controlled diffusion compressor blades at stall bs
TRANSCRIPT
NAVAL POSTGRADUATE
SCHOOL__Monterey, California
T DIC• •i EI-ECTE
6U1~994
THESIS
LASER-DOPPLER VELOCIMETER MEASUREMENTS IN ACASCADE OF CONTROLLED DIFFUSION COMPRESSOR
BLADES AT STALL
by
1Humberto Javier Ganaim Rickel
June, 1994
Principal Advisor: Garth V. Hobson
Approved for public release; distribution is unlimited.
S~25694 9

REPORT DOCUMENTATION PAGE OMFoBT At.roedlomeju ng I M8 No. 0704-0188
Pt re V b~n 1' Owns cofen of iforrmwtm is e, to av e I hw paresponse, w M the Una1wm " •srucs. s, &wV *"ft data our ,gas&W ff " ft d~at nefd, ad comnpIn VWd teler0 ft cof n of omionabn. SOreN commeont rgan ths estmaste or any o~ ape of "us cofiscn ofidmf o., wcký s ý t redug #Vs Ww. to W M Headw~rWrs S~wsm OirscwoMe f1 Opuahonh aons and Repots. 1215 Jeftton Dos Highway. S~s1204. ArkigiM. VA 22202-430., and to the Oftc of Maaement and jdget. PapewoA Redutin Pmod (0704-0188). WashMnon, DC 20503.
1. AGENCY USE ONLY (Leave Blank) 2. REPORT DATE 3. REPORT TYPE
June, 1994 Master's Thesis
4. TITLE AND SUBTITLE S. FUNDING NUMBERSLASER-DOPPLER VELOCIMETER MEASUREMENTS IN A CASCADE OFCONTROLLED DIFFUSION COMPRESSOR BLADES AT STALL
SAUTHOR(S)
Ganaim Rickel, Humberto Javier
7 PERFORMING ORGANIZATION NAMES(S) AND ADDRESS(ES) S. PERFORMING ORGANIZATION
Naval Postgraduate SchoolMonterey, CA 93943-5000
IL SONINGMNITORING AGENCY NAME(S) AND ADDRESS(ES) 10. SPONSORINGIMONITORINGAGENCY REPORT NUMBER
11. SUPPLEMENTARY NOTESThe views expressed in this thesis are those of the author and do not reflect the official policy or position of the Department ofDefense or the U.S. Government.
12L DSSTIg UTIONIAVAILABILITY STATEMENT 12b. DISTRIBUTION CODE
Approved for public release; distribution is unlimited. A
13. ABSTRACT ( Maximum 200 words)An incipient compressor blade stall has been generated and examined in the Low Speed Cascade Wind Tunnel at the Turbopropulsion Laboratory. The testblades were a controlled-diffusion design with solidity 1.67, and stalling occured at 10 degrees of incidence above the design inlet air angle. Tufting andlaser-sheet flow-visualization techniques showed that the stalling process was unsteady, and occurred over the whole cascade of 20 blades. Detailedlaser-doppler velocimeter measurements over the suction side of the blades showed regions of continuous and intermittent reversed flow. The measurementsof the continuous reversed flow region at the leading edge were the first data to be obtained of flow within the leading edge separation bubble. Theintermittent reversed flow region measurements quantified what was observed in the flow visualization studies. Blade surface pressure measurements showeda decrease in normal force on the blade as would be expected at stall.
14. SUBJECT TERMS 16. PRICE CODE
15. NUMBER OF PAGES14
17. SECURITYCLASSIFICATION 18. SECURITY CLASSIFICATION 19. SECURITY CLASSIFICATION 20. UMITATION OF ABSTRACTOF REPORT OF T"I PAGE OF ABSTRACT
Unclassified Unclassified Unclassified UL
NSN 7540-01-280-5500 Standard Form 296 (Rev. 2-89)

Approved for public release; distribution is unlimited.
LASER-DOPPLER VELOCIMETER MEASUREMENTS IN A CASCADE OFCONTROLLED DIFFUSION COMPRESSOR BLADES AT STALL
by
Humberto Javier Ganaim RickelBS, Venezuelan Naval School, 1985
Submitted in partial fulfillmentof the requirements for the degree of
MASTER OF SCIENCE IN ENGINEERING SCIENCE
from the
NAVAL POSTGRADUATE SCHOOLJune, 1994
Author:9irGanaim, Rickel
Approved By: p-,
0 Dr. Garth V. Hobson, Advisor
Dr. Raymond P. Shreeve, Second Reader
Dr. Daniel J. 0&llins, ChairmanDepartment of Aeronautical and Astronautical Engineering
ii

ABSTRACT
An incipient compressor blade stall has been generated and examined in the Low
Speed Cascade Wind Tunnel at the Turbopropulsion Laboratory. The test blades were a
controlled-diffusion design with solidity 1.67, and stalling occured at 10 degrees of
incidence above the design inlet air angle. Tufting and laser-sheet flow-visualization
techniques showed that the stalling process was unsteady, and occurred over the whole
cascade of 20 blades. Detailed laser-doppler velocimeter measurements over the suction
side of the blades showed regions of continuous and intermittent reversed flow. The
measurements of the continuous reversed flow region at the leading edge were the first
data to be obtained of flow within the leading edge separation bubble. The intermittent
reversed flow region measurements quantified what was observed in the flow
visualization studies. Blade surface pressure measurements showed a decrease in normal
force on the blade as would be expected at stall. Acces.ion For
NTIS CRA&IDTIC TABUnannouncedJustification
ByDi-t. ibition I
Availability Codes
Avail and /orDist Special
liii
TABLE OF CONTENTS
1. INTRODUCTION .................................................. 1
A. BACKGROUND ............................................... I
B. PU RPO SE ..................................................... I
II. TEST FACILITY AND INSTRUMENTATION .......................... 3
A. LOW-SPEED CASCADE WIND TUNNEL .......................... 3
B. INSTRUMENTATION .......................................... 3
1. Pneumatic Data Acquisition System .............................. 3
2. Laser-Doppler Velocimeter ..................................... 3
a. Laser and Optics .......................................... 7
b. Data Acquisition .......................................... 7
c. Automated Traverse table ................................... 8
d. Atomizer and Seeding Probe ................................. 8
III. EXPERIMENTAL PROCEDURE ................................... 10
A. PRESSURE MEASUREMENTS AND FLOW VISUALIZATION ....... 10
iv

B. TUNNEL SET-UP AND TEST-SECTION CONFIGURATION .......... 10
C. LASER SET-UP ............................................... 12
D. SURVEYS .................................................. 14
i. Inlet Surveys at 48 and 50 Degrees .............................. 14
2. Passage Surveys at 50 Degrees ................................. 14
3. W ake Surveys at 50 Degrees ................................... 17
IV. RESULTS AND DISCUSSION ..................................... 18
A. BLADE SURFACE PRESSURE MEASUREMENTS ................. 18
B. INLET SURVEYS (STATIONS I THROUGH l E) ................... 18
C. PASSAGE SURVEYS (STATIONS 2 THROUGH 15) ................ 26
D. WAKE SURVEYS (STATIONS 16 THROUGH 19) .................. 43
E. SUM M ARY .................................................. 43
V. CONCLUSIONS AND RECOMMENDATIONS ....................... 50
A. CONCLUSIONS .............................................. 50
B. RECOMMENDATIONS ........................................ 51
Vl. APPENDICES .................................................. 52
A. INLET SURVEY AT 48 DEGREES (STATIONS 1 THROUGH I E) ..... 52
V

B. H
B. HISTOGRAMS FROM STATIONS 2 THROUGH 15 FOR 50 DEG ...... 64
C. HISTOGRAMS FROM STATIONS 16 THROUGH 19 FOR S0 DEG ...... 86
D. TABLE OF SHIFT SELECTIONS AT PLUS OR MINUS 5 MHz ........ 94
E. TUNNEL CALIBRATION DATA ................................ 96
F. SURVEYS FROM STATION I THROUGH 19 ..................... 105
REFERENCES .................................................... 127
INITIAL DISTRIBUTION LIST ...................................... 128
vi

LIST OF FIGURES
Figure 1. Low Speed Cascade Tunnel Schematic ......................... 4
Figure 2. CD Blade Pressure Tap Locations on Pressure and Suction Sides ..... 5
Figure 3. LDV System Installation ..................................... 6
Figure 4. Atomizer and Seeding Probe .................................. 9
Figure 5. Anodized Blades .......................................... I I
Figure 6. LDV Fringe Pattern and Beam Arrangement .................... 13
Figure 7. Inlet and Exit Pitchwise Survey Locations ...................... 15
Figure 8. Suction Side Passage Survey Locations ........................ 16
Figure 9. Pressure Distribution and Normal Force Coefficient ............... 19
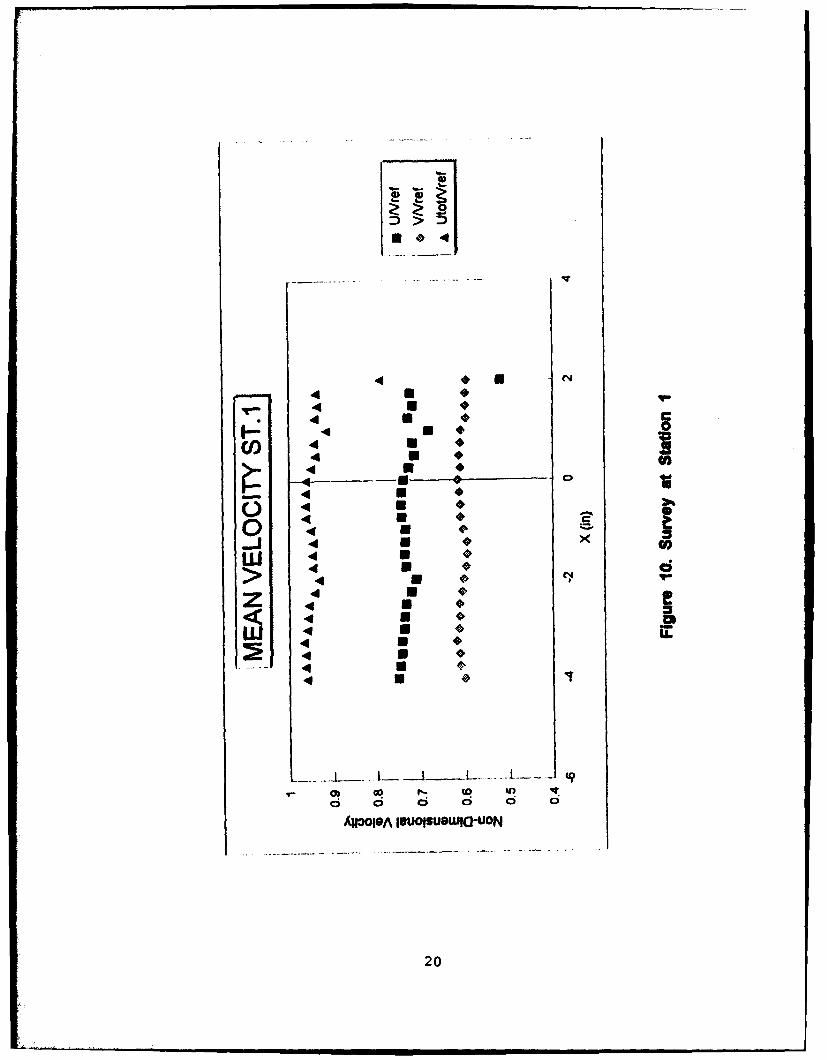
Figure 10. Survey at Station I ....................................... 20
Figure 11. Survey at Station I A ...................................... 21
Figure 12. Survey at Station IB ...................................... 22
Figure 13. Survey at Station I C ...................................... 23
Figure 14. Survey at Station ID ...................................... 24
Figure 15. Survey at Station IE ...................................... 25
Figure 16. Survey at Station 2 ........................................ 27
Figure 17. Survey at Station 2A ...................................... 28
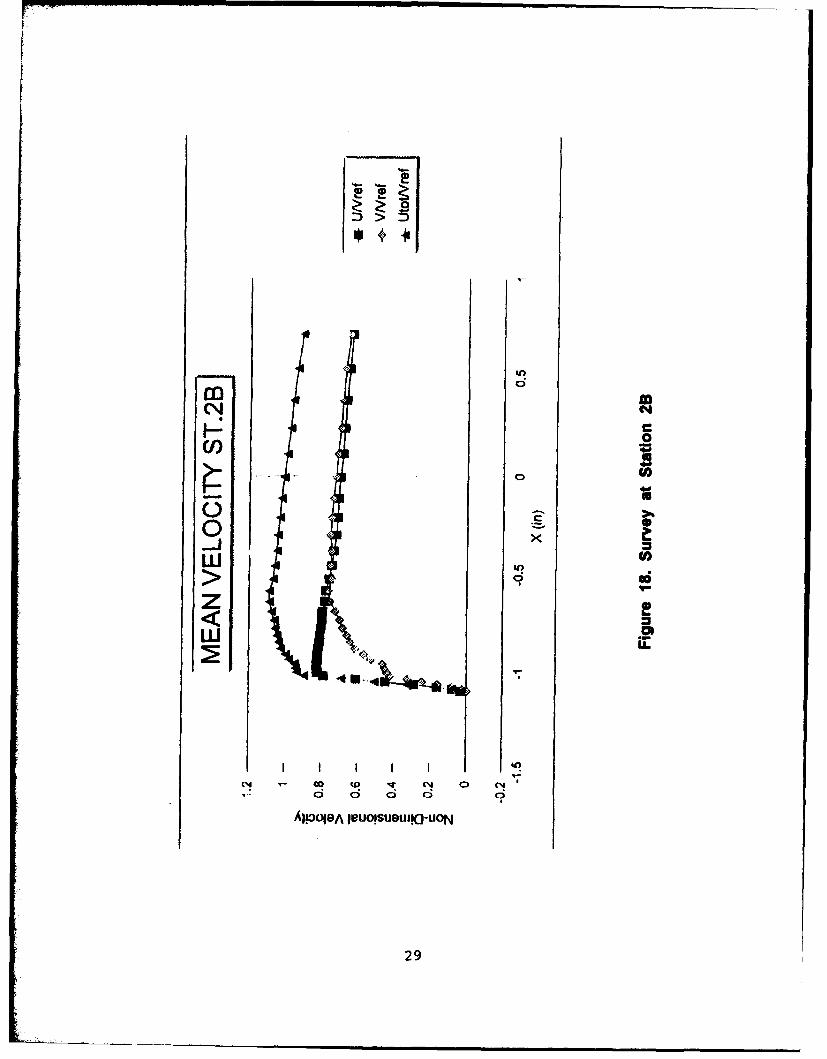
Figure 18. Survey at Station 2B ...................................... 29
vii

Figure 19. Survey at Station 3 ..................................... 30
Figure 20. Survey at Station 4 ..................................... 31
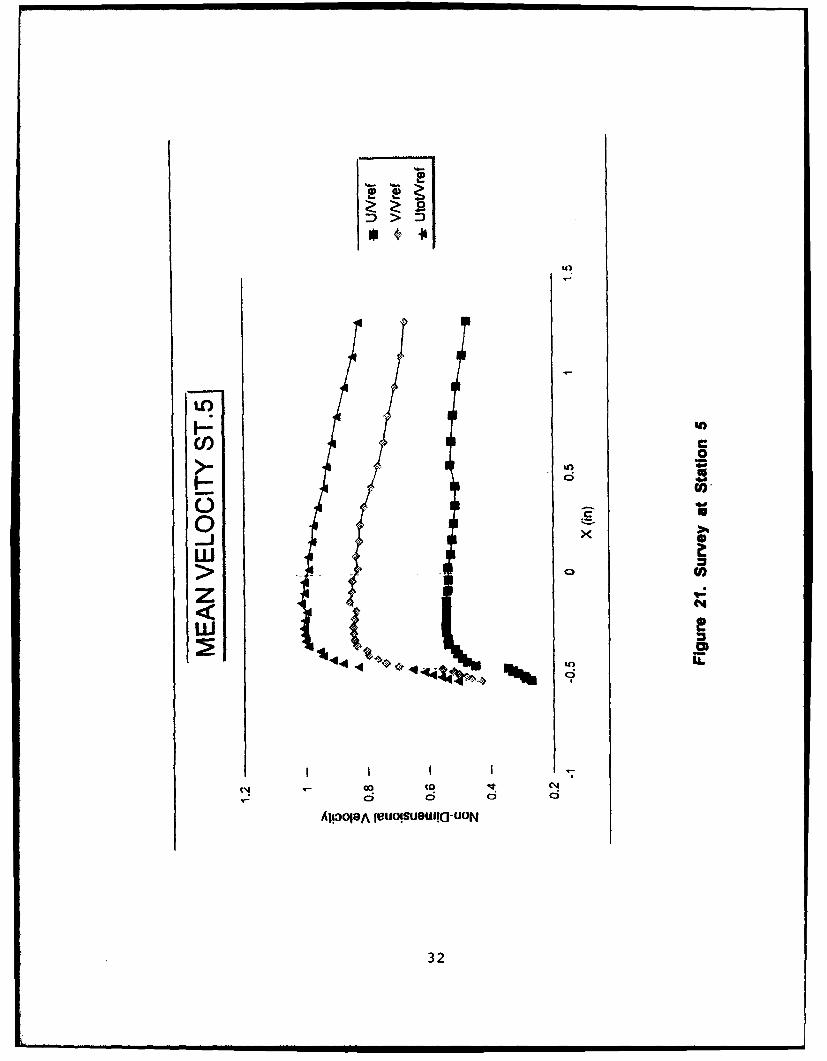
Figure 21. Survey at Station 5 ..................................... 32
Figure 22. Survey at Station 6 ..................................... 33
Figure 23. Survey at Station 7 ..................................... 34
Figure 24. Survey at Station 8 ..................................... 35
Figure 25. Survey at Station 9 ..................................... 36
Figure 26. Survey at Station 10 .................................... 37
Figure 27. Survey at Station I ..................................... 38
Figure 28. Survey at Station 12 .................................... 39
Figure 29. Survey at Station 13 .................................... 40
Figure 30. Survey at Station 14 .................................... 41
Figure 3 1. Survey at Station 15 .................................... 42
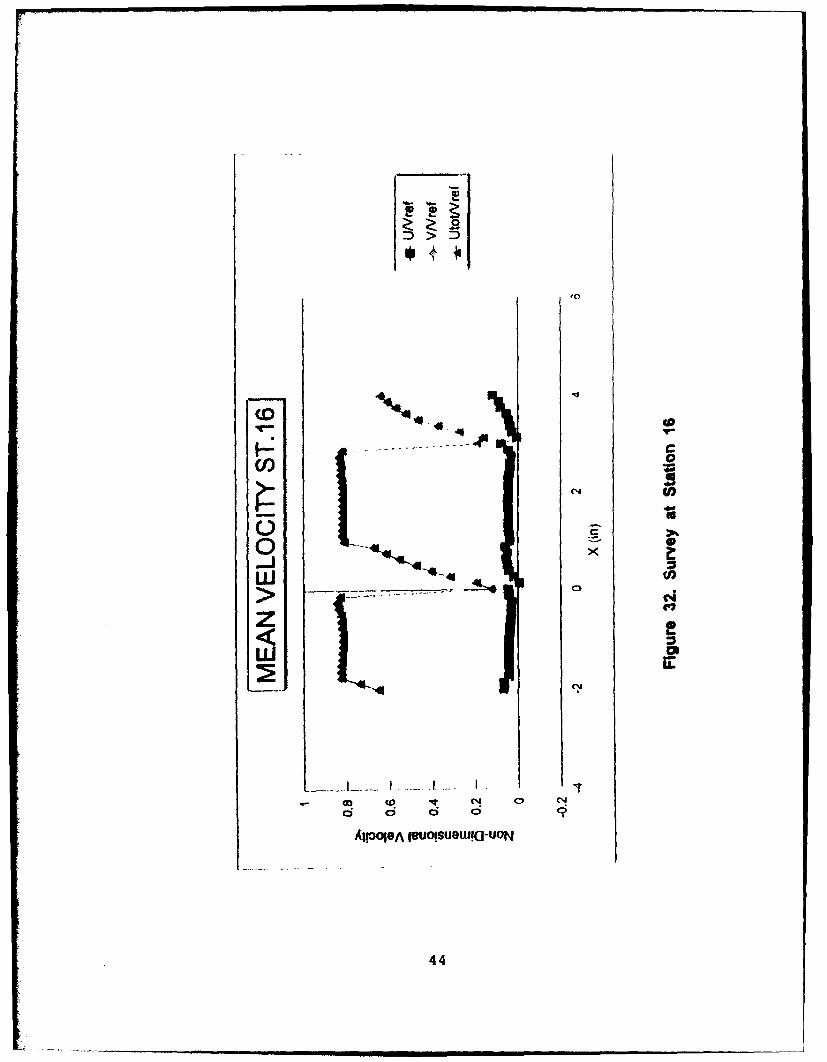
Figure 32. Survey at Station 16 .................................... 44
Figure 33. Survey at Station 17 .................................... 45
Figure 34. Survey at Station 18 .................................... 46
Figure 35. Survey at Station 19 .................................... 47
Figure 36. Reverse Flow Regions ................................... 48
viii

ACKNOWLEDGEMENTS
I would like to avail myself of this opportunity to thank Dr. Garth V. Hobson
for taking so much of his time to explain the procedures involved in this project to
me and for all his patience during his explanation. I would also like to thank Dr.
Raymond Shreeve for his advice, which positively influenced my thesis. I would like
to thank my wife Jaira and my children, Humbert and Kevin, for giving me the
support to finish my studies at the Naval Postgraduate School. Jaira: you are the
main reason in my life that helps me improve.
ix

1. INTRODUCTION
A. BACKGROUND
The continuing effort to predict off-design performance and stalling behavior of
compressor blades during the design phase has prompted studies to characterize the flow
in and around leading edge separation bubbles of blades in cascade. Experimental studies
have attempted to map viscous flow development in specific geometries. Recently
Hobson and Shreeve [Ref. 1] reported detailed two-component (LDV) measurements of
the flow through a controlled-diffusion (CD) compressor cascade at a Reynolds number
of about 700,000, and at a very high-incidence angle (8 deg above design).
They obtained a laminar leading-edge separation, which reattached turbulent, and
enclosed a (laminar) bubble on the suction surface of the blade. Consistent with
measurements at lower incidence angles, the reattached suction surface boundary layer
remained turbulent and attached over the rear part of the blade. Since boundary layer
separation ( for a code-validation test case) had not been achieved, the next step was to
increase the incidence angle further to 10 deg above design and try to stall the (CD)
blades. This was the motivation for the present study in which the flowfield through the
CD cascade was extensively surveyed at a fixed incidence angle which was 2 deg greater
than the previous incidence reported by Hobson and Shreeve [Ref. I].
B. PURPOSE
The objective was to increase the inlet air angle beyond 48 degrees, as tested by
Classick [Ref. 2], Murray [Ref. 3], Hobson and Shreeve [Ref. I], and Wakefield [Ref. 4],
to 50 degrees in an attempt to stall the blades. The intention was to determine the
maximum turning or lift generated by the blades, and to determine the way in which the
suction-side boundary layer separated. Would the leading-edge separation bubble grow or
LI

would separation begin from the trailing edge where the boundary layer was fully
turbulent. Two-dimensional laser Iripler velocimeter measurements were to be taken in
the pitchwise or blade-to-blade direction at most of the stations measured by Hobson and
Shreeve [Ref. 1].
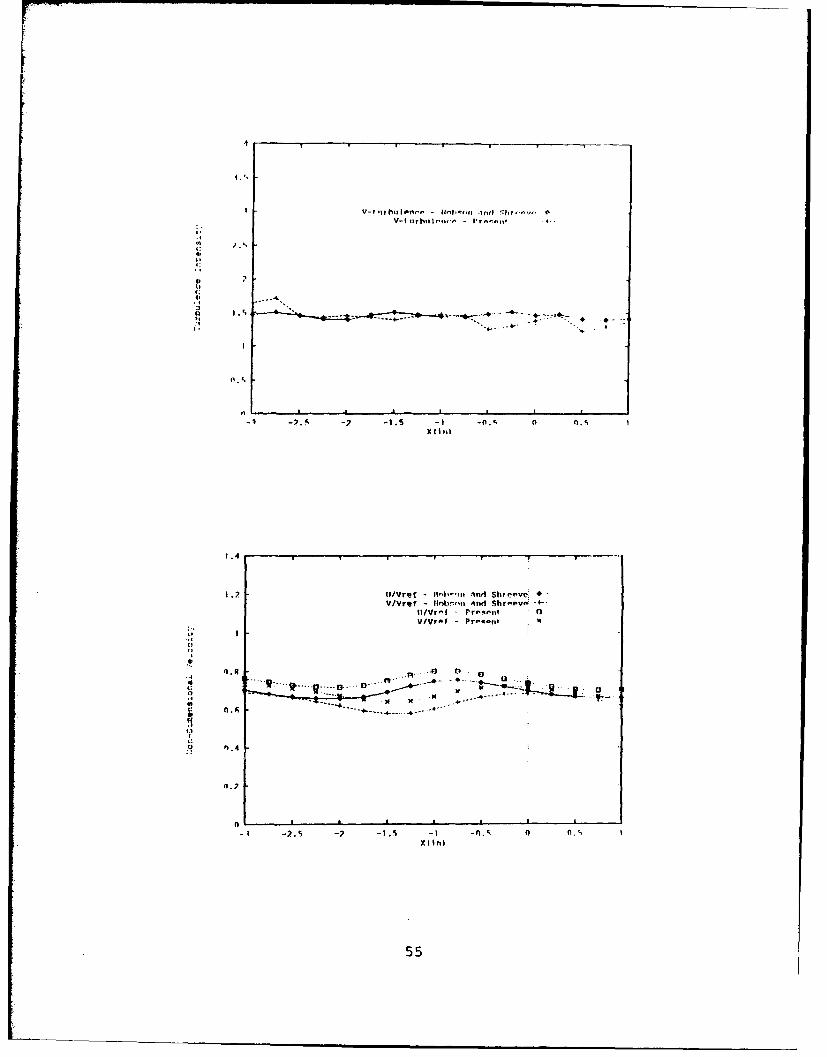
Prior to performing the above study, LDV measurements at 48 degrees were
obtained in the inlet region in order to verify the resilts that both Hobson and Shreeve
[Ref. 1] and Wakefield [Ref. 4] obtained during their experiments. This was desirable
because Hobson and Shreeve had used different inlet guide vanes (IGV's) and, after new
IGV's were installed, Wakefield performed only Hot-Wire measurements. A comparison
of the measurements taken by the present author with those taken by Hobson and Shreeve
at 48 degrees is presented in Appendix A. The study carried out at an inlet-air angle of
50 degrees is reported in the sections which follow.
2

II. TEST FACILITY AND INSTRUMENTATION
A. LOW-SPEED CASCADE WIND TUNNEL
The subsonic cascade wind tunnel and operating instrumentation were as described
by Wakefield [Ref. 5]. The cascade had 20 blades, the flow Reynolds number, based on
chord length, was approximately 700,000 and the inlet air angle was 48 and 50 deg.
The blades had a chord length of 5.01 in. and a spacing of 3 in. The blade
coordinates and cascade geometry were reported by Elazar [Ref. 5]. Figure 1 shows the
schematic of the cascade.
B. INSTRUMENTATION
1. Pneumatic Data Acquisition System
Blade surface static pressure measurements were recorded with a 48-channel
Scanivalve. The pneumatic data acquisition system was the same as that described and
used by Classick [Ref. 2] and the program "ACQUIRE" was used to perform the
pressure measurements. Figure 2 shows the location of the pressure taps on blade number
10, the location of which is shown in Figure 1.
2. Laser-Doppler Velocimeter
The horizontal (U) and vertical (V) mnean velocity components, U-turbulence,
V-turbulence, and Reynolds stress were measured with a two-dimensional LDV system
consisting of four major subsystems:(a) the laser and optics, (b) the data acquisition
system, (c) the automated traverse table, and (d) the seeding probe. A photograph of the
LDV equipment, traverse table, counters and oscilloscope is shown in Figure 3, which
also shows the north endwall of the cascade.
3

U-
Ag Fnt�'I
I
I
hiII-
ii
4

IIn
.0
2 14

Figure 3. LDV System Installation
6

a. Laser and Optics
A four beam, two color TSI model 9100-7 LDV system was used. The laser
was a Lexell four-Watt Argon-Ion laser which was operated nominally at 2 Watts in a
multi-line mode. Two colors, green (514.5 tnm) and blue (488 nm) were selected by the
color separator. The two beams were centered and split into a four beam arrangement to
measure two velocity components at right angles to each other. Two Bragg cells shifted
the frequency of one beam in each pair to allow measurement of reverse flows. The ir
beams then passed through a divergence section which improved the dimensions
measuring volume. Two photo-detectors collected the scattered light after it passed
through the same optics. Table I contains a summary of the characteristics of the LDV
system.TABLE I
"CHARACTERISTIC BLUE BEAM GREEN BEAMWAVELENGTH 488 nanometers 514.5 nanometers
FRINGE SPACING 4.51 microns 4.76 microns
FOCAL LENGTH 762 mm 762 mmNUMBER OF FRINGES 28 28
HALF ANGLE 3.10 degrees 3.10 degreesMEASURING VOL. DIAM 133 micro meter 133 micro meter
MEASURING VOL. LENG 2.5 mm 2.5 mmFREQ. SHIFT (FIND) + 5 Mhz + 5 Mhz
BEAM SPACING 82.5 mm 82.5 mmORIENTATION HORIZONTAL VERTICAL
CHANNEL 2 1FREQUENCY SHIFT 5 Mhz UP 5 Mhz DOWN
b. Data Acquisition
The data acquisition system consisted of two TSI Model 1990 counter-type
signal processors and a 1998A Master Interface in which the signals from the
photo-detectors were digitized. An oscilloscope attached to the input conditioner of the
counters provided real-time display of the photomultiplier output. The digitized signals
from the counters were send to an IBM PC in which the information was processed by
7

TSI proprietary software "FIND" version 4.0 . Through this software it was possible to
position the LDV at programmed locations and automatically take measurements in
surveys at any desired increment.
c. Automated Traverse table
The automated three-axis traverse was Model 9500 from TSI. The traverse
used stepping motors for positioning the optical table which rested between the upper
support arms. Digital encoders along each axis provided positioning accuracy to 0.0001
inch. The traverse and encoder interface to the PC used RS-232C protocol.
d. Atomizer and Seeding Probe
Olive oil was used as a seed material in a TSI atomizer which produced
approximately I micro-meter sized particles as measured by Elazar [Ref. 5]. The seeding
wand was adjustable, however, the adjustment was done on an arc, perpendicular to the
tunnel, thus the seeding was not always at midspan. This limited the distance over which
the pitchwise surveys could be extended. Figure 4 shows the atomizer and seeding probe.
8

Figure 4. Atomizer and Seeding Probe

,A- -! ! ! ;
III. EXPERIMENTAL PROCEDURE
A. PRESSURE MEASUREMENTS AND FLOW VISUALIZATION
Once the tunnel was set up at 50 degrees and running at a plenum pressure of 12
inches of water (approximately 700,000 Reynolds number), the pressure measurements
were taken as specified by Classick [Ref. 2].
The flow visualization was carried out by projecting a laser sheet from the bottom
left of the cascade to blade number 14, and while the tunnel plenum pressure was set at
12 inches of water (gauge), fog was introduced through one of the endwalls. The flow
pattern of the fog between the blades was illuminated by the laser sheet. This process was
performed at night for better visibility. The process was filmed ussing an 8mm video
camera.
B. TUNNEL SET-UP AND TEST-SECTION CONFIGURATION
For the present study, the 50 degree inlet flow angle was set by adjusting the inlet
guide vanes and side walls to equalize the endwall static pressures on both upstream
walls. The exit flow angle was adjusted by setting the tailboards at angles which gave
nearly uniform downstream wall static pressure measurements in the pitchwise direction
across the cascade. The average inlet flow angle was measured, with the LDV, over three
passage widths, 31.3% of an axial chord length upstream of the blade leading edge. Fine
adjustments of the inlet guide vanes were made to achieve an average inlet flow angle (as
measured by the LDV) of 50.21 degrees.
Previous LDV measurements were taken between blades 7 and 8 which were
anodized black to minimize reflections. Because of the present inlet flow angle setting of
50.21 deg., blade 8 was too close to the edge of the window. Thus blade 8 and 6 were
10

�1
Figure 5. Anodized Blades
11

exchanged and all subsequent measurements during this study were taken between blades
6 and 7 as shown in Figure 5.
The tunnel reference velocity (Vref) was determined using the analysis of Elazar
[Ref. 5]. At different tunnel speeds, the inlet flow velocity was measured (31.3% axial
chord upstream) with the LDV, and the plenum pressure and temperature and ambient
pressure were recorded. A least-squares curve fit was applied to the data to determine the
calibration curve. During each subsequent run, the plenum and atmospheric conditions
were recorded and used as input to a Newton method iteration algorithm to determine
Vref. The result of this calibration is presented in Appendix E.
C. LASER SET-UP
The green beams of the laser were aligned vertically with the unshifted beam at the
bottom and the blue beams were horizontal with the unshifted beam to the right , as
shown in Figure 6. All surveys were conducted with the LDV optics "standard", i.e., the
488-nm blue beam measuring the horizontal velocity component (U), and the 514.5-nm
green beam measuring the vertical velocity component (V). Down shifting was used in
the following form; the green beam was downshifted by 5MHz and the blue beam was
upshifted by 5MHz. The 1990 signal processors had the following settings: continuous
(CONT) Mode; High Filter, 20MHz; Low Filter, 0.3MHz; Amplitude Limit, full
counterclockwise; Cycles/Burst, 8; Comparison, 1 percent; Auto (green button), in;
Voltage, External (EXT); Data Ready, Internal(INT); Gain, One (01); Resolution
(No/SEC), One (01). For the Data Interface Master; Coincidence Mode, Range XI and
Delta Interval 2 to the power 3 micro-seconds was used throughout this study.
In the Optics screen of the acquisition menu of FIND the frequency shift was set to
+5MHz on both channels. As the maximum reverse flow Doppler frequency was
approximately I MHz this level of 5MHz downshifting allowed the determination of
reverse flow velocities, both in the mean and intermittently. The determination of this
final selection is shown in Appendix D.
12
[i

Si m I II I I ii I I I I I
BLUE
Two Color I:Fiilge Palloei
Beam Arratigellmel1
Figure S. LDV Fringe Pattern and Beam Arrangement
13
D. SURVEYS
1. Inlet Surveys at 48 and 50 Degrees
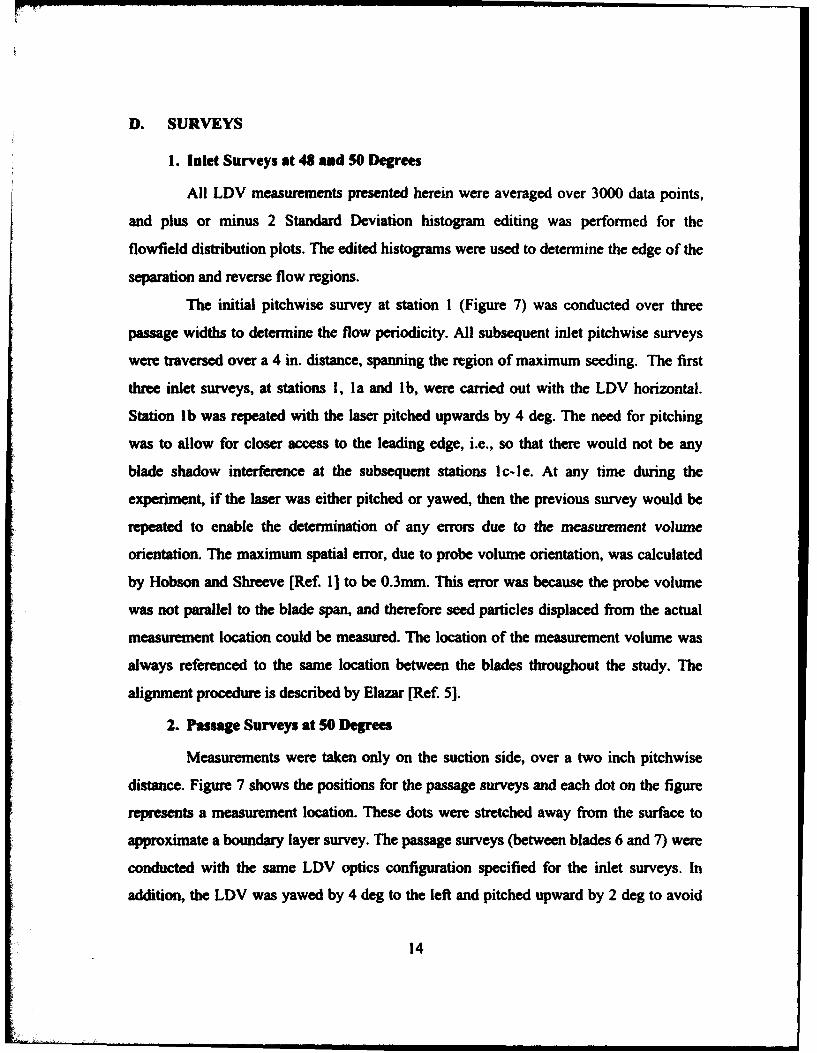
All LDV measurements presented herein were averaged over 3000 data points,
and plus or minus 2 Standard Deviation histogram editing was performed for the
flowfield distribution plots. The edited histograms were used to determine the edge of the
separation and reverse flow regions.
The initial pitchwise survey at station I (Figure 7) was conducted over three
passage widths to determine the flow periodicity. All subsequent inlet pitchwise surveys
were traversed over a 4 in. distance, spanning the region of maximum seeding. The first
three inlet surveys, at stations 1, l a and l b, were carried out with the LDV horizontal.
Station lb was repeated with the laser pitched upwards by 4 deg. The need for pitching
was to allow for closer access to the leading edge, i.e., so that there would not be any
blade shadow interference at the subsequent stations ic-le. At any time during the
experiment, if the laser was either pitched or yawed, then the previous survey would be
repeated to enable the determination of any errors due to the measurement volume
orientation. The maximum spatial error, due to probe volume orientation, was calculated
by Hobson and Shreeve [Ref. 1] to be 0.3mm. This error was because the probe volume
was not parallel to the blade span, and therefore seed particles displaced from the actual
measurement location could be measured. The location of the measurement volume was
always referenced to the same location between the blades throughout the study. The
alignment procedure is described by Elazar [Ref. 5].
2. Passage Surveys at 50 Degrees
Measurements were taken only on the suction side, over a two inch pitchwise
distance. Figure 7 shows the positions for the passage surveys and each dot on the figure
represents a measurement location. These dots were stretched away from the surface to
approximate a boundary layer survey. The passage surveys (between blades 6 and 7) were
conducted with the same LDV optics configuration specified for the inlet surveys. In
addition, the LDV was yawed by 4 deg to the left and pitched upward by 2 deg to avoid
14

If) lo i ) u):(' (NJ (1, (*'i
0
,~CV L0ttI•
Ul
15
U,)
II L I I I l ,,,C)
• 15
ii
I p

I I I'
a
' |U
~ T- ~ ( *-4 T )
161

the laser beams being shadowed by the blade. This was done for the suction side close to
the leading edge, from station 2 to 7. At stations 7 to 15 the LDV was only yawed by 4
deg.
3. Wake Surveys at 50 Degrees
Wake surveys (between blades 6 and 7) were conducted with the same LDV
optics configuration specified for the inlet surveys. The LDV was horizontal and
perpendicular to the tunnel for stations 16 to 19 and the surveys were performed over two
passage widths (6 inches). Figure 7 shows the positions for tL. wake surveys.
17

IV. RESULT AND DISCUSSION
A. BLADE SURFACE PRESSURE MEASUREMENTS
The upper plot of Figure 9 shows the blade surface pressure distribution measured
by Dreon [Ref. 6] at 40 and 43 degrees, Armstrong [Ref. 7] at 48 degrees and the present
work at 50 degrees. The integration of the area within the pressure distributions for each
angle gave the Normal Force Coefficient. The lower plot (Normal Force Coefficient
versus Angle of Attack) shows a drop-off in force (or lift) at 50 degrees, consistent with
the observation that the cascade had entered into stall.
B. INLET SURVEYS (STATIONS 1 THROUGH IE)
Figures 10 through 15 show the horizontal (U), vertical (V) components and the
total velocity (Utot) distributions in the pitchwise direction ahead of the blades. At station
1, a disturbance in the total velocity profile is evident which is periodic and three inches
apart. This disturbance corresponds to the spacing of the blades and thus the presence of
the blades is now felt 30% of an axial chord ahead of the leading edges. This magnitude
of upstream disturbance, was not evident at lower inlet air angles.
Station IA (Fig. 11) shows measurement anomalies on the U component which are
due to imperfections in the acrylic window. In subsequent figures (12 through 15) the
total velocity (Utot) decreased as the flow approached the leading edge of blade number 6
and then increased again as the flow rounded the leading edge of the blade.
The final inlet profile (Fig. 15) shows a variation in total velocity of 40% (from 1.0
to 0.6) across the leading edge. This variation is less than that previously measured at 48
degrees inlet air angle (> 50% variations), and this too is an indication that stall had
occurred.
18

-0.5
Dr~.On - Beta-4Odeq. Preen.. ivnrf.Drew.,- *eta-40deq. Su'ct. uorf.
*Dreono- Beta-43deq. Press.. lurt. I?Orson:- Bets-43deq. Suct. surf.Arustranqt- 8*ts-49deq. Preen.. silrV.
4.aArostrona:- *ota-49dcq. Stict. qurf.v varneim:- 0:1ta-SOdeq. Pr.'s,. ,',,rt.
ranaim: ata-dnq. S,:ut. ~.urf.
-20 0.2 0.%f. OR
0.64
*' 0.62
U
02
R 0.54 Draw. 12 pts), Arutstronq G anal.
0.52
33 40 4Z 44 16 .14 SInlet Fin" Anql-
Figure 9. Pressure Distribution and Normal Force Coefficient
19
ClEl
4 U)
LI-> Uý
4 U 0
4 U 0So ommuosaiUO
4 U X20

4 U 44 U I-
4 U C0
Cl) 4 U *4.,
4 , U_ 4 ,. I(U) 4 , U
4
w 4 U4 U 0 1�44 Uu
e4 3 0 54 U 0
4 U 0 C4 U*4 U*
4 3*4
ci 0 CD1� o a o
A�POi.A IWUOISLWWIO-UON
21

cri/O 0
Iw
'.4
C4 CR CR l NJ
AljooIOA g3UoISU~uwla-uoN
22

C'4
Cf)
00.jx
z
- e
APOIOgA P16uowiauuf-IoN
23

(l)
*1 aj
CI) 0
w l qw Cz ; ci c
Al~q9 PUOSUOUJG-Ue
w2

C14
1- 4-
cCE)C"! C4 '
olqAluisai-o
0 25

C. PASSAGE SURVEYS (STATIONS 2 THROUGH 15)
At station 2 only forward moving particles were measured, and the mean velocities
(both U and V components) were all positive (Fig. 16). The discontinuity in the VNref
profile between points 11 and 12 was unexplained. At station 2A the magnitude of the
first data point dropped off significantly (Fig. 17). Upon examination of the histograms
for the vertical velocity component it was found to contain reverse flow particles, which
indicated that this region had intermittent reverse flow. The first data point at station 2B
had a negative mean V velocity and a positive mean U velocity (Fig. 18), and this
indicated the beginning of the leading edge reverse flow region (i.e., negative mean
velocity on V). The following 5 data points had intermittent reverse flow histograms.
At station 3 the first three data points had negative mean velocities, both U and V,
and then the following 7 data points had intermittent reverse flow particles. Station 4 only
had intermittent reverse flow particles (no histograms with a negative mean) for the first 6
data points. The discontinuity in the profile as shown in Figure 20 illustrated the change
over from intermittent reverse flow to all positive, or forward-moving particles. The
profile at station 5 (Fig. 21) was very similar to that at station 4.
At station 6 (Fig. 22) the first two points showed only forward moving particles, the
third data point had intermittent reverse flow, the next five data points were all positive
and the ninth data point again had intermittent reverse flow. All other data points beyond
the tenth point had histograms with only positive values. The first data point at station 7
(Fig. 23) only had positive moving particles, the second through sixteenth data points
showed intermittent reverse flow and then all higher points were positive.
The first data point at station 8 (Fig. 24) had only positive particles, the next 17
data points showed intermittent reverse flow, and then all the points showed only positive
flow. The mean flow profile once again showed a significant discontinuity in that region.
Stations 9 through 15 (Figs. 25 through 31) were similar in that they all showed
regions of intermittent reverse flow close to the suction surface of the blade followed by
the core flow where all the measured particles had positive velocity components.
26

50
U))
0 do
CWL
>1zE
lw 0
M4IG im setaIO
27

I-
U)0
'C(NII-. C
0Cl)0 0
dUo
o -
-j xW I') 0c
Z e'Cw
I I I� I IC'. (0 C'. 0
0 0 0 D
A11,oIeA IBtiO!SIi8IU!G-UON
28
jCN'4,
C)) 0i c 6Al~qA IeOISBUII-Ua
029

C1)
or)0
0 S
oj -
wz
AIPO19A IeUOISUOul(u!-UON
30

;> 0
Cl)5
0 a 0ý
31~
LfU)
43019 CeIIUUJ(-
32a

Titm:('44
CO c
(00
0(
o Ul9S
C)Cl
I L.

C'N
C,)3looO Ce~siiuc-O
34a

LCI
U))
C'.
>IuU,
C3 9
0 ~ 9 -~uls 'I)uO
o C35

C#) Cl
AIPOIA Rwsum!-(JC
36I

I '
0 ,•F--
o 0< Iwm U) i
_ 1. . .. . II I
C d ('.1
/AIPONISA leUOt9ueSu!U-UON
37

D
cid
C14
U)
x U
w - M
M*
zW**412
woCc; ci a
AIPOISAPNM9IJO!SUBW(JUN
38

-j9
wS
LU)
CR CRC
opq& -eossum-
o 39

CI-O
U))
F--
I-j
w
400

*1~4a
(1) (0
(0wz
.Izw
A)I!OqGA jeuoISGIsuwO-uoN
41

.00
CM
U))
0 S,-i x
w> U)
zw
Iq IR 't NI )C) 0 C) ('4
A)POISA IRtJOI9UGWcIO-UON
42

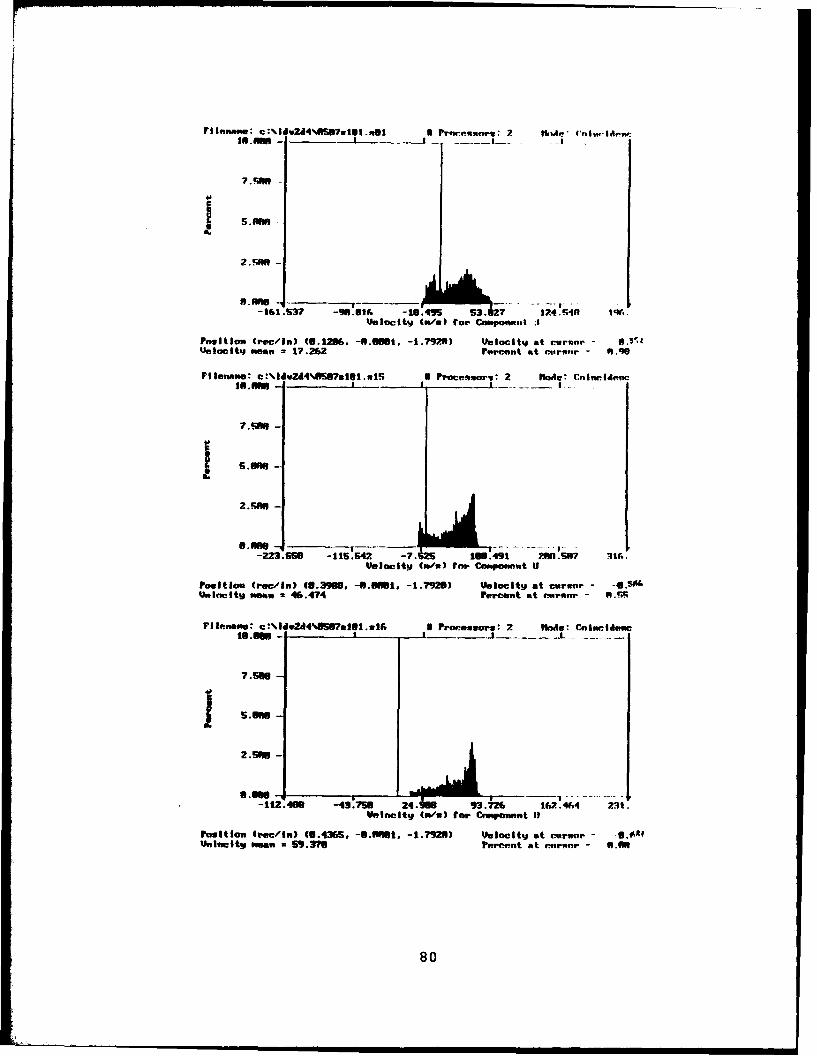
It can be seen in Appendix B that for each station all the histograms to the left of
the discontinuity had negative and positive velocities and the histograms to the right of
the discontinuity had only positive velocities.
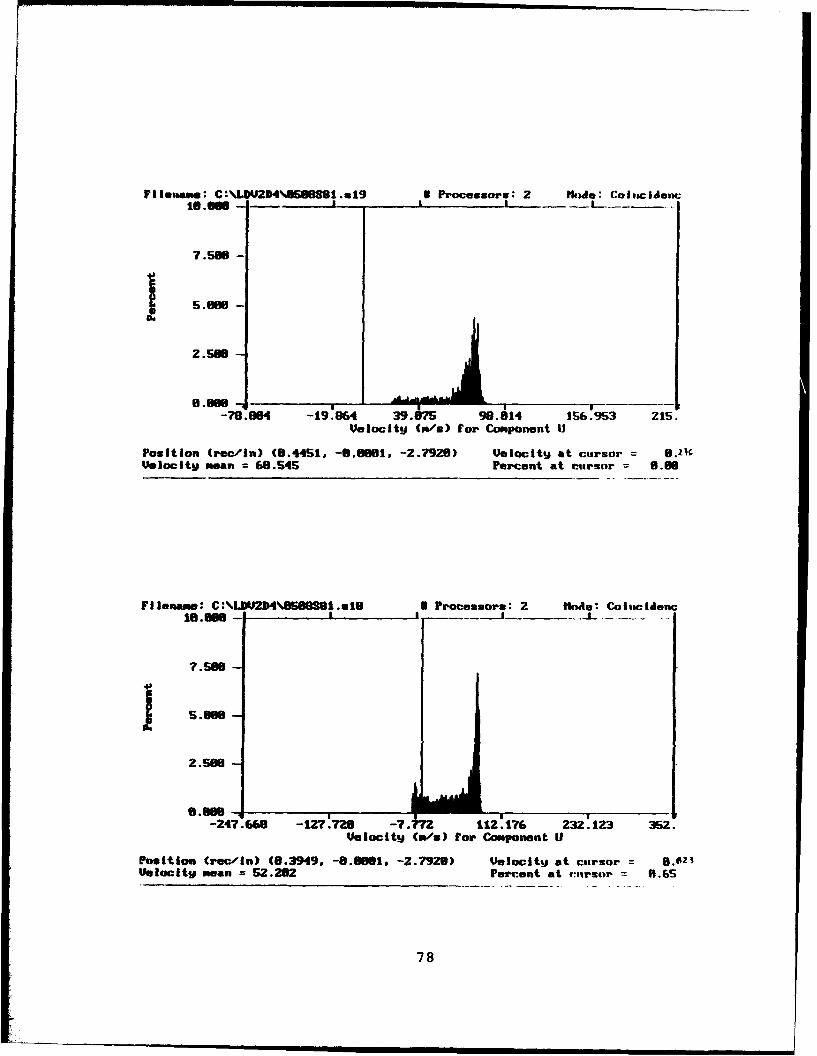
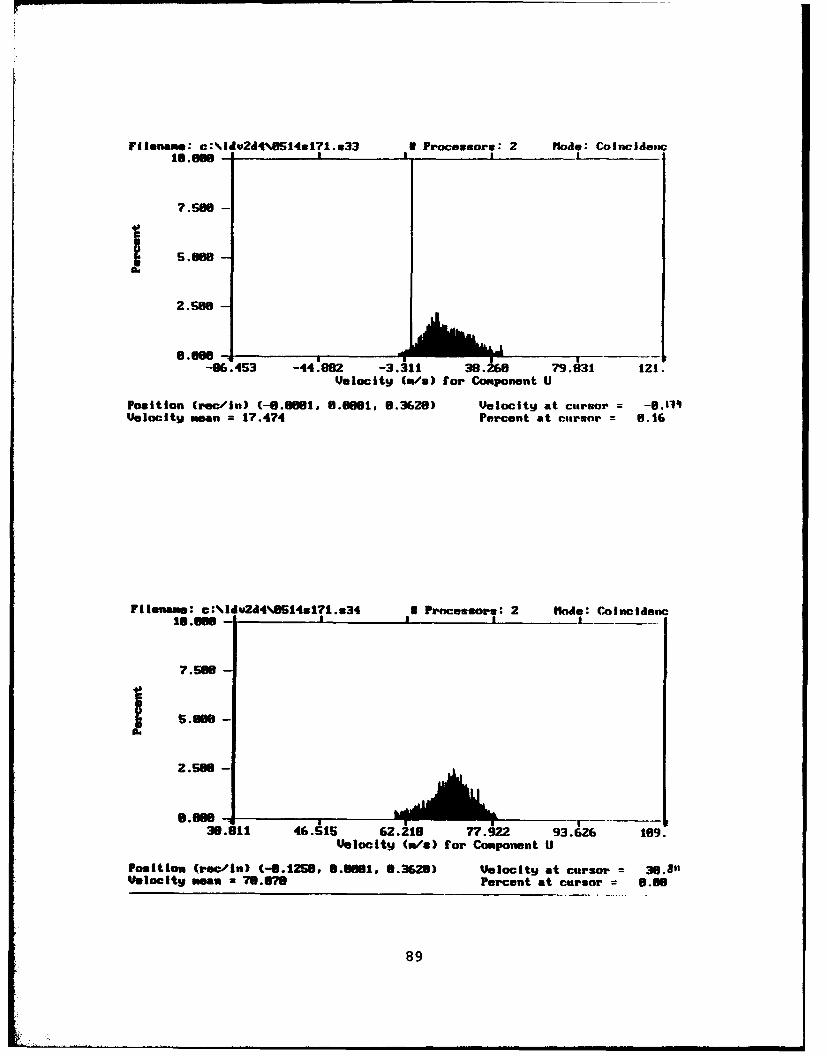
D. WAKE SURVEYS (STATIONS 16 THROUGH 19)
Figure 32 through 34 show the horizontal (U) and vertical (V) velocity components
and the total velocity (Utot) distributions through the wakes at the exit of the cascade.
Like the other surveys, each point in these plots represents a histogram of 3000 data
points which where analyzed at plus and minus two standard deviations. The ones that
delimited positive from negative velocities for each station are printed ir Appendix C.
Two features are evident in these plots; firstly, the width of the wake increased from
station 16 to 19, and secondly, the region of intermittent reverse flow was within the
wake on the suction side of the blade (to the left of the X=0 line for blade 6).
E. SUMMARY
Once all the histograms from each station were analyzed, the boundary of the
region of intermittent reverse flow (last point of negative velocity at a station) was plotted
for each station 2 through 19. This is shown in figure 36 with dotted lines. Also shown on
this plot , with the solid line, is the region of reverse flow as determined by a negative
mean velocity on the vertical component. This line represented the reverse flow region of
the leading edge separation bubble which had been observed with flow visualization
techniques. It was postulated that the reason reverse flow was measured in this region
was because the flow was unsteady and seed particles were entrained into the leading
edge separation bubble. This was not possible at lower inlet air angles because the flow
was relatively steady compared to the present study. Flow visualization also confirmed
the two distinct regions of intermittent reverse flow, as shown by the two regions of
dotted lines; the lower region being associated with the leading edge separation bubble
and the upper region representing the turbulent separation that occurred aft of mid chord.
43
I-c
tto
> CE)
C) I
cw w (0
w 44

D D
45

ED
to
0
I'U)o-be
w 4 4
-6

0)0
U)
C) IPPU-.
-U..--- '%. soWIOUO
47'

-, I . I;: (q) -- ,
tP.
4)0)
"0| Il , 4 -
-'I0'1 I I
'(IP (P 11*
.-. I I$
*. .. . . • _ - _ - _ , I I--
48
S. . . . .l I l

More detailed surveys are needed between stations 6 and 7 to fully characterize the
transition between these two regions.
49

V. CONCLUSIONS AND RECOMMENDATIONS
A. CONCLUSIONS
The lack of experimental data of compressor cascades at or near stall has been
somewhat alleviated with the current set of detailed measurements. The following
specific conclusions can be drawn.
1. The controlled diffusion (CD) cascade was successfully stalled. This was
confirmed with the blade surface pressure measurements, which showed that for
50 degrees the normal force on the blade had decreased. Flow visualization
techniques (both tufting and laser sheet with fog or smoke) also confirmed that the
blades had stalled.
2. It was possible to measure both mean reverse flow and intermittent reverse flow
with the LDV. With the appropriate use of firequency shifting it was possible to do
these measurements with the certainty that the results from the histograms were
correctly representing negative or positive velocities.
3. The regions of reverse flow were plotted. With the information obtained from
each histogram at each station it was possible to plot regions of intermittent
reverse flow and also a region of leading-edge reverse flow.
4. It was possible to take LDV measurements inside the reverse flow region during
the stalling process, which was unsteady.
5. The inlet-flow pitchwise surveys at an inlet air angle of 48 degrees compared very
well with previous measurements.
50

B. RECOMMENDATIONS
The following specific recommendations for further measurements at the 50
degrees inlet-air angle setting are proposed;
i. More detailed measurements should be taken in the leading edge separation
bubble region (station 2 to 4).
2. More detailed measurements should be taken between stations 6 and 8 to further
characterize the region of forward and intermittent reverse flow.
3. Detailed measurements are needed between stations 15 and 16 to determine the
trailing edge base flow region.
4. Pressure side passage surveys are also needed.
5. Measurements away from mid span are needed to determine the degree of two
dimensionality of the flow.
Blade surface pressure measurements at approximately 49 degrees inlet air angle
are also needed to determine the maximum blade loading condition.
51

UZ m ICuS
A. InLM BUiWVY8 k? 46 DR UM98 (STATIONS I THROUGN 12)
Pitchvise survey at station 1
X(l) Y(l) U/Vrst V/Vref U-turb V-turb Reynolds Correl.refer reter Stream Coeff.
3 -6.292 0.74136 0.692654 1.463915 1.413003 0.067123 0.0469022.75 -6.292 0.746466 0.692364 1.416979 1.263615 0.065471 0.06789
2.4999 -6.292 0.753923 0.6S8168 1.334609 1.346387 0.042565 0.0342232.2499 -6.292 0.756570 0.602245 1.311649 1.348066 0.05643 0.04609
2 -6.292 0.753071 0.674006 1.300756 1.346572 0.017453 0.0143741.75 -6.292 0.740567 0.67201 1.31101 1.306448 0.059379 0.0500971.5 -6.292 0.742543 0.671297 1.303492 1.298236 0.043573 0.0372
1.25 -6.292 0.730081 0.670637 1.501345 1.343765 0.127392 0.0906691 -6.292 0.730915 0.676326 1.574865 1.353234 0.120067 0.091395
0.75 -6.2921 0.735436 0.600991 1.61169 1.334633 0.115111 0.0773150.4999 -6.292 0.730607 0.687099 1.475767 1.369417 0.11726 0.063042
0.25 -6.292 0.741475 0.690215 1.509765 1.488283 0.056298 0.036198-0.0001 -6.292 0.744766 0.690736 1.487172 1.414451 0.093394 0.064144-0.2501 -6.292 0.746923 0.691276 1.409122 1.312934 0.002955 0.002307-0.5001 -6.292 0.751632 0.668292 1.455245 1.362432 0.12164 0.069793
-0.75 -6.292 0.754739 0.603100 1.350539 1.25601 0.110055 0.093525-1 -6.292 0.755149 0.676992 1.576743 1.411971 0.074725 0.046492
9 J 99 I ,p JlIPI.* I lf,. 1 .' '..,I .99t 5hI. ' *ev,
'9.
-ISh
? l0 9
X f1,9
52

1.4
I HDV U-Iks~, iand Slat oevy. -0V/Viet Illobsoeb and Sloreeve -0
It/Vret - Present 0
X (I .i
1.5
q.
(C Iill
45

Pitchwise survey at station la
X(I) Y(i) U/Vref V/Vref U-turb V-turb Reynolds Correl.refer refer Stress Coeff.
1 -5.5 0.703738 0.644747 1.320592 1.353239 0.112141 0.0921110.75 -5.5 0.700153 0.668084 1.394284 1.284097 0.127712 0.104707
0.5 -5.5 0.705206 0.687196 1.384214 1.217664 0.033909 0.0295310.25 -5.5 0.718 0.702983 1.589035 1.464419 0.166871 0.105262
0 -5.5001 0.736945 0.71407 1.665003 1.373785 0.190951 0.122541-0.2501 -5.5 0.756807 0.718059 1.72404 1.296312 -0.06843 -0.04495
-0.5 -5.5 0.782435 0.712994 1.508213 1.245929 0.064386 0.050296-0.75 -5.5001 0.799708 0.693006 1.487321 1.454848 -0.00563 -0.00382
-1 -5.5 0.800899 0.666727 1.479869 1.467399 -0.00566 -0.00383-1.25 -5.5 0.779457 0.642881 1.482129 1.449028 -0.00456 -0.00311-1.5 -5.5 0.749275 0.638938 1.373295 1.386049 0.071845 0.055405
-1.7501 -5.5 0.726591 0.651752 1.472721 1.426907 0.126707 0.088507-2 -5.5 0.716153 0.670346 1.632892 1.457935 0.164624 0.101506
-2.25 -5.5 0.718584 0.692819 1.663465 1.428475 0.146736 0.090645-2.5001 -5.5 0.728194 0.711438 1.754875 1.446504 0.188347 0.108915-2.7501 -5.5 0.744533 0.725975 1.892023 1.714723 0.139615 0.063169
-3 -5.5 0.763451 0.732077 1.694677 1.649282 0.01088 0.005714
5 4 I itt' ll. I *...,,*
I a
-1... oL -. ,.I .. -. I.-*.'
54
4.
I Vt ,ivh~~~a~pvi~~X I- IIIl~~ i~ ~r''"
f 4-
1 1 .2A -, -1. -I sllq fle
V/Vref - lloko~.,lv And3 Shr-evý -4--lI/Vr'-f -pr".I.' t fl
V/Vrof - rIq,R-w
If* IfI- 4 -
1'n
I - 0- *)
45

Pitchvise survey at station lb
X(I) Y(i) U/Vref V/Vref U-turb V-turb Reynolds Corral.refer refer Stress Coeff.
2 -5 0.958084 0.627842 1.607578 1.791224 0.096447 0.0493471.75 -5 0.653672 0.444457 1.729976 1.526591 0.025728 0.0142731.5 -5 0.673265 0.487715 1.244763 1.41887 0.117505 0.097474
1.25 -5 0.63042 0.569016 1.298135 1.408513 0.060343 0.0483511 -5 0.624632 0.626094 1.413872 1.319718 0.113958 0.089479
0.75 -5 0.632516 0.669163 1.375079 1.271422 0.162005 0.1357610.4999 -5.0001 0.647871 0.703524 1.474691 1.29333 0.197921 0.152035
0.25 -5 0.668768 0.730604 1.378618 1.227759 0.152697 0.1321720 -5 0.699079 0.755237 1.472813 1.265611 0.154464 0.121407
-0.2501 -5 0.738667 0.770627 1.907636 1.633206 -0.02761 -0.01298-0.5 -5 0.791511 0.77656 1.580932 1.429406 0.100471 0.065139
-0.75 -5 0.866611 0.750163 1.757226 1.776589 -0.29205 -0.13706-1 -5 0.931505 0.641569 1.729945 2.052353 0.062178 0.025658
-1.25 -5 0.827368 0.477815 1.866588 1.647463 0.104234 0.04966-1.5 -5 0.677658 0.521568 1.426295 1.718446 0.149499 0.089363
-1.75 -5 0.640081 0.594843 1.475752 1.367188 0.244467 0.177518-2 -5 0.63561 0.646967 1.527771 1.302694 0.204851 0.1508
56

4, L
0. A - 4
57-4

Pitchvise survey at station Ic
X(I) ¥(1) U/Vref V/Vref U-turb V-turb Reynolds Correl.refer refer Stress Coeff.
2 -4.896 1.032942 0.655777 1.95444 2.395522 0.309529 0.096531.75 -4.896 0.899393 0.305473 4.000105 4.453251 -3.537 -0.289911.5 -4.896 0.611193 0.452963 1.218652 1.492263 0.128289 0.103002
1.25 -4.896 0.592662 0.560462 1.266566 1.320667 0.138072 0.1205221 -4.896 0.596724 0.621573 1.264895 1.247186 0.166161 0.15379
0.75 -4.896 0.609269 0.668145 1.407681 1.275609 0.15649 0.1272470.4999 -4.896 0.626958 0.705764 1.471754 1.314726 0.242738 0.183168
0.25 -4.896 0.65313 0.73a446 1.490103 1.267063 0.210081 0.1624630 -4.896 0.685123 0.765836 1.481566 1.287087 0.121722 0.093201
-0.25 -4.896 0.726156 0.707 1.542182 1.306153 0.117827 0.085408-0.5 -4.896 0.78884 0.799841 1.883499 1.530384 -0.03132 -0.01587
-0.75 -4.896 0.884321 0.784678 1.922391 2.078085 -0.77927 -0.28482-1 -4.896 1.019106 0.655669 2.272077 3.191467 -0.67551 -0.13602
-1.25 -4.896 0.846569 0.34376 2.641355 2.621281 -0.66567 -0.14038-1.5 -4.896 0.627775 0.48539 1.513604 1.485803 0.192735 0.125133
-1.75 -4.896 0.609753 0.585436 1.529772 1.327857 0.26045 0.18721-2 -4.896 0.616697 0.645592 1.495324 1.342328 0.165122 0.120114
58
II A.
58

V-t iI, ~.'
n. A 4, - -
- --. ' rl E
4 /V1.4 .'
o5

Pitchwise strvey at statiooi id
X(t) Y(i) Ii/Vrrf V/Vre f 1-tiurh V-turh ReyrnnIdrl Correl.refer refer Stress ('opfft.
2 -4.844 1.07927 0.691071 1.70938 2.788001 0.175375 0.053731.975 -4.844 1.187367 0.497841 3.30138 3.384047 1.44019 0.188222
1.75 -4.844 1.187167 0.497841 3.30138 3.384047 1.44019 0.1882221.625 -4.844 0.577508 0.328685 1.266654 1.977669 0.232642 0.135599
1.5 -4.844 0.568449 0.450116 1.300276 1.457942 0.132569 0.1021051.375 -4.8441 0.569421 0.518367 1.247914 1.316408 0.125447 0.1114981.25 -4.844 0.573569 0.563031 1.317631 1.238009 0.167099 0.149569
1.125 -4.844 0.577005 0.598154 1.354335 1.259156 0.17762 0.1520791 -4.8441 0.58466 0.626691 1.316982 1.238104 0.277691 0.159315
0.875 -4.8441 0.591686 0.651528 1.421663 1.298462 0.20271 0.1603360.75 -4.844 0.599771 0.672473 1.411686 1.197735 0.148799 0.128494
0.625 -4.844 0.609006 0.693352 1.542253 1.321696 0.154754 0.1108510.5 -4.644 0.62082 0.711766 1.534475 1.310233 0.184049 0.133661
0.375 -4.844 0.63455 0.728728 1.519501 1.234516 0.170355 0.1325990.2499 -4.844 0.649186 0.74463 1.482682 1.261745 0.127431 0.0994570.125 -4.8441 0.66519 0.75998 1.454505 1.277603 0.122416 0.096185
0.0001 -4.844 0.680677 0.77378 1.423782 1.221272 0.16884 0.141775-0.125 -4.844 0.699117 0.786315 1.466321 1.288817 0.18499 0.142925
-0.2501 -4.844 0.723446 0.799266 1.550707 1.289112 0.11641 0.085026-0.3751 -4.844 0.748298 0.807987 1.524747 1.349774 0.108343 0.076664
-0.5 -4.844 0.78575 0.817583 1.755867 1.459877 0.037677 0.021461-0.625 -4.844 0.829675 0.820534 1.750142 1.541152 0.114339 0.061895
-0.7501 -4.844 0.888058 0.812054 2.131969 2.158399 -0.63247 -0.20068-0.875 -4.844 0.980107 0.778259 2.326029 2.584094 -1.17601 -0.28567
-1 -4.844 1.087523 0.683 2.355792 3.890212 -0.99661 -0.15879-1.125 -4.844 1.164313 0.45077 4.517489 3.635272 2.47677 0.220208-1.25 -4.844 0.795877 0.345364 3.956939 7.094027 -4.37986 -0.22782
-1.375 -4.844 0.619863 0.373951 1.557443 1.789111 0.141239 0.074009-1.5 -4.844 0.601546 0.482327 1.528185 1.44206 0.223027 0.147768
-1.625 -4.844 0.597837 0.545238 1.65922 1.501836 0.200149 0.217276-1.75 -4.844 0.598954 0.589662 1.510196 1.374525 0.216697 0.252423
-1.875 -4.844 0.60419 0.623358 1.480675 1.420208 0.258699 0.179625-2 -4.844 0.608207 0.649622 1.460579 1.435412 0.215375 0.163q21
iI
L- I j....
60
S - -I . . . . 1 . .. m .'.. . -' 'l.* i
60

4.k
0.4
in 14'~ D
61i

a.,
ea
-^g flftIM
*SccC. ii W,**.*t c .ccacvc ciata - f
S. . . . .o p . . C. . o . . . . . . • 4 i a a c * * b a * C a n F 4 .W a f *. a. . . .o;
---- -- . -. . . ..-- - .... -- - - - -. c- t- 1 * t .. t fi ..l ....lS..... .3 . a. .... enact .... Sccb . ..... C *U... Oa..- se.. ..a ~ t!.. .*...... *.. *. *... ... i ....... l.i. ..*!n.
i Illpllt ll~lllIi nu l zma :niu mv~lll il• ticic s •
jil ... ~. ...... ..... ......-- 2..
1-HiSIZN 11101-20 *0 Cofoace n.eantSS*oi c acec=a.o S.ec caancf.C a..... e-eac.-.iS. .nIc.lIlia2..a a:.....~iI .. .oo. I .. ... 8 .ll ...
. .. .. ... -.... ....... a.. . . I . .... ... .....
nacc C Scftaofl,4-i Ile aa Ve . * c c J
62
~* * 3 e~ an.. .a annaanaa..Ab*a.

_ ~ ~ ~ ~ ... ....... ,....n.J - .. .. j... i
I. U
• V ) ef - I, I1.1 lr--- -ilieS) --- - -
0404 Wei ll
-0. 11 0.5/ ,
-• I .I -"-(VIl) 0. I I.'
63
" i i i I II I

B. HISTOGRAMS FROM STATION 2 THROUGH 15 FOR 50 DEG
FIlenme.: C:%%L9V2D94%•.511S2l.mll v rrof1IrflFo: 2 MOOe: :.10,:IA..,is.su0 -' _______......... ...___L._
7.501-
2.5W6 -
6.006 --.3.919 12.524 21. 239.S2 311.N f, 46.9
Uelocity (WO/) for Compnumnt U1
Powitlon (rec/in) (-1.1421, 6.8MO8. -4.7929) Velocity at crirsor 3.419'Velocity mean = 25.445 Percent at r.mranr - .80
Fltionam: C:NLD20D4•\6•i121.%32 I Proceg.,mrs: 2 iAe: ('qIu,,, foowm18.801-- #I _-
7.5458-
I 5.6i8 -
2. S2.5681 -
-4.193 19.671 43.535 67.399 91.261 II ;.Velocity (We/) for C'mponevmt 1
Position (rec/in) (0.6679, 0.00M6, -4.7928) VeinlcIt at ritr.orVelocity nann = 55.467 prremilt at CO....qr - t.f6
64

F ilenme,: C:%LD12D4%S5IISAI.*.31 I Processors: 2 Maoe: Cnincidenc
7.5W8
J5.M
2.588
-111.634 -68.6188 -9.725 41.M29 92.104 143.Uelocity (wa) for Component U
Position (rec/in) (-1.1331, 8.8868. 4.7906) Velocity at cursor = -8.'iUelocity mean = 15.759 Percent at cursor 8.96
Fl lenams: C:%LDU2D4%851182A1.*82 I Processors: 2 Hode: CoinclencIO.MO
1s.m1 -- I _________________
7 .
J5.M
2.5W8
-8.836 6.487 28.85 35.293 49.736 64.1Velocity (WS) for Component U
Position (roe/in) (-1.1233, 8.888., -4.7985) Velocitg at cursor -8.012Velocitg mean = 28.871 Percent at cursor = 8.88
65

FIlename: c:mLW2Imm2 1tz261.sg1 8 Procssors: 2 noae: Colocidnnc
7.588I 5.000 -
2.568
s,8m -.
-185.373 -63.296 -21.297 26.976 62.959 185.Uelocity (W'e) for Component U
Position (usc/In) (-1.8928. 6.6988. -4.7566) Velocity at cursor = 8.0C5UVlocity mean z -6.164 Percent at cursor 3.11
Filename: C:NLIlU2D4%Mll*2b1.s*I2 a Processors: 2 Itkde: Coincidonc
7.5W8
S5.8w8-
2.5W6
-122.596 -72.725 -22.869 26.99 76.841 126.Velocity (•e) for Component U
Position (res/in) (-9.3W36, 9.9 , -4.75M8) Velocity at cursor a 8.ztVelocity mean = 2.859 Percent at cursor = 8.95
66

Fllenam : C*\LDV2D"451182bl.u% I Processors: 2 lnude: (tiociardc
7.508-
2.58-
-124.665 -63.746 -2.11 .1.9 119.934 179.Uelocity Wmes) for Component II
P]wition (src/In) (-1.6321, 8.1l66, -4.75M1) Uelocitya at cursor -@.%'5Veloc•t• mean = 27.64? Percent at cursor = 0.33
Fiemsme: C'%ILJ92*4*5Is2I1.-s7 U Processors: 2 nolie: Coincidenc
7.5W-
Z.Sw -
6.6M8 4~idiIhL&J-38.622 -4.i89 22.604 49.218 75.831 182.
Velocity CW's) for Component U
Position (ruc/in) (-1.6162, 6.6M8, -4.7588) Velocity at cursor = O6.Velsocity mean = 35.911 Percent at cursor 8.11
67

FII.,wanms: C:%g.W23m4%9151R3. gall I Prucesso S: 2 tlkbAe: (:osiou:demu16.9" - ------ '--- a - -I*--* - -j- - - - -
7.5111
5.0101
0.11111 - -v - .- - -- ---47.5 -311.11M -14 611 1.v" 1. 34.velocityi (s/) for Co~mponent U
Poal1tion free/"in) t-8.9360, 01.91110. -4.S428) veoacity at cursor 60Velocity mean - -. S12 Pervent at cursor, - .23
VS esa..: C:%LINAMMI51233.03 a Processohs: 2 11040: ColnCIdAGOC
7.566 -
2.51101-
9.0111 -1 1 1 -- --132.926-t .9 -29.063 23. 61 75.2186 127.
Velocityg Wsn) for Co~mpommat UI
Poeltion drec/1 1s)(-. 1.611011. -4.S428) kUwincitt at cursor O- SVelocity man = -2.1158 Percent at cuso 9.75
Fil emme.: C:%LDV234%6512331 .4 0 Pr~oeuauur: 2 fMMO: Calic dmic
2.166
O.Me ------_____
-195.955 -336.715 -37.47S 41.S 121.915 2M6.velocity (Wa) for comnponent 11
Position (rec/ln) (-11.9631. 3.9661, -4.S429) Velocity at ctiuanr - .f~Vel~ocity nean = 9.149 Percent at cursor - 1.14
68

Filenme: C:%J.DV2DM%512S31.sall I Processors: 2 linde: Colucideticis. -a i -
7.580-
5.001-
2.568
-88.434 -22.222 35.996 94.283 152.415 210.Velocity (Cw's) for Component U
Position (inc/in) (-6.7575. 6.0061, -4.5428) Velocity at c:ursor A.111Velocity mean = 65.097 Percent at I.Ersor 8.08
FIIeuge : C:%L3DU34\I*M2831.esl 2 Processors: 2 linde: Coincidenc
7.580-
J 5.m00
2.566
-247.371 -128.994 -18.617 187.761 226.138 344.Uelocity (0/a) for Component U
Position (rec/,n) (-8.7811, 6.6801, -4.5429) Uelocity at cursor -9.142Ueloclty mean = 48.572 Percent at cursor 8.59
69

fIlemnea: C:%1.De'/3|4%W23S4.a7 8 Processors. 2 hoje: QilcIdenc18.008 .L I ....
2 5Sell -
eii, s - 1"4 . .
t -w.e8 -(35.318 2. 9. 46 157?.523 221.-e8ocity (-.8) for Component II
Position (rec/ibe) (-9.6339. 6.m0i. -4.292) Uelocity at cursor 6.131Velacity mean = 61.167 Percent at c6rsur RIM
Fllename: C:%L'V2,4%ffi2341.m% I Processors: 2 lkude. Coincidenc
7.S8l -
2.501 -
-237.210 -123.960 61.39 193 .6= Z16.429 379.velocity (we) tar Campomaet II
Position (rec/in) (-0.6490. 61.61 , -4.2920) Uelocity at ,:usrsur -. 1,.1oUelocity mean x 46.330 Percent at cursor 8 6.7S
Filename: C:%LW1ZD4'I452S41.861 I8 Processors: 2 ioloe: Coincidenc
7.5891 -
2.581
-237.097 -131.244 -25.391 80.462 106.315 292.Velooity (Cm/V) for Component to
nsitlion (rec/i,) (-8.7187. 9.811111. -4.2920) Velocity at cursor S.5S1Uelocity mean Z?.SS3 Percent at curor 1.40
70

Filmen : C:MLvM%"l2S51.s@1 a fracsor: Ha: Coi"ncidema
7.51111 -
15.•-
mSAW -
-162.696 -94.9561 -7.:6 66.531 168.271 256.eIoclltg (We) for COMPonEnt U
Position (.ci/lu) (-6.5469, 6.6631, -4.0429) Uilocity at cursor WL-Velocity um" x 36.661 Percent at cursor = 6.39
Manseama: C:\L3V23%551I225 I Processors: 2 Nods: CoIncidene
7.5661I 5.666
2.566
.m--214.1175 -169.994 -5S.&33 99.mN 284.869 399.
Ueloclty (We) for Component U
Position (ma/cn) (-6.4962, 6.U11, -4.0419) Velocity at cursor =UVIocity mean z 47.428 Percent at cursor 6.39
Filenase: c:%L3UM4%M651.218" el Po nrcoSm0": 2 "ode: ColCindeiuc
7.5368
I 5.666
SAM
2.536- 9A.-196.M5 -40.331 26.242 92.916 159.398 225.
Velocity (Wie') for Component II
Position (rec/In) (-8.4642. 8.1161, -4.6421) UVlocity at cursor = -5.15Uelocity swan a 59.52" Percent at cursor : 9.66
71
L. .

FIi|naae." C :\L|U234111%.612St,1..sil U Pr•*-•r 2 I.de : (C4|I•: Jde,Csumall L JI I
........-
2.510 -
-131."2 -(A6.942 9. •. w 151.72 .Uelocity (,'.) for Component II
Positian (pectln) (-6.3825. @I.O ., -3.7919) VeIocit y at cursor .Velacity aean a 45.139 Percent at curatsor 9 6.
Filename. C:%LiU2SI4%6Ml2S6l.s.62 P rocesors: 2 noMde: CnIn.idenc
7.566-
S 5.101111
4..
2.5111 .
-13.763 411M 2 9 143.957 265.Velocity (WO) for Component U
Position (rec/in) (-4.3725, 6.6I61, -3.792M) Uelncitg at "truar - .10,UeIncity mean = 51.662 Percent at cursor = 6O.
rIleneam: C:%L9W234.6517%61.s63 I Prrgwesors: 2 iJnd:c CJlinciJ4devIis.08 - ______________________ -L.-~.
7.566
-194.b25 -9.432 -4.239 90.955 16. 14" 21)5.Uel.cityt (Weu) for Componnnt 1I
Position (i.c/in) (-9.3614. .6IAMt. -3.7926) Velecitil at rur-ror a - filUnIn.Ity mean = 43.358 Percent at r.arunr - 0.49
72

FI Ifr.n•.s: C:\I.DqJ2D4%•.r, tZSS6 .fl4 U Ir'r w~•..rs 7 ? l,,, : 'l~:I•.
4.FA
5. f --
2.511 -
am88 - -~--.-----r- ----100.846 -43.76*1 21.316 t 6.300 151.46,6, 216(
Velocity ( "/') for Compolent II
Position (rec/in) (-F1.3494, @.NM8I, -1 7928) Velocity at cursor A.2lfiU eel a,.. "eon = 53.819 Percent at ctursor ".8M
Plifnneme: C:NLOU2D4$%KI52S61.s8 a Processorx: 2 hinse: CohInI.4lecIO.868 -I -. I ..
7.598 -
+, 5.60 -
2 .5 M*
. A-
-117.208 -47.131 22.946 93.623 163.1181 233.Uelocity (C/o) for Component ii
Position (rec/!n) (-0.2M08. 8.881@ . -3.7920) velocity at cursor = 0.3ZVelocity mean = 57.984 Percent at cursor 0.08
FIlenome: C.:LDU2D4\S5I2••I .s89 0 Pro.ce"sors: 2 tinod: CoIlnidntI c
7.58 -
5.8880116
2.58a -
8.8011 --M- '--- r --232.877 -119.982 -7.689 164.587 216.782 320.
Velocity (m'.) for Component II
Position (rec/In) ([email protected]". 8.9MI8. -3.7921) Velocitip at buirsnr - S.,UVlocity m•an = 4n.418 Percent at ervser-or - W!
73

Filename: C:\LD42D4\8512S .usl IU Processors: 2 Modne: Cnincridnec
7. SOS
2.500-
-106.136 -3F.7S0 28.619 9S.997 163.374 Z30.Velocityp (W/O) for Component U
Position (rec/in) (-0.2474, 8.6061, -3.7921) Velocity at cursor = -9.146Velocity mean = 62.309 Percent at cursor 8.09
Filename: C:%LDSJ2D4%•912S61.n22 I Processors: 2 "fide: Coincideoc16.989 - i p
7.58 -
4'
~ 5.006
2.590
9.999 - _______
4.765 31.188 57.670 94.153 11i .635 137.Velocity (Ws) far Component U
Position (rftc/in) (0.2541, 8.8001, -3.7920) Velocity at cursor 30.111
Velocity mt r = 78.912 Percent at cursor 8.00
74

F lnnai :.: cI.Du2D4%1r•dP?.e7R. 3sill I Prmennsnrma: 2 plhwe: C(•wI,.rId.6,-
18.4
SS"
/ .,2.500
--A17.215 -52.175 12.665 77.9%6 142.946 287.Velocity (ms/) rpo Component ii
Position (rec/In) (-0.1434, 9.9999. -3.2921) Velocity at cursor 8.1pUflocity %esn = 45.3m5 Percent at cursor 8.98
Filename: C:%LUUZD4%.5787I7.w62 8 Processors: 2 mod*: Col3CJdenc18.696 ' - i ____________
7.566 -
2.599
6.999 - ; 1--_; .......
-199.639 -163.691 -7.?44 983 194.158 211R.Uelocity (W's) for Copponent U
Position (rac/in) (-6.1335, 9.88M9. -3.2921) Ielocity at cursor B.-WAUelocity mean = 4.229 Percent at cursor 6.55
Piloeneae: C:%143U2D4%9M97S71.%I| I Processors: 2 Wode: Collilaenc
7.599
j5.960
2.599 -
-253.254 -132.254 -11.,4 169.746 238.746 35.Ueloclty (m/8) for Component U
Position (reciin) (9.172S. S.A6M9. -3.2921) Uelocity at cursor 0.414Ueolcity ean = 49.281 Percent at cursor - 8.72
75

lile"ame: C:%LDV234%ISO7\879.at7 I Proc.manre: 2 floas: CttleiA:Iantie.sss , L Jj_ __ _ ......-
7.5011 -
-56 .116 -6 .. 9 44.626 94.442 144.0541 1%.Ueloclty (in/) for Componelt to
rsltion (rec/in) (0.2141. 6.1011, -3.2921) Velucity at cursor 9.264Vvincity mean = 69.234 Percent at cursor - 0.01
FilenAnme: C:%L|W2DI4%\SR87l.sIR 9 Processors: 2 IUAC: Cnlncidenc16.8011 _ -A
7.S86 -
2.568! -
6i.66 -~ ------ ,T-- -,--- - -
-221.S24 -111.45 -1.310 169.604 218.754 3201.Uelocity (N'S) for Component U
Position (roc/in) (0.2598, 6.01111, -3.Z921) Uelocity at cursor [email protected].)Uelocity mean = 53.656 Percent at cursor = 1.14
llename: C:%LWM24%4WPS71.119 I Processors: 2 hode: Coiuvidmnc
ss.me - -
2.566
FoiSo~.c/n(S366-24.7M 58i 52. ICý7 98.465 1 28.873 1fi7.
Uelocity (W/e) for Component U
Position (roe/in) (11.3161, 94.1. -3.2921) Ueloclty at cursor = O.,,Uelocity mean = 71.261 Percent at cursorr 8.16
76

Filename: C:NLDU2D4%AF68S81.*B1 I Processors: 2 "ode: Coincidenc18.86 - - 1Lt i ..... .
7.566I --
40
2.508-
.I Ow1-86.947 -35.763 1S.422 66.616 117.791 160.
Velocity (wMs) for Component I!
Position (rec/in) (-9.83, 6.8688. -2.7928) Velocity at cursor -O.VVelocity mean = 41.014 Percent at cursor 9.00
Filename: C:%LDU2D4N85SM01.s82 I Processors: 2 Hods: CoinclAencisse . - I I L. -. 1 I
7.568-
4J 500
2.M66
-179.996 -94.104 -8.212 77.666 163!572 249.Velocity (WO") for Component U
Position (rec/in) (8.8816. 6.89M. -2.79M6) Velocity at curolr - .w)eUelocity mean = 34.754 Percent at coirsor = 0.59
77
II Fileumm: C:\l.DV2D.4N9SS8M8..*19 V Processors: 2 Mule: (Coinciaenc
7.580-
S.M
2.5011
-78.884 -19.864 39.M75 90.914 156.953 215.
Velocity (Wa') for Component 0
Position (rec/in) (9.4451, -9. -2.7920) Uelocity at cursor 9.21C
Uelocity mean = G8.545 Percent at cursor 0.88
Filenam: C*%LD2D4%BSMS9I.81U I Processors: 2 HnAe: Cohcildencls.Im - a _l~~~ ~~ ----I ....
7.58-
' 5....-
Z.596
-247.668 -127.722 -7.,. 11Z.176 232.123 352.Velocity (a's) for Component U
Position (rme/In) (0.3949. -8.661M. -2.7926) Velocity at cursor 0 9.021Ueloaity mean = 52.282 Percent at cursor ".is
78

Filiniamm C:%LW?84%NMl7S9t el9 Uperneemsors: 2 I1,es: Coni,.iA..uc
HA.m
-295.956 -178.275 -16.663 11.W57 M S.764I ?342.Velnc ityg (mao) fnr Cmpwonent 11
Position (rec.'in) (9.MM. -0.81611, -2.2978) Velocitye at curino, - eiUsiocttq ponme = 3264 Pamoverit at c..reetr - .68
FIlvename: C:%L9VMD%J158791.m1g I prncerm-otns: 2 rllru: Conigcaflotc:
7.SM -
-23.955 -123.27 -1.5!; 191.95 22.1.419 134.Veoacity (me) few. Componenit if
Positiffon (roe/in) (6.4894. -0.016111 -2.7920) Umlncitg at crormaruenicity~ mman a 73.26? Parrmnt at cumormre - .52
Fienm Cp~D4Re79..g U ntmnu 2 HneC79iju
Fiillaamu: c:%3duU•l4A597u~ull.Jd1 U Paqrf•nsor: 2. ttA.: r'nl-I,w-g n,w
7A1
?. rim -
-161.537 ? -9.016 -19.456 3. 7 174.518 196.V/elocity (We/u) ror Componmlst j
Position (rec/In) (0.129•. -0.1111. -1.7927) Uelocity at curnor - .9l.5-olocltI imean = 17.262 Precent at mirsrtr - 0.l90
Fllewan: c:%ld w2d4%WU7alO . n.t I Proceasorv: 2 lIloe: CnlnerlAnc
7.9;M -
-223.65B -115.542 -7.626 II 491 M .507 M1f.Usluocit (We/) fn. Cmqpomnrt U
Position (ree/In) (11.31M9, -8.8011. -1.7921) Velocity at cursor - 8S0&klslcmItg sman m 46.474 Percent at mrant .- CA
Filename: c:%ldv2d4%SW647.s1.s16 I Processors: 2 ",Je: ! Colnclmm
7.590
I I
-112.408 -43.759 2 93. 162.464 23t.
Uelcity (nWu) for C4nenent II
Position (veclhn) (B.1365, -9.00t1. -1.7921) Uelocity at cursor - .. IxUnlocity vman u S9.3761 Permct at r•,rwr - R.AW
80

Fil le".aus c :'%ld2d4.%3;7w111 .wrn g l,7*~s ~~
7s. -M
2.66a-
-152.669 -84.646 -16.*6*4 17.27 S. 197.Uelaaftio (We) for COMPO"otet U
Foitition (wc'n 613 .666. -1.29m6) nwul"Cty at Co~rmvr-UflaCltW meals = 17.367 Fnrieent At cte.oran - .39
IFIlanane' c:'ddv2d4\35WsallI.m16 I Proc.esaors: 2 flnae: CniintrEdnc
-213.932 -169.678 -6.36 9?AFS; 7M1.417 1"3.Uelarltja (W*-) for. CompamwIn to
Posiltion (rec/in) (3.4594, .hl -1.2971) Uelorlt' *t cursor -~ llUelocltWg mean a 4S.363 Part,.nt at .ner fl1.4'
Filename: c:NiJ,214%AMU?*111.al7 3 pware..esnrt: 7 &SAO! Co I t-.4#dtnc
7.569
2.5W9
-7.6.14 -t7.785 36 794 14".721 1')l.UIRIOCItY (WO.) fur CAoMPonent 11
feisition (vec/in) (3.9111. 8.1696 -1.29M1) Uulocoty at cursor- Ul'Velocnity Omean 61.MAN peircet at mirner - 1.6
81

2. 54111
-127.987 -71.613 -1512 41.74 97.WJAV 1";..eoraityg ("/a) for Cosspenvelvet If
Poviltion (reci'I,) (6.1238. 6l.66U -0.79211) Velocity at evervanr .1Velcityj swam - M3.ERN p.,u~cent at reruu.,r -~ir
FIPauaas c:%Id,,2d4%8Ws?121.u19 I I'roc..nur: 2 8ndAc: CUISIIApac16.11111 - a________ I'---- I---* ------ -I--- - -
7.586
-149.121 -67.223 14. 74 16 . 1 MAWI(. MA.N.Velocity (a/*a) for Cenweennet if
Petiltion (reecdix) (6.77. 8.00M6. -0.797A) Uelocltq at everar 9.25)Velocity smalla 55.623 Paepnnt att g.mrinh. If 8.9
FTlen-a~ -na- --- a-' MM4 S A7 a 12 .126 U Prnecasors: 7 flnie: (oI1WAldrnmc
7.568
4.ý
2.566
-SI.794 -5.116 411.T~I I 71 134 .646 Infi.Velocity (eu) for Cm~nueflvet 11
Pasgitia. (wuc.'in) (8.632S. 6ý 86 6 .67976) Volocite; at regretter - .0"-
Velocity swan 2 64.7"5 Pre cet at r."ruarwr- .
82

Fli.nvwao* c:NIduZd4MF0597*l3l.wtI . U ii- egns: 2 flnAe "IwJ.
2..W6
-175.449 -6i9.46? -13.566 42.35% 98.276. 154.Velocityi (rn) for Component U
Position freclin) (9.2739, 9.881111, -. 9-S") Velocityi at cursonr 6.xVelocity mean u 14.3114 ?tbreent at curoran- 9.29
Fileonae: c*%Idu2J4%M857a13l.sA2 I rrv~~n* 2 ltne*e CovuIKw-Idnc
7.C99
40
-259.10" -73.79.r 1 1.476 96.73 M ~ 11.9"' 26i7.Velocity (Wa/) fnr- Componont It
Position (rec/in) (6.6-25, 6.806M, -0.4999) UeancmIty at curmor - .- wVelocity mean = 4.190 Pner,,ant at eternor 0 .47
Filenome: c:%Idv2A4%9567u31.*21 I Procosgars: 2 *tAe* ConEwlrnlnc18.11411111__ __ _ _ ~- - - -
-146.561 -65S.143 16i.2 in -7.495 179.114 MR0.Velocity (We/) for Comtpovwnt U
Position (wee/in) (3.6933. S.666, -6.4999) Velocity at rursor - .151Unloritg mean = 696Pennant at cursor 0.13t
83

Flinnams. c-'\1du214\WvAhtwtl.l ql v Prr. ."nrs 7 "Mn.e! .I.Ir
PnlIo r. /n - 0181 1.M. --. Veoit Itcro F#
7 .SM -
6 .666 -I - I --- I---- -
-154.1S4 -71.1629 -1.407 39.09 1178. 14 M~.Uelocity (m/9), for Component 10
Position (rec'ln) (6.16m1 6.061111 -0.2566) Velocity at .curxnr - .1ULcInft~g mean 15S.469 Percent at c,,r"nr 0.462
Filenaume: c:Nl~d.44%656fls4I..21 I Pru.esrsors: 2 fln~e: EninclAun.c16.ow6 - a - II --- - - - - -I -
7.SM1
-15.SI4 719.322 816396 7.15 15.17 44~Velocity (M/ia) for CAmpo~net If
Pouition (rue/in) (9.76S,5 11.06100, -6.2551) Velocity~ at c~ursor -8.4Velocity mean a53.190 Percent at r~ursnr ".910
484

FI'Ilgame. C\Idu7d4\R!UiIxls5.wn1 8 Processors: 2 ffnAe: C-11sIw pit.,c
7.%0"
S.S W
0.
2.'6
- 124.6M6 -68.296i -11.964 44.357 1 M.r,79 Ir.7.Velocityj (rn/a) for Conponent to
Position (roe/in) (10.18M3 S.OM6, 6.161011) Velocity at cursor- goVelocity swan = 116.194 Pe*.onnt at cursonr 1$ .47
Ftwn:c:,%iavzd4%#566u151.*z26 r.,,.-,ssors: 2 6nde, CoI~xllelmcemme - I -- - A
7.91111
-143.555S -68.9827 1.916 911.6,13 178.371, 2¶;6.Velocityg (rn/) for Crm~panut If
Position (pee/in) (11.61113. 11.11011111.66t Unincitt at c'u~rsorVelocity 9men m S13.??? Percen~t at mr'uoqr - (.33
rilenArne: C!IdivZA4'M656sl5.x21 2 Prcsos 2 I`In~e: Coin.nIArnmln.eis -A. ~- I -
7.66 S
129.8 -S5.1111 19.A76 93. 156 6711 241.Velocity. (rn/s) far Componeant If
Position (rec/le) (0.6719, 8.6866, 3.61) alncita at Curnw.v -
Ufnlt.itt mean = 56.7.%Z Peremnt at c-urrnr 6.66
I- 85

C. HISTOGRAMS FROM STATION 16 THROUGH 19 FOR 50 DEGFilename.: c:\Idu~d4%9514w161 .s1fl 1 ,e..,.r~ 7 IeA'Eeu.~'w
7.%W8
5.0m"A..
2.5m8
38.86 3 49.8.3______ 62.912 76.792 941.677 11
Velticity (%/s) roar Coinisomst I
Position (rec/in) (2.8749, 8.861M, 0.2626) Veinclty at cier-m. 35.u5SVelocity moan 269.852 Prt-Purnt at ventrir - iiFMl
F ilestapm: c :\ ldvZd4\S514. 161.%78 Prntqea-,ws: 2 lh '11C I W. I4nmot,
7.508
I .8Me -
-145.928 -M0.744 8. 411 85.6725 16?.IW9 Z.3).Velocity ("/as) for Ctmpostevit 11
Position (rec/in) (0.6258, 8.861.I 8.2620) Veocinty at (12nr si. 29?Velocity mean = 47.8326 Perceist at t-tirmor 9.s55
86

Filaname: c:%%1Ju2d4%6514w161.*32 I Processors: 2 ttods: Coinacidenc18.ms8- I I I
7.586
J5.-2.568
-116.366 -63.254 -10.143 42.969 96.881 149.Velocity in/=s) for Component 11
Position (rec/in) (8.1258, 6.8881, 8.2626) Velocity at cursor 1.6Velocity mean = 16.427 Percent at cursor 6 .68
Filem,..: c:%31u2d4%8514sI61.*34 I Processors: 2 "ode: coincideoc
7. SM
J.Om
31.540 47.282 62.956 79.510 94.164 189.Velocity Wis) for Component U
Position (rec/in) (-8.1256, 8.6881, 8.2628) V~elocityj at cursor 31.S48lVelocity mean = 76.663 Percent at cursor 8.no
87

Fliename: c:\ldv2d4%Ml514s1?.sZ? I Processors: 2 Mode: Coincidoem1i .m -; _________ 1. __I__
7.506 -
2.588 -
-148.979 -63.2M8 14.!4m 92.368 178.139 247.Velocity (rnX) for Component It
Position (rec/in) (8.7588, O.861, 0.3628) Velocity at cursor = 0.016Velocity mean = 53.464 Percent at cursor = 6.86
Filenam: c:%Idu2d4%k614s171.s28 I Processors: 2 Node: Coincidenc168. 68 --- t I__ __ _ _ .. . . - -..... .
7.588
2.51W
-152.290 -72.464 7.378 87.284 167.030 246.Velocity (Wrs) for Component 11
Position (rec/in) (8.6250, 8.8881, 8.3626) Velocity at cursor = .i(,.Velocity nean = 47.268 Percent at cursor 0.42
88
Filename: c:%1dv2d4%6514sll.u33 I Processors: 2 Mode: Coincidleac
19.1911- I t I
7.5W0-
1 5.000
a.6w
2.581
o.es - ____
-•6.453 -44.882 -3.311 39.266 79.831 121.Velocity (0r/) for Component U
Position (uec/in) (-0.11111. 6.991. 0.3620) Uelocity at cursor = -e.114Uelocity mean = 17.474 Percent at ceursor = 9.16
Filename: c:%ld2d4%9514*171..34 I Processors: 2 "ole: Coincidenc
7.5111
'5.00-
2.58 -
8.99 -. 1__ _ _ _ _ _ _ _ _ __ _ _ _ _ _ _ __
36.811 46.515 62.218 77.922 93.626 109.Velocity (rn/8) for Component U
Position (rec/in) (-4.1258. 9.9961, 8.3626) Velocity at cursor = 39.85Velocity man = 7h.W7 Percent at cursor = 8.9
89

Filenamme: . '%ldw2d4%14wI8.s27 8 Processors: 2 "ode: Coincidenclls.Om - ____________ ______________
7.5W8-
S.8
2.888- U
-122.616 -S1.842 18.932 89.787 166.481 231.Velocity (orn/) for Component Ul
Position (rec/in) (8.7588, 6.8888. 0.6779) Velocity at cursor = -O.Z jVelocity mean = 54.324 Percent at cursor 8.8M
Filename: c:%ldu2v4%M' 14*1G1.s20 I Processors: 2 nOde: CoInclIdeon
0.61180-I
2.5M-
8.O08 -
-146.848 -69.7 7. 2 84..63 161.833 239.Velocity (a."s) for Component U
Position (rec/in) (8.i256, S.8118, 8.6779) Velocity at cursor = -0.08Velocity mean = 45.S57 Percent at cursor 8.23
90

Filename: c:\ldv2d4M514su1t.*3Z I Processors: 2 "ode' Coincidem•10s.m - t t_______ ___
7.509 -
2.58 -
-92.326 -49.116 -3.907 49.393 84.513 128.Uelocity (Ck/s) for Cmponent II
Position (rec/in) (9.125, O.9811M, 9.6779) Velocity at cursor = -8.10Vellocity mean = 18.190 Percent at cursor 0 6.49
Filename: o:\ldv2d4%MM14s181.m33 U Processors: 2 Node: coincidenc1.669 I we -
7.598
S5.0--
2.59 -
-88.766 -38.922 16.922 68.767 118.611 166.Uelocity (ma/s) for Component U
Position (rec/in) (-6.698I, ,66S69, 0.6779) Velocity at cursor -- S.Velocity mean = 35,993 Percent at cursor 9.98
91

Filename: c:%IwZd4%M64st191.s2n I Prac.smors: 2 "#)do: CoinciJenc10.0" - I _ i ... .. .....
?.568-
IS. Ow
2.5W8-
O.Om -. 1 _ T-12• .438 -59.e15 S.AW 79.432 149.055 219.
Uelocity (Cm/a) for Component II
Position (rec/In) (M.62S, 0.M888. 1.6620) Uslocit, at cutrsor -R.z&bVelocity mean = 44.614 Percent at cotrsor = 0.60
Filename: c:%ld2d4%M14x191.e29 I PrnmoR.srU: 2 Mllode: Coln.ldmnc18.88 - 1 . -. I .... .. .
7.568-I 5.686-
2.598
-126.686 -60.601 5.. 96 71.572 137.659 283.Uelocity (m/a) for Component II
Position (rec/in) (8.4999 M, 8.68M 1.0626) Velocity at cursor = 8,83UVlocity mean = 39.5 Percent at cirsor = 0.29
92

F lename: c:\Id¶,2d4%hS14ulgl.e31 3 Processors: 2 lOtAe: Ce1ln1InAnicIe.eee - !___ _____ ____ ___
7.58 -
S.D
2.588
-182.876 -51.346 -0.615 58.115 100.845 151.Velocity (n/*) for Component II
Position (rec/in) (8.258, 6.08888, 1.0620) Velocity at cursor 0.0Uelocity mean = 24.759 Percent at Cursor = 0.33
Filname: c:%Idv2d4%M14el9l.u32 8 Processors: 2 Hnde: Coinc IeAncie.mlO -- ! ______a___
7.508-
J 5.808 -
2.5 -
-84.733 -48.661 3.i11 47.483 91.555 135.Uelocity (WO) for Component II
Position (rec-in) (0.1250, 8.66, 1.8628) Velocity at cursor nD.ngUslocity mean - 25.447 Percent at cursor 8.86
93
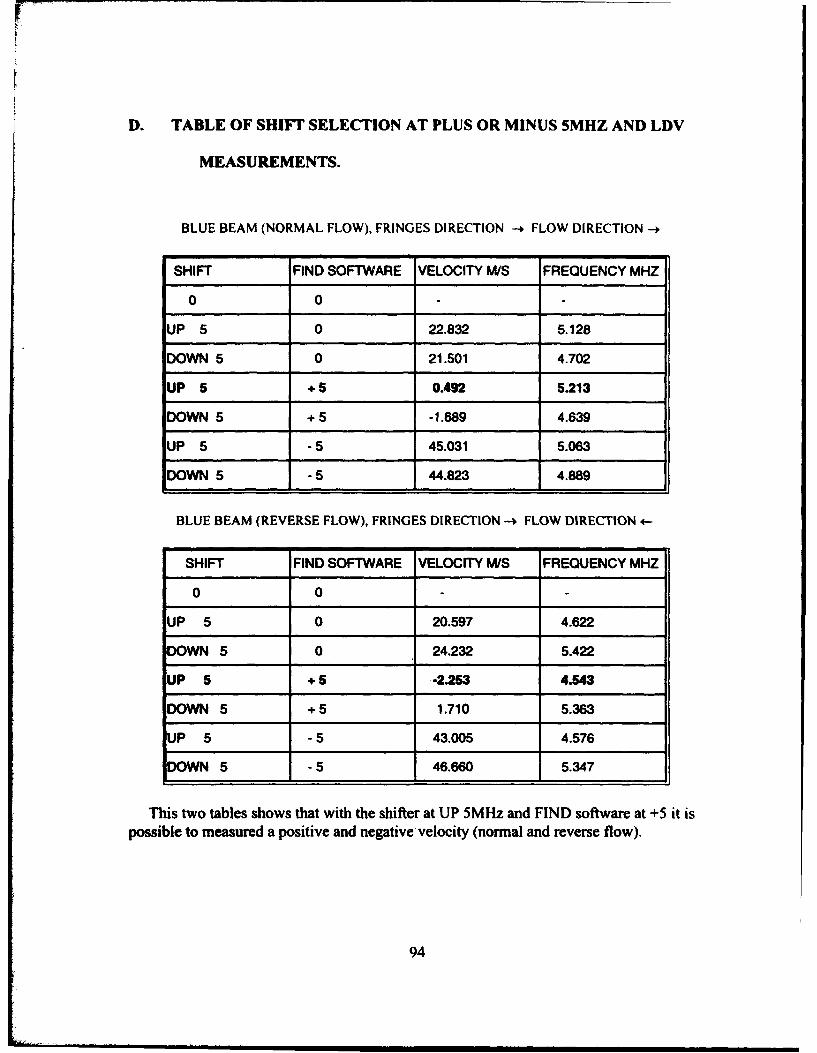
D. TABLE OF SHIFT SELECTION AT PLUS OR MINUS 5MHZ AND LDV
MEASUREMENTS.
BLUE BEAM (NORMAL FLOW), FRINGES DIRECTION -, FLOW DIRECTION -,
SHIFT FIND SOFTWARE VELOCITY M/S FREQUENCY MHZ
0 0
UP 5 0 22.832 5.128
DOWN 5 0 21.501 4.702
UP 5 +5 0.492 5.213
DOWN 5 +5 -1.689 4.639
UP 5 -5 45.031 5.063
DOWN 5 -5 44.823 4.889
BLUE BEAM (REVERSE FLOW), FRINGES DIRECTION - FLOW DIRECTION 4-
SHIFT FIND SOFTWARE VELOCITY M/S FREQUENCY MHZ
0 0
UP 5 0 20.597 4.622
DOWN 5 0 24.232 5.422
UP 5 +5 -2.253 4.543
DOWN 5 +5 1.710 5.363
UP 5 - 5 43.005 4.576
DOWN 5 - 5 46.660 5.347
This two tables shows that with the shifter at UP 5MHz and FIND software at +5 it ispossible to measured a positive and negative velocity (normal and reverse flow).
94
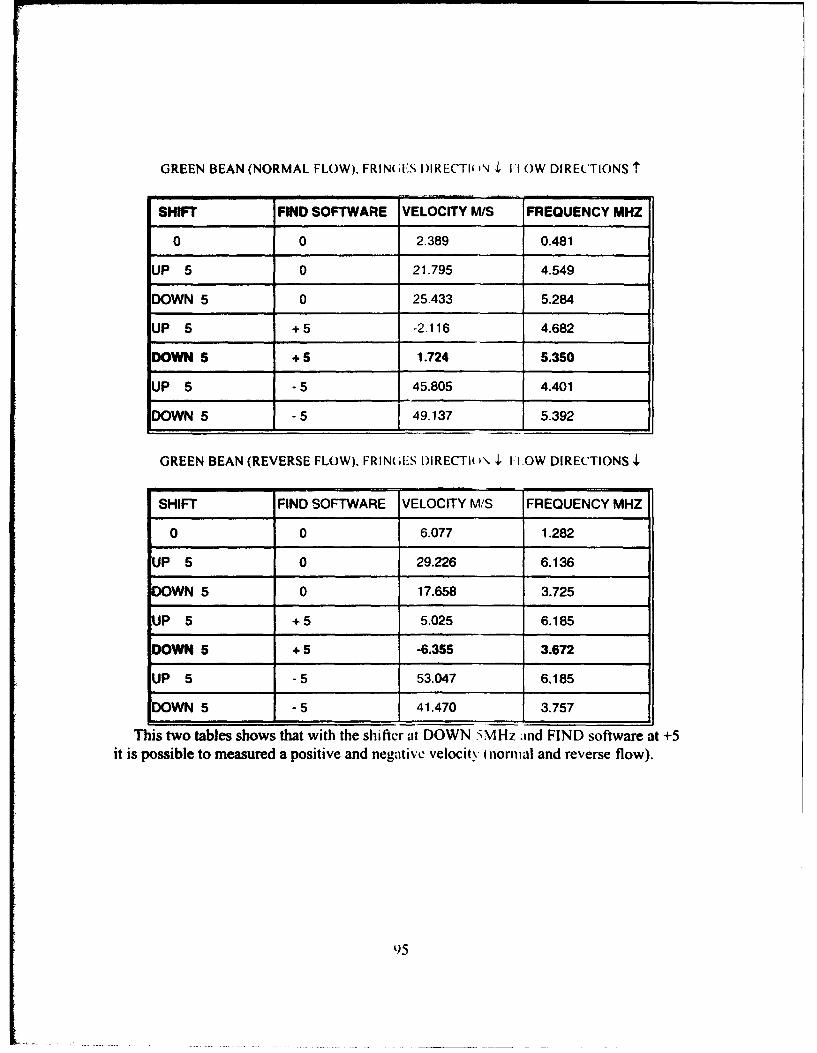
GREEN BEAN (NORMAL FLOW), FRINOES I)IRECTI( IN ., H OW DIRECTIONS I
SHIFT FIND SOFTWARE VELOCITY M/S FREQUENCY MHZ
0 0 2.389 0.481
UP 5 0 21.795 4.549
DOWN 5 0 25.433 5.284
UP 5 +5 -2.116 4.682
DOWN 5 +5 1.724 5.350
UP 5 -5 45.805 4.401
DOWN 5 -5 49.137 5.392
GREEN BEAN (REVERSE FLOW), FRIN(GIES DIRECTI )N F, 10W DIRECTIONS •,
SHIFT FIND SOFTWARE VELOCITY M/S FREQUENCY MHZ
0 0 6.077 1.282
UP 5 0 29.226 6.136
DOWN 5 0 17.658 3.725
UP 5 +5 5.025 6.185
DOWN 5 +5 -6.355 3.672
UP 5 - 5 53.047 6.185
DOWN 5 - 5 41.470 3.757
This two tables shows that with the shifter at DOWN 5MHz and FIND software at +5
it is possible to measured a positive and negative velocity (normial and reverse flow).
L9

E. TUNNEL CALIBRATION DATA
CCCCCCCCCCCCCCCCCCCCCCCCCCCCCCCCCCCCCCCCCCCCCCCCCCCCCCCCCCCCC.C(.Cccc`c((..c.(.(.CCCC CC OUTPUT FROM PROGRAM CALIBRATE CC CCCCCCCCCCCCCCCCCCCCCCCCCCCCCCCCCCCCCCCCCCCCCCCCCCCCCCCCCCC(('(`( C(,C(`CCc(`cc(-c(U('(`
LEAST SQUARES STRAIGHT LINE CURVE FIT IS USEDTO DETERMINE TUNNEL CHARACTERISTICS AT DIFFERENT SPEEDS
NEWTON S METHOD IS USED TO DETERMINE THE REFERENCE VEI)CITYFROM THE RECORDED AMBIENT PRESSURE AND TUNNEL PLENUMPRESSURE AND TEMPERATURE
BEGIN DETERMINING TUNNEL CHARACTERISTICSFROM THE FOLLOWING MEASURED VALUES
AXIAL VEL. TANGENTIAL VEL. AMBIENT PRESS. PLENUM PRESS. PLENUM TEMP.M PER SEC M PER SEC. INCHES MERCURY INCHES WATER DEG. C.
19.9600 24.6660 29.8941 2.0000 17.777832.0520 39.2970 29.8941 4.7000 18.055639.7110 48.1900 29.8941 7.3000 18.888946.6360 55.9700 29.9841 10.0000 19.444450.9830 61.5980 29.9841 12.0000 20.000054.9530 66.2070 29.9841 14.1000 20.5556
CALCULATED VALUES FOR THE TUNNEL CONFIGURATION
TOTAL VALOCITY MACH NUMBER MACH NUMBER FUNCT. PRESSURE RATIO
0.317303192E+02 0.414931434E-01 0.599998018E-02 -0.19331]650EI030.507107968E+02 0.662619212E-01 0.152081979E-01 -0.816858085E+020.624439918E+02 0.815012269E-01 0.228644274E-01 -0.522360685E+020.728529648E+02 0.949967822E-01 0.309775796E-01 -0. 379793300E4020.799598643E+02 0.104164963E+O0 0.369544196E-01 -0.314827750Ef020.860418448E+02 0.111981989E+00 0.425268503E-01 -0.266449149EI02
CALLING LEAST SQUARES SUBROUTINETO DETERMINE THE PRESSURE RATIO AS A FUNCTION OF MACH NO. PARAM
PRESSURE RATIO - At * ANUX + AO
MATRIX EQUATION
0.60E+02 -0.42E+03 AO 0.15E+00-0.42E+03 0.50E+05 Al -0.71E+01
A1 - 0.19109469172E-03 AO = 0.39221597704E-01
REFERENCE CONDITIONS FOR EACH RUNAMBIENT PRESSURE PLENUM PRESSURE PLENUM TEMPERATURE RUIN NAME
INCHES MERCURY INCHES WATER DEGREES CELSIUS
96

29.8737 12.0000 18.8889 0514sll.PRN29.8737 12.0000 20.0000 0514slal.PRN29.8684 12.0000 22.7778 0514slbl.PRN29.8481 12.0000 22.2222 0514slcl.PRN29.8481 12.0000 22.7778 0514sldl.PRN29.8481 12.0000 22.7778 0514slel.PRN30.0110 12.1000 21.1111 0511s21.PRN30.0110 12.1000 21.1111 0511s2al.PRN30.0110 12.1000 22.2222 0511s2bl.PRN29.9702 12.2000 20.5556 0512s31.PRN29.9906 12.2000 21.1111 0512s41.PRN29.9906 12.1000 21.1111 0512s51.PRN29.9906 12.1000 21.1111 0512s61.PRN29.9092 12.1000 22.2222 0507s71.PRN29.9295 12.2000 22.7778 0508s81.PRN29.9295 12.2000 22.7778 0507s91.PRN29.9295 12.2000 22.7778 0507sl0I.PRN29.9295 12.2000 23.3333 0507s111.PRN29.9499 12.2000 23.3333 0507sl21.PRN29.9499 12.2000 23.3333 0507s131.PRN30.0110 12.0000 21.1111 0508s141.PRN29.9906 12.0000 21.6667 0508s151.PRN29.8684 12.0000 21.6667 0514s161.PRN29.8684 12.0000 22.2222 0514s171.PRN29.8684 12.0000 22.2222 0514s181.PRN29.8684 12.0000 22.2222 0514s191.PRN
I= 1PRESSURE RATIO = -31.36317 MACH NUMBER PARAMETER 0.4151E-01RUN NAME - 0514a11.PRN
BEGIN NEWTON ITERATION
ITERATION NUMBER 1 MACH NO. PARAM. = 0.104363 ERROR TERM = -0.6401E-02ITERATION NU1BE9R 2 MACH NO. PARAM. - 0.110764 ERROR TERM - 0.1655E-03ITERATION NUMBER 3 MACH NO. PARAN. - 0.110598 ERROR TERM - 0.5999E-07ITERATION NUMBER 4 MACH NO. PARAM. - 0.110598 ERROR TERM = -0.1731E-10
VREF - 84.73722268314
I- 2PRESSURE RATIO - -31.36317 MACH NUMBER PARAMETER = 0.4151E-01RUN NAME - 0514s1aI.PRN
BEGIN NEWTON ITERATION
ITERATION NUMBER 1 MACH NO. PARAM. = 0.104165 ERROR TERM = -0.6610E-02ITERATION NUMBER 2 MACH NO. PARAM. = 0.110775 ERROR TERM = 0.1765E-03ITERATION NUMBER 3 MACH NO. PARAM. = 0.110598 ERROR TERM - 0.7161E-07ITERATION NUMBER 4 MACH NO. PARAM. - 0.110598 ERROR TERM = -0.2066E-10
VREF - 84.89826103496
1 3
97

PRESSURE RATIO = -31.35743 MACH NUMBER PARAMETER = 0.4151E-01RUN NAME - 0514slbl.PRN
BEGIN NEWTON ITERATION
ITERATION NUMBER 1 MACH NO. PARAM. = 0.103675 ERROR TERM = -0.7129E-02ITERATION NUMBER 2 MACH NO. PARAM. = 0.110804 ERROR TERM = 0.2053E-03ITERATION NUMBER 3 MACH NO. PARAM. - 0.110598 ERROR TERM = 0.1066E-06ITERATION NUMBER 4 MACH NO. PARAM. - 0.110598 ERROR TERM = -0.3074E-10
VREF - 85.29953401308
I - 4PRESSURE RATIO - -31.33544 MACH NUMBER PARAMETER = 0.4151E-01RUN NAME - 0514slcl.PRN
BEGIN NEWTON ITERATION
ITERATION NUMBER 1 MACH NO. PARAM. - 0.103772 ERROR TERM - -0.7025E-02ITERATION NUMBER 2 MACH NO. PARAM. - 0.110798 ERROR TERM - 0.1994E-03ITERATION NUMBER 3 MACH NO. PARAN. - 0.110598 ERROR TERM - 0.9887E-07ITERATION NUMBER 4 MACH NO. PARAM. - 0.110598 ERROR TERM - -0.2852E-10
VREF - 85.21942480550
I= 5PRESSURE RATIO - -31.33544 MACH NUMBER PARAMETER - 0.4151E-01RUN NAME - 0514sldl.PRN
BEGIN NEWTON ITERATION
ITERATION NUMBER 1 MACH NO. PARAM. - 0.103675 ERROR TERM - -0.7129E-02ITERATION NUMBER 2 MACH NO. PARAN. - 0.110804 ERROR TERM - 0.2053E-03ITERATION NUMBER 3 MACH NO. PARAM. - 0.110598 ERROR TERM = 0.1066E-06ITERATION NUMBER 4 MACH NO. PARAN. = 0.110598 ERROR TERM = -0.3074E-10
VREF - 85.29953401308
1, 6PRESSURE RATIO - -31.33544 MACH NUMBER PARAMETER = 0.4151E-01RUN NAME - 0514slel.PRN
BEGIN NEWTON ITERATION
ITERATION NUMBER 1 MACH NO. PARAN. = 0.103675 ERROR TERM = -0.7129E-02ITERATION UMBER 2 MACH NO. PARAM. - 0.110804 ERROR TERM = 0.2053E-03ITERATION NUMBER 3 MACH NO. PARAN. - 0.110598 ERROR TERM = 0.1066E-06ITERATION NUMBER 4 MACH NO. PARAN. = 0.110598 ERROR TERM = -0.3074E-10
98

VREF - 85.29953401308
1- 7PRESSURE RATIO - -31.24322 MACH NUMBER PARAMETER = 0.4153E-01RIJN NAME - 0511s21.PRN
BEGIN NEWTON ITERATION
ITERATION NUMBER 1 MACH NO. PARAM. - 0.103968 ERROR TERM = -0.6846E-02ITERATION NUMBER 2 MACH NO. PARAM. - 0.?'0814 ERROR TERM - 0.1893E-03ITERATION NUMBER 3 MACH NO. PARAM. - 0.1-0625 ERROR TERM - 0.8621E-07ITERATION NUMBER 4 MACH NO. PARAM. = 0.110625 ERROR TERM = -0.2489E-10
VREF 85.07919440271
1= 8PRESSURE RATIO - -31.24322 MACH NUMBER PARAMETER 0.4153E-01RUN NAME = 0511s2al.PRN
BEGIN NEWTON ITERATION
ITERATION NUMBER 1 MACH NO. PARAM. - 0.103968 ERROR TERM = -0.6846E-02ITERATION NUMBER 2 MACH NO. PARAN. - 0.110814 ERROR TERM - 0.1893E-03ITERATION NUMBER 3 MACH NO. PARAM. - 0.110625 ERROR TERM = 0.8621E-07ITERATION NUMBER 4 MACH NO. PARAM. - 0.110625 ERROR TERM = -0.2489E-10
VREF - 85.07919440271
I - 9PRESSURE RATIO - -31.24322 MACH NUMBER PARAMETER 0.4153E-01RUN NAME - 0511s2bI.PRN
BEGIN NEWTON ITERATION
ITERATION NUMBER 1 MACH NO. PARAM. = 0.103772 ERROR TERM = -0.7053E-02ITERATION NUMBER 2 MACH NO. PARAM. - 0.110826 ERROR TERM - 0.2009E-03ITERATION NUMBER 3 MACH NO. PARAM. - 0.110625 ERROR TERM = 0.1007E-06ITERATION NUMBER 4 MACH NO. PARAM. - 0.110625 ERROR TERM - -0.2908E-10
VREF - 85.23966280667
I = 10PRESSURE RATIO = -30.93546 MACH NUMBER PARAMETER = 0.4155E-01RUN NAME - 0512s31.PRN
BEGIN NEWTON ITERATION
ITERATION NUMBER 1 MACH NO. PARAM. - 0.104066 ERROR TERM = -0.6770E-02
S~99

ITERATION NUMBER 2 MACH NO. PARAM. - 0.110836 ERROR TERM = 0.1850E-03ITERATION NUMBER 3 MACH NO. PARAM. - 0.110651 ERROR TERM = 0.8108E-07ITERATION NUMBER 4 MACH NO. PARAM. - 0.110651 ERROR TERM = -0.2344E-10
VREF - 85.01903047416
I = 11PRESSURE RATIO - -30.95720 MACH NUMBER PARAMETER 0.4155E-01RUN NAME - 0512s41.PRN
BEGIN NEWTON ITERATION
ITERATION NUMBER 1 MACH NO. PARAM. - 0.103968 ERROR TERM = -0.6874E-02ITERATION NUMBER 2 MACH NO. PARAM. - 0.110842 ERROR TERM = 0.1908E-03ITERATION NUMBER 3 MACH NO. PARAM. - 0.110651 ERROR TERM = 0.8790E-07ITERATION NUMBER 4 MACH NO. PARAM. - 0.110651 ERROR TERM = -0.2540E-10
VREF - 85.09939011711
I - 12PRESSURE RATIO = -31.22131 MACH NUMBER PARAMETER 0.4153E-01RUN NAME - 0512s51.PRN
BEGIN NEWTON ITERATION
ITERATION NUMBER 1 MACH NO. PARAM. - 0.103968 ERROR TERM - -0.6846E-02ITERATION NUMBER 2 MACH NO. PARAN. - 0.110814 ERROR TERM - 0.1893E-03ITERATION NUMBER 3 MACH NO. PARAN. - 0.110625 ERROR TERM - 0.8621E-07ITERATION NUMBER 4 MACH NO. PARAN. - 0.110625 ERROR TERM - -0.2489E-10
VREF - 85.07919440271
I - 13PRESSURE RATIO - -31.22131 MACH NUMBER PARAMETER 0.4153E-01RUN NAME - 0512s61.PRN
BEGIN NEWTON ITERATION
ITERATION NUMBER 1 MACH NO. PARAN. - 0.103968 ERROR TERM = -0.6846E-02ITERATION NUMBER 2 MACH NO. PARAM. - 0.110814 ERROR TERM = 0.18938-03ITERATION NUMBER 3 MACH NO. PARAM. = 0.110625 ERROR TERM - 0.8621E-07ITERATION NUMBER 4 MACH NO. PARAM. - 0.110625 ERROR TERM - -0.2489E-10
VREF - 85.07919440271
I - 14PRESSURE RATIO = -31.13385 MACH NUMBER PARAMETER = 0.4153E-01RUN NAME - 0507s71.PRN
100

BEGIN NEWTON ITERATION
ITERATION NUMBER 1 MACH NO. PARAM. - 0.103772 ERROR TERM = -0.7053E-02ITERATION NUMBER 2 MACH NO. PARAM. - 0.110826 ERROR TERM - 0.2009E-03ITERATION NUMBER 3 MACH NO. PARAM. - 0.110625 ERROR TERM = 0.1007E-06ITERATION NUMBER 4 MACH NO. PARAM. - 0.110625 ERROR TERM = -0.2908E-10
VREF - 85.23966280667
I - 15PRESSURE RATIO - -30.89209 MACH NUMBER PARAMETER = 0.4155E-01RUN NAME - 0508s81.PRN
BEGIN NEWTON ITERATION
ITERATION NUMBER 1 MACH NO. PARAM. = 0.103675 ERROR TERM - -0.7184E-02ITERATION NUMBER 2 MACH NO. PARAM. - 0.110859 ERROR TERM = 0.2084E-03ITERATION NUMBER 3 MACH NO. PARAM. - 0.110651 ERROR TERM = 0.1105E-06ITERATION NUMBER 4 MACH NO. PARAM. = 0.110651 ERROR TERM = -0.3193E-10
VREF - 85.34004386482
I - 16PRESSURE RATIO - -30.89209 MACH NUMBER PARAMETER = 0.4155E-01RUN NAME " 0507s91.PRN
BEGIN NEWTON ITERATION
ITERATION NUMBER 1 MACH NO. PARAM. = 0.103675 ERROR TERM = -0.7184E-02ITERATION NUMBER 2 MACH NO. PARAM. - 0.110859 ERROR TERM - 0.2084E-03ITERATION NUMBER 3 MACH NO. PARAM. - 0.110651 ERROR TERM - 0.1105E-06ITERATION NUMBER 4 MACH NO. PARAM. - 0.110651 ERROR TERM - -0.3193E-10
'ZREF = 85.34004386482
I - 17PRESSURE RATIO - -30.89209 MACH NUMBER PARAMETER 0.4155E-01RUN NAME - 0507sa01.PRN
BEGIN NEWTON ITERATION
ITERATION NUMBER 1 MACH NO. PARAM. - 0.103675 ERROR TERM - -0.7184E-02ITERATION NUM4BER 2 MACH NO. PARJAH. = 0.110859 ERROR TERM = 0.2084E-03ITERATION NUMBER 3 MACH NO. PARAM. - 0.110651 ERROR TERM = 0.1105E-06ITERATION NUMBER 4 MACH NO. PARAK. - 0.110651 ERROR TERM = -0.3193E-10
VREF - 85.34004386482
I "18
101

PRESSURE RATIO - -30.89209 MACH NUMBER PARAMETER = 0.4155E-O1RUN NAME - 0507s111.PRN
BEGIN NEWTON ITERATION
ITERATION NUMBER I MACH NO. PARAM. - 0.103578 ERROR TERM = -0.7288E-02ITERATION NUMBER 2 MACH NO. PARAM. - 0.110865 ERROR TERM - 0.2145E-03ITERATION NUMBER 3 MACH NO. PARAM. - 0.110651 ERROR TERM = 0.118SE-06ITERATION NUMBER 4 MACH NO. PARAM. - 0.110651 ERROR TERM - -0.3432E-10
VREF - 85.42010151240
I - 19PRESSURE RATIO - -30.91383 MACH NUMBER PARAMETER = 0.4155E-01RUN NAME - 0507s121.PRN
BEGIN NEWTON ITERATION
ITERATION NUMBER 1 MACH NO. PARAH. - 0.103578 ERROR TERM = -0.7288E-02ITERATION NUMIBER 2 MACH NO. PARAM. - 0.110865 ERROR TERM - 0.2145E-03ITERATION NUMBER 3 MACH NO. PARAM. - 0.110651 ERROR TERM1 - 0.1188E-06ITERATION NUMBER 4 MACH NO. PARAH. - 0.110651 ERROR TERM = -0.3432E-10
VREF - 85.42010151240
I - 20PRESSURE RATIO - -30.91383 MACH NUMBER PARAMETER = 0.4155E-01RUN NAME - 0507s131.PRN
BEGIN NEWTON ITERATION
ITERATION NUMBER 1 MACH NO. PARAN. - 0.103578 ERROR TERM = -O.7288E-02ITERATION NUMBER 2 MACH NO. PARAM. - 0.110865 ERROR TERM - 0.2145E-03ITERATION NUMBER 3 MACH NO. PARAM. - 0.110651 ERROR TERM - 0.1188E-06ITERATION NUMBER 4 MACH NO. PARAM. - 0.110651 ERROR TERM = -0.3432E-10
VREF - 85.42010151240
I - 21PRESSURE RATIO - -31.51192 MACH NUMBER PARAMETER 0.4151E-01RUN NAME - 0508s141.PRN
BEGIN NEWTON ITERATION
ITERATION NUMBER 1 MACH NO. PARAN. - 0.103968 ERROR TERM = -0.6818E-02ITERATION NUMBER 2 MACH NO. PARAM. - 0.110786 ERROR TERM = 0.1878E-03ITERATION NUMBER 3 MACH NO. PARAN. - 0.110598 ERROR TERM = 0.8454E-07ITERATION NUMBER 4 MACH NO. PARAM. - 0.110598 ERROR TERM = -0.2439E-10
102

VREF - 85.05899450070
I - 22PRESSURE RATIO - -31.48982 MACH NUMBER PARAMETER - 0.4151E-01RUN NAME " 0508s151.PRN
BEGIN NEWTON ITERATION
ITERATION NUMBER 1 MACH NO. PARAN. - 0.103870 ERROR TERN - -0.6922E-02ITERATION NUMBER 2 MACH NO. PARAN. - 0.110792 ERROR TERM - 0.1936E-03ITERATION NUMBER 3 MACH NO. PARAM. - 0.110598 ERROR TERM = 0.9153E-07ITERATION NUMBER 4 MACH NO. PARAM. - 0.110598 ERROR TERM = -0.2640E-10
VREF - 85.13925466046
I " 23PRESSURE RATIO - -31.35743 MACH NUMBER PARAMETER = 0.4151E-01RUN NAME - 0514s161,PRN
BEGIN NEWTON ITERATION
ITERATION NUMBER 1 MACH NO. PARAN. - 0.103870 ERROR TERM = -0.6922E-02ITERATION NUMBER 2 MACH NO. PARAM. - 0.110792 ERROR TERM = 0.1936E-03ITERATION NUMBER 3 MACH NO. PARAN. = 0.110598 ERROR TERM - 0.9153E-07ITERATION NUMBER 4 MACH NO. PARAM. - 0.110598 ERROR TERM = -0.26403-10
VREF - 85.13925466046
I - 24PRESSURE RATIO - -31.35743 MACH NUMBER PARAMETER = 0.4151E-01RUN NAME - 0514s171.PRN
BEGIN NEWTON ITERATION
ITERATION NUMBER 1 MACH NO. PARAM. - 0.103772 ERROR TERM = -0.7025E-02ITERATION NUMBER 2 MACH NO. PARAM. - 0. 110793 ERROR TERM - 0.19941-03ITERATION NUMBER 3 MACH NO. PARAM. - 0. 110598 ERROR TERM - 0.9887E-07ITERATION NUMBER 4 MACH NO. PARAM. - 0.110598 ERROR TERM - -0.2852E-10
VREF - 85.21942480550
I - 25PRESSURE RATIO - -31.35743 MACH NUMBER PARAMETER = 0.4151E-01RUN NAME - 0514s181.PRN
BEGIN NEWTON ITERATION
ITERATION NUMBER 1 MACH NO. PARAM. , 0.103772 ERROR TERM = -0.7025E-02
103
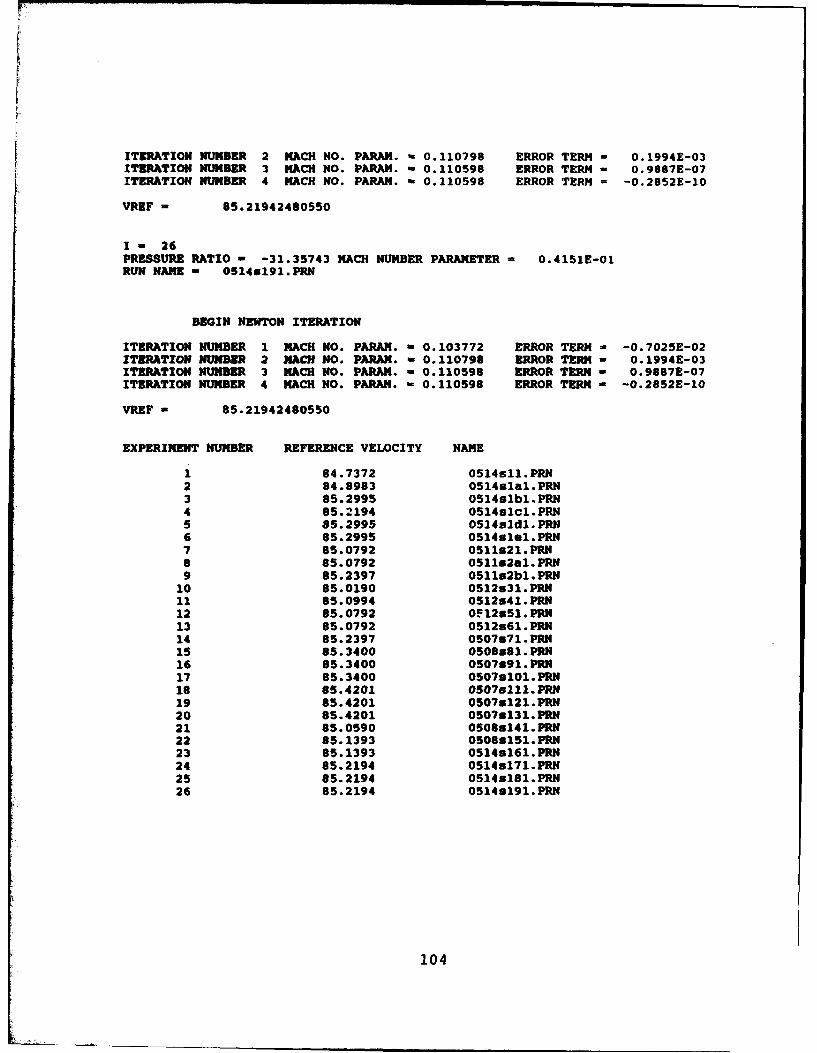
ITERATION NUMBER 2 MACH NO. PARAM. - 0.110798 ERROR TERM = 0.1994E-03ITERATION NUMBER 3 MACH NO. PARAM. - 0.110598 ERROR TERM - 0.9887E-07ITERATION NUMBER 4 MACH NO. PARAN. - 0.110598 ERROR TERM = -0.2852E-10
VREF - 85.21942480550
I - 26PRESSURE RATIO - -31.35743 MACH NUMBER PARAMETER = 0.4151E-01RUN NAME - 0514g191.PRN
BEGIN NEWTON ITERATION
ITERATION NUMBER I MACH NO. PARAM. - 0.103772 ERROR TERM = -0.7025E-02ITERATION NUMBER 2 MACH NO. PARAN. - 0.110798 ERROR TERM - 0.1994E-03ITERATION NUMBER 3 MACH NO. PARAN. - 0.110598 ERROR TERM - 0.9887E-07ITERATION NUMBER 4 MACH NO. PARAM. - 0.110598 ERROR TERM - -0.2852E-10
VREF - 85.21942480550
EXPERIMENT NUMBER REFERENCE VELOCITY NAME
1 84.7372 0514s11.PRN2 84.8983 0514slal.PRN3 85.2995 0514slbl.PRN4 85.2194 0514slcl.PRN5 85.2995 0514sldI.PRN6 85.2995 0514slel.PRN7 85.0792 0511s21.PRN8 85.0792 0511s2al.PRN9 85.2397 0511s2bl.PRN
10 85.0190 0512s31.PRN11 85.0994 0512s41.PRN12 85.0792 0•t2s51.PRN13 85.0792 0512s61.PRN14 85.2397 0507s71.PRN15 85.3400 0508s81.PRN16 85.3400 0507991.PRN17 85.3400 0507sl01.PRN18 85.4201 0507e111.PRN19 85.4201 05079121.PRN20 85.4201 0507u131.PRN21 85.0590 0508s141.PRN22 85.1393 0508s151.PRN23 85.1393 0514s161.PRN24 85.2194 0514s171.PRN25 85.2194 0514s181.PRN26 85.2194 0514s191.PRN
104

F. SURVEYS FROM STATION I THROUGH 19
d. c;d C,:9rn6 09o9
C4 d86ca''q"4 .o
"lii m .0wPNf wI~~w II111IL11111
IdIIII0I'I 11111 I1;;II i~~~~~~~~q 114hh lie~~ dccdooddcoic
4444 6 did vdi, d d d d t4 do cd6d~ 4 4de4 6j ' 6 W4 4 . mi4 c
i I,d d* dd555 d~ - -dd~~~ddd6
Zel .
W! M in in in aw!. w!d w!. in v! r!
105

_Cý .c o c C
0c
c 17 . M l- SRO -O -. M
0 ,N(C"C Ve - ep 0 CDv M(v
0~~~V -W (fN rvW(
UN ~3~got
~0h NN .- V, -tý .4D~
LL 0M. -C4dif
A I on -_ iI W I.~
I.. Z-1 m fifmivn. im aI 4:4: F .!5!I
m v n , . :: 2 r
0 ~ ~ ~ 4 d w3s 33 d doooaa0000000000 000000000
0000 d d oOOC OOO I
IDI
a ý V in w w 0 C>0 .mtv fnv in m 4D .. tvN@ O-.(
0~l 4, W, w ID M- U 4 m~0 .
106

...... b..... @ 9 .-- e .,.. w e
4 cm
C4 tiiv 40 cocd dddddoooooooooo
d 4COP 0 E Ifdid0dd 0- E d9 Pi@0- dC'9 )U)P.l
BMW I'MM BRAC)~C
107 ,

A A a C 0 E
2 PftIwl Sum" a g ~ S leln1345 Xpn) Y~tn) 1*W VNmE uitvr~67 2 -. 862 0.62132? 0.433780 009=01a 1.94 .4.82 0.618 a313306 0.9110679 1.67 .4.82 0.137061 a310049 01666610 Ill 4.4.2 0.2 1661 01430111 0.247W6It 1.76 .4.w2 VIM?61 @66762l 01604212 1.0 4.02 a6357196O 91088 0.98071W13 1.62 .4.82 0.63666 @,3261? 0.666060
14 1.14 .4.02 @53W0 OL41140 0.67171Is I.6 4.4.2 @53lW 12,0563100 0.6666Is 1.44 4642 @64662 @4666 0@113116I? 1.37 .4.2 @5W474685@13M 0.7MM6Is 1.31 .4.82 U43010 a543101 0.71022110 1.35 4.62 @961I OLIN=0 0.78421620 1.10l -4.12 0.651101 0.06272 0792110221 1.12 4.62 a@~6616 0.67324 0.6666622 1.06 .4.82 0.960M7 @90004 0601691423 1 .4.02 @6n216 a406716 &==I3624 mew7 4.62 @677164 a611161 @6617425 @671 4.4.2 0411113 @413134 @66667as 0112 4.42 @616661 @04762 0.6222327 @71 4.6 @02361 @6862301666326 0.6 4.62 @6624 0.93771 @0.9004626 @621 .4.82 @66476 @66127 @60666330 @63 4.82 0@600510 @661621 @62141631 to 4.42 @661621I GLOOM7 &MING632 @437 4M6 06114010 0.611101 @6666233 0@371 4.82 @668674 @676676 @6760634 0.312 4.42 GLOO6 OL666 O @660 @6673035 0.35 4.02 0.700021 4087091 MOM1so 0@#$ 4.62 0@710630 @6477012 @0.612467 @126 4.62 @76332 @66619 @06242
39 @06282 4.62 @636116 su @6 06 163610339 4601 4.62 @70666 Or023 0.00614440 40621 4.62 @7167 66666 @666641 40121 4.62 @72661 @70667 1.01172942 417 -4.62 a716021 @70166N 1.01056643 426 4.62 @7381190.@7010010 1.01641044 4313 4.62 @71846 0.710644 1.031600146 4371 4.62 @L71147 0@697140 1.024029
46 4437 4.62 0@798110 @06749 1.03400447 46. 4.62 @76671 706621 1.0"m3646 4.102 4.62 GN71 0.106749 1.0467140 4615 4.62 @7646 @63666 1.061066so 467 4.62 @VM011 @67666 1.042261 471 4.62 0803053 @662363S 1.036162 4.612 .4.62 &9080 4 @4164606 1.0MM63 4676 4.02 0.8136 04 @7324 @1661?
4 4637 4.4.2 &817121 @.602M3 0160146SO .1 4.62 @62161 @4266 @UPONa .1.06 4.62 @6263 @310 @U08883s7 4.1. .4.02 @.410B GOWN16 @6636SO -1.10 4.62 @.346106 0.171142 26044W0 .1.26 .4.62 @666168 @S48M6 @70N"60 -1.31 4.62 @.57966 @22162 @616666f -. 3 .4.62 055 @ am @ U66 @66162l
62 -1.44 4.62 @.604748 0421266 @64610903 .1.5 .4.62 @1905117 @46304 @L722166 .1.66 4.62 @67412 0.40M6 WSW14
6 41.62 .4.82 @6617I @6410 @112651so 4.1.6 4.62 @66132S2 0@620610 @V6161G? .4.71 4.62 @.067W6 @4666 @.600261as 1.011 4.62 0.6158496 0.61161 0.61446666 4.006 4.62 all76 @6570610 @63M0170 .1.94 .4.82 0@1190068 0.900515 0.63930671 -2 .4.82 0.606444 06900236 0.0546367273
108

~E~9 99ot 99::;;; c,4~;.- 0 a 9M Mev CM
vp
cm
U. 0 11 H asildddd~d ~ drjdd q~0cr----Coco
W 111, 0 ! 10V.n omm9I : CC r
N N . C 44. W N N C .9 ARM C N9
ON UP IIH ;;>aoodooooooea~o o adoo do 5 oOR
dddddddddC ";9d' dC* dC
IVico . .! 99 . c
77- '0~999900c
109

C4 we-qb4 V
M!f111H'o 'HIM Pi
w ~ II.40 i mif -i -I --, -
o ~ ~ d!II -: 0sa 1jul11 .
o doco odeoccoddPdd~000 ddddd c idc0000
r odC.i4I~ ~~.dP'7 7 .7cq 4 di
110

POW , M9 C4 t - C4E. .0
Rpm P-- H! a#ma
. . . . . . -I CI F O0 1 ..-- 0 -
81 di X3 C-4 CN1. )C
S9 ddeeoooooeo -- ----- caaI ~ 0 vT o OCAOOAO w
C1 p ft
Be- .- MDR
odd ~f doo od d oo
H ri% q))) U)U)U II)))))UUUUU
U~ ~ ~ ~ ~~~P,3fli V~.NNN g0 N N NNNNNN86 !.g i'dd ct .
fi if 1'.)U 13( ý ." I:11%R1
4ddd-- d'!dddddd 999dd od00000
C40)40NU@-----U('4((Up4CCU ( Ci C5dc 06
11m

GOGUOP-004.0V.. 'A0 M WOW. 0 0
94
cm .4 11 C4
~~11,,*4 g~ll I ) P.
- ~~~ 40h~ a-
w 4,1 ic4 0)h).4 Oad- 6 a6 .
-o 51.9. "1 r E f.a#
o - a In.
o ~@~O~-!ir-f~-- ~guu i.n Z3 "C~dd~c~ddci d0ddddddd
r..t~sit. 4044004('440040044004 . 40' 004404400400440
.6Cv
CO~ !i 0 to 0000 00
112

d a odo d aoo cio a0 coo ... C ?C
-; a m00 int- n M i A *-JM,1M _g -mn ~ m
~4.- v ai- 6' v.ifl4 vD'~~ ~ei',* m w
Ael-m- 90 WIV
A i W,Id ieq id ; -.-- -- i t- - 0 0 - -i ;C ~
1*. lot. ... N0 .
- -- - -- - w via i ,a w d 46
w iffl p" H~ v Sim MT CC4 10
I~~~~ -.- A -C ;oooo~x"eooo o 00 0 0 0 00 00000zo vi
d 'i - SW 1. I', U!0 W!G 00. O I n
goC, O N .4 go cm C4- 0004 00 0 C-4o o oo o 0000 . .
00 IM in wn 01
¶ ¶~v enW~
'I 113
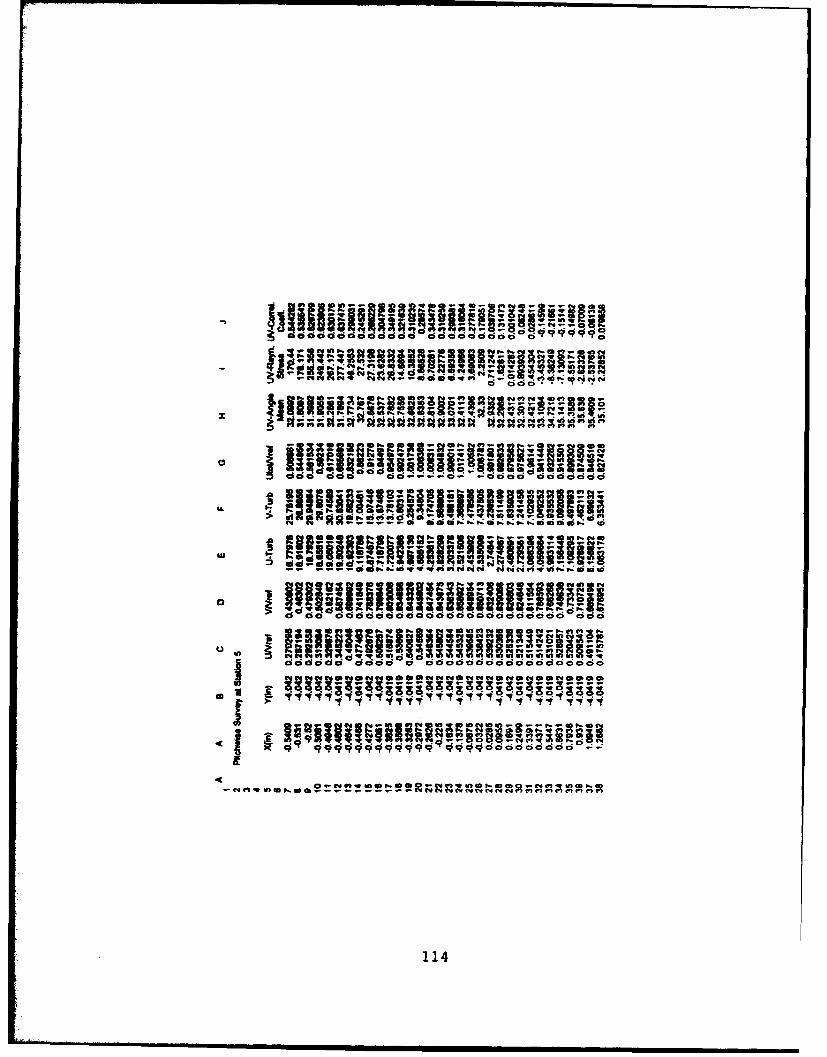
RI!UiftM~ a I R UH5~- -..I ARE
-j do - -
~~~~~~~f ddo d d e e ce edaa Oci 9
?
10@
coo a - o- -cioca ecocddcc
*n 0i~a: 23 : a; cia;P, V: R l
.v vi " tj" 4Civ
d~ d
ft g-. -I&: -i!-11
COO cci oc d c;ci ci c oo0
-r~~vb.W~ 3--o0- " Vmo. O ;; o'C'm con, A A
114 IU1 U ) )UU

000 0 000a,6660cccddo6c~c,9 9 9 9 9
9."
... qEd~4..A 4,04 1..
0s
0~5 a j1"CH~ 3U31 i lqcocat cc cacao ccc e eocOR
U. ;-R l
0 -0 0 m e -pd s . d o ed d c sa o q V e n @d6 6 6
ew qq~
vi 402en- aeee d40 .6P dI . 6 wV-P !ýrýF;W0O~~aa aoaac cda~C4c 'o
a a X--! --
6eP m m. m4tIt t66 ~ ~ ~ P P. P..P.P.P.P.Pccddici4: p...
12-1 C-11 0"- 12. 101 "121 10- 0
wm.-mmWA 4.0 en. "MEe- A ene A m.M A
115

!W8
~ ~ d c io o co *0IIdi".2d 6dd99b,dda d dddd-
ON Ogg* -
d_ X~ I IIi!. a MUM6dd ddoodocadadoododddd4 d
q~~qq qq I':;dd 1-W d~. d
CI -@oef' C4e ."9...on I-
116~
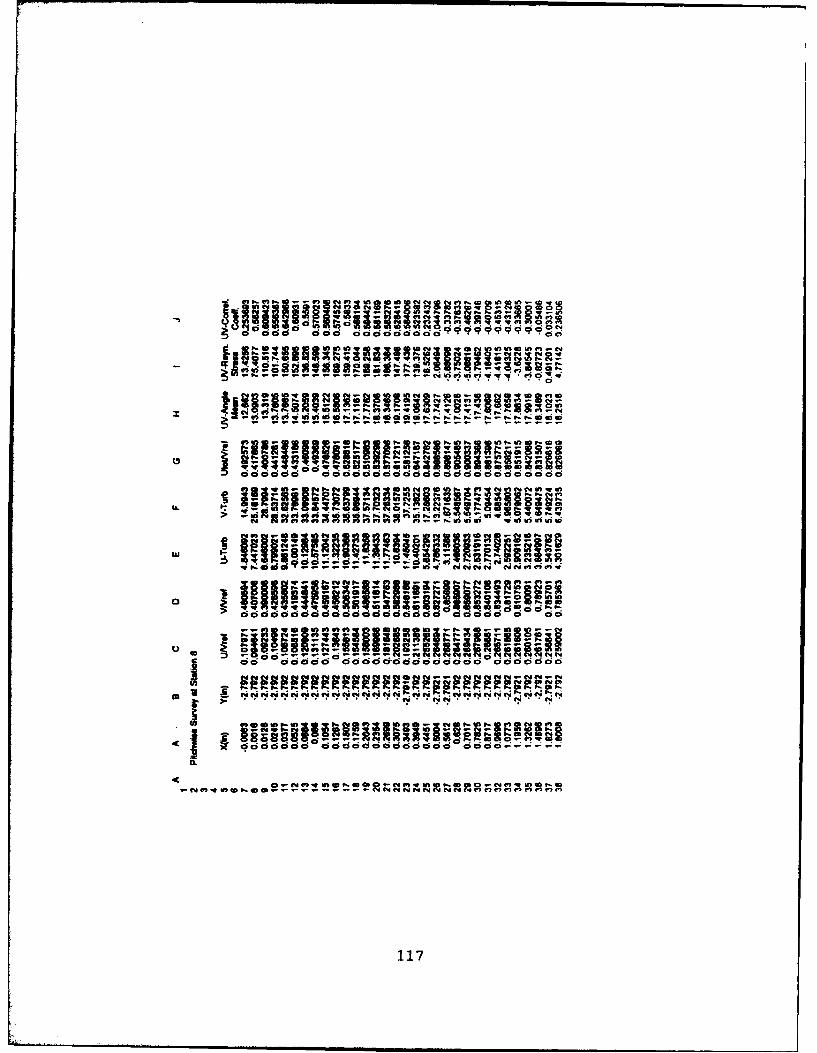
d d d~aa ac oacid d 9 9 9 9 9 9 9 0 0
i i 'o2
*N~)U)UNOP~000 ('d~4Din0I ~ 0 0 5 0NNp~l~~C
0-0005 S~~.UII p- ~ In~)0?0
d dds dd3(.10N
o0,mmN~0C . t'I NC1NNUWmof 1:1
~ d
4> dd~doc6dadd~d;" acao a d oco
- ------- - N C4 C t4n qMMtnM
117- I

Sooooaddodd rddddood9 9
S; i9...
fis;- -W 9. V W f
Ilia, C4 - CIO pa1m..HIC gill 8z ~ ~~~~ otoe4 V5 I 05.ýMv I`.@0~C E4C mgmEl4":. g. w Z rl?~
in~lel~--IdinweM n Uln.. 4 i~m-p-e 1'd dQ l e
A 3;35U inInsl-n~eI 0 ldCdd~d -~d dd
us 3S oi 3345 i' d ".d~o o 4dP. 4 4 R 4 coc oeq W;C4o4,
0 11~I ~ li4md
fi IEddd d .d zd d d i e,4Pd,0dEd--mm4.w4.WM
ineee~ l4.UWW e We~nD..nin ;
ddddd dd dd ;mmi;;;;:;dq'Jcý d d d ":..3;3~~U~j~0 a- *nfgm lc 3 od
4 r iI#do 44 4-00dfd~d d dd d d:-:-
tv ~ 00 0 0 00t ý 7mA ý1 o
118
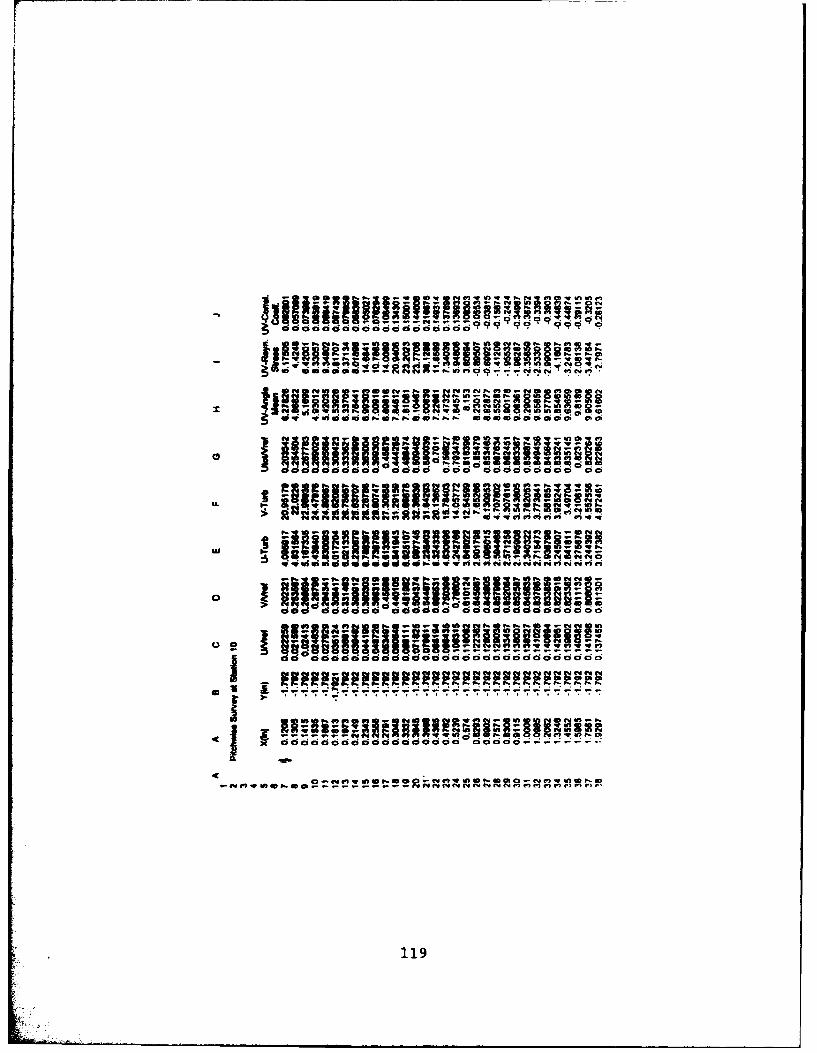
ddo dRedaa oe 1 1ý0
L.~~EtR!90m 0~ - #Few
00 oco.c 000a
OD W1~w ~ ~ w 46I -6" 61;4 . . ,4,PP
o~ "O 1110 a R.iii~iiii1111119,I i
A~I -~. C jC~ C4-I'
119a

~dddýýddddd: d~dd~d d6ddddd~o""
I~ I --- -
go 1 1 6
7 T - T'7 - $17
120

;IU3 ~ ~ dd d3~; ;m 3ES
Z;~ dNpaORial
00 11211 aleulo.
HH2011fiid'dll ddddidddi 4.4c
11111111111f i!ihIIIi I ii 111111ddd I I.-diidliidlidd
udhili11IHiII I'
j ddd dd.S a o ddddddo~dod
12

Ad 9 . ......
11! 449AA AA !4
IL I 111111 11 1 1~~~~~ dW' AN""~ ili3weddd Hddde~em ddd
ddddd§15d5§18d Id6ddd ddJ*S6
dd~dddd d ! dd d dcodod:-
122

cu~~u-~qI4 X dI u lz. 11 as I fi
01
met Il;- un d 2I -IIIoudddddddddadd ddddoodo
~ddc d;;2ddd~dddddddddd dc
cm~~. Anmm4
~;123

99999999v9 O9O9699 0
coo4D -~m~wm wo
:,111P 13 9%~ 0o~99900.~ : - t~ ~ r4 i (4I) 4
0~~-t i kii L-Ik IIliaI3U aOIU
000 000 d ooooaooaa6d ooo a cood0
c$ dV g~ 0 00 6 _d00 9dgo-Urn;-ruu;3m dx3N'~ Aj3do-- M oddddccd
ID~~m ddd dd 6 doo od.d
y~ ~ M
C4ovC- C5jI I IAIfnI
3-3l~U~p-0 wrn0w124o-

00000cod00000 0 co C oO0aooooaoa
o o,
10 110 c 1100001.13101111C:0 0
do d~~o.00000 00
Mi dd2dd 60d!
4C
125

00000000 0000000 0C00000000000 occod oooooeo0o
0!@0@a0; a00aoaOod o 60 odooeoo d 00000000000000
0o 0 dI;I0 9S "0oo00000 000 0ooo ooo0oo~oo~oo d o~oooooo0oooooooooo
I
126

REFERENCES
I. Hobson, G. V., and Shreeve, R. P., "Inlet Turbulence Distortion and Viscous FlowDevelopment in a Controlled-Diffusion Compressor Cascade at Very High Incidence",AIAA paper 91-2004 presented at the 27th Joint Propulsion Conference, Sacramento,California June 24-26 1991.
2. Classick, M. A., "Off-Design Loss Measurements in a Compressor Cascade", Master'sThesis, Naval Postgraduate School, Monterey, California, September 1989.
3. Murray, K. D., "Automation and Extension of LDV Measurements of Off-Design Flowin a Subsonic Cascade Wind Tunnel", Engineer's Thesis, Naval Postgraduate School,Monterey, California, June 1989.
4. Wakefield, B. E., "Hotwire Measurements of the Turbulent Flow into a Cascade ofControlled-Diffusion Compressor Blades", Master's Thesis, Naval PostgraduateSchool, Monterey, California, December 1993.
5. Elazar, Y., "A Mapping of the Viscous Flow Behavior in a Controlled DiffusionCompressor Cascade Using Laser Doppler Velocimetry and Preliminary Evaluation ofCodes for the Prediction of Stall", Doctoral Thesis, Naval Postgraduate School,Monterey, California, March 1988.
6. Dreon, J. W., "Controlled Diffusion Compressor Blade Wake Measurements",Master's Thesis, Naval Postgraduate School, Monterey, California, September 1986.
7. Armstrong, J. H., "Near-Stall Loss Measurements in a CD Compressor Cascade WithExploratory Leading Edge Flow Control", Master's Thesis, Naval PostgraduateSchool, Monterey, California, June 1990.
127

INITIAL DISTRIBUTION LIST
1. Defense Technical Information Center 2Cameron StationAlexandria, Virginia 22304-6145
2. Library, Code 52 2Naval Postgraduate SchoolMonterey, California 93943-5000
3. Department Chairman, AADepartment of AeronauticsNaval Postgraduate SchoolMonterey, California 93943
4. Garth V. Hobson, Turbopropulsion Laboratory, Code AA/Hg 7Department of AeronauticsNaval Postgraduate SchoolMonterey, California 93943
5. Naval Air Systems CommandAIR-536T (Attn: Mr. Mario Duffles)Washington, District of Columbia 20361-5360
6. Naval Air Warfare CenterAircraft Division (Trenton)PE-31 (Attn: S. Clouser)250 Phillips Blvd.Princeton CrossroadsTrenton, New Jersey 08628-0176
7. N.L. SangerNASA Lewis Research CenterM/S 5-11, 21000 Brookpark RoadCleveland, Ohio 44135
128

8. Lt. Humberto Javier Ganaim Rickel 2Venezuelan NavyAcquisition Office880 NW 15th St.Miami, Florida 33172
129