control strategy tool (cost) project future year … strategy tool (cost) “project future year...
TRANSCRIPT

Control Strategy Tool (CoST) “Project Future Year Inventory” Development Document
Work Assignment: 1-03 Contract No: EP-D-12-044 OMB Clearance No: 2030-0005 Prepared for: Alison Eyth U.S. Environmental Protection Agency C439-02 Research Triangle Park, NC 27711
Prepared by: Darin Del Vecchio Institute for the Environment The University of North Carolina at Chapel Hill 137 E. Franklin St., CB 6116 Chapel Hill, NC 27599-6116 Date due: April 8, 2013

EMAQ LOE (EPA Contract EP-D-07-102) CoST PFYI Development Document
UNC-EMAQ(1-03)-008.v1 April 8, 2013 ii
Contents
Contents ......................................................................................................................................... ii
Tables ............................................................................................................................................ iii
Figures ........................................................................................................................................... iv
Acronyms ....................................................................................................................................... v
1 Introduction............................................................................................................................ 1
1.1 Background ..................................................................................................................... 1
1.2 Purpose and Intended Audience for this Document ....................................................... 1
2 Concepts General to the PFYI Control Strategy ................................................................ 2
2.1 Introduction to the PFYI Control Strategy...................................................................... 2
2.2 Inputs to the PFYI Control Strategy ............................................................................... 4 2.2.1 Summary Information ........................................................................................ 4
2.2.2 Inventories .......................................................................................................... 4 2.2.3 Control Programs ............................................................................................... 4 2.2.4 Input Constraints ................................................................................................ 5
2.3 Strategy Outputs.............................................................................................................. 5 2.3.1 Strategy Detailed Result ..................................................................................... 6 2.3.2 Strategy Messages ............................................................................................ 17
2.3.3 Controlled Emissions Inventory ....................................................................... 18
2.4 Costing Control Measures............................................................................................. 19
3 Project Future Year Inventory Control Strategy ............................................................. 20
3.1 Project Future Year Inventory Background .................................................................. 20
3.2 Introduction to Control Programs ................................................................................. 21
3.3 PFYI Inputs and Outputs .............................................................................................. 34
3.4 PFYI Algorithm ............................................................................................................ 36
3.5 PFYI Strategy Example ................................................................................................ 41
4 Potential Future Updates .................................................................................................... 46
5 References ............................................................................................................................. 46

EMAQ LOE (EPA Contract EP-D-07-102) CoST PFYI Development Document
UNC-EMAQ(1-03)-008.v1 April 8, 2013 iii
Tables
Table 1. Columns in the Strategy Detailed Result ...........................................................................6
Table 2. Columns in the Strategy Messages Result .......................................................................17
Table 3. Control Packet Matching Hierarchy ................................................................................21
Table 4. Table Format for Plant Closure Packet Dataset Type......................................................24
Table 5. Table Format for Projection Packet Dataset Type ...........................................................25
Table 6. Table Format for Projection Packet Extended Dataset Type ...........................................26
Table 7. Column Mapping between New and Old Control Program Packet Formats ...................28
Table 8. Table Format for Control Packet Dataset Type ...............................................................28
Table 9. Table Format for Control Packet Extended Dataset Type ...............................................30
Table 10. Table Format for Control Program Allowable Packet ...................................................33
Table 11. Control Program Action Codes......................................................................................36
Table 12. Inventory Records ..........................................................................................................42
Table 13. Plant Closure Packet ......................................................................................................43
Table 14. Projection Packet (Extended Format) ............................................................................43
Table 15. Control Packet (Extended Format) ................................................................................43
Table 16a. Detailed Result Records (first part of table) ................................................................44
Table 16b. Detailed Result Records (continuation of Table 16a) ..................................................45

EMAQ LOE (EPA Contract EP-D-07-102) CoST PFYI Development Document
UNC-EMAQ(1-03)-008.v1 April 8, 2013 iv
Figures
Figure 1. Basic Steps for Running a PFYI Control Strategy ...........................................................3
Figure 2. The Process for Running Project Future Year Inventory Control Strategy....................40

EMAQ LOE (EPA Contract EP-D-07-102) CoST PFYI Development Document
UNC-EMAQ(1-03)-008.v1 April 8, 2013 v
Acronyms
CE ..............................Control Efficiency
CMAQ........................Community Multiscale Air Quality model
CMAS ........................Community Modeling and Analysis System
CoST ..........................Control Strategy Tool
CRF ............................Capital Recovery Factor
CSV ............................Comma-separated values
DBF ............................D-base Format
EC ..............................Elemental Carbon
EMF ...........................Emissions Modeling Framework
EPA ............................Environmental Protection Agency
ESRI ...........................Environmental Systems Research Institute
FGD............................Flue Gas Desulfurizer
FIPS............................Federal Information Processing Standards
GDP............................Gross Domestic Product
GIS .............................Geographic information system
HEID ..........................Health and Environmental Impacts Division
IE ................................Institute for the Environment (UNC)
LNB............................Low NOx Burner
NAICS........................North American Industry Classification System
NEI .............................National Emissions Inventory
NSCR .........................Non-Selective Catalytic Reduction
OC ..............................Organic Carbon
O&M ..........................Operating and Maintenance
ORL............................One record per line
PR ...............................Percent Reduction
RE ..............................Rule Effectiveness
RP ...............................Rule Penetration
SCC ............................Source Classification Code
SIC .............................Standard Industrial Classification
SNCR .........................Selective Non-Catalytic Reduction
SQL ............................Structured Query Language
SMOKE......................Sparse Matrix Operator Kernel Emissions modeling system
tpy ..............................Tons per year
UNC ...........................University of North Carolina

EMAQ LOE (EPA Contract EP-D-07-102) CoST PFYI Development Document
UNC-EMAQ(1-03)-008.v1 April 8, 2013 1
1 Introduction
1.1 Background
In the air quality modeling arena, emissions modeling is the process by which emissions
inventories and other related information are converted to hourly, gridded, chemically speciated
emissions estimates that are suitable for input to an air quality model such as the Community
Multiscale Air Quality (CMAQ) model. The Emissions Modeling Framework (EMF) is a
software system currently being used by EPA to solve many of the long-standing complexities of
emissions modeling [Houyoux, 2008]. The EMF supports the management and quality assurance
of emissions inventories and emissions modeling-related data, and also the running of the Sparse
Matrix Operator Kernel Emissions modeling system (SMOKE), which is used by EPA to prepare
emissions inputs for performing air quality modeling with CMAQ. It provides integrated quality
control processes to foster high quality of emissions results, data handling, organization of data,
tracking of emissions modeling efforts, and real-time accessibility of information. The EMF has
been developed under a multiyear contract between the U.S. EPA and the University of North
Carolina at Chapel Hill’s Institute for the Environment (UNC-IE).
One of the modules within the EMF system is the Control Strategy Tool (CoST) module. A
control strategy is a set of control programs applied to emissions inventory sources in a specified
geographic region (in addition to any controls that are already in place) to accomplish a
projection of inventories to a future year. Control programs are sets of control measures and
other adjustments (e.g., projection factors) that are used to estimate the effects of implementing a
regulation that is “on the books.” The control programs therefore are considered when
projecting a base-year emissions inventory to a future-year base emissions inventory.
The CoST module is used to estimate the emission reductions and costs associated with future-
year control scenarios, and then to generate emission inventories with the control scenarios
applied. Providing CoST as a tool integrated within the EMF facilitates a level of collaboration
between control strategy development and emissions inventory modeling that was not previously
possible. CoST supports analyses for projecting inventories to future years and data
transparency, and provides a wide array of options for developing other types of control
strategies. It automates the key steps for applying control programs (Plant Closures, Projections,
Controls, Caps, and Replacements) when running the control strategy analysis.
The result of a CoST control strategy run contains information that specifies the adjusted
inventory emissions and emissions reductions achieved for each combination of control program
and emission source. Control strategy results can be exported to comma-separated-values (CSV)
files, Google Earth-compatible (.kmz) files, or Shapefiles. The results can also be viewed in a
graphical table that supports sorting, filtering, and plotting. The Strategy Detailed Result tables
that are output from a strategy can also be merged with the original inventory to create controlled
emissions inventories that can be exported to files that can be input to SMOKE.
1.2 Purpose and Intended Audience for this Document
This document is a software development document that provides technical descriptions
regarding how CoST computes the “Project Future Year Inventory” (PFYI) type of control
strategy. Information is given on the input parameters to strategies, on how the computations of

EMAQ LOE (EPA Contract EP-D-07-102) CoST PFYI Development Document
UNC-EMAQ(1-03)-008.v1 April 8, 2013 2
the strategies are performed, and on the outputs from the strategies. This document is intended
for use by readers who are already familiar with emissions modeling and extensive control
strategy development. It is not intended as a user’s guide.
For additional information on other aspects of the EMF and CoST, please see the following
independent documents:
CoST User’s Guide
CoST Control Measures Database Document
These documents, and additional information about CoST, can be found at:
http://www.epa.gov/ttn/ecas/cost.htm. A glossary of terms is included as an appendix to this
document.
2 Concepts General to the PFYI Control Strategy
2.1 Introduction to the PFYI Control Strategy
A “Project Future Year Inventory” control strategy is a set of control programs that applies
control factors, growth factors, caps, and replacement to sources, as would be needed to project a
base-year inventory to a future-year inventory. CoST automates the key steps needed to prepare
control strategies.
The inputs to this type of control strategy consist of:
a set of parameters that control how the strategy is run,
one or more emissions inventory datasets,
filters that determine which sources from those datasets are to be included in the run; and
one or more control programs.
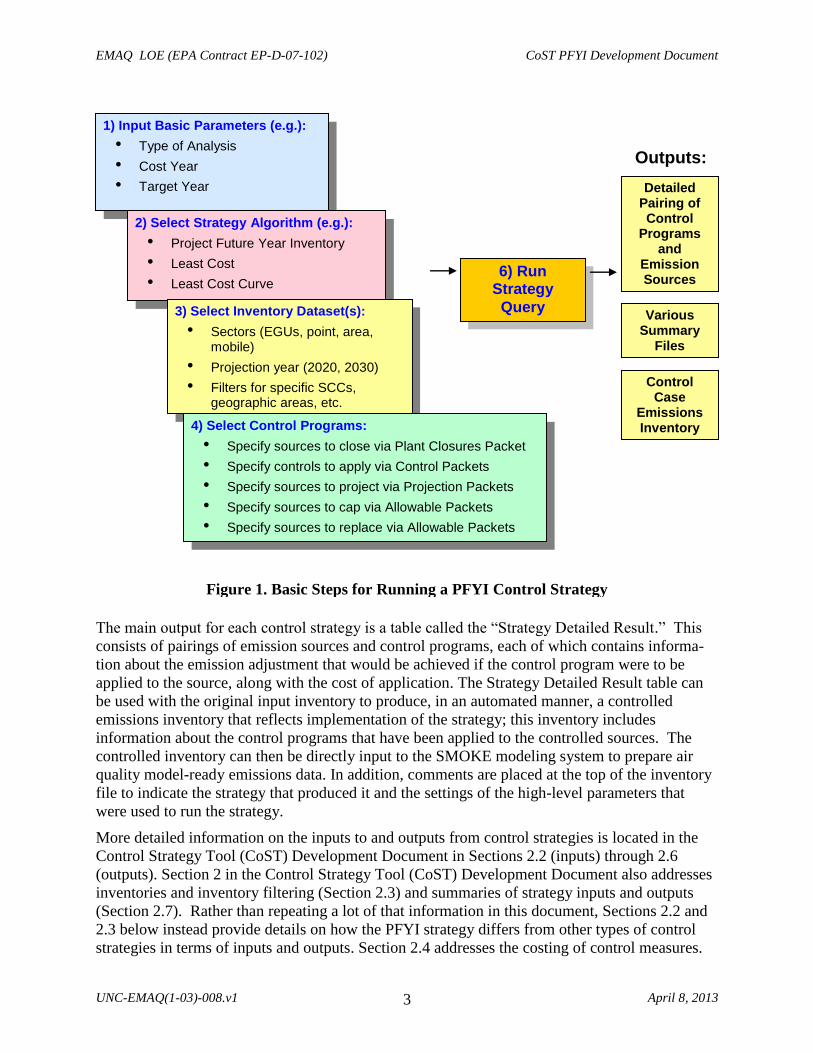
Figure 1 is a diagram of the basic steps for running a control strategy.
EMAQ LOE (EPA Contract EP-D-07-102) CoST PFYI Development Document
UNC-EMAQ(1-03)-008.v1 April 8, 2013 3
The main output for each control strategy is a table called the “Strategy Detailed Result.” This
consists of pairings of emission sources and control programs, each of which contains informa-
tion about the emission adjustment that would be achieved if the control program were to be
applied to the source, along with the cost of application. The Strategy Detailed Result table can
be used with the original input inventory to produce, in an automated manner, a controlled
emissions inventory that reflects implementation of the strategy; this inventory includes
information about the control programs that have been applied to the controlled sources. The
controlled inventory can then be directly input to the SMOKE modeling system to prepare air
quality model-ready emissions data. In addition, comments are placed at the top of the inventory
file to indicate the strategy that produced it and the settings of the high-level parameters that
were used to run the strategy.
More detailed information on the inputs to and outputs from control strategies is located in the
Control Strategy Tool (CoST) Development Document in Sections 2.2 (inputs) through 2.6
(outputs). Section 2 in the Control Strategy Tool (CoST) Development Document also addresses
inventories and inventory filtering (Section 2.3) and summaries of strategy inputs and outputs
(Section 2.7). Rather than repeating a lot of that information in this document, Sections 2.2 and
2.3 below instead provide details on how the PFYI strategy differs from other types of control
strategies in terms of inputs and outputs. Section 2.4 addresses the costing of control measures.
1) Input Basic Parameters (e.g.):
• Type of Analysis
• Cost Year
• Target Year
6) Run Strategy
Query
Outputs:
Detailed Pairing of Control
Programs and
Emission Sources
Various Summary
Files
Control Case
Emissions Inventory
2) Select Strategy Algorithm (e.g.):
• Project Future Year Inventory
• Least Cost
• Least Cost Curve
3) Select Inventory Dataset(s):
• Sectors (EGUs, point, area, mobile)
• Projection year (2020, 2030)
• Filters for specific SCCs, geographic areas, etc.
4) Select Control Programs:
• Specify sources to close via Plant Closures Packet
• Specify controls to apply via Control Packets
• Specify sources to project via Projection Packets
• Specify sources to cap via Allowable Packets
• Specify sources to replace via Allowable Packets
•
Figure 1. Basic Steps for Running a PFYI Control Strategy

EMAQ LOE (EPA Contract EP-D-07-102) CoST PFYI Development Document
UNC-EMAQ(1-03)-008.v1 April 8, 2013 4
2.2 Inputs to the PFYI Control Strategy
All types of control strategies have fields that can be specified by the user prior to running the
strategy. This section describes these how the fields are used differently in a PFYI strategy than
in other strategy types.
2.2.1 Summary Information
See the Control Strategy Tool (CoST) Development Document, Section 2.2, for detailed
information on the Summary Information fields. The following input fields are used in a
different manner than in other CoST strategy types:
Type of Analysis: The type of algorithm used to match the control program packet
records with sources. Must be specified as the “Project Future Year Inventory” strategy
type.
Target Year: The target year represents the future year to which you are projecting the
inventory. The target year is used when building the various cutoff dates (control
compliance and plant closure effective dates) when evaluating whether or not certain
control programs are applied to an inventory.
Target Pollutant: The target pollutant is not required for this strategy type and so is left
blank.
2.2.2 Inventories
See the Control Strategy Tool (CoST) Development Document, Section 2.2.2, for detailed
information on how inventories are handled by CoST. The inventories to process for this
strategy type includes not just the one-record-per-line (ORL) types but also the newer Flat File
2010 dataset format:
Inventories to Process: The emissions inventories for which the control strategy will be
run. The inventories must already have been loaded into the EMF and be one of the
following EMF dataset types: Flat File 2010 Point, Flat File 2010 Nonpoint, ORL point,
ORL nonpoint, ORL nonroad, or ORL onroad. Multiple inventories can be processed for
a strategy. Note that multiple versions of the inventories may be available, and the
appropriate version of each inventory must be selected prior to running a control strategy.
2.2.3 Control Programs
The PFYI strategy type supports four different types of control programs:
Programs to Include: A list of specific control programs to use for the run.
o Plant Closure: This control program targets sources to close
o Control: This control program specifies source control factors
o Projection: This control program specifies source projection adjustments
o Allowable: This control program specifies source cap or replacement emissions
EMAQ LOE (EPA Contract EP-D-07-102) CoST PFYI Development Document
UNC-EMAQ(1-03)-008.v1 April 8, 2013 5
As much as possible, the Control Program datasets are designed to be compatible with SMOKE.
The Projection, Control, and Allowable datasets are fully compatible with SMOKE. The Plant
Closure Packet and the new Projection, Control, and Allowable Extended dataset types, however,
are not compatible with SMOKE; these dataset types are CSV-based files that must contain
certain columns. The format of these dataset formats will defined in detail in Section 3.2.
2.2.4 Input Constraints
The following settings for the strategy are known as “constraints.” If the constraint values are
not satisfied for a particular combination of control measure and source, the measure under
consideration will not be applied to the source, and CoST will look for another measure that
satisfies all of the constraints.
Minimum Emissions Reduction (tons): Not used for this strategy type.
Minimum Control Efficiency (%): Not used for this strategy type.
Maximum Cost per Ton ($/ton): Not used for this strategy type.
Maximum Annualized Cost ($/yr): Not used for this strategy type.
Minimum Percent Reduction Difference for Replacement Control (%): Not used for this
strategy type
Minimum Percent Reduction Difference for Predicting Controls (%): This required
constraint determines whether a predicted control measure has a similar percent reduction
to the percent reduction specified in the Control Program Control Packet. The following
formula defines the calculation used during the constraint validation:
[ABS(control packet percent reduction - control measure percent reduction) / control packet
percent reduction] x 100
≥ Minimum Percent Reduction Difference for Predicting Controls (%)
where
control packet percent reduction = see percent_reduction column definition in Table 1 for a
detailed definition on how this is calculated
control measure percent reduction
= control efficiency (%) x (rule penetration (%) / 100) x (rule effectiveness (%) / 100)
2.3 Strategy Outputs
CoST automatically generates two main outputs after each successful strategy run for the PFYI
strategy type:
Strategy Detailed Result (one for each input inventory), discussed in Section 2.3.1
Strategy Messages (only one for all input inventories) , addressed in Section 2.3.2
Each of these outputs is created as an EMF Dataset. Also discussed in this section is the
controlled emissions inventory output (Section 2.3.3).

EMAQ LOE (EPA Contract EP-D-07-102) CoST PFYI Development Document
UNC-EMAQ(1-03)-008.v1 April 8, 2013 6
2.3.1 Strategy Detailed Result
The Strategy Detailed Result is the primary output from the control strategy. It is a table of
emission-source–control-program pairings, each of which contains information about the
emission adjustment achieved after a control program is applied to a source. The contents of this
table are described later in this section.
The columns in the Strategy Detailed Result table are described in Table 1. Although this table
format is discussed in detail in the CoST Development Document, the PFYI strategy’s use of the
table is different enough that a full description needs to be given here. An example of the PFYI
Detailed Result is discussed in detail in Sections 3.
Table 1. Columns in the Strategy Detailed Result
Column Description
SECTOR The source sector specified for the input inventory dataset.
CM_ABBREV For Plant Closure Packets, this column will be set to
“PLTCLOSURE”.
For Projection Packets, this column will be set to
“PROJECTION”.
For Control Packets, this column will be set to the abbreviation
of the control measure that was applied to the source, if it was
explicitly specified in the packet, or it could be the predicted
measure abbreviation as found in the CMDB. If no measure can
be found, then it will be set to “UNKNOWNMSR”.
For Allowable Packets, this column will be set to the predicted
abbreviation of the control measure that was applied to the
source. If no measure can be found, then it will be set
“UNKNOWNMSR”.
POLL The pollutant for the source, found in the inventory
SCC The SCC code for the source, found in the inventory
FIPS The state and county FIPS code for the source, found in the
inventory
PLANTID For point sources, the plant ID/facility ID for the source from
the inventory.
POINTID For point sources, the point ID/unit ID for the source from the
inventory.
STACKID For point sources, the stack ID/release point ID for the source
from the inventory.
SEGMENT For point sources, the segment/process ID for the source from
the inventory.

EMAQ LOE (EPA Contract EP-D-07-102) CoST PFYI Development Document
UNC-EMAQ(1-03)-008.v1 April 8, 2013 7
Column Description
ANNUAL_COST ($) The total annual cost (including both capital and operating and
maintenance) required to keep the measure on the source for a
year
Default Approach (used when there is no cost equation, or
inputs to cost equation are not available):
Annual Cost = Emission Reduction (tons) x Reference Yr Cost
Per Ton ($/tons in 2006 Dollars) x Cost Yr Chained GDP /
Reference Yr Chained GDP
Annual Cost = 11.88 (tons) x 147 ($/ton in 2000 Dollars) x 9817
/ 11415.3 = $1,501.85
Using Type 8 Cost Equation:
If Stack Flow Rate >= 5.0 cfm Then
Annual Cost = (Annualized Capital Cost + 0.04 x Capital Cost
+ O&M Cost)
Else
Annual Cost = Default Annualized Cost Per Ton Factor x
Emission Reduction (tons) x Cost Yr Chained GDP / Reference
Yr Chained GDP
Since Stack Flow Rate = 10,500 cfm, use first equation
Annual Cost = ($11,081 + 0.04 x $117,388 + $99,328) =
$115,105
Note that costs are adjusted to the strategy-defined “Cost Year”
dollars.
ANN_COST_PER_
TON ($/ton)
The annual cost (both capital and operating and maintenance) to
reduce one ton of the pollutant.
Ann_Cost_Per_Ton = Annual Cost ($) / Emis Reduction (tons)
Default Approach (used when there is no cost equation, or
inputs to cost equation are not available):
Ann_Cost_Per_Ton = 1,501.85 / 11.88 = $126.42/ton
Using Type 8 cost Equation:
Ann_Cost_Per_Ton = $115,105 / 11.88 = $9,689/ton
Note that costs are adjusted to the strategy-defined “Cost Year”
dollars.
EMAQ LOE (EPA Contract EP-D-07-102) CoST PFYI Development Document
UNC-EMAQ(1-03)-008.v1 April 8, 2013 8
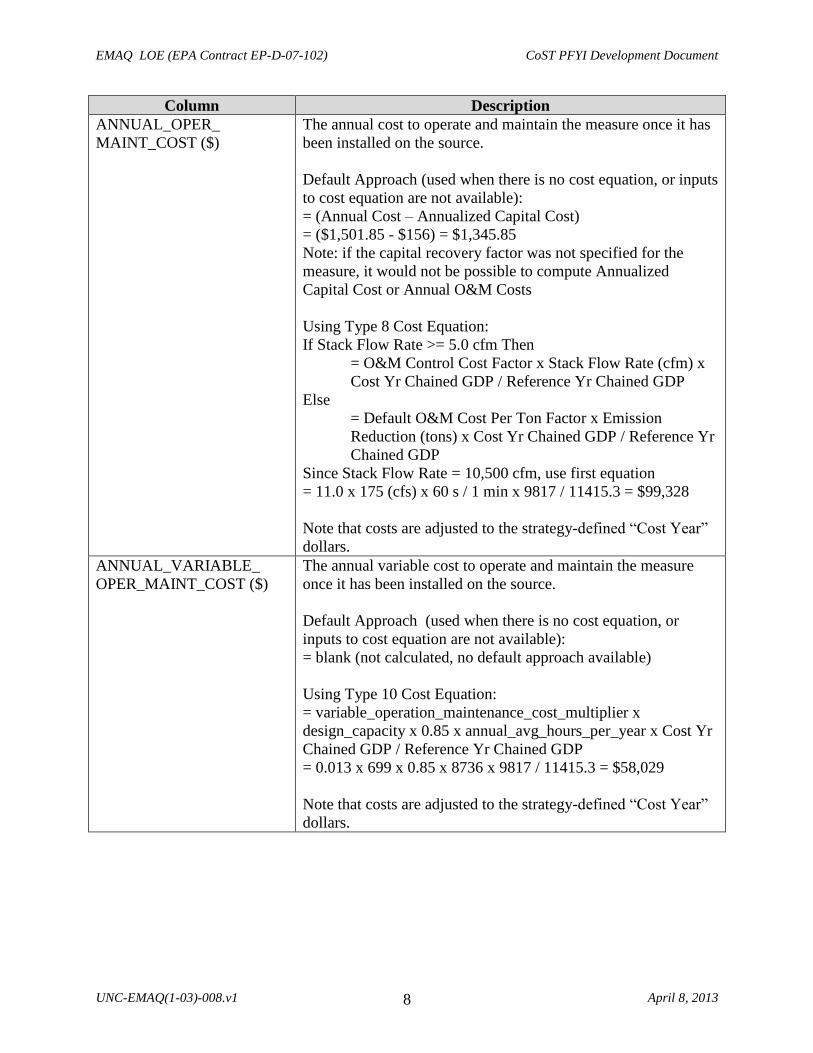
Column Description
ANNUAL_OPER_
MAINT_COST ($)
The annual cost to operate and maintain the measure once it has
been installed on the source.
Default Approach (used when there is no cost equation, or inputs
to cost equation are not available):
= (Annual Cost – Annualized Capital Cost)
= ($1,501.85 - $156) = $1,345.85
Note: if the capital recovery factor was not specified for the
measure, it would not be possible to compute Annualized
Capital Cost or Annual O&M Costs
Using Type 8 Cost Equation:
If Stack Flow Rate >= 5.0 cfm Then
= O&M Control Cost Factor x Stack Flow Rate (cfm) x
Cost Yr Chained GDP / Reference Yr Chained GDP
Else
= Default O&M Cost Per Ton Factor x Emission
Reduction (tons) x Cost Yr Chained GDP / Reference Yr
Chained GDP
Since Stack Flow Rate = 10,500 cfm, use first equation
= 11.0 x 175 (cfs) x 60 s / 1 min x 9817 / 11415.3 = $99,328
Note that costs are adjusted to the strategy-defined “Cost Year”
dollars.
ANNUAL_VARIABLE_
OPER_MAINT_COST ($)
The annual variable cost to operate and maintain the measure
once it has been installed on the source.
Default Approach (used when there is no cost equation, or
inputs to cost equation are not available):
= blank (not calculated, no default approach available)
Using Type 10 Cost Equation:
= variable_operation_maintenance_cost_multiplier x
design_capacity x 0.85 x annual_avg_hours_per_year x Cost Yr
Chained GDP / Reference Yr Chained GDP
= 0.013 x 699 x 0.85 x 8736 x 9817 / 11415.3 = $58,029
Note that costs are adjusted to the strategy-defined “Cost Year”
dollars.
EMAQ LOE (EPA Contract EP-D-07-102) CoST PFYI Development Document
UNC-EMAQ(1-03)-008.v1 April 8, 2013 9
Column Description
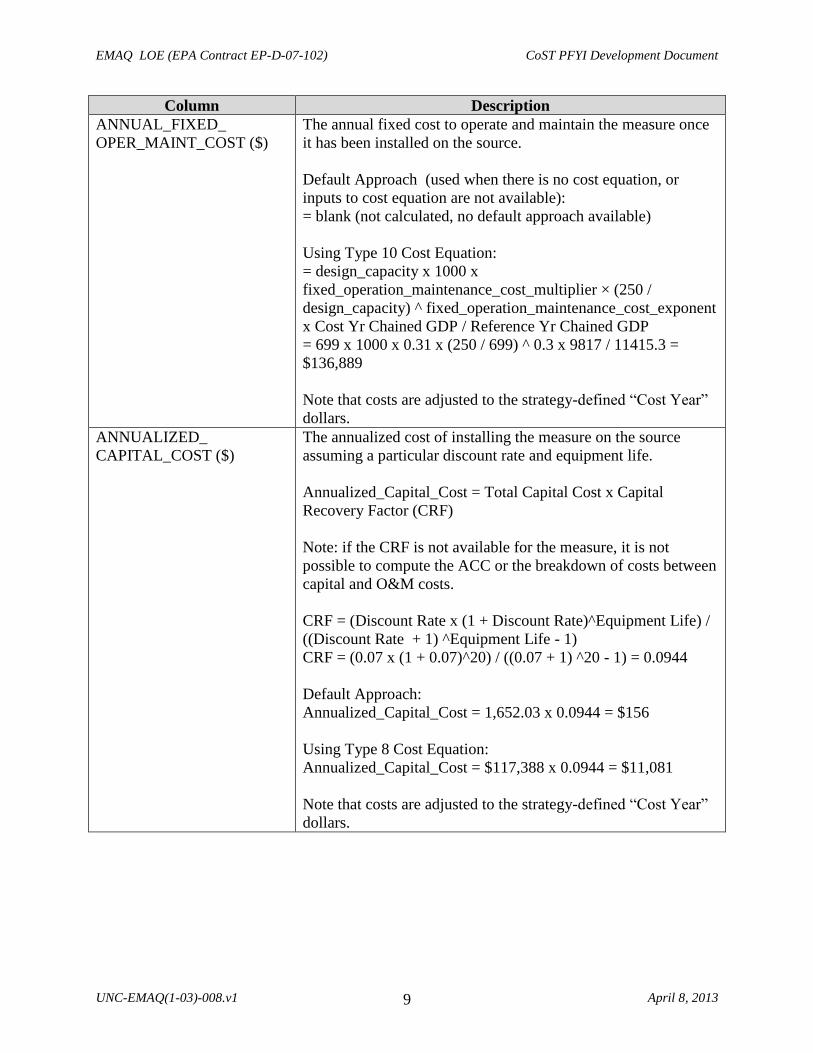
ANNUAL_FIXED_
OPER_MAINT_COST ($)
The annual fixed cost to operate and maintain the measure once
it has been installed on the source.
Default Approach (used when there is no cost equation, or
inputs to cost equation are not available):
= blank (not calculated, no default approach available)
Using Type 10 Cost Equation:
= design_capacity x 1000 x
fixed_operation_maintenance_cost_multiplier × (250 /
design_capacity) ^ fixed_operation_maintenance_cost_exponent
x Cost Yr Chained GDP / Reference Yr Chained GDP
= 699 x 1000 x 0.31 x (250 / 699) ^ 0.3 x 9817 / 11415.3 =
$136,889
Note that costs are adjusted to the strategy-defined “Cost Year”
dollars.
ANNUALIZED_
CAPITAL_COST ($)
The annualized cost of installing the measure on the source
assuming a particular discount rate and equipment life.
Annualized_Capital_Cost = Total Capital Cost x Capital
Recovery Factor (CRF)
Note: if the CRF is not available for the measure, it is not
possible to compute the ACC or the breakdown of costs between
capital and O&M costs.
CRF = (Discount Rate x (1 + Discount Rate)^Equipment Life) /
((Discount Rate + 1) ^Equipment Life - 1)
CRF = (0.07 x (1 + 0.07)^20) / ((0.07 + 1) ^20 - 1) = 0.0944
Default Approach:
Annualized_Capital_Cost = 1,652.03 x 0.0944 = $156
Using Type 8 Cost Equation:
Annualized_Capital_Cost = $117,388 x 0.0944 = $11,081
Note that costs are adjusted to the strategy-defined “Cost Year”
dollars.

EMAQ LOE (EPA Contract EP-D-07-102) CoST PFYI Development Document
UNC-EMAQ(1-03)-008.v1 April 8, 2013 10
Column Description
TOTAL_CAPITAL_
COST ($)
The total cost to install a measure on a source.
Default Approach (used when there is no cost equation or cost
equation inputs are not available):
TCC = Emission Reduction (tons) x Reference Yr Cost Per Ton
($/tons in 2006 Dollars) x Capital Annualized Ratio x Cost Yr
Chained GDP / Reference Yr Chained GDP
TCC= 11.88 (tons) x 147 ($/tons in 2000 Dollars) x 1.1 x 9817 /
11415.3 = $1,652.03
Using a Type 8 Cost Equation:
If Stack Flow Rate >= 5.0 cfm Then
TCC = Capital Control Cost Factor x Stack Flow Rate
(cfm) x Cost Yr Chained GDP / Reference Yr Chained
GDP
Else
TCC = Default Capital Cost Per Ton Factor x Emission
Reduction (tons) x Cost Yr Chained GDP / Reference Yr
Chained GDP
Example: Stack Flow Rate = 10,500 cfm, so use first equation
= 13.0 x 175 (cfs) x 60 s / 1 min x 9817 / 11415.3 = $117,388
Note that costs are adjusted to the strategy-defined “Cost Year”
dollars.
CONTROL_EFF (%) The control efficiency as specified by the Control Packet or
Allowable Packet.
For the old Control Packet format, the field is set to the CEFF
field.
For the new Control Extended Packet format, the field is set to
the ANN_PCTRED field for annual emission sources only; if
the source happens to have monthly emissions specified, then
this field will be calculated based on the following monthly
emission and pctred factors:
Control Efficiency (%) =
(jan_value×jan_pctred
100 +
feb_value×feb_pctred
100 + … +
dec_value×dec_pctred
100 )×100
(jan_value + feb_value + … + dec_value)
This field is null for Plant Closure and Projection Packets.
EMAQ LOE (EPA Contract EP-D-07-102) CoST PFYI Development Document
UNC-EMAQ(1-03)-008.v1 April 8, 2013 11
Column Description
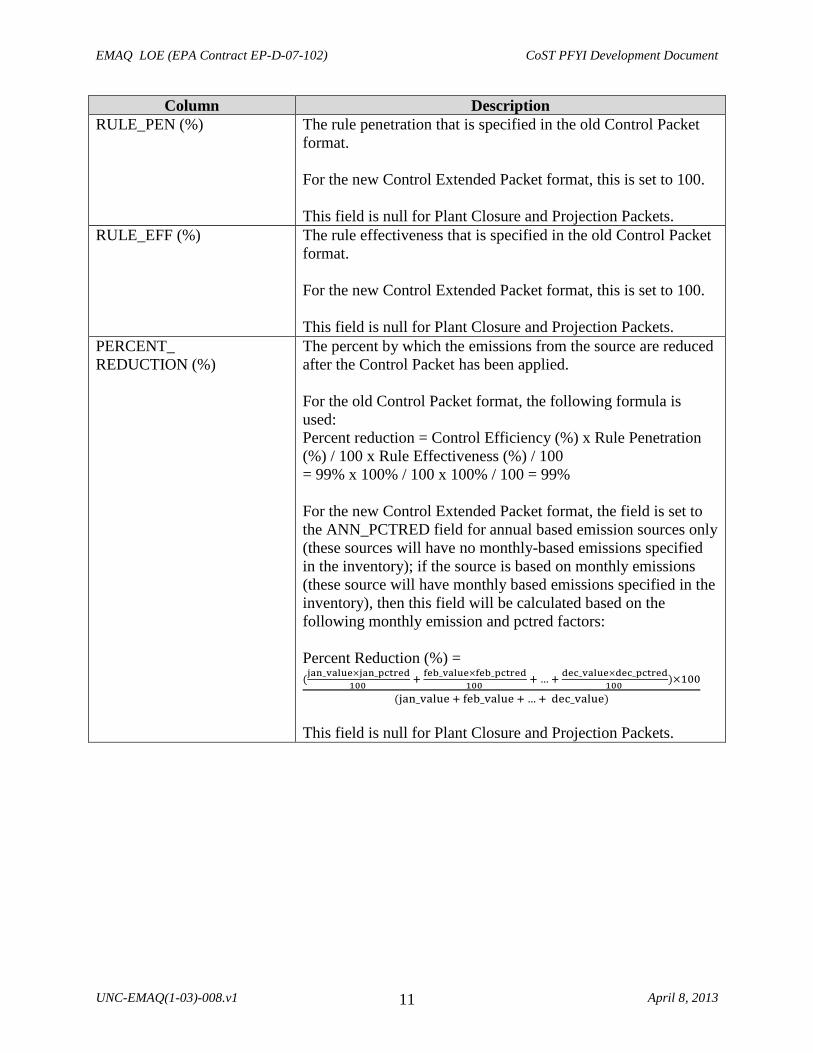
RULE_PEN (%) The rule penetration that is specified in the old Control Packet
format.
For the new Control Extended Packet format, this is set to 100.
This field is null for Plant Closure and Projection Packets.
RULE_EFF (%) The rule effectiveness that is specified in the old Control Packet
format.
For the new Control Extended Packet format, this is set to 100.
This field is null for Plant Closure and Projection Packets.
PERCENT_
REDUCTION (%)
The percent by which the emissions from the source are reduced
after the Control Packet has been applied.
For the old Control Packet format, the following formula is
used:
Percent reduction = Control Efficiency (%) x Rule Penetration
(%) / 100 x Rule Effectiveness (%) / 100
= 99% x 100% / 100 x 100% / 100 = 99%
For the new Control Extended Packet format, the field is set to
the ANN_PCTRED field for annual based emission sources only
(these sources will have no monthly-based emissions specified
in the inventory); if the source is based on monthly emissions
(these source will have monthly based emissions specified in the
inventory), then this field will be calculated based on the
following monthly emission and pctred factors:
Percent Reduction (%) =
(jan_value×jan_pctred
100 +
feb_value×feb_pctred
100 + … +
dec_value×dec_pctred
100 )×100
(jan_value + feb_value + … + dec_value)
This field is null for Plant Closure and Projection Packets.

EMAQ LOE (EPA Contract EP-D-07-102) CoST PFYI Development Document
UNC-EMAQ(1-03)-008.v1 April 8, 2013 12
Column Description
ADJ_FACTOR The adjustment factor stores the Projection Packet factor that is
applied to the source. This number is stored in a fractional state
rather than as a percentage.
For the old Projection Packet format, the ann_proj_factor field is
used.
For the new Projection Extended Packet format, the field is set
to the ANN_PROJ_FACTOR field for annual emission sources
only; if the source happens to have monthly emissions specified,
then this field will be calculated based on the following monthly
emission and proj_factor values:
Adjust Factor = (jan_value×jan_proj_factor+ … +dec_value×dec_proj_factor)
(jan_value + feb_value + … + dec_value)
This field is null for Plant Closure and Control Packets.
INV_CTRL_EFF (%) The control efficiency for the existing measure on the source,
found in the inventory
INV_RULE_PEN (%) The rule penetration for the existing measure on the source,
found in the inventory
INV_RULE_EFF (%) The rule effectiveness for the existing measure on the source,
found in the inventory
FINAL_EMISSIONS
(tons)
The final emissions amount that results from the source’s being
adjusted by the various Control Program Packets. This is set by
subtracting the emis_reduction field by the inv_emissions field.
Note that the Strategy Sample discussed in Section 3.5 gives
more details on exactly how this field is used.
EMAQ LOE (EPA Contract EP-D-07-102) CoST PFYI Development Document
UNC-EMAQ(1-03)-008.v1 April 8, 2013 13
Column Description
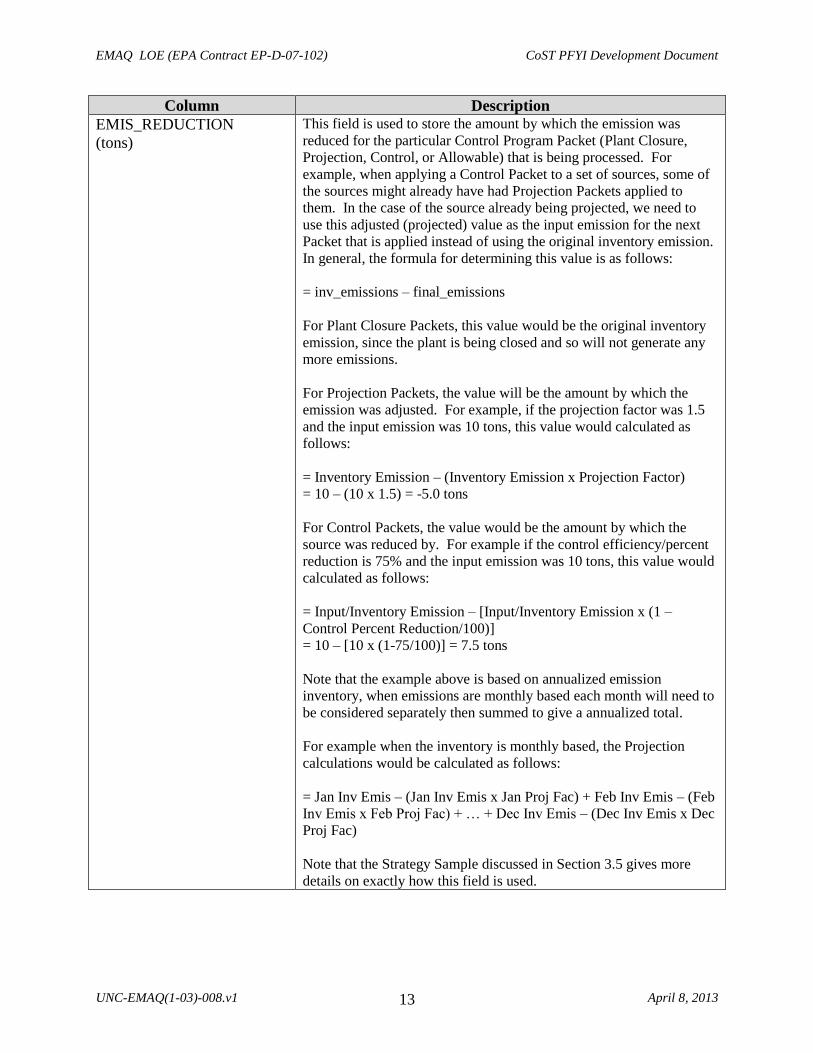
EMIS_REDUCTION
(tons)
This field is used to store the amount by which the emission was
reduced for the particular Control Program Packet (Plant Closure,
Projection, Control, or Allowable) that is being processed. For
example, when applying a Control Packet to a set of sources, some of
the sources might already have had Projection Packets applied to
them. In the case of the source already being projected, we need to
use this adjusted (projected) value as the input emission for the next
Packet that is applied instead of using the original inventory emission.
In general, the formula for determining this value is as follows:
= inv_emissions – final_emissions
For Plant Closure Packets, this value would be the original inventory
emission, since the plant is being closed and so will not generate any
more emissions.
For Projection Packets, the value will be the amount by which the
emission was adjusted. For example, if the projection factor was 1.5
and the input emission was 10 tons, this value would calculated as
follows:
= Inventory Emission – (Inventory Emission x Projection Factor)
= 10 – (10 x 1.5) = -5.0 tons
For Control Packets, the value would be the amount by which the
source was reduced by. For example if the control efficiency/percent
reduction is 75% and the input emission was 10 tons, this value would
calculated as follows:
= Input/Inventory Emission – [Input/Inventory Emission x (1 –
Control Percent Reduction/100)]
= 10 – [10 x (1-75/100)] = 7.5 tons
Note that the example above is based on annualized emission
inventory, when emissions are monthly based each month will need to
be considered separately then summed to give a annualized total.
For example when the inventory is monthly based, the Projection
calculations would be calculated as follows:
= Jan Inv Emis – (Jan Inv Emis x Jan Proj Fac) + Feb Inv Emis – (Feb
Inv Emis x Feb Proj Fac) + … + Dec Inv Emis – (Dec Inv Emis x Dec
Proj Fac)
Note that the Strategy Sample discussed in Section 3.5 gives more
details on exactly how this field is used.

EMAQ LOE (EPA Contract EP-D-07-102) CoST PFYI Development Document
UNC-EMAQ(1-03)-008.v1 April 8, 2013 14
Column Description
INV_EMISSIONS
(tons)
This field is used to store the beginning/input emission for the
particular Control Program Packet (Plant Closure, Projection,
Control, or Allowable) that is being processed. For example,
when applying a Control Packet to a set of sources, some of the
sources might already have had Projection Packets applied to
them. In the case of the source already being projected, we need
to use this adjusted (projected) value as the input emission for
the next Packet that is applied instead of using the original
inventory emission. The following sequence applies:
IF source was projected THEN
Use final_emissions field from Projection Packet entries
in the Strategy Detailed Result Output as input emission ELSE
Use inventory emission as input emission END IF
Note that if the starting inventory had average-day emissions,
the average-day value is annualized and the resulting value is
shown here. If the inventory has monthly-based emissions
(FF10 format), the monthly values are summed and the resulting
value is shown here.
Note that the Strategy Sample discussed in Section 3.5 gives
more details on exactly how this field is used.
APPLY_ORDER This field stores the Control Program Action Code that is being
used on the source. See Table 8 for a list of the action codes.
These codes indicate whether the Control Program is applying a
Plant Closure, Projection, Control, or Allowable Packet.
INPUT_EMIS (tons) This field is not used for the strategy type and is left blank/null.
OUTPUT_EMIS
(tons)
This field is not used for the strategy type and is left blank/null.
FIPSST The two-digit FIPS state code.
FIPSCTY The three-digit FIPS county code.
SIC The SIC code for the source from the inventory.
NAICS The NAICS code for the source from the inventory.
SOURCE_ID The record number from the input inventory for this source.
INPUT_DS_ID The numeric ID of the input inventory dataset (for bookkeeping
purposes).
CS_ID The numeric ID of the control strategy
CM_ID This field is not used for the strategy type and is left blank/null.

EMAQ LOE (EPA Contract EP-D-07-102) CoST PFYI Development Document
UNC-EMAQ(1-03)-008.v1 April 8, 2013 15
Column Description
EQUATION TYPE The control measure equation that was used during the cost
calculations. If a minus sign is in front of the equation type, this
indicates that the equation type was missing inputs and the
strategy instead used the default approach to estimate costs.
Note that this field will be used only when Control Packets are
applied, not when any of the other packet types are applied.
ORIGINAL_
DATASET_ID
This field is not used for the strategy type and is left blank/null.
SECTOR This field is not used for the strategy type and is left blank/null.
CONTROL_PROGRAM The control program that was applied to produce this record
XLOC The longitude for the source, found in the inventory for point
sources, for nonpoint inventories the county centroid is used.
This is useful for mapping purposes
YLOC The latitude for the source, found in the inventory for point
sources, for nonpoint inventories the county centroid is used.
This is useful for mapping purposes.
PLANT The plant name from the inventory (or county name for nonpoint
sources)
REPLACEMENT_ADDON Indicates whether the Control Packet was applying a
replacement or an add-on control packet.
A = Add-On Control
R = Replacement Control
Note that this field will be used only when Control Packets are
applied, not when any of the other packet types are applied.
EXISTING_MEASURE_
ABBREVIATION
This field is not used for the strategy type and is left blank/null.
EXISTING_PRIMARY_
DEVICE_TYPE_CODE
This field is not used for the strategy type and is left blank/null.
STRATEGY_NAME This field is not used for the strategy type and is left blank/null.
CONTROL_TECHNOLOGY This field is not used for the strategy type and is left blank/null.
SOURCE_GROUP This field is not used for the strategy type and is left blank/null.
COUNTY_NAME This field is not used for the strategy type and is left blank/null.
STATE_NAME This field is not used for the strategy type and is left blank/null.
SCC_L1 This field is not used for the strategy type and is left blank/null.
SCC_L2 This field is not used for the strategy type and is left blank/null.
SCC_L3 This field is not used for the strategy type and is left blank/null.
SCC_L4 This field is not used for the strategy type and is left blank/null.

EMAQ LOE (EPA Contract EP-D-07-102) CoST PFYI Development Document
UNC-EMAQ(1-03)-008.v1 April 8, 2013 16
Column Description
JAN_FINAL_EMISSIONS The monthly January final emission that results from the
source’s being adjusted by the various Control Program Packets.
This is set by subtracting the monthly January emission
reduction by the monthly January input emission.
Note that the Strategy Sample discussed in Section 3.5gives
more details on exactly how this field is used. This monthly-
related field is populated only when projecting Flat File 2010
inventories.
FEB_FINAL_EMISSIONS Same as defined for the jan_final_emissions field but for
February.
… …
DEC_FINAL_EMISSIONS Same as defined for the jan_final_emissions field but for
December.
JAN_PCT_RED The percent by which the source’s January monthly emission is
reduced after the Control Packet has been applied.
For the old Control Packet format, the following formula is
used:
Percent reduction = Control Efficiency (%) x [Rule Penetration
(%) / 100] x [Rule Effectiveness (%) / 100]
= 99% x [100% / 100] x [100% / 100] = 99%
For the new Control Extended Packet format, the field is set to
the Control Packet ANN_PCTRED field for annual based
emission sources only (these sources will have no monthly-
based emissions specified in the inventory); if the source is
based on monthly emissions (these source will have monthly
based emissions specified in the inventory), then this field will
be set to the Control Packet jan_pctred field. If the jan_pctred
field is unknown, then the Control Packet ann_pctred is used.
This field is null for Plant Closure and Projection Packets.
This monthly-related field is only populated when projecting
Flat File 2010 inventories.
FEB_PCT_RED Same as defined for the jan_pct_red field but for February
… …
DEC_PCT_RED Same as defined for the jan_pct_red field but for December
COMMENT Information about this record and how it was produced; this can
be either created automatically by the system or entered by the
user.

EMAQ LOE (EPA Contract EP-D-07-102) CoST PFYI Development Document
UNC-EMAQ(1-03)-008.v1 April 8, 2013 17
2.3.2 Strategy Messages
The Strategy Messages output provides useful information that is gathered while the strategy is
running. This output can store ERROR and WARNING types of messages. If an ERROR is
encountered during the prerun validation process, the strategy run will be canceled and the user
can peruse this dataset to see what problems the strategy has (e.g., duplicate packet records).
The columns of the Strategy Messages output are described in Table 2.
Table 2. Columns in the Strategy Messages Result
Column Description
Fips The state and county FIPS code for the source, found in the inventory
Scc The SCC code for the source, found in the inventory
PlantId For point sources, the plant/facility ID for the source, found in the
inventory
PointId For point sources, the point/unit ID for the source, found in the inventory
StackId For point sources, the stack/release point ID for the source, found in the
inventory
Segment For point sources, the segment/process ID for the source, found in the
inventory
Poll The pollutant for the source, found in the inventory
Status The status type. The possible values are listed below:
Warning – description
Error – description
Informational – description
control_program The control program for the strategy run; this is populated only when
using the PFYI strategy type.
message The text describing the strategy problem.
message_type Contains a high-level message-type category. Currently this is populated
only when using the PFYI strategy type.
The possible values are listed below:
Inventory Level (or blank) – message has to do specifically with a
problem with the inventory
Packet Level – message has to do specifically with a problem with
the packet record being applied to the inventory
inventory Identifies the inventory with the problem.
Packet_fips The state and county FIPS/region code for the source, found in the control
program packet
Packet_scc The SCC code for the source, found in the control program packet
Packet_plantId For point sources, the plant/facility ID for the source, found in the control
program packet
Packet_pointId For point sources, the point/unit ID for the source, found in the control
program packet
Packet_stackId For point sources, the stack/release point ID for the source, found in the
control program packet
Packet_segment For point sources, the segment/process ID for the source, found in the

EMAQ LOE (EPA Contract EP-D-07-102) CoST PFYI Development Document
UNC-EMAQ(1-03)-008.v1 April 8, 2013 18
Column Description
control program packet
Packet_poll The pollutant for the source, found in the control program packet
Packet_sic The SIC code for the source, found in the control program packet
Packet_mact The MACT/regulatory code for the source, found in the control program
packet
Packet_naics The NAICS code for the source, found in the control program packet
Packet_compliance
_effective_date
The compliance or effective date, found in the control program packet.
The compliance date is used in the Control Packet; the effective date is
used in the Plant Closure Packet
Packet_replacement Indicates whether the packet identifies a replacement versus an add-on
control, found in the control program packet
Packet_annual_mon
thly
Indicates whether the packet is monthly based or annual based
2.3.3 Controlled Emissions Inventory
Another output that can be created is a controlled emissions inventory. This dataset is not
automatically created during a strategy run; instead, a user can choose to create it after the
strategy run has completed successfully. When EMF/CoST creates a controlled inventory,
comments placed at the top of the inventory file indicate the strategy used to produce it and the
high-level settings for that strategy.
For ORL Inventories:
For the sources that were controlled, CoST fills in the CEFF (control efficiency), REFF (rule
effectiveness), and RPEN (rule penetration) columns based on the Control Packets applied to the
sources. The CEFF column is populated differently for a replacement Control Packet record
than for an add-on Control Packet record. For a replacement control, the CEFF column is
populated with the percent reduction of the replacement control. For an add-on control, the
CEFF column is populated with the overall combined percent reduction of the add-on control
plus the preexisting control, using the following formula: (1 – {[1 – (existing percent reduction /
100)] x [1 – (add-on percent reduction / 100)]}) x 100. For both types of Control Packet records
(add-on or replacement), the REFF and RPEN are defaulted to 100 since the CEFF accounts for
any variation in the REFF and RPEN by using the percent reduction instead of solely the CEFF.
Note that only Control Packets (not Plant Closure, Projection, or Allowable packets) will be used
to help populate the columns discussed above.
For Flat File 2010 Inventories:
For the sources that were controlled, CoST fills in the annual (ANN_PCT_RED) and monthly
percent reduction (JAN_PCT_RED) columns based on the values for the Control Packet that was
applied to the sources. The CEFF column is populated differently for a replacement control than
for an add-on control. For a replacement control, the CEFF column is populated with the percent
reduction of the replacement control. For an add-on control, the CEFF column is populated with
the overall combined percent reduction of the add-on control plus the preexisting control, using
the following formula: (1 – {[1 – (existing percent reduction / 100)] x [1 – (add-on percent

EMAQ LOE (EPA Contract EP-D-07-102) CoST PFYI Development Document
UNC-EMAQ(1-03)-008.v1 April 8, 2013 19
reduction / 100)]}) x 100. For both types of measures, the REFF and RPEN values are defaulted
to 100, because the CEFF accounts for any variation in the REFF or RPEN by using the percent
reduction instead of the CEFF.
CoST also populates several additional columns toward the end of the ORL and Flat File 2010
inventory rows that specify information about measures that it has applied. These columns are:
CONTROL MEASURES: An ampersand (&)-separated list of control measure abbrevi-
ations that correspond to the control measures that have been applied to the given source.
PCT REDUCTION: An ampersand-separated list of percent reductions that have been
applied to the source, where percent reduction = CEFF REFF RPEN.
CURRENT COST: The annualized cost for that source for the most recent control
strategy that was applied to the source.
TOTAL COST: The total cost for the source across all measures that have been applied
to the source.
In this way, the controlled inventories created by CoST always specify the relevant information
about the measures/programs that have been applied as a result of a CoST control strategy.
2.4 Costing Control Measures
The Control Strategy Tool costs out emission control measures in two ways: (1) cost equations
are used to determine engineering costs that take into account several variables for the source,
when those variables are available; or (2) if those data are not available, a simple cost factor in
terms of dollars per ton of pollutant reduced is used to calculate the cost of the control measure
when applied to a specific source. The second approach can also utilize a simple incremental
cost factor in terms of dollars per ton of pollutant when there is a preexisting control already on
the source, as identified in the inventory CEFF field. If the inventory CEFF field is populated
and the control measure has an incremental cost per ton factor specified, this cost factor will
always be used instead of the normal cost per ton factor. If on the other hand the incremental
cost factor is not specified on a control with a preexisting control, than the default cost factor will
be used instead.
Currently, cost equations are used only for some EGU and non-EGU source measures. They are
not used for area sources.
During a strategy run, if the engineering cost equation was not found to have the appropriate
inputs (e.g., missing design capacity), this issue can be identified by looking for a negative sign
in front of the equation type in the Strategy Detailed Result equation_type column (e.g., -Type 2
or -Type 8). The sources with this issue will be populated in the Strategy Messages dataset. The
associated message will help identify which equation inputs are missing.
See the Control Strategy Tool (CoST) Development Document and Control Strategy Tool
Cost Equations Document for more detailed information on how cost equations are used in
CoST.

EMAQ LOE (EPA Contract EP-D-07-102) CoST PFYI Development Document
UNC-EMAQ(1-03)-008.v1 April 8, 2013 20
3 Project Future Year Inventory Control Strategy
3.1 Project Future Year Inventory Background
The inventory projection process involves taking a base-year inventory and projecting it to a
future-year base inventory). For the future-year base inventories to have information on existing
control measures, it is helpful for the inventory projection process to specify what control
measures have been applied to the sources. This can be accomplished in a way that is similar to
how the Annotate Inventory strategy analysis works. It can also be accomplished by
incorporating the concept of control programs (explained in Section 8.2) into CoST and the
EMF. The process of projecting inventories is currently done using a series of SAS programs
that take as input data tables collected from various sources. For several years, EPA has wanted
to make the process of applying the control programs more explicit and documentable. By
incorporating the control programs into CoST and having CoST apply the projection and control
factors to create the projected inventory, it will be possible to annotate the inventories as the
projection takes place.
To accomplish the application of control programs and projection factors to an inventory, the
control programs concept is being incorporated into CoST. For each control program, it will be
possible to specify the type of program, the start and end date, and one accompanying dataset
that will identify the sources that will be affected by the program (e.g., a list of plants that will
close). The types of control programs are expected to include, but not be limited to, the
following:
Planned closures at specific plants
Planned reductions at specific plants
Planned growth at specific plants
Planned replacement control technology at existing plants
Planned add-on control technology at existing plants
Caps on emissions at existing plants
Replacement of emissions at existing plants
SCC-based reduction programs
Commuter programs
Estimated growth for specific sectors
In situations where the desired control measures or technologies for the control program are
known, these can be specified as part of the control program. If the control measures are not
known, CoST can search for a measure with the desired control efficiency and provide that as the
best guess for the applied measure. If a probable measure is found for a source, a cost estimate
will also be included as part of the analysis. To implement the process of inventory projection, a
new strategy analysis algorithm is being added to CoST, called “Project Future Year Inventory”.
The Strategy Detailed Result for this strategy will show the control efficiency (and probable
control measure, including costs), growth factor, and cap value or replacement value that was
applied to a source. This strategy will also be able to generate a complete inventory for use as

EMAQ LOE (EPA Contract EP-D-07-102) CoST PFYI Development Document
UNC-EMAQ(1-03)-008.v1 April 8, 2013 21
input to SMOKE. It is important to note that there is another important data need: to collect
planned control program data (e.g., from SIPs) from states so that future EPA control strategy
modeling can incorporate these programs and thereby produce more realistic results than if the
planned state-specific programs are ignored.
3.2 Introduction to Control Programs
A control program is used as an input to a “Project Future Year Inventory” control strategy. A
control program contains a control packet type of dataset that will identify the sources that will
be affected by the program, a start date and end date, and a list of probable control measure or
control technologies to include during the analysis. There are four major types of control
programs:
Plant Closure – can identify specific plants to close; can vary the level of closure by
targeting specific stacks or by closing whole plants (i.e., all stacks at the plant will be
closed)
Control – can apply replacement or add-on controls to inventory emission sources
Projection – can apply projections to inventory emission sources
Allowable – can apply a replacement cap on inventory emission sources or replace
inventory emission sources
The Control Program Packet Dataset is used in conjunction with an emission inventory to create
a control/projection matrix by matching the control packet to the emission inventory using a
hierarchical weighted matching approach. This matching process creates source–control-packet
pairings. The matrix is stored in the Strategy Detailed Result. See Table 3 for a complete listing
of the matching hierarchy combinations, the inventory types the matching criteria can be used
for, and the Control Program Packet Types that can use these criteria.
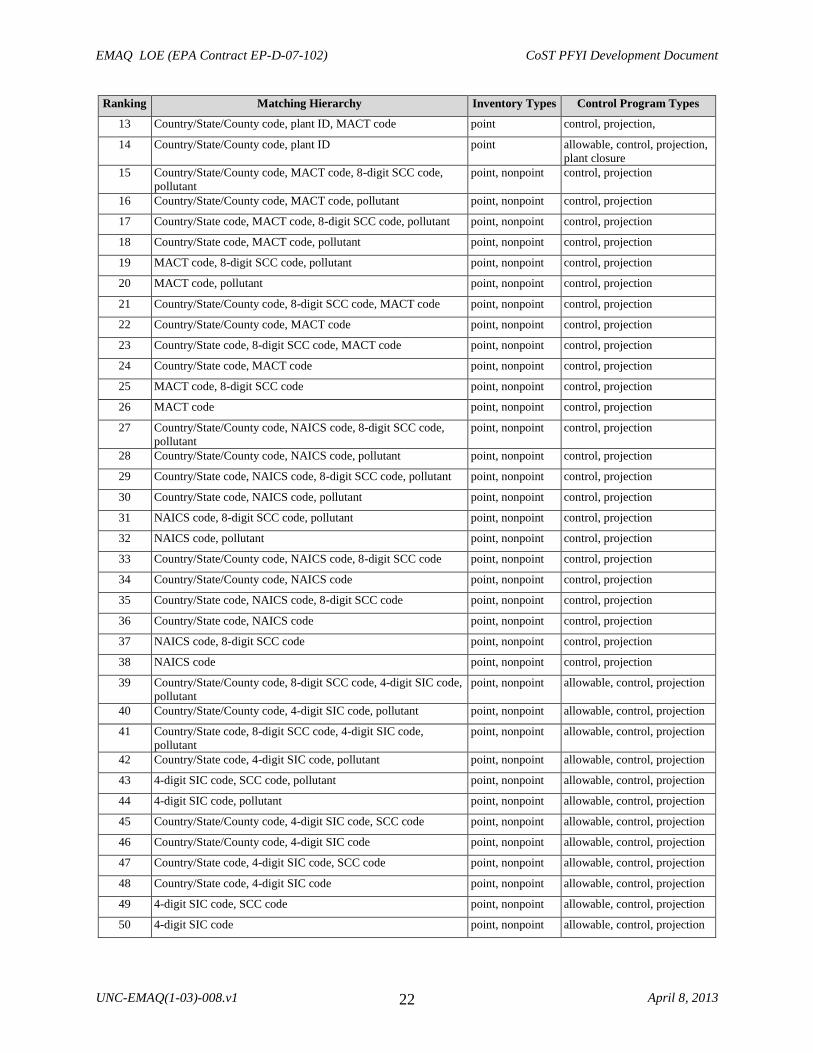
Table 3. Control Packet Matching Hierarchy Ranking Matching Hierarchy Inventory Types Control Program Types
1 Country/State/County code, plant ID, point ID, stack ID,
segment, 8-digit SCC code, pollutant
point allowable, control, projection,
plant closure
2 Country/State/County code, plant ID, point ID, stack ID,
segment, pollutant
point allowable, control, projection,
plant closure
3 Country/State/County code, plant ID, point ID, stack ID,
pollutant
point allowable, control, projection,
plant closure
4 Country/State/County code, plant ID, point ID, pollutant point allowable, control, projection,
plant closure
5 Country/State/County code, plant ID, 8-digit SCC code,
pollutant
point allowable, control, projection,
plant closure
6 Country/State/County code, plant ID, MACT code, pollutant point control, projection,
7 Country/State/County code, plant ID, pollutant point allowable, control, projection,
plant closure
8 Country/State/County code, plant ID, point ID, stack ID,
segment, 8-digit SCC code
point allowable, control, projection,
plant closure
9 Country/State/County code, plant ID, point ID, stack ID,
segment
point allowable, control, projection,
plant closure
10 Country/State/County code, plant ID, point ID, stack ID point allowable, control, projection,
plant closure
11 Country/State/County code, plant ID, point id point allowable, control, projection,
plant closure
12 Country/State/County code, plant ID, 8-digit SCC code point allowable, control, projection,
plant closure
EMAQ LOE (EPA Contract EP-D-07-102) CoST PFYI Development Document
UNC-EMAQ(1-03)-008.v1 April 8, 2013 22
Ranking Matching Hierarchy Inventory Types Control Program Types
13 Country/State/County code, plant ID, MACT code point control, projection,
14 Country/State/County code, plant ID point allowable, control, projection,
plant closure
15 Country/State/County code, MACT code, 8-digit SCC code,
pollutant
point, nonpoint control, projection
16 Country/State/County code, MACT code, pollutant point, nonpoint control, projection
17 Country/State code, MACT code, 8-digit SCC code, pollutant point, nonpoint control, projection
18 Country/State code, MACT code, pollutant point, nonpoint control, projection
19 MACT code, 8-digit SCC code, pollutant point, nonpoint control, projection
20 MACT code, pollutant point, nonpoint control, projection
21 Country/State/County code, 8-digit SCC code, MACT code point, nonpoint control, projection
22 Country/State/County code, MACT code point, nonpoint control, projection
23 Country/State code, 8-digit SCC code, MACT code point, nonpoint control, projection
24 Country/State code, MACT code point, nonpoint control, projection
25 MACT code, 8-digit SCC code point, nonpoint control, projection
26 MACT code point, nonpoint control, projection
27 Country/State/County code, NAICS code, 8-digit SCC code,
pollutant
point, nonpoint control, projection
28 Country/State/County code, NAICS code, pollutant point, nonpoint control, projection
29 Country/State code, NAICS code, 8-digit SCC code, pollutant point, nonpoint control, projection
30 Country/State code, NAICS code, pollutant point, nonpoint control, projection
31 NAICS code, 8-digit SCC code, pollutant point, nonpoint control, projection
32 NAICS code, pollutant point, nonpoint control, projection
33 Country/State/County code, NAICS code, 8-digit SCC code point, nonpoint control, projection
34 Country/State/County code, NAICS code point, nonpoint control, projection
35 Country/State code, NAICS code, 8-digit SCC code point, nonpoint control, projection
36 Country/State code, NAICS code point, nonpoint control, projection
37 NAICS code, 8-digit SCC code point, nonpoint control, projection
38 NAICS code point, nonpoint control, projection
39 Country/State/County code, 8-digit SCC code, 4-digit SIC code,
pollutant
point, nonpoint allowable, control, projection
40 Country/State/County code, 4-digit SIC code, pollutant point, nonpoint allowable, control, projection
41 Country/State code, 8-digit SCC code, 4-digit SIC code,
pollutant
point, nonpoint allowable, control, projection
42 Country/State code, 4-digit SIC code, pollutant point, nonpoint allowable, control, projection
43 4-digit SIC code, SCC code, pollutant point, nonpoint allowable, control, projection
44 4-digit SIC code, pollutant point, nonpoint allowable, control, projection
45 Country/State/County code, 4-digit SIC code, SCC code point, nonpoint allowable, control, projection
46 Country/State/County code, 4-digit SIC code point, nonpoint allowable, control, projection
47 Country/State code, 4-digit SIC code, SCC code point, nonpoint allowable, control, projection
48 Country/State code, 4-digit SIC code point, nonpoint allowable, control, projection
49 4-digit SIC code, SCC code point, nonpoint allowable, control, projection
50 4-digit SIC code point, nonpoint allowable, control, projection

EMAQ LOE (EPA Contract EP-D-07-102) CoST PFYI Development Document
UNC-EMAQ(1-03)-008.v1 April 8, 2013 23
Ranking Matching Hierarchy Inventory Types Control Program Types
51 Country/State/County code, 8-digit SCC code, pollutant point, nonpoint,
onroad, nonroad
allowable, control, projection
52 Country/State code, 8-digit SCC code, pollutant point, nonpoint,
onroad, nonroad
allowable, control, projection
53 8-digit SCC code, pollutant point, nonpoint,
onroad, nonroad
allowable, control, projection
54 Country/State/County code, 8-digit SCC code point, nonpoint,
onroad, nonroad
allowable, control, projection
55 Country/State code, 8-digit SCC code point, nonpoint,
onroad, nonroad
allowable, control, projection
56 8-digit SCC code point, nonpoint,
onroad, nonroad
allowable, control, projection
57 Country/State/County code, pollutant point, nonpoint,
onroad, nonroad
allowable, control, projection
58 Country/State/County code point, nonpoint,
onroad, nonroad
allowable, control, projection,
plant closure
59 Country/State code, pollutant point, nonpoint,
onroad, nonroad
allowable, control, projection
60 Country/State code point, nonpoint,
onroad, nonroad
allowable, control, projection,
plant closure
61 Pollutant point, nonpoint,
onroad, nonroad
allowable, control, projection
More than one of the same type of control programs can be added to a strategy. For example, a
client could add three Plant Closure Control Programs: Cement Plant Closures, Power Plant
Closures, and Boiler Closures. All three of these control programs would be evaluated and a
record of the evaluation would be stored in the Strategy Detailed Result. If there happen to be
multiple Projection, Control, or Allowable Type Control Programs added to a strategy, packets
of the same type are merged into one packet during the matching analysis so that no duplicate
source–control-packet pairings are created. Duplicate records will be identified during the run
process and the user will be prompted to remove duplicates before the core algorithm performs
the projection process.
The Project Future Year Inventory strategy processes Control Programs in the following order:
1. Plant Closure Type Control Programs
2. Projection Type Control Programs
3. Control Type Control Programs
4. Allowable Type Control Programs
The Control analysis is dependent on the Projection analysis; likewise, the Allowable analysis is
dependent on the Projection and Control analyses. The adjusted source emission values need to
be carried along from each analysis step to make sure each portion of the analysis applies the
correct adjustment factor. For example, a source could be projected, and also controlled, in
addition to having a cap placed on the source. Or, a source could have a projection or control
requirement, or perhaps just a cap or replacement requirement.
As much as possible, the Control Program Packet datasets are designed to be compatible with
SMOKE. The Projection, Control, and Allowable Packets are fully compatible with SMOKE.
The Plant Closure Packet and the new Projection, Control, and Allowable Packets Extended
dataset types, however, are not compatible with SMOKE; these dataset types are CSV-based

EMAQ LOE (EPA Contract EP-D-07-102) CoST PFYI Development Document
UNC-EMAQ(1-03)-008.v1 April 8, 2013 24
files that must contain certain columns. Tables 29 through 36 show the formats (and relevant
mappings) of the seven types of control program packets. CoST makes use of some of the
SMOKE unused optional columns to further extend the matching hierarchy, as compared to the
SMOKE matching hierarchy in cntlmat. These new columns are explained in the Tables 30, 33
and 35 below.
The format of the Control Program Plant Closure Packet (Table 4) is based on the CSV format.
The first row of this dataset file must contain the column header definition as defined in Line 1
of Table 4. All the columns specified here must be included in the dataset import file.
Table 4. Table Format for Plant Closure Packet Dataset Type
Line Position Description
1 A..H Column header definition – must contain the following columns:
fips,plantid,pointid,stackid,segment,plant,effective_date,reference
2+ A Country/State/County code, required
B Plant Id for point sources, optional, blank, zero, or -9 if not specified, leave blank
for nonpoint inventories
C Point Id for point sources, optional, blank, zero, or -9 if not specified, leave blank
for nonpoint inventories
D Stack Id for point sources, , optional, blank, zero, or -9 if not specified, leave
blank for nonpoint inventories
E Segment for point sources, optional, blank, zero, or -9 if not specified, leave blank
for nonpoint inventories
F Plant name or description, for point sources, optional, leave blank for nonpoint
inventories
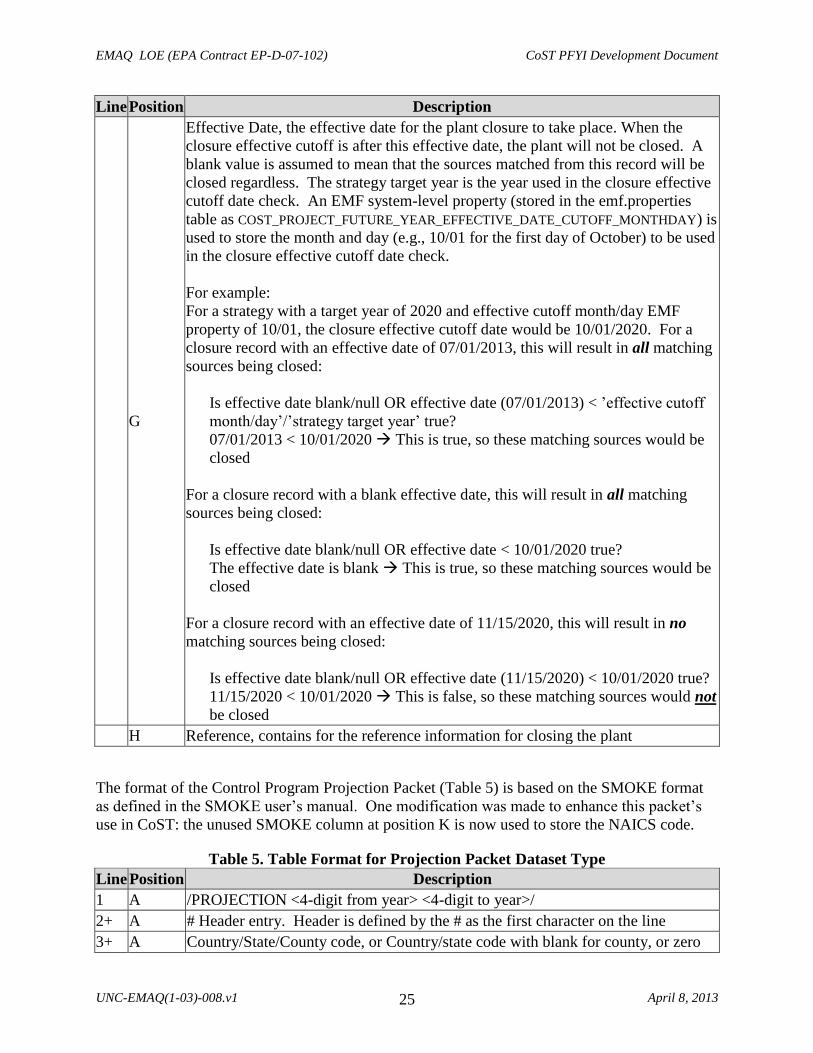
EMAQ LOE (EPA Contract EP-D-07-102) CoST PFYI Development Document
UNC-EMAQ(1-03)-008.v1 April 8, 2013 25
Line Position Description
G
Effective Date, the effective date for the plant closure to take place. When the
closure effective cutoff is after this effective date, the plant will not be closed. A
blank value is assumed to mean that the sources matched from this record will be
closed regardless. The strategy target year is the year used in the closure effective
cutoff date check. An EMF system-level property (stored in the emf.properties
table as COST_PROJECT_FUTURE_YEAR_EFFECTIVE_DATE_CUTOFF_MONTHDAY) is
used to store the month and day (e.g., 10/01 for the first day of October) to be used
in the closure effective cutoff date check.
For example:
For a strategy with a target year of 2020 and effective cutoff month/day EMF
property of 10/01, the closure effective cutoff date would be 10/01/2020. For a
closure record with an effective date of 07/01/2013, this will result in all matching
sources being closed:
Is effective date blank/null OR effective date (07/01/2013) < ’effective cutoff
month/day’/’strategy target year’ true?
07/01/2013 < 10/01/2020 This is true, so these matching sources would be
closed
For a closure record with a blank effective date, this will result in all matching
sources being closed:
Is effective date blank/null OR effective date < 10/01/2020 true?
The effective date is blank This is true, so these matching sources would be
closed
For a closure record with an effective date of 11/15/2020, this will result in no
matching sources being closed:
Is effective date blank/null OR effective date (11/15/2020) < 10/01/2020 true?
11/15/2020 < 10/01/2020 This is false, so these matching sources would not
be closed
H Reference, contains for the reference information for closing the plant
The format of the Control Program Projection Packet (Table 5) is based on the SMOKE format
as defined in the SMOKE user’s manual. One modification was made to enhance this packet’s
use in CoST: the unused SMOKE column at position K is now used to store the NAICS code.
Table 5. Table Format for Projection Packet Dataset Type
Line Position Description
1 A /PROJECTION <4-digit from year> <4-digit to year>/
2+ A # Header entry. Header is defined by the # as the first character on the line
3+ A Country/State/County code, or Country/state code with blank for county, or zero
EMAQ LOE (EPA Contract EP-D-07-102) CoST PFYI Development Document
UNC-EMAQ(1-03)-008.v1 April 8, 2013 26
Line Position Description
(or blank or -9) for all Country/State/County or Country/state codes
B 8 or 10-digit SCC, optional, blank, zero, or -9 if not a SCC-specific projection
C Projection factor [enter number on fractional basis; e.g., enter 1.2 to increase
emissions by 20%]
D Pollutant , blank, zero, or -9 if not a pollutant-specific projection
E Standard Industrial Category (SIC), optional, blank, zero, or -9 if not a SIC-
specific projection
F Maximum Achievable Control Technology (MACT) code, optional, blank, zero, or
-9 if not a MACT-specific projection
G Plant Id for point sources, optional, blank, zero, or -9 if not specified, leave blank
for nonpoint inventories
H Point Id for point sources, optional, blank, zero, or -9 if not specified, leave blank
for nonpoint inventories
I Stack Id for point sources, , optional, blank, zero, or -9 if not specified, leave
blank for nonpoint inventories
J Segment for point sources, optional, blank, zero, or -9 if not specified, leave blank
for nonpoint inventories
K North American Industry Classification (NAICS) Code, optional, blank, zero, or -
9 if not a NAICS-specific projection
L Characteristic 5 (blank for ORL inventory input format), optional
3 A /END/
The format of the Control Program “Projection Packet Extended” (Table 6) is not based on the
SMOKE format. It is based on the EMF Flexible File Format, which is based on the CSV-based
format. This new format uses column names that are aligned with the Flat File 2010 dataset
types in the EMF system. The format also supports monthly projection factors in addition to
annual projection factors. For example, instead of using the FIPS code, the new format uses the
REGION_CD column, and instead of PLANTID the new format uses FACILITY_ID. The
appropriate mapping between the old and new formats is described in Table 7. The new format
also contains additional columns that will be used in the future to help further enhance the
inventory source matching capabilities, these include COUNTRY_CD, TRIBAL_CODE,
CENSUS_TRACT_CD, SHAPE_ID, and EMIS_TYPE.
Table 6. Table Format for Projection Packet Extended Dataset Type
Column Description
Country_cd Country code, optional; currently not used in matching process
Region_cd State/county code, or state code with blank for county, or zero (or blank or -9)
for all state/county or state codes
Facility_id Facility ID (aka Plant ID in ORL format) for point sources, optional; blank,
zero, or -9 if not specified; leave blank for nonpoint inventories
Unit_id Unit ID (aka Point ID for ORL format) for point sources, optional; blank, zero,
EMAQ LOE (EPA Contract EP-D-07-102) CoST PFYI Development Document
UNC-EMAQ(1-03)-008.v1 April 8, 2013 27
Column Description
or -9 if not specified; leave blank for nonpoint inventories
Rel_point_id Release Point ID (aka Stack ID in ORL format) for point sources, optional;
blank, zero, or -9 if not specified; leave blank for nonpoint inventories
Process_id Process ID (aka Segment on ORL format) for point sources, optional; blank,
zero, or -9 if not specified; leave blank for nonpoint inventories
Tribal_code Tribal code, optional; currently not used in matching process
Census_tract_cd Census tract ID, optional; currently not used in matching process
Shape_id Shape ID, optional; currently not used in matching process
Emis_type Emission type, optional; currently not used in matching process
Scc 8- or 10-digit SCC, optional; blank, zero, or -9 if not an SCC-specific control
Poll Pollutant;, blank, zero, or -9 if not a pollutant-specific control
Reg_code Regulatory code (aka Maximum Achievable Control Technology code),
optional; blank, zero, or -9 if not a regulatory code-specific control
Sic Standard Industrial Category (SIC), optional; blank, zero, or -9 if not an SIC-
specific control
Naics North American Industry Classification (NAICS) code, optional; blank, zero, or
-9 if not a NAICS-specific control
Ann_proj_factor
The annual projection factor used to adjust the annual emission of the inventory.
The number is stored as a fraction rather than a percentage; e.g., enter 1.2 to
increase emissions by 20% (double precision).
The annual projection factor is also used as a default for monthly-specific
projection factors when they are not specified. If you do not want to specify a
monthly-specific projection factor value, then also make sure not to specify an
annual projection factor, which could be used as a default.
Jan_proj_factor
The projection factor used to adjust the monthly January emission of the
inventory (the jan_value column of the FF10 inventory). The number is stored
as a fraction rather than a percentage; e.g., enter 1.2 to increase emissions by
20% (double precision).
If no January projection factor is specified, the annual projection factor value
will be used as a default.
The monthly-specific projection factor fields are not used on the older ORL
inventory formats; only the annual projection factor field will be used on these
older formats.
Feb_proj_factor Analogous to the January projections factor, above.
… …
Dec_proj_factor
The projection factor used to adjust the monthly December emission of the
inventory (the dec_value column of the FF10 inventory). The number is stored
as a fraction rather than a percentage; e.g., enter 1.2 to increase emissions by
20% (double precision).

EMAQ LOE (EPA Contract EP-D-07-102) CoST PFYI Development Document
UNC-EMAQ(1-03)-008.v1 April 8, 2013 28
Column Description
If no December projection factor is specified, the annual projection factor value
will be used as a default.
The monthly-specific projection factor fields are not used on the older ORL
inventory formats; only the annual projection factor field will be used on these
older formats.
Comment Information about this record and how it was produced and entered by the user.
Table 7 identifies the appropriate mapping between the old (ORL inventories) and new (FF10
inventories) packet formats.
Table 7. Column Mapping between New and Old Control Program Packet Formats New Extended Format
Column
“Control Program
Extended” DS Type
Old Format
Column
“Control Program
Extended” DS Type
Description
REGION_CD FIPS State/county code, or state code
FACILITY_ID PLANTID Plant ID for point sources
UNIT_ID POINTID Point ID for point sources
REL_POINT_ID STACKID Stack ID for point sources
PROCESS_ID SEGMENT Segment for point sources
MACT REG_CD Maximum Achievable Control Technology (MACT)
code
The format of the Control Program Control Packet Dataset Type (Table 8) is based on the
SMOKE format as defined in the SMOKE user’s manual. Several modifications were made to
enhance the packet’s use in CoST: (1) The unused SMOKE column at position D is now used to
store the primary control measure abbreviation; if one is specified, this measure is used on any
source that was matched with those control packet entries. (2) The unused SMOKE column at
position P is used to store the compliance date the control can be applied to sources. (3) The
unused SMOKE column at position Q is used to store the NAICS code.
Table 8. Table Format for Control Packet Dataset Type
Line Position Description
1 A /CONTROL/
2+ A # Header entry. Header is indicated by use of “#” as the first character on the line.
3+ A Country/state/county code, or country/state code with blank for county, or zero
(or blank or -9) for all country/state/county or country/state codes
B 8- or 10-digit SCC, optional; blank, zero, or -9 if not an SCC-specific control
C Pollutant; blank, zero, or -9 if not a pollutant-specific control
D Primary control measure abbreviation; blank, zero, or -9 applies to all measure in
the Control Measure Database
E Control efficiency; value should be a percent (e.g., enter 90 for a 90% control

EMAQ LOE (EPA Contract EP-D-07-102) CoST PFYI Development Document
UNC-EMAQ(1-03)-008.v1 April 8, 2013 29
Line Position Description
efficiency)
F Rule effectiveness; value should be a percent (e.g., enter 50 for a 50% rule
effectiveness)
G Rule penetration rate; value should be a percent (e.g., enter 80 for a 80% rule
penetration)
H Standard Industrial Category (SIC); optional, blank, zero, or -9 if not an SIC-
specific control
I Maximum Achievable Control Technology (MACT) code; optional, blank, zero,
or -9 if not a MACT-specific control
J
Application control flag:
Y = control is applied to inventory
N = control will not be used
K
Replacement flag:
A = control is applied in addition to any controls already on source
R = control replaces any controls already on the source
L Plant ID for point sources; optional, blank, zero, or -9 if not specified; leave blank
for nonpoint inventories
M Point ID for point sources; optional, blank, zero, or -9 if not specified; leave blank
for nonpoint inventories
N Stack ID for point sources; optional, blank, zero, or -9 if not specified; leave blank
for nonpoint inventories
O Segment for point sources; optional, blank, zero, or -9 if not specified; leave blank
for nonpoint inventories
P
Compliance Date. The compliance date on which a control can be applied to
sources; prior to this date, the control will not be applied. A blank value is
assumed to mean that the control is within the compliance date and the sources
matched from this record will be controlled regardless. The strategy target year is
the year that is used in the control compliance cutoff date check. An EMF system-
level property (stored in the emf.properties table as
COST_PROJECT_FUTURE_YEAR_COMPLIANCE_DATE_CUTOFF_MONTHDAY) is used
to store the month and day (e.g., 10/01 for the first day of October) to be used in
the control compliance cutoff date check.
For example,
For a strategy with a target year of 2020 and compliance cutoff month/day EMF
property of 10/01, the control compliance cutoff date would be 10/01/2020. For a
control record with a compliance date of 07/01/2013, this will result in all
matching sources not being controlled:
Is compliance date blank/null OR compliance date (07/01/2013) > ’compliance
cutoff month/day’/’strategy target year’ true?
07/01/2013 > 10/01/2020 This is false, so these sources would not be
controlled
EMAQ LOE (EPA Contract EP-D-07-102) CoST PFYI Development Document
UNC-EMAQ(1-03)-008.v1 April 8, 2013 30
Line Position Description
For a control record with a blank compliance date, this will result in all matching
sources being controlled:
Is compliance date blank/null OR compliance date > 10/01/2020 true?
The compliance date is blank This is true, so these matching sources would
be controlled
For a control record with a compliance date of 11/15/2020, this will result in all
matching sources being controlled:
Is compliance date blank/null OR compliance date (11/15/2020) > 10/01/2020
true?
11/15/2020 > 10/01/2020 This is true, so these matching sources would be
controlled
Q North American Industry Classification (NAICS) Code, optional, blank, zero, or -
9 if not a NAICS-specific control
4 A /END/
The format of the Control Program “Control Packet Extended” (Table 9) is not based on the
SMOKE format. It is based on the EMF Flexible File Format, which is based on the CSV-based
format. This new format uses column names that are aligned with the Flat File 2010 dataset
types in the EMF system. The format also contains additional columns that will be used in the
future to help further enhance the inventory source matching capabilities: COUNTRY_CD,
TRIBAL_CODE, CENSUS_TRACT_CD, and SHAPE_ID, and EMIS_TYPE.
Table 9. Table Format for Control Packet Extended Dataset Type
Column Description
Country_cd Country code, optional; currently not used in matching process
Region_cd State/county code, or state code with blank for county, or zero (or blank or
-9) for all state/county or state codes
Facility_id Facility ID (aka Plant ID in ORL format) for point sources, optional; blank,
zero, or -9 if not specified; leave blank for nonpoint inventories
Unit_id Unit ID (aka Point ID for ORL format) for point sources, optional; blank,
zero, or -9 if not specified; leave blank for nonpoint inventories
Rel_point_id Release Point ID (aka Stack ID in ORL format) for point sources, optional;
blank, zero, or -9 if not specified; leave blank for nonpoint inventories
Process_id Process ID (aka Segment on ORL format) for point sources, optional; blank,
zero, or -9 if not specified; leave blank for nonpoint inventories
Tribal_code Tribal code, optional; currently not used in matching process
Census_tract_id Census tract ID, optional; currently not used in matching process
Shape_id Shape ID, optional; currently not used in matching process

EMAQ LOE (EPA Contract EP-D-07-102) CoST PFYI Development Document
UNC-EMAQ(1-03)-008.v1 April 8, 2013 31
Column Description
Emis_type Emission type, optional; currently not used in matching process
Scc 8- or 10-digit SCC, optional; blank, zero, or -9 if not an SCC-specific
control
Poll Pollutant;, blank, zero, or -9 if not a pollutant-specific control
Reg_code Regulatory code (aka Maximum Achievable Control Technology code),
optional; blank, zero, or -9 if not a regulatory code-specific control
Sic Standard Industrial Category (SIC), optional; blank, zero, or -9 if not an
SIC-specific control
Naics North American Industry Classification (NAICS) code, optional; blank,
zero, or -9 if not a NAICS-specific control
Compliance_Date
Compliance Date. The compliance date on which a control can be applied to
sources; prior to this date, the control will not be applied. A blank value is
assumed to mean that the control is within the compliance date and the
sources matched from this record will be controlled regardless. The strategy
target year is the year used in the control compliance cutoff date check. An
EMF system-level property (stored in the emf.properties table as
COST_PROJECT_FUTURE_YEAR_COMPLIANCE_DATE_CUTOFF_MONTHDAY)
is used to store the month and day (e.g., 10/01 for the first day of October) to
be used in the control compliance cutoff date check.
For example,
For a strategy with a target year of 2020 and compliance cutoff month/day
EMF property of 10/01, the control compliance cutoff date would be
10/01/2020. For a control record with a compliance date of 07/01/2013, this
will result in all matching sources not being controlled:
Is compliance date blank/null OR compliance date (07/01/2013) >
’compliance cutoff month/day’/’strategy target year’ true?
07/01/2013 > 10/01/2020 This is false, so these sources would not be
controlled
For a control record with a blank compliance date, this will result in all
matching sources being controlled:
Is compliance date blank/null OR compliance date > 10/01/2020 true?
The compliance date is blank This is true, so these matching sources
would be controlled
For a control record with a compliance date of 11/15/2020, this will result in
all matching sources being controlled:
Is compliance date blank/null OR compliance date (11/15/2020) >
10/01/2020 true?
11/15/2020 > 10/01/2020 This is true, so these matching sources

EMAQ LOE (EPA Contract EP-D-07-102) CoST PFYI Development Document
UNC-EMAQ(1-03)-008.v1 April 8, 2013 32
Column Description
would be controlled
Application_control
Application control flag:
Y = control is applied to inventory
N = control will not be used
Replacement
Replacement flag:
A = control is applied in addition to any controls already on source
R = control replaces any controls already on the source
Pri_cm_abbrev Primary control measure abbreviation (from the Control Measure Database)
that defines the control packet record
Ann_pctred
The percent reduction of the control (value should be a percent; e.g., enter
90 for a 90% percent reduction) to apply to the annual emission factor; the
percent reduction can be considered a combination of the control efficiency,
rule effectiveness, and rule penetration (CE * RE/100 * RP/100).
The annual percent reduction field is used to reduce annual emission of the
inventory (the ann_value column of the FF10 inventory formats contains the
annual emission value).
The annual percent reduction is also used as a default for monthly-specific
percent reductions when they are not specified. If you do not want to
specify a monthly-specific projection factor value, then also make sure not
to specify an annual projection factor, which could be used as a default.
Jan_pctred
The percent reduction of the control to apply to the monthly January
emission factor (the jan_value column of the FF10 inventory).
If no January percent reduction is specified, the annual percent reduction
value will be used as a default.
The monthly-specific percent reduction fields are not used on the older ORL
inventory formats; only the annual percent reduction field will be used on
these older formats.
Feb_pctred Analogous to the January percent reduction, above.
… …
Dec_pctred
The percent reduction of the control to apply to the monthly December
emission factor (the dec_value column of the FF10 inventory).
If no December percent reduction is specified, the annual percent reduction
value will be used as a default.
The monthly-specific percent reduction fields are not used on the older ORL
inventory formats; only the annual percent reduction field will be used on
these older formats.
Comment Information about this record and how it was produced and entered by the
user.

EMAQ LOE (EPA Contract EP-D-07-102) CoST PFYI Development Document
UNC-EMAQ(1-03)-008.v1 April 8, 2013 33
The format of the Control Program Allowable Packet (Table 10) is based on the SMOKE format
as defined in the SMOKE user’s manual. Two modifications were made to enhance this packet’s
use in CoST. (1) The unused SMOKE column at position L is now used to store the compliance
date that the cap or replacement emission value can be applied to a source. (2) The unused
SMOKE column at position M is used to store the NAICS code.
Table 10. Table Format for Control Program Allowable Packet
Line Position Description
1 A /ALLOWABLE/
2+ A # Header entry. Header is indicated by use of “#” as the first character on the line.
3+ A Country/state/county code, or country/state code with blank for county, or zero
(or blank or -9) for all country/state/county or country/state codes
B 8- or 10-digit SCC, optional; blank, zero, or -9 if not an SCC-specific cap or
replacement
C
Pollutant;, blank, zero, or -9 if not a pollutant-specific control; in most cases, the
cap or replacement value will be a pollutant-specific value, and that pollutant’s
name needs to be placed in this column
D Control factor (no longer used by SMOKE or CoST; enter -9 as placeholder)
E Allowable emissions cap value (tons/day) (required if no “replace” emissions are
given)
F Allowable emissions replacement value (tons/day) (required if no “cap” emissions
are given)
G Standard Industrial Category (SIC); optional, blank, zero, or -9 if not an SIC-
specific cap or replacement
H Plant ID for point sources, optional; blank, zero, or -9 if not specified; leave blank
for nonpoint inventories
I Point ID for point sources, optional; blank, zero, or -9 if not specified, leave blank
for nonpoint inventories
J Stack ID for point sources, optional; blank, zero, or -9 if not specified, leave blank
for nonpoint inventories
K Segment for point sources, optional; blank, zero, or -9 if not specified, leave blank
for nonpoint inventories
L
Compliance Date. The compliance date on which a cap or replacement entry can
be applied to sources; prior to this date, the cap or replacement will not be applied.
A blank value is assumed to mean that the cap or replacement is within the
compliance date and is available for analysis.
The strategy target year is used to calculate the baseline comparison date to use in
the compliance date check. January 1st of the strategy target year will define this
baseline compliance date to use in the comparison check (i.e., target year = 2020
baseline compliance date is 1/1/2020).
In order for the compliance date to be met, the following must be true:
Packet compliance date ≥ 1/1/’strategy target year’

EMAQ LOE (EPA Contract EP-D-07-102) CoST PFYI Development Document
UNC-EMAQ(1-03)-008.v1 April 8, 2013 34
Line Position Description
For example:
For a strategy with a target year of 2020, the baseline compliance date would be
1/1/2020.
baseline compliance date = 1/1/’strategy target year’ = 1/1/2020
A packet compliance date of 5/1/2020 would pass the compliance check since
5/1/2020 >= 1/1/2020 is true.
A packet compliance date of 1/1/2018 would NOT pass the compliance check
since 1/1/2018 >= 1/1/2020 is false.
A blank compliance date assumes the entry is in compliance and is not subject to
the conditional check listed above
M North American Industry Classification (NAICS) Code, optional; blank, zero, or
-9 if not a NAICS-specific projection
4 A /END/
3.3 PFYI Inputs and Outputs
The PFYI strategy type assigns projection and control adjustment factors, applies add-on or
replacement control measures, and applies a cap or replacement to emissions sources in a
specified geographic region. If multiple inventories are specified as inputs to a Project Future
Year Inventory strategy, each inventory is processed separately and one Strategy Detailed Result
is generated per inventory. Control Programs are assigned to the strategy to drive the Project
Future Year Inventory strategy, as described in Section 8.2.
Note that almost all of the strategy parameters for the Project Future Year Inventory strategy
have the same meaning and act in the same way as they do for the Maximum Emissions
Reduction strategy (see Sections 2.2 and 2.3 of the CoST Development Document), such as cost
year, inventory filter, and county dataset. The user does not need to specify a target pollutant for
this strategy type. So, if a filter for the inventory is specified, only sources that meet the filter
will be considered for control.
Control Program Packet datasets are applied during the Project Future Year Inventory strategy
by the Control Programs that are assigned to the strategy. The Control Program contains a
packet dataset the will perform various actions on the sources in the emission inventory. The
packet dataset contains several key fields that can be used for matching to key source identifiers
in the emission inventory. Various combinations can be used when matching between the packet
entry and the source. The control packet source matching criteria are defined in Table 3. For
example, a control packet could be very specific, identifying a specific plant stack (i.e., fips,
plantid, pointid, stackid, and segment are filled in), or the packet could be as broad as specifying
all sources that are classified under a certain MACT code. The more specific the match, the
higher the ranking is; so, in the example just given, the plant-specific control packet entry would
outweigh the MACT-specific packet entry.

EMAQ LOE (EPA Contract EP-D-07-102) CoST PFYI Development Document
UNC-EMAQ(1-03)-008.v1 April 8, 2013 35
The Project Future Year Inventory strategy type uses only one constraint during the strategy run:
Minimum Percent Reduction Difference for Predicting Controls (%): This required
constraint is the minimum percent reduction for predicting the probable control measure
that could be applied to the source. The percent difference calculation is based on the
probable control measure percent reduction compared to the control percent reduction
specified in the control packet.
o = [(Control Measure Percent Reduction – Control Packet Percent Reduction) /
Control Measure Percent Reduction] x 100 ≤ Minimum Percent Reduction
Difference for Predicting Controls (%)
o Old Control Packet Format:
= {[(CM CEFF x CM RPEN x CM REFF) – (CP CEFF x CP RPEN x CP REFF)]
/ (CM CEFF x CM RPEN x CM REFF)} x 100 ≤ Minimum Percent Reduction
Difference for Predicting Controls (%)
o New Control Extended Packet Format:
= {[(CM CEFF x CM RPEN x CM REFF) – (CP PCTRED)] / (CM CEFF x CM
RPEN x CM REFF)} x 100 ≤ Minimum Percent Reduction Difference for
Predicting Controls (%)
The control measure with the smallest Percent Reduction Difference will be assigned as
the most probable measure by assigning the control measure abbreviation to the
cm_abbrev column in the Strategy Detailed Result.
If the pri_cm_abbrev is populated in the Control Packet, the Minimum Percent Reduction
Difference for Predicting Controls constraint is ignored, and the pri_cm_abbrev value is
used to fill in the cm_abbrev column in the Strategy Detailed Result.
The Project Future Year Inventory control strategy can assign to each source many Control
Program Packet records (e.g., plant closure, future-year projection, or applying an add-on control
measure). As noted earlier, this algorithm uses similar inputs to those described in Section 2 of
the CoST Development Document: summary parameters, input inventories, inventory filters, and
a constraint, but not measures. The algorithm also expects control programs as input. The
strategy produces the two standard types of strategy outputs described in Section 2.6: Strategy
Detailed Result for each input inventory and Strategy Messages for all input inventories.
The apply_order column of the Strategy Detailed Result defines what type of action the control
packet takes on the inventory source pollutant record. Table 11 contains a list of valid action
codes that will be stored in the apply_order column.

EMAQ LOE (EPA Contract EP-D-07-102) CoST PFYI Development Document
UNC-EMAQ(1-03)-008.v1 April 8, 2013 36
Table 11. Control Program Action Codes
Control
Program
Action Code
Control Program Action
Control
Program
Type
Control Program Packet
Dataset Types
0 Close plants, plants will be removed
from strategy controlled inventory
Plant
Closure
Plant Closure (CSV)
1 Project inventory source emissions Projection Projection Packet or
Projection Extended Packet
2 Apply add-on or replacement control
to inventory source emissions
Control Control Packet or
Control Extended Packet
3 Cap inventory source emissions Allowable Allowable Packet or
Allowable Extended Packet
4 Replace inventory source emissions Allowable Allowable Packet or
Allowable Extended Packet
The control_program column of the Strategy Detailed Result will contain the control program
name that created the source–control-packet pair. The cm_abbrev column will contain either the
type of Control Program Packet that was applied or, for Control Packets, it could contain the
predicted or specified control measure applied to the source.
For the source–projection-packet pairs, the cm_abbrev column will be set to
PROJECTION
For the source–plant closure-packet pairs, the cm_abbrev column will be set to
PLTCLOSURE.
For pairs of sources and control packets or of sources and allowable packets, the
cm_abbrev column will contain either the measure abbreviation specified via the control
packet pri_cm_abbrev column, or the probable measure abbreviation (if the constraint
discussed above was met), or it will be set to UNKNOWNMSR if no measure was found
in the CMDB (or if the constraint was not met).
3.4 PFYI Algorithm
This section provides an overview of the algorithm that matches sources with control measures
for a Project Future Year Inventory control strategy. Figure 2 diagrams the process that is used
when running this type of strategy. The steps in the source-measure matching algorithm for the
Project Future Year Inventory strategy are given below.
1. Process/read the emissions inventory
2. Use inventory filtering (discussed in Section 2.3) to filter the emissions inventory, then
compute uncontrolled emissions for later use
a. Filter by SQL WHERE Clause (based on contents of the Inventory Filter field), if any
b. Filter by the counties specified in the selected County Dataset, if any
c. Compute uncontrolled emissions for controlled sources using one of these formulas:
ORL Inventories:
EMAQ LOE (EPA Contract EP-D-07-102) CoST PFYI Development Document
UNC-EMAQ(1-03)-008.v1 April 8, 2013 37
unc_emis = ann emis / (1 - CE / 100 × RE / 100 × RP / 100)
unc_emis = avg day emis × days_in_month / (1 - CE / 100 × RE / 100 × RP / 100)
Flat File 2010 Inventories:
unc_emis = ann_value / (1 – ann_pct_red / 100)
unc_emis = jan_value / (1 – jan_pctred / 100)
+ feb_value / (1 – feb_pctred / 100)
…
+ nov_value / (1 – nov_pctred / 100)
+ dec_value / (1 – dec_pctred / 100)
3. Preprocess control program packets by cleaning all packet types (i.e., change -9, 0 (zero), and
blank (empty string) column values to null);. The following is a list of the columns that are
changed for each control packet:
a. Control Packet: plantid, pointid, stackid, segment, fips, scc, poll, mact, sic, naics,
pri_cm_abbrev
b. Control Extended Packet: facility_id, unit_id, rel_point_id, process_id, region_cd,
scc, poll, reg_code, sic, naics, pri_cm_abbrev
c. Projection Packet: plantid, pointid, stackid, segment, fips, scc, poll, mact, sic, naics
d. Projection Extended Packet: facility_id, unit_id, rel_point_id, process_id, region_cd,
scc, poll, reg_code, sic, naics
e. Allowable Packet: plantid, pointid, stackid, segment, fips, scc, poll, sic, naics
f. Allowable Extended Packet: facility_id, unit_id, rel_point_id, process_id, region_cd,
scc, poll, reg_code, sic, naics
g. Plant Closure Packet: plantid, pointid, stackid, segment, fips, effective_date
4. Perform a prerun process that validates the routine. This process evaluates the control
program packets for the presence of severe errors that would stop the core algorithm from
running. The following severe errors (shown as “Error” in the status column) will be logged in
the Strategy Messages Output and would stop the strategy run from proceeding:
a. Plant Closure Packets closure date is not in the correct format (it is stored as string, so
format could be incorrect)
b. There are duplicate packet-specific records. To check for this, like packets are merged
and then evaluated for duplicates. For example, all “Control packets (even extended
types)” will be unioned together and this resulting dataset is evaluated for duplicates.
The information stored in the Strategy Messages Output can be used to help identify and quality-
assure the packet records that have “Error” status. Once all “Error” issues are resolved, the
Project Strategy run should be able to complete successfully.
5. Match the Inventory Sources to Control Program Packets using the Control Packet Matching
Hierarchy (see Table 3). Merge like Control Program Types (i.e., all Control Program Control
Packets) to ensure that no duplicate source-control packet records are handled during the
analysis. Ensure Control Program start and end dates lie within the strategy Target Year; if so,
include in analysis. Process the Control Programs in the following order:
a. Plant Closure Type Control Program

EMAQ LOE (EPA Contract EP-D-07-102) CoST PFYI Development Document
UNC-EMAQ(1-03)-008.v1 April 8, 2013 38
b. Projection Type Control Program; uses the results from the Plant Closure Packet
analysis to ensure the closed sources are excluded from the analysis
c. Control Type Control Program; uses the results from the Plant Closure Packet and
Projection Packet analyses to ensure that the unclosed sources are projected before the
sources are controlled
d. Allowable Type Control Program; uses the results from the Plant Closure, Control,
and Projection Packet analyses to ensure that the unclosed sources are projected and/or
controlled before the sources have a cap or replacement applied
6. For Control Program Control Packet analysis only: Filter the Control Measures to consider
during the Control Program Control Packet analysis
a. By the selected Specific Control Measures as specified in the Control Program,
AND/OR
b. By the selected Specific Control Technologies as specified in the Control Program
7. For Control Program Control Packet analysis only: Predict Probable Measure for Inventory
Sources
a. Of the remaining measures, find the ones that apply to the SCC of the source (as
specified by the SCCs listed as applicable to each measure)
b. Match on FIPS (data could be available at the National, State, or County level)
c. Match on Inventory Pollutant
d. Match on Measure Effective Date (the target year must be equal to or later than the
effective date for the measure to be included)
e. Match on measure’s Minimum and Maximum Emissions (inventory source must have
greater than or equal to the minimum emissions and less than the maximum
emissions)
8. For Control Program Control Packet analysis only: Evaluate Minimum Percent Reduction
Difference for Predicting Controls Constraint while the source is being matched with Control
Program Control Packet. This Constraint calculation is dependent on both the inventory source
and the Control Packet. The Minimum Percent Reduction Difference constraint is used to help
predict when a measure is the most likely to match the control specified in the Control Packet.
9. For Control Program Control Packet analysis only: If multiple measures are available for a
source, then the best measure is chosen according to the following criteria:
a. Closest Locale (matching both FIPS state and county is best, then FIPS-state, followed
by national)
b. Closest Percent Reduction (choose the measure that has the minimum percent
reduction difference between the Control Packet specified percent reduction and the
measures efficiency record percent reduction).
c. Cheapest annual cost
10. Perform a postrun process that looks for unused control programs, packet records that were
not used in all inventories, and packet records that were not used at all during the analysis. This
information will be logged as a “Warning” in the Strategy Messages Output. The information
stored in this output can be used to help identify and quality-assure the packet records that have
problems.

EMAQ LOE (EPA Contract EP-D-07-102) CoST PFYI Development Document
UNC-EMAQ(1-03)-008.v1 April 8, 2013 39
11. Compute the Strategy Detailed Result to include the source–control-packet pairs obtained
from the algorithms shown in 5, 6, 7, 8, and 9.
12. After completing the computation of Strategy Detailed Results for all input inventories,
prepare the summary outputs (described in Section 2.6) along with any controlled inventories
upon user request.

EMAQ LOE (EPA Contract EP-D-07-102) Control Strategy Tool (CoST) Project Future
Year Inventory Development Document
UNC-EMAQ(1-03)-008.v1 April 8, 2013 40
Core Algorithm
All sources in Emissions Inventory
Filter Inventory:
Inventory Filter (SQL)
County Filter
Filtered Emissions Inventory
Filter Control Program Control
Measures by:
Specific control measures or by
Specific control technologies
All Control Measures
Strategy Detailed Result:
Emission-source–control-packet pairings and related computed values (e.g., emissions reduction, projected
emissions, capped emissions, cost)
Controlled Emissions Inventory
Predict Probable Measure for
Source based on:
SCC FIPS
Inventory Pollutant
Measure Effective Date Min and Max Emissions
Create Controlled Inventory by
merging with starting inventory
Process next inventory
Choose Best Measures for
Sources with Multiple
Measures based on:
Closest Locale
Closest Percent Reduction
Cheapest Annual Cost
Filtered Control Measures
Match Inventory Sources to
Control Packets using
Matching Hierarchy
Match Inventory Sources to
Projection Packets using
Matching Hierarchy
Match Inventory Sources to
Allowable Packets using
Matching Hierarchy
Match Inventory Sources to
Plant Closure Packets using
Matching Hierarchy
Cleaned Control Program Packets
Clean Control Program
Packets
All Control Programs
Prerun Validation
Validate Plant Closure format
(date is in correct format) Merge like packets and verify no
duplicate records present
Strategy Messages Result:
List of duplicate packet records List of unused packets
List of packet records that were not used
Postrun Validation
Find unused control programs Find packet records that were not
used
Eliminate Control Measures: Measure percent reduction needs to
be within prediction percent
reduction
Figure 2. The Process for Running Project Future Year Inventory Control Strategy

EMAQ LOE (EPA Contract EP-D-07-102) Control Strategy Tool (CoST) Project Future
Year Inventory Development Document
UNC-EMAQ(1-03)-008.v1 41 April 8, 2013
3.5 PFYI Strategy Example
In Section 2.1 there was a brief description of how the PFYI strategy algorithm works. The
current section provides much more detail using a specific example, including what the inputs to
the strategy are, what the source–measure pairings are, and what the outputs look like. Note that
in this and the following sections describing the strategy algorithms, only the inputs that actually
affect the results are included; ones that are just informational may be left out (e.g., Project,
Region). This example incorporates as many use-case scenarios as possible that a user might
encounter when using this process: annual-only emissions, annual- and monthly-based
emissions, and monthly-only emissions.
Strategy Inputs:
Name: Project Future Year Strategy Sample
Type of Analysis: Project Future Year Inventory
Cost Year: 2006
Target Year: 2017
Discount Rate: 7%
Use Cost Equations: Yes
Inventories: Flat File 2010 Point Dataset, ptinv_ptnonipm_2008, version 1
Programs:
Plant Closure Packet Sample
Control Packet Sample
Projection Packet Sample
Minimum Percent Reduction Difference for Predicting Controls (%): 10%
Table 12 shows the inventory sources to be used in this example. It was created based on data
from an ORL point EMF dataset. The information in the brackets for the Source column helps
define the key structure for a source.
Table 13 contains the data for the sample Plant Closure packet.
Table 14 contains the data for the sample Projection packet.
Table 15 contains the data for the sample Control packet.
Table 16(a+b) contains detailed data from the Detailed Result output that is created during the
projection process. Table 16b is just a continuation of Table 16a. The Detailed Result contains
many table columns and only a subset of the important columns is reported in these tables. The
comments column from these two tables contains information that will identify key steps as
related to that inventory source-control program pairing projection matching process.
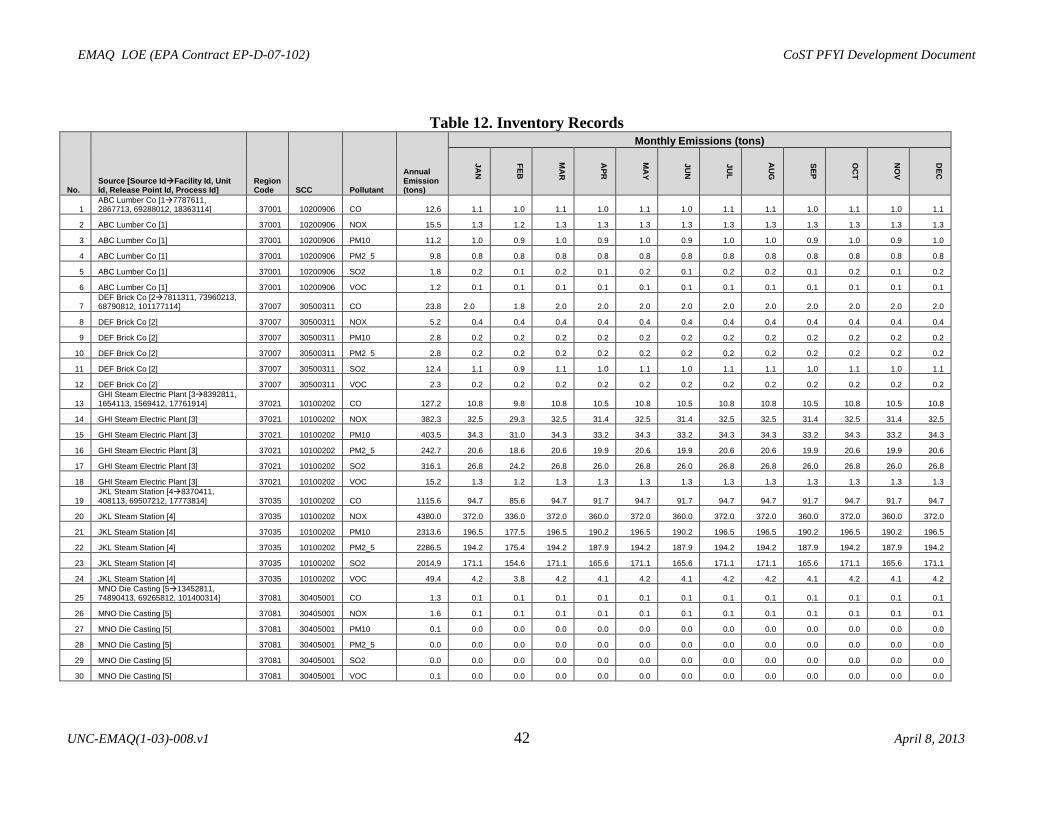
EMAQ LOE (EPA Contract EP-D-07-102) CoST PFYI Development Document
UNC-EMAQ(1-03)-008.v1 42 April 8, 2013
Table 12. Inventory Records
No. Source [Source IdFacility Id, Unit Id, Release Point Id, Process Id]
Region Code SCC Pollutant
Annual Emission (tons)
Monthly Emissions (tons)
JA
N
FE
B
MA
R
AP
R
MA
Y
JU
N
JU
L
AU
G
SE
P
OC
T
NO
V
DE
C
1 ABC Lumber Co [17787611, 2867713, 69288012, 18363114] 37001 10200906 CO 12.6 1.1 1.0 1.1 1.0 1.1 1.0 1.1 1.1 1.0 1.1 1.0 1.1
2 ABC Lumber Co [1] 37001 10200906 NOX 15.5 1.3 1.2 1.3 1.3 1.3 1.3 1.3 1.3 1.3 1.3 1.3 1.3
3 ABC Lumber Co [1] 37001 10200906 PM10 11.2 1.0 0.9 1.0 0.9 1.0 0.9 1.0 1.0 0.9 1.0 0.9 1.0
4 ABC Lumber Co [1] 37001 10200906 PM2_5 9.8 0.8 0.8 0.8 0.8 0.8 0.8 0.8 0.8 0.8 0.8 0.8 0.8
5 ABC Lumber Co [1] 37001 10200906 SO2 1.8 0.2 0.1 0.2 0.1 0.2 0.1 0.2 0.2 0.1 0.2 0.1 0.2
6 ABC Lumber Co [1] 37001 10200906 VOC 1.2 0.1 0.1 0.1 0.1 0.1 0.1 0.1 0.1 0.1 0.1 0.1 0.1
7 DEF Brick Co [27811311, 73960213, 68790812, 101177114] 37007 30500311 CO 23.8 2.0 1.8 2.0 2.0 2.0 2.0 2.0 2.0 2.0 2.0 2.0 2.0
8 DEF Brick Co [2] 37007 30500311 NOX 5.2 0.4 0.4 0.4 0.4 0.4 0.4 0.4 0.4 0.4 0.4 0.4 0.4
9 DEF Brick Co [2] 37007 30500311 PM10 2.8 0.2 0.2 0.2 0.2 0.2 0.2 0.2 0.2 0.2 0.2 0.2 0.2
10 DEF Brick Co [2] 37007 30500311 PM2_5 2.8 0.2 0.2 0.2 0.2 0.2 0.2 0.2 0.2 0.2 0.2 0.2 0.2
11 DEF Brick Co [2] 37007 30500311 SO2 12.4 1.1 0.9 1.1 1.0 1.1 1.0 1.1 1.1 1.0 1.1 1.0 1.1
12 DEF Brick Co [2] 37007 30500311 VOC 2.3 0.2 0.2 0.2 0.2 0.2 0.2 0.2 0.2 0.2 0.2 0.2 0.2
13 GHI Steam Electric Plant [38392811, 1654113, 1569412, 17761914] 37021 10100202 CO 127.2 10.8 9.8 10.8 10.5 10.8 10.5 10.8 10.8 10.5 10.8 10.5 10.8
14 GHI Steam Electric Plant [3] 37021 10100202 NOX 382.3 32.5 29.3 32.5 31.4 32.5 31.4 32.5 32.5 31.4 32.5 31.4 32.5
15 GHI Steam Electric Plant [3] 37021 10100202 PM10 403.5 34.3 31.0 34.3 33.2 34.3 33.2 34.3 34.3 33.2 34.3 33.2 34.3
16 GHI Steam Electric Plant [3] 37021 10100202 PM2_5 242.7 20.6 18.6 20.6 19.9 20.6 19.9 20.6 20.6 19.9 20.6 19.9 20.6
17 GHI Steam Electric Plant [3] 37021 10100202 SO2 316.1 26.8 24.2 26.8 26.0 26.8 26.0 26.8 26.8 26.0 26.8 26.0 26.8
18 GHI Steam Electric Plant [3] 37021 10100202 VOC 15.2 1.3 1.2 1.3 1.3 1.3 1.3 1.3 1.3 1.3 1.3 1.3 1.3
19 JKL Steam Station [48370411, 408113, 69507212, 17773814] 37035 10100202 CO 1115.6 94.7 85.6 94.7 91.7 94.7 91.7 94.7 94.7 91.7 94.7 91.7 94.7
20 JKL Steam Station [4] 37035 10100202 NOX 4380.0 372.0 336.0 372.0 360.0 372.0 360.0 372.0 372.0 360.0 372.0 360.0 372.0
21 JKL Steam Station [4] 37035 10100202 PM10 2313.6 196.5 177.5 196.5 190.2 196.5 190.2 196.5 196.5 190.2 196.5 190.2 196.5
22 JKL Steam Station [4] 37035 10100202 PM2_5 2286.5 194.2 175.4 194.2 187.9 194.2 187.9 194.2 194.2 187.9 194.2 187.9 194.2
23 JKL Steam Station [4] 37035 10100202 SO2 2014.9 171.1 154.6 171.1 165.6 171.1 165.6 171.1 171.1 165.6 171.1 165.6 171.1
24 JKL Steam Station [4] 37035 10100202 VOC 49.4 4.2 3.8 4.2 4.1 4.2 4.1 4.2 4.2 4.1 4.2 4.1 4.2
25 MNO Die Casting [513452811, 74890413, 69265812, 101400314] 37081 30405001 CO 1.3 0.1 0.1 0.1 0.1 0.1 0.1 0.1 0.1 0.1 0.1 0.1 0.1
26 MNO Die Casting [5] 37081 30405001 NOX 1.6 0.1 0.1 0.1 0.1 0.1 0.1 0.1 0.1 0.1 0.1 0.1 0.1
27 MNO Die Casting [5] 37081 30405001 PM10 0.1 0.0 0.0 0.0 0.0 0.0 0.0 0.0 0.0 0.0 0.0 0.0 0.0
28 MNO Die Casting [5] 37081 30405001 PM2_5 0.0 0.0 0.0 0.0 0.0 0.0 0.0 0.0 0.0 0.0 0.0 0.0 0.0
29 MNO Die Casting [5] 37081 30405001 SO2 0.0 0.0 0.0 0.0 0.0 0.0 0.0 0.0 0.0 0.0 0.0 0.0 0.0
30 MNO Die Casting [5] 37081 30405001 VOC 0.1 0.0 0.0 0.0 0.0 0.0 0.0 0.0 0.0 0.0 0.0 0.0 0.0
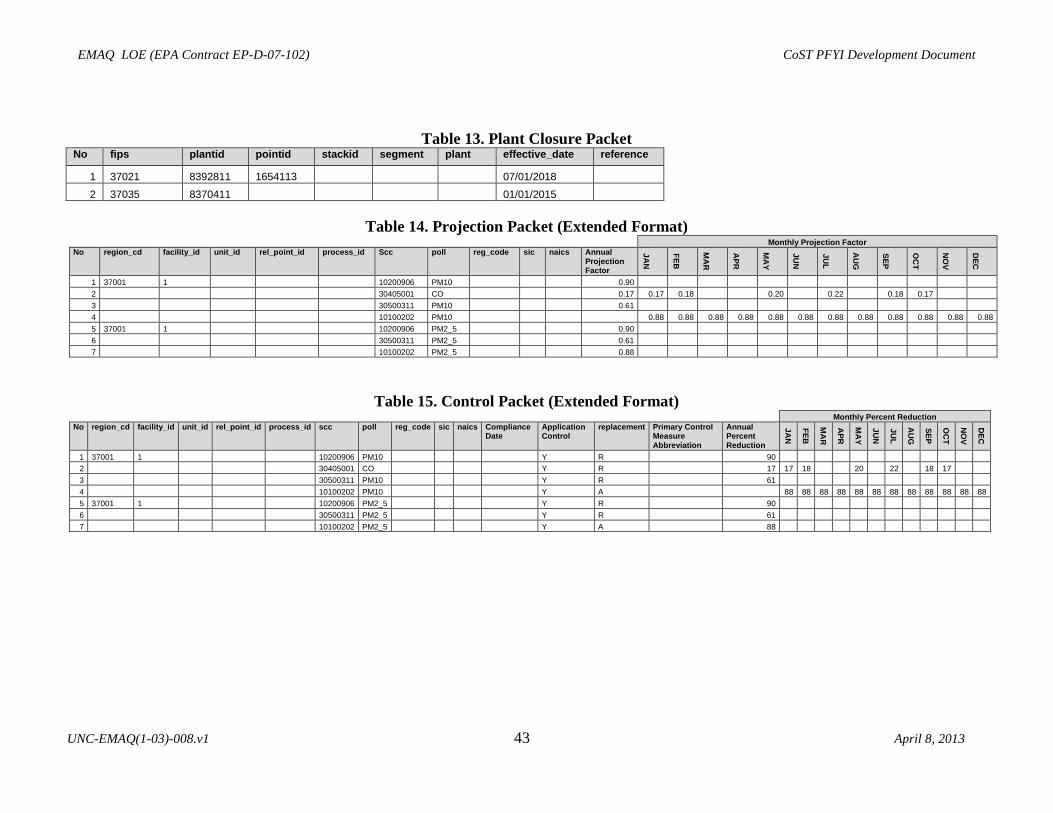
EMAQ LOE (EPA Contract EP-D-07-102) CoST PFYI Development Document
UNC-EMAQ(1-03)-008.v1 43 April 8, 2013
Table 13. Plant Closure Packet No fips plantid pointid stackid segment plant effective_date reference
1 37021 8392811 1654113
07/01/2018
2 37035 8370411
01/01/2015
Table 14. Projection Packet (Extended Format)
Monthly Projection Factor
No region_cd facility_id unit_id rel_point_id process_id Scc poll reg_code sic naics Annual Projection Factor
JA
N
FE
B
MA
R
AP
R
MA
Y
JU
N
JU
L
AU
G
SE
P
OC
T
NO
V
DE
C
1 37001 1
10200906 PM10
0.90 2
30405001 CO
0.17 0.17 0.18
0.20
0.22
0.18 0.17
3
30500311 PM10
0.61 4
10100202 PM10
0.88 0.88 0.88 0.88 0.88 0.88 0.88 0.88 0.88 0.88 0.88 0.88
5 37001 1
10200906 PM2_5
0.90 6
30500311 PM2_5
0.61
7
10100202 PM2_5
0.88
Table 15. Control Packet (Extended Format)
Monthly Percent Reduction
No region_cd facility_id unit_id rel_point_id process_id scc poll reg_code sic naics Compliance Date
Application Control
replacement Primary Control Measure Abbreviation
Annual Percent Reduction
JA
N
FE
B
MA
R
AP
R
MA
Y
JU
N
JU
L
AU
G
SE
P
OC
T
NO
V
DE
C
1 37001 1
10200906 PM10
Y R
90 2
30405001 CO
Y R
17 17 18
20
22
18 17
3
30500311 PM10
Y R
61 4
10100202 PM10
Y A
88 88 88 88 88 88 88 88 88 88 88 88
5 37001 1
10200906 PM2_5
Y R
90 6
30500311 PM2_5
Y R
61
7
10100202 PM2_5
Y A
88

EMAQ LOE (EPA Contract EP-D-07-102) CoST PFYI Development Document
UNC-EMAQ(1-03)-008.v1 44 April 8, 2013
Table 16. Detailed Result Records (first part of table) Source [Source Id=Facility Id, Unit Id, Release Point Id, Process Id, Region Cd, Scc, Pollutant]
CM Abbrev Apply Order or Action Code
Control Efficiency
Percent Reduction
Replacement Addon
Adjustment Factor
Final Emissions
Emission Reduction
Inventory Emissions
Comments
JKL Steam Station [8370411, 408113, 69507212, 17773814, 37035, 10100202, CO]
PLTCLOSURE 0 0.00 1115.60 1115.60 The apply order, 0, indicates a "Plant Closure" packet has been applied. The Plant Closure packet record No. 2 from Table 13 was applied by matching on fips, plantid, and effective date.
JKL Steam Station [8370411, 408113, 69507212, 17773814, 37035, 10100202, NOX]
PLTCLOSURE 0 0.00 4380.00 4380.00 The Plant Closure packet record No. 2 from Table 13 was applied by matching on fips, plantid, and effective date. Note how the Final Emission is zero indicating the plant generates zero emissions.
JKL Steam Station [8370411, 408113, 69507212, 17773814, 37035, 10100202, PM10]
PLTCLOSURE 0 0.00 2313.60 2313.60 The Plant Closure packet record No. 2 from Table 13 was applied by matching on fips, plantid, and effective date. Note how the Emission Reduction column has the same value as in the Inventory Emissions showing full emission reduction.
MNO Die Casting [13452811, 74890413, 69265812, 101400314, 37081, 30405001, CO]
PROJECTION 1 0.18 0.23 1.07 1.30 The apply order, 1, indicates a "Projection" packet has been applied. The Projection packet record No. 2 from Table 14 was applied by matching on scc and pollutant. Note how the adjustment factor is only being used for "Projection" packets. The projection factor is fraction and not percentage based.
GHI Steam Electric Plant [8392811, 1654113, 1569412, 17761914, 37021, 10100202, PM2_5]
PROJECTION 1 0.88 213.57 29.12 242.69 The Projection packet record No. 7 from Table 14 was applied by matching on scc and pollutant. Here are the projection calculations for an annual based source: Final Emission = Inventory Emission x Projection Factor = 242.69 x 0.88 = 213.57 Emission Reduction = Inventory Emission - Final Emission = 242.69 - 213.57 = 29.12
GHI Steam Electric Plant [8392811, 1654113, 1569412, 17761914, 37021, 10100202, PM10]
PROJECTION 1 0.88 355.05 48.42 403.47 The Projection packet record No. 4 from Table 14 was applied by matching on scc and pollutant. Here are the projection calculations for a monthly based source: Final Emission = Jan Inv Emis x Jan Projection Factor + Feb Inv Emis x Feb Projection Factor + ... + Dec Inv Emis x Dec Projection Factor = 34.3 x 0.88 + 31.0 x 0.88 + ... + 34.3 x 0.88 = 355.05 Emission Reduction = Inventory Emission - Final Emission = (Jan Inv Emis + Feb Inv Emis + ... + Dec Inv Emis) - Final Emission = (34.3 + 31.0 + ... + 34.3) - 355.05 = 48.42
DEF Brick Co [7811311, 73960213, 68790812, 101177114, 37007, 30500311, PM2_5]
PROJECTION 1 0.61 1.73 1.11 2.84 The Projection packet record No. 6 from Table 14 was applied by matching on scc and pollutant.
DEF Brick Co [7811311, 73960213, 68790812, 101177114, 37007, 30500311, PM10]
PROJECTION 1 0.61 1.73 1.11 2.84 The Projection packet record No. 3 from Table 14 was applied by matching on scc and pollutant.
DEF Brick Co [7811311, 73960213, 68790812, 101177114, 37007, 30500311, PM10]
UNKNOWNMSR 2 61.0 61.0 R 0.68 1.06 1.73 The apply order, 2, indicates a "Control" packet has been applied. The Control packet record No. 3 from Table 15 was applied by matching on scc and pollutant. Note how the control efficiency and percent reduction are being used but the adjustment factor is not being used. Also these fields are percentage and not fraction based. The Replacement Addon field is set to R, indicating a replacement control will be applied and not an Addon control. Since, this source was projected in the previous table row, the emission to be controlled will be based on the projected emissions. Note how the emissions, 1.73 tons, comes from the Final Emissions field during the projection process
DEF Brick Co [7811311, 73960213, 68790812, 101177114, 37007, 30500311, PM2_5]
UNKNOWNMSR 2 61.0 61.0 R 0.68 1.06 1.73 The Control packet record No. 6 from Table 15 was applied by matching on scc and pollutant. Here are "Replacement" control calculations for an annual based source: Emission Reduction = Uncontrolled Inv Emission – [Uncontrolled Inv Emission x (1 – Percent Reduction/100)] = 1.73 - (1.73 x (1 - 61/100)) = 1.06 where the Uncontrolled Inv Emission is calculating by “backing out” existing controls as specified in the inventory control efficiency field. Final Emission = Inventory Emission - Emis Red = 1.73 - 1.06 = 0.68

EMAQ LOE (EPA Contract EP-D-07-102) CoST PFYI Development Document
UNC-EMAQ(1-03)-008.v1 45 April 8, 2013
Source [Source Id=Facility Id, Unit Id, Release Point Id, Process Id, Region Cd, Scc, Pollutant]
CM Abbrev Apply Order or Action Code
Control Efficiency
Percent Reduction
Replacement Addon
Adjustment Factor
Final Emissions
Emission Reduction
Inventory Emissions
Comments
GHI Steam Electric Plant [8392811, 1654113, 1569412, 17761914, 37021, 10100202, PM10]
UNKNOWNMSR 2 88.0 88.0 A 42.61 312.45 355.05 The Control packet record No. 4 from Table 15 was applied by matching on scc and pollutant. Here are"”Addon” control calculations for a monthly based source: Emission Reduction = Jan Inv Emission x Jan Percent Reduction/100 + Feb Inv Emission x Feb Percent Reduction/100 + ... + Dec Inv Emission x Dec Percent Reduction/100 where existing controls are NOT “backed out” the control is assumed to add on to the existing control Final Emission = (Jan Inv Emis + Feb Inv Emis + .... + Dec Inv Emis) - Emission Reduction
Table 17. Detailed Result Records (continuation of
Table 13. Plant Closure Packet No fips plantid pointid stackid segment plant effective_date reference
1 37021 8392811 1654113
07/01/2018
2 37035 8370411
01/01/2015
Table 14. Projection Packet (Extended Format)
Monthly Projection Factor
No region_cd facility_id unit_id rel_point_id process_id Scc poll reg_code sic naics Annual Projection Factor
JA
N
FE
B
MA
R
AP
R
MA
Y
JU
N
JU
L
AU
G
SE
P
OC
T
NO
V
DE
C
1 37001 1
10200906 PM10
0.90 2
30405001 CO
0.17 0.17 0.18
0.20
0.22
0.18 0.17
3
30500311 PM10
0.61 4
10100202 PM10
0.88 0.88 0.88 0.88 0.88 0.88 0.88 0.88 0.88 0.88 0.88 0.88
5 37001 1
10200906 PM2_5
0.90 6
30500311 PM2_5
0.61
7
10100202 PM2_5
0.88
Table 15. Control Packet (Extended Format)
Monthly Percent Reduction
No region_cd facility_id unit_id rel_point_id process_id scc poll reg_code sic naics Compliance Date
Application Control
replacement Primary Control Measure Abbreviation
Annual Percent Reduction
JA
N
FE
B
MA
R
AP
R
MA
Y
JU
N
JU
L
AU
G
SE
P
OC
T
NO
V
DE
C
1 37001 1
10200906 PM10
Y R
90 2
30405001 CO
Y R
17 17 18
20
22
18 17
3
30500311 PM10
Y R
61 4
10100202 PM10
Y A
88 88 88 88 88 88 88 88 88 88 88 88
5 37001 1
10200906 PM2_5
Y R
90 6
30500311 PM2_5
Y R
61
7
10100202 PM2_5
Y A
88
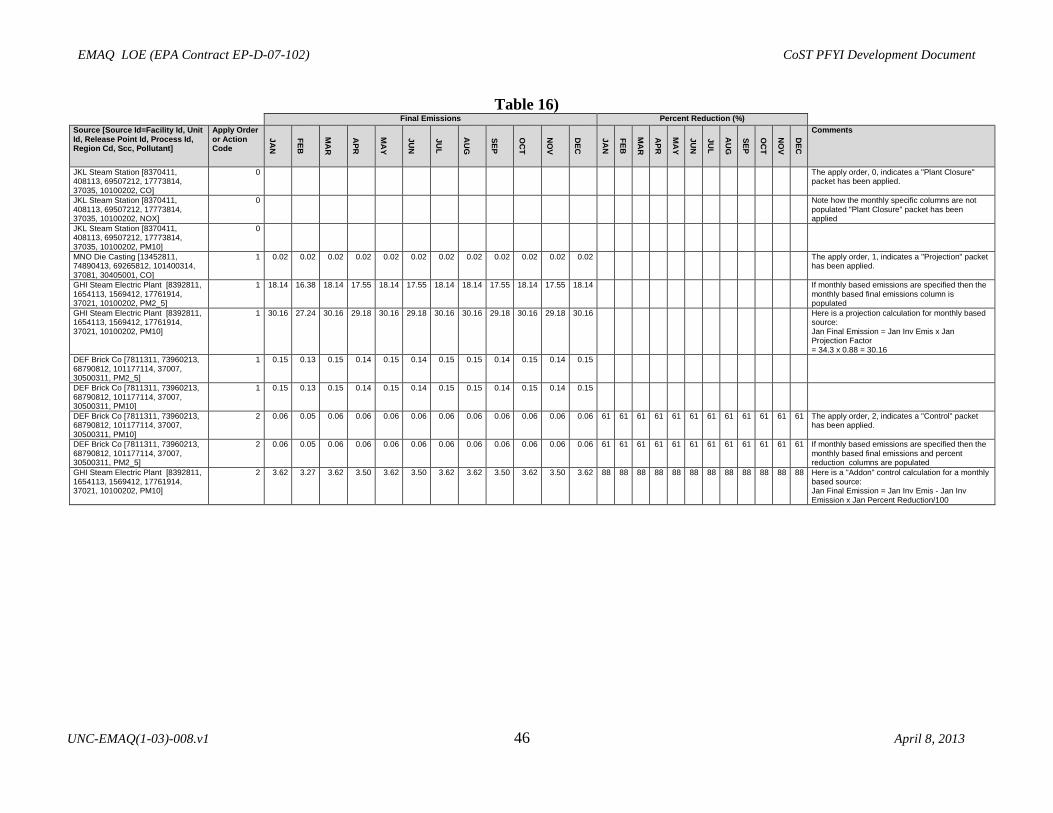
EMAQ LOE (EPA Contract EP-D-07-102) CoST PFYI Development Document
UNC-EMAQ(1-03)-008.v1 46 April 8, 2013
Table 16) Final Emissions Percent Reduction (%)
Source [Source Id=Facility Id, Unit Id, Release Point Id, Process Id, Region Cd, Scc, Pollutant]
Apply Order or Action Code
JA
N
FE
B
MA
R
AP
R
MA
Y
JU
N
JU
L
AU
G
SE
P
OC
T
NO
V
DE
C
JA
N
FE
B
MA
R
AP
R
MA
Y
JU
N
JU
L
AU
G
SE
P
OC
T
NO
V
DE
C
Comments
JKL Steam Station [8370411, 408113, 69507212, 17773814, 37035, 10100202, CO]
0 The apply order, 0, indicates a "Plant Closure" packet has been applied.
JKL Steam Station [8370411, 408113, 69507212, 17773814, 37035, 10100202, NOX]
0 Note how the monthly specific columns are not populated "Plant Closure" packet has been applied
JKL Steam Station [8370411, 408113, 69507212, 17773814, 37035, 10100202, PM10]
0
MNO Die Casting [13452811, 74890413, 69265812, 101400314, 37081, 30405001, CO]
1 0.02 0.02 0.02 0.02 0.02 0.02 0.02 0.02 0.02 0.02 0.02 0.02 The apply order, 1, indicates a "Projection" packet has been applied.
GHI Steam Electric Plant [8392811, 1654113, 1569412, 17761914, 37021, 10100202, PM2_5]
1 18.14 16.38 18.14 17.55 18.14 17.55 18.14 18.14 17.55 18.14 17.55 18.14 If monthly based emissions are specified then the monthly based final emissions column is populated
GHI Steam Electric Plant [8392811, 1654113, 1569412, 17761914, 37021, 10100202, PM10]
1 30.16 27.24 30.16 29.18 30.16 29.18 30.16 30.16 29.18 30.16 29.18 30.16 Here is a projection calculation for monthly based source: Jan Final Emission = Jan Inv Emis x Jan Projection Factor = 34.3 x 0.88 = 30.16
DEF Brick Co [7811311, 73960213, 68790812, 101177114, 37007, 30500311, PM2_5]
1 0.15 0.13 0.15 0.14 0.15 0.14 0.15 0.15 0.14 0.15 0.14 0.15
DEF Brick Co [7811311, 73960213, 68790812, 101177114, 37007, 30500311, PM10]
1 0.15 0.13 0.15 0.14 0.15 0.14 0.15 0.15 0.14 0.15 0.14 0.15
DEF Brick Co [7811311, 73960213, 68790812, 101177114, 37007, 30500311, PM10]
2 0.06 0.05 0.06 0.06 0.06 0.06 0.06 0.06 0.06 0.06 0.06 0.06 61 61 61 61 61 61 61 61 61 61 61 61 The apply order, 2, indicates a "Control" packet has been applied.
DEF Brick Co [7811311, 73960213, 68790812, 101177114, 37007, 30500311, PM2_5]
2 0.06 0.05 0.06 0.06 0.06 0.06 0.06 0.06 0.06 0.06 0.06 0.06 61 61 61 61 61 61 61 61 61 61 61 61 If monthly based emissions are specified then the monthly based final emissions and percent reduction columns are populated
GHI Steam Electric Plant [8392811, 1654113, 1569412, 17761914, 37021, 10100202, PM10]
2 3.62 3.27 3.62 3.50 3.62 3.50 3.62 3.62 3.50 3.62 3.50 3.62 88 88 88 88 88 88 88 88 88 88 88 88 Here is a "Addon" control calculation for a monthly based source: Jan Final Emission = Jan Inv Emis - Jan Inv Emission x Jan Percent Reduction/100

EMAQ LOE (EPA Contract EP-D-07-102) CoST PFYI Development Document
UNC-EMAQ(1-03)-008.v1 47 April 8, 2013
4 Potential Future Updates
This section describes updates that may be made to the CoST algorithms in the future.
Reviewing these may also make the reader more aware of some of the nuances involved with
applying the current version of CoST.
The following updates could be supported in future versions of the software:
1) Update Control Program Allowable Packet processing algorithm to be based on monthly
and annual values instead of daily-based values.
2) Include more thorough warning messages in the Strategy Messages about Control
Program Packet usage and trends during the analysis.
5 References
Eyth, A.M., D. Del Vecchio, D. Yang, D. Misenheimer, D. Weatherhead, L. Sorrels, “Recent
Applications of the Control Strategy Tool (CoST) within the Emissions Modeling Framework”,
17th
Annual Emissions inventory Conference, Portland, OR, 2008.
Houyoux, M.R., M. Strum, R. Mason, A. Eyth, A. Zubrow, C. Allen, “Using SMOKE from the
Emissions Modeling Framework”, 17th
Annual Emissions inventory Conference, Portland, OR,
2008.
Misenheimer, D.C., “A New Tool for Integrated Emissions and Controls Strategies Analysis”,
16th
Annual Emissions inventory Conference, Raleigh, NC, 2007.