control strategy implementation considerations for...
TRANSCRIPT

Confidential
Control Strategy Implementation
Considerations for a Continuous Drug Product
Manufacturing Process
Hayden Thomas 5th October, 2015
©2015 Vertex Pharmaceuticals Incorporated1
2
© 2 0 1 4 V e r t e x P h a r m a c e u t i c a l s
I n c o r p o r a t e d
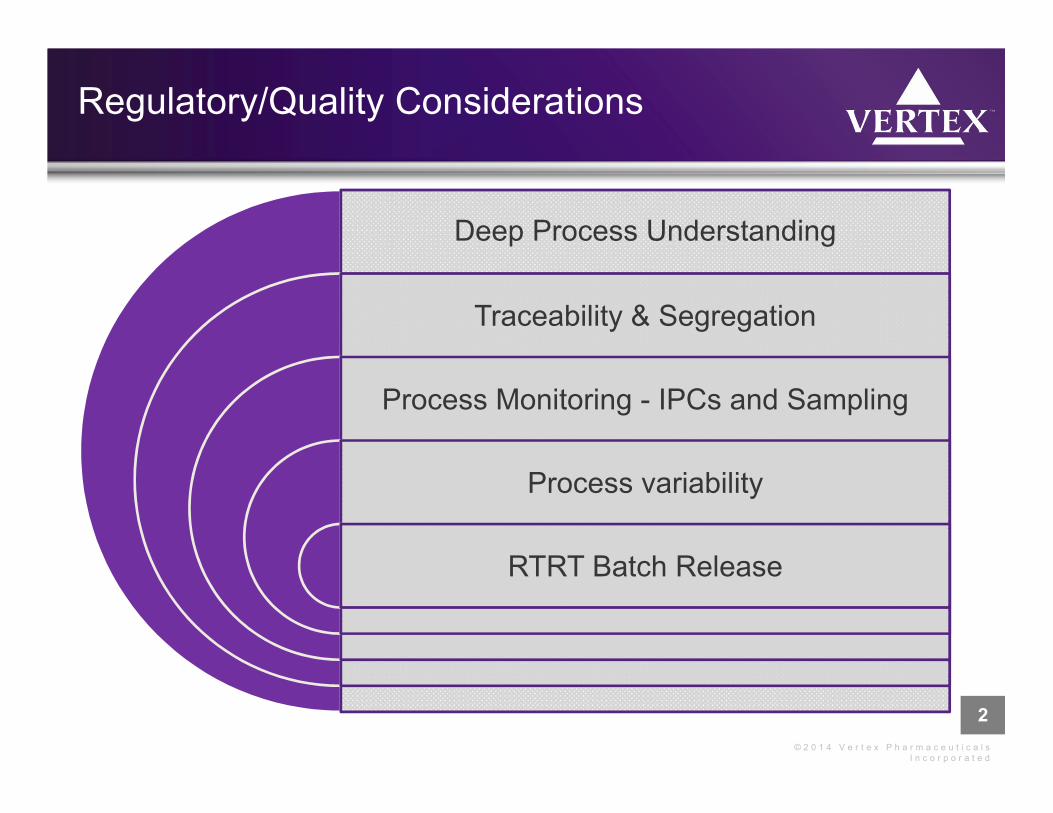
Regulatory/Quality Considerations
Deep Process Understanding
Traceability & Segregation
Process Monitoring - IPCs and Sampling
Process variability
RTRT Batch Release

3
© 2 0 1 4 V e r t e x P h a r m a c e u t i c a l s
I n c o r p o r a t e d
Deep Process Understanding - Quality by Design
3
Determine high risk areas of the design space and continually monitor process performance
Design a manufacturing process to consistently deliver the intended performance of the product; Establish design space, product specifications and critical control points
Define desired product performance upfront; Identify potential Critical Quality Attributes (CQAs) early in development

4
© 2 0 1 4 V e r t e x P h a r m a c e u t i c a l s
I n c o r p o r a t e d
Deep Process Understanding - Quality by Design
• Early investment in process
development
– CM consumes more material at
initiation
– Need for “discontinuous”
operations or science of scale
tools to bridge the gap to fully
continuous operations
4
5
© 2 0 1 4 V e r t e x P h a r m a c e u t i c a l s
I n c o r p o r a t e d
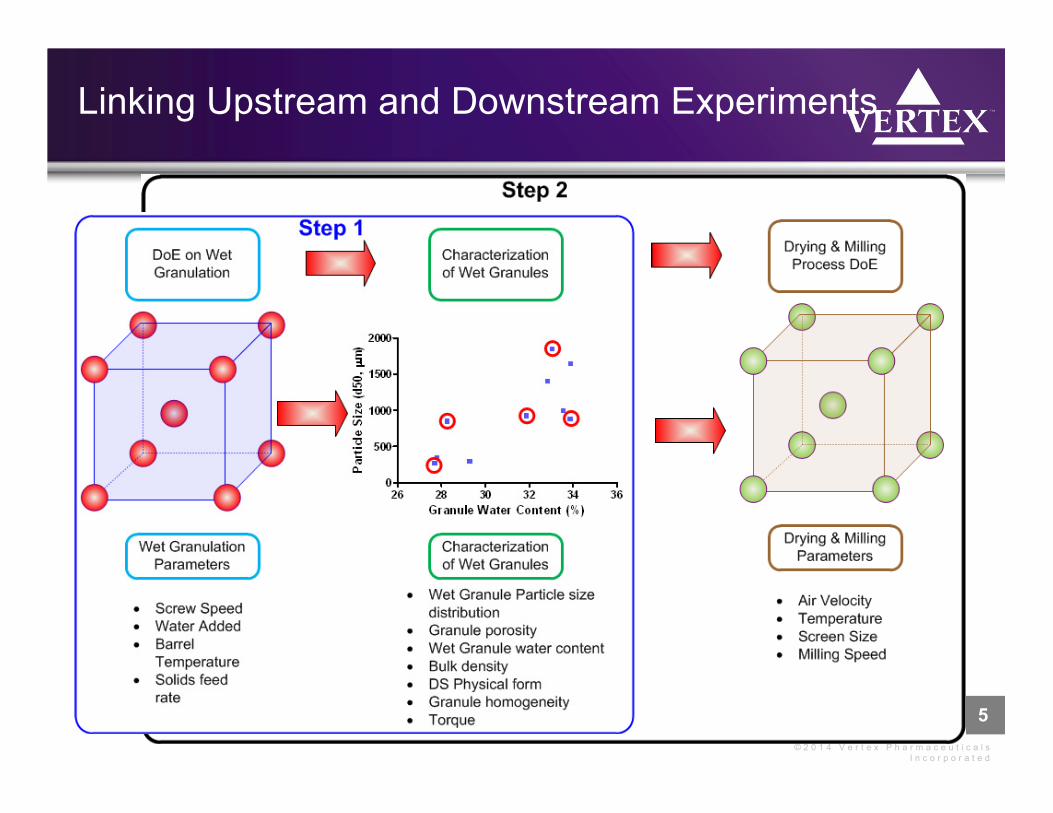
Linking Upstream and Downstream Experiments
5

6
© 2 0 1 4 V e r t e x P h a r m a c e u t i c a l s
I n c o r p o r a t e d
Traceability: Understanding Residence Time Distribution
Mass
Unit
Material FlowMass Unit + RTD’s
RTD
Forward & Back Mixing
Unit Op #1 Unit Op #2 Unit Op #3 Unit Op #4 Unit Op #5
7
© 2 0 1 4 V e r t e x P h a r m a c e u t i c a l s
I n c o r p o r a t e d
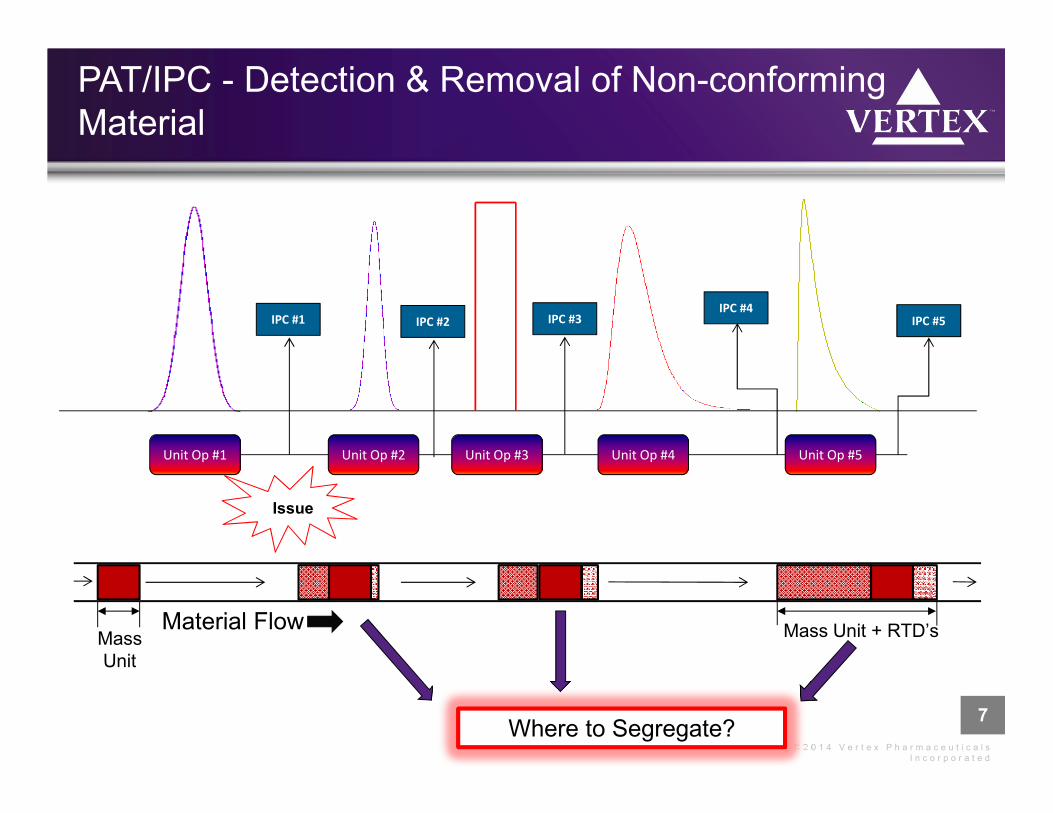
PAT/IPC - Detection & Removal of Non-conforming
Material
Unit Op #1
IPC #1
Mass
Unit
Material Flow Mass Unit + RTD’s
Issue
Unit Op #2 Unit Op #3 Unit Op #4 Unit Op #5
IPC #2 IPC #3IPC #4
IPC #5
Where to Segregate?
8
© 2 0 1 4 V e r t e x P h a r m a c e u t i c a l s
I n c o r p o r a t e d
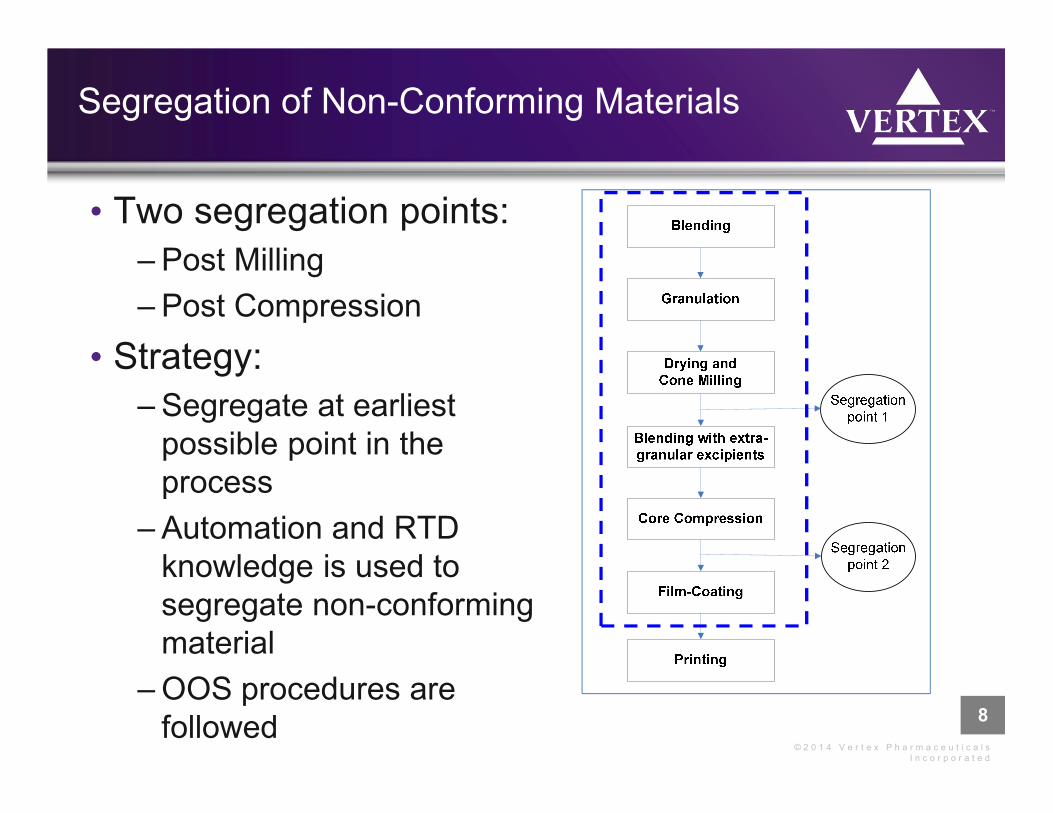
Segregation of Non-Conforming Materials
• Two segregation points:
– Post Milling
– Post Compression
• Strategy:
– Segregate at earliest
possible point in the
process
– Automation and RTD
knowledge is used to
segregate non-conforming
material
– OOS procedures are
followed
9
© 2 0 1 4 V e r t e x P h a r m a c e u t i c a l s
I n c o r p o r a t e d
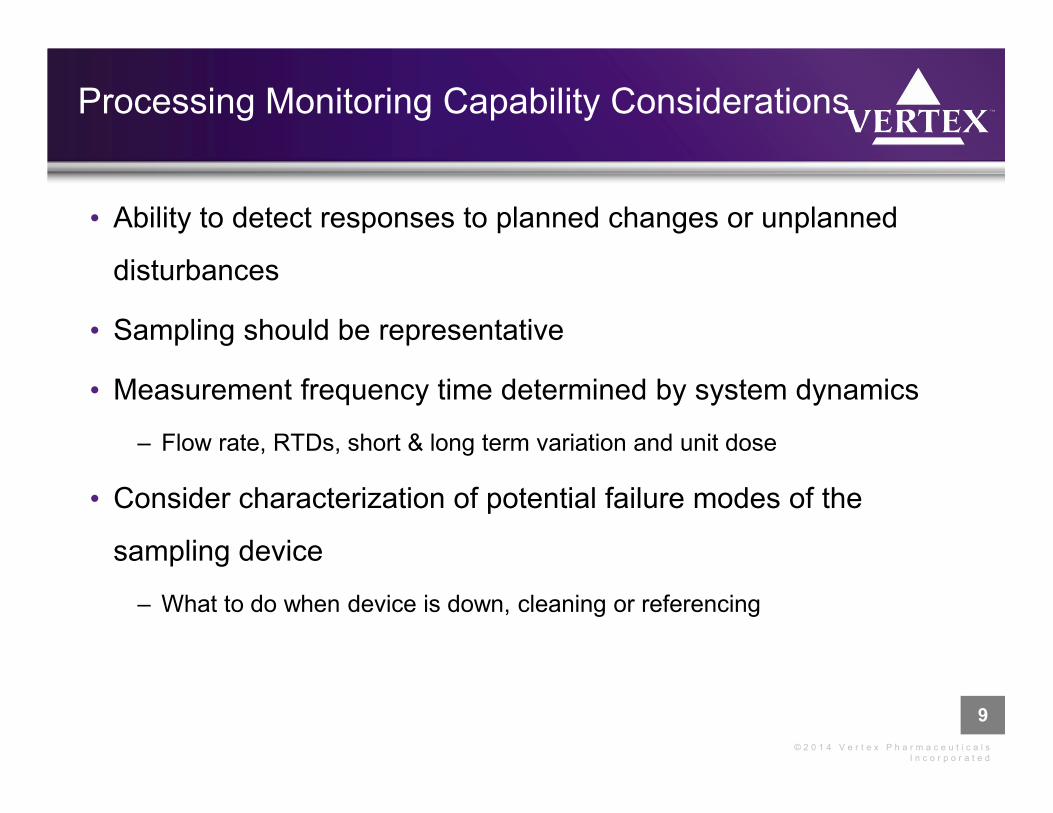
Processing Monitoring Capability Considerations
• Ability to detect responses to planned changes or unplanned
disturbances
• Sampling should be representative
• Measurement frequency time determined by system dynamics
– Flow rate, RTDs, short & long term variation and unit dose
• Consider characterization of potential failure modes of the
sampling device
– What to do when device is down, cleaning or referencing
10
© 2 0 1 4 V e r t e x P h a r m a c e u t i c a l s
I n c o r p o r a t e d
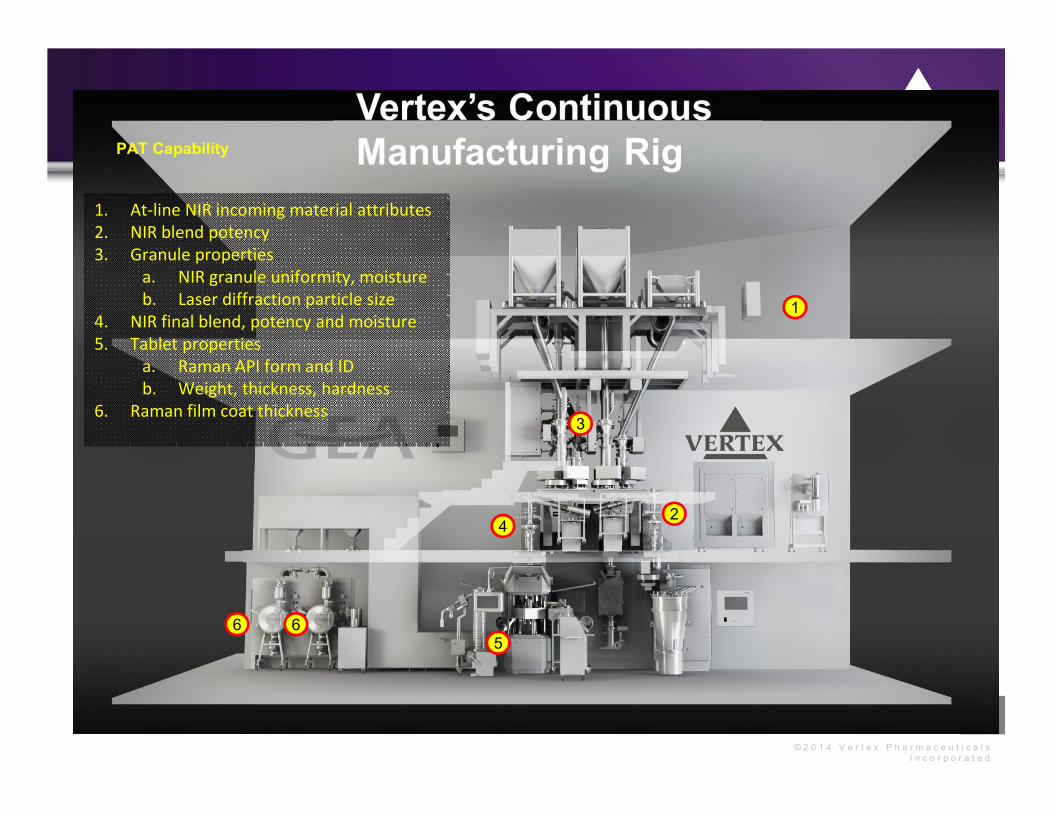
1. At-line NIR incoming material attributes
2. NIR blend potency
3. Granule properties
a. NIR granule uniformity, moisture
b. Laser diffraction particle size
4. NIR final blend, potency and moisture
5. Tablet properties
a. Raman API form and ID
b. Weight, thickness, hardness
6. Raman film coat thickness
1
2
3
4
566
PAT Capability

11
© 2 0 1 4 V e r t e x P h a r m a c e u t i c a l s
I n c o r p o r a t e d
Improved Product Quality Assurance Through
Comprehensive Process and Product Monitoring
• Control software displays all active unit operations and alarms on HMI
• IPCs, CPPs, and PPs with design space limits are monitored in real time
• Process control charts available for operator review
• Batch summary reports: material tracking, alarms, IPCs, CPPs and PPs with design
spaces, etc. available for batch review

12
© 2 0 1 4 V e r t e x P h a r m a c e u t i c a l s
I n c o r p o r a t e d
Process Control - PAT for IPCs and RTRT
• Both IPCs and RTRT are based on PAT measurements of in-process materials
• In-Process Control Measurements
– Analysis of in-process materials to assess material against in-process action and
warning limits for conformance /non-conformance
• RTRT
– Analysis of up-stream in-process materials to assess the batch as a whole against the
release specifications for end product
– Only material passing all IPCs are included in the batch and the batch analysis for
release
• Not all IPC measurements need to be inputs to the RTRT methods
• Not all inputs into the RTRT methods need to be in-process controls
12
In-Process Control Real Time
Release Testing

13
© 2 0 1 4 V e r t e x P h a r m a c e u t i c a l s
I n c o r p o r a t e d
Examples of How PAT Can Be Used for IPC and
RTRT Measurements
13
Step PAT Measurement Use
IG Blending LIW Feeders
mass flow
Gravimetric IPC
Drying Temperature Granule discharge temperature IPC
PAT 3 (NIR) Water content in granules IPC
PAT 3 (Laser
Diffraction)
Granule particle size distribution RTRT
EG Blending LIW Feeders
mass flow
Gravimetric IPC
LIW Feeders
mass flow + PAT 3
(NIR; granules)
Final Blend Potency IPC
PAT 4 (NIR) Final Blend Potency IPC / RTRT
Water Content in Final Blend RTRT
Compression PAT 5 (Raman) Physical Form RTRT
PAT 5 (WTH) Core tablet weight thickness, hardness IPC /RTRT
14
© 2 0 1 4 V e r t e x P h a r m a c e u t i c a l s
I n c o r p o r a t e d
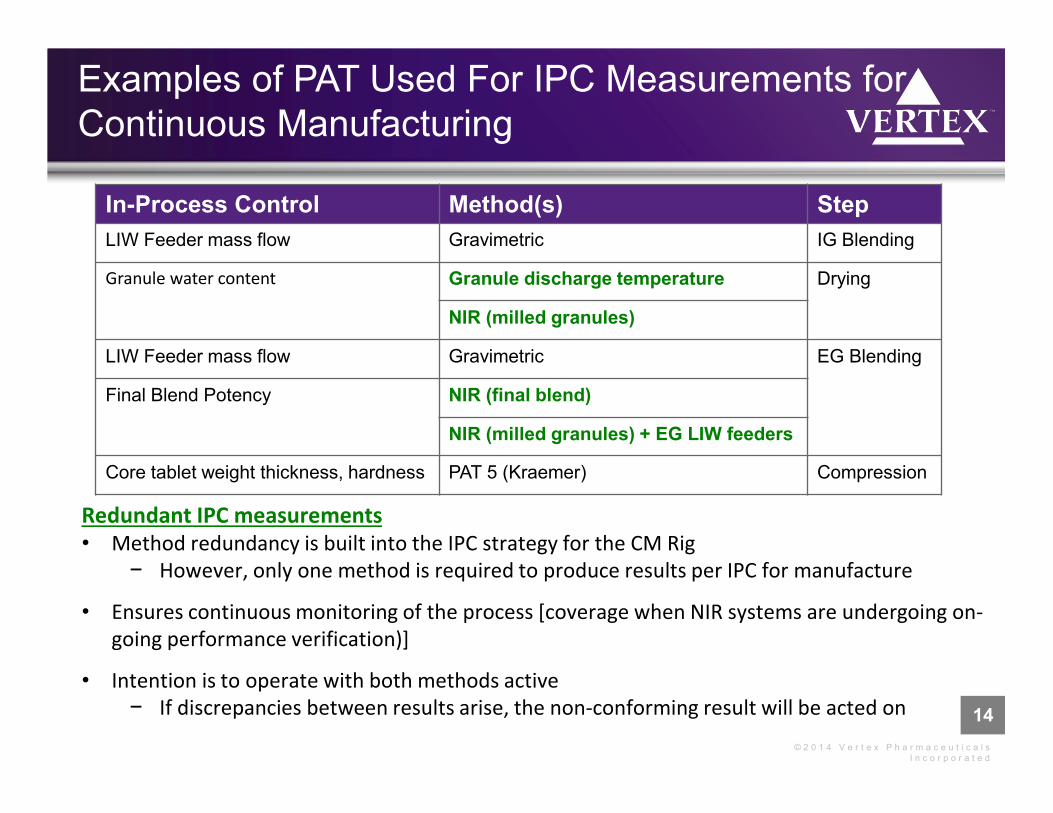
Examples of PAT Used For IPC Measurements for
Continuous Manufacturing
In-Process Control Method(s) Step
LIW Feeder mass flow Gravimetric IG Blending
Granule water content Granule discharge temperature Drying
NIR (milled granules)
LIW Feeder mass flow Gravimetric EG Blending
Final Blend Potency NIR (final blend)
NIR (milled granules) + EG LIW feeders
Core tablet weight thickness, hardness PAT 5 (Kraemer) Compression
Redundant IPC measurements
• Method redundancy is built into the IPC strategy for the CM Rig
− However, only one method is required to produce results per IPC for manufacture
• Ensures continuous monitoring of the process [coverage when NIR systems are undergoing on-
going performance verification)]
• Intention is to operate with both methods active
− If discrepancies between results arise, the non-conforming result will be acted on
15
© 2 0 1 4 V e r t e x P h a r m a c e u t i c a l s
I n c o r p o r a t e d
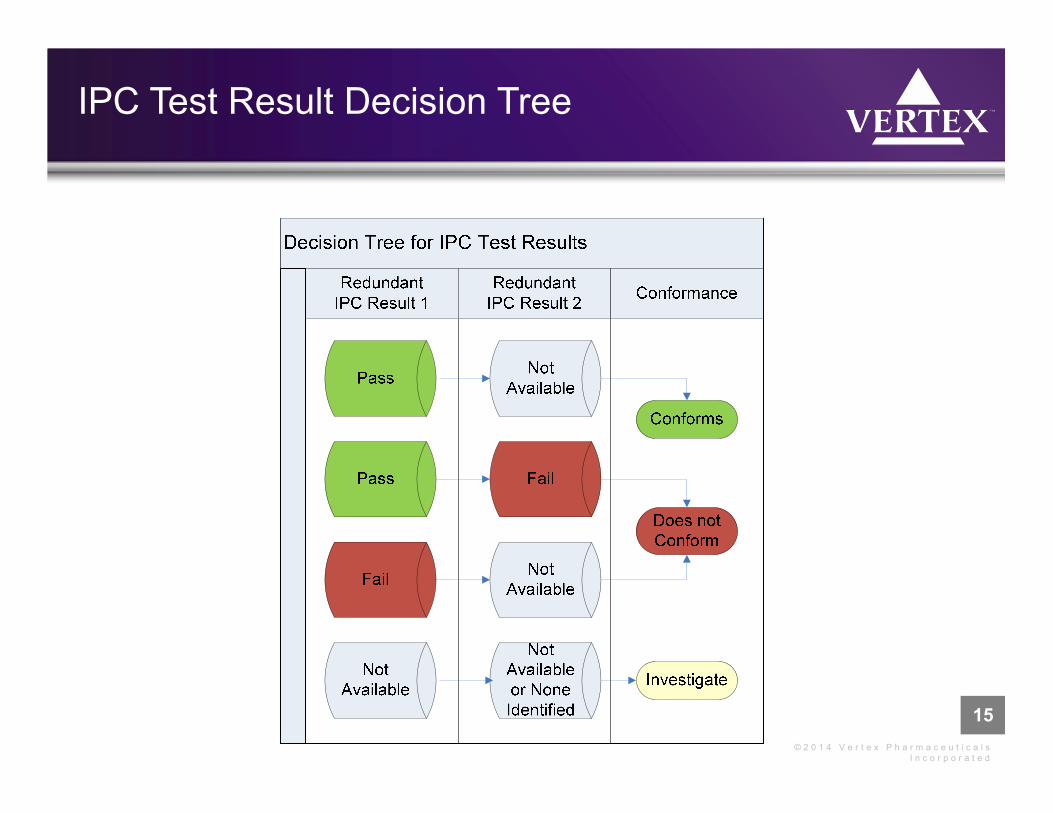
IPC Test Result Decision Tree

16
© 2 0 1 4 V e r t e x P h a r m a c e u t i c a l s
I n c o r p o r a t e d
Example of RTRT for Continuous Manufacturing
• A composite sample will be taken after tablet printing for retains, stability, and
any release testing not amenable to RTRT (e.g. appearance)
• Traditional end product testing performed for appearance
Critical Quality Attribute
PAT Technology RTRT Method Material
Identification Raman Confirm presence of API Core Tablet
AssayNIR
Weight
API Content
Tablet Weight
Final Blend
Core Tablet
Dissolution
Laser Diffraction
NIR
WTH
Granule Particle Size
API Content, Water Content
Tablet Weight, Hardness, Thickness
Milled Granules
Final Blend
Core Tablet
Water Content NIR Water Content Final Blend
Content Uniformity
NIR
Weight
Variance in API Content
Variance in Tablet weight
Final Blend
Core Tablet
Physical Form Raman API physical form Core Tablet
17
© 2 0 1 4 V e r t e x P h a r m a c e u t i c a l s
I n c o r p o r a t e d
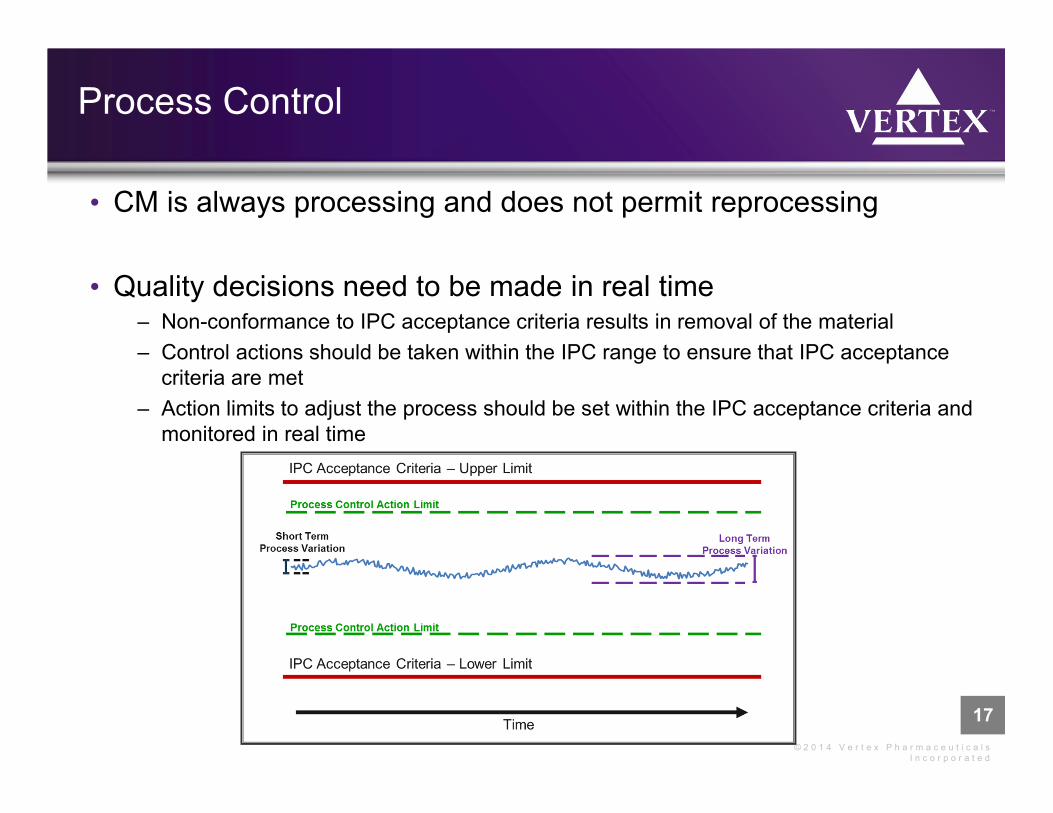
Process Control
• CM is always processing and does not permit reprocessing
• Quality decisions need to be made in real time– Non-conformance to IPC acceptance criteria results in removal of the material
– Control actions should be taken within the IPC range to ensure that IPC acceptance
criteria are met
– Action limits to adjust the process should be set within the IPC acceptance criteria and
monitored in real time
18
© 2 0 1 4 V e r t e x P h a r m a c e u t i c a l s
I n c o r p o r a t e d
Process Control
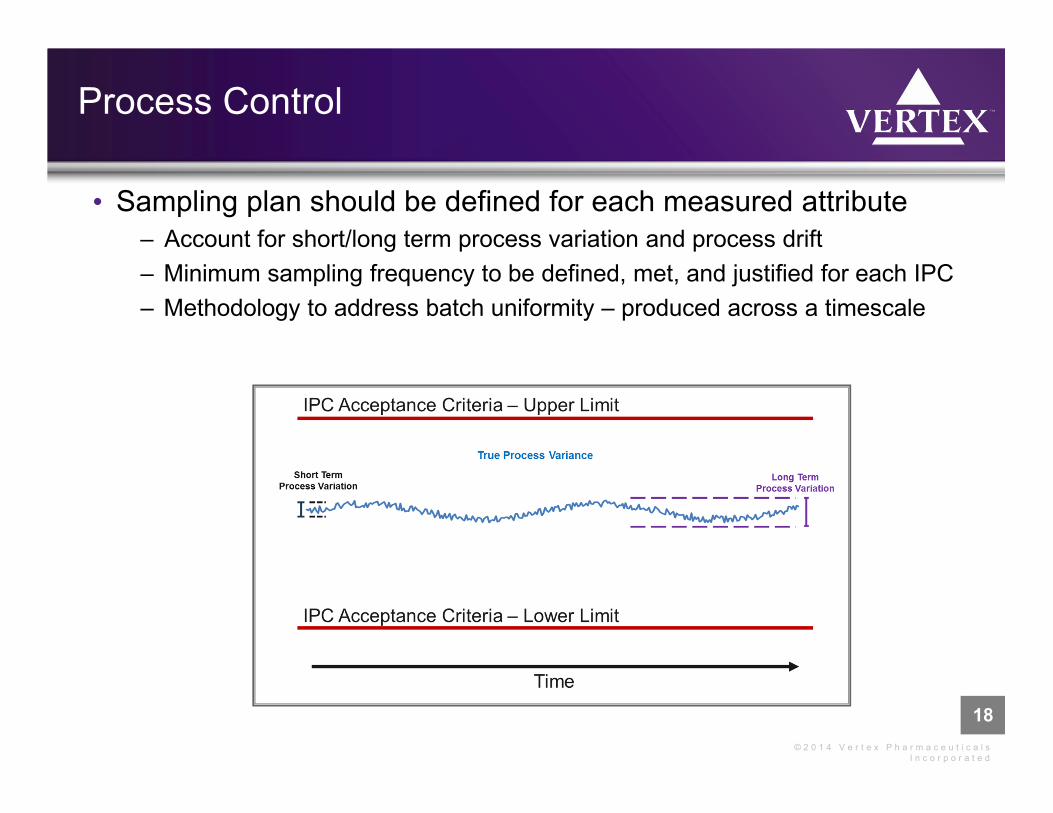
• Sampling plan should be defined for each measured attribute
– Account for short/long term process variation and process drift
– Minimum sampling frequency to be defined, met, and justified for each IPC
– Methodology to address batch uniformity – produced across a timescale

19
© 2 0 1 4 V e r t e x P h a r m a c e u t i c a l s
I n c o r p o r a t e d
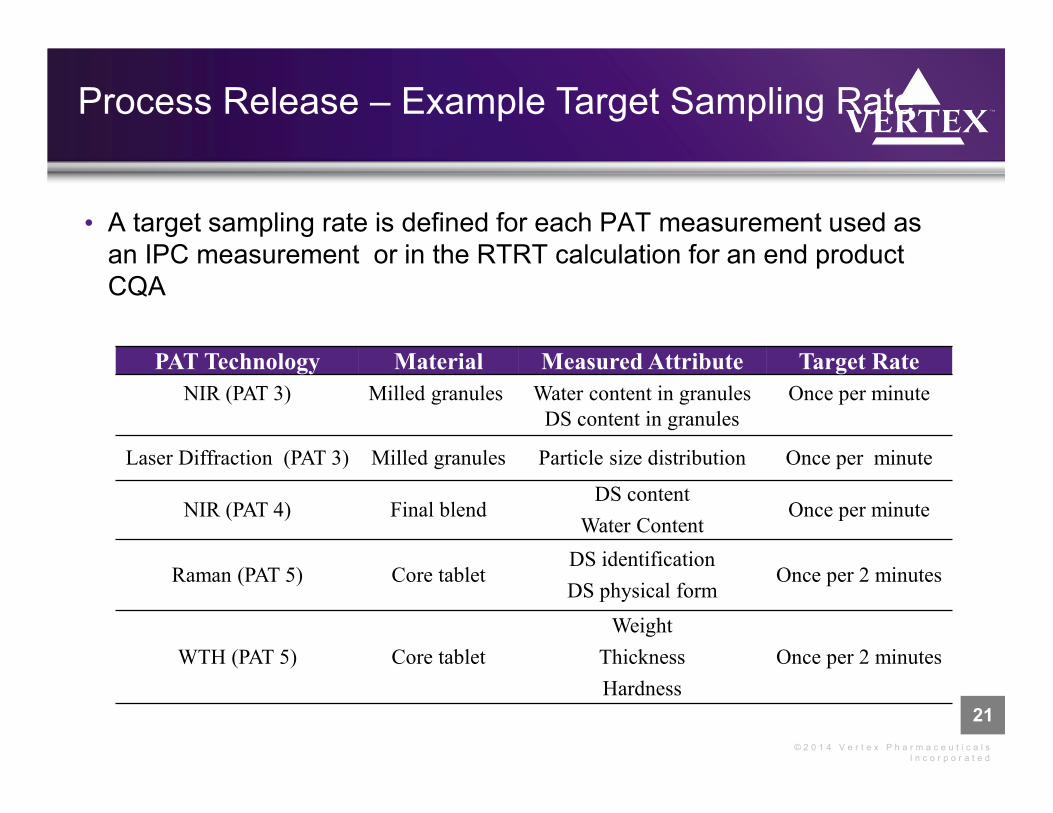
Process Release - Target Sampling Rate
19
• A target sampling rate is defined for each PAT measurement used as
an IPC measurement or in the RTRT calculation for an end product
CQA
• Target sampling rate > IPC statistically, justified sampling plan
PAT Technology Material Measured Attribute Target Rate
NIR (PAT 3) Milled granules Water content in granules
DS content in granules
Once per minute
Laser Diffraction (PAT 3) Milled granules Particle size distribution Once per minute
NIR (PAT 4) Final blendDS content
Water ContentOnce per minute
Raman (PAT 5) Core tabletDS identification
DS physical formOnce per 2 minutes
WTH (PAT 5) Core tablet
Weight
Thickness
Hardness
Once per 2 minutes
20
© 2 0 1 4 V e r t e x P h a r m a c e u t i c a l s
I n c o r p o r a t e d
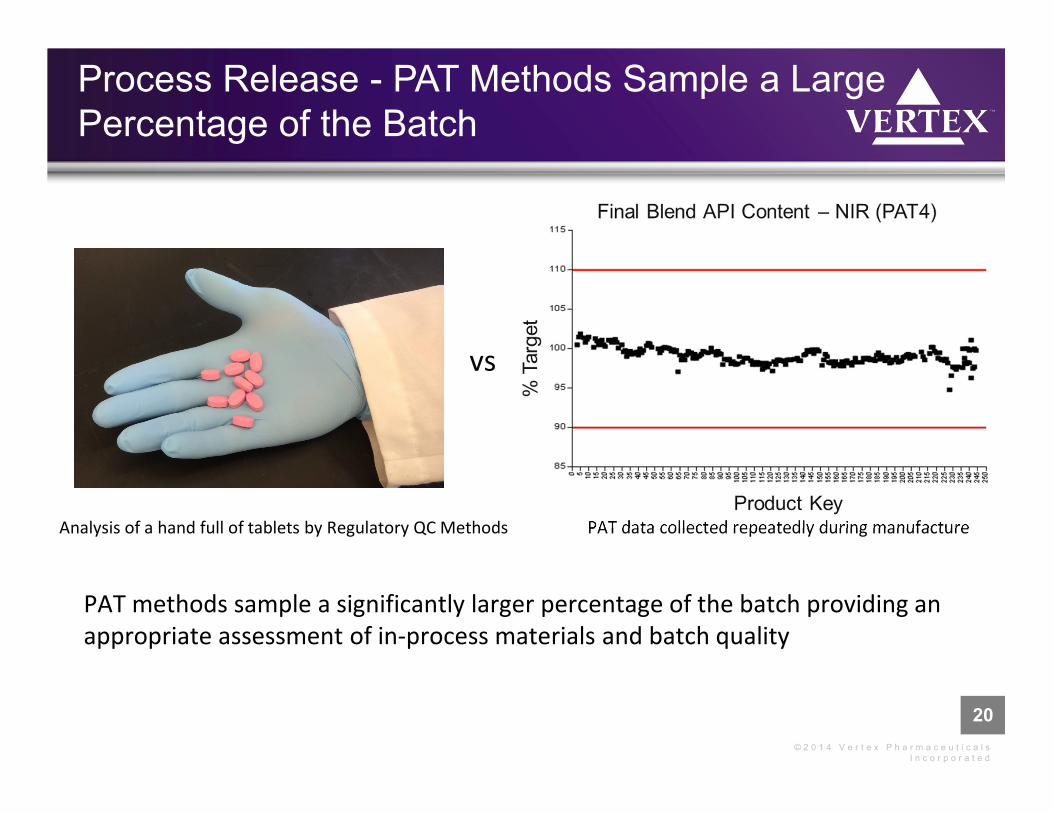
Process Release - PAT Methods Sample a Large
Percentage of the Batch
20
Analysis of a hand full of tablets by Regulatory QC Methods
vs
PAT data collected repeatedly during manufacture
PAT methods sample a significantly larger percentage of the batch providing an
appropriate assessment of in-process materials and batch quality
21
© 2 0 1 4 V e r t e x P h a r m a c e u t i c a l s
I n c o r p o r a t e d
Process Release – Example Target Sampling Rate
21
• A target sampling rate is defined for each PAT measurement used as
an IPC measurement or in the RTRT calculation for an end product
CQA
PAT Technology Material Measured Attribute Target Rate
NIR (PAT 3) Milled granules Water content in granules
DS content in granules
Once per minute
Laser Diffraction (PAT 3) Milled granules Particle size distribution Once per minute
NIR (PAT 4) Final blendDS content
Water ContentOnce per minute
Raman (PAT 5) Core tabletDS identification
DS physical formOnce per 2 minutes
WTH (PAT 5) Core tablet
Weight
Thickness
Hardness
Once per 2 minutes

22
© 2 0 1 4 V e r t e x P h a r m a c e u t i c a l s
I n c o r p o r a t e d
Process Release - Example RTRT Minimal
Sample Size Criteria
• A minimum sample size is defined for each PAT point used to assess
an end product CQACritical Quality
AttributePAT Technology In-Process Material Attribute Minimum Sample Size
Identification Raman API identification in core tablets NLT 10 Tablets
AssayNIR Final blend API content NLT 50%*
Weight Core tablet weight NLT 50%*
Dissolution
Laser Diffraction Milled granule particle size distribution NLT 50%*
NIR Final blend API and water content NLT 50% *
WTH Core tablet weight, thickness, hardness NLT 50%*
Water Content NIR Final blend water content NLT 50%*
Content Uniformity
NIR Final blend API content NLT 50%*
Weight Core tablet weight NLT 50%*
Physical Form Raman API physical form in core tablets NLT 10 Tablets
NValid Results = Number of valid results obtained
NTarget Results = Theoretical number of results at the target measurement rate
������������ � � �������������
��������������� 100
Actual Sample Size for Assay, Dissolution, Water Content, and Content Uniformity
* NLT 50% target sample size achieved + NMT 15% in a contiguous segment not sampled
23
© 2 0 1 4 V e r t e x P h a r m a c e u t i c a l s
I n c o r p o r a t e d
Conclusions
• There are many Regulatory and Quality aspects to consider when
defining your CM control strategy
• Taking a QbD approach provides deep process understanding that
serves as the foundation for the control strategy
• Control strategy implementation requires a sophisticated process control
system that also can control and manage the PAT systems and data
• Real time in-process controls require PAT measurements
(spectroscopic and/or non-spectroscopic) that can be acted on in real
time
• In-process material PAT analysis can be leveraged for RTRT to
appropriately characterize the end product CQA’s of the batch for
release

24
© 2 0 1 4 V e r t e x P h a r m a c e u t i c a l s
I n c o r p o r a t e d
Acknowledgements
• Team at Vertex
– Pharmaceutical Development
– Technical Operations
– Supply Chain Management
– Quality
– CMC Regulatory
– GIS
– Facilities
• Equipment manufacturers
• Our CMOs, suppliers, and research collaborators
• FDA, EMA, MHRA