control of viruses and other scary critters in wastewater
TRANSCRIPT


Fecal contamination of water
remains one of the largest threats to
the biological safety of water today.

Economics of Pollution
• Morbidity and Mortality Health care costs
• Outbreaks/disaster costs
• Productivity loss
• Decreases in educated workforce (girls)
• Quality of life low
• Transboundary blame
• Total Tourism Foreign Earnings ($B) US$ 856
• 9.7% of world GDP
• Worlds largest and fastest growing industry
• Tourism contributes to 70% GDP for some of the world’s poorest countries.
• ~$280,000 loss/d/beach closure
Ref: PATA Tourism Forecast / WTO
Health, Social &
Economic impacts
Tourism

Coupled Water, Food and Human Systems
WATER
SYSTEMS
Oceans
Streams Rivers
FOOD
SYSTEMS
Produce
Pork
Fish
Poultry
Beef
HUMAN SYSTEMS
Elderly Children
Immuno-
compromised
Agricultural
Runoff
Handling
Preparation
Consumption
Irrigation
Fertilization
Animal &
Human Feces
Recreational
& Drinking
Water
Lakes
Ground
Water
COMMUNITY

Advances impacting sanitation
science & disease
Emerging methods & pathogens:
• New molecular methods
advance understanding of
emerging pathogens
• Now will have data on
occurrence in sewage
Green and Blue Economy
Wastewater Resource Recovery - $37 Billion
Wastewater Treatment - $70.8 Billion
Overall Market (products/services) - $770B * Pittsburgh’s H2Opportunity Report
Science-based & data-driven
approaches:
• Support quantitative
microbial risk assessment,
risk communication and risk
management
Risk Analysis
Technology Environmental Methods & Data

IN MICHIGAN WE SHOULD: ELEVATE THE DISCUSSION ON WASTEWATER TREATMENT AS AN
IMPORTANT COMPONENT OF THE ONE WATER CONCEPT
PILOT AND BUILD INNOVATIVE TECHNOLOGIES AND DESIGNS
USE THE MOST ADVANCED DIAGNOSTICS OF ANY PLACE IN THE WORLD
ADDRESS THE EFFICIENCY OF WASTEWATER TREATMENT Emerging issues for wastewater industry Enterococci qPCR for beach pollution Coliphage as a new virus indicator

• 24 million gallons of sewage discharged annually (Alliance for GL 2010)
• ~539 combined sewer overflow systems
• 184,923 days of closures or advisories at beaches since 1992 (NRDC 2010)
• Temperature projected to increase ~4°C by 2100 (Meehl et al. 2007)
• Urban land projected to increase ~178% by 2040 (PSC 2001)
Great Lakes

Water in the Urban and Rural Environments
• URBAN (point sources)
• Wastewater treatment
systems with larger
flows
• Combined sewer
overflows
• Aging infrastructure,
spills
• Community water
• Tourism focus at
coastal areas
• RURAL (diffuse)
• Septic tanks; smaller
wastewater plants & lagoon
systems
• Animal manure & biosolids
application
• Groundwater & individual
wells
• Less monitoring & less
information on water quality
• Source of food supply

Costly restoration projects, such as the over one billion dollar Great Lakes
Restoration Initiative are currently underway. To help inform these efforts,
high-resolution spatial analyses of environmental stressors were analyzed
by mapping of ecosystem services for all five Great Lakes.
Allan et al. 2013 PNAS
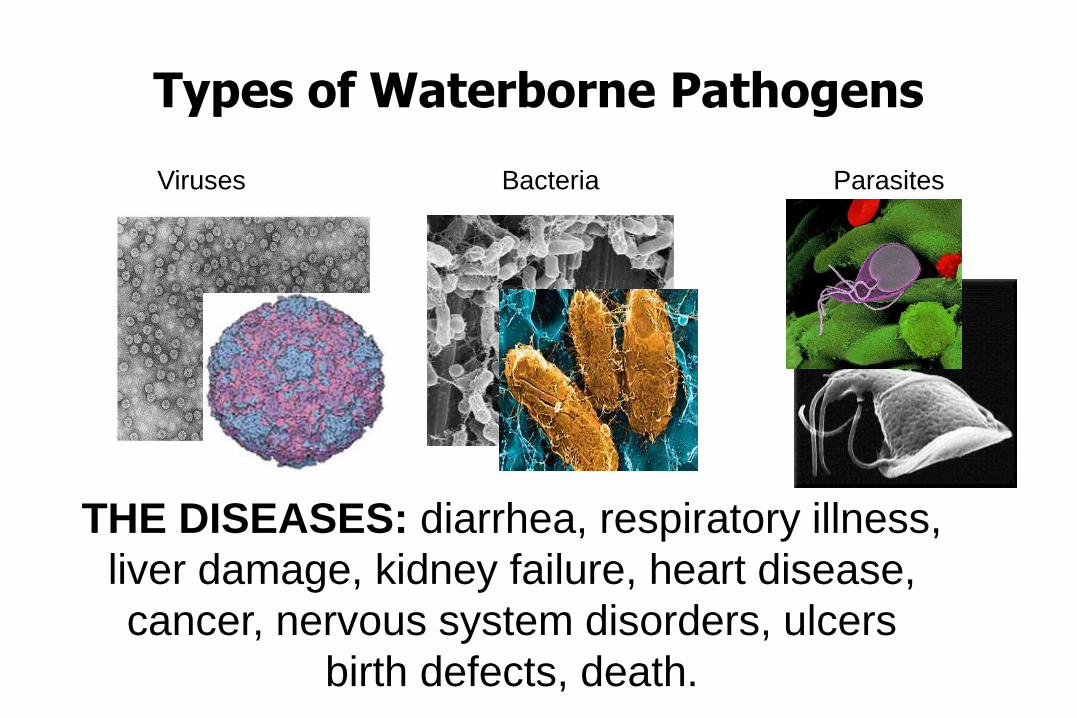
Types of Waterborne Pathogens
Viruses Bacteria Parasites
THE DISEASES: diarrhea, respiratory illness,
liver damage, kidney failure, heart disease,
cancer, nervous system disorders, ulcers
birth defects, death.

Studies on Viruses in freshwaters are few
but the estimates are that there are about
1010 /liter in freshwater systems.
Viruses are the most
numerous and
diverse entities on
earth with estimates
of 1.7 billion different
viruses and levels as
high as ~ 1030 in the
ocean alone (Suttle,
2007)
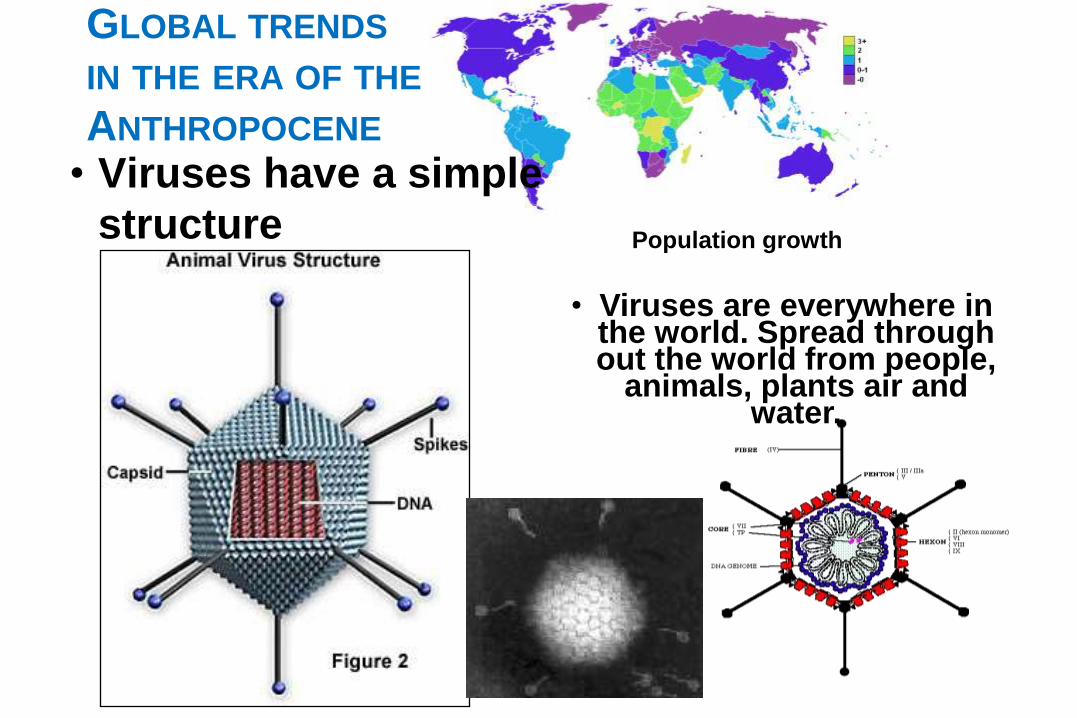
Population growth
GLOBAL TRENDS
IN THE ERA OF THE
ANTHROPOCENE
• Viruses are everywhere in the world. Spread through out the world from people,
animals, plants air and water.
• Viruses have a simple
structure
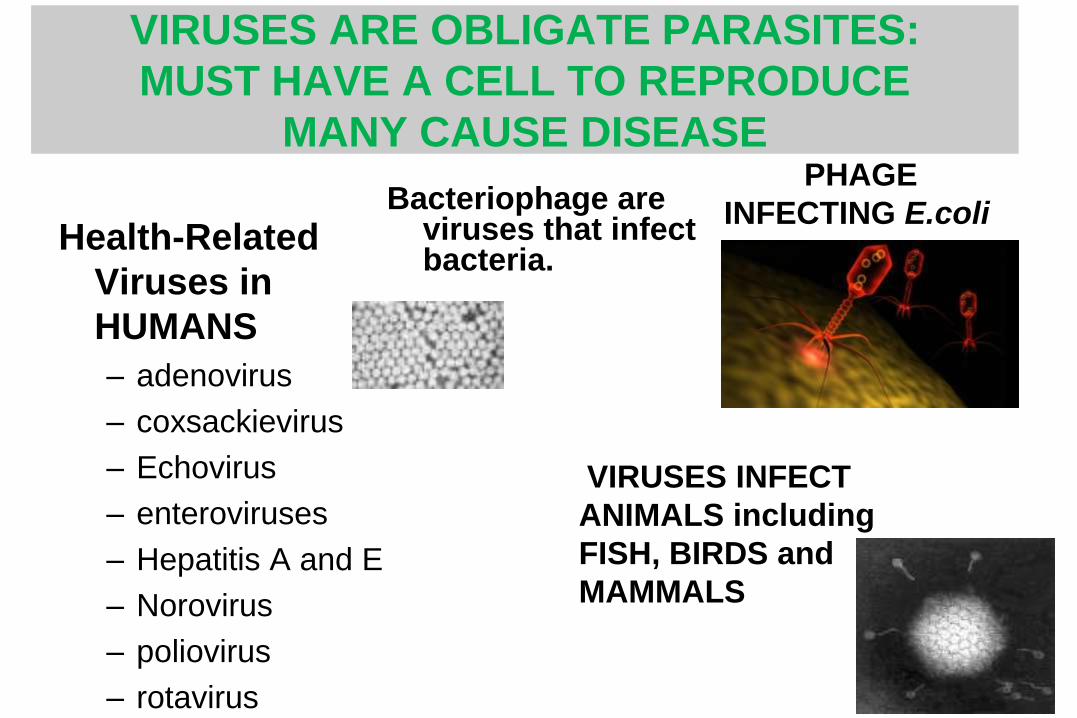
VIRUSES ARE OBLIGATE PARASITES:
MUST HAVE A CELL TO REPRODUCE
MANY CAUSE DISEASE Public
Health-Related
Viruses in
HUMANS
– adenovirus
– coxsackievirus
– Echovirus
– enteroviruses
– Hepatitis A and E
– Norovirus
– poliovirus
– rotavirus
Bacteriophage are viruses that infect bacteria.
VIRUSES INFECT
ANIMALS including
FISH, BIRDS and
MAMMALS
PHAGE
INFECTING E.coli

• Viruses are bio nanoparticles
VIRUSES
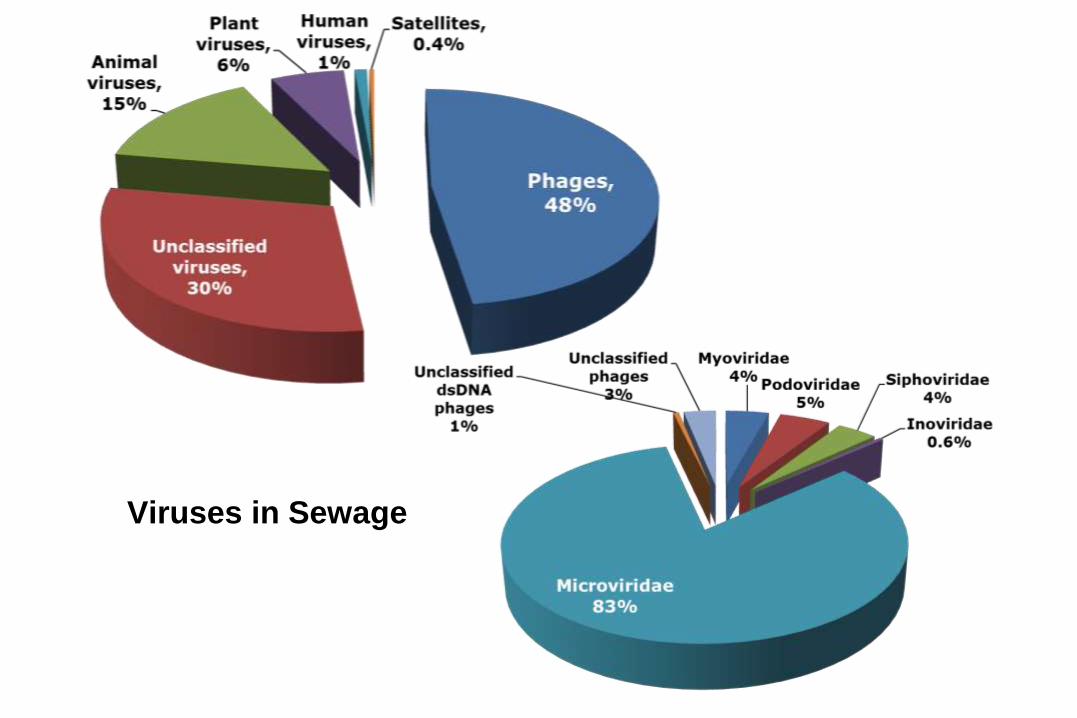
Viruses in Sewage

Human Viruses identified:
Adenoviridae
Human adenovirus B
Human adenovirus C
Human adenovirus F
Polyomaviridae
JC polyomavirus
BK polyomavirus
Human enterovirus B
Human papillomavirus
Diversity of the sewage
virome

Virus host
Virus host Percent Types of viral homologs
Humans 1% Adenoviridae, Picornaviridae, (Rhinoviruses and enteric viruses)
Animals 15% Circoviridae (Avian and swine circoviruses)
Plants 6% Geminiviridae, Nanoviridae (Grain, Fruit, and vegetable viruses)
Bacteria 48% Inoviridae, Microviridae, Myoviridae, Podoviridae, Siphoviridae
Bacterophage shown to move antibiotic resistant genes
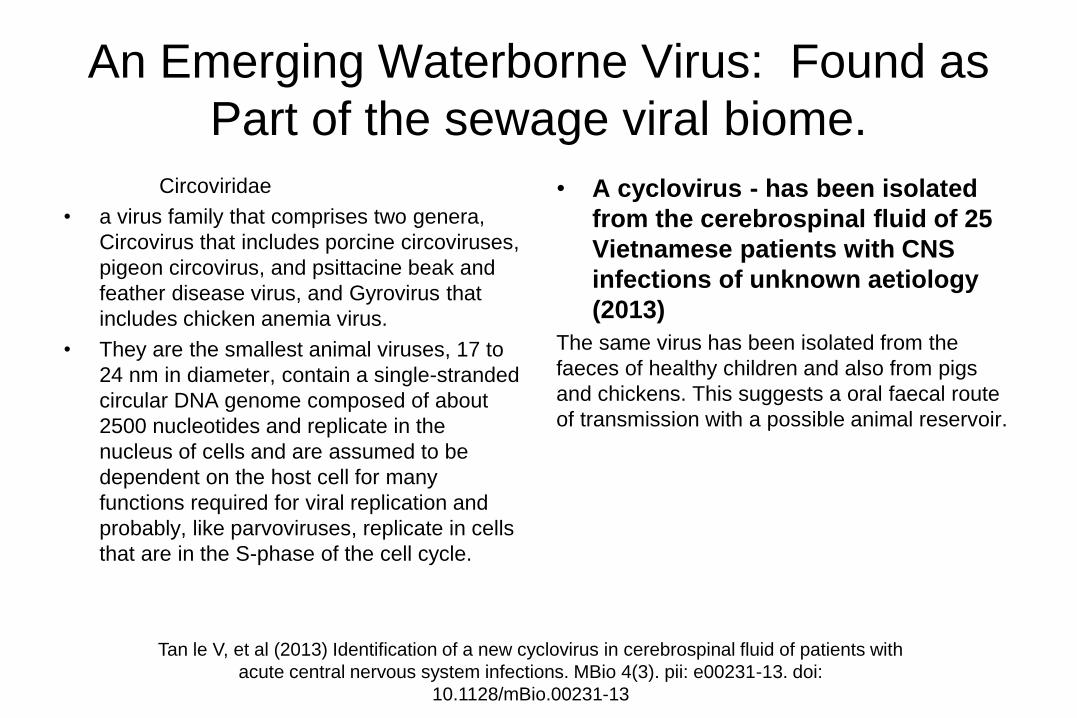
An Emerging Waterborne Virus: Found as
Part of the sewage viral biome.
Circoviridae
• a virus family that comprises two genera,
Circovirus that includes porcine circoviruses,
pigeon circovirus, and psittacine beak and
feather disease virus, and Gyrovirus that
includes chicken anemia virus.
• They are the smallest animal viruses, 17 to
24 nm in diameter, contain a single-stranded
circular DNA genome composed of about
2500 nucleotides and replicate in the
nucleus of cells and are assumed to be
dependent on the host cell for many
functions required for viral replication and
probably, like parvoviruses, replicate in cells
that are in the S-phase of the cell cycle.
• A cyclovirus - has been isolated
from the cerebrospinal fluid of 25
Vietnamese patients with CNS
infections of unknown aetiology
(2013)
The same virus has been isolated from the
faeces of healthy children and also from pigs
and chickens. This suggests a oral faecal route
of transmission with a possible animal reservoir.
Tan le V, et al (2013) Identification of a new cyclovirus in cerebrospinal fluid of patients with
acute central nervous system infections. MBio 4(3). pii: e00231-13. doi:
10.1128/mBio.00231-13

Water quality indicators are used to evaluate
wastewater treatment efficacy
• Water quality data are used to describe the condition of a waterbody, to help
understand the condition of the water, and to determine how it may be improved.
• These are bacteria and do not represent viruses
http://www.slic2.wsu.edu:82/hurlbert/micro101/pages/Chap2.html http://prep4md.blogspot.com/2008_07_01_archive.html
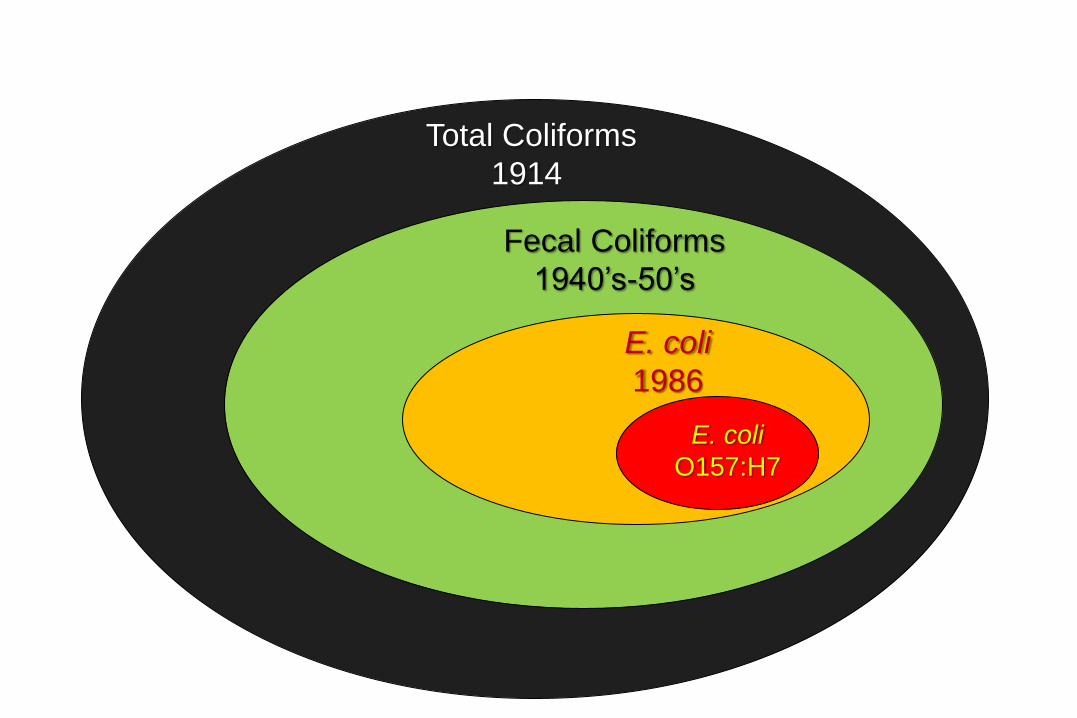
Total Coliforms
1914
Fecal Coliforms
1940’s-50’s
E. coli
1986
E. coli
O157:H7

Membrane Filtration
IDEXX
Water Sampling Conventional
and Alternative
Indicators E.coli gram - rod
Enterococci gram + cocci
Clostridium spore former
Coliphage virus
Coliphage

Using molecular methods to
determine water quality • Advantages:
– More sensitive
– More time-efficient
– Could these be More cost-effective?
• Southern blotting gives presence/absence of DNA fragments
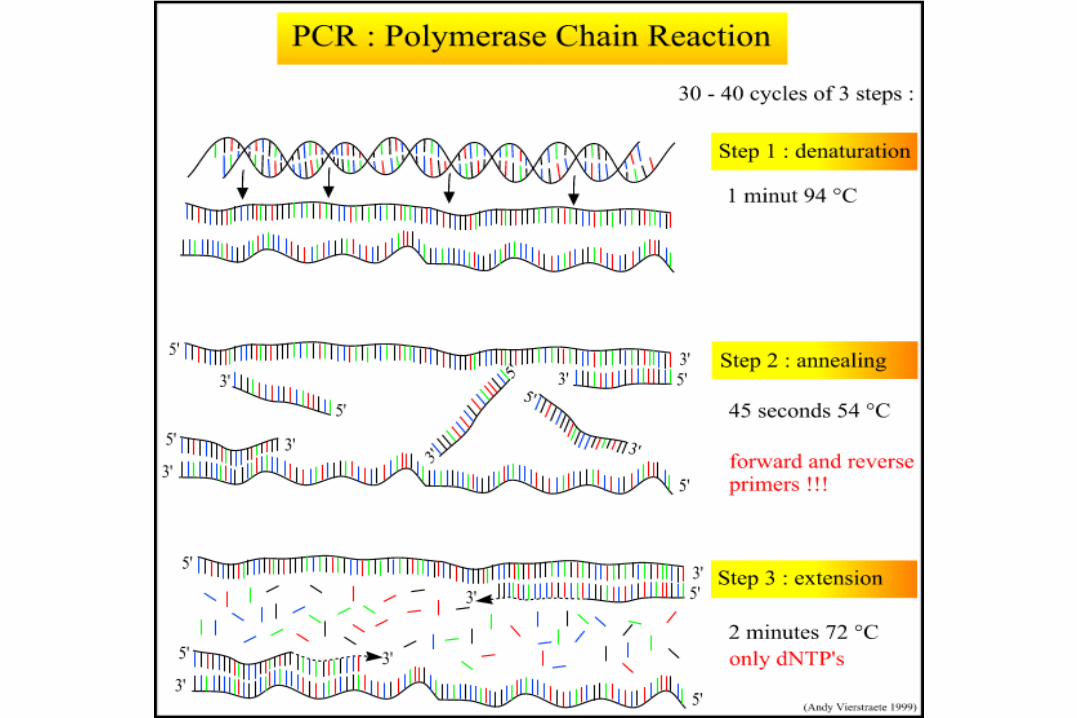
• Routine PCR gives presence/absence of amplified DNA
• qPCR gives copies/reaction of amplified DNA
• Disadvantages:
– Viability of target organisms needs to be considered
– Copies/reaction needs to be translated to cells/volume to be able to determine
risk
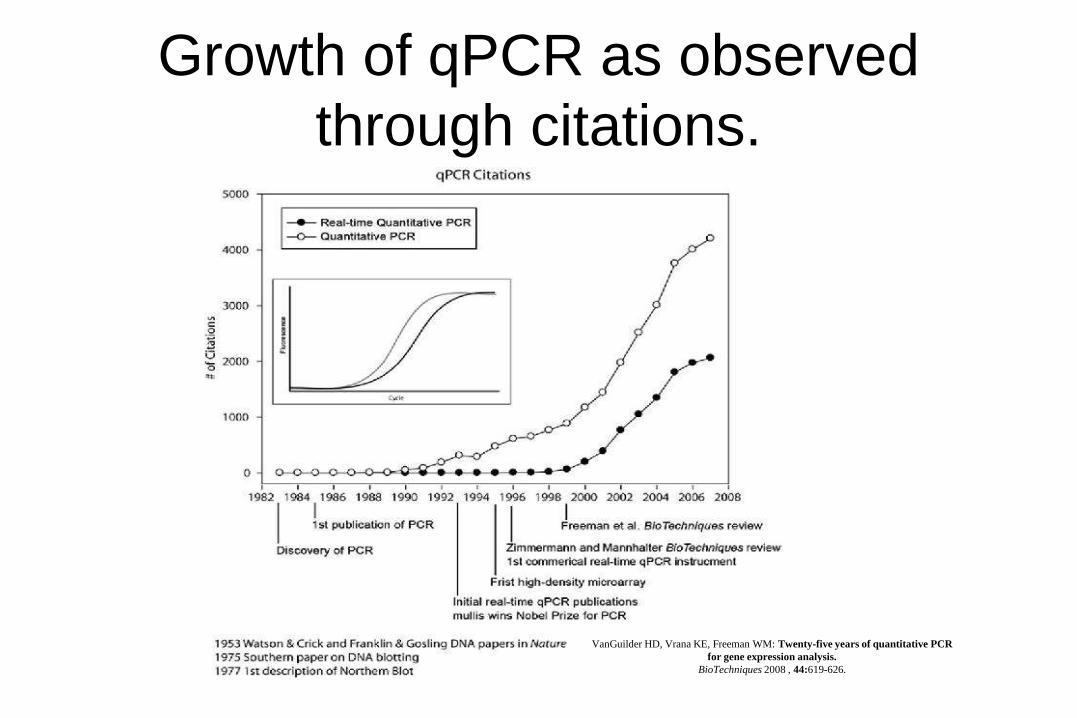
Growth of qPCR as observed
through citations.
VanGuilder HD, Vrana KE, Freeman WM: Twenty-five years of quantitative PCR
for gene expression analysis.
BioTechniques 2008 , 44:619-626.

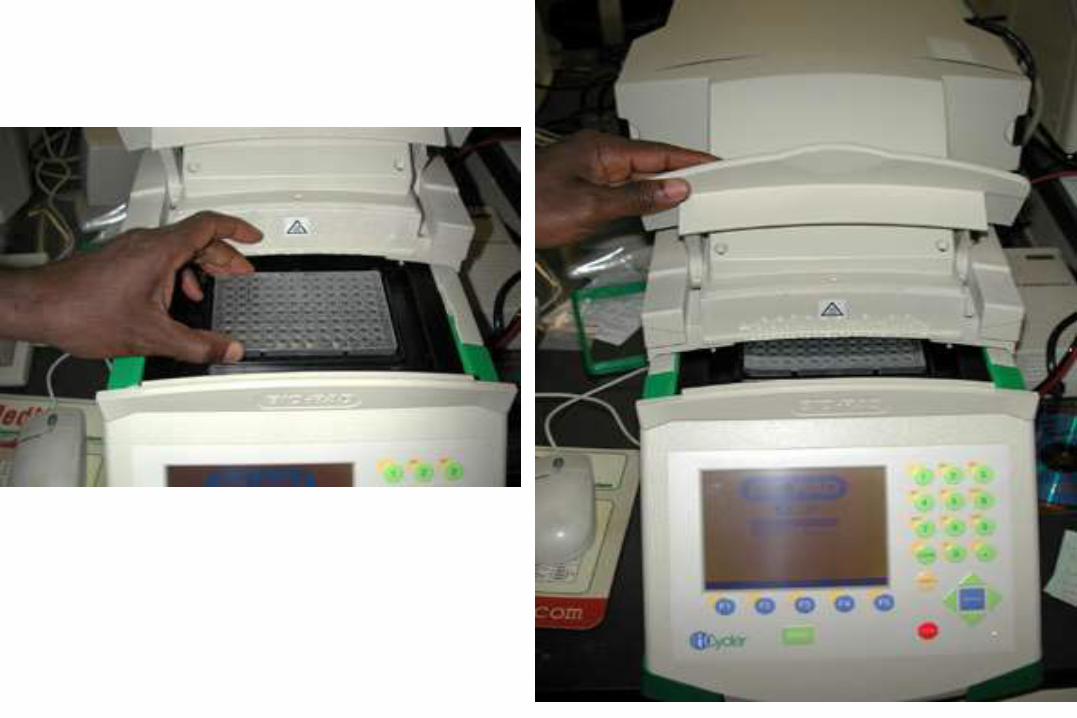
REAL TIME PCR using Taqman probe method
Now referred to as quantitative PCR

Advantages of qPCR
Can target specific pathogens and source tracking markers.
Can obtain rapid results during extreme events.
Can address quantitative characterization .

Insert epi and risk setivi
WHAT IS THE TARGET?
BAT for Drinking Water 4-3-2
log reductions for Viruses,
Giardia & Crypto
Potable Reuse
BAT 12, 10,10 log reductions
for Viruses Giardia & Crypto
What about Routine
wastewater treatment????

Microbial Source Tracking
•Tools are now available to determine the molecular fingerprint of the fecal pollution.
•Health risks
•Remediation
•Prioritization
•Responsibility

BACTERIODES
• Bacteroides are specialists in the intestinal
environment of animals.
• Are the most numerous types of bacteria
approximately 30 % of what is excreted.
• These bacteria are anaerobes and can not
grow in the presence of oxygen.
• Specific genetic targets have been identified
in cattle, humans and swine.

Tools used
Method Bacteria Protocol/gene
Cultivation E. coli USEPA Method 1603
Cultivation
enterococci
USEPA Method 1600
qPCR
E. coli
uidA
qPCR
Enterococci
23S rRNA
qPCR
B. thetaiotaomicron
α-1-6 mannanase
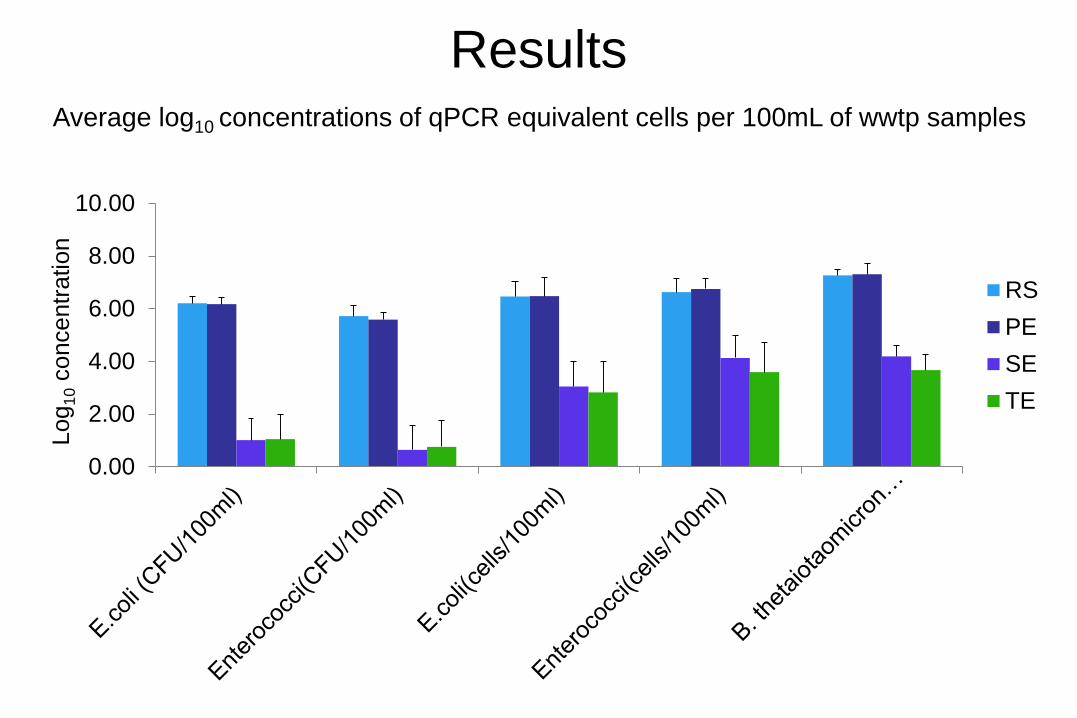
Results
0.00
2.00
4.00
6.00
8.00
10.00
Log
10 c
oncentr
ation
RS
PE
SE
TE
Average log10 concentrations of qPCR equivalent cells per 100mL of wwtp samples

Average log10 reduction during wastewater treatment process
3.03
3.59
3.64
4.97
5.17
0.00 1.00 2.00 3.00 4.00 5.00 6.00
Enterococci(cells/100ml)
B. thetaiotaomicron (cells/100ml)
E. coli(cells/100ml)
Enterococci(CFU/100ml)
E. coli (CFU/100ml)

Enterococci vs. B. thetaiotaomicron qPCR signals
In Wastewater
y = 0.9739x + 0.4525 R² = 0.7916
0.00
2.00
4.00
6.00
8.00
10.00
0.00 2.00 4.00 6.00 8.00 10.00
Log 1
0 B
. th
eta
iota
om
icro
n c
on
cen
trat
ion
, (c
ells
/10
0m
L)
Log10 enterococci concentration, (cells/100mL)
Raw sewage Primary effluent Seondary effluent Tertiary effluent

E. coli vs. B. thetaiotaomicron qPCR signals in Wastewater
y = 0.8523x + 1.5687 R² = 0.8766
0.00
2.00
4.00
6.00
8.00
10.00
0.00 2.00 4.00 6.00 8.00
Log
10 B
. th
eta
iota
om
icro
n
concentr
ation
(cells
/100m
L)
Log10 E.coli concentration (cells/100mL)
Raw sewage Primary effluent Secondary effluent Tertiary effluent

Comparison of E. coli CFU and cells in
wastewater treatment samples
0.00
2.00
4.00
6.00
8.00
RS PE SE TE
Log
10 c
on
ce
ntr
atio
n E.coli (cfu/100mL)
E.coli(cells/100mL)

Comparison of enterococci CFU and cells
in wastewater treatment samples
0.00
2.00
4.00
6.00
8.00
RS PE SE TE
Lo
g1
0 c
on
ce
ntr
atio
n
enterococci(cfu/100mL) enterococci(cells/100mL)

Comparison between secondary effluents before and
after chlorination
0.00
1.00
2.00
3.00
4.00
5.00
Log
10 C
oncentr
ation
SE (Pre-chlorination)
SE (Post-chlorination)

0 2 4 6 8
T ota l Co liform s (cfu /100m L)
Fecal Co lifo rm s (cfu /100m L)
Enterococci (cfu /100m L)
C .perfringens (cfu /100m L)
C oliphage -15597 host (p fu /100m L)
C oliphage -F-am p host (p fu /100m L)
Ente rovirus MPN /100L
G iard ia (cysts/100L)
C ryptosporid ium (oocysts/100L)
Log concen tra tion of m icroorganism s
Plan t A
In flow
a) C om parison of d istribution of pathogens and indica tors in in fluent and effluent sam ples from
wastewater reclam ation p lant A. Sam ples collected under peak flow conditions.
0 2 4 6 8
Plant A
O utflow
Bacteria, parasites and viruses
in non-potable reclaimed water
0 2 4 6 8
T ota l Co liform s (cfu /100m L)
Fecal Co lifo rm s (cfu /100m L)
Enterococci (cfu /100m L)
C .perfringens (cfu /100m L)
C oliphage -15597 host (p fu /100m L)
C oliphage -F-am p host (p fu /100m L)
Ente rovirus MPN /100L
G iard ia (cysts/100L)
C ryptosporid ium (oocysts/100L)
Log concentra tion of m icroorgan ism s
Plant B
In flow
b) Boxplo t o f dis tribution o f pathogens and ind icators in in fluent and e ffluent sam ples from
wastewater rec lam ation p lant B. Sam ples co llected under peak flow cond itions.
0 2 4 6 8
Plant B
O utflow
0 2 4 6 8
Tota l Coliform s (cfu /100m L)
Feca l Coliform s (cfu /100m L)
Enterococci (cfu /100m L)
C .perfringens (cfu /100m L)
C oliphage -15597 host (p fu /100m L)
C oliphage -F-am p host (p fu /100m L)
Enterovirus M PN /100L
G iard ia (cysts/100L)
C ryp tosporid ium (oocysts/100L)
log concentration data
Log concen tra tion o f m icroorganism s
c) C om parison of d istribution of pathogens and ind icato rs in in fluents and effluents from wastewater
reclam ation p lant C . Sam ples co llected under peak flow conditions.
Plant C
In flow
Plant C
O utflow
0 2 4 6 8
Secondary,
Filtration,
Disinfection

1
10
100
1,000
10,000
100,000
1,000,000
Influent
(A)
Pre-Chlorination
(B)
Post-Dechlorination
(C)
E. c
oli
(MP
N/1
00
mL)
Activated Sludge - Event 2 Grab 1Activated Sludge - Event 2 Grab 2Activated Sludge - Event 2 Grab 3Activated Sludge - Event 2 Geometric MeanHigh-Rate Clarification - Event 2 Grab 1High-Rate Clarification - Event 2 Grab 2High-Rate Clarification - Event 2 Grab 3High-Rate Clarification - Event 2 Geometric MeanOutfall 001 NPDES Weekly Geometric Mean LimitOutfall 001 NPDES Monthly Geometric Mean Limit
Grab sample HRC-B-3 reported
>24,200 which is shown here
REMOVAL OF E.COLI THROUGH CONVENTIONAL AND
INNOVATIVE SEWAGE TREATMENT
1
10
100
1,000
10,000
100,000
1,000,000
Influent
(A)
Pre-Chlorination
(B)
Post-Dechlorination
(C)
Ente
roco
cci (
MP
N/1
00
mL)
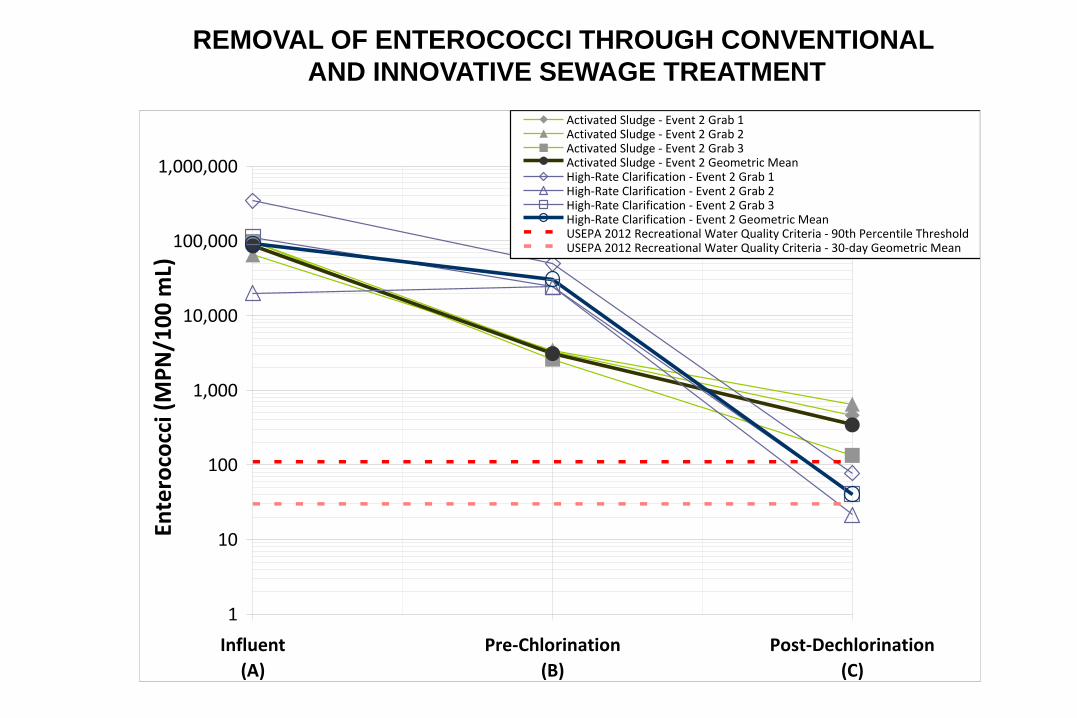
Activated Sludge - Event 2 Grab 1Activated Sludge - Event 2 Grab 2Activated Sludge - Event 2 Grab 3Activated Sludge - Event 2 Geometric MeanHigh-Rate Clarification - Event 2 Grab 1High-Rate Clarification - Event 2 Grab 2High-Rate Clarification - Event 2 Grab 3High-Rate Clarification - Event 2 Geometric MeanUSEPA 2012 Recreational Water Quality Criteria - 90th Percentile ThresholdUSEPA 2012 Recreational Water Quality Criteria - 30-day Geometric Mean
REMOVAL OF ENTEROCOCCI THROUGH CONVENTIONAL
AND INNOVATIVE SEWAGE TREATMENT
0
1
10
100
1,000
Influent
(A)
Pre-Chlorination
(B)
Post-Dechlorination
(C)
Som
atic
Co
liph
age
(P
FU/m
L)
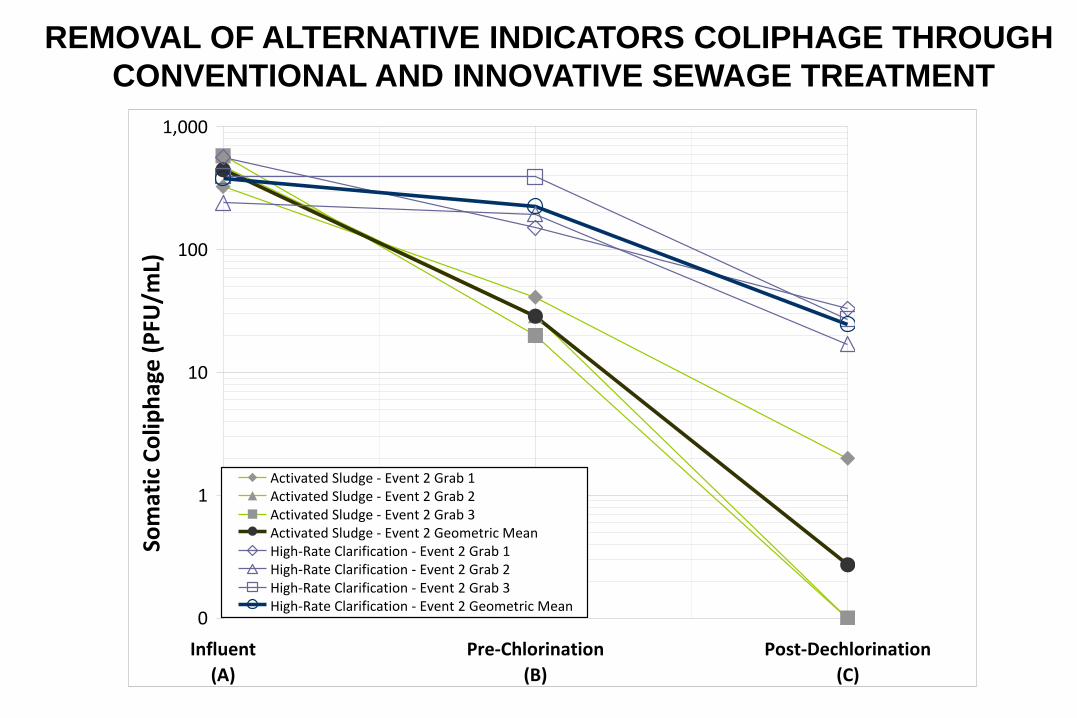
Activated Sludge - Event 2 Grab 1Activated Sludge - Event 2 Grab 2Activated Sludge - Event 2 Grab 3Activated Sludge - Event 2 Geometric MeanHigh-Rate Clarification - Event 2 Grab 1High-Rate Clarification - Event 2 Grab 2High-Rate Clarification - Event 2 Grab 3High-Rate Clarification - Event 2 Geometric Mean
REMOVAL OF ALTERNATIVE INDICATORS COLIPHAGE THROUGH
CONVENTIONAL AND INNOVATIVE SEWAGE TREATMENT

Removals of Coliphage versus Viruses
ORGANISM
CONVENTIONAL HRC
Influent to Activated Sludge
Effluent (pre-chlorination)
Activated Sludge Effluent (pre-
chlorination) to Disinfected
Effluent (post-dechlorination)
Influent to Disinfected
Effluent (post-
dechlorination)
Influent to HRC Effluent
(pre-chlorination)
HRC Effluent (pre-
chlorination) to
Disinfected Effluent
(post-chlorination)
Influent to Effluent
(post-chlorination)
Total Cultivable
Virus a
-0.33 b 2.47 2.14 0.24 0.88 1.11
Adenovirus a
-1.81 b 2.47 0.66 0.74 -0.14 0.60
CONVENTIONAL HRC
ORGANISM
Influent to HRC
Effluent (pre-
chlorination)
HRC Effluent (pre-
chlorination) to
Disinfected Effluent
(post-chlorination)
Influent to
Effluent
(post-
chlorination)
Somatic phage a
0.38 1.48 1.85 0.39 0.53 0.93
Male-specific
phage a
1.21 0.64 1.85 0.39 0.09 0.48

In conclusion • Molecular methods are rapidly evolving and can be used to obtain results in
as little as 5 to 6 hours.
• Currently in Michigan and in the Great Lakes, a qPCR laboratory, protocols,
and training modules are being developed to be used by county health.
• Targets will be source tracking markers and pathogens
• Eventually certification will be developed.
• Rapid response during flooding, contamination events and outbreaks with
these tools provides information that can be used for decision making.
• Will be able to tie this to risk assessment
Recommendations • Use advanced technology for water diagnostics to
improve resolution of the evidence for decision
making, including MST tools for the identification of
the source of contamination.
• Improve wastewater management and the return
flows/recycle/reuse to address future water quality.
• Develop the 21st century water curriculum for future
water scientists, technicians and engineers.
• Obtain 3 log removal of viruses as a goal for
treatment. Address high flow events. This will protect
and restore water-related ecosystems.

THANK YOU