control of nuclear propulsion plant power transients
TRANSCRIPT

CONTROL OF NUCLEAR PROPULSION PLANTPOWER TRANSIENTS
Howard Ma it land Chatham

Llt) duate Scnool

%* A ft
rubfj 1"
nnuu l ounuu
lonterey, California
CONTROL OF NUCLEI PROPULSION PLaNTPOWER TRANSIENTS
by
Howard Maitland Cnatham
June 1975
Th es i s Advi s or
:
A, Gerba
Approved for public release; distribution unlimited.
T167532


SECURITY CL AS5IFICATIOM OF THIS PAGE fWhmi Date Kntvred)
REPORT DOCUMENTATION PAGE READ INSTRUCTIONSBEFORE COMPLETING FORM
REPORT NUMBER 2. GOVT ACCESSION NO 3. RECIPIENT'S CAT ALOC NUMBER
4. TITLE (an.J Subline)
Control of Nuclear Propulsion PlantPower Transients
5. TYPE OF REPORT & PERIOD COVERED
Master's Thesis; June 1975
6. PERFORMING ORG. REPORT NUMBER
7. AUTHORS
Howard Maitland Chatham
6. CONTRACT OR GRANT NUMBERfa;
9. PERFORMING ORGANIZATION NAME AND ADDRESS
Naval Postgraduate SchoolMonterey, California 939^0
10. PROGRAM ELEMENT, PROJECT, TASKAREA a WORK UNIT NUMBERS
II. CONTROLLING OFFICE NAME AND ADDRESS
Naval Postgraduate SchoolMonterey, California 939^0
12. REPORT DATE
June 197513. NUMBER OF PAGES
U MONITORING AGENCY NAME 4 ADDRESS!-// different from Controlling Office)
Naval Postgraduate SchoolMonterey, California 939^0
XLtS. SECURITY CLASS, 'of thlt report)
UnclassifiedMm. DECLASSIFICATION- DOWNGRADING
SCHEDULE
16. DISTRIBUTION STATEMENT (of thlt Report)
Approved for public release; distribution unlimited.
17. DISTRIBUTION STATEMENT (of the- abttract entarad In Block 20, It different from Report)
18. SUPPLEMENTARY NOTES
19. KEY WORDS (Continue on tavataa eide If nidrt-/ and Idtr.tlty by block number)
Nuclear propulsion, simulation, AT .S, Savannah, power transients.
L
20. ABSTRACT (Continue on revaree side It neceeacjy and Identity by block number)
The nuclear propulsion plant of the N.3. Savannah is simplified andsimulated using Digital Simulation Language. The plant is subjected to anup power transient of sixty-five percent and a down power transient of eightypercent. Constraints are imposed to limit power excursions, minimize reactorcoolant hot leg temperature and. maximize boiler saturation temperature whilemaintaining average coolant temper: lure constant. Combinations of control rodmovement and changes in reactor coolant flow rate are studied in order to
PD 1 JAN 73 1473 EDITIOK OF 1 NOV 65 !S OeiOL r TE
(Page 1) S/N 0102-0H- 6601 I
SECURITY CLASSIFICATION OF THIS PAGE (Vhen Datn Entered)


JiCOKl T Y CLASSIFICATION OF THIS P A G E f» *i«n Oria Enttfl
determine the control systems that best satisfy the constraints and minimizethe time to steady state for each transient.
DD Form 1473, 1 Jan 7?
S/N 0102-014-6601 SECURITY CLASSIFICATION OF TW'.S P*GE(T«im D»f En<»r»4>


Control of Nuclear Propulsion PlantPower Transients
by
Howard 'Mai t land /Chatham
Lieutenant, United States NavyB.S., Iowa State University, 1 968
Submitted in partial fulfillment of thp


Library
Naval PpstgraauatMonterey, California 9
ABSTRACT
The nuclear propulsion plant of the N.S. Savannah is simplified
and simulated using Digital Simulation Language. The plant is
subjected to an up power transient of sixty-five percent and a
down power transient of eighty percent. Constraints are imposed
to limit power excursions, minimize reactor coolant hot leg tem-
perature and maximize boiler saturation temperature while main-
taining average coolant temperature constant. Combinations of
control rod movement and changes in reactor coolant flow rate are
studied in order to determine the control systems that best satisfy
the constraints and minimize the time to steady state for each
transient.
4


TABLE OF CONTENTS
I. INTRODUCTION 13
II. N.S. SAVANNAH 16
A. THE SHIP 16
B. THE POWER PLANT 16
1. The Primary System 16
2. The Secondary System 19
3. The Plant Model 19
III. REACTOR KINETICS AND THERMODYNAMICS 22
A. THE REACTOR KINETICS EQUATIONS 22
B. THE THERMODYNAMIC EQUATIONS 24
1
.
Reactor Heat Transfer Equations 24
2. Heat Exchanger Equations — 24
3. Modification of the Point Equations 25
IV. TRANSIENT ANALYSIS WITHOUT CONTROLS 26
A. TRANSIENT SELECTION ~ 26
B. THE UP POWER TRANSIENT 27
C. THE DOWN POWER TRANSIENT 27
V. CONTROL FOR THE UP POWER TRANSIENT 33
A. BASIC CONTROL 33
B. CONTROL LIMITS 33
C. CONTROL SYSTEMS 34
1. T Control 34ave
2. Anticipatory Control 35
3. Discrete Flow Change 39
4. Continuous Flow Change 43
5


VI. CONTROL FOR THE DOWN POWER TRANSIENT 50
A. EASIC CONTROL 50
B. CONTROL PROBLEMS 50
C. THE NEW TRANSIENT $1
D. CONTROL SYSTEMS 54
1 . T Control 54ave
2. Anticipatory Control 54
5. Discrete Flow Change 58
4. Continuous Flow Change 65
VII. CONCLUSIONS AND RECOMMENDATIONS 69
A. CONCLUSIONS 69
1 . The Up Power Transient 69
2. The Down Power Transient 69
3. Final Control •:
69
B. RECOMMENDATIONS FOR FURTHER STUDY 70
APPENDIX THE COMPUTER SIMULATION 71
COMPUTER PROGRAM DOWN POWER EXAMPLE — 73
BIBLIOGRAPHY 75
INITIAL DISTRIBUTION LIST 76


LI3T OF TA3LE3
TABLE I N.S. SAVANNAH PRIMARY AJW SECONDARY CHARACTERISTICS 18


LIST OF DRAWINGS
2-1 SIMPLIFIED DIAGRAM OF THE NUCLEAR POWER PLANT 21
4-1 SYSTEM TEMPERATURES VERSUS TIMEUP POWER TRANSIENT WITHOUT CONTROLS 28
4-2 POWER LEVELS VERSUS TIMEUP POWER TRANSIENT WITHOUT CONTROLS 29
4-3 SYSTEM TEMPERATURES VERSUS TIMEDOWN POWER TRANSIENT WITHOUT CONTROLS 31
4-4 POWER LEVELS VERSUS TIMEDOWN POWER TRANSIENT WITHOUT CONTROLS 32
5-1 SYSTEM TEMPERATURES VERSUS TIMEUP POWER TRANSIENT, T CONTROL 36
ave
5-2 PO./ER LEVELS VERSUS TIMEUP POWER TRANSIENT, T CONTROL 3?
ave
5-3 CONTROL ROD HEIGHT VERSUS TIMEUP POWER TRANSIENT, T CONTROL 38
' ave
5-4 SYSTEM TEMPERATURES VERSUS TIMEUP POWER TRANSIENT, ANTICIPATORY CONTROL — 40
5-5 POWER LEVELS VERSUS TIMEUP POWER TRANSIENT, ANTICIPATORY CONTROL 41
5-6 CONTROL ROD HEIGHT VERSUS TIMEUP POWER TRANSIENT, ANTICIPATORY CONTROL 42
5-7 SYSTEM TEMPERATURES VERSUS TIMEUP POWER TRANSIENT, DISCRETE FLOW CHANGE 44
5-8 POWER LEVELS VERSUS TIMEUP POWER TRANSIENT, DISCRETE FLOW CHANGE 45
S-9 CONTROL ROD HEIGHT VERSUS TIMEUP POWER TRANSIENT, DISCRETE FLOW CHANGE 46
5-10 SYSTEM TEMPERATURES VERSUS TIMEUP POWER TRANSIENT, CONTINUOUS FLOW CHANGE 47
5-11 POWER LEVELS VERSUS TIMEUP POWER TRANSIENT, CONTINUOUS FLOW CHANGE 48
5-12 CONTROL ROD HEIGHT VERSUS TIMEUP POWER TRANSIENT, CONTINUOUS FLOW CHANGE 49
8


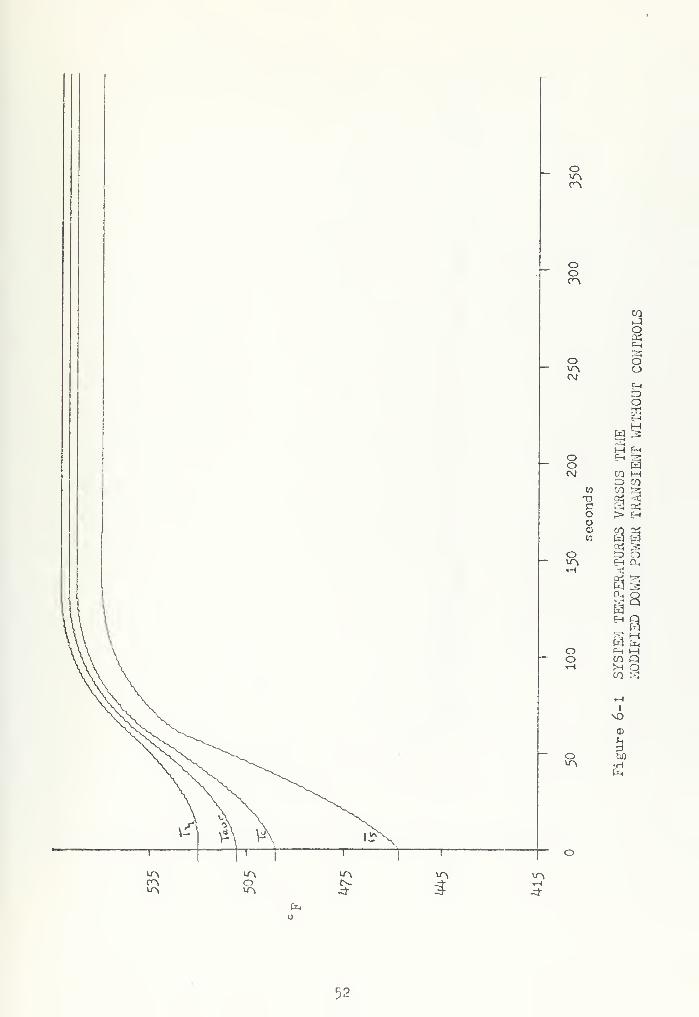
6-1 SYSTEM TEMPERATURES VERSUS TIMEMODIFIED DOWN POWER TRANSIENT WITHOUT CONTROLS 52
6-2 POWER LEVELS VERSUS TIMSMODIFIED DOWN POWER TRANSIENT WITHOUT CONTROLS — 53
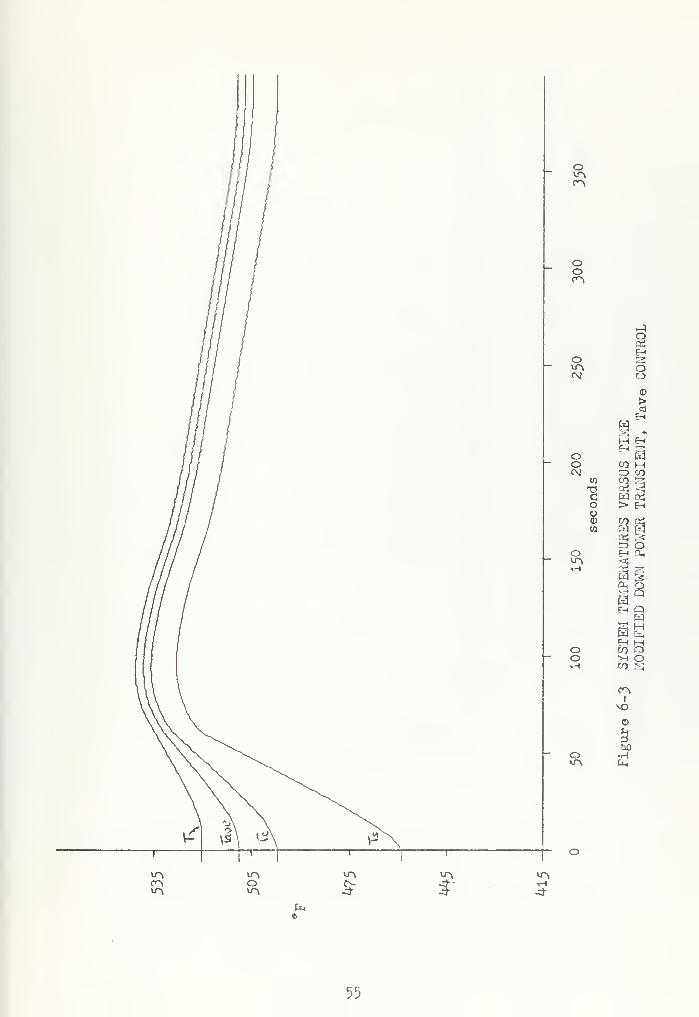
6-3 SYSTEM TEMPERATURES VERSUS TIMEMODIFIED DOW POWER TRANSIENT, T CONTROL 55ave
6-4 POWER LEVELS VERSUS TIMEMODIFIED DOWN POWER TRANSIENT, T CONTROL 56ave
6-5 CONTROL ROD HEIGHT VERSUS TIMEMODIFIED DOWN POWER TRANSIENT, T CONTROL 57ave
6-6 SYSTEM TEMPERATURES VERSUS TIMEMODIFIED DOWN POWER TRANSIENT, ANTICIPATORY CONTROL 59
6-7 POWER LEVELS VERSUS TIMEMODIFIED DOWN POWER TRANSIENT, ANTICIPATORY CONTROL 60
6-8 CONTROL ROD HEIGHT VERSUS TIMEMODIFIED DOWN POWER TRANSIENT, ANTICIPATORY CONTROL 61
6-9 SYSTEM TEMPERATURES VERSUS TIMEMODIFIED DOWN POWER TRANSIENT, DISCRETE FLOW CHANGE 62
6-10 POWER LEVELS VERSUS TIMEMODIFIED DOWN POWER TRANSIENT, DISCRETE FLOW CHANGE 63
6-11 CONTROL ROD HEIGHT VERSUS TIMEMODIFIED DOWN POWER TRANSIENT, DISCRETE FLOW CHANGE 64
6-12 SYSTEM TEMPERATURES VERSUS TIME.MODIFIED DOWN POWER TRANSIENT, CONTINUOUS FLOW CHANGE 66
6-13 POWER LEVELS VERSUS TIMEMODIFIED DOWN POWER TRANSIENT, CONTINUOUS FLOW CHANGE 67
6-14 CONTROL ROD HEIGHT VERSUS TIMEMODIFIED DOWN POWER TRANSIENT, CONTINUOUS FLOW CHANGE 68


TABLE OF SYMBOLS AND ABBREVIATIONS
SYMBOL DEFINITION
c Delayed neutron precursor concentration
c Reactor coolant specific heatrp
C Normalized delayed neutron precursor concentration
C Reactor coolant thermal capacity
C Boiler water thermal capacity
C - Fuel element thermal capacity
CRW Control rod worth
&T Temperature difference across the heat exchanger
DRW Differentia] rod worth
Boiler overall heat transfer coefficient\h Fuel element heat transfer coefficientr
H_ Feed water enthalpyfw
H Boiler steam enthalpy
K _„ Effective neutron multiplication factor
1* Prompt neutron lifetime
m Reactor coolant flow rateP
m Boiler steam flow rates
M Normalized reactor coolant flow rate
n Reactor neutron power
N Normalized reactor neutron power
P Normalized reactor thermal power
P Boiler steam pressures
q Reactor thermal power
t Time
10


SYMBOL DEFINITION
T Average coolant temperature in the heat exchanger
T Cold leg temperature at the heat exchangerc
T Average coolant temperature in the corecav
T Cold leg temperature at the reactorcc
T . Hot leg temperature at the reactor
T_ Average fuel temperature in the core
T, Hot leg temperature at the heat exchanger
T Boiler steam temperature
o< Fuel temperature coefficient of reactivity
ex. Coolant temperature coefficient of reactivity
/Q Effective delayed neutron fraction
A Effective delayed neutron precursor iecay constant
P Reactivity
V Normalized steam flow
A dot (•) above a variable signifies "che time derivative of that
variable.
11


ACKNOWLEDGEMENT
The author wishes to express his sincere appreciation to Professor
Alex Gerba, Department of Electrical Engineering, Naval Postgraduate
School, for his guidance throughout this study.
12


I. INTRODUCTION
As the energy crisis becomes more pressing every day, nuclear
power stands out as a most promising solution. Generation of electric
power from nuclear energy was first accomplished in 1951 at the Atomic
Enery Commission's (AEC) test facility in Idaho. Since then nuclear
power stations have been built for commercial use in many countries
and it has been estimated that three quarters of the total generating
capacity of the United States will be from nuclear power by 2000 AD.
But power generation on land at present takes a second seat to
marine plants. The United States alone has over one hundred ships
with nuclear propulsion systems. Russia, England and France also
have vessels with similar propulsion. The initial construction
costs have limited most of these to naval craft, though west Germany
and Japan have developed commercial ships with nuclear propulsion.
The United States also built a commercial nuclear vessel, the Nuclear
Ship (N.S.) Savannah, which has since been decommissioned.
The basic advantages of nuclear power versus fossil fuels are
the small amounts of fuel required for substantial power generation,
the relatively few pollutants generated, and the longevity of the
fuel before refueling is necessary. Initial set up costs and costs
of refueling are considerably more than for fossil fuel plants
but the fewer number of plants for the same power generation and
the longer lifetime of the plants more than counter-balance these
costs.£~&J
Marine nuclear power plants differ from stationery power generating
13


plants, normally they are smaller physically and the output size
required is less. In addition shipboard plants have more substantial
power transients imposed on them. An electric generating station
will have periods of peak load changes from normal steady state
demands but these are insignificant compared to the propulsion
orders that can arise in a maneuvering situation at sea. Power
transients of up to eighty percent are not unlikely and a different
mode of control than used on stationery plants is required.
Control systems on a nuclear plant keep system variables within
proper limits and shut down the reactor when possible damage to the
reactor or the environment is about to occur. Though the pressurized
water reactor, the normal plant for shipboard use, is inherently
stable it is also quick to respond. An automatic control system
for this propulsion plant would minimize the possibility of human
error, be able to cope with the quickness of response, and could
also reduce the number of watchstanders required to operate the
plant.
This thesis investigates the automatic control of a nuclear
propulsion system to large power transients. To insure the validity
of the system, the plant is modeled as closely as possible to that
of the N.S. Savannah, the only unclassified power plant for which
sufficient data was available. Similar load changes as applied
in this study were conducted during power range testing on the
N.S. Savannah with satisfactory results./~9/
The thesis is organized into sections as follows: first, the
N.S. Savannah is described paying particular attention to the pro-
pulsion systems; next the reactor kinetics and thermodynamics equations
14


for the plant are developed. Following these are sections covering
the results of the power transients to the plant without control
systems and then with various control schemes applied. Finally
the conclusions and recommendations for further study are discussed.
An appendix follows presenting the comments and problems on the
computer simulation.
15


II. N.S. SAVANNAH
A. THE SHIP
The Savannah was designed as a passenger-cargo ship and as
such even with a conventional propulsion plant might not have been
economical compared to bulk cargo ships. She was built to promote
the acceptance of nuclear vessels throughout the world and to serve
as a prototype for future merchant vessels. Because of the economical
problems she was subsidized by the government but run by civilian
concerns.
The ship began operations in early 19&2. She made several trips
overseas but political pressures in several countries against
nuclear power curtailed many port visits. After much "showing
of the flag" at home and abroad she was decommissioned in late 1971.
Even though economically unsound at the time the ship was termed
a success due to the performance of her propulsion plant, proving
that commercial nuclear systems were practical.^Y/
B. THE POWER PLANT
The basic nuclear power plant is divided into two system, the
primary and the secondary.
1 . The Primary System
This system generates the heat to boil water in the secondary
system. It consists of the nuclear reactor, coolant pumps and
piping, the heat exchanger and auxiliary systems. All of these
are enclosed in a containment device which prevents the release of
radioactive particles in case of some nuclear accident.
16


The reactor core is made up cf uranium dioxide formed into
thin fuel plates coated with a cladding material. Twenty-one control
rods made of enriched boron-stainless steel are inserted between
groups of fuel elements. The rods absorb neutrons and when fully
inserted into the reactor sufficient neutrons are absorbed to prevent
a self-sustaining nuclear reaction. As the rods are withdrawn less
neutrons are absorbed thus allowing more fissions to take place.
The fission process generates thermal energy which is con-
ducted through the cladding to water circulating through the reactor
core. The water is kept pressurized to prevent boiling in the
system. The water is forced from the reactor by coolant pumps in
two loops. Midway in each loop is a counter-flow heat exchanger.
This method of heat transfer to the secondary system is used to
insure there is no possible contamination of the propulsion system
by nuclear by-products in the coolant.
The major auxiliary systems consist of a pressurizer, coolant
purification and make up systems. A steam buble is created by
electric heaters in a pressure vessel piped to the coolant loop.
The higher temperature in the pressurizer maintains the bubble in
this system and not in the primary loop. The bubble allows for
thermal expansion and contraction in the primary system while
maintaining a relatively constant pressure. The purification system
draws off twenty gallons perminute of coolant to run through an
ion exchanger. The make up system stores the purified coolant and
charges additional water as necessary to the primary loops to maintain
volume./^" Oj
Data for analysis of this and the secondary system are
included as Table 1.^,9/
17

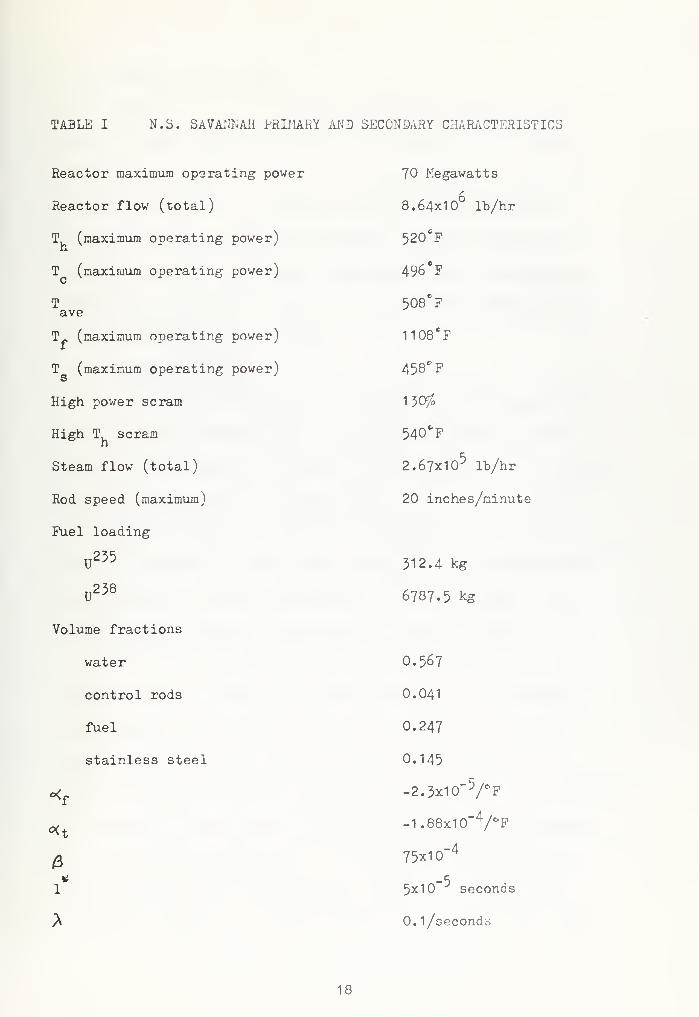
TABLE I N.S. SAVANNAH PRIMARY AND SECONDARY CHARACTERISTICS
Reactor maximum operating power
Reactor flow (total)
T, (maximum operating power)Q
T (maximum operating power)c
Tave
T (maximum operating power)
T (maximum operating power)s
High power scram
High T scram
Steam flow (total)
Rod speed (maximum)
Fuel loading
T235
U
u258
Volume fractions
water
control rods
fuel
stainless steel
ff
*1
70 Megawatts
8.64x10° lb/hr
520CF
496eF
508°F
1108CF
458CF
130/
540*F
2. 67x1 5 lb/hr
20 inches/minute
312.4 kg
6787.5 kg
0.567
0.041
0.247
0.145
-2.3x10" 5/
C,
F
75x10~4
5x10 seconds
0.1/secondo
18


2. The Secondary System
This system uses the heat of the primary system to create
steam in a boiler connected to the heat exchanger. The propulsion
system is very similar to most steam turbine systems. Steam from
each boiler is piped to a propulsion turbine, a turbo-generator,
the steam-driven feed pumps and auxiliary systems. The propulsion
turbines also have a steam dump which allows steam to be by-passed
around the turbine to the condenser. All condensed steam is pumped
back to the boilers by feed pumps.
3. The Plant Model
Due to the complexity of a nuclear power plant some simpli-
fication of the model was undertaken in order to carry out this
study. A single coolant loop primary plant was assumed. All primary
auxiliary system effects were neglected. Complete mixing in the
reactor and a constant differential rod worth were also assumed.
The ship's electrical loads (hotel loads) and auxiliary steam loads
were assumed to be constant regardless of the power level. Feed
v/ater temperature and flow rate were also assumed to be constant.
The actual variable available to the watchstanders on the
Savannah were steam flow (m ), coolant flow (m ), boiler pressures p
and temperature (P ,T ), coolant hot leg, cold leg and average
temperatures (T, ,1 ,T ), temoerature differential across thee v h ' c ave
'
heat exchanger (AT), neutron power (n), and control rod height.^ 8/
In a saturated steam system P corresponds to T and this variables s
was not used in the simulation. As the reactor thermal power is
equal to the temperature differential across the heat exchanger
multiplied by the coolant specific heat and the coolant flow rate,
19


hi and AT were combined into one term which when normalized becameP
P. Normalization of steam flow and neutron and thermal power allowed
comparison of the three power levels on the same plot. Other plots
generated were control md height and system temperatures. Control
rod height was zero referenced at one hundred percent steady state
power and represented the height of the group of rods which was
controlling the reactor.
Figure 2-1 shows a simplified diagram of the power plant
model.
20


OQ
w
o
I—
I
QQWMM
MCO
I
CM
CD
U
•H
21


III. REACTOR KINETICS AND THERMODYNAMICS
A. THE REACTOR KINETICS EQUATIONS
Reactor kinetics is the study of the time dependent behavior
of a nuclear reactor. The first equation equates the rate of change
of neutrons causing thermal fission to the rate of production of
prompt, delayed and source neutrons causing thermal fission less
the rate of loss of neutrons of all types. The other six equations
relate the rate of change of the six delayed neutron precursors
to the rate of production of each group of delayed neutron precursors
less their rate of loss.
To simplify the reactor model the six groups of delayed neutron
precursors are lumped into a single group.J^^J ^e decay constant
becomes dependent on the variation of K __ from one, defined as
reactivity, but has been assumed constant for this study with negli-
gible effect on the results. In addition, since the contribution
of source neutrons while operating above one percent power is insig-
nificant, this term was also neglected. Thus the equations are as
follows:
A = n .(1 - ) + 3- c - _n (3-1
)
lc
l'-K .«.eff
c = n.0-^.c (3-2)r
For use in the computer simulation and power comparisons,
normalization of these equations is convenient ._£ 3/ These normal-
ized forms are shown on the next page with N=n/n(0) and C=c/c(0).
The initial quantity is referenced to one hundred percent power.
22


= N.(K - 1) +£.(C - N) (3-3)5k *ff i*
N
eff
C = ;v(n - G) (5-4)
K „„ is the ratio of the number of neutrons produced from fissioneli
in one generation to the preceeding generation. When K __ equals
one the reactor is said to be critical and neutron population is
constant for successive generations. The power level is also constant
and a steady state condition exists. Increasing K __ causes increased
neutron production, the supercritical condition. Decreasing K ,
subcritical, causes a decrease in neutron product ion./~~Y7
Three major factors affect K „_. These are average coolant
temperature in the core, average fuel temperature and control rod
height •j/lj/ An increase in coolant temperature decreases the density
of the water which causes less moderation, slowing down of fast
neutrons, and fewer thermal fissions occur. Thus K __ is reduced.eff
Numerically this is computed by multiplying the change in temperature
by a negative constant called the temperature coefficient of reac-
tivity, in this case <K . A similar effect takes place due to the
temperature of the fuel and this negative reactivity coefficient
is «<£..
The height of the control rods also changes reactivity. As
rods are withdrawn more reactivity is "inserted" in the core; driving
rods in reduces the reactivity. The amount of reactivity per inch
of travel is called differential rod worth (DRV/). For the Savannah
the DRW was computed to be 7 • 0x10" /inch.£~oJ The zero reference
for rod height was set for one hundred percent steady state power
and the control rod worth (CRW) is found by multiplying the DRW
by the rod height.
23


Combining all these terras and noting that -0.120988 i3 the
reactivity due to T at 508° P and Tf
at 1108*F, the following
equation results:
Keff
= 1.120988 +«t-T
cav +«Cf-T
f+ CEW (3-5)
B. THE THERMODYNAMIC EQUATIONS
1
.
Reactor Seat Transfer Equations
The total power generated in the reactor equals the thermal
capacity of the fuel times the rate of change of the fuel temperature
plus the heat transfer coefficient of the fuel times the temperature
difference between the fuel and the coolant in the core.
q = C -T. + h « (T_ - T ) (3-6)rf f r f cav' v '
And the latter term equals the thermal capacity of the coolant
times the rate of change of the average coolant temperature in the
core plus the coolant flow rate times the specific heat of the coolant
times the temperature difference of the coolant across the reactor.
c
h • (T. - T ) = C, • T + m . c - (T . - T ) (3-7)r v f cav' bp cav p rp ch cc 7 '
where T = (T . + T )/2. (3-8)cav v ch cc" v J
2. Heat Exchanger Equations
The coolant flow rate times the specific heat of the coolant
times the temperature difference of the coolant across the heat
exchanger equals the thermal capacity of the coolant times the
rate of change of the average temperature of the coolant in the
heat exchanger plus the heat transfer coefficient of the heat ex-
changer times the temperature difference between the coolant average
temperature in the heat exchanger and the saturated liquid in the
boiler.
m . c • (T, - T ) = C, • T + h. * (T - T ) (3-9)p rp v h c' bp ave d
v ave s 7
24


And the latter term is equal to the thermal capacity of the boiler
liquid times the rate of change of the saturation temperature in
the boiler plus the steam flow rate times the difference of enthalpy
between the steam and the feed water.
h, . (T - T ) = C • T + m . (H - H„ ) (3-10)d ave s y bss s v s fw y w ;
where T = (T, + T )/2. (3-11)ave he' w '
3. Modification of the Point Equations
The above equations, representing the point model /JoJ',
do not account for the transport delays of six seconds in the coolant
loop nor in the boiler. Letting
Tch
(t) = Th(t+6) (3-12)
and Tc(t) = T
cc(t+6) (3-13)
the time rate of change of T, and T can be evaluated by expansionto h cc
by a Taylor series and neglecting second order and higher derivatives.
In addition the enthalpy difference in equation (3-10) is approx-
imately constant for this plant.
Evaluating constants as necessary, including coolant flow
effects, and normalizing all power and flow terms j_ 3/, the following
equations were used for the simulation:
Tf
= (600 N - Tf
+ Tcav )/25
(3-14)
T = (T. - T - 50 M (T - T ))/25 (3-15)cav v f cav v cav cc /7/ v '
T, = M (2 T - T. - T )/6 (3-16)h v cav h cc '
T = M (T -T )/6 (3-17)cc v c cc^'
T = 70 (P -H, )/3/M (3-18)s
T = (T, + T )/2 (3-19)ave h o."
T = ((2 - 0.48/M) T, + O.96 T /H)/(2 + O.48/H) (3-20)
P = 0.02 (T -T ). (3-21)v ave s '
25


IV. TRANSIENT ANALYSIS WITHOUT CONTROLS
A. TRANSIENT SELECTION
The transients selected for this study were an up power maneuver
of twenty to eighty-five percent and a down power maneuver of one
hundred to twenty percent. Both these transients were run on the
N.S. Savannah and its control system handled both these transients,
except as noted in section VI, satisfactorily ./"~§7 The up power
maneuver represents a load increse from normal "hotel loads" to a
"full bell" (normal full speed) in ten seconds. The down power
test represents the tripping of the propulsion throttle from maximum
power, a three second transient.
In the up power case steady state conditions were assumed to
have been reached when T was within three degrees of its finalave to
value and neutron power within four percent power of its final value.
For the down power case the temperature requirement remained the
same but due to the more significant overshoots the power band was
reduced to two percent.
It should be noted that due to the relatively lov; fuel enrichment
of this reactor a significant o^ is generated. Without this term
T would have to return to its initial steady state value afterave
any transient if no controls were applied. This characteristic
is used in many power plants where more highly refined uranium can
be used. In the Savannah this was not feasible but a constant
T control was still desired thus rod movement was used to counter-ave
act the fuel temperature effects./lj>7 Subsequent sections discuss
the restrictions and advantages of the T control system.Q.VG
26


B. THE UP POWER TRANSIENT
The up power transient was ran without any control system to
determine the natural system response. Steady state was reached
in ninety seconds after the start of the maneuver. As anticipated,
as T_ increases with power, to maintain K __ equal to one T mustf eff ave
decrease. AT increases as does the temperature difference between
T and T . Figures 4-1 and 4-2 present the plots of T, ,T ,ave s ° - ^ h' ave'
T , and T and H\ N and P versus time.c s '
Steady state values were as follows:
Th
= 478.7 "P ^ = 65'Ofo
T = 468. 5°F N = 81. 3$ave '
T = 458. 3°F P = 84.6^C
T = 426.
2
-F.s
The peak overshoot of N was nine percent power. The minimum
T was 423*0 P. It was noted that T was the first temperature toS S
respond, followed in order by T , T and T, . This is due to the* ' * c ave h
sudden change in steam demand draws energy from the boiler which
reduces T . The water in the heat exchanger has more heat removed
thus T decrease. T necessarily decreases and since the thermalc ave
power of the reactor is less than the steam demand T, increases
relative to T . But due to the rapid decrease in T , T, decreasesc c h
also. Also noted was the fact that neutron power lagged the thermal
power in the initial response by five seconds and it was over thirty
seconds before it caught up with P.
C. THE DOWN POWER TRANSIENT
The natural response of this transient reached stead.v state in
seventy seconds. Just the opposite of the up power transient occurred
27


vAC^
O>A
^A<MT-i
CO
OW HM O6-i O
o CO t-<o ^> :r>•^H CO o
w W E-lTIC > MOo C/-)
© W chw
VA -i COJ>-
E-< Q±
«=r" ^»
Oe-< a,COO S) &,
VTA CO =>
A©u3bO
VA •Hcv Cn
VA(A*A
>AoA -3-
ClH3
*AH-3-
28


O
CM•»-<
co
§F-i
Oooo B-*rH CDw o
w M SHTJ E-i MC 3:O coO rz> E-.o CO ^310 W M
*A :=> coo-
Ml
LEVELS
POWER
THAN
o O Q-.^C\i
1
-3-
©
VO •HC\2 fe
oo Ocvl
^
29


in the direction of the temperature values though the order of
response stayed the same. As before the neutron power lagged thermal
power. The initial delay was about three seconds and the crossover
point was not reached until seventy seconds. The peak overshoot
was only 2. 3,'° power. (This represents a 11. 57^ overshoot of the
steady state value as compared to only a 10.6';' overshoot on the
up power transient.)
Figures 4-3 and 4-4 show the results of this transient versus
time. Steady state values were:
Th
= 559. 8*F f = 20.0;$
T - 557.
3
CF N = 21.21
ave
T = 554.
8
C F P = 21.1$
T = 546. 8°F.s
The maximum T, was 562.7 F.h
30


T
O
rH CO
Iw 6M
O "T)O CO oi-l 3 "3
CO r_|
W>5l M
n >c Eho 00 2o kj egQ> c=: hW tD CO
^> j* cCN- 32 en!
o
CV
oa,
r3
en
•H
o I -3-
fc
31


o
CMt-H CO
o
ou
o !=>o otH 3^
w M 3T) C-(
c e-i
oo0) CO Mw oi COW S3
in{N-
CO (H
la-q o
a,
o 2.8
*n •HCM fc,
V*.
32


V. CONTROL FOR THE UP POWER TRANSIENT
A. 3ASIC CONTROL
The normal control system for a pressurized water reactor is
to keep T in a specified band. The primary reason for maintaining
T in this transient is to raise T .P\2j Without controls it wasave s l '
onoted that T dropped to 425 F. The higher T can be kept the more
o S
efficient the secondary plant will be. The Savannah used a control
of T = 508 + 3 F which was adopted in this study also. Since
in this case T decreased rod withdrawal was required to addave
reactivity to the core and raise system temperatures. The maximum
rod withdrawal rate of twenty inches per minute was used to help
speed up the response of the plant.
B. CONTROL LIMITS
In order to prevent excessive power generation in the core from
causing a reactor accident, an automatic insertion of all control
rods (scram) is initiated when N reaches 130$. Due to the tolerances
involved in the power detection instruments and in the scram cir-
cuitry a ten percent power band below the scram set point was
determined to be the maximum power allowable in this simulation.
To insure that this limitation would not be exceeded by any
transient a test was run using a twenty to one hundred percent
maneuver. When N reached 120;£ rod motion was terminated but power
kept on increasing until it just reached 130$. It was evident
that a lower power limit was required. Using a 110' limit the max-
imum power attained was 117$. Limits in between the two limits
33


either exceeded or were extremely close to MO'/o thus the 110"'' was
adopted for further transients.
Attempting the test tx-ansient with this limit resulted in a
maximum power of 118$ but a further difficulty was encountered.
Since rod motion can only counter less than 1.25'F per second,
T had originally dropped but was increasing and had reached
495eF when rod travel ceased. T continued to increase and when
ave
power dropped below 110$ rods were bumped to maintain that level.
When T reached its lower limit of 505°F rod motion again ceasedave °
but as T rose above 511 F rod insertion commenced. Bv the timeave
T turned at 513CF power had been driven down to 59^ and was
ave
still decreasing.
This over action necessitated a rod position limit. The rod
worth corresponding to T at 508°F and dependent on steam demand
was used as the limit. Since T_ at steady state equals T plusf ave
^ times 600, the limit was 0.0138- (^ - 1). This corresponds to a
rod height of 1 9« 7- (4^ - 1) inches. Not allowing rod withdrawal
past this point precluded the extreme power and temperature
oscillations encountered above.
C. CONTROL SYSTEMS
1 . T Controlave
The 20 to &5?o transient was run using the above limits and
steady state was reached in 1 50 seconds. Steady state values were;
\ = 515.3 F V = 85.0/0
T = 505.0 F N = 87.9$ave
Tc
= 494.7 F P - 85.3/o
T = 462.3 F.s
34


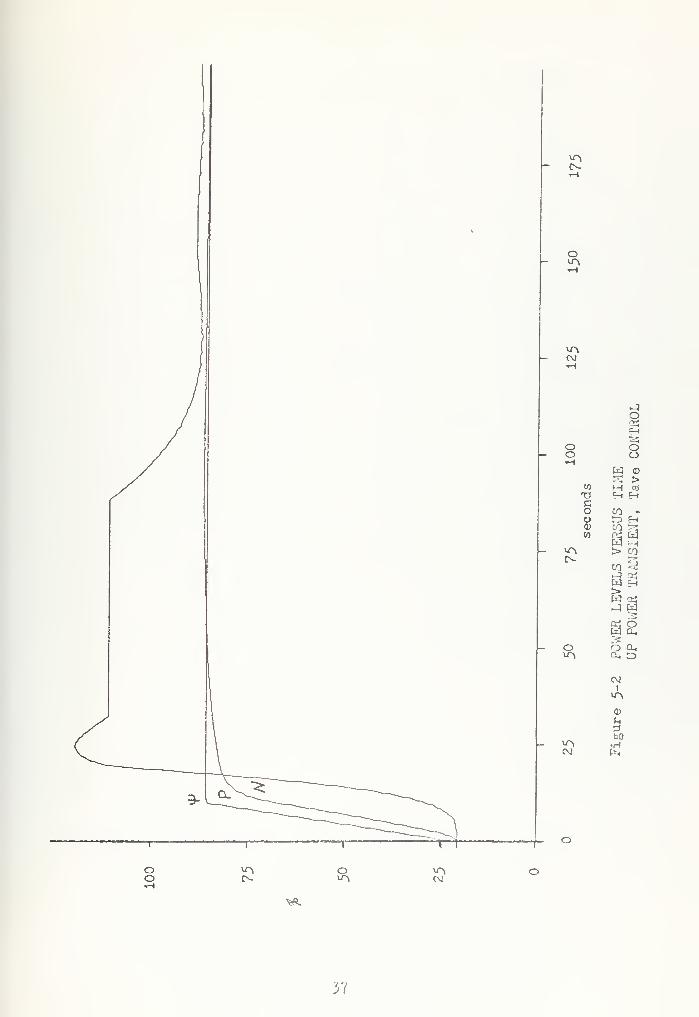
Figures 5-1 > 2 and 3 show the plot3 of temperatures, power
levels and control rod height versus time. The minimum T reacheds
was 443 • 2 F, well above the minimum for the system response without
controls. Maximum power was 118.2^ and though N again lagged P
initially, the crossover point was reached in only eighteen seconds,
substantially less than in the previous run.
It was also noted that N was still in excess of Y and P
after 200 seconds. This was due to the fact that the fuel with its
slower time response than the coolant had not reached its final
value. In order to raise T_ the neutron power must be greater than
the thermal power and as the steady state value of T is approached
the difference in power levels will diminish.
Initial rod motion was at the maximum rate of twenty inches
per minute. But during the period of bumping rods to maintain the
110;o N limit an average rate of 8.67 inches per minute was obtained.
2. Anticipatory Control
In an effort to reduce the response time, early rod with-
drawal was initiated. As soon as steam demand exceeded neutron
power by a five percent tolerance band the rod pull was commenced
instead of waiting until T exceeded its band.to ave
In this case steady state was reached in 135 seconds even
though rod travel was only initiated five seconds sooner than in
the previous case. Steady state values were as follows:
Th
- 515.2*F Y = 85.6%
T = 505.&P N = 87.3''
ave
T = 494. 8°F P = 85.4,'Sc
T = 462. 3°F.s
35


o
CM
oo
w
coo
O
CM
W ^§
eh aoen oCO Q)
P3 **
> Eh
COWgE-i
Fh
HCO
EH
aEHCO
co n>
oa,
I
vp»
©
•H
o 3 3-
Cxh
36

O
CM
Occ!
Eh£5o Oo OH
w M CO
T> Eh EhCo CO -o tD EhCD CO 2;CO as
VA > COC^-
CO ^
erf 6W CL,
O o a.O, 23
CM1
Q)
•HCM C*<
o
Vfc.
37


Oin
CM
OISM *JZo Eh Oo O
•H CO
CO >w 25 tfl
T) W EhC >O *O Eh F-«
0)
CO giu^ as{>-
Q o^O EH
O 325 OEh O,
o 6 a,^ C_> CD
1
a>
uz>
tou^ •Hcv &4
-3-
I
001
to
©
C•H
C\J
1
VOHI
oCM
I
38


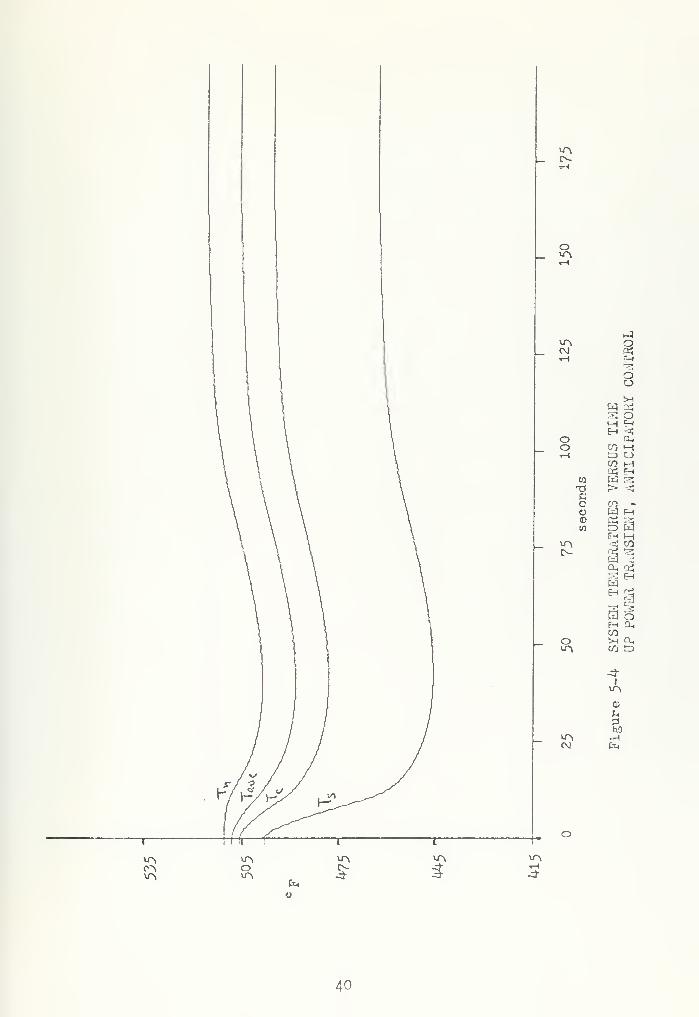
Minimum T was only 446 P in this case, an increase aboves
the previous run. Maximum power reached 119,'; and the crossover
point for N and P was only fifteen seconds. Again the initial
rod withdrawal was at twenty inches per minute whereas the subsequent
average rate was 9« 1 2 inches per minute. See figures 5-4,5 and 6.
3. Discrete Flow Change
Many reactor plants have the capability of two speed coolant
pumps. At high power levels, normally above 5C^> the pumps are
shifted to the faster speed usually twice the flow rate of the
slow speed. This reduces the AT and with T constant decreasesave
T, . As this is a desirious result as will be discussed for theh
down power transient, an investigation of this flow change was
conducted for the up power maneuver too.
A simulation was run without temperature control but with
the coolant pump shift at ^Qffa N and steady state was reached in
ninety-four seconds, only slightly slower than without the pump
shift.
Another run using the T control and the pump shift reachedfc' ave
steady state in 1 56 seconds only six seconds slower than without
the flow change.
Combining all three control schemes steady state was reached
in 141 seconds. This also was only six seconds slower than the
anticipatory control case. Steady state values in this case were:
T^ = 510. 1°F H* = 85.O'
n
T = 505. 0"F N = 87.9$ave
T = 499. 9"F P = 85.8$c
T = 462.
1
CF.
s
39

1-1
o
-1VA OCM «iH =H
"^OOtH
S! OM EHEH <4
O o,o CO M1-1 CZ> O
CO Mq=: eh
w W 373 > <!CO CO -O W Eh<D « S3W
Eh mVA * COCN-
a, ccj
a ehmEh ^§ OEh Q-,
COO t=H a,VA CO C3
»A
0)
60VA •HCM Ph
en>A
lO ino C>-kO
'J
-3-
>A
5 -3-
40


-3of-<
Oo
a;o
S!MOW M
CD
\s^
41


I— c^-
o
^*A o<M cc;*H
oo>H
O E-t QhO MH CO O^> MCO Eh
S§jc >o •>
o EH EH0)
w 33t-t M
LA H LQC^-
Q SjO Eh
hH [3
a; oEh cu
O O CL,
VA
iA •HCM Cn
42


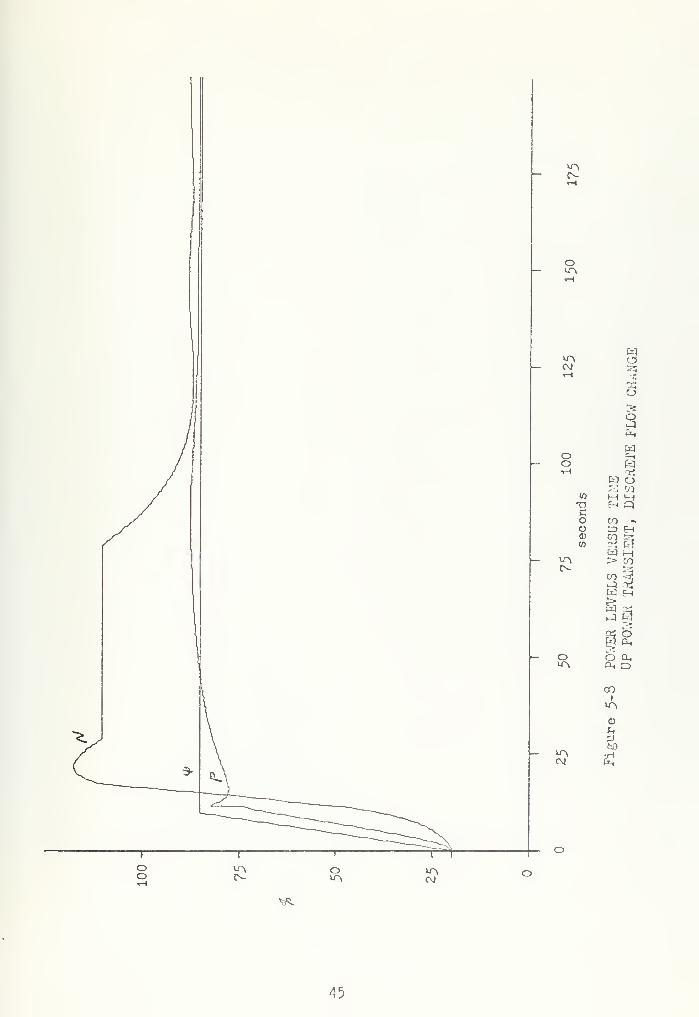
The system showed an increased T minimum of 447.
1
6F and
a reduced power level maximum of 117$. More of an overshoot in P
was observed than before, 2.5'' power, and the second rod withdrawal
average rate was reduced to 8.66 inches per minute. Figures 5-7 >
8 and 9 show the pertinent data.
4. Continuous Flow Change
In an attempt to reduce the response time a continuous flow
change was assumed. The coolant pump was assumed to be variable
speed, normal flow rate at Op power and twice that rate at 100p*
steam flow. In between a linear relationship was assumed thus
M equaled y plus one. Steam flow was used in this control because
N was known to exceed 100'' whereas steam flow was limited by the
boiler and turbine construction.
In this case the transient system reached steady state in
138 seconds, three seconds faster than in the previous case.
Minimum T was 447. 8°F and maximum power was II7.'. Figures 5-10,s
11 and 12 shew the variable plots and steady state values were:
T = 510.5CF i = 85.O7S
T = 505. 0°F N = 87.8.'ave
T = 499. 5°F P = 85.7/c
T = 462. 1°F.s
The P, N crossover point was Just over fifteen seconds and
the second rod withdrawal average rate was 8.76 inches per minute.
43


O-
o
wUA oCNJ
i-H 5
O
MEn Wo pho co W
1-1
CO oc=; co
W W MT; > QCO co -o W En0) as asK CO CxJ
Eh Min t; coc^
a, 3
E-< ^W OEh a,COo sh a,
CM
CO CO
©
to•H
o
44

o
W^ OCMH 9
x!OISoH
o Eho wT-i
Si COw M MTJ Eh QCO co -O tD En© co s;w erf £1
fxJ MVT\ > co£N-
CO ^C£l Eh
o 6 ex,VA a, o
00i
o
u^ •Hcv &h
o
^
45


o
Wun. O<M a;*H
O
oW [X,
o E-< Eno WH CO ^CO co
Hi ^H HW Qc >o m>
o •h e-i<D k s:W o w
^ 03CV
JTROL
ROD
H
POWER
TRA1J
o o a,"A
ON1
<D
uto
"A •HC\j fc<
i
COI
oc
CMrH
I
VO
I
OCM
I
46


o
wCJ
3u-> -«
C\J c5T-i
|3O
w§3 CO
r* oo co ao £> M1-i CO EH
(3 ow > oxsc CO -o W P-H
o ft: a© t3 Ww E-t M< co
vr\ §3C^
rq f-i
(3E-< Qi
« ei oe-i a,COVl Ql,
O CO 13VA
O«!
0)
*-•
VO •HCM fe
VA
>AO 3fc,
47


O
wo^
»A trj
CM Oy-i
5=O
oO 23o HtH
IME ONT
w E-l OTSc oo -o 13 Eho 00 3
33<Dto
> COVA
00 S*O-
p^gW a{h-q W
W a,~jg
o a,o a. ^>vn
VA
u3W>
»A •HCM Ct|
^.
48


O
O|u\ 35
CM aT-l
o
fcq CI3 EDM OE-i tr>o £=*
o CO HtH
CO ^Q5 o
w w oT) >C «o En E-f
oQ)
WW CO
o- Q c4O Eh
O 3=ttl oEh Oh
O Q-o o cr>
*A
CMH
©?H
3M»T\ •HCM tn
49


VI . COHTilOL FOR THE DOWN POV/ER TRANSIENT
A. BASIC CONTROL
As with the up power transient the control for the down power
transient is based on maintaining T = 508 + 3°F. But insteadave
of attempting to raise T , decreasing T is one of the primaryS n
concerns. High T could cause fuel cladding burnout and release
of fission products to the coolant. The N.S. Savannah had a high
oT, scram at 540 F and this limit was adopted for this study. As
temperature indicators are more accurate than power instruments
the large tolerance band needed for the high power scram is not
needed for the high T scram.
Another concern is power overshoot, i.e., power decreasing
below the twenty percent steam demand. Many reactor accidents are
more severe at low power levels and levels of less than one percent
virtually shut down the reactor.
Since T needed to be decreased, as seen in figure 4-3* rodsave
were inserted into the core.
B. CONTROL PROBLEMS
T control was attempted using several rod speeds and controlave
limits. Using the maximum speed power decrease to less than one
percent. A minimum power limit of 15' was established to allow
rod motion after N had past M* thus continuing to reduce T but
keeping power above several percent. To preclude the temperature
and power oscillations noted in the up power transients the same
rod limitation was imposed. Thus rods could not be inserted past
50

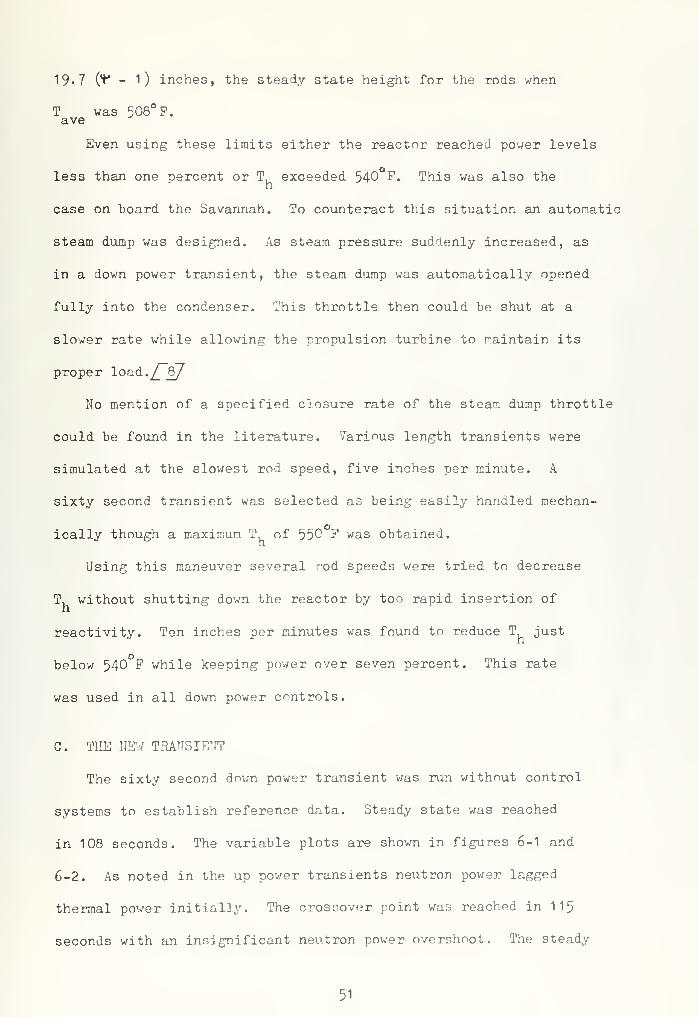
19-7 (y - 1) inches, the steady state height for the rods when
T was 508eF.
ave
Even using these limits either the reactor reached power levels
less than one percent or T exceeded 540 F. This was also the
case on board the Savannah. To counteract this situation an automatic
steam dump was designed. As steam pressure suddenly increased, as
in a down power transient, the steam dump was automatically opened
fully into the condenser. This throttle then could be shut at a
slower rate while allowing the propulsion turbine to maintain its
proper load.^8/
No mention of a specified closure rate of the steam dump throttle
could be found in the literature. Various length transients were
simulated at the slowest rod speed, five inches per minute. A
sixty second transient was selected as being easily handled mechan-
ically though a maximum T, of 550 F was obtained.
Using this maneuver several rod speeds were tried to decrease
T, without shutting down the reactor by too rapid insertion of
reactivity. Ten inches per minutes was found to reduce T just
below 540 F while keeping power over seven percent. This rate
was used in all down power controls.
C. THE NEW TRANSIENT
The sixty second down power transient was run without control
systems to establish reference data. Steady state was reached
in 108 seconds. The variable plots are shown in figures 6-1 and
6-2. As noted in the up power transients neutron power lagged
thermal power initially. The crossover point was reached in 115
seconds with an insignificant neutron power overshoot. The steady
51

o
ooo^
CO
3o Ou^ OCM
IME T
WITHOUT
O P-H 3O wCM CO M
CD COw CO 3T) erf ^C d *rf
o > e-»
o
(0
o C3 b^ Eh (X,
T-l
IS
o ^ Mo CO QT-t >H O
co S
1
\o
<D
o bflVA •H
o 5


o
oo0^
CO
o
o ow^ oCM
EHt=>o
o S:oCM H
w co-a W r^
o H ct|
o Ph fn0)
00 CO rri
!=> Wco 3=oPi 9w a,
-rH
LEVELS
V
IED
DOWN
oerf i,W Mo \3. Q
•«H o o
CM1
VO
<r>
u
o b0u^
si
oo o-oin CM
Vi.
53


state values of temperature remained the same as for the three
second transient while N was 22.0/' and P was 21 ,0/{-.
D. CONTROL SYSTEMS
1
.
T Controlave
With this control system the steady state conditions were
reached after 356 seconds. Figures 6-3, 4 and 5 show the pertinent
plots. Steady state values were:
T, = 510. 4*F Y = 20.0$n
T = 508. 0°F N = 18.0fcave '
T = 505. 6°F P = 19.8$c
T = 498. 1*F.s
Maximum T was just under 540 F and minimum N was 7»47»«
N reached P after about thirty seconds and maintained about the
same rate of decrease until thermal power reached 22;£. Because
of the longer and less peaked power overshoot the subsequent rod
motion was not linear at first. After twenty seconds an average
rate of 1 .63 inches per minute was obtained while the initial rod
travel had been at a rate of ten inches per minute.
It should also be noted that the neutron power exhibits oscil-
lations of up to two percent power even after steady state. Though
T. . T . T , and T have stabilized T_ is still decreasing andh/ ave c s f
as N is affected the most by T and is more responsive to reactivity
changes at low powers these oscillations will continue for several
minutes.
2. Anticipatory Control
In this case rod insertion was commenced when steam demand
was less than neutron power by five percent. The response time
54

o
ooen
-H-o«Eho «=—
1
>n OCM
IMET,
Tave
C
o E-i So CO MCM o co
w CO STfC w o3O > Eho© CO ci
O eh a,>n <<T-l
Eh QW
E-1 wo co Qo in Ox-t CO s
en1
©
o •HVA Ek
vnen O 3'
55


o
oo
^)Occ:e-i
o 3^A OCM o
CD
>E-i
o §o M<\1 co
w W sTJ S ij
C M p2o <H EhoCD CO OLW
CO 3o W a,VA >tH
ER
LEVELS
IFIED
DOWN
o 7-7. QoQ-i «i|T-t
ii
CD
J-.
3bflo •H
VA fei
oo o VA
CM
J*.
56


o
oo
-1oa*p-io 25
u^ OC\J o
ID
>
o M 2Eh >3o M
C\! CO f-0
w ZD s;
3 3o W Eho !>
n-f
10 tH a33o M O,
u^. wtH
i-H W2 n6-1 wo 2 Qo o o
r-t O 23
1
\o
<D
J-,
bOo •HC*4
co CMi iH
m 1
©XIcC
>
VO
I
oCM
I
57

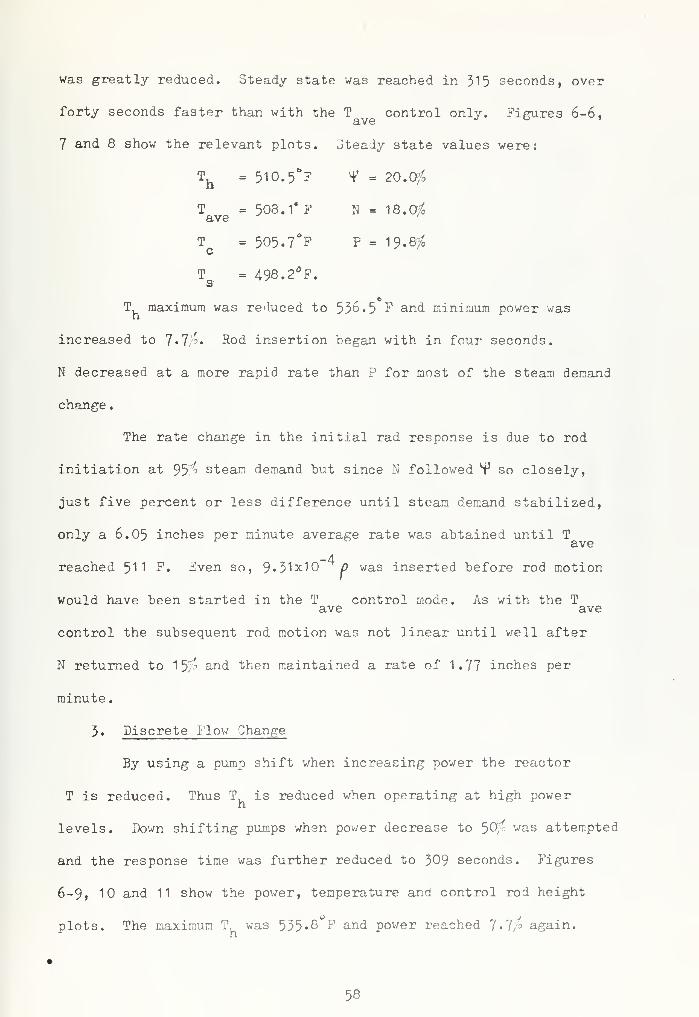
was greatly reduced. Steady state was reached in 315 seconds, over
forty seconds faster than with the T control only. Figures 6-6,ave J ° '
7 and 8 show the relevant plots. Steady state values were:
Th
= 510.5&F V = 20.0$
T = 503.1* F N - 18.0$ave '
T = 505. 7°F P = 19.8/o
T = 498.
2
dF.
s
T, maximum was reduced to 536.5 F and minimum power was
increased to 7«7'« Rod insertion began with in four seconds.
N decreased at a more rapid rate than P for most of the steam demand
change
.
The rate change in the initial rad response is due to rod
initiation at 95^ steam demand but since N followed S3 so closely,
just five percent or less difference until steam demand stabilized,
only a 6.05 inches per minute average rate was abtained until Tave
reached ^^^ F. Even so, 9' 31x10" p was inserted before rod motion
would have been started in the T control mode. As with the Tave ave
control the subsequent rod motion was not linear until well after
N returned to 1 5f ' and then maintained a rate of 1.77 inches per
minute.
3. Discrete Flow Change
By using a pump shift when increasing power the reactor
T is reduced. Thus T is reduced when operating at high power
levels. Down shifting pumps when power decrease to ^Cffc was attempted
and the response time was further reduced to 309 seconds. Figures
6-9, 10 and 11 show the power, temperature and control rod height
plots. The maximum T, was 535*8 F and power reached 7»7/° again.
58


oinen
o ^o oen
Ehs;o
oo ^>n a.<M M
C_>MEH
W
OO CO MC\J O CO
co s;
o > Eho© CO Clt
w
o EH O*^n ^T-l
IsSiEH Q
Eh Mo CO Qo !>H O•<H co a
1
©
bOovn
•H
vntnin
ino>-n
in
3-
*n
5vnH
59


o
o ^o or>
Oa
oEHo <;
v> a,C\J H
C_>
HEH
Eh
o So HCM CO
tn w sc M 3O Eh c_,
t)
CO cti
co 3erf oo W a.,
u^\ >13co 5
^8W Q^ WMCrf Ct,
W M3 QO OH cu a
cv
VO
£toO •H
>^\ fti
oo
o VTA
't^
60


o
o .-3o or^
s;oo
a*oEho <3^ Cl,
C\i M(H
§ EhM 3E-i Woo tH
<\! CO CO
CO <tj
C cti rcj
O fc3 ?-t
o ><D oiW E-i W
o oOH°*H
TROL
ROD
H
IFIED
DOWN
O 3 Qo O OtH
gure
6-8
G M
o •Hu^\ fe
-3-
I
1
co
r
i
wa>
o
*-l
C I
I
I
oI
61


o
o Cxi
o Oc^v
<3
3
o wu^\ EHcv
oCO
o Wo CO MCM O CO
00 "3
c w -c:
o P» EHo© CO 3i
b bo Eh Cl,
in <*•H
CU Q
Eh Mo CO Qo ^H OH CO 3
ON1
VO
o •H^ fe
O-3- 3 -3"
C*<
o
62


o0°\
oo
oinC\J
«o
33O
s!
a!oCO
o nO enOJ W Zj
w*o M o3a eh e-i
oo©
to erf
w35 OW CL,o >^ *-^
x-i CO gga^ wM35 in
o o oo ^ s:t-H
oi-l
1
©uziwo •H^ fc,
X*.
65


o
wo oo 3C\ Ano
oJP*
wo Ehu> WCM >^O
CO
Eh Wo Mo CO COC\?
3 i£fh
c/1
O >o0) Eh £3w
CJ oo a^tH
§a
2 M
25 Qo O Oo o stH
tH1
O
faOo •Hu^ Cm
64


Steady state values were:
Th
= 510. 4°F ^ = 20.0$
Tave
= 508. 1*F N = 18.0/,
Tc
= 505. 7°F P = 19.8$
T = 498.1 F.s
In this instance, N exceeded steam demand slightly more
than in the previous case and the average initial control rod rate
was 7*4 inches per minute until T reached 511° F. Thus 1 5.6x1ave
fi was inserted before the ten inches per minute rate was established,
The second rod motion when in the linear area was at a rate of
1.59 inches per minute.
4. Continuous Flow Change
As in the up power case a flow rate of M = 1 + V was
established and the results are shown in figures 6-12, 13 and 14.
Steady state was reached in 310 seconds and the values were:
Tu = 510.06F H* = 20.0$
h
T = 508.0*F N = 18.0$ave
T = 506. 1°F P = 19.7$c
T = 498. 1°F.s
T, reached a maximum of 535. 3° F and power again had a
minimum of f ,J'fo, The control rod travel rates where insignificantly
different from the discrete pump shift case.
65


o
Woo ^o T*m o
:•=
o
co
oo :=>
>n ^CM MH
Oo
o CO Mo 13 COCM CO 3
to-">-* —
*
"d @ £c P» E-<oo CO T5CO
w
O -4j
VA ^5 3•»-l
a, o
E-t QWa mEH MCO QO in Oo CO S,
r-4
CMH1
\o
0)
O •H*A &H
CA*Ao I
VA
-3"
66


o
woo ^o =cCA
8
CO
oo 1=>v-> Sc\j M
Oo
5o Mo COCM W r^
CO y* -^
73 in ^C EH ^<oo §§w co rs
a,O £>VA "^*-l CO 3
>
M
3 QO O OO ^ StH
H1
©
fcOo •HiA f^
v*.
67


oen
Cxi
CJ3o -io x:PA
CO
Oo ^>VP» j^C\J M
EH23OO
Cxi .S En
o ^o CO COCM
II73C W ~iO >o
E-j §<DW
o 6o wu^ ri 3*H
§aQ
O M
o o oo o avH
^3-
1
o •HUA Cx<
CO CM1
-Hw 1
<D
X!oC
I
oCM
68


VII. CONCLUSIONS AND R^COMMENDATIONS
A. CONCLUSIONS
1
.
The Up Power Transient
In this case several specifics were noted. The sooner the
initial rod withdrawal, the quicker was the response of the system.
Increasing the coolant flow rate did not substantially degrade the
response time but did reduce the maximum power and increased the
minimum T . The continuous flow change system gave a slightlys
better response than the discrete flow change.
2. The liown Power Transient
As noted above the sooner the rod motion started the quicker
the response. But in this case a discrete flow change further
decreased the response time as well as the maximum T . The minimum
power level was not affected. The continuous flow change caused a
slight decrease in T, while response time increased insignificantly.
3. Final Control
A satisfactory control for these transients was developed
using only two rod speeds, twenty and ten inches per minute. A
simple two speed motor for the control rod drive mechanisms could
be used, greatly simplifying the variable speed used on the Savannah.
Overall comparison showed that the control using the T
band, an anticipatory rod motion response and continuous flow changes
was the system which responded best to both the up power and the
down power transients. But due to the complexity of variable speed
motors vice dual speed the discrete flow change control would be
a more practical system with only a slight reduction in response.
69


B. RECOMMENDATIONS FOR FURTHER STUDY
Several extensions of this investigation merit further study.
1. This study used a two speed rod control. Either a variable
speed system as used on the N.S. Savannah or optimizing the rod
speed to one value, thus enabling the use of a still simpler motor,
could be used as a basis for further work.
2. As this study looked at the two transients separately, a
study of the two maneuvers in rapid succession would provide a
good measure of the real worth of the control systems.
3. An investigation could be made into the effects of allowing
rod travel in excess of the steady state limit by some percentage
in an effort to speed up the system response.
4. A study of the two loop response could be undertaken including
the effects of coolant loop isolation or steam stop valve closure.
5. This study used equal transport delays between the reactor
and the heat exchanger and vice versa. Other plants have substan-
tially more delay in the cold leg than the hot leg and simulation
of this could generate new controls.
70


APPENDIX
THE COMPUTER SIMULATION
Initially the reactor plant was simulated on the IBM-360 using
the INTEG program. The limit of 4500 points required a delta time
of greater than 0.3 seconds to complete the up power transient.
In fact, even using a delta time of 0.01 seconds caused over- and
underflow conditions. The best delta time found was 0.005 seconds
which only allowed 22.5 seconds of the simulation.
Discarding the INTEG approach, the IBM Digital Simulation
Language (DSL) was selected. Eor all the analysis presented a
delta time of 0.005 seconds was used in the fixed step size, fourth
order Runge-Kutta integration. As a check a delta time of 0.001
seconds was also used which yielded less than 0.3 F difference in
temperature values and less than 0.4;~o difference in power levels.
But since the smaller delta time required over forty-five minutes
of computer time vice the nine minutes for the larger delta time,
the 0.005 delta time was selected to increase turn around time.
The fixed step size integration method was chosen to facilitate
the calculation of control rod worth. A NOSORT/SORT block was
required for the control system which precluded the use of an
integration statement for CRW. Thus a fixed step size was needed
to be able to generate a constant withdrawal rate, v/hen initially
running the simulation the actual rate observed was five times as
INTEG is a locally developed integration and plot package of
the ,V. R. Church Computer Center, Naval Postgraduate School, Mon-
terey, California.
71


fast as calculated. As no explanation could be found, other than
a possible peculiarity of the program method, rod speeds of two
and four inches per minute were put into the program resulting in
ten and twenty inches per minute for the simulation.
An inconvenience with DSL was that the graphical output on the
CALCCMP plotter at the Naval Postgraduate School placed the labeling
for the abscissa to the right of the axis into the graph proper.
This required modification of the plots for presentation as figures
in this paper.
72


COMPUTER PROGRAM
DOWN POWER EXAMPLE
TITLE DOWN POWER TRANSIENT W/DISCRETE FLOW CHANGECONTRL DELT=0.005,FINTIM=450INTEG RKSFXINCON T3IC=458,TCCIC=502,TCAVIC=508,TFIC=1108,THIC=514INCON CRW=0,CRP=0,NIC=1 ,N=1 ,CIC=1 ,C=1 ,M=2,DLTP=0.05NOSORT* POWER TRANSIENT INPUT
IF (TIME. LT. 50) GO TO 1
IF (TIME.GT.110) GO TO 2
PSI=1-(TIHE-50)*0.08/6GO TO 3
1 PS 1=1
GO TO 3
2 PSI=0..2
3 CONTINUE* FLOW CHANGE CONTROL
IF (N,,GT. 0.5)M=1
7 CONTINUESORT
GO TO 7
P=0.02*(TAV-TS)T3DOT=70* ( P-PSI )/3/MTS=INTGRL(TSIC ,TSDOT
)
TC=((2-0.48/m)*TH+0.96*T3/m)/(2+0.48/m)tccdot=(tc-tcc)*m/6tcc=intgrl(tccic ,tccdot )
tcadot=(tf-tcav-50*m*(tcav-tcc))/25tcav=intgrl(tcavic ,tcadot )
tfdot=(600*n-tf+tcav)/25tf=intgrl(tfic ,TFDOT
)
thdot=(2*tcav-tcc-th)*m/6th=intgrl(thic ,thdot)
TAV=(TH+TC)/2rlmt=o.oi38*(psi-i)
NOSORT* ROD MOTION CONTROL
IF ((508-TAV).GT.3) GO TO 4
IF ((508-TAV).LT.-3) GO TO 5
IF ((N-PSI).GT.DLTP) GO TO 5
GO TO 6
4 CRW=CRW+7E-7/3GO TO 6
5 IF (crw.lt. rlmt) go to 6
IF (N.LT.O.15) GO TO 6
CRW=CRW-7E-7/66 CONTINUESORT
73


KEF-1 . 120988-1 .88E-4*TCAV-2.3E-5*TF+CRrfnd0t=2e4* (n* ( kef-1 )/kef+75e-4* (c-n )
)
n=intgrl(iiic,ndct)CD0T=0.1*(N-C)C=INTGRL(CIC,CDOT)CEP=CRW/7E-4
PRINT 2,TH,TAV,TC,TS,N,PSI,P,CRPENDSTOP
74


BIBLIOGHA.' HY
1. "America's Atom-Powered Merchant Ship", U. S. News and WorldReport , v. 71, p. 49, 16 August 1 97 1
.
2. Birch, A., The Kinetics of Pressurized Water and Other ReactorPower Plants
,paper presented at the Second United Nations
International Conference on the Peaceful Uses of AtomicEnergy, Geneva, Switzerland, 1-13 September 1958.
3. Clark, H. W. , Jr., Study of a Marine Nuclear Propulsion PlantThrough Computer Simulation , M.S. Thesis, Naval PostgraduateSchool, Monterey, California, 1971.
4. Duncombe, E. and Rathbone, D. E. , "Optimization of the Responseof a Nuclear Reactor Plant to Changes in Jemand", IEEETransactions on automatic Contro l, v. 14, p. 277-282,June 1969.
5. Glasstone, S. and Sesonske, A., Nuclear Reactor Engineering ,
Van Nostrand Reinhold, 1 967
•
6. Hamilton, W. H. , and others, "Power and Temperature Controlof Pressurized V/ater-Cooled Reactors", Electrical Engineering
,
v. 75, P. 505-510, June 1956.
7. Harrer, J. M. , Nuclear Reactor Control Engineering , D. VanNostrand, 1963.
8. Kramer, A. W., Nuclear Propulsion for Merchant Ships , U. S.
Atomic Energy Commission, 1962.
9. Landis, J. W. , "Operating Experience with Nuclear Propulsion:Startup and Initial Operation of the U.S. Savannah", Journalof the Joint Panel on Nuclear Marine Propulsion , v. 7,
p. 1-5, October 1963.
10. Naval Reactors Physics Handbook , v. 1, U. S. Atomic EnergyCommission, 1 9^4
•
11. Schultz, M. A., Control of Nuclear Reactors and Power Plants,
McGraw-Hill, 1961.
12. Stirling, A. G. , "Basic Control Concepts for Pressurized WaterReactors", Journal of the American Society of Naval Engineers
,
v. 72, p. 693-697, November i960.
13. Wood, P. M. and Levine, Z. , Reactor Physics and Core Design of
the Merchant Ship Reactor,paper presented at the Nuclear
Engineering and Science Conference, Chicago, Illinois,
17-21 March 1958.
75


INITIAL DISTRIBUTION LIST
No. Copies
1
.
Defense Documentation Center 2
Cameron StationAlexandria, Virginia 22314
2. Library, Code 0212 2
Naval Postgraduate SchoolMonterey, California 93940
3. Department Chairman, Code 52 2
Department of Electrical EngineeringNaval Postgraduate SchoolMonterey, California 93940
4. Professor A. Gerba 10Department of Electrical EngineeringNaval Postgraduate SchoolMonterey, California 93940
5. LT Howard M. Chatham, USN 1
399 Bent leyvi lie RoadChagrin Falls, Ohio 44022
76


5 oec 79
2 51ry
160513 Irhes/ sC408 r .
c.iC^tham
c°ntro? f
?;opu,s ''onpi2c,ear
2 sTf
o
160512Thesis
C408c.l
ChathamControl of nuclear
propulsion plant powertransients.

thesC408
Control of nuclear propulsion plant powe
3 2768 001 02384 9DUDLEY KNOX LIBRARY