control of air flow temperature and pressure in the
TRANSCRIPT

Control of air flow temperature and pressure inthe pipelines with PID
YıLDıRıM SAHINp and ABDULLAH G€OÇER
Department of Mechatronics Engineering, Faculty of Engineering, University of Erciyes, Kayseri,Turkey
Received: August 16, 2019 • Accepted: October 24, 2019Published online: June 30, 2020
ABSTRACT
Today, the use of proportional-integral-derivative (PID) control units continues in many controlapplications due to their simple structure. In areas such as pressure, temperature, flow control, PIDcontrol element is used and many new methods are applied in adjusting control parameters. In thisstudy, the LTR 701 Controlled Airflow and Temperature Experimental System was used to studythe temperature and pressure control at different flow rates in the pipelines. In this control system,temperature was controlled with PID control element, pressure was controlled with PI controlelement, and reaction of control parameters at different temperatures and pressures were inves-tigated. Also, temperature was controlled as cascade with PI element in elementary controller and Pelement in secondary controller. The manual adjustment method has been applied to adjust thecontrol parameters. In addition, the experimental system is modelled in MATLAB-SIMULINK. Onthis model, simulation results showed that it is matching the experimental results.
KEYWORDS
PID control, temperature control, pressure control, control simulation
1. INTRODUCTION
In the control training, it is important to apply the theoretical knowledge and to compare thetheoretical knowledge with the applications [1, 2]. The proportional-integral-derivative (PID)control element, which has an important place in automatic control systems, is widely used inthe industry and constitutes an important part of industrial control systems. Therefore, anyimprovement in PID design and application methods will have important effects on in-dustrial control systems [3–5].
There are many academic studies using PID control elements. Hok et al. controlled a timedelayed non-linear pressure control system with a numerical PI control element. The modelof the control system is extracted as a first-order transfer function with time delay, and basedon this model, the control element is optimized according to the open-cycle frequencyresponse by the method of Ziegler–Nichols [6]. Soyguder et al. performed modelling, nu-merical simulation and control of a variable flow HVAC (heating ventilation air condi-tioning) system which has two different areas in Matlab-SIMULINK. The sub-models of thesystem are derived from the heat transfer equations of heat loss due to convection, con-duction, cooling unit and fan between the two regions. The system was controlled by self-tuning PID type fuzzy adaptive control element, and successful results were obtained. Theseresults are also compared with the results obtained with fuzzy PD and conventional PIDcontroller [7].
€Unal used genetic algorithm and ant-colony algorithm to optimize the coefficients ofthe PID control element used in the control of a pressure process control unit. He obtainedthe dynamic model of the system to be controlled by using artificial neural network andoptimized the PID control element on this model by genetic algorithm, ant colony algo-rithm and Ziegler–Nichols methods [8]. Kayacan used the PID control element which was
International Review ofApplied Sciences andEngineering
11 (2020) 2, 167–173
DOI:10.1556/1848.2020.20028© 2020 The Authors
ORIGINAL RESEARCHPAPER
*Corresponding author.E-mail: [email protected]
Unauthenticated | Downloaded 10/22/21 05:10 AM UTC

obtained with the fuzzy control theory and the gray systemtheory on a non-linear liquid level control scheme [9].
Bolat designed a PIC-based card to provide real-timecontrol of a furnace via Matlab-SIMULINK simulationsoftware and controlled furnace temperature by trans-mitting of control information generated in Matlab-SIMULINK environment. In addition, he has simulatedthe furnace with PI parameters determined by theZiegler–Nichols Step Response Field Method and theFuzzy Gain Control PI Controller [10]. Akg€ul modelleda greenhouse with a fuzzy logic method, in a naturalaeration system, in order to provide temperature andrelative humidity control and decided howmuch greenhouse windows should be opened by thismethod [11].
As can be seen, there are some studies about the ap-plications of PID control elements in ventilation systems.In this study, various control experiments were conductedwith control elements such as P, PI and PID to check thetemperature and pressure of a pipe with passing air in it.For these experiments, the LTR 701 Controlled Airflow andTemperature System was used, and the performances of thecontrol elements under different conditions werecompared. On the other hand, system is modelled inMatlab-SIMULINK with using the transfer functions ofthis control system, and the obtained simulation results arecompared with each other and the actual results of thecontrol system.
2. EXPERIMENTAL SYSTEM AND ITSMATHEMATICAL MODEL
The LTR 701 Controlled Airflow and Temperature Systemis an experimental setup that enables the specification ofthe control systems and the performance of the variouscontrol elements. These controls are provided by changingthe temperature, flow rate and pressure with five analogueoutput variables (flow rate, 2 temperature, pressure andthrottle position) and two input variables (ventilator speedand heater output). The system consists of a fan, heater,flow metre, measuring tube, air inlet valve, valve sensor,two temperature sensors, pressure sensor, analogue datacard, pc and thermocouple. Manually adjustable air inletangle can be applied as a disruptive effect to the system.Figure 1 shows the experimental apparatus with PC.
2.1. Control cycle of temperature
In this cycle, the air flow is uncontrolled and the controlleronly controls the temperature. Control of this temperaturecycle in the system can be achieved with the PID controlelement. The block diagram of this cycle can be seen inFig. 2.
Transfer function of this cycle is as follows;
d ¼ ðdS� dÞ:GR1:G3þ ðUM:G1þ 4:G4Þ:G2 (1)
dþ d:GR1:G3 ¼ dS:GR1:G34 þ UM:G1:G2þ 4:G4:G2
(2)
d
ds¼ GR1:G3þ G2:ðUm:G1þ 4:G4Þ
1þ GR1:G3þ G2:ðUm:G1þ 4:G4Þ (3)
2.2. Pressure control cycle
In this cycle, the temperature is uncontrolled and thecontroller only performs the pressure control. In the system,the control of this pressure cycle can be achieved with the PIcontrol element. The block diagram of this cycle can be seenin Fig. 3.
Fig. 1. Air flow and temperature control test setup
Fig. 2. Block diagram of temperature control cycle
Fig. 3. Block diagram of the pressure control cycle
168 International Review of Applied Sciences and Engineering 11 (2020) 2, 167–173
Unauthenticated | Downloaded 10/22/21 05:10 AM UTC
Transfer function of this cycle is as follows;
P ¼ ðPS� PÞ:ðGR1:G1þ 4:G4Þ (4)
P ¼ PS:GR1:G1þ 4:G4:PS� P:GR1:G1� P:4:G4 (5)
PPs
¼ GR1:G1þ 4:G41þ GR1:G1þ 4:G4
(6)
The transfer functions that showed in the system modelare as follows;
G1(s) 5 The transfer function of the fan effect to pressureG2(s) 5 The transfer function of the pressure effect totemperatureG32(s) 5 The transfer function of the heating effect onsensor 2G33(s) 5 The transfer function of the heating effect onsensor 3G4(s) 5 The transfer function of the air inlet angle effect topressure
The values of these transfer functions are as follows;
G1ðsÞ ¼ ΔpΔUm
¼ e−0;24:s :0;425
2;4:sþ 1(7)
G2ðsÞ ¼ Δ d
Δp¼ e−0;7:s :
0;3688;35:sþ 1
(8)
G32ðsÞ ¼ Δ d
ΔUH¼ e−0;3:s :
0;5433;3:sþ 1
(9)
G4ðsÞ ¼ ΔpΔ4
¼ 0;032;1:sþ 1
(10)
2.3. Designing of the experimental system in MATLAB-SIMULINK
MATLAB is a software which can be used in many areassuch as control systems, power systems, filter design, geneticalgorithm, graphics, database, finance, fuzzy control, neuralnetworks, optimization, image processing and statistics.Many toolboxes for these workspaces are available in the
program SIMULINK, a very important and visual toolbox inMATLAB. It is a virtual lab for modelling and simulating ofdynamic systems. Pressure and temperature control exper-iments which performed in the LTR 701 were designed andcontrolled in MATLAB-SIMULINK.
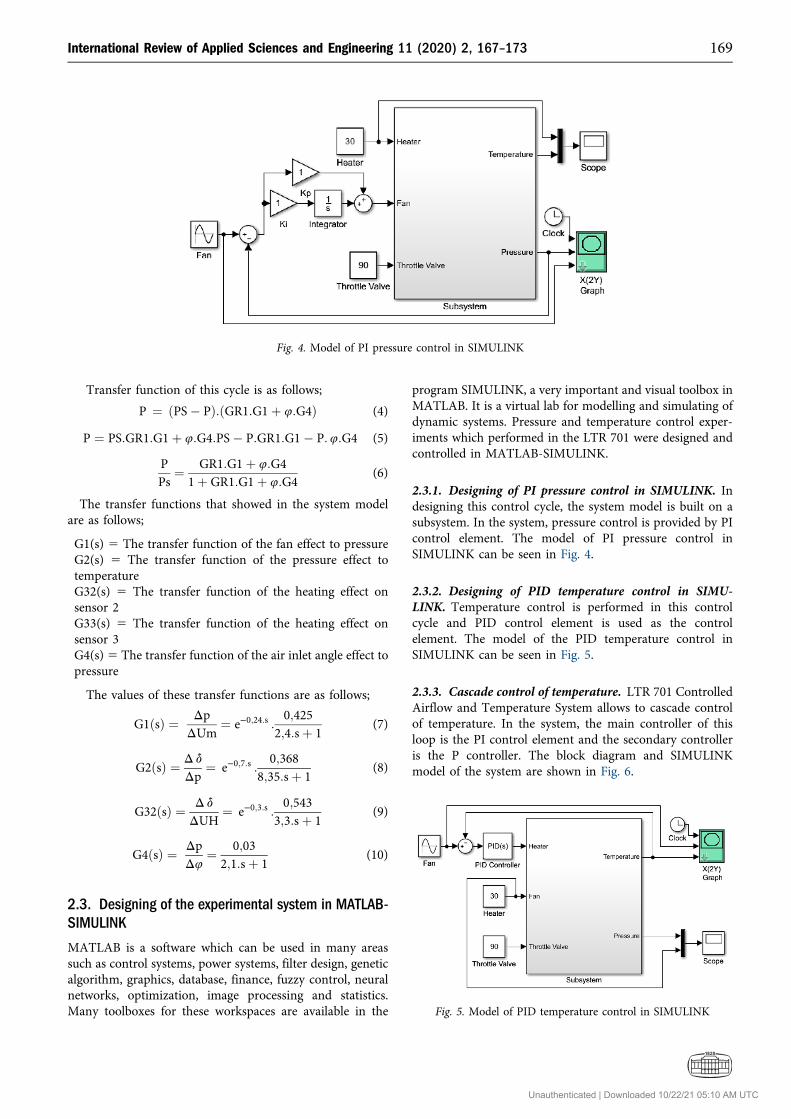
2.3.1. Designing of PI pressure control in SIMULINK. Indesigning this control cycle, the system model is built on asubsystem. In the system, pressure control is provided by PIcontrol element. The model of PI pressure control inSIMULINK can be seen in Fig. 4.
2.3.2. Designing of PID temperature control in SIMU-LINK. Temperature control is performed in this controlcycle and PID control element is used as the controlelement. The model of the PID temperature control inSIMULINK can be seen in Fig. 5.
2.3.3. Cascade control of temperature. LTR 701 ControlledAirflow and Temperature System allows to cascade controlof temperature. In the system, the main controller of thisloop is the PI control element and the secondary controlleris the P controller. The block diagram and SIMULINKmodel of the system are shown in Fig. 6.
Fig. 4. Model of PI pressure control in SIMULINK
Fig. 5. Model of PID temperature control in SIMULINK
International Review of Applied Sciences and Engineering 11 (2020) 2, 167–173 169
Unauthenticated | Downloaded 10/22/21 05:10 AM UTC

3. FINDINGS AND DISCUSSION
3.1. Comparison of simulation and experimentalresults in temperature control
In the model of the airflow and temperature system whichwas created in MATLAB-SIMULINK, simulations of thetemperature control experiments were made and comparedwith the actual results. Temperature control with P, PI andPID was performed using Kp, Ki, and Kd parameters thatwere manually determined as in the test system. The pa-rameters used in SIMULINK are;
Kp 5 3.371Ki 5 2.748Kd 5 1.799
The parameters used in the experimental setup are;
Kp 5 60.000Ki 5 45.880Kd 5 25.940
When the results are examined, in the experimental Pcontrol (Fig. 7(a)), the system catches the desired responsein a very short time, but oscillations are seen at the peakpoints. But the control results are not obtained in the
Fig. 6. a) Block diagram of cascade temperature control, b) SIMULINK model of cascade temperature control
Fig. 7. In the temperature control with P control element; a) Thechanging in response of the airflow and temperature system to the
sinusoidal input signal, b) The changing in response of theSIMULINK model to the sinusoidal input signal
Fig. 8. In the temperature control with PI control element; a) Thechanging in response of the airflow and temperature system to the
sinusoidal input signal, b) The changing in response of theSIMULINK model to the sinusoidal input signal
170 International Review of Applied Sciences and Engineering 11 (2020) 2, 167–173
Unauthenticated | Downloaded 10/22/21 05:10 AM UTC
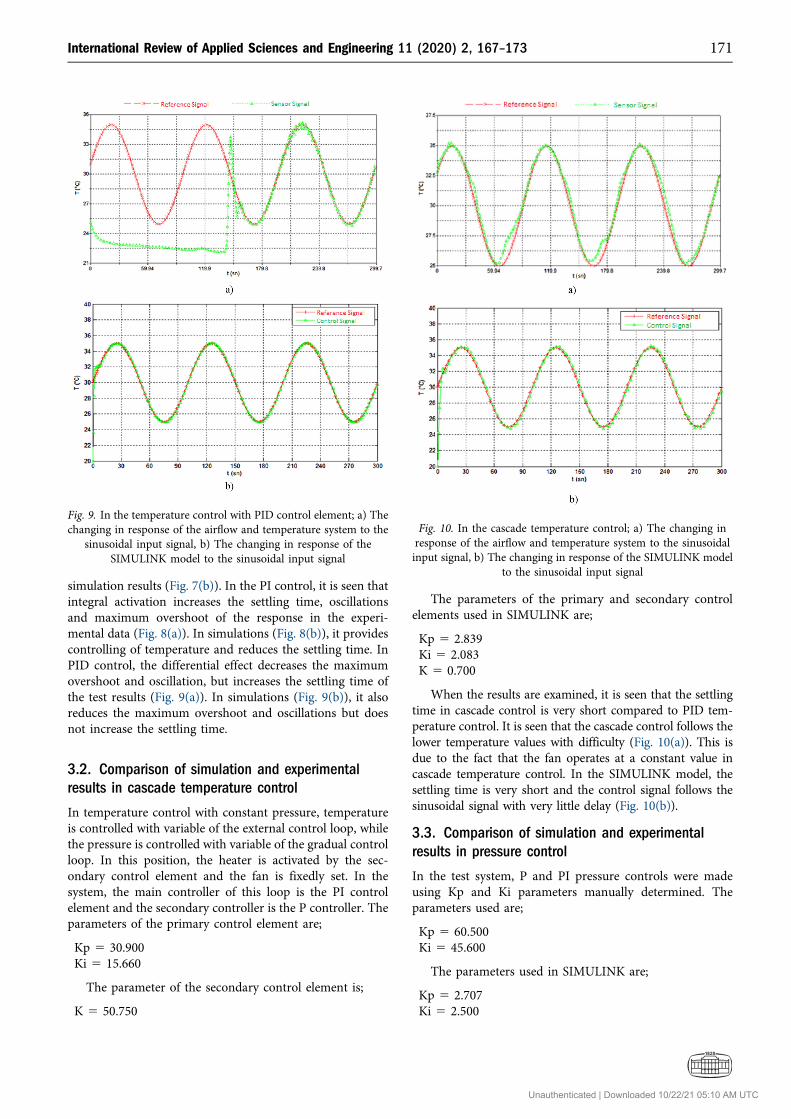
simulation results (Fig. 7(b)). In the PI control, it is seen thatintegral activation increases the settling time, oscillationsand maximum overshoot of the response in the experi-mental data (Fig. 8(a)). In simulations (Fig. 8(b)), it providescontrolling of temperature and reduces the settling time. InPID control, the differential effect decreases the maximumovershoot and oscillation, but increases the settling time ofthe test results (Fig. 9(a)). In simulations (Fig. 9(b)), it alsoreduces the maximum overshoot and oscillations but doesnot increase the settling time.
3.2. Comparison of simulation and experimentalresults in cascade temperature control
In temperature control with constant pressure, temperatureis controlled with variable of the external control loop, whilethe pressure is controlled with variable of the gradual controlloop. In this position, the heater is activated by the sec-ondary control element and the fan is fixedly set. In thesystem, the main controller of this loop is the PI controlelement and the secondary controller is the P controller. Theparameters of the primary control element are;
Kp 5 30.900Ki 5 15.660
The parameter of the secondary control element is;
K 5 50.750
The parameters of the primary and secondary controlelements used in SIMULINK are;
Kp 5 2.839Ki 5 2.083K 5 0.700
When the results are examined, it is seen that the settlingtime in cascade control is very short compared to PID tem-perature control. It is seen that the cascade control follows thelower temperature values with difficulty (Fig. 10(a)). This isdue to the fact that the fan operates at a constant value incascade temperature control. In the SIMULINK model, thesettling time is very short and the control signal follows thesinusoidal signal with very little delay (Fig. 10(b)).
3.3. Comparison of simulation and experimentalresults in pressure control
In the test system, P and PI pressure controls were madeusing Kp and Ki parameters manually determined. Theparameters used are;
Kp 5 60.500Ki 5 45.600
The parameters used in SIMULINK are;
Kp 5 2.707Ki 5 2.500
Fig. 9. In the temperature control with PID control element; a) Thechanging in response of the airflow and temperature system to the
sinusoidal input signal, b) The changing in response of theSIMULINK model to the sinusoidal input signal
Fig. 10. In the cascade temperature control; a) The changing inresponse of the airflow and temperature system to the sinusoidalinput signal, b) The changing in response of the SIMULINK model
to the sinusoidal input signal
International Review of Applied Sciences and Engineering 11 (2020) 2, 167–173 171
Unauthenticated | Downloaded 10/22/21 05:10 AM UTC

When the results are compared, it can be seen that thesystem does not catch the desired value and sudden dropsoccur at the peak points in the experimental P pressurecontrol (Fig. 11(a)). Also, simulation results (Fig. 11(b))almost coincide with experimental results. In PI control,the system (Fig. 12(a)) follows the desired value. However,it is observed that there are declines at the peak and thetime of settlement is very low. In simulation results(Fig. 12(b)), it is seen that the maximum overrun andsettling time are higher than the experimental results, butthe oscillations are less.
4. RESULTS
In this study, the air flow rate and temperature arecontrolled by standard feedback P, PI, PD and PID con-trollers in the LTR 701 Airflow and Temperature System,which is a prototype of a heating and cooling system. Inaddition, with the help of the theoretical model of the sys-tem, the pressure effect and the temperature change werecontrolled with the same control organs in Matlab-SIMU-LINK as a simulation. As a result of these studies, thefollowing results were obtained:
� Based on the experimental P, PI, and PID temperaturecontrol results, it was observed that the settlement time
and maximum overrun were low, but the oscillations werehigh in the P control. The integral effect increases themaximum overshoot and settlement time, while the de-rivative effect reduces the maximum overrun. PID controlby combining the appropriate parameters gives good re-sults.
� According to the simulation results, P control follows thesinusoidal signal below the desired value. In the PI con-trol, the sinusoidal signal is caught and the maximumexceeding value is decreased by adding the derivative ef-fect.
� The settling time is very short in cascade temperaturecontrol compared to PID temperature control. It is seenthat the cascade control follows the lower temperaturevalues with difficulty. This is due to the fact that the fanoperates at a constant value in cascade temperature con-trol. In the SIMULINK model, the settling time is veryshort and the control signal follows the sinusoidal signalwith very little delay.
� Experimental P and PI pressure control resultsshow that the using of the proportional effect aloneresults in failure of the pressure control and PI con-trol with the integral effect provides the desiredcontrol result.
According to the simulation results, P control follows thesinusoidal signal at the desired value as in the temperature
Fig. 11. In the pressure control with P control element; a) Thechanging in response of the airflow and temperature system to the
sinusoidal input signal, b) The changing in response of theSIMULINK model to the sinusoidal input signal
Fig. 12. In the pressure control with PI control element; a) Thechanging in response of the airflow and temperature system to the
sinusoidal input signal, b) The changing in response of theSIMULINK model to the sinusoidal input signal
172 International Review of Applied Sciences and Engineering 11 (2020) 2, 167–173
Unauthenticated | Downloaded 10/22/21 05:10 AM UTC

control. In PI control, sinusoidal signal is captured andpressure control is provided.
REFERENCES
[1] M. S. Qureshi, P. Swarnkar, and S. Gupta, “A supervisory on-line tuned
fuzzy logic based sliding mode control for robotics: An application to
surgical robots,” Robot. Auton. Syst., vol. 109, pp. 68–85, 2018.
[2] J. Zhang, “Design of a new PID controller using predictive func-
tional control optimization for chamber pressure in a coke
furnace,” ISA Trans., vol. 67, pp. 208–214, 2017.
[3] S. S. Yurdakul and _I. Eker, Self-tuning PID Control with Experi-
mental Applications, EMO 5. Automation Symposium, 2009.
[4] S. Yıldırım and S. Savas, “Trajectory control of a mobile robot
using neural network for frail blind persons,” Int. Rev. Appl. Sci.
Eng., vol. 4, no. 1, pp. 27–34, 2013.
[5] S. M. Attaran, R. Yusof, and H. Selamat, “A novel optimization
algorithm based on epsilon constraint-RBF neural network for
tuning PID controller in decoupled HVAC system,” Appl. Therm.
Eng., vol. 99, 613–624, 2016.
[6] H. S. Mok, G. T. Kim, M. H. Park, and H. W. Rhew, “PI controller
gains tuning of the pressure control system by open-loop fre-
quency response,” IEEE, vol. 88, pp. 557–561, 1988.
[7] S. Soyguder, M. Karak€ose, and H. Alli, “Design and simula-
tion of self-tuning PID-type fuzzy adaptive control for an
expert HVAC system,” Expert Syst. Appl., vol. 96, pp. 4566–
4573, 2009.
[8] M. €Unal, H. Erdal, and V. Topuz, “Trajectory tracking per-
formance comparison between genetic algorithm and ant col-
ony optimization for PID controller tuning on pressure
process,” Comput. Appl. Eng. Educ., vol. 20, no. 3, pp. 518–528,
2012.
[9] E. Kayacan, Grey Prediction Based Control Based Control Of A
Non-linear Liquid Level System Using PID Type Fuzzy Controller,
Master Thesis, Bo�gaziçi University, _Istanbul, 2006.
[10] Y. Bolat, Matlab-SIMULINK þ PIC Based Fuzzy Logic Controller
Design and Implementation of Real Time Temperature Control,
Master Thesis, Marmara University, 2006.
[11] H.N. Akg€ul, _I. Kavdır, and M.A. Dayıo�glu, “Trajectory tracking
performance comparison between genetic algorithm and ant col-
ony optimization for PID controller tuning on pressure process,”
Tar. Mak. Bil. Der., vol. 2, no. 1, pp. 57–63, 2006.
Open Access statement. This is an open-access article distributed under the terms of the Creative Commons Attribution-NonCommercial 4.0 International License (https://creativecommons.org/licenses/by-nc/4.0/), which permits unrestricted use, distribution, and reproduction in any medium for non-commercial purposes, provided theoriginal author and source are credited, a link to the CC License is provided, and changes – if any – are indicated.
International Review of Applied Sciences and Engineering 11 (2020) 2, 167–173 173
Unauthenticated | Downloaded 10/22/21 05:10 AM UTC