contribution of thiol- and hydroxycinnamic acids metabolism … · 4.2.8 the effect of aeration on...
TRANSCRIPT

TECHNISCHE UNIVERSITÄT MÜNCHEN
Lehrstuhl für Technische Mikrobiologie
Contribution of thiol- and hydroxycinnamic acids metabolism of sourdough lactobacilli on structural and sensorial properties of wheat breads
André Jänsch
Vollständiger Abdruck der von der Fakultät Wissenschaftszentrum Weihenstephan für Ernährung, Landnutzung und Umwelt der Technischen Universität München zur Erlangung des akademischen Grades eines
Doktors der Naturwissenschaften
genehmigten Dissertation.
Vorsitzender: Univ.-Prof. Dr. S. Scherer
Prüfer der Dissertation: 1. Univ.-Prof. Dr. R. F. Vogel
2. apl. Prof. Dr. P. Köhler
3. Prof. Dr. M. G. Gänzle, University of Alberta / Kanada
(nur schriftliche Beurteilung)
Die Dissertation wurde am 02.05.2013 bei der Technischen Universität München eingereicht und durch die Fakultät Wissenschaftszentrum Weihenstephan für Ernährung, Landnutzung und Umwelt am 07.11.2013 angenommen.

Erklärung Ich versichere durch eigenhändige Unterschrift, dass ich die Arbeit selbstständig und ohne
Benutzung anderer als der angegebenen Hilfsmittel angefertigt habe.
Folgende Teile der Arbeit sind mit der Hilfe von Dritten zu Stande gekommen:
• Kapitel 2: Teigfermentationen (Referenzteige, organische Säuren, Glutathion) wurden
teilweise von Dr. Nicoline Vermeulen durchgeführt. Sämtliche Daten wurden anhand
von Zusatzmessungen bestätigt. Die Messungen des Kleberabbaus (2.2.10) wurden
von Herrn Dr. Wieser vorgenommen. Die Brote wurden an der LfL (Landesanstalt für
Landwirtschaft) durch erfahrene Bäcker hergestellt.
• Kapitel 3: Die Bestimmung der freien Ferulasäure wurde durch Herrn Dr. Wieser
vorgenommen. Teilweise wurden Daten (Abbildungen) dieses Kapitels aus Diplom /
Semesterarbeiten von Michael Novakowski und Wolfgang Holzmüller übernommen.
Das Screening auf Decarboxylasen (3.2.6) wurde parallel auch von Dr. Susanne
Kaditzky / Kristina Gramlich bestätigt. Die Untersuchung an Würzefermentationen
und MRS-Medium mit zugesetzter Ferulasäure bzw. Coumarsäure wurde von Dr.
Susanne Kaditzky vorgenommen. Die Bestimmungen von flüchtigen Aromakompo-
nenten mittels GC/MS wurden am Hans-Dieter-Belitz Institute for Cereal Grain
Research (hdbi) durchgeführt.
• Kapitel 4: Die Erzeugung der nox-Mutante wurde von Dr. Simone Freiding während
ihrer Diplomarbeit durchgeführt. Genetische Daten von Lactobacillus sanfranciscensis
TMW1.1304 wurden aus der veröffentlichten Arbeit von Prof. Dr. Vogel entnommen.
Die intrezellulären Mangangehalte (4.2.9) in Lactobacillus sanfranciscensis wurden
von Herrn Dr. Jürgen Behr bestimmt.
André Jänsch, Wädenswil

Summary
I
TABLE OF CONTENTS
SUMMARY .......................................................................................................... 1
ZUSAMMENFASSUNG ...................................................................................... 3
1. GENERAL INTRODUCTION ......................................................................... 5
1.1 WHEAT FLOUR ............................................................................................................. 6 1.2 WHEAT GLUTEN PROTEINS ...................................................................................... 8
1.2.1 Gliadins and glutenins ............................................................................................... 9 1.3 NON-STARCH POLYSACCHARIDES (NSP) ............................................................ 13
1.4 WHEAT SOURDOUGH MICROBIOTA AND LACTOBACILLUS SANFRANCISCENSIS ....................................................................................................... 16 1.5 OXIDATIVE STRESS RESPONSE IN LACTIC ACID BACTERIA ......................... 18
2. EVALUATION OF INFLUENCING FACTORS ON FINAL BREAD VOLUME OF SOURDOUGH PREPARED BREADS ..................................... 29
2.1 MATERIALS AND METHODS ................................................................................... 31 2.1.1 Used strains, medium, and cultivation conditions ................................................... 31 2.1.2 Wheat and flour ....................................................................................................... 31 2.1.3 Wheat sourdough fermentations .............................................................................. 32 2.1.4 Determination of cell counts and dough pH ............................................................ 32 2.1.5 Dough characterisation and determination of bread volume using standard baking trial (Rapid-Mix-Test) ...................................................................................................... 32 2.1.6 Determination of the final bread volume with a granulation method ..................... 33
2.1.7 Determination of glutathione reductase activity ..................................................... 34 2.1.8 Inactivation of the glutathione reductase from Lactobacillus sanfranciscensis TMW1.53 ......................................................................................................................... 34
2.1.9 Activity-staining of glutathione-reductase using SDS-page gel ............................. 35
2.1.10 Protein analysis using RP-HPLC .......................................................................... 35 2.2 RESULTS ....................................................................................................................... 36
2.2.1 Biochemical characterization of the reference doughs............................................ 36
2.2.2 Influence of sourdough dosage on the final bread volume ..................................... 39
2.2.3 Influence of organic acids on the final bread volume ............................................. 40
2.2.4 Influence of the used starter culture in sourdough fermentations on the final bread volume .............................................................................................................................. 43
2.2.5 Influence of the sourdough fermentation period on the bread volume ................... 45
2.2.6 Influence of ascorbic acid addition on the volume of sourdough breads ................ 45
2.2.7 Influence of microbiological catalysed redox reactions on bread volume .............. 47
2.2.8 Thiol levels in sourdough fermented with L. sanfranciscensis TMW1.53 and L. sanfransiscensis TMW1.53∆gshR ................................................................................... 51
2.2.9 Thiol levels in sourdough fermented with L. reuteri BR11, L. reuteri BR11∆cyuC and L. pontis TMW1.84 ................................................................................................... 52 2.2.10 Effects of L. sanfranciscensis TMW1.53 and cognate mutant TMW1.53∆gshR on gluten proteins during sourdough fermentations .............................................................. 53

Summary
II
2.2.11 Influence of “Vitalkleber” and Diacetyl-tartaric-acid-ester (DACW) on the final bread volume .................................................................................................................... 55
2.3 DISCUSSION ................................................................................................................ 57 2.3.1 Effect of endogenous and exogenous parameter on the final bread volume during wheat sourdough fermentations ....................................................................................... 57 2.3.2 Effect of redox reactions and glutathione reductase on thiol-exchange reactions in wheat sourdoughs. ............................................................................................................ 59
3. DISTRIBUTION OF ENZYME ACTIVITIES IN LACTOBACILLI ABLE TO GENERATE VOLATILE AROMA COMPOUNDS FROM HYDROXYCINNAMIC ACIDS ........................................................................ 65
3.1 MATERIALS AND METHODS ................................................................................... 69 3.1.1 Used strains, primer, media, and restriction enzymes ............................................. 69
3.1.2 Preparation of mMRS-media with added ethyl ferulate (EF) ................................. 73
3.1.3 Predicted cinnamoyl esterase activity of lactobacilli determined with plate screening assay ................................................................................................................. 73
3.1.4 Fermentations with different lactobacilli in broth supplemented with cinnamic acid derivatives ........................................................................................................................ 73
3.1.5 Purification of heterologously expressed protein using FPLC ................................ 74
3.1.6 Determination of predicted cinnamoyl esterase activity of the purified recombinant proteins using spectrophotometer ..................................................................................... 75 3.1.7 Determination of α-L-arabinofuranosidase and xylosidase activity of the purified recombinant proteins using spectrophotometer ................................................................ 77 3.1.8 Sequencing of the cloned genes into the expression vector pBAD-MycHis B ....... 78 3.1.9 Screening of phenolic acid decarboxylase genes using PCR and verification of decarboxylase activity in lactobacilli ............................................................................... 78 3.1.10 Wort fermentations with a combination of aroma active starter cultures ............. 79
3.1.11 Sourdough fermentations with Lactobacillus pontis TMW1.1086 ....................... 80
3.2 RESULTS ....................................................................................................................... 81
3.2.1 Determination of predicted cinnamoyl esterase activity in lactobacilli .................. 81
3.2.2 Heterologously expression of predicted hydrolases/esterases from lactobacilli and characterizations of the recombinant enzymes ................................................................. 82 3.2.3 Fermentations with different lactobacilli in broth supplemented with cinnamic acid derivatives ........................................................................................................................ 88
3.2.4 Screening of lactobacilli for α-L-arabinofuranosidase genes using PCR ............... 90
3.2.5 Heterologously expression of a predicted α-L-arabinofuranosidase and xylosidase from L. brevis TMW1.1326 and characterization of the recombinant enzymes .............. 92
3.2.6 Screening of phenolic acid decarboxylase genes using PCR and verification of decarboxylase activity in lactobacilli ............................................................................... 95 3.2.7 Wort fermentations with a combination of aroma active starter cultures ............... 98
3.2.8 Sourdough fermentations with Lactobacillus pontis TMW1.1086 ......................... 99
3.3 DISCUSSION .............................................................................................................. 100 3.3.1 Determination of activities in lactobacilli able to liberate free forms of hydroxycinnamates during fermentations ...................................................................... 100
4. INSIGHTS INTO THE OXIDATIVE STRESS RESPONSE OF LACTOBACILLUS SANFRANCISCENSIS ....................................................... 110
4.1 MATERIALS AND METHODS ................................................................................. 111

Summary
III
4.1.1 Used strains, media, plasmids, primers, and growth conditions ........................... 111
4.1.2 General molecular techniques ............................................................................... 112 4.1.3 Sequence and mRNA isolation of genes coding for manganese transport protein in L. sanfranciscensis TMW1.53. ...................................................................................... 113
4.1.4 Southern hybridization .......................................................................................... 114 4.1.5 Creation of knock-out mutants for NADH oxidase and glutathione reductase from L. sanfranciscensis TMW1.53 ....................................................................................... 114
4.1.6 Preparation of crude cellular extracts and determination of NADH-oxidase, glutathione reductase or cystathionine-γ-lyase activity ................................................. 116 4.1.7 Determination of intracellular and extracellular sulfhydryl levels ........................ 116
4.1.8 Sequence and expression of a gene coding for a CyuC-like protein in L. sanfranciscensis TMW1.53 ............................................................................................ 117
4.1.9 Determination of the optical density, pH, organic acids formed during fermentation ........................................................................................................................................ 117
4.1.10 Influence of oxidants treatment on growth inhibition determined with a plate assay ............................................................................................................................... 118
4.1.11 Determination of the effect of oxidants treatment on growth rates in MRS broth ........................................................................................................................................ 118
4.1.12 Nucleotide accession numbers ............................................................................ 119 4.2 RESULTS ..................................................................................................................... 120
4.2.1 Nucleotide sequence analysis of the L. sanfranciscensis TMW1.53 glutathione reductase gene ................................................................................................................ 120
4.2.2 Analysis of the amino acid sequence compared with bacterial glutathione reductases ....................................................................................................................... 120
4.2.3 Insertional inactivation of the glutathione reductase gene and glutathione reductase activity of the mutant strain ............................................................................................ 122 4.2.4 Contribution of the glutathione reductase to the oxygen tolerance of L. sanfranciscensis ............................................................................................................. 123 4.2.5 Cysteine and cystine transport by L. sanfranciscensis TMW1.53 ........................ 124
4.2.6 Gene arrangement and regulation of nox .............................................................. 125 4.2.7 Insertional inactivation of the NADH oxidase gene and Nox activity of the mutant strain ............................................................................................................................... 125
4.2.8 The effect of aeration on growth in different media compositions ....................... 125
4.2.9 Determination of intracellular manganese levels in L. sanfranciscensis under static, anaerobic or aerobic conditions ...................................................................................... 127 4.2.10 Effect of agitation and aeration on formation of organic acids during fermentation ........................................................................................................................................ 127
4.2.11 Growth of L. sanfranciscensis TMW1.53 and mutant TMW1.53∆nox in MRS maltose medium supplemented with various fructose concentrations in aerated cultures ........................................................................................................................................ 128
4.2.12 Influence of oxidants treatment on growth inhibition of L. sanfranciscensis TMW1.53 and mutant TMW1.53∆nox in a plate assay ................................................. 129 4.2.13 Contribution of the NADH oxidase (Nox) to the oxygen tolerance of L. sanfranciscensis ............................................................................................................. 130 4.2.14 Other enzymes and antioxidative compounds involved in the oxidative stress response of L. sanfranciscensis ...................................................................................... 131
4.3 DISCUSSION .............................................................................................................. 135 4.3.1 Influence of the glutathione reductase during the aerobic life of L. sanfranciscensis TMW1.53 ....................................................................................................................... 135

Summary
IV
4.3.2 The influence of changes in fermentation conditions on the growth response of Lactobacillus sanfranciscensis TMW1.53 and mutant TMW1.53∆nox ........................ 136
4.3.3 Insight into the oxidative stress response of L. sanfranciscensis .......................... 139
CONCLUDING REMARKS ............................................................................ 147
5. APPENDIX ................................................................................................... 151 5.1 GENERAL MATERIALS AND METHODS ............................................................. 151
5.1.1 Used equipment in the studies according to chapter 2, 3, and 4. .......................... 151
5.1.2 Expendable materials ............................................................................................ 152 5.1.3 Kits ........................................................................................................................ 152
5.1.4 Chemicals .............................................................................................................. 153 5.1.5 Restriction enzymes .............................................................................................. 156 5.1.6 Plasmids ................................................................................................................ 156
5.1.7 Media ..................................................................................................................... 157
5.1.8 Preparation of electro competent E. coli cells and transformation approach ........ 157
5.1.9 Determination of protein concentrations and performance of SDS-PAGE gels ... 158
5.1.10 PCR and agarose gel electrophoresis .................................................................. 159 5.1.11 Isolation of genomic DNA, plasmids, and purification of PCR products ........... 160
5.1.12 Digestion and ligation ......................................................................................... 160 5.2 SEQUENCES ............................................................................................................... 160
6. ABBREVIATIONS ....................................................................................... 164

Summary
V
LIST OF FIGURES Figure 1. Wheat grain showing component tissues. ................................................................... 6 Figure 2. Classification of gliadin and glutenin subunits in wheat flour ................................. 10
Figure 3. Structural elements of AX. ....................................................................................... 15 Figure 4. Maltose and sucrose metabolism of L. sanfranciscensis .......................................... 17
Figure 5. Procedure Rapid-Mix-Test developed at the LfL (Freising). ................................... 33
Figure 6. Free amino nitrogen content during sourdough fermentations with lactobacilli ...... 38
Figure 7. Influence of different sourdough dosages on the bread volume ............................... 39
Figure 8. Final bread volume of sourdough prepared breads with a dosage of 10%. .............. 40
Figure 9. Volume of sourdough prepared breads ..................................................................... 41 Figure 10. (A): Simplified presentation of yeast fermentation. (B): Accumulation of ethanol (mmol) of baker’s yeast in chemically acidified doughs after two hours of fermentation. ..... 42
Figure 11. Influence of supplemented fructose to sourdoughs fermented with L. sanfranciscensis TMW1.53 on the final bread volume. ........................................................... 43
Figure 12. Influence of the used micro organisms in sourdough fermentations on the final bread volume. ........................................................................................................................... 44
Figure 13. Appearance of baked breads with dry yeast ........................................................... 45
Figure 14. Oxidation of glutathione by endogenous flour glutathione dehydrogenase ........... 46
Figure 15. The influence of ascorbic acid towards bread volume is pH-dependent. ............... 46
Figure 16. Influence of oxidized and reduced glutathione on the final bread volume. ............ 47
Figure 17. Appearance of breads in standard baking trials with L. sanfranciscensis TMW1.53 fermented sourdoughs .............................................................................................................. 48
Figure 18. Detection of glutathione reductase acivity in crude cellular extracts ..................... 50
Figure 19. Thiol levels SDS-extracts from chemically acidified wheat doughs and dough fermented with L. sanfranciscensis TMW1.53 and L. sanfranciscensis TMW1.53∆gshR. .... 51 Figure 20. Thiol levels in sourdough fermented with L. reuteri BR11, L. reuteri BR11∆cyuC, L. pontis TMW1.84 and chemically acidified doughs. ............................................................ 52
Figure 21. Relative amounts of gliadins (GLIA) and glutenins (GLUT) in sourdoughs ......... 53
Figure 22. Influence of bakery improvers on the final bread volume. ..................................... 55
Figure 23. Schematic presentation of enzymes involved in ferulic acid (FA) release and conversion to volatile aroma compounds ................................................................................. 65 Figure 24. Content of free ferulic acid during wheat sourdough fermentations with lactobacilli. ............................................................................................................................... 67
Figure 25. Alignment of predicted cinnamyol esterases from different genome sequenced lactobacilli ................................................................................................................................ 83
Figure 26. Plate assay with LB agar and supplemented ethyl ferulate (0.1%)......................... 85
Figure 27. Determination of the pH optimum of the recombinant cinnamoyl esterases.......... 86
Figure 28. Determination of the substrate side chain length-dependent activity of the heterologously expressed cinnamoyl esterases ........................................................................ 87 Figure 29. Thin layer chromatography analysis (TLC) of three day fermentations with lactobacilli in mMRS supplemented with methyl caffeate ...................................................... 89 Figure 30.Screening for arabinofuranosidase genes in lactobacilli using PCR ....................... 90
Figure 31. Alignment of α-L-arabinofuranosidase amino acid sequences from different micro- organisms. ................................................................................................................................ 91
Figure 32. SDS-PAGE gel of the heterologously expressed enzymes. .................................... 93
Figure 33. Temperature -and pH-dependent relative activities of the recombinant enzymes. . 94
Figure 34. TLC analysis of the activity of the recombinant enzymes against branched polysaccharides.. ...................................................................................................................... 95

Summary
VI
Figure 35. PCR products obtained for decarboxylase genes in lactobacilli. ............................ 96
Figure 36. Metabolism of coumaric acid and ferulic acid in fermentations with L. pontis. .... 97 Figure 37. Metabolism of p-CA to 4-vinylphenol and 4-ethylphenol by L. pontis .................. 98 Figure 38. Amino acid sequence of the glutathione reductase of L. sanfranciscensis ........... 122 Figure 39. Integration of pME-1∆gshR into gshR of L. sanfranciscensis TMW1.53. ........... 122 Figure 40. Growth of L. sanfranciscensis TMW1.53 and L. sanfranciscensis TMW1.53∆gshR at aerobic conditions and anaerobic conditions ...................................................................... 123 Figure 41. Growth of L. sanfranciscensis TMW1.53∆gshR and L. sanfranciscensis TMW1.53∆gshR in mMRS without addition of cysteine. ..................................................... 124
Figure 42. Growth of Lactobacillus sanfranciscensis TMW1.53 and TMW1.53∆nox under static, anaerobic growth conditions and under aerobic (220 rpm) conditions ....................... 126
Figure 43. Formation of organic acids in aerated cultures, under anaerobic, statically conditions ............................................................................................................................... 128
Figure 44. Growth of L. sanfranciscensis TMW1.53 and mutant TMW1.53∆nox in MRS maltose with various fructose concentrations under aerobic conditions (220 rpm). .............. 129
Figure 45. Influence of diamide treatment on growth inhibition of. Lactobacillus sanfranciscensis TMW1.53∆nox and L. sanfranciscensis TMW1.53 ................................... 130
Figure 46. Growth response of L. sanfranciscensis TMW1.53and mutant TMW1.53∆nox in MRS supplemented with 0.5 g L-1 cysteine and MRS without addition of cysteine ............. 131 Figure 47. Insight of involved enzymes to achieve redox homeostasis in Lactobacillus sanfranciscensis under oxidative stress conditions ................................................................ 132
Figure 48. The figure summarizes the features of the pBAD/Myc-His vector ...................... 156

Summary
VII
LIST OF TABLES Table 1. Carbohydrate composition grain of wheat ................................................................... 7 Table 2. Classification of different wheat proteins .................................................................... 8 Table 3. Repeating motifs of x- and y-type HMW subunits ..................................................... 11 Table 4. Microbiological characterization of sourdough prepared with „Tommi“ wheat flour (type 550, A wheat) .................................................................................................................. 36
Table 5. Microbiological characterization of sourdoughs prepared with „Bussard“-wheat flour (type 550, E wheat) .................................................................................................................. 37
Table 6. Microbiological characterization of sourdough prepared with „Dekan”-wheat flour (type 550, B wheat) .................................................................................................................. 37
Table 7. Occurrence of glutathione reductase genes and cystathionine-γ-lyase genes in different lactobacilli ................................................................................................................. 49
Table 8. Glutathione reductase and cystathionine-γ-lyase activity in sourdough lactobacilli. 50
Table 9. Microbiological characterization of sourdoughs prepared with commercially, ascorbic acid-free wheat flour for gluten protein determination. ............................................. 54 Table 10. Characterization of the fermented sourdoughs supplemented with bakery improvers .................................................................................................................................................. 56
Table 11. Used microorganisms and their cultivation conditions ............................................ 69
Table 12. Used primers for PCR and cloning experiments ...................................................... 70
Table 13. Used buffer solutions for the pH-dependent determination of cinnamoyl esterase-activity ...................................................................................................................................... 71
Table 14. Preparation of citrate buffer solution in the pH-range of 4.0–6.0 ............................ 71
Table 15. Preparation of sodium phosphate buffer solution in the pH-range of 6.5–8.0 ......... 72
Table 16. Preparation of Tris-HCL buffer solution in the pH-range of 8.5–9.0 ...................... 72
Table 17. Screening for cinnamoyl esterase activity in lactobacilli with mMRS agar plates supplemented with 0.1% ethyl ferulate .................................................................................... 81 Table 18. Enzyme kinetics of the recombinant cinnamoyl esterases in reactions with the substrate p-nitrophenyl acetate ................................................................................................. 86
Table 19. Screening for harbored pdc/pda genes and enzyme activities of lactobacilli .......... 96 Table 20. Results of the wort fermentations with a combination of cultures. .......................... 99
Table 21. Used primers for PCR and cloning experiments .................................................... 111
Table 22. Sensitivities of L. sanfranciscensis TMW1.53 and mutant TMW1.53∆nox to oxidants. ................................................................................................................................. 130
Table 23. Equipment .............................................................................................................. 151 Table 24. Other materials ....................................................................................................... 152 Table 25. Commercially available kits ................................................................................... 152 Table 26. Chemicals ............................................................................................................... 153 Table 27. Composition of mMRS-medium ............................................................................ 157 Table 28. Composition of denaturating and electrophoresis buffer ....................................... 158
Table 29. One letter code for nucleotides .............................................................................. 166 Table 30. One letter code for amino acids ............................................................................. 167 Table 31. Units of measurements ........................................................................................... 167

Preface
VIII
PREFACE
This study was carried out at the department of “Technische Mikrobiologie Weihenstephan”
(TMW) at the Technical University of Munich (TUM), and included a scientific visit at the
Department of Agricultural, Food and Nutritional Science of the University of Alberta,
Edmonton (Canada) during the years 2004 – 2008. Part of the research was funded by the
Research Association of the German Food Industry (FEI) and the German Federation of
Industrial Research Associations “Otto von Guericke” project No. AiF-FV 14492 N
“Optimization of gluten quality in wheat doughs containing sourdoughs”, and the Canada
Research Chairs Program. The participating sourdough company Ernst Böcker GmbH & Co.
KG is gratefully acknowledged for funding part of my salary.
The work presented in this thesis would not have been accomplished without the support,
encouragement and help of many people. I sincerely thank Professor Rudi F. Vogel for
providing excellent working facilities for this scientific project. Without his critical and
detailed comments throughout my work at his department, and his research expertise, there
could have been no guarantee of finishing this thesis.
I am also grateful to Professor Michael Gänzle for enabling me a scientific stay at his
department in Edmonton, and continuing my experimental work in the lab. His ideas and
overall scientific knowledge in the field of lactic acid bacteria inspired me throughout my
thesis. Professor Matthias Ehrmann helped me a lot in the field of molecular cloning
techniques and genome wide screening approaches. I want to thank Dr. Herbert Wieser of the
Hans-Dieter-Belitz Institute for Cereal Grain Research (hdbi); his department performed the
analyses of the gluten fractions and the evaluation of the ferulic acid content in wheat
sourdough fermentations. Many thanks also to the bakers of the LfL (Landesanstalt für
Landwirtschaft) in Freising, who performed the baking trials in respect to final bread volume.
This work would not have been possible without the support and co-operation of several
colleagues. I wish to thank my co-authors at the TMW: Dr. Nicoline Vermeulen, Dr. Clarissa
Schwab, Dr. Simone Freiding, Dr. Jürgen Behr, and Dr. Maher Korakli. Many thanks also to
the several students (diploma thesis, bachelor, and coursework), who conducted in some
extent approaches for this thesis. Mrs. Monika Hadek and Mrs. Angela Seppeur have taken
great care in creating a very pleasing working atmosphere at the department.
I would like to thank my parents for putting me on this planet and to grow up without a care
in the world. Finally, I am deeply grateful to Melanie – as of late Magdalena and Ludwig –
for bringing so much joy, love and inspiration to my life.

Summary
1
SUMMARY The contribution of wheat sourdough fermentations on the final bread volume is presented in
the first part of this thesis. Exogenous and endogenous factors, e.g. strain selection, sourdough
dosage, and fermentation period, which have a main impact on gluten quality were evaluated
in respect to the final bread volume during wheat sourdough fermentations. A distinct
classification was not observable for different microorganisms in sourdough fermentations
with respect to the final bread volume. Moreover, the influence of acid supplementation
resulting in different bread dough pH-values on bread volume is presented. Increasing
amounts of acetic acid resulted in collapsed final bread volumes; thus, the performance of the
baker´s yeast was strongly inhibited with elevated acetic acid concentrations. Redox reactions
catalyzed by the fermentation flora during wheat sourdough fermentations generated reduced
thiol compounds. Low-molecular weight compounds are capable bread aroma precursors; in
addition, the dough rheology is affected by degradation of gluten proteins caused by a
decrease of the redox potential in the dough system. The addition of baking improvers in
fermentations with L. sanfranciscensis had a positive effect on the final bread volume; thus,
the baking agents were not diminished during wheat sourdough fermentations.
The distribution of enzyme activities in lactobacilli able to generate volatile aroma
compounds from hydroxycinnamic acids is discussed in the second part of this thesis. Ferulic
acid was accumulated in wheat sourdough fermentations with L. sanfranciscensis; by using
plate screening approaches the ability of lactobacilli was evaluated to release bonded
hydroxycinnamic acids. Furthermore, predicted cinnamoyl esterases, and arabinoxylan-
degrading enzymes were heterologously expressed and characterized of different lactobacilli.
It was shown that liberated phenolic compounds could be further metabolized and account for
aroma in sourdough fermentations. The free form of the phenolic acid is the substrate of
decarboxylases by lactobacilli, generating volatile precursors, e.g. 4-vinylphenol and 4-
vinylguaiacol, respectively. In wort fermentations with a combination of aroma active starter
cultures, the results from the screenings were merged together; a combination of L. brevis
TMW1.1326 and L. pontis TMW1.1086 showed capable results related to the generation of
active aroma odors.
Thirdly, insights are given into the oxidative stress response of L. sanfranciscensis; two main
enzyme activities contributing to the aerobic life of the strain, glutathione reductase and
NADH-oxidase, respectively, are introduced, and characterized by creating of cognate mutant

Summary
2
strains. The loss of GshR activity in L. sanfranciscensis TMW∆gshR resulted in a loss of
oxygen tolerance. The gshR-mutant strain exhibited a strongly decreased aerobic growth rate
on mMRS when compared to either anaerobic growth or the wild type strain; aerobic growth
was restored by addition of cysteine. In addition, by inactivation of the native NADH-oxidase
gene, it was ensured that besides fructose O2 can react as an electron acceptor. The mutant
strain was only able to grow in MRS media supplemented with fructose in aerated cultures,
whereas the wild type strain showed a fructose-independent growth response. Additionally, L.
sanfranciscensis showed manganese-dependent growth response in aerated cultures, the final
OD and growth velocity was increased in media supplemented with manganese. Finally, the
mutant strain TMW1.53∆nox was more sensitive to the superoxide generating agent paraquat
and showed inhibition of growth on diamide-treated MRS-plates without fructose
supplementation. A scheme is proposed for the enzymes included in the detoxification of
reactive oxygen species, and possible effects are shown of antioxidative compounds in L.
sanfranciscensis to maintain redox homeostasis during the aerobic life of the strain.

Zusammenfassung
3
ZUSAMMENFASSUNG
Der erste Teil dieser Arbeit präsentiert den Beitrag von fermentierten Weizensauerteigen auf
das resultierende Brotvolumen. Exogene und endogene Faktoren, wie Stammauswahl,
Sauerteiganteil und Fermentationsdauer, die einen grossen Einfluss auf die Kleberqualität und
somit das resultierende Brotvolumen haben wurden während einer Weizensauerteigfermen-
tation bewertet. Eine eindeutige Klassifizierung auf das resultierende Brotvolumen von
verschiedenen, in Sauerteigen eingesetzten Mikroorganismen konnte nicht aufgestellt werden.
Darüber hinaus ist der Einfluss von Säurezugabe, resultierend zu unterschiedlichen Brotteig
pH-Werten, auf das finale Brotvolumen dargestellt. Steigende Mengen an zugesetzter
Essigsäure lassen die Brotvolumen kollabieren. Folglich wurde die Leistung der Backhefe mit
steigenden Essigsäurekonzentrationen stark gehemmt. Während einer Weizensauerteig-
fermentation werden Redoxreaktionen durch die Fermentationsflora katalysiert, die reduzierte
Thiolkomponenten erzeugen. Verbindungen mit niedrigem Molekulargewicht sind mögliche
Brotaromenvorstufen. Des Weiteren wird die Teigrheologie durch den Abbau des
Klebernetzwerkes beeinflusst, welcher durch die Erniedrigung des Redoxpotentials im
Teigsystem hervorgerufen wird. Der Zusatz von Backmitteln in Fermentationen mit L.
sanfranciscensis hatte einen positiven Einfluss auf das resultierende Brotvolumen.
Dementsprechend wurden die Backmittel während einer Weizensauerteigfermentation in ihrer
Wirkung nicht abgeschwächt.
Der zweite Teil dieser Arbeit widmet sich der Verbreitung von Enzymaktivitäten in
Laktobazillen, welche flüchtige Aromakomponenten aus Hydroxy-Zimtsäuren generieren.
Ferulasäure wurde während einer Weizensauerteigfermentation mit L. sanfranciscensis
angehäuft. Die Fähigkeit von Laktobazillen gebundene Hydroxy-Zimtsäuren freizusetzen,
wurde mittels Platten-Untersuchung evaluiert. Weiterhin wurden mögliche Zimtsäure-
esterasen und Arabinoxylan-abbauende Enzyme von verschiedenen Laktobazillen heterolog
exprimiert und charakterisiert. Es wurde gezeigt, dass freigesetzte Phenolverbindungen
verstoffwechselt wurden und somit zur Entwicklung des Aromas in Sauerteigfermentationen
beitragen können. Die freie Form der Phenolsäure dient als Substrat für Decarboxylasen von
Laktobazillen, die flüchtige Verbindungen wie 4-Vinylphenol bzw. 4-Vinylguaiacol erzeugen.
Die Resultate der Screenings wurden in Vorderwürzefermentationen mit einer Kombination
von aroma-aktiven Starterkulturen zusammengefügt. Viel versprechende Resultate im

Zusammenfassung
4
Hinblick auf die Erzeugung von aktiven Aromenverbindungen konnten mit einer
Kombination von L. brevis TMW1.1326 und L. pontis TMW1.1086 erzielt werden.
Im dritten Teil der Arbeit ist ein Einblick in die oxidative Stressantwort von L.
sanfranciscensis gegeben. Zwei wichtige Enzymaktivitäten (Glutathion-Reduktase und
NADH-Oxidase) werden vorgestellt, die zum aeroben Leben des Stammes beitragen. Die
beiden Enzymaktivitäten werden durch die Erzeugung von verwandten Mutantenstämmen
charakterisiert. Der Verlust der Glutathion-Reduktase Aktivität in L. sanfranciscensis
TMW∆gshR ist verantwortlich für den Verlust der Sauerstofftoleranz des Stammes. Im
Verhältnis zu anaeroben Wachstumsbedingungen bzw. dem Wachstum des Wildstammes
zeigte der gshR-Mutantenstamm eine stark verringerte Wachstumsrate unter aeroben
Bedingungen. Durch den Zusatz von Cystein zum Nährmedium wurde das Wachstum unter
aeroben Bedingungen wiederhergestellt. Durch die Inaktivierung des ursprünglichen NADH-
Oxidase Genes wurde zusätzlich sichergestellt, dass neben Fruktose auch Sauerstoff als
Elektronenakzeptor verwendet werden kann. Der Mutantenstamm war nur in MRS-Medium
mit zugesetzter Fruktose befähigt unter aeroben Kulturbedingungen zu wachsen, wohingegen
der Wildstamm ein fruktose-unabhängiges Wachstumsverhalten aufwies. Des Weiteren zeigte
L. sanfranciscensis unter aeroben Kulturbedingungen ein mangan-abhängiges Wachstums-
verhalten. In Medium mit zugesetztem Mangan waren die optische Dichte und die
Wachstumsgeschwindigkeit gesteigert. Abschliessend zeigte der Mutantenstamm
TMW1.53∆nox ein sensitives Verhalten gegenüber Paraquat, eine Substanz die Superoxide
erzeugt. Auf MRS-Platten ohne Fruktosezusatz konnte ebenfalls eine Wachstumhemmung bei
Diamid-Behandlung gezeigt werden. Eine Übersicht von beteiligten Enzymen die zu einer
Überwindung von reaktiven Sauerstoffarten beitragen wurde aufgestellt, darüber hinaus
werden mögliche Effekte von antioxidativen Verbindungen in L. sanfranciscensis gezeigt,
welche einen Beitrag zur Redox-Selbstregulation während des aeroben Lebens des Stammes
leisten.

Chapter 1
5
1 1. GENERAL INTRODUCTION
This introduction reviews current knowledge of the topics exposed in this thesis. The main
substrate wheat flour and the diversity of gluten proteins are described. A short introduction is
given in the chemistry of gluten proteins, non-starch polysaccharides (NSP), as well as in the
biodiversity and metabolic exploitation of wheat sourdough microbiota. Lactobacillus
sanfranciscensis TMW1.53, the main strain used in the studies of chapter 2 and 4 is
introduced. A general overview of oxidative stress responses is given for the Lacto-
bacillaceae.
The second section focuses on wheat sourdough fermentations with lactobacilli. The
evaluation of sourdough dosage and the impact on the final bread volume is shown; the effect
of strain selection, fermentation period, organic acid accumulation, and addition of baking
improver’s is determined. Moreover, the influence of glutathione reductase activity of strain
Lactobacillus sanfranciscensis TMW1.53 in sourdough fermentations is introduced, and the
interaction of glutathione in respect to gluten quality is demonstrated.
Thirdly, the ability of hetero- and homofermentative lactobacilli is discussed to liberate
phenolic aroma precursors in wheat sourdough fermentations. As a starting point for this
study screening approaches with different lactobacilli were performed on mMRS plates
supplemented with ethyl ferulate. Subsequently, with in vivo fermentations and molecular
techniques the ability of specific Lactobacillus strains could be shown to have the potential of
phenolic aroma enhancement during wheat sourdough fermentations. Main enzyme activities
in the metabolism of bonded ferulic acid in wheat arabinoxylan to volatile phenolic aroma
compounds of lactobacilli were heterologously expressed in E. coli.
Finally, the last chapter reviews the defenses against oxidative stress in Lactobacillus
sanfranciscensis TMW1.53 on a genetically background. The detoxification of reactive
oxygen species could be performed on an enzymatic level and on a non-enzymatic level as
well. Two crucial enzyme activities were shut downed for cell defense against oxygen related
stress by creating cognate mutants. An insight is summarized of the ability of Lactobacillus

Chapter 1
6
sanfranciscensis to compensate the effect of reactive oxygen species during the aerobic life of
the strain.
1.1 WHEAT FLOUR
Wheat is one of the three most important crops in the world, together with maize and rice
(95). The vast majority of bread is traditionally produced from wheat flour. The gluten
proteins, the non-starch polysaccharides, and lipids are the main compounds besides the major
substance starch (42). During all steps of bread making, complex chemical, biochemical and
physical transformations occur, which affect and are affected by the various flour constituents
(42). The key characteristic of wheat is the unique properties of doughs formed from wheat
flours; these properties depend on the structures and interactions of the grain storage proteins,
which together form the “gluten” protein fraction (93).
Figure 1. Wheat grain showing component tissues (Reprinted from Surget and Barron, 2005) (90). The wheat grain contains of 2-3% germ, 13-17% bran, and 80-85% mealy endosperm (102).
Outer layers of wheat grain (bran) have primarily a role of protection; cell walls in these
tissues are thick, hydrophobic and essentially formed of cellulose and complex xylans, but
also generally contain significant amounts of lignin (90). Proteins and carbohydrates each
represent approx. 16% of total dry matter of the bran. The inner starchy endosperm mainly

Chapter 1
7
contains carbohydrate reserves, which are needed for the growth of the seedling; apart from
carbohydrates the endosperm contains lipids (1.5%), proteins (13%) and minerals (0.5-1.5%)
(90, 102). The carbohydrate composition of wheat grain is important, because of the
nutritional requirement of the sourdough microbiota in fermentations.
Table 1. Carbohydrate composition grain of wheat Compound % Starch 63.0 – 72.0 Amylose (in starch) 23.4 – 27.6 Pentosan 6.6 β-Glucan 1.4 Fructosan 0.9 – 1.46 Glucose 0.02 – 0.03 Fructose 0.02 – 0.04 Sucrose 0.57 – 0.80 Maltose Traces Raffinose 0.2 – 0.39
(12)
Wheat flour mainly consists of starch (70–75%), water (approx. 14%) and proteins (10–12%).
In addition, non-starch polysaccharides (2–3%), in particular arabinoxylans (AX), and lipids
(1.5–2.5%) are important minor flour constituents relevant for bread production and quality
(42). The starch is the most abundant component of wheat flour; it consists of branched
glucose-units linked together by glycosidic bonds. Starch is composed of two different
molecules:
- linear and helical amylose (500 – 6.000 α-(1-4) linked D-glucose-units).
- branched amylopectin (300.000 – 3.000.000 D-glucose-units linked together with α-
(1-4) and α-(1-6) bonds).
Starch could be found in wheat in two different granules; the large, lenticular (B-type)
granules having diameters from 10–35 nm, and the small, spherical (A-type) granules with a
diameter of 2–10 nm (50). The amylose/amylopectin ratio differs between starches, but
typical levels of amylose and amylopectin are 25–28% and 72–75%, respectively (24).

Chapter 1
8
1.2 WHEAT GLUTEN PROTEINS
Gluten proteins play a key role in determining the unique baking quality of wheat by
conferring water absorption capacity, cohesivity, viscosity and elasticity on dough (119).
Scientific study of cereal grain proteins extends back for over 250 years, with the isolation of
wheat gluten first being described in 1745 from Beccari, and more systematic studies have
been carried out by Osborne (1859-1929) (94). Osborne (1924) classified the proteins of
wheat according to their solubility in four different fractions: albumins, soluble in water;
globulins, soluble in salt solutions; gliadins, soluble in 70% ethanol; glutenins, soluble in
diluted acetic acid. Albumins and globulins represent about 20% of total proteins in wheat
flour, gliadins and glutenins account for approx. 80% of the wheat flour proteins (12, 91, 93).
This definition has since been extended to include related proteins, which are not soluble in
alcohol-water mixtures in the native state. In wheat, these groups of monomeric and
polymeric prolamins are known as gliadins and glutenins, respectively, and together form
gluten proteins (1, 98, 119). Both fractions consist of numerous, partially closely related
protein components characterized by high glutamine and proline contents (94, 119). Wheat
prolamins are the major storage proteins present in the starchy endosperm cells of the grain
(1).
Table 2. Classification of different wheat proteins Osborne Solubility Composition Functional Fraction behavior role Albumin water Non-gluten proteins Variable mainly monomeric Globulin dilute salt Non-gluten proteins Variable mainly monomeric Gliadin aqueous alcohol Gluten proteins (mainly monomeric Dough gliadins and LMW glutenins) viscosity Glutenin dilute acetic acid Gluten proteins (mainly HMW Dough glutenin polymers) elasticity Residue unextractable Gluten proteins (HMW polymers Variable and polymeric non-gluten proteins (triticins)
(42)

Chapter 1
9
1.2.1 Gliadins and glutenins
Gluten proteins enable the formation of a cohesive visco-elastic dough that is capable of
holding gas produced during fermentation and oven-rise, resulting in the typical fixed open
foam structure of bread after baking (114). Both fractions are important contributors to the
rheological properties of dough; nonetheless, their function related to dough quality are
diverse. Gliadins and glutenins are usually found in more or less equal amounts in wheat (42).
Hydrated gliadins have little elasticity and are less cohesive than glutenins; they contribute
mainly to the viscosity and extensibility of the dough system. In contrast, due to their large
size, glutenin polymers form a continuous network that provides strength and elasticity to the
dough (42, 119). For example, highly elastic doughs are required for bread making, whereas
more extensible doughs are needed for making cakes and biscuits (94, 95).
Gliadins are mainly monomeric proteins with molecular weights (Mw) around 28.000–
55.000 and can be classified according to their different primary structures into α/β-, γ- and ω-
type gliadins (114, 119). Cysteine residues play an important role in the structure of both
gliadins and glutenins. These cysteine residues are either involved in disulfide bonds within
the same polypeptide (intra-chain disulfide bonds) or in disulfide bonds between different
polypeptides (inter-chain disulfide bonds) (114). α/β-Gliadins contain six cysteine residues
and form three intra-chain disulfide bonds, while γ-gliadins contain eight cysteine residues
and form four intra-chain disulfide bonds, ω-gliadins lacking cysteine residues and therefore
the possibility to form disulfide cross links. Almost all cysteine residues are located in the C-
terminal domain (43, 108). Minor portion of gliadins have an odd number of cysteines and are
linked together or to glutenins; these gliadins are proposed to act as a terminator of glutenin
polymerization. ω-Gliadins are characterized by the highest contents of glutamine, proline and
phenylalanine which together account for around 80% of the total composition (119). Studies
on the secondary structure have indicated that the N-terminal domains of α/β- and γ-gliadins
are characterized by β-turn conformation, similar to ω-gliadins (64, 119). The non-repetitive
C-terminal domain contains considerable proportions of α-helix and β-sheet structures.
Comparison of amino acid sequences revealed that α/β-gliadins and γ-gliadins are both related
to the LMW-GS, they are accordingly classified as “sulfur-rich prolamins” (98, 114).
The glutenin fraction has been difficult to study since it comprises several dozen different
disulfide-bonded polypeptides in the molecular mass range of millions to hundreds of millions
(64). The largest polymers termed “glutenin macropolymer” (GMP) showed the greatest
contribution to dough properties; the amount in wheat flour (~ 20–40 mg/g) is strongly

Chapter 1
10
correlated with dough strength and loaf volume (119). After reduction of disulfide bonds, the
resulting glutenin subunits show solubility in aqueous alcohols similar to gliadins (119).
Shewry and Halford classified all prolamins of the Triticeae (wheat, barley and rye) to three
broad groups: sulfur-rich (S-rich), sulfur-poor (S-poor) and high molecular weight (HMW)
prolamins (94). Based on primary structure, glutenin subunits have been divided into high-
molecular-weight (HMW) subunits (MW: 67.000–88.000) and low-molecular-weight (LMW)
subunits (MW: 32.000–35.000) by Wieser (2006) (119). Although LMW subunits show
strong similarities with α-type and γ-type gliadins, they differ in one very important
characteristic; apart from intra-chain disulfide bonds, inter-chain disulfide bonds that lead to
incorporation of LMW subunits in glutenin polymers also occur in LMW subunits (114).
LMW subunits contain eight cysteins, six of them are in positions homologous to α/β- and γ-
gliadins, and therefore are proposed to be linked by intra-chain disulfide bonds (43, 119, 120).
The two additional cysteine residues are not able to form intra-chain bonds; thus, inter-chain
disulfide bonds are generated with cysteines of other gluten proteins.
Figure 2. Classification of gliadin and glutenin subunits in wheat flour (64).
The current nomenclature of HMW subunits contains, besides an indication of the genetic
locus (1A, 1B, or 1D) and the type (x or y), a number that was originally meant to reflect a
ranking according to decreasing molecular weight; this number reflects now the mobility of
the glutenin subunit on SDS-PAGE (114). HMW glutenin subunits belong to the minor
components within the gluten protein family (~ 10%). Each wheat variety contains three to
five HMW subunits which can be grouped into two different types, the x- (MW: 83.000–
88.000) and the y-type (MW: 67.000–74.000), respectively (75, 119). HMW subunits have
high contents of proline, glutamine, glycine, and low contents of lysine; they consist of non-
repetitive N- and C-terminal domains (A- and C domain) flanking a central repetitive domain

Chapter 1
11
(B domain) that confers elasticity to protein molecules (1, 40, 119). Domains A and C are
characterized by the frequent occurrence of charged residues and by the presence of most or
all cysteine residues (119).
Table 3. Repeating motifs of x- and y-type HMW subunits Subunits Motif x-type y-type Tri-peptide GQQ -- Hexa-peptide PGQGQQ PGQGQQ Nona-peptide GYYPTSPQQ GYYPTSLQQ (96, 114)
The most important difference between the x- and the y-type lies within the A- and B domains
and the occurrence of cysteine residues. The x-type except subunit Dx5 has four cysteines,
three in domain A and one in domain C (97, 119). Two residues of domain A are linked by an
intra-chain bond, the other two by inter-chain disulfide bonds. Subunit Dx5 has an additional
cysteine residue at the beginning of domain B; it is proposed that another inter-chain bond is
generated. The y-type has five cysteines in domain A and one in each of domains B and C.
Inter-chain disulfide bonds have been detected in the cysteines of domain A, which are
connected with corresponding residues of another y-type. Cysteine residue of domain B is
linked together with cysteines of LMW subunits; at present, no inter-chain bond is observed
of the cysteine residue of domain C (59, 119). The amino acid composition of HMW subunits
indicates the hydrophilic nature of the central repetitive domain and the hydrophobic
characteristics of the N- and C-terminal domains (96).
HMW subunits are the major determinants of dough and gluten elasticity; the two main
features of the HMW subunits structure in respect to their role in glutenin elastomers are as
follows: the number and distribution of disulfide bonds and the properties and interactions of
the repetitive domains. Although disulfide-linked glutenin chains provide an “elastic
backbone” to gluten for interactions with other glutenin subunits and with gliadins, evidence
from spectroscopic studies of HMW subunits suggests that non-covalent hydrogen bonding
between glutenin subunits and polymers may also be important (1, 7, 8, 117). The importance
of non-covalent bonds can be demonstrated by the effects of agents such as salts, urea, and
deuterium oxide on dough mixing (27, 112). Moreover, it was proposed by Belton that inter-
chain hydrogen bonds formed in particular between glutamine residues are also important in

Chapter 1
12
conferring elasticity (6, 94). The disulfide structure of native glutenins is not in a stable state,
but undergoes a continuous change from the maturing grain to the final end product bread
(120, 121). Differences in the disulfide bonding properties of glutenin subunit impact on their
association within the glutenin macropolymer and role in establishing gluten structure and
subsequent function (64). Different factors, e.g. genetic configuration (ratio: gliadin, LMW
subunits, and HMW subunits), environmental differences (sulfur deficiency, heat or water
stress), and the redox state of the system (presence of reducing or oxidizing agents) are
influencing the state of disulfide structure (121). Hence, oxidizing and reducing agents which
have a strong impact on the dough thiol-disulfide system can affect the polymerization of
glutenin subunits and thereby change the rheological properties of the dough (36, 42). Already
very low concentrations of endogenous glutathione drastically weaken the dough and increase
extensibility through thiol/disulfide interchange. Reduced glutathione (γ-GluCysGly, GSH)
and oxidized glutathione (GSSG) are both naturally occurring in wheat flour (61). These
sulfhydryl compounds are capable of undergoing a disulfide-sulfhydryl interchange with other
low-molecular weight thiol compounds as well as gluten proteins, resulting in the cleavage or
reformation of disulfide bonds in wheat dough (43). The effect of sulfur (S) deficiency on the
amount of total glutathione and cysteine in flour was evaluated by Köhler et al. (84); the
different dough properties caused by S deficiency affected the final bread volume drastically.
They concluded that the concentrations of glutathione and cysteine in S-deficient flours
influenced the rheological dough properties at least as much as protein parameters.
Oxidizing or reducing agents that influence the thiol-exchange reactions between reduced
glutathione and gluten proteins are therefore important components of baking improvers to
standardize and to control dough rheology and bread texture in wheat baking processes. L-
threo-ascorbic acid most strongly enhances strength, handling and baking properties of
doughs; it is oxidized enzymatically by an endogenous ascorbic acid oxidase which uses
molecular oxygen as an electron acceptor (43). Following, L-threo-dehydroascorbic acid and
water are generated. The oxidized ascorbic acid acts as an electron acceptor in the oxidation
of endogenous glutathione by wheat flour glutathione dehydrogenase. By this reaction the
level of reduced glutathione is drastically decreased in the system, which can weaken the
dough (36, 43). The influence of addition of exogenous oxidizing enzymes, e.g. tyrosinase,
laccase, glucose oxidase, glutathione oxidase, and sulfhydryl oxidase could be seen in other
studies. Also, the occurrence of dityrosine bonds during dough development is postulated to
play only a minor role in the structure of wheat gluten (46). Nonetheless, the increase of

Chapter 1
13
dehydro-ferulic acid-tyrosine (DFT) cross linking was detected during wheat dough mixing;
therefore, it is very likely that DFT represents a new covalent cross link between AX and
proteins in cereal flour (82). No correlation was observed between gluten yield and dityrosine
concentrations, indicating that dityrosine cross links are not a determinant factor for gluten
formation (87).
1.3 NON-STARCH POLYSACCHARIDES (NSP)
Beside starch and the gluten proteins, a third important group called non-starch
polysaccharides (NSP) affects the process of bread production. As mentioned before, wheat
flour consists to 2-3% of non-starch polysaccharides, in particular arabinoxylans (AX). In
general, NSP includes arabinoxylan, β-glucan, cellulose, and smaller peptides derived from
amylose and amylopectin (48). Nevertheless, these components have major effects on the use
of wheat flour in bread making due to their viscosity in aqueous solution but also to their
hydration properties (90). The wheat endosperm cell walls consist up to 75% (dry matter
weight) of NSP, of which arabinoxylans are by far the most prominent group (85%) (70, 71).
Arabinoxylans have a common structure of β-1,4-linked D-xylopyranosyl residues,
substituted at the C(O)-3 and/or the C(O)-2 position with monomeric α-L-arabinofuranoside
(78, 79). Some of the arabinose residues are ester linked on (O)-5 to ferulic acid (101).
Polysaccharide-bond ferulic acid occurs widely in graminaceous plants, such as wheat bran
and other cereals (32, 33). Hydroxycinnamic acids are very important compounds for the
structure of the cell wall, because they can be coupled by peroxidase-mediated oxidative
bonding to form a variety of diferulates enhancing the cross linking of polysaccharide chains
(47, 83). On average 66% of xylosyl residues of the xylan backbone are unsubstituted. The
arabinoxylans are grouped in water-extractable (WE-AX) and water-unextractable (WU-AX)
AX (42). In wheat flours the average amounts of WE-AX and WU-AX are 0.5% and 1.7%,
respectively (90). The content of ferulic acid in WU-AX is increased up to five-times in
comparison with the content in WE-AX (81). The generation of diferulates via cross linking
under oxidising conditions by WE-AX results in a strong viscosity increase of the
arabinoxylan solution, and at high AX concentrations to a formation of a gel. Dehydro-
diferulic acid cross-links are likely to be the major parameter that explains differences
between WE-AX and WU-AX in the endosperm and aleuronic cell walls of cereal grains (2).
Unlike most polysaccharide gels, arabinoxylan gelation process and gel properties are

Chapter 1
14
governed by the establishment of covalent (e.g. diferulates) linkages and also weak hydrogen
interactions. Moreover, the arabinoxylan properties are dependent on AX structural
characteristics such as molecular weight (Mw), xylan backbone substitution (A/X ratio), as
well as ferulic acid content and location (22, 113). The Mw of water extractable AX of wheat
is in the range of 200-300 kDa (30). The arabinose to xylose ratio (A/X) is often used to
characterise the structure of AX, and the average value of A/X ratio is 0.5 for WE-AX in the
starchy endosperm (90). The structure of WU-AX is very close to that of WE-AX, but the
average molecular weight and A/X ration are slightly higher for the water unexctractable AX
compared to the water extractable AX (53). Ferulic acid is an important structural element of
the AXs from starchy endosperm, although the amount linked to arabinoxylan is very low and
represents 0.3% of WE-AX and 0.6-0.9% of WU-AX in wheat. These percentages correspond
to about 2-4 ferulic acid residues per 1.000 xylose residues in WE-AX and 6-10 ferulic acid
residues in WU-AX, respectively (10). The amount of dehydro-diferulic acids were detected
10-15 times in lesser amounts than ferulic acid in WE-AX, but only four times lesser amounts
than ferulic acid in WU-AX (30, 62). In comparison, ferulic acid (FA) accounts for 0.9% of
arabinoxylan in the pericarp from wheat, and very similar amounts are observed for dehydro-
diferulic acids, which corresponds to about 30 ferulic acid residues per 1.000 xylose residues
(2, 56, 69, 90). The presence of polysaccharide-bond hydroxycinnamic acids, e.g. p-coumaric,
sinapic, and ferulic acid, in the cell walls of different plant species was observed in several
studies (14, 19, 20, 23). They are found both covalently attached to the plant cell wall and as
soluble forms in the cytoplasm (34). Ferulic and p-coumaric acid account for 0.66 and 0.004%
dry weight of the cell wall in wheat bran, respectively (88, 101). Ferulic acid is linked to
various carbohydrates as glycosidic conjugates, and it occurs as various esters and amides
with a wide variety of natural products (88). A remarkable part of the ferulates in the cell wall
form dimers, the presence of ester-linked dimeric phenolic compounds is a physiologically
significant strategy to strengthen the cell wall, and to terminate cell wall extensibility. Ferulic
acid also mediates polysaccharide-protein cross links via tyrosine or cysteine residues (65), as
mentioned in chapter 1.2. FA exhibits a wide range of therapeutic effects against various
diseases like cancer, diabetes, cardiovascular and neurodegenerative (4). It has been proved to
be a potent antioxidant, reported to terminate free radical chain reaction and reduces the risk
for coronary heart diseases (11). FA is an effective scavenger of free radicals and it has been
approved in certain countries as food additive to prevent lipid peroxidation (103).

Chapter 1
15
Figure 3. Structural elements of AX: (A) non-substituted D-xylopyranosyl residue; (B) D-xylo-pyranosyl residue substituted on C(O)-2 with a L-arabinofuranosyl residue; (C) D-xylopyranosyl residue substituted on C(O)-3 with a L-arabinofuranosyl residue and linkage of ferulic acid to C(O)-5 of the L-arabinofuranosyl; (D) D-xylopyranosyl residue substituted on C(O)-2 and C(O)-3 with L-arabinofuranosyl residue (42). The amount and type of hydroxycinnamates vary greatly in respect to different cereal grains
and different tissues, e.g. endosperm or bran, respectively.
WU-AXs are cross-linked in the cell wall structure and therefore water-unextractable. Until
now, the optimal composition of arabinoxylans in respect to gas retention remains unclear, but
the assumption that an increased WU-AX percentage led to decreased final bread volume is
well accepted (26). Arabinoxylans are having a high water holding capacity; it has been
proposed that in freshly prepared dough, AX hold up to one quarter of the water (42). Water
soluble AXs act similar to gluten during wheat fermentations in respect to slow down the
diffusion rate of carbon dioxide out of the dough, thus contributing to gas retention. Other
studies postulated a positive influence of WE-AX to the formation of a secondary, weaker
network enforcing the gluten network (51, 54). The effect of phenolic acids on the rheological
properties and proteins of wheat dough and bread was evaluated by Han et al. (45); they
observed that during bread making the wheat proteins were rearranged and the supplemented
phenolic acid reduced high molecular weight proteins (45). In conclusion, phenolic acids
affect bread making quality by altering the flour protein properties.

Chapter 1
16
1.4 WHEAT SOURDOUGH MICROBIOTA AND LACTOBACILLUS
SANFRANCISCENSIS
Sourdough is a mixture of wheat flour and water and is fermented with lactic acid bacteria
(LAB) and yeasts over a certain period of time at indicated temperatures. The main function
of wheat sourdough fermentations is leavening of the dough, producing of organic acids, and
generating volatile aroma compounds, therefore improving the flavor and structure of the final
bread (13). Some LAB are generating exopolysaccharides in the dough system, which have an
impact on crumb structure and shelf life of sourdough breads. LAB growth in the sourdough
may originate from selected natural contaminants in the flour or from starter cultures
containing one or more known species (29). LAB are the predominant microorganisms and in
many cases yeasts are present in significant numbers. Whereas in the majority of fermented
foods homofermentative LAB play an important role, heterofermentative LAB are dominating
in sourdough fermentations (29). The classification of different sourdough types could be seen
elsewhere (9, 13, 29); nevertheless, the main strains used in this study Lactobacillus (L.)
sanfranciscensis (main germ, type-I-sourdoughs), L. brevis (isolated from type-I-sourdoughs),
and L. pontis (typical germ in type-II-sourdoughs) could be classified into the different types
of sourdough based on their occurrence and optimal growth temperature. The strains are
obligate heterofermentative microorganisms. The heterofermentative metabolism of hexoses
was clearly pictured by Gänzle et al. (38, figure 4).
L. sanfranciscensis is the predominant key bacterium in traditionally fermented sourdoughs.
The genomic analysis of L. sanfranciscensis by Vogel et al. (116) revealed a circular
chromosomal sequence of 1.298.316 bp and two additional plasmids pLS1 and pLS2, with
sizes of 58.739 bp and 18.715 bp, which are predicted to encode 1.437, 63 and 19 ORFs,
respectively. The sequenced strain L. sanfranciscensis TMW1.1304 was isolated from a
commercial mother sponge with a tradition of continuous propagation by back-slopping
procedures (116). L. sanfranciscensis contains the smallest genome within the lactobacilli so
far, but has the highest rRNA operon density (5.39 per Mbp). Thus, it was proposed that the
high rRNA operon density allows L. sanfranciscensis to respond quickly to favorable growth
conditions in the sourdough environment, finally resulting in high growth rates (116). Based
on the genome sequence of L. sanfranciscensis TMW1.1304 it was proposed that the strain
has the potential to synthesize de novo four amino acids (alanine, aspartate, glutamate, and
glutamine). Moreover, among three other amino acids (arginine, lysine, asparagine)
originaring from L-aspartate, L-alanine can be converted into L-cysteine.

Chapter 1
17
Figure 4. Maltose and sucrose metabolism of L. sanfranciscensis, updated from Hammes et al. (1996). End products of metabolism are printed in bold, major products of the metabolism in sourdoughs are underlined. Key metabolic enzymes of L. sanfranciscensis are indicated by numbers. 1. maltose-phosphorylase; 2. hexokinase; 3. phosphoglucomutase; 4. phosphoketolase; 5. acetate kinase; 6. phosphotransacetylase; 7. lactate dehydrogenase; 8. cell-wall bond fructosyltransferase (38).
The predicted auxotrophy for the remaining 12 amino acids could be explained with the
presence of a large number of peptidases, proteases, and transport systems for amino acids
and peptides (116). Besides several amino acid transporters with unknown specificity, ABC
transporters for glutamine, methionine and cystine are predicted; the latter transporter for
cystine in L. sanfranciscensis is also introduced in chapter 4 of this thesis. The regulatory
system of L. sanfranciscensis is harbouring amongst others two genes for rpoE, a sigma factor
involved in high temperature and oxidative stress response, and one gene for rex, a redox-
sensing transcriptional repressor (116).
Sourdough fermentations are characterized by a highly stable association of yeasts and lactic
acid bacteria. The synergistic interactions between lactobacilli and yeasts are based on the
metabolism of carbohydrates and amino acid accumulation. Maltose is the preferred carbon

Chapter 1
18
source for L. sanfranciscensis (38), and is available in high amounts in wheat sourdough
fermentations due to the activity of endogenous amylases. Maltose-negative yeasts like
Saccharomyces exiguus or Candida humilis could build a stable consortium with L.
sanfranciscensis in wheat sourdoughs. Lactobacillus brevis and Lactobacillus pontis also
exhibit maltose phosphorylase activity (106). Most of the obligatory heterofermentative
lactobacilli metabolize pentoses, but not L. sanfranciscensis (44). A fructosyltransferase
activity of L. sanfranciscensis TMW1.392 was shown by Tieking et al.; nonetheless, the
majority of L. sanfranciscensis strains do not exhibit fructosyltransferase activity (111).
During the oxidation of fermentable substrates, reduced coenzymes in form of NADH or
NADPH are generated; the transfer of electrons to external electron acceptors is maintaining
the catabolic flux by regeneration of the oxidized form of the pyridine nucleotides (58). The
utilization of electron acceptors in Lactobacillus sanfranciscensis was shown by Stolz et al.
(105), fructose is used as an electron acceptor with the help of mannitol dehydrogenase
generating mannitol. The utilization of electron acceptors enables the production of acetate
from acetyl-phosphate and the synthesis of an additional ATP. Oxygen can also be used as an
external electron acceptor by L. sanfranciscensis under aerobic conditions see chapter 4 and
other studies (38, 58, 105). The growth of L. reuteri, L. fermentum, and L. pontis is inhibited
under aerobic conditions due to the lack of NADH oxidase reactions (107). Several organic
compounds, e.g. citrate, glutathione (GSSG), and long chain aldehydes can serve also as
external electron acceptors for L. sanfranciscensis under static, anaerobic conditions (38).
1.5 OXIDATIVE STRESS RESPONSE IN LACTIC ACID BACTERIA
LAB have been found to contain unique flavoproteins that are different from the respiratory
redox enzymes of cytochrome-containing bacteria like Escherichia coli. By maintenance of
the redox balance of NAD/NADH under aerobic conditions, several enzymes are involved in
the response to oxidative stress. While L. sanfranciscensis CB1 was described to produce a
single Mn-containing superoxide dismutase (SOD) that is essential for aerobic growth, it lacks
the respiratory chain and catalase enzyme (28). Other strains have not been investigated in
this respect. Furthermore, lactic acid bacteria use NADH peroxidase activity to decompose
H2O2 (25). NADH peroxidase resumes the role of heme-containing catalases by reducing
intracellular levels of H2O2 while also regenerating oxidized pyridine nucleotide (89).
Reduced coenzymes in form of NADH are accumulated during the oxidation of fermentable

Chapter 1
19
substrates, to maintain the catabolic flux the oxidized form of this pyridine nucleotide must be
regenerated. Under aerobic conditions two types of NADH oxidases, corresponding to H2O2-
forming oxidase (Nox-1) and H2O-forming oxidase (Nox-2) can contribute to this goal. In
Streptococcus mutans Nox-2 was identified to play an important role in energy metabolism,
while the role of Nox-1 was negligible in this respect (49). The FAD-dependent
oxidoreductase, NADH oxidase (Nox-2), in L. sanfranciscensis catalyzes the direct four-
electron reduction of O2 to water and serves as an electron acceptor during active aerobic
metabolism (86). The regeneration of two molecules of NAD+ by Nox provides oxidized
pyridine nucleotides for glycolysis. Furthermore, since Nox-activity directly reduces O2 to
H2O without the formation of reactive O2 intermediates, it may serve to protect L.
sanfranciscensis against oxidative stress. It is suggested that peroxide is not released from the
active site of Nox during regeneration of NAD+ under aerobic conditions (86). NADH
oxidases have been purified and characterized in L. sanfranciscensis (67, 68), in Lactobacillus
brevis (52), and several other lactic acid bacteria, e.g. Streptococcus pyogenes (41) and
Lactococcus lactis (73). Lactic acid bacteria show a greater metabolic potential when the
reduced cofactors, from which NADH is the most significant, are regenerated by exogenous
electron acceptors. In most cases, this also results in an increased fermentation yield. During
growth of L. sanfranciscensis in a medium containing maltose, glucose and other electron
acceptors like fructose an additional amount of ATP is generated by the metabolism of
fructose. Aerobic growth of L. sanfranciscensis on maltose was found to result in a higher
final cell yield and growth rate than anaerobic growth. The higher level of acetate production
is concomitant with the production of ATP through the acetate kinase reaction (104). The
shut-down of the ethanol branch of the phosphoketolase pathway in the presence of
exogenous electron acceptors seems to be very common among heterofermentative
lactobacilli.
Many lactic acid bacteria, especially lactobacilli, contain very high intracellular Mn(II) levels,
e.g. Lactobacillus plantarum (3, 57) and Lactobacillus brevis (5). The manganese content acts
as a scavenger of toxic oxygen species, or as a cofactor for several enzymes such as catalase
(60) and SOD (37). Kehres and Maguire reviewed the Mn(II)-dependent enzymatic
detoxification of oxygen radicals, and showed also the non-enzymatic influence of Mn(II) as a
‘free’ transition metal, substituting functions for iron and heme in a hitherto chemically
undefined way (57).

Chapter 1
20
Glutathione reductase (gshR) is a member of the family of flavoprotein disulfide oxido-
reductases. The enzyme catalyzes the NADPH-dependent reduction of glutathione disulfide.
In addition to the technological relevance in wheat doughs, glutathione has an important
function as redox buffer in bacterial cells. Glutathione is the major non-protein thiol
compound in living cells, it was found to be involved in the resistance to osmotic stress (99),
toxic electrophiles (35) and oxidative stress (21, 100). Glutathione also acts as an electron
donor for both scavenging of reactive oxygen, e.g. from respiration, and metabolic reactions
such as reduction of hydroperoxides and lipidperoxides (72). The glutathione reductase plays
an essential role in cell defence against oxygen stress by maintaining a high intracellular
GSH/GSSG status (66). GshR has been purified and characterized from several bacteria, e.g.
Cyanobacterium anabaena PCC7120 (55), Pseudomonas aeruginosa (80). In Escherichia
coli, glutathione-based reduction systems contribute to the protection against oxidative stress
(21); however, the glutathione reductase from E. coli seems to play a minor when compared
to thioredoxin reductases (100). Lactic acid bacteria are known for their ability to accumulate
reduced glutathione (118). A sulfhydryl uptake system was studied by Thomas (109) and the
import and metabolism of glutathione by Streptococcus mutans was reported by Sherrill and
Fahey (92). Glutathione reductases were characterized from Streptococcus thermophilus
CNRZ368 (76) and Enterococcus faecalis (74) but their contribution to the oxygen tolerance
of lactobacilli remains unknown. Lactococcus lactis exhibited higher levels of glutathione
reductase activity when growing under aerobic conditions. The increased accumulation of
GSH under aerobic conditions was interpreted as regulatory mechanism that protects the cells
against oxidative stress (63). Vido et al. (115), showed that the thioredoxin reductase-
thioredoxin system in Lactococcus lactis is important but not essential during aerobic life,
suggesting the existence of an additional redox system that contributes to oxygen tolerance.
Moreover, the respiration capacity of the fermenting bacterium Lactococcus (Lc.) lactis was
confirmed in several studies (17, 31, 77). The damaging effects of oxygen on Lc. lactis cells
were not observed when cells were grown in the presence of both oxygen and a heme source
(31). In addition, aerated, heme grown Lc. lactis cells displayed increased growth yield,
resistance to oxidative stress, and improved long-term survival when stored at low
temperatures (17, 85). Heme is an essential cofactor of cytochrome complexes in the electron
transport chains of respiring cells (39, 110). Duwat et al. (2001) provided genetic and
additional biochemical evidence for respiration in Lc. lactis, the cydA (cytochrom d oxidase)
gene is induced transcriptionally in late exponential phase of cells grown under respiration

Chapter 1
21
conditions (31). The ability to utilize an external heme source indicated that a heme uptake
mechanism must also be present in Lc. lactis; genes comprising the ygfCBA operon (ABC
transporter) of Lc. lactis are involved in heme homeostasis (31, 77). The electron transport
chains of Lactobacillus plantarum WCFS1 were evaluated under anaerobic respiration
conditions; indicating that L. plantarum is able to reduce nitrate to nitrite only when both
heme and menaquinone are supplied to the medium (15). Moreover, some LAB demonstrate
respiratory behavior when menaquinone and/or heme are supplemented to the culture broth in
a screening approach conducted by Brooijmans (18). However, very few LAB besides L.
plantarum, e.g. L. reuteri and L. fermentum contain the necessary narGHJI genes for
anaerobic nitrate respiration (15, 16).

Chapter 1
22
REFERENCES 1. Anjum, F. M., M. R. Khan, A. Din, M. Saeed, I. Pasha, and M. U. Arshad. 2007.
Wheat gluten: High molecular weight glutenin subunits - structure, genetics, and relation to dough elasticity. Journal of Food Science 72:56-63.
2. Antoine, C., S. Peyron, F. Mabille, C. Lapierre, B. Bouchet, J. Abecassis, and X. Rouau. 2003. Individual contribution of grain outer layers and their cell wall structure to the mechanical properties of wheat bran. J Agric Food Chem 51:2026-2033.
3. Archibald, F. S., and M. Duong. 1984. Manganese Acquisition by Lactobacillus plantarum. Journal of Bacteriology 158:1-8.
4. Balasubashini, M. S., R. Rukkumani, P. Viswanathan, and V. P. Menon. 2004. Ferulic acid alleviates lipid peroxidation in diabetic rats. Phytotherapy Research 18.
5. Behr, J., L. Israel, M. G. Ganzle, and R. F. Vogel. 2007. Proteomic approach for characterization of hop-inducible proteins in Lactobacillus brevis. Appl Environ Microbiol 73:3300-6.
6. Belton, P. S. 1999 On the elasticity of wheat gluten. Journal of Cereal Science 29:103-107.
7. Belton, P. S., I. J. Colquhoun, J. M. Field, A. Grant, P. R. Shewry, A. S. Tatham, and N. Wellner. 1995. FTIR and NMR studies on the hydration of a high Mr subunit of glutenin. Int J Biol Macromo 17.
8. Belton, P. S., A. M. Gil, and A. S. Tatham. 1994. 1H NMR relaxation times studies of the hydration of the barley protein. Chordein J Chem Soc Farad Trans 90:1099.
9. Böcker, G., P. Stolz, and W. P. Hammes. 1995. Neue Erkenntnisse zum Ökosystem Sauerteig und zur Physiologie der sauerteigtypischen Stämme Lactobacillus sanfrancisco und Lactobacillus pontis. Getreide Mehl Brot 49:370-374.
10. Bonnin, E., L. Saulnier, J. Vigouroux, G. Dervilly, and J. F. Thibault. 1999. Potentialities of endogenous peroxydases and feruloyl esterases in wheat for modifications of arabinoxylans, p. 81-89, Second European Symposium on enzymes in grain processing, Helsinki.
11. Bourne, L., G. Paganga, D. Baxter, P. Hughes, and C. Rice-Evans. 2000. Absorption of ferulic acid from low-alcohol beer. Free Radical Research 32:273-280.
12. Brandt M. J., G. M. G. 2005. Handbuch Sauerteig, vol. ISBN 3-89947-166-0. 13. Brandt, M. J., and M. G. Gänzle. 2005. Handbuch Sauerteig, vol. 6. B. Behrs Verlag
GmbH & Co. KG. 14. Brett, C. T., G. Wende, A. C. Smith, and K. W. Waldron. 1999. Biosynthesis of
cell-wall ferulate and diferulates. European Food Res. Techn. 214:482-488. 15. Brooijmans, R. J. W., W. M. De Vos, and J. Hugenholtz. 2009. Electron transport
chains of lactic acid bacteria - walking on crutches is part of their lifestyle. Biology reports 34:1-3.
16. Brooijmans, R. J. W., W. M. De Vos, and J. Hugenholtz. 2009. Lactobacillus plantarum WCSF1 Electron transport chains. Appl. Environ. Microbiol. 75:3580-3585.
17. Brooijmans, R. J. W., B. Poolman, G. K. Schuurman-Wolters, W. M. de Vos, and J. Hugenholtz. 2007. Generation of a membrane potential by Lactococcus lactis through aerobic electron transport. Journal of Bacteriology 189:5203-5209.
18. Brooijmans, R. J. W., B. Smit, F. Santos, J. van Riel, W. M. De Vos, and J. Hugenholtz. 2009. Heme and menaquinone induced electron transport in lactic acid bacteria. Microbial Cell Factories 8:1-11.
19. Buanafina, M. M. 2009. Feruloylation in grasses: current and future perspectives. Molecular Plant 2:861-872.

Chapter 1
23
20. Bunzel, M., J. Ralph, H. Kim, F. Lu, S. A. Ralph, J. M. Marita, R. D. Hatfield, and H. Steinhart. 2003. Sinapate dehydrodimers and sinapate-ferulate heterodimers in cereal dietary fiber. J Agric Food Chem 51:1427-1434.
21. Carmel-Harel, O., and G. Storz. 2000. Roles of the glutathione- and thioredoxin-dependent reduction systems in the Escherichia coli and Saccharomyces cerevisiae responses to oxidative stress. Annual Review of Microbiology 54:439-461.
22. Carvajal-Millan, E., V. Landillon, M. H. Morel, X. Rouau, J. L. Doublier, and V. Micard. 2005. Arabinoxylan gels: Impact of the feruloylation degree on their structure and properties. Biomacromolecules 6:309-317.
23. Chen, M., D. C. Gitz, and J. W. McClure. 1998. Soluble sinapoyl esters are converted to wall-bound esters in phenylalanine ammonia-lyase-inhibited radish seedlings. Phytochemistry 49:333-340.
24. Colonna, P., and A. Buléon. 1992. New insights on starch structure and properties. Cereal chemistry and technology Proceedings of the ninth international cereal and bread congress:25-42.
25. Condon, S. 1987. Responses of lactic acid bacteria to oxygen. FEMS Microbiology Reviews 1987:269-281.
26. Courtin, C. M., A. Roelants, and J. A. Delcour. 1999. Fractionation - reconstitution experiments provide insight into the role of endoxylanases in bread-making. J Agric Food Chem 47:1870-1877.
27. Danno, G., and R. G. Hoseney. 1982. Effects of dough mixing and rheologically active compounds on relative viscosity of wheat proteins. Cereal Chem 59:196-198.
28. De Angelis, M., and M. Gobbetti. 1999. Lactobacillus sanfranciscensis CB1: manganese, oxygen, superoxide dismutase and metabolism. Appl Microbiol Biotechnol 51:358-63.
29. de Vuyst, L., and P. Neysens. 2005. The sourdough microflora: biodiversity and metabolic interactions. Trends in Food Science & Technology 16:43-56.
30. Dervilly-Pinel, G., L. Rimsten, L. Saulnier, R. Andersson, and P. Aman. 2001. Water-extractable arabinoxylan from pearled flours of wheat, barley, rye, and triticale. Evidence for the presence of ferulic acid dimers and their involvement in gel formation. Journal of Cereal Science 34:207-214.
31. Duwat, P., S. Sourice, B. Cesselin, G. Lamberet, K. Vido, P. Gaudu, Y. Le Loir, F. Violet, P. Loubière, and A. Gruss. 2001. Respiration capacity of the fermenting bacterium Lactococcus lactis and its positive effects on growth and survival. Journal of Bacteriology 183:4509-4516.
32. Faulds, C. B., P. A. Kroon, L. Saulnier, J. F. Thibault, and G. Williamson. 1995. Release of ferulic acid from maize bran and derived olygosaccharides by Aspergillus niger esterases. Carbohydrate Research 27:187-190.
33. Faulds, C. B., and G. Williamson. 1995. Release of ferulic acid from wheat bran by a ferulic acid esterase (FAE-III) from Aspergillus niger. Appl. Microb. Biotechnol. 43:1082-1087.
34. Faulds, C. B., and G. Williamson. 1999. Review: The role of hydroxycinnamates in the plant cell wall. J Agric Food Chem 79:393-395.
35. Ferguson, G. P. 1999. Protective mechanism against toxic electrophiles in Escherichia coli. Trends in microbiology 7:242-247.
36. Fitchett, C. S., and P. J. Frazier. 1986. Action of oxidants and other improvers. Chemistry and physics of baking:179-198.
37. Fridovich, I. 1981. Superoxide radical and superoxide dismutases. D.L. Gilbert (ed.), Oxygen and Living Process, Springer-Verlag, New York:250-272.

Chapter 1
24
38. Gänzle, M. G., N. Vermeulen, and R. F. Vogel. 2007. Carbohydrate, peptide and lipid metabolism of lactic acid bacteria in sourdough. Food Microbiology 24:128-138.
39. Gennis, R. B. 1987. The cytochromes of Escherichia coli. FEMS Microbiol. 46:387-399.
40. Gianibelli, M. C., O. R. Larroque, F. MacRitchie, and C. W. Wrighley. 2001. Biochemical, genetic, and molecular characterization of wheat glutenin and its component subunits. Cereal Chem 78:635-646.
41. Gibson, C. M., T. C. Mallett, A. Claiborne, and M. G. Caparon. 2000. Contribution of NADH oxidase to aerobic metabolism of Streptococcus pyogenes. J Bacteriol 182:448-55.
42. Goesaert, H., K. Brijs, W. S. Veraverbeke, C. M. Courtin, K. Gebruers, and J. A. Delcour. 2005. Wheat flour constituents: how they impact bread quality, and how to impact their functionality. Trends in Food Science & Technology 16:12-30.
43. Grosch, W., and H. Wieser. 1999. Redox reactions in wheat dough as affected by ascorbic acid. J. Cereal Sci 29:1-16.
44. Hammes, W. P., and C. Hertel. 2003. The genera Lactobacillus and Carnobacterium. Springer, Berlin.
45. Han, H. M., and B. K. Koh. 2011. Effect of phenolic acids on the rheological properties and proteins of hard wheat flour dough and bread. J Sci Food Agri 91:2495-2499.
46. Hanft, F., and P. Koehler. 2005. Quantitation of dityrosine in wheat flour and dough by liquid chromatography-tandem mass spectrometry. J Agric Food Chem 53:2418-2423.
47. Hatfield, R. D., J. Ralph, and J. H. Grabber. 1999. Cell wall crosslinking by ferulates and diferulates in grasses. J Sci Food Agri 79:403-407.
48. Henry, R. J. 1985. A comparison of the non-starch carbohydrates in cereal grains. J Agric Food Chem 36:1243-1253.
49. Higuchi, M., Y. Yamamoto, L. B. Poole, M. Shimada, Y. Sato, N. Takahashi, and Y. Kamio. 1999. Functions of two types of NADH oxidases in energy metabolism and oxidative stress of Streptococcus mutans. J Bacteriol 181:5940-7.
50. Hoseney, R. C. 1986. Principles of cereal science and technology. Am. Assoc. Cereal Chem.
51. Hoseney, R. G. 1984. Functional properties of pentosans in baked foods. Food Technology 38:114-117.
52. Hummel, W., and B. Riebel. 2003. Isolation and biochemical characterization of a new NADH oxidase from Lactobacillus brevis. Biotechnol Lett 25:51-4.
53. Izydorczyk, M. S., and C. G. Biliaderis. 1995. Cereal arabinoxylans: advances in structure and physicochemical properties. Carbohydrate Research 28:33-48.
54. Jelaca, S. L., and I. Hlynca. 1972. Effect of wheat-flour pentosans in dough, gluten and bread. Cereal Chem 49:489-495.
55. Jiang, F., and B. Mannervik. 1999. Optimized heterologous expression of glutathione reductase from Cyanobacterium anabaena PCC 7120 and characterization of the recombinant protein. Protein expression and purification 15:92-98.
56. Kabel, M. A., F. Carvalheiro, G. Garrote, E. Avgerinos, E. Koukios, J. C. Parajo, F. M. Girio, H. A. Schols, and A. G. J. Voragen. 2002. Hydrothermally treated xylan rich by-products yield different classes of xylo-oligosaccharides. Carbohydrate Polymers 50:47-56.
57. Kehres, D. G., and M. E. Maguire. 2003. Emerging themes in manganese transport, biochemistry and pathogenesis in bacteria. FEMS Microbiol Rev 27:263-90.

Chapter 1
25
58. Knorr, R. 2000. Adaption and stress response of the carbohydrate metabolism of Lactobacillus sanfranciscensis - Biochemical and genetic characterization of key enzymes involved in acetate production. Grauer.
59. Köhler, P., H. D. Belitz, and H. Wieser. 1993. Disulphide bonds in wheat gluten: further cystine peptides from heigh molecular weight (HMW) and low molecular weight (LMW) subunits of glutenin and from gamma-gliadins. Z. Lebensm Unters Forsch 196:239-247.
60. Kono, Y., and I. Fridovich. 1983. Isolation and characterization of the pseudocatalase of Lactobacillus plantarum. J Biol Chem 258:6015-9.
61. Kuninori, T., and H. Matsumoto. 1964. Dehydro-L-ascorbic acid reducing system in flour. Cereal Chem 41:39-46.
62. Lempereur, I., A. Surget, and X. Rouau. 1998. Variability in dehydrodiferulic acid composition of durum wheat and distribution in milling fractions. Journal of Cereal Science 28:251-258.
63. Li, Y., J. Hugenholtz, T. Abee, and D. Molenaar. 2003. Glutathione protects Lactococcus lactis and oxidative stress. Applied and Environmental Microbiology 69:5739-5745.
64. Lindsay, M. P., and J. H. Skerritt. 1999. The glutenin macropolymer of wheat flour doughs: structure-function perspectives. Trends in Food Science & Technology 10:247-253.
65. Liyama, K., T. B. Lam, and B. A. Stone. 1994. Covalent Cross-Links in the Cell Wall. Plant. Physiol. 104:315-320.
66. Lopez-Barea, J., J. A. Barcena, J. A. Bocanegra, J. Florindo, C. Garcia-Alfonso, A. Lopez-Ruiz, E. Martinez-Galisteo, and J. Peinado. 1990. Handbook of glutathione: Metabolism and physiological functions. CRC Press, Boca Raton FL:111.
67. Lountos, G. T., R. Jiang, W. B. Wellborn, T. L. Thaler, A. S. Bommarius, and A. M. Orville. 2006. The crystal structure of NAD(P)H oxidase from Lactobacillus sanfranciscensis: Insights into the conversion of O2 into two water molecules by the flavoenzyme. Biochem. 45:9648-9659.
68. Lountos, G. T., B. R. Riebel, W. B. Wellborn, A. S. Bommarius, and A. M. Orville. 2004. Crystallization and preliminary analysis of a water-forming NADH oxidase from Lactobacillus sanfranciscensis. Acta Crystallogr D Biol Crystallogr 60:2044-7.
69. Mandalari, G., C. B. Faulds, A. I. Sancho, A. Saija, G. Bisignano, R. LoCurto, and K. W. Waldron. 2005. Fractionation and characterization of arabinoxylans from brewers spent grain and wheat bran. Journal of Cereal Science 42:205-212.
70. Mares, D. J., and B. A. Stone. 1973. Studies on wheat endosperm. I. Chemical composition and ultrastructure of the cell walls. Australian Journal of Biological Sciences 26:793-812.
71. Mares, D. J., and B. A. Stone. 1973. Studies on wheat endosperm. II. Properties of the wall components and studies on their organization in the wall. Australian Journal of Biological Sciences 26:813-830.
72. Meyer, A. J., and R. Hell. 2005. Glutathione homeostasis and redox-regulation by sulfhydryl groups. Photosynthesis research 86:435-457.
73. Neves, A. R., A. Ramos, H. Costa, S. van, II, J. Hugenholtz, M. Kleerebezem, W. de Vos, and H. Santos. 2002. Effect of different NADH oxidase levels on glucose metabolism by Lactococcus lactis: kinetics of intracellular metabolite pools determined by in vivo nuclear magnetic resonance. Appl Environ Microbiol 68:6332-42.

Chapter 1
26
74. Patel, M. P., J. Marcinkeviciene, and J. S. Blanchard. 1998. Enterococcus faecalis glutathione reductase: purification, characterization and expression under normal and hyperbaric O2 conditions. FEMS Microbiol Lett 166:155-163.
75. Payne, P. I. 1987. Genetics of wheat storage protein and the effect of allelic variation on breadmaking quality. Ann Rev Plant Physiol 38.
76. Pebay, M., A. C. Holl, J. M. Simonet, and B. Decaris. 1995. Characterization of the gor gene of the lactic acid bacterium Streptococcus thermophilus CNRZ368. Research in Microbiology 146:371-383.
77. Pedersen, M. B., C. Garrigues, K. Tuphile, C. Brun, K. Vido, M. Bennedsen, H. Mollgaard, P. Gaudu, and A. Gruss. 2008. Impact of aeration and heme-activated respiration on Lactococcus lactis gene expression: Identification of a heme-responsive operon. Journal of Bacteriology 190:4903-4911.
78. Perlin, A. S. 1951. Isolation and composition of the soluble pentosans of wheat flour. Cereal Chem 28:370-381.
79. Perlin, A. S. 1951. Structure of the soluble pentosans of wheat flours. Cereal Chem 28:282-293.
80. Perry, A. C., N. Ni Bhriain, N. L. Brown, and D. A. Rouch. 1991. Molecular characterization of the gor gene encoding glutathione reductase from Pseudomonas aeruginosa: determinants of substrate specificity among pyridine nucleotide-disulphide oxidoreductases. Molecular Nicrobiology 5:163-171.
81. Petit-Benvegnen, M. D., L. Saulnier, and X. Rouau. 1998. Solubilization of arabinoxylans from isolated water-unextractable pentosans and wheat flour doughs by cell-wall-degrading enzymes. Cereal Chem 75:551-556.
82. Piber, M., and P. Koehler. 2005. Identification of dehydro-ferulic acid-Tyrosine in rye and wheat: evidence for a covalent cross-link between arabinoxylans and proteins. J Agric Food Chem 53:5276-5284.
83. Ralph, J., S. Quideau, J. H. Grabber, and R. D. Hatfield. 1994. Identification and synthesis of new ferulic acid dehydrodimers present in grass cell-walls. J. Chem. Society-Perkin Transaction 23:3485-3498.
84. Reinbold, J., M. Rychlik, S. Asam, H. Wieser, and P. Koehler. 2008. Concentrations of total glutathione and cysteine in wheat flour as affected by sulfur deficiency and correlation to quality parameters. J Agric Food Chem 56:6844-6850.
85. Rezaiki, L., B. Cesselin, Y. Yamamoto, K. Vido, E. van West, P. Gaudu, and A. Gruss. 2004. Respiration metabolism reduces oxidative and acid stress to improve long-term survival of Lactococcus lactis. Mol. Microbiol. 53:1331-1342.
86. Riebel, B., P. R. Gibbs, W. B. Wellborn, A. S. Bommarius. 2003. Cofactor Regeneration of both NAD+ from NADH and NADP+ from NADPH:NADH Oxidase from Lactobacillus sanfranciscensis. Advanced Synthesis & Catalysis 345:707-712.
87. Rodriguez-Mateos, A., S. J. Millar, D. G. Bhandari, and R. A. Frazier. 2006. Formation of dityrosine cross-links during breadmaking. J Agric Food Chem 54:2761-2766.
88. Rosazza, J. P. N., Z. Huang, L. Dostal, T. Volm, and B. Rousseau. 1995. Review: Biocatalytic transformations of ferulic acid: an abundant aromatic natural product. Journal of Industrial Microbiology 15:457-471.
89. Ross, P., A. Claiborne 1997. Evidence for regulation of the NADH peroxidase gene (npr) from Enterococcus faecalis by OxyR. FEMS Microbiology Letters 151:177-183.
90. Saulnier, L., P. E. Sado, G. Branlard, G. Charmet, and F. Guillon. 2007. Wheat arabinoxylans: Exploiting variation in amount and composition to develop enhanced varieties. Journal of Cereal Science 46:261-281.

Chapter 1
27
91. Seilmeier, W., H.-D. Belitz, and H. Wieser. 1991. Separation and quantitative determination of high-molecular-weight subunits of glutenin from different wheat varieties and genetic variants of the variety Sicco. Z. Lebensm Unters Forsch 192:124-129.
92. Sherryll, C., and R. C. Fahey. 1998. Import and metabolism of glutathione by Streptococcus mutans. Journal of Bacteriology 180:1454-1459.
93. Shewry, P. R. 2009. Wheat. Journal of Experimental Botany 60:1537-1553. 94. Shewry, P. R., and N. G. Halford. 2002. Cereal seed storage proteins: structures,
properties and role in grain utilization. Journal of Experimental Botany 53:947-958. 95. Shewry, P. R., N. G. Halford, P. S. Belton, and A. S. Tatham. 2002. The structure
and properties of gluten: an elastic protein from wheat grain. Phil. Trans. R. Soc. Lond. B 357:133-142.
96. Shewry, P. R., N. G. Halford, and A. S. Tatham. 1989. The high molecular weight subunits of wheat, barley and rye: genetics, molecular biology, chemistry and role in wheat gluten structure and functionality. Oxford University Press:163-219.
97. Shewry, P. R., and A. S. Tatham. 1997. Disulphide bonds in wheat gluten proteins. J. Cereal Sci 25:207-227.
98. Shewry, P. R., A. S. Tatham, J. Forde, M. Kreis, and B. J. Miflin. 1986. The classification and nomenclature of wheat gluten proteins: a reassessment. J. Cereal Sci 4:97-106.
99. Smirnova, G. V., T. A. Krasnykh, and O. N. Oktyabrsky. 2001. Role of glutathione in the response of Escherichia coli to osmotic stress. Biochemistry (Moscow) 66:973-978.
100. Smirnova, G. V., N. G. Muzyka, M. N. Glukhovchenko, T. A. Krasnykh, and O. N. Oktyabrsky. 1999. Oxidative stress resistance of Escherichia coli strains deficient in glutathione biosynthesis. Biochemistry (Moscow) 64:1111-1116.
101. Smith, M. M., and R. D. Hartley. 1983. Occurrence and nature of ferulic acid substitution of cell-wall polysaccharides in graminaceous plants. Carbohydrate Research 118:65-80.
102. Sramkova, Z., E. Gregova, and E. Sturdik. 2009. Chemical composition and nutritional quality of wheat grain. Acta Chimica Slovaca 2:115-138.
103. Srinivasan, M., A. R. Sudheer, and V. P. Menon. 2007. Ferulic Acid: Therapeutic Potential Through Its Antioxidant Property. J. Clin. Biochem. Nutr. 40:92-100.
104. Stolz, P., G. Böcker, W. P. Hammes, and R. F. Vogel. 1995. Utilization of electron acceptors by lactobacilli isolated from sourdough. Z Lebensm Unters Forsch 201:91-96.
105. Stolz, P., G. Böcker, W. P. Hammes, and R. F. Vogel. 1995. Utilization of electron acceptors by lactobacilli isolated from sourdough I. Lactobacillus sanfranciscensis. Z. Lebensm Unters Forsch 201:91-96.
106. Stolz, P., W. P. Hammes, and R. F. Vogel. 1996. Maltose-phosphorylase and hexokinase activity in lactobacilli from traditionally prepared sourdoughs. Adv. Food Sci 18:1-6.
107. Stolz, P., R. F. Vogel, and W. P. Hammes. 1995. Utilization of electron acceptors by lactobacilli isolated from sourdough II. Lactobacillus pontis, L. reuteri, L. amylovorus, and L. fermentum. Z. Lebensm Unters Forsch 201:402-410.
108. Tatham, A. S., and P. R. Shewry. 1995. The S-poor Prolamins of wheat, barley and rye. J. Cereal Sci 22:1-16.
109. Thomas, E. L. 1984. Disulfide reduction and sulfhydryl uptake by Streptococcus mutans. Journal of Bacteriology 157:240-246.

Chapter 1
28
110. Thony-Meyer, L. 1997. Biogenesis of respiratory cytochromes in bacteria. Microbiol. Mol. Biol. Rev. 61:337-376.
111. Tieking, M., M. Korakli, M. Ehrmann, M. G. Gänzle, and R. F. Vogel. 2003. In situ production of exopolysaccharides during sourdough fermentation by cereal and intestinal isolates of lactic acid bacteria. Appl. Environ. Microbiol. 69:945-952.
112. Tkachuk, R., and I. Hlynka. 1968. Some properties of dough and gluten in D2O. Cereal Chem 45:80-87.
113. Vansteenkiste, E., C. Babot, X. Rouau, and V. Micard. 2004. Oxidative gelation of feruloylated arabinoxylan as affected by protein. Influence on protein enzymatic hydrolysis. Food Hydrocolloids 18:557-564.
114. Veraverbeke, W. S., and J. A. Delcour. 2002. Wheat protein composition and properties of wheat glutenin in relation to breadmaking functionality. Critical Reviews in Food Science and Nutrition 42:179-208.
115. Vido, K., H. Diemer, A. Van Dorsselaer, E. Leize, V. Juillard, A. Gruss, and P. Gaudu. 2005. Roles of thioredoxin reductase during the aerobic life of Lactococcus lactis. J Bacteriol 187:601-10.
116. Vogel, R. F., M. Pavlovic, M. Ehrmann, A. Wiezer, H. Liesegang, S. Offschanka, S. Voget, A. Angelov, G. Böcker, and W. Liebl. 2011. Genomic analysis reveals Lactobacillus sanfranciscensis as stable element in traditional sourdoughs. Microbial Cell Factories 10:P. S6 1-11.
117. Wellner, N., P. S. Belton, and A. S. Tatham. 1996. Fourier transform IR spectroscopic study of hydration induced structure changes in the solid state of omega gliadins. J Biochem 319:741-747.
118. Wiederholt, K. M., and J. L. Steele. 1994. Glutathione accumulation in Lactococci. Dairy Science 77:1183-1188.
119. Wieser, H. 2007. Chemistry of gluten proteins. Food Microbiology 24:115-119. 120. Wieser, H. 2003. The use of redox agents: Bread making - Improving quality.
Woodhead Publishing Ltd.:424-446. 121. Wieser, H., W. Bushuk, and F. MacRitchie. 2006. The polymeric glutenins. In:
Gliadin and Glutenin - the unique balance of wheat quality. St. Paul American Ass. of Cereal Chemistry:213-240.

Chapter 2
29
2 2. EVALUATION OF INFLUENCING FACTORS ON FINAL BREAD
VOLUME OF SOURDOUGH PREPARED BREADS
The quality of baked goods from wheat attained with a straight dough process is determined
predominantly by the quantity and quality of the gluten proteins of the flour. The importance
of gluten proteins for the baking quality of wheat flours is explained by their ability to form
high molecular weight aggregates that are stabilized by covalent bonds and non-covalent
interactions between monomers (see also chapter 1). The use of sourdough in wheat baking
improves the sensorial and nutritional quality of the products. Especially proteolytic events
during fermentation are highly relevant for the aroma formation in wheat breads; however, the
amount of the glutenin macropolymer is strongly reduced during sourdough fermentations
(40). Because of the limited knowledge on the biochemical nature of gluten modifications
during sourdough fermentations, it is currently not possible to optimize the gluten quality in
wheat doughs with sourdough addition through a targeted selection of fermentation organisms
and baking improvers. In addition to proteolytic events, the gluten quality is strongly affected
by redox reactions (37). In contrast to proteolytic degradation, these reactions are reversible,
and may be affected by appropriate baking improvers; therefore, appear advantageous as a
tool to control gluten quality. Because sourdough fermentations are increasingly used in
wheat baking, bakeries and suppliers require starter cultures and baking improvers that enable
the optimization of gluten quality in wheat sourdoughs. Special attention is guided on the
texture and volume of wheat bread produced with sourdough fermentation.
It was recently shown that Lactobacillus sanfranciscensis increases the levels of low
molecular weight thiol components as well as thiol levels in gluten proteins during sourdough
fermentation (37). The reduction of disulfide bonds by L. sanfranciscensis may determine
gluten quality in addition to the pH-dependent activity of cereal proteases. The effect of L.
sanfranciscensis on disulfide exchange reactions in wheat doughs was attributed to
glutathione reductase activity of the microorganism (37). Glutathione reductase (GshR) is a
member of the family of flavoprotein disulfide oxidoreductases. The enzyme catalyzes the
NADH-dependent reduction of glutathione disulfide. The expression of the enzyme during

Chapter 2
30
wheat sourdough fermentations with L. sanfranciscensis was shown, indicating that the
glutathione reductase of L. sanfranciscensis is active in sourdough fermentations and thus
may contribute to increased SH-levels in sourdough. The reduction of glutathione was
evaluated in buffer-based fermentations with cells of L. sanfranciscensis, demonstrating the
generation of GSH. A direct effect of L. sanfranciscensis was proposed unlikely on disulfide
bonds in gluten proteins due to the inaccessibility of intracellular or cell-wall bond enzymes
of the strain (37).
The aim of this part is to characterize modifications of gluten proteins in sourdough
fermentations and their impact on bread quality. Major enzymatic reactions of flour and the
fermentation flora are identified, which have an impact on the gluten network. Main focus is
set on redox reactions catalyzed by glutathione dehydrogenases. A glutathione reductase
knock-out mutant was constructed from Lactobacillus sanfranciscensis TMW1.53, and the
impact during wheat sourdough fermentations on thiol levels was determined using the wild
type strain and its cognate mutant. Moreover, the impact of the glutathione reductase is shown
on gluten proteins (gliadins and glutenins, respectively) during wheat sourdough fermenta-
tions. The influence of sourdough supplementation on the baking performance of wheat flours
is presented in respect to final bread volume. Knowledge about degradation and modification
events of gluten proteins during wheat sourdough fermentations could lead to the
development of new bakery improvers, which enhance bread quality based on rheological-
technical parameters. The characterization of the reference doughs was performed using
standard baking trials (Landesanstalt für Landwirtschaft LfL, Freising). The baked breads
were classified according to their volume. Different dosages of sourdough (2%, 5%, 10%, and
20%) were added to directly produced bread dough. The breads and sourdoughs were made
with the same flour. On the basis of experiments with different reference strains, all
combinations were evaluated concerning strain selection and supplemented quantity of
sourdough, which generated the maximum bread volume. In this study the application of
ascorbic acid was not realized. Thus, the extensive influence of the substance on the redox
system of gluten was eliminated, and possible differences caused from the used fermentation
flora on bread volume could be seen as opposed to trials with flours supplemented with
ascorbic acid.

Chapter 2
31
2.1 MATERIALS AND METHODS
2.1.1 Used strains, medium, and cultivation conditions
Following main strains were used in this study: Lactobacillus sanfranciscensis TMW 1.53
(type-strain), Lactobacillus plantarum TMW 1.468, Lactobacillus fermentum TMW 1.890,
Lactobacillus sakei TMW 1.22, Lactobacillus reuteri BR11, Lactobacillus pontis TMW1.84,
and Enterococcus faecalis TMW 2.22. The strains were cultivated under anaerobic conditions
at 30°C using modified MRS-medium (see chapter 5.1.7). The pH-value was adjusted to 6.2
before the sterilization step; sugars were autoclaved separately. For cloning approaches E. coli
DH5α was used, and incubated aerobically in LB broth at 37°C. Genomic DNA’s of different
lactobacilli were used in the PCR screening approaches for glutathione reductase and
cystathionine-γ-lyase genes in lactobacilli (see table 7).
2.1.2 Wheat and flour
For evaluation of the different degradation processes during wheat sourdough fermentations
A, B and E-class wheat was used in this study. The species were selected after consultation
with Bayerische Landesanstalt für Landwirtschaft (LfL), special attention was laid on
frequently grown wheat species. Untreated A-class wheat grains cultivar “Tommy” was
provided by Nordsaat Saatzucht GmbH (Boehnshausen, Germany) and milled by LfL. The
grains were milled to flour type 550, and stored under cool and dry conditions until usage.
The protein and water content of the flour was 13.4% and 14.1%, respectively. The selected
species of B-class wheat cultivar “Dekan” and E-class wheat cultivar “Bussard” were
provided by Lochow-Petkus GmbH (Bergen, Germany). All other wheat sourdough
fermentations and bread doughs were prepared using commercially available flour without
supplemented ascorbic acid (e.g. Meyermühle, Landshut). The determination of thiol levels in
wheat sourdough fermentations with lactobacilli (see chapter 2.2.8 and 2.2.9) was performed
with enriched wheat flour (ash content of 0.4-0.5 g/100 g) obtained at a local supermarket in
Edmonton (Canada).
The federal office of plant varieties (Germany) classifies wheat species in four so-called
baking quality groups. The main feature of classification is the final bread volume in baking
trials with the Rapid-Mix-Test:
E-class: elite wheat; with excellent characteristics; mainly mixed with weaker wheat.
A-class: quality wheat; with high protein content; could compensate deficits of other species.

Chapter 2
32
B-class: bread wheat; all species that are appropriate for production of pastries.
C-class: other wheat; used as foodstuff for both human and animal consumption.
2.1.3 Wheat sourdough fermentations
Cell cultures grown overnight were harvested, rinsed two-times with tap water and finally
suspended in 25 ml tap water. Two doughs were made with the same starter culture; the
culture suspension was mixed with 25 g of flour resulting in a sourdough with TA (dough
yield) of 200. Chemically acidified doughs were prepared using a 1:4 acetic acid : lactic acid
mixture, in order to mimic the acidification by lactobacilli, 3.75 µL/g dough were added after
2 hours of fermentation to adjust the pH to 4.5, and 6.25 µL/g dough were added after 7 hours
to adjust the pH to 3.6. Samples were drawn after 0, 5, and 24 (or 20) hours from the
sourdough fermentations at 30°C. Glutathione (oxidized/reduced) was added with a
concentration of 10 mM to dough. Total aerobic count was evaluated immediately; the other
samples were stored at -20°C until usage.
2.1.4 Determination of cell counts and dough pH
In all doughs, the dough pH and the cell counts were determined as described by Thiele et al.
(33). In chemically acidified doughs, cell counts remained generally <104 cfu/g. The absence
of contaminants in sourdoughs was verified by observation of uniform colony morphology.
2.1.5 Dough characterisation and determination of bread volume using standard baking
trial (Rapid-Mix-Test)
The identity of the fermentation flora of the used starter culture was evaluated using total
aerobic count technique. The concentrations of organic acids, ethanol, and free amino
nitrogen (FAN) were determined as performed by Thiele et al. (6, 33). For quantitative
determination of free thiol-groups according to Antes and Wieser (2), the sourdoughs were
extracted with a SDS-solution (1:10). 75 µl of the dough extract was mixed with 150 µl
nitrogen-saturated reagent A (n-propanol (50%) in sodium phosphate buffer (50 mM, pH 8.0))
and 7.5 µl reagent B (39.6 mg Ellman’s reagent (5,5’-dithiobis-(2-nitro benzoic acid))) in 10
ml sodium phosphate buffer (0.5 M, pH 7.0). The extracts were measured against a blank
(sample approach without reagent) using a spectrophotometer at 412 nm. Different
concentrations of glutathione served for set up of a calibration curve.
The influence of a sourdough dosage with selected starter cultures on the baking performance
was evaluated in comparison to chemically acidified reference doughs using standard baking

Chapter 2
33
trials related to Rapid-Mix-Test. The breads were characterized in reference to their volume.
The Rapid-Mix-Test was developed at the Landesanstalt für Landwirtschaft (Freising,
Germany) to evaluate the baking performance of flours; all parameters beside the flour were
kept preferably constant. The reproducibility was high due to the fact that the baking process
was performed by experienced bakers. As mentioned before, the addition of ascorbic acid was
omitted.
Composition of the doughs: 1000 g flour, 1% peanut fat, 5% yeast, 1% sugar, 1.5% salt, 0.6 g
malt, and 10% (or otherwise stated) sourdough were mixed with 570 ml water during one
minute, resulted in homogenous dough. Subsequently, the dough rest was performed for 20
minutes at 32°C with a relative humidity of 80%. The dough pieces were formed and baked
for 20 minutes after an additional dough rest of 30 minutes at 32°C and relative humidity of
80%. The evaluation of the breads volume using granulate measurement method was
performed after a cool down phase of the baked breads.
Procedure: Rapid-Mix-Test1
20
2 10
325
201 min kneading20 min dough rest10 min round work, rest3 min compact, parting, round work25 min form, mellowness2 min stiffening20 min baking
Figure 5. Procedure Rapid-Mix-Test developed at the LfL (Freising).
2.1.6 Determination of the final bread volume with a granulation method
The final volume of the baked breads was determined with a displacement method. Firstly, a
container was filled with flaxseeds to evaluate the volume of the container. Following, the
removal of the flaxseeds, and bread was placed into the container. Subsequently, the container
was filled with flaxseeds again; the difference of the flaxseeds amount filled before and after
the addition of the bread corresponds to the volume of the bread. The measurements were

Chapter 2
34
performed as duplicates to exclude inaccurate volume determinations due to the existence of
air beneath the breads.
2.1.7 Determination of glutathione reductase activity
GshR activity in cell-free extracts was measured at 25ºC by monitoring the oxidation of
NADPH in the reaction mixture (1 ml) at 340 nm. The reaction mixture contained 640 µl
sodium phosphate buffer (143 mM NaH2PO4, 143 mM Na2HPO4, mixture 1:1 + 5 mM
EDTA), 120 µl GSSG (10 mM), 100 µl NADPH (1 mM) and 100 µl extracts. The reduced
GSH-content was measured with DTNB by adding 20 µl of reagent B as described under
2.1.5. The glutathione reductase activity was calculated with reference to controls that were
incubated without addition of crude cellular extract.
2.1.8 Inactivation of the glutathione reductase from Lactobacillus sanfranciscensis
TMW1.53
For insertional inactivation of the glutathione reductase gene, a 765-bp fragment of the
glutathione reductase gene was obtained with PCR using primers gshknockV and gshknockR
(chapter 4.1, table 21), carrying BamHI restriction sites. Digestion and ligation into the
BamHI restriction site of plasmid pME-1 resulted in the non-replicating integration vector
pME-1∆gshR, which was cloned in E. coli DH5α and isolated with the Wizard Plus SV
Minipreps DNA. For preparation of electro competent cells of L. sanfranciscensis, the strain
was grown on mMRS medium supplemented with 1 % (w/v) glycine to an optical density
(590 nm) of 0.7. The cells were harvested by centrifugation at 4°C (4000 x g, 15 minutes) and
washed four times with 50 mL of 10 mM MgCl2 solution, once with glycerol (10% v/v) and
once with glycerol-sucrose solution (10% v/v, 0.5 M). Cells were resuspended in glycerol-
sucrose solution and stored at –80°C in 100 µL aliquots. All washing and storage solutions
were cooled on ice.
After electroporation, cells were incubated in mMRS broth at 30°C for 3 hours prior to plating
on mMRS with 10 ppm erythromycin. To verify the insertion of plasmid pME-1∆gshR into
the glutathione reductase gene in cells from erythromycin-resistant colonies, PCR was carried
out with primers targeting the regions upstream and downstream of the glutathione reductase
gene (GTDHV and GTDHR, respectively) and the plasmid borne regions from pME-1 (eryV
and T7, chapter 4.1, table 21). PCR products obtained with primers T7/GTDHV and
GTDHR/eryV were sequenced. A scheme of the integration approach is given in chapter
4.2.3, figure 39 of this thesis.

Chapter 2
35
2.1.9 Activity-staining of glutathione-reductase using SDS-page gel
Activity staining of GshR was performed after separation of crude cellular extracts on 12%
SDS-polyacrylamide gels (16). The gel was immersed and shaken twice for 10 min in 25%
v/v isopropanol in 10 mM Tris-HCl buffer (pH 7.9) to remove the SDS, and then finally
equilibrated for renaturation in 50 mM Tris-HCl buffer (pH 7.9) for 15 minutes. The gel was
soaked in the substrate solution (25 ml 50mM Tris-HCl buffer, pH 7.9, containing 4.0 mM
GSSG, 1.5 mM β-NADPH, and 2 mM DTNB) with gentle shaking for 20 min. After a brief
rinse with 50 mM Tris-HCl buffer (pH 7.9), the GshR activity was negatively stained in
darkness by 50 ml 1.2 mM MTT (3-(4,5-dimethylthiazol-2-yl)-2,5-diphenyltetrazolium
bromide) and 1.6 mM PMS (phenazine methosulfate) for 10 minutes at ambient temperature.
A clear zone against the blue background indicated GshR activity.
2.1.10 Protein analysis using RP-HPLC
The analyses were performed at the Hans-Dieter-Belitz-Institute, Freising, with the help of
Dr. Herbert Wieser (see preface).
The crude protein content was determined by the Dumas method using an FP-328 combustion
instrument. For the extraction of Osborne fractions, flour and lyophilized doughs (100 mg
each) were extracted stepwise with 0.4 mol/L NaCl supplemented with 0.067 mol/L
HKNaPO4, pH 7.6 (2 x 1.0 mL) at 20°C (albumins/globulins), with 60% (v/v) ethanol (3 x 0.5
mL) at 20°C (gliadins) and with 50% (v/v) 1-propanol containing 2 mol/L urea,
dithioerythritol (1%, w/v) and Tris-HCl (0.05 mol/L, pH 7.5) under nitrogen at 60°C (glutenin
subunits). After centrifugation, the corresponding supernatants were combined and diluted to
2.0 mL with the respective extraction solvent. For the determination of SDS-soluble and SDS-
insoluble proteins, flour and lyophilized doughs (100 mg) were extracted stepwise with 1%
(w/v) SDS supplemented with 0.05 mol/L sodium phosphate pH 6.9 (2 x 1.0 mL) at 20°C.
After centrifugation, supernatants were combined and lyophilized. Both dried extract and
residue were dissolved in 50% (v/v) 2-propanol + 1% (w/v) + Tris-HCl (0.08 mol/L, pH 8.0)
under nitrogen and magnetically stirred at 60°C for 20 minutes. All fractions were filtered
through a 0.45 µm membrane. RP-HPLC was performed by using an instrument with a
solvent module 126 and “System Gold” software. Aliquots of fractions were injected,
separated and quantified on a Nucleosil 300-5-C8 column at 50°C by using a solvent gradient
of increasing acetonitrile concentration in the presence of 1% (v/v) trifluoroacetic acid. The
flow rate was 1.0 mL/min and the detection wavelength was 210 nm (40).

Chapter 2
36
2.2 RESULTS
2.2.1 Biochemical characterization of the reference doughs
The determination of the requested metabolic activity of the fermentation starter cultures in
the doughs was performed in respect to total plate count, pH-value, and the concentration of
organic acids. Dough sample was analyzed from three different time-points: 0 hours (non-
acidified dough); 5 hours (correspondent to a “Vollsauer” with exponentially grown lactic
acid bacteria); and 24 hours (correspondent to a “Grundsauer” with a pH-value of 3.5). The
chemically acidified dough was leavened with an addition of lactate / acetate (ratio 4:1). The
plate count of the acidified dough showed no contamination growth.
Table 4. Microbiological characterization of sourdough prepared with „Tommi“ wheat flour (type 550, A wheat)
Starter culture Time (Hours)
Plate count (cfua / g dough) pH Lactateb Acetateb Fermentation
quotientc
chem. acidified e 0 < 104 6.35 ± 0.01 n.d.d n.d. -- 5 < 104 3.48 ± 0.03 41.0 ± 0.1 20.1 ± 2.1 2.0 24 < 104 2.79 ± 0.04 179.3 ± 9.0 60.6 ± 4.9 3.0 L. sakei 0 (1.0 ± 0.1) x 107 6.21 ± 0.0 n.d. n.d. -- 5 (1.25 ± 0.08 x 10⁸ 4.44 ± 0.02 18.8 n.d. -- 24 (3.27 ± 0.40) x 109 3.61 ± 0.04 52.6 ± 2.3 n.d. -- L. sanfranciscensis 0 0.5 x 10⁵ 6.27 ± 0.01 n.d. n.d. 5 (4.3 ± 1.8) x 107 5.54 ± 0.04 3.1 ± 0.2 1.4 ± 0.0 2.1 24 (3.2 ± 0.2) x 108 3.62 ± 0.01 65.2 ± 0.1 8.2 ± 0.0 8.0 L. plantarum 0 (5.7 ± 1.1) x 106 6.22 ± 0.01 n.d. n.d. -- 5 (11.1 ± 9.3) x 108 4.22 ± 0.21 20.4 ± 0.4 n.d. (51.0) 24 (1.0 ± 0.4) x 109 3.34 ± 0.04 59.2 ± 7.0 0.1 ± 0.1 (592.0) acfu: colony forming unit, bconcentrations in mmol / kg dough; cFermentation quotient: lactate / acetate ratio, dn.d.: below detection limit, ereduced amount of acids for consecutively doughs, see text.
In all three fermented doughs total plate counts of > 108 cfu/g dough were detected after 24
hours of fermentation. Final pH-values of < 4.0 after 24 hours of fermentation were
determined, corresponding to a “Vollsauer”. Lactobacillus sanfranciscensis and Lactobacillus
plantarum accumulated almost equal amounts of lactate after 24 hours of fermentation, 59.2
and 65.2 mmol/ kg dough, respectively. L. plantarum and L. sakei formed marginal amounts
of acetate; these organisms utilize the Embden-Meyerhoff-Shunt almost exclusively for
energy metabolism during wheat sourdough fermentations. L. sanfranciscensis accumulated
higher amounts of acetate as expected, resulted in a lower fermentation quotient. The
fermentation quotient describes the lactate/acetate ratio inside the fermentation system.
Acetate plays a major role in determining bread aroma; the fermentation quotient is often used
to describe the dough quality. Usually, the fermentation quotient lies within the range of 2.0–

Chapter 2
37
3.5 in sourdoughs fermented with obligate heterofermentative lactobacilli. All three starter
cultures, L. plantarum, L. sakei, and L. sanfranciscensis accumulated lesser amounts of
organic acids during the fermentation period compared to the chemically acidified dough. In
further approaches the supplemented amount of acids to the dough was therefore reduced. The
sourdough fermentations resulted in a high reproducibility; minor standard deviations
occurred between mean averages of two separately performed sourdough fermentations.
For evaluation of different degradation processes during wheat sourdough fermentations, also
B-wheat and E-wheat besides A-wheat were applied in this study. The following tables
summarise the data set for a “Bussard”-wheat flour and a “Dekan”-wheat flour.
Table 5. Microbiological characterization of sourdoughs prepared with „Bussard“-wheat flour (type 550, E wheat)
Starter culture Time (h)
Plate count (cfua / g dough) pH Lactateb Acetateb Fermentation
quotientc Amino-Nb
chem. acidified 0 < 104 6.2 ± 0.14 n.d.d n.d. -- n.e.e
5 < 104 3.75 ± 0.09 53.0 ± 1.5 12.8 ± 3.2 4.1 13.9 ± 2.7 24 < 104 3.15 ± 0.08 150.3 ± 13.8 31.1 ± 2.4 4.8 18.2 ± 3.7 L. sanfranciscensis 0 n.e. 6.06 ± 0.04 n.d. n.d. -- 5.2 ± 1.8 5 (1.5 ± 0.14) x 107 4.75 ± 0.08 18.0 ± 1.3 3.6 ± 0.5 5.0 12.6 ± 3.4 24 (2.4 ± 0.8) x 108 3.5 ± 0.0 76.0 ± 0.9 13.8 ± 0.7 5.5 18.3 ± 6.0 L. plantarum 0 (5.5± 0.9) x 108 6.09 ± 0.01 n.d. n.d. -- 3.3 ± 1.4 5 n.e. 3.75 ± 0.08 50.0 ± 3.0 n.d. -- 9.0 ± 3.4 24 (5.7± 2.9) x 108 3.3 ± 0.0 102.8 ± 11.3 n.d. -- 9.3 ± 1.2 acfu: colony forming unit, bconcentrations in mmol / kg dough; cFermentation quotient: Lactate / Acetate; dn.d.: below detection limit; enot evaluated
Table 6. Microbiological characterization of sourdough prepared with „Dekan”-wheat flour (type 550, B wheat)
Starter culture Time (h)
Plate count (cfua / g dough) pH Lactateb Acetateb Fermentation
quotientc Amino-Nb
chem. acidified 0 < 104 6.25 ± 0.07 n.d. n.d. -- 6.5 ± 1.1 5 < 104 3.7 ± 0.0 43.2 ± 12.0 11.7 ± 1.2 3.7 7.2 ± 1.6 24 < 104 3.25 ± 0.07 111.3 ± 0.5 28.5 ± 4.1 3.9 12.2 ± 3.3 L. sanfranciscensis 0 n.e.e 6.09 ± 0.03 n.d. n.d. -- 6.3 ± 0.4 5 (5.9 ± 0.4) x 107 3.65 ± 0.07 20.7 ± 0.9 4.8 ± 0.2 4.3 11.2 ± 2.2 24 (6.0 ± 0.8) x 107 3.5 ± 0.0 79.1 ± 1.8 16.9 ± 0.5 4.7 16.9 ± 2.2 L. plantarum 0 (4.5 ± 1.7) x 108 6.06 ± 0.05 n.d. n.d. -- 5.4 ± 1.4 5 (1.0 ± 0.3) x 109 3.7 ± 0.0 56.5 ± 0.7 n.d. -- 10.4 ± 3.9 24 1.3 x 10⁹ 3.4 ± 0.0 100.2 ± 5.5 n.d. -- 13.1 ± 0.1 acfu: colony forming unit, bconcentrations in mmol / kg dough; cFermentation quotient: Lactate / Acetate, dn.d.: below detection limit; e not evaluated.
The total plate counts in fermentations with L. sanfranciscensis and Dekan-wheat flour
showed lower total plate counts of approximately 107 cfu/g dough after 24 hours of
fermentation, while the accumulation of organic acids during fermentation and the pH drop
showed amounts as expected. Thus, it could be assumed that the effectively counts were
higher, and a mistake was conducted in respect to serial dilutions.

Chapter 2
38
Fermentationszeit (Stunden)
0 5 10 15 20 25
Am
inos
ticks
toff
(mm
ol /
kg)
0
10
20
30
40
50
60
L.plantarum TMW1.468 L. sanfranciscensis TMW1.53 L. sakei TMW1.22 Chemisch gesäuert
The degradation of flour protein was detected by an increase of low-molecular amino
nitrogen. The increase of low-molecular amino nitrogen content in the fermentation doughs
was comparable to the increase in acidified doughs (see figure 6). This fact is in accordance to
other studies; the protein degradation during wheat sourdough fermentations is mainly caused
by endogenous proteases of the flour (6, 20, 26).
Figure 6. Free amino nitrogen content during sourdough fermentations with lactobacilli and chemically acidified dough.
Moreover, high-molecular proteins were extracted and evaluated using RP-HPLC. No
differences could be seen on the quantitative evaluation of proteins after 5 hours of
fermentation with the different lactobacilli strains in the Osborne fractions
(albumins/globulins, gliadins, glutenin subunits). Only Enterococcus faecalis exhibited a
proteolytic activity against the gluten proteins. The overall content of GMP was already
significantly decreased after 5 hours of fermentations with the used strains. A drastically
degradation of gluten proteins was observed after 24 hours of fermentation, whereas the
glutenins and the GMP were more affected than the gliadins. The chemically acidified doughs
and the fermented doughs with lactobacilli showed only marginal differences in respect to
protein degradation. Thus, the endogenous flour proteases have the highest impact on protein
degradation during wheat sourdough fermentations. The fermentations performed with the
three different flour cultivars (“Tommi” A-wheat, “Bussard” E-wheat, and “Dekan” B-wheat)
showed no significant trend related to protein degradation (data not shown, (40), and report
AIF No. 14492 N).
Fermentation time in hours
Am
ino
nitr
ogen
(m
mol
/ kg
doug
h)
Chemically acidified

Chapter 2
39
2.2.2 Influence of sourdough dosage on the final bread volume
Sourdoughs were prepared and fermented for 20 hours at 30°C with L. sanfranciscensis
TMW1.53, L. plantarum TMW1.468, and L. sakei TMW 1.22, subsequently 2%, 5%, 10%,
and 20% of the fermented sourdoughs were added to final bread dough. In the case of L.
sanfranciscensis sourdough, the baking trials were performed two-times with “Tommi”-wheat
flour and once with commercially, ascorbic acid-free wheat flour. The baking trials with L.
plantarum and L. sakei sourdough were performed only two-times with “Tommi”-wheat flour
(data not shown). No significant differences were observed in the final bread volume
concerning the sourdough dosage in percentages, or the applied flours (data not shown).
A: Lactobacillus sanfranciscensis TMW1.53
500
550
600
650
700
750
1 2 3
Bre
ad
volu
me
(ml/k
g fl
our)
Figure 7. Influence of different sourdough dosages on the bread volume at three baking days. Sourdoughs were prepared at different days with Tommi-wheat and commercially available flour (1: Tommi, day 1; 2: Tommi, day 2; 3: commercially available flour, day 3). Sourdoughs (TA 200) were inoculated with L. sanfranciscensis TMW1.53 (A), and fermented for 20 hours at 30°C. Black bar = 2% sourdough; dark-grey bar = 5% sourdough; grey bar = 10% sourdough; and white bar = 20% sourdough dosage. The final bread volumes showed no differences in respect to the diverse starter cultures:
Lactobacillus sanfranciscensis (obligate heterofermentative), Lactobacillus plantarum
(facultative heterofermentative), and Lactobacillus sakei (facultative heterofermentative).
Nonetheless, significant differences were observed in bread volumes between two baking
days with the same final dough process and fermentation organism (e.g. A: Lactobacillus
sanfranciscensis 1, 2).

Chapter 2
40
2.2.3 Influence of organic acids on the final bread volume
The bread volume is essentially dependent on the dough pH-value; therefore, the influence of
organic acids was determined on the final bread volume. Primarily, lactate and acetate
amounts were introduced into doughs comparable to in vivo accumulated amounts of these
acids. The organic acids were supplemented at the beginning of the fermentation. A final
dosage of 10% sourdough was added to the final bread doughs. All sourdoughs were prepared
without the addition of viable microorganisms.
665
667
669
671
673
675
677
679
with
out s
ourd
ough
100
mM
Lac
tate
50 m
M L
acta
te
100
mM
Lac
tate
+10
mM
Ace
tate
100
mM
Lac
tate
+20
mM
Ace
tate
50 m
M L
acta
te +
10 m
M A
ceta
te
50 m
M L
acta
te +
20 m
M A
ceta
te
Bre
ad v
olum
e (m
L / k
g flo
ur)
Figure 8. Final bread volume of sourdough prepared breads with a dosage of 10%. The sourdoughs were prepared without supplementation of microorganisms, only organic acids were added.
The differences were marginal between the final bread volumes; the mean value was 673.3
ml/kg flour, the standard variation 4.3 ml/kg flour. The lowest and maximum bread volume
showed only a difference of 12 ml/kg flour. Therefore, the generally accumulated organic
acids during wheat sourdough fermentations with lactobacilli are having no impact on the
final bread volume. However, it should be noticed, that the effect of acids depends on the
buffering capacity of the system.
Consecutively, the pH-value was adjusted to 3.6 with organic acids in sourdough
fermentations; in pre-trials the amount of acids / g flour was determined to reach a specific
pH-value. For the baking trials sourdoughs were fermented with the addition of lactic- and

Chapter 2
41
acetic acid, moreover also a mixture of both acids. Furthermore, sourdoughs were prepared
with hydrochloric acid; this approach served to distinguish between pH-value effects and
influences of specific acids. Significant differences in final bread volume were observed
between two baking days for bread doughs produced with a constant process (see figure 7).
0.6
0.8
1
1.2
Lact
ic a
cid
(pH
: 5.2
)
Lact
ic a
cid
(pH
: 4.9
)
Hyd
roch
loric
aci
d(p
H: 5
.1)
Lact
ic a
cid
: Ace
ticac
id 1
:1 (
pH: 4
.6)
Lact
ic a
cid
: Ace
ticac
id 1
:4 (
pH: 4
.5)
Ace
tic a
cid
(pH
: 4.5
)
rela
tive
Bre
ad v
olum
e (-
)
Figure 9. Volume of sourdough prepared breads (Bread dough pH). The pH-values of sourdoughs were exactly adjusted to pH 3.6 with different organic acids. The sourdough dosage was 10% of the final bread dough. Hence, every day one reference bread was baked with a dosage of 10% sourdough (pH: 3.6)
added to the final bread dough. The relative volumes of the baked breads were determined
according to following formula: volume bread xy / volume reference bread.
The relative final bread volume of the lactic acid bread is by definition 1. No significant
difference was observed between lactic acid and hydrochloric acid acidified breads. A distinct
decrease of the final bread volume was observed by the addition of acetic acid (last bar). The
final pH-values of the bread doughs prepared with lactic acid sourdoughs, and hydrochloric
acid sourdoughs were 5.2 and 5.1, respectively. The breads produced with acetic acid
acidified sourdough showed a pH-value of 4.5. The bread volume collapsed by the addition of
triple amounts of lactic acid (second bar). The final bread volume was even lower than the

Chapter 2
42
bread volumes prepared with a 1:1 ratio or 1:4 ratio of lactate to acetate, respectively.
Notwithstanding, the pH-values of the latter breads were clearly decreased with 4.6 and 4.5
compared to a bread dough pH-value of 4.9. Therefore, it is proposed that not only the pH-
value determines the final bread volume, but also the subsequent parameters (see figure 10).
The baker’s yeast could be inhibited by specific amounts of acetic acid.
A B
0
10
20
30
40
50
60
2 2.5 3 3.5 4 4.5 5 5.5
pH
mm
ol e
than
ol /
kg d
ough
Figure 10. (A): Simplified presentation of yeast fermentation. (B): Accumulation of ethanol (mmol) of baker’s yeast in chemically acidified doughs after two hours of fermentation. The doughs were adjusted to the requested pH-value with hydrochloric acid (filled diamond), acetic acid (filled cube), and lactic acid (filled triangle). The fermentation efficiency of the baker’s yeast was determined in following approach to
confirm the inhibitory effect of acetic acid. Figure 10 A summarizes the fact, that there is a
direct link between accumulation of ethanol and gas formation by yeast under anaerobic
conditions. The relative amount of ethanol accumulated by baker’s yeast in different doughs
acidified with lactic acid, acetic acid, and hydrochloric acid is shown in figure 10 B, the
ethanol concentration was measured after two hours of fermentation in a liquid dough with a
dough yield of 400 (TA 400). The specific influence of acetic acid supplementation
independent to the pH-value could be clearly seen. Thus, the presence of acetic acid has an
inhibitory effect of the baker’s yeast during fermentation.
Moreover, the final bread volume was compared with L. sanfranciscensis sourdough dosage
to breads with L. sanfranciscensis sourdough dosage supplemented with fructose. Again it
should be proven, that acetic acid accumulation during sourdough fermentations can inhibit
the baker’s yeast. L. sanfranciscensis exclusively formed acetic acid in fermentations; no

Chapter 2
43
accumulation of ethanol was observed (data not shown) by the addition of fructose (5% from
the initial flour weight). The sourdoughs were fermented for 48 hours to gain the highest
acetic acid concentrations. The final bread volumes of breads prepared with the addition of
fructose were slightly decreased in volume in comparison with the reference bread (see figure
11). The reduction in volume could be caused by higher concentrations of acetic acid in the
doughs, certainly also the presence of fructose could affect dough characteristics.
0.98 0.99 1 1.01 1.02 1.03
without fructose
with added fructose
relative bread volume (-)
Figure 11. Influence of supplemented fructose to sourdoughs fermented with L. sanfranciscensis TMW1.53 on the final bread volume.
2.2.4 Influence of the used starter culture in sourdough fermentations on the final bread
volume
The effect of starter culture selection for sourdough fermentations upon bread volume was
determined with five different microorganisms. Obligate heterofermentative and facultative
heterofermentative species were chosen as well as Enterococcus faecalis which clearly
contributed to gluten proteolysis in sourdough fermentations (40). Sourdoughs were
fermented with: L. sanfranciscensis TMW1.53, L. plantarum TMW1.468, L. sakei TMW1.22,
L. fermentum TMW1.890, and Enterococcus faecalis TMW2.22. The sourdoughs were
prepared with a dough yield of 200 (TA 200) and fermented for approx. 20 hours at 30°C; the
final bread doughs contained 10% sourdough dosage. The baking approaches were performed
as duplicates at three independent baking days. Common wheat flour (free of ascorbic acid)
was used in this approach compared to the genuine flour used in chapter 2.2.2. No specific
strain could be selected to gain an increase in final bread volume (see figure 12).

Chapter 2
44
0
100
200
300
400
500
600
700
800
L. sanfran. L. sak ei L. plantarum L. fermentum E. faecalis
Bre
ad v
olum
e (m
l/kg
flour
)
Figure 12. Influence of the used micro organisms in sourdough fermentations on the final bread volume. The baking approaches were conducted at several baking days. The different colored bars represent independent baking days. Used strains: L. sanfranciscensis TMW1.53, L. sakei TMW1.22, L. plantarum TMW1.468, L. fermentum TMW1.890, and E. faecalis TMW2.22.
The assumption that reductive, obligate heterofermentative strains like L. sanfranciscensis
produce breads with a decreased volume in comparison with H2O2 generating strains, e.g. L.
sakei was not observed. The selected sourdough dosage of 10% to the final bread dough
resulted in insufficient results in respect to classification of strains based on their generated
bread volume. The reproducibility of bread volumes were sufficient between breads baked on
the same day with the same fermentation strain. All pre-cultures were checked for purity
using microscopy before inoculation of the respective sourdough; therefore, a contamination
or development of spontaneous flora was very unlikely. The complexity of the fermentation
and baking process avoided a classification in respect to bread volume based on different used
starter cultures. Moreover, the different physiological condition of the added baker’s yeast
must be mentioned on the diverse baking days. The influence of dry yeast usage was
determined to compensate the different physiological conditions of the baker’s yeast; this
approach provided insufficient results due to non-activity of the dry yeast in fermentations
(type: Farmipan Red).

Chapter 2
45
Figure 13. Appearance of baked breads with dry yeast (left bread) and reference bread with fresh yeast (right bread)
The breads baked with dry yeast showed a quarter of the volumes in comparison with breads
baked with fresh baker’s yeast; this could already be seen in the dough stage, after preparation
of the doughs included dough rest only a rarely yeast performance and dough development
was observed (see figure 13).
2.2.5 Influence of the sourdough fermentation period on the bread volume
The bread volume of an overnight fermented sourdough with lactic acid was compared with a
freshly prepared sourdough. The breads produced from the freshly prepared sourdough were
decreased 2% in volume compared with the overnight fermented sourdough (662 vs. 677 ml/
kg flour). In another trial, sourdough was fermented with lactic acid for 20 hours and 70
hours, respectively. The final bread volume of the 20 hours fermented sourdough was 646
ml/kg flour, whereas the bread volume of the 70 hours fermented sourdough was 513 ml/kg
flour; thus, a 21% decrease in final bread volume was observed for the 70 hours fermented
sourdough. The repetition of the baking trial confirmed the above mentioned result, but the
decrease of final bread volume was not so pronounced (only 3% in comparison with 21% in
the first approach). The difference of 18% in decrease of bread volume could not be clearly
clarified between the two approaches. Microbiological contaminations of the doughs could be
excluded due to chemical acidification.
2.2.6 Influence of ascorbic acid addition on the volume of sourdough breads
The fundamental difference between the above mentioned approaches and the real baking
process in bakeries is the usage of ascorbic acid. Ascorbic acid is the main added baking
improver with stabilization effects upon the gluten network:

Chapter 2
46
P — SH ½ O 2
H 2 O P — SSG DHAA
AA
GSH
GSSG
Figure 14. Oxidation of glutathione by endogenous flour glutathione dehydrogenase contributes to stabilization of the gluten network in wheat doughs (according to Hahn and Grosch, (15, 37)). AA: ascorbic acid, DHAA: dehydroascorbic acid, AO: ascorbic acid oxidase, GshR: glutathione dehydrogenase, P: protein
0.88
0.9
0.92
0.94
0.96
0.98
1
1.02
1.04
1.06
1.08
Ref
eren
ce, b
read
doug
h pH
5.0
with
asc
orbi
cac
id, b
read
doug
h pH
5.1
with
asc
orbi
cac
id, b
read
doug
h pH
4.7
rela
tive
brea
d vo
lum
e (-
)
Figure 15. The influence of ascorbic acid towards bread volume is pH-dependent. The influence of the final bread dough pH-value on the effect of ascorbic acid was
determined. Reference bread was baked with a lactic acid sourdough dosage of 10%; ascorbic
acid in a common concentration of 0.02% in relation to initial flour weight was supplemented
to the sourdough, though the dilution of the sourdough in the final bread dough was
considered. The final pH-value was not adjusted after addition of ascorbic acid to the first
sourdough. In the second sourdough, ascorbic acid was dissolved in water and the pH-value
was adjusted using sodium hydroxide to 7.2. The final pH-values of the baked breads differed
by 0.4 pH-units. The increase in bread volume due to addition of ascorbic acid was only
observed in breads baked with higher pH-values of the dough, e.g. pH-value of 5.1.
Flour GshR AO

Chapter 2
47
2.2.7 Influence of microbiological catalysed redox reactions on bread volume
L. sanfranciscensis TMW1.53 possesses a glutathione reductase, its activity caused an
increase of thiol-groups during wheat sourdough fermentations (see also chapter 2.2.8). Other
lactobacilli, e.g. L. sakei, showed no glutathione reductase activity; thus, there was observed
no increase in thiol-groups during wheat sourdough fermentations (37). The quantity of free
thiol-groups plays a major role in development of the gluten network; hence, also a main
impact on bread volume could be seen. Thus, a difference in final bread volume was expected
using the different lactobacilli in sourdough fermentations.
400
500
600
700
Refer
ence
-M
Refer
ence
-S
with G
SSG-M
with G
SSG-S
with G
SH-M
with G
SH-S
Bre
ad v
olum
e (m
L/kg
flou
r)
Figure 16. Influence of oxidized and reduced glutathione on the final bread volume. Glutathione was supplemented to sourdoughs acidified with lactic acid (-M) and to sourdoughs fermented with L. sanfranciscensis TMW1.53 (-S). The experiments were performed in duplicates, dark-grey and grey bars. As shown in figure 12, no classification based on the selected starter cultures in sourdough
fermentations in respect to the final bread volume could be established.
In addition, sourdoughs were fermented with GSSG (10 mM) and GSH (10 mM)
supplemented at the beginning of fermentation; Following, the final bread volume was
determined. L. sanfranciscensis sourdoughs and chemically acidified doughs were used in this
approach. The bread volume was increased by 5% when 10% sourdough fermented with L.
sanfranciscensis was added to the final bread dough in comparison to the reference bread. As
expected, addition of the reduced form of glutathione (GSH) resulted in decreased final bread
volumes. Thus, supplemented GSH degraded the protein network, and therefore contribute to

Chapter 2
48
a reduction of the gas holding capacity of the gluten. The effect of glutathione addition on
final bread volume was comparable between chemically acidified sourdoughs and sourdoughs
fermented with L. sanfranciscensis. The expectation was that L. sanfranciscensis reduce
GSSG to form GSH resulting in a final bread volume reduction in comparison to chemically
acidified sourdoughs, but this was not the case. Thus, indicating that glutathione reductase
activity from L. sanfranciscensis is playing just a minor role in respect to final bread volume;
the influence of microbial glutathione reductase after addition of exogenous glutathione in
sourdoughs on the final bread volume (10% sourdough dosage) was negligible.
Figure 17. Appearance of breads in standard baking trials with L. sanfranciscensis TMW1.53 fermented sourdoughs: (A) Reference, (B) supplemented with 10 mM GSSG, (C) supplemented with 10 mM GSH.
Figure 17 shows the baked breads with supplemented GSSG and GSH, respectively. The
reference bread was prepared with a dosage of 10% L. sanfranciscensis-sourdough (A), the
baked bread with addition of oxidized glutathione to L. sanfranciscensis-sourdough showed
already a decreased volume compared with the reference bread (B). L. sanfranciscensis-
sourdoughs supplemented with reduced glutathione showed a significant decrease in final
bread volume (C).
Oxidoreductases of lactobacilli could generate reduced thiol compounds during wheat
sourdough fermentations. Low-molecular weight compounds are capable bread aroma
precursors; however, the dough rheology could be affected by degradation of gluten proteins
caused by a decrease of the redox potential in the dough system. Approaches in this study (see
figure 20) indicated that obligate heterofermentative lactobacilli, e.g. L. reuteri and L. pontis
exert comparable effects on thiol levels during wheat sourdough fermentations as L.
A
C B

Chapter 2
49
sanfranciscensis. Strains of these species and other lactobacilli were screened for glutathione
reductase activity on biochemical and genetically levels to establish whether their effects on
thiol exchange reactions are also attributable to glutathione reductase activities. Moreover, L.
reuteri BR11 and the cognate mutant strain L. reuteri BR11∆cyuC, which is deficient in a
cystine uptake system (25), were included in the analysis. Several lactobacilli DNA were
screened in PCR by using the degenerated primers Deg/gshRV and Deg/gshRR (see chapter
4.1.1 and 5.1.10), respectively. L. brevis TMW 1.57, L. plantarum TMW 1.460, L. johnsonii
TMW 1.192, L. frumenti TMW 1.635, L. acidophilus TMW 1.18, L. hilgardii TMW 1.45, and
L. pentosus TMW 1.10 were found to harbor glutathione reductase genes related to gshR of L.
sanfranciscensis; however, no amplification product was obtained with DNA from L. reuteri
TMW 1.106, L. pontis TMW1.84 or L. reuteri BR11 (data not shown and Table 7).
Table 7. Occurrence of glutathione reductase genes and cystathionine-γ-lyase genes in different lactobacilli Glutathione reductase sequences Cystathionine-γ-lyases sequences
L. sanfranciscensis TMW1.53 L. reuteri TMW1.10
L. brevis TMW1.57 L. reuteri TMW1.976
L. plantarum TMW1.460 L. panis TMW1.648
L. johnsonii TMW1.192 L. fermentum TMW1.890
L. frumenti TMW1.635 L. mindensis TMW1.1206
L. acidophilus TMW1.18 L. pontis TMW1.84
L. hilgardii TMW1.45
L. pentosus TMW1.10
The absence of glutathione reductase activity in L. pontis and L. reuteri was verified by
determination of the activity in crude cellular extracts after separation on SDS-PAGE gels
(Figure 18). Strains without glutathione reductase activity exhibited cystathionine-γ-lyase
(CgL) activity (Table 8).
Based on the partial sequence of the cystathionine-γ-lyase of L. fermentum TMW1.890, the
whole sequence of the gene was completed using inverse PCR (see chapter 5.2 Sequences). A
knockout-mutant of the glutathione reductase (gshR) from L. sanfranciscensis TMW1.53 was
designed according to chapter 2.1.8; the influence of the glutathione reductase was evaluated
with this approach on thiol-levels during wheat sourdough fermentations. In addition,
following lactobacilli strains were examined for glutathione reductase activity according to

Chapter 2
50
chapter 2.1.7: L. sanfranciscensis TMW1.53, L. sanfranciscensis TMW1.53∆gshR, L. pontis
TMW1.84, L. reuteri BR11, and a cognate mutant of L. reuteri BR11 unable to transport
cystine (L. reuteri BR11∆bspA). L. sanfranciscensis showed a glutathione reductase activity
of 45 nmol/min/mg, while the activity of the cognate mutant strain L. sanfranciscensis
TMW1.53∆gshR was strongly reduced to 14 nmol/min/mg. No glutathione reductase activity
was observed for L. pontis TMW1.84 and L. reuteri BR11.
Table 8. Glutathione reductase and cystathionine-γ-lyase activity in sourdough lactobacilli. L. sanfrancscensis L. sanfranciscensis L. reuteri BR11 L. reuteri BR11 L. pontis TMW1.53 TMW1.53∆gshR ∆cyuC TMW1.84 GshR activitya 45 14 - - -
gshRb + - - - - CgL activity - - + + + CgL, PCR -c n.d. +d n.d. +c
a) glutathione reductase activity in crude cellular extract, nmol min-1 mg-1
, - indicates the absence of GshR activity in crude cellular extracts after separation on SDS-PAGE. b) Detection of a glutathione reductase gene using the degenerated primers Deg-gshRV and Deg-gshRR. c) (38). d) (35).
The results were supported by activity staining for glutathione reductase using SDS-gel
according to chapter 2.1.9.
Figure 18. Detection of glutathione reductase acivity in crude cellular extracts of L. reuteri BR11 (Lane 1), L. pontis TMW1.84 (Lane 2) and L. sanfranciscensis TMW1.53 (Lane 3) after separation of crude cellular extracts by SDS-PAGE. The location of GshR with a predicted relative molecular weight (Mw) of 48.614 is indicated.
1 2 3
48 kDa

Chapter 2
51
2.2.8 Thiol levels in sourdough fermented with L. sanfranciscensis TMW1.53 and L.
sanfransiscensis TMW1.53∆gshR
To determine whether GshR is involved in the reduction of thiol groups in wheat sourdoughs,
thiol levels were quantified in SDS-extracts of wheat sourdoughs fermented with L.
sanfranciscensis TMW1.53 and TMW1.53∆gshR. Samples were taken from unfermented
doughs, after 5 hours of incubation, corresponding to exponentially growing cells in
sourdough, and after 24 hours of incubation, corresponding to stationary cells. Chemically
acidified dough was used as a control. Both strains grew to high cell counts (7.0 ± 0.5 x 10⁸
cfu/g) after 24 hours of fermentation. The pH of doughs fermented with L. sanfranciscensis
after 5 hours was 4.38 ± 0.05 and 3.45 ± 0.05 after 24 hours, respectively. Fermentation with
L. sanfranciscensis increased thiol levels in dough (Figure 19). In chemically acidified
doughs, thiol level decreased during fermentation. During fermentation with the gshR-mutant
strain, the pH decreased to 4.32 ± 0.05 after 5 hours of fermentation and to pH 3.47 ± 0.05
after 24 hours. The thiol content of sourdoughs fermented with the gshR-mutant was
comparable to that of chemically acidified doughs.
fermentation time (h)
0 6 12 18 24
µM
SH
/ g
doug
h
6
8
10
12L. sanfranciscensis
L. sanfranciscensis ∆gshRchemically acidified
Figure 19. Thiol levels SDS-extracts from chemically acidified wheat doughs and dough fermented with L. sanfranciscensis TMW1.53 and L. sanfranciscensis TMW1.53∆gshR. Shown are the means ± standard deviations from five independent experiments, data differing significantly (p<0.05) from chemically acidified doughs are marked with an asterisk.
* *
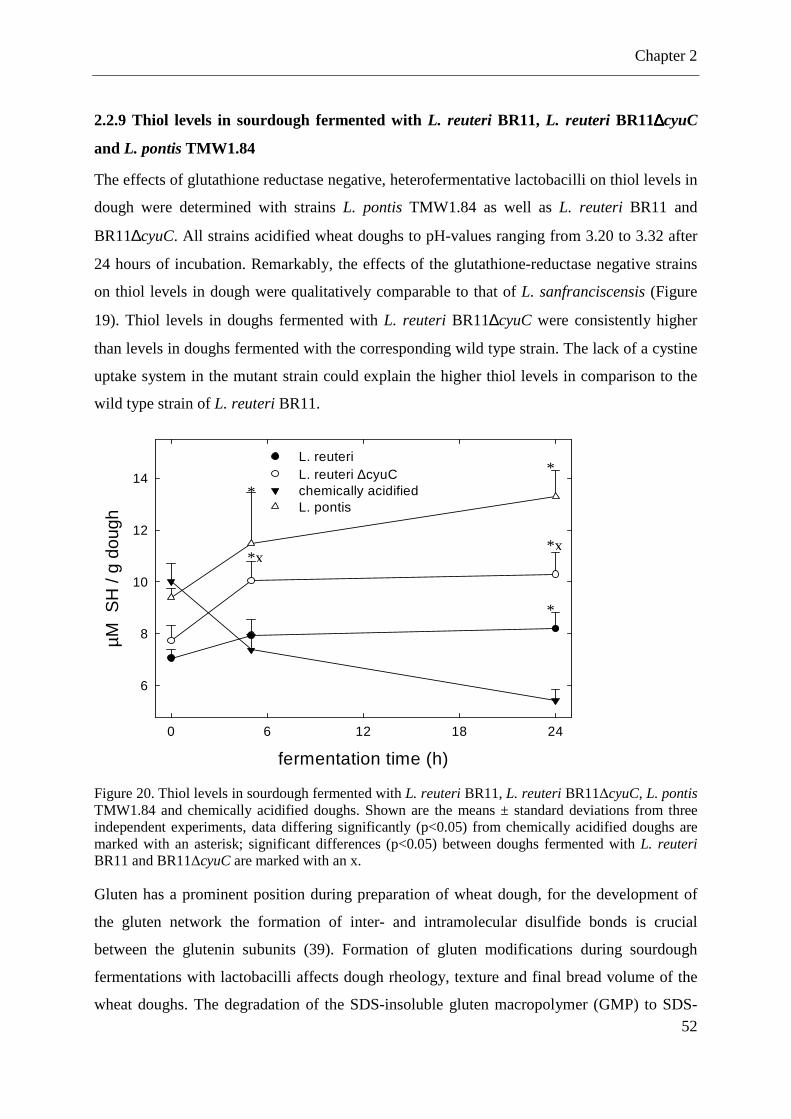
Chapter 2
52
2.2.9 Thiol levels in sourdough fermented with L. reuteri BR11, L. reuteri BR11∆∆∆∆cyuC
and L. pontis TMW1.84
The effects of glutathione reductase negative, heterofermentative lactobacilli on thiol levels in
dough were determined with strains L. pontis TMW1.84 as well as L. reuteri BR11 and
BR11∆cyuC. All strains acidified wheat doughs to pH-values ranging from 3.20 to 3.32 after
24 hours of incubation. Remarkably, the effects of the glutathione-reductase negative strains
on thiol levels in dough were qualitatively comparable to that of L. sanfranciscensis (Figure
19). Thiol levels in doughs fermented with L. reuteri BR11∆cyuC were consistently higher
than levels in doughs fermented with the corresponding wild type strain. The lack of a cystine
uptake system in the mutant strain could explain the higher thiol levels in comparison to the
wild type strain of L. reuteri BR11.
fermentation time (h)
0 6 12 18 24
µM
SH
/ g
doug
h
6
8
10
12
14
L. reuteriL. reuteri ∆cyuCchemically acidifiedL. pontis
Figure 20. Thiol levels in sourdough fermented with L. reuteri BR11, L. reuteri BR11∆cyuC, L. pontis TMW1.84 and chemically acidified doughs. Shown are the means ± standard deviations from three independent experiments, data differing significantly (p<0.05) from chemically acidified doughs are marked with an asterisk; significant differences (p<0.05) between doughs fermented with L. reuteri BR11 and BR11∆cyuC are marked with an x.
Gluten has a prominent position during preparation of wheat dough, for the development of
the gluten network the formation of inter- and intramolecular disulfide bonds is crucial
between the glutenin subunits (39). Formation of gluten modifications during sourdough
fermentations with lactobacilli affects dough rheology, texture and final bread volume of the
wheat doughs. The degradation of the SDS-insoluble gluten macropolymer (GMP) to SDS-
*
*
*x *x
*

Chapter 2
53
soluble low-molecular weight compounds is supported by the proteolytic activity of
lactobacilli, thus the gluten quality in wheat doughs with 10-20% sourdough dosage is
adulterated in comparison with direct produced wheat doughs (7).
The influence on thiol levels during wheat sourdough fermentations with thermophilic,
heterofermentative lactobacilli, e.g. L. reuteri and L. pontis is comparable with fermentations
with L. sanfranciscensis; however, the indicated strains exhibited no glutathione reductase
activity (27). The increased thiol levels in sourdoughs fermented with L. reuteri and L. pontis
are attributed to other thiol active enzymes. Both strains harboring a cystathionine-γ-lyase
gene and exhibited also cystathionine-γ-lyase activity in crude cellular extracts (see table 8).
An influence of the active enzyme on thiol levels during wheat sourdough fermentations
could be existent due to metabolism of cysteine and thiol exchange reactions.
2.2.10 Effects of L. sanfranciscensis TMW1.53 and cognate mutant TMW1.53∆gshR on
gluten proteins during sourdough fermentations
The use of a method combining extract and HPLC allowed a more detailed study on protein
degradation (see chapter 2.1.10) during wheat sourdough fermentations. Dough proteins, here
gliadins and glutenins were fractionated by a modified Osborne procedure according to
Wieser et al. (40). Significant differences in the GLIA amounts could not be detected over a
fermentation period of 24 hours with chemically acidified dough, sourdough fermented with
L. sanfranciscensis TMW1.53, and the cognate mutant TMW1.53∆gshR. However, a
significant difference in the GLUT amounts was detected after 24 hours of fermentation with
a decrease to 34% in L. sanfranciscensis TMW1.53 sourdoughs in comparison to a decrease
to only 56% in TMW1.53∆gshR sourdoughs.
Figure 21. Relative amounts of gliadins (GLIA) and glutenins (GLUT) in sourdoughs after 0, 5, 24 hours of fermentation. CHE: chemically acidified dough, SAN: L. sanfranciscensis TMW1.53 sourdough, SAN/G: L. sanfranciscensis TMW1.53∆gshR sourdough. 0 hours = 100 %.

Chapter 2
54
Total plate counts of the two sourdoughs of L. sanfranciscensis TMW1.53 and the mutant
exhibited similar results > 108 cfu/g dough after 24 hours of fermentation. The chemically
acidified dough showed total plate counts < 104 cfu/g dough throughout the fermentation
period indicating no contamination growth, e.g. spontaneous microbiota. The pH-value as
well as the fermentation quotient showed similar results for L. sanfranciscensis sourdoughs
and the mutant TMW1.53∆gshR sourdoughs, respectively. The chemically acidified dough
showed somehow increased organic acids values compared to the doughs fermented with
microorganisms; although, they showed still values at the upper range of natural acidified
sourdoughs. Therefore, a direct effect is shown of the glutathione reductase on glutenin
proteins during wheat sourdough fermentations. The degradation of the glutenin protein
fraction differs by approx. 20% between the wild type strain of L. sanfranciscensis and the
cognate mutant.
Table 9. Microbiological characterization of sourdoughs prepared with commercially, ascorbic acid-free wheat flour for gluten protein determination.
Starter culture Time (Hours)
Plate count (cfua / g dough) pH Lactateb Acetateb Fermentation
quotientc
chem. acidified 0 < 104 n.a. n.d.d n.d. - 5 < 104 n.a. 14.2 6.4 2.2 24 < 104 n.a. 48.6 20.3 2.4 L. sanfranciscensis 0 3.0 x 10⁵ 5.62 n.d. n.d. - TMW1.53 5 5.0 x 10⁷ 4.38 8.8 2.2 4.0 24 7.4 x 10⁸ 3.45 35.9 6.1 5.9 L. sanfranciscensis 0 3.8 x 10⁵ 5.55 n.d. n.d. - TMW1.53∆gshR 5 4.6 x 10⁷ 4.32 4.8 0.6 8 24 7.2 x 10⁸ 3.47 30.2 7.9 3.8 acfu: colony forming unit, bconcentrations in mmol / kg dough; cFermentation quotient: lactate / acetate ratio, dn.d.: below detection limit, n.a.: not analyzed
The production of breads based on sourdoughs fermented with the mutant strain L.
sanfranciscensis TMW1.53∆gshR was not feasible due to the existence of a genetically
modified organism. Therefore, the direct influence of the glutathione reductase on final bread
volume could not be evaluated. Indeed, it should be considered that the sourdough content is
approximately between 10-20% of the final bread dough. The impact of the enzyme would
have been diminished by “dilution” of fresh prepared dough. Moreover, yeasts could equalize
possible differences in the following baking process (see figure 5 – Rapid Mix Test).

Chapter 2
55
2.2.11 Influence of “Vitalkleber” and Diacetyl-tartaric-acid-ester (DATEM) on the final
bread volume
Vitalkleber and DATEM are the main improvers used by bakers beside ascorbic acid. The
gluten quantity, hence bread volume is increased after addition of Vitalkleber; the ester serves
as an emulsifier with stabilization effects on the existing gluten network. Both bakery
improvers were provided by Mühlenchemie (Ahrensburg, Germany – “Vitalkleber”:
EMCEvit C and DATEM: Mulgaprime 16). The bakery improvers were added at the
beginning of sourdough fermentations according to manufacturer’s instructions (Vitalkleber:
2.0%/1000 g flour; DATEM: 0.3%/1000 g flour).
645
650
655
660
665
670
675
680
685
Lact
ic a
cid,
Ref
eren
ce
Lact
ic a
cid,
Vita
lkle
ber
L. s
anfr
anc.
,V
italk
lebe
r
Lact
ic a
cid,
DA
CW
L. s
anfr
anc.
,D
AC
W
Bre
ad v
olum
e m
l / k
g flo
ur
Figure 22. Influence of bakery improvers on the final bread volume. Often used products, as „Vitalkleber“ and Diacetyl-tartaric-acid-ester (DATEM) were supplemented to sourdoughs fermented with L. sanfranciscensis TMW1.53 or to chemically acidified (with lactic acid adjusted to a pH-value of 3.6) doughs. After 20 hours of fermentation a 10% sourdough dosage was added to the final bread dough.
This approach was executed with microbiological preferments and with chemically acidified
preferments. The supplemented bakery improvers were not degraded during wheat sourdough
fermentations and showed a positive impact on bread volume (two outliers, black bar: lactic
acid acidified sourdough with Vitalkleber, and L. sanfranciscensis sourdough with DATEM).
Thus, their effective application in wheat sourdough fermentations is possible. In another
approach, with addition of Vitalkleber and DATEM to wheat sourdoughs fermented with L.
sanfranciscensis, the increase in final bread volume could also be seen (see table 10).

Chapter 2
56
The addition of Vitalkleber and DATEM in sourdoughs fermented with L. sanfranciscensis
caused an increase in ethanol accumulation after 20 hours, 140.8 mmol/kg dough
(Vitalkleber) and 156.4 mmol/kg dough (DATEM), respectively; in comparison with ethanol
values of 31.2 mmol/kg dough in sourdough fermented with L. sanfranciscensis without the
addition of bakery improvers (data not shown). Noticeably, the high fermentation quotients of
10.8 after 5 hours, and 14.5 after 20 hours in sourdoughs fermented with L. sanfranciscensis
supplemented with Vitalkleber. The final bread volume was increased by 1.4% in sourdoughs
fermented with L. sanfranciscensis supplemented with Vitalkleber, and approximately 5.8%
in sourdoughs fermented with L. sanfranciscensis supplemented with DATEM in comparison
with the bread volume gained from sourdoughs fermented with L. sanfranciscensis without
added bakery improvers.
The impact of the supplemented bakery improvers on the protein degradation during
sourdough fermentations was evaluated at the Hans-Dieter-Belitz Institute for Cereal Grain
Research by Dr. Wieser (see also report AiF 14492 N). In conclusion, by addition of DATEM
during wheat sourdough fermentations no differences were observed in respect to protein
degradation; the protein deficiency after 24 hours of fermentation was compensated by
supplementation of Vitalkleber at the beginning.
Table 10. Characterization of the fermented sourdoughs supplemented with bakery improvers Approach Time Plate count pH Lactate Acetate Fermentation Bread volume (h) cfu/g dough mmol/kg dough quotient ml/kg flour
Chemically 0 < 104 5.94 n.d. n.d --- --- acidified 5 < 104 5.26 14.2 6.4 2.2 --- 20 < 104 4.61 48.6 21.7 2.2 696.1 Chem. acid. 0 < 104 6.03 n.d. n.d --- --- + Vitalkleber 5 < 104 5.26 10.9 3.3 3.3 --- 20 1.3 x 10⁶ 4.64 31.0 10.9 2.8 682.5 Chem. acid. 0 < 104 5.70 n.d. n.d. --- --- + DATEM 5 < 104 5.10 15.8 6.2 2.5 --- 20 1.0 x 10⁶ 4.91 50.2 13.8 3.6 684.3 L. sanfrancis- 0 1.6 x 10⁷ 5.53 n.d. n.d. --- --- censis 5 3.0 x 10⁷ 4.95 7.1 0.9 7.9 --- 20 7.3 x 10⁸ 3.66 32.6 6.8 4.8 636.8 L. sanfrancisc. 0 1.3 x 10⁷ 5.65 n.d. n.d. --- --- + Vitalkleber 5 4.2 x 10⁷ 5.06 5.4 0.5 10.8 --- 20 1.2 x 10⁹ 3.74 48.0 3.3 14.5 645.7 L. sanfrancisc. 0 1.9 x 10⁷ 5.38 n.d. n.d. --- --- + DATEM 5 3.5 x 10⁷ 4.83 5.0 3.9 1.3 --- 20 7.5 x 10⁸ 3.99 46.1 9.5 4.9 673.6

Chapter 2
57
2.3 DISCUSSION
2.3.1 Effect of endogenous and exogenous parameter on the final bread volume during
wheat sourdough fermentations
A classification of the different parameters, e.g. sourdough dosage, fermentation strain
selection in respect to final bread volume could not be established due to diverse reasons. As
evidence, the results obtained in figure 7 and 12 showed no trend in consideration of
percentage of sourdough dosage to the final bread dough or selected sourdough fermentation
organism. In further studies, attention should be paid to the physiological status of the
microorganisms used in the sourdough fermentations. Reproducibility of the sourdough
fermentations could be analyzed with the determination of total plate count, pH-value, and the
fermentation quotient in the dough system. Thus, sourdough fermentations with comparable
values of the three mentioned parameters might enable a classification based on strain
selection or sourdough dosage in respect to final bread volume. A classification should be
established based on worst case scenarios; therefore, the addition of different percentages of
sourdough dosage to the final bread dough should cover maybe 0%, 20%, and 40%. The
sourdough dosage to the final dough in fermentations with different microorganism should be
at least 20%. The recommended addition of sourdough to the final bread dough is approx.
12% for wheat breads (4). Possible differences caused by the sourdough microbiota in respect
to final bread volume could be detected when increasing amounts of sourdough dosage are
used. The classification must be established in independent baking approaches (days), because
the physiological status of the applied yeasts varies on a daily base in the baking process. The
usage of dry yeast is not recommended (see chapter 2.2.4, figure 13). Overall, with the
insufficient bread volume data generated in this study no clear classification could be
established; further studies have to generate more data in respect to final bread volume for the
parameters sourdough dosage and the selection of fermentation microorganisms, respectively.
The accumulation of organic acids produced by the microbiota during wheat sourdough
fermentations could inhibit the baker’s yeast in the baking process resulting in a decreased
final bread volume. The obligate heterofermentative hexose metabolism accumulates lactate,
ethanol and CO2 as the major products unless co-substrates are available that enable the
regeneration of reduced cofactors. In the presence of external electron acceptors, acetyl-
phosphate is converted to acetate with the yield of an additional molecule of ATP (10).
Several co-factors, e.g. O2, fructose, oxidized glutathione could be reduced by specific

Chapter 2
58
enzymes (see also chapter 4 of this thesis), and therefore enable regeneration of the oxidized
form of pyridine nucleotide (10, 23, 30, 31). The inhibition of the yeast by high amounts of
acetic acid was shown in chapter 2.2.3; the yeast exhibited a strong decrease in ethanol
accumulation in doughs supplemented with acetic acid. The inhibitory effect of organic acids
is caused by the undissociated form of the acid. Therefore, due to the higher pKa of acetic acid
compared to lactic acid, the antimicrobial activity of acetate is higher at equivalent pH values
and the same total concentrations of acids (1). The undissociated acetic acid diffuses freely
into the yeast cell. Once inside the cell, the acid dissociates due to higher intracellular pH and
causes acidification of the cytoplasma (34). Under fermentation conditions, the intracellular
pH of Saccharomyces cerevisiae is usually maintained between 5.5-5.75 when the external
pH is 3.0 (19). Thomas et al. (34) proposed that the total concentration of acetic acid
determines the extent of growth inhibition by S. cerevisiae, not the concentration of the
undissociated form of the acid alone. Figure 9 clearly demonstrates the above mentioned
phenomenon, the final bread volume drastically decreased in sourdough breads supplemented
with acetic acid. Fermentation arrest and reduced ethanol volumetric production of S.
cerevisiae was shown in sourdough fermentations (this study) and during alcoholic
fermentations (11, 13, 24, 28).
Endogenous ascorbic acid oxidase from flour could explain the effect of ascorbic acid on the
final bread volume as shown in figure 14. The enzyme was characterized and stable within a
pH-range of 5 to 9 (21); in another study from Every (9), optimal pH-values of 6.2-6.3 were
estimated for the endogenous flour ascorbate oxidases. Moreover, the involved endogenous
glutathione dehydrogenase in the enzyme cascade was found to have their optimal activity in
a pH-range of 5.5-7.5 (22). Therefore, the impact of supplemented ascorbic acid on an
increase of final bread volume is pH-dependent; enzymes involved in the cascade (figure 14)
have an optimal activity above a pH-value of 5. The final bread volume prepared with
sourdough (+ ascorbic acid, pH: 4.7) was even decreased in respect to the volume compared
with the reference bread (see figure 15); the decreased volume is caused by the pH-drop and
the resulting effect on the gluten network. A possibly inhibitory effect of ascorbic acid on the
fermentation performance of the baker’s yeast is unlikely due to the antioxidative effect of the
compound.

Chapter 2
59
2.3.2 Effect of redox reactions and glutathione reductase on thiol-exchange reactions in
wheat sourdoughs.
The addition of the reduced and oxidized form of glutathione during wheat sourdough
fermentations with L. sanfranciscensis showed no influence in respect to the final bread
volume compared with chemically acidified doughs. Thus, a direct impact of the microbial
glutathione reductase during the fermentation period on the gluten network resulting in
decreased final bread volumes could be excluded with this approach. Although, differences in
final bread volume could be compensated due to addition of fresh dough and fermentation
activity of the baker’s yeast, again it should be noted that only 10% of sourdough dosages
were introduced into the final bread doughs. In comparison, it was concluded that in addition
to the pH-dependent activity of cereal proteases, redox reactions catalyzed by lactobacilli
determine gluten quality during sourdough fermentations. Thus, the formation of thiols by L.
sanfranciscensis interferes with gluten polymerization during sourdough fermentations (37).
In contrast to the results of glutathione addition during sourdough fermentations is the
outcome of the approach using a cognate mutant of L. sanfranciscensis decreased in
glutathione reductase activity. The functional characterization of a glutathione reductase in
lactobacilli was carried out using a GshR-deficient mutant of L. sanfranciscensis TMW1.53.
Although the enzyme is located in the cytoplasm, the accumulation of thiols in the
extracellular medium was attributable to GshR activity. Import of glutathione was previously
demonstrated in S. mutans (29); however, glutathione in wheat doughs undergoes thiol-
exchange reactions with cyst(e)ine and other thiols (14). Thus, transport of reduced or
oxidized thiol compounds other than glutathione across the cytoplasmic membrane may
account for the effects of metabolism on extracellular thiol levels. Previously, the intracellular
conversion of cystine or cysteine in L. reuteri was shown to increase extracellular thiol levels
(17, 18).
L. sanfranciscensis increased thiol levels in wheat doughs, whereas a decrease of thiols was
observed in wheat doughs fermented with L. sanfranciscensis TMW1.53∆gshR. The
extracellular accumulation of thiols is particularly relevant in wheat doughs. The quality and
quantity of gluten proteins in wheat flours is of paramount importance for wheat bread quality
and the intermolecular disulfide crosslinks of glutenin subunits to form the glutenin
macropolymer are dependent on the presence or absence of low molecular weight sulfhydryl
compounds (14). The elasticity and viscosity of wheat sourdoughs decreases during
fermentation because of altered protein net charge, disruption of thiol-crosslinking of gluten

Chapter 2
60
protein, and proteolytic degradation of glutenin subunits (3, 8, 32, 37). The disruption of
disulfide crosslinks in the gluten macropolymer occurs early during fermentation and is
dependent on the presence of heterofermentative lactic acid bacteria in the dough (37). The
direct impact of the glutathione reductase of L. sanfranciscensis on gluten proteins during
sourdough fermentations was shown in figure 21. The degradation of the glutenin fraction
was deviating by approx. 20% between the wild type strain of L. sanfranciscensis and the
mutant TMW1.53∆gshR. Thus, the knockout of a single enzyme activity resulted in a
decreased glutenin network breakdown during wheat sourdough fermentations. In the study
by Wieser et al. (40), the glutenin degradation showed comparable results in respect to L.
sanfranciscensis and chemical acidification during sourdough fermentations, respectively.
They assumed that the proteolytic activities of lactobacilli played only a marginal role in
gluten degradation.
In comparison, proteolytic degradation of gluten proteins occurs only after extended
fermentation times corresponding to pH values of less than 4.5 and a comparable extent of
gluten proteolysis occurs in aseptic and fermented doughs (32, 33). In keeping with the
different time scales of proteolysis and thiol exchange, a comparison of fundamental
rheological properties of aseptic acidified wheat doughs and sourdoughs with the same pH
revealed significant differences between fermented and unfermented doughs after 6 hours of
fermentation but not after 24 hours of fermentation (8). Thiol exchange reactions in wheat
doughs are furthermore relevant in applications targeting complete proteolytic degradation of
gluten proteins. In wheat doughs, proteolysis is limited by the activity of proteolytic enzymes
but the substrate solubility becomes the limiting factor to protein degradation upon addition of
external proteases (12, 32, 36). The disruption of disulfide crosslinks between gluten proteins
by chemical reducing agents or heterofermentative lactobacilli is required to achieve a
virtually quantitative hydrolytic degradation of gluten proteins in wheat doughs (32, 36).
The effects of L. reuteri and L. pontis on thiol levels in sourdough were comparable to L.
sanfranciscensis but these strains did not exhibit glutathione reductase activity. Remarkably,
L. reuteri BR11∆cyuC, which has a comparable phenotype as the gshR deficient L.
sanfranciscensis with respect to its tolerance to oxygen (see chapter 4 and (35)), increased the
thiol levels in dough when compared to the cognate wild type strain, indicating a role of
cystine metabolism via cystathionine-γ-lyase for thiol-exchange reactions in wheat doughs.
The effect of CyuC deletion in L. reuteri was less pronounced compared to the GshR deletion
in L. sanfranciscensis. It is counter-intuitive that the loss of cystine transport increased

Chapter 2
61
extracellular thiol levels; however, the L. reuteri CyuC mutant strain remains capable of
extracellular accumulation of thiols from substrates other than cystine (18, 25).
Bakery improvers like Vitalkleber and emulsifiers, e.g. diacetyl-tartaric-acid ester (DATEM)
are widely used in bakeries as dough strengtheners, and finally increase the bread volume.
With the approaches conducted in this study, the supplementation of the improvers during
sourdough fermentations was evaluated in respect to their inactivation/degradation by the
fermentation microbiota resulting in a decreased or not enhanced final bread volume. No
differences in respect to protein degradation were observed by the addition of the emulsifier
DATEM in sourdough fermentations; the protein deficiency after 24 hours of fermentation
was compensated by supplementation of Vitalkleber at the beginning. The bread volumes
achieved with a 10% dosage of sourdough to the final bread dough were increased by the
usage of both bakery improvers. Therefore, the possibility of bakery improver
supplementation during wheat sourdough fermentations was shown in consideration of
enhanced bread volumes. Aroma and taste analyses should be performed due to increased
values for ethanol in sourdoughs fermented with L. sanfranciscensis and supplemented
Vitalkleber or DATEM, respectively. These analyses should focus also on the shifted
fermentation quotient in favor to lactic acid in sourdoughs fermented with L. sanfranciscensis
by the addition of Vitalkleber.
Future perspectives should focus not only on single enzyme reactions by the sourdough
microbiota, but attention should be paid on an overall screening approach of different
lactobacilli in regard to redox potential during wheat sourdough fermentations. The redox
potential discriminates among species of lactic acid bacteria during fermentations (5). Thus,
an overall perception concerning the reductive or oxidative potential of lactobacilli during
fermentations could lead to the best selection of fermentation organism in respect to the
desired quality parameter.

Chapter 2
62
REFERENCES 1. Adams, M. R., and H. J. Hall. 1988. Growth inhibition of food-borne pathogens by
lactic and acetic acids and their mixtures. Int. J. Food Sci. Techn. 23:287-292. 2. Antes S., W. H. 2000. Quantitative determination and localisation of thiol groups in
wheat flour, Cambridge. 3. Arendt, E. K., L. A. M. Ryan, and F. Dal Bello. 2007. Impact of sourdough on the
texture of bread. Food Microbiol 24:165-174. 4. Brandt, M. J., and M. G. Gänzle (ed.). 2006. Handbuch Sauerteig. Behrs Verlag
GmbH & Co. KG, Hamburg. 5. Brasca, M., S. Morandi, R. Lodi, and A. Tamburini. 2007. Redox potential to
discriminate among species of lactic acid bacteria. Journal of Applied Microbiology 103:1516-1524.
6. C. Thiele, M. G., RF. Vogel. 2002. Contribution of sourdough lactobacilli, yeast, and cereal enzymes to the generation of amino acids in dough relevant for bread flavor. Cereal Chem 79:45-51.
7. CI. Clarke, T. S., P. Dockery, O´Sullivan, EK. Arendt. 2004. Wheat sourdough fermentations: Effects of time and acidification on fundamental rheological properties. Cereal Chem 81:409-417.
8. Clarke, C. I., T. J. Schober, D. Dockery, K. O'Sullivan, and E. K. Arendt. 2004. Wheat sourdough fermentation: Effects of time and acidification on fundamental rheological properties. Cereal Chem 81:409-417.
9. Every, D. 1999. Purification and characterization of ascorbate oxidase from flour and immature wheat kernels. Journal of Cereal Science 30:245-254.
10. Gänzle, M. G., N. Vermeulen, and R. F. Vogel. 2007. Carbohydrate, peptide and lipid metabolism of lactic acid bacteria in sourdough. Food Microbiology 24:128-138.
11. Garay-Arroyo, A., A. A. Covarrubias, I. Clark, I. N ino, G. Gosset, and A. Martinez. 2004. Response to different environmental stress conditions of industrial and laboratory Saccharomyces cerevisiae strains. Appl Microbiol Biotechnol 63:734-741.
12. Gobbetti, M., C. G. Rizzello, R. DiCagno, and M. De Angelis. 2007. Sourdough lactobacilli and celiac disease. Food Microbiol 24:187-196.
13. Graves, T., N. Narendranath, K. Dawson, and R. Power. 2006. Effect of pH and lactic or acetic acid on ethanol productivity by Saccharomyces cerevisiae in corn mash. J. Ind Microbiol Biotechnol 33:469-474.
14. Grosch, W., and H. Wieser. 1999. Redox reactions in wheat dough as affected by ascorbic acid. J Cereal Sci 29:1-16.
15. Hahn, B., and W. Grosch. 1998. Distribution of glutathione in Osborne fractions as affected by additions of ascorbic acid, reduced and oxidised glutathione. Journal of Cereal Science 27:117-125.
16. Hou, W. C., H. J. Liang, C. C. Wang, and D. Z. Liu. 2004. Detection of glutathione reductase after electrophoresis on native or sodium dodecyl sulfate polyacrylamide gels. Electrophoresis 25:2926-31.
17. Hung, J., D. Cooper, M. S. Turner, T. Walsh, and P. M. Giffard. 2003. Cystine uptake prevents production of hydrogen peroxide by Lactobacillus fermentum BR11. FEMS Microbiology Letters 227:93-99.
18. Hung, J., M. S. Turner, T. Walsh, and P. M. Giffard. 2005. BspA (CyuC) in Lactobacillus fermentum BR11 is a highly expressed high-affinity L-cystine-binding protein. Current Microbiology 50:33-37.

Chapter 2
63
19. Imai, T., and T. Ohno. 1995. The relationship between viability and intracellular pH in the yeast Saccharomyces cerevisiae. Appl Environ Microbiol 61:3604-3608.
20. J. Loponen, M. M., K. Katina, T. Sontag-Strohm, H. Salovaara. 2004. Degradation of HMW glutenins during wheat sourdough fermentations. Cereal Chem 81:87-93.
21. K. Pfeilsticker, S. R. 1982. Characterisation of L-ascorbic acid oxidase (EC 1.10.3.3.) from wheat flour. Z. Lebensm. Unters. Forsch. 174:306-308.
22. Kaid, N., L. Rakotozafy, J. Potus, and J. Nicolas. 1997. Studies on the glutathione-dehydroascorbate oxidoreductase (EC 1.8.5.1) from wheat flour. Cereal Chemistry 74:605-611.
23. Knorr, R. 2000. Adaption and stress response of the carbohydrate metabolism of Lactobacillus sanfranciscensis - Biochemical and genetic characterization of key enzymes involved in acetate production. Grauer.
24. Mira, N. P., M. Palma, J. F. Guerreiro, and I. Sà-Correia. 2010. Genome-wide identification of Saccharomyces cerevisiae genes required for tolerance to acetic acid. Microbial Cell Factories 9:1-13.
25. MS. Turner, T. W., LM. Hafner, PM. Giffard. 1999. The bspA locus of Lactobacillus fermentum BR11 encodes an L-cystine uptake system. J. Bacteriol. 181:2192-2198.
26. N. Vermeulen, M. P., M. Ehrmann, MG. Gänzle, RF. Vogel. 2005. Functional characterization of the proteolytic system of Lactobacillus sanfranciscensis DSM20451T during growth in sourdough. Appl Environ Microbiol 71:6260-6266.
27. R. Lo, M. T., DG. Barry, R. Sreekumar, TP. Walsh, PM. Giffard. 2008. Cystathionine-gamma-lyase is a component of cystine-mediated oxidative defense in Lactobacillus reuteri BR11. Journal of Bacteriology 191:1827-1837.
28. Rasmussen, J. E., E. Schultz, R. E. Snyder, R. S. Jones, and C. R. Smith. 1995. Acetic acid as a causative agent in producing stuck fermentations. Am J Enol Viticult 46:278-280.
29. Sherrill, C., and R. C. Fahey. 1998. Import and metabolism of glutathione by Streptococcus mutans. J Bacteriol 180:1454-1459.
30. Stolz, P., G. Böcker, W. P. Hammes, and R. F. Vogel. 1995. Utilization of electron acceptors by lactobacilli isolated from sourdough I. Lactobacillus sanfranciscensis. Z. Lebensm Unters Forsch 201:91-96.
31. Stolz, P., R. F. Vogel, and W. P. Hammes. 1995. Utilization of electron acceptors by lactobacilli isolated from sourdough II. Lactobacillus pontis, L. reuteri, L. amylovorus, and L. fermentum. Z. Lebensm Unters Forsch 201:402-410.
32. Thiele, C., M. G. Gänzle, and R. F. Vogel. 2003. Fluorescence labeling of wheat proteins for determination of gluten hydrolysis and depolymerization during dough processing and sourdough fermentation. J Agric Food Chem 51:2745-2752.
33. Thiele, C., S. Grassl, and M. Ganzle. 2004. Gluten hydrolysis and depolymerization during sourdough fermentation. J Agric Food Chem 52:1307-14.
34. Thomas, K. C., S. H. Hynes, and W. M. Ingledew. 2002. Influence of medium buffering capacity on inhibition of Saccharomyces cerevisiae growth by acetic and lactic acids. Appl Environ Microbiol 68:1616-1623.
35. Turner, M. S., T. Woodberry, L. M. Hafner, and P. M. Giffard. 1999. The bspA locus of Lactobacillus fermentum BR11 encodes an L-cystine uptake system. J Bacteriol 181:2192-2198.
36. Vermeulen, N. 2006. Aroma relevant metabolic activities of lactobacilli during wheat sourdough fermentation. Doctoral thesis at the TU München, Faculty Center of Life Sciences Weihenstephan.

Chapter 2
64
37. Vermeulen, N., J. Kretzer, H. Machalitza, R. F. Vogel, and M. G. Gänzle. 2006. Influence of redoxreactions catalysed by homo- and hetero-fermentative lactobacilli on gluten in wheat sourdoughs. J Cereal Sci 43:137-143.
38. Vermeulen, N., C. Thiele, M. G. Gänzle, and R. F. Vogel. 2003. Presented at the 2nd International Symposium on Sourdough, Brussel, Belgium.
39. Wieser, H. 2003. The use of redox agents. Cauvin SP. ed., Woodhead Publishing Ltd. 40. Wieser, H., N. Vermeulen, F. Gaertner, and R. F. Vogel. 2008. Effects of different
Lactobacillus and Enterococcus strains and chemical acidification regarding degradation of gluten proteins during sourdough fermentation. Eur Food Res Technol 226:1495-1502.

Chapter 3
65
3 3. DISTRIBUTION OF ENZYME ACTIVITIES IN LACTOBACILL I
ABLE TO GENERATE VOLATILE AROMA COMPOUNDS FROM
HYDROXYCINNAMIC ACIDS
Pentosans are the prominent non-starch polysaccharides in respect to the bread production
process (see also chapter 1). The solubility of pentosans (WE-AX and WU-AX) is influenced
by the composition and length of side-chains, the degree of substitution, and the predominant
linkages (1); thus, they could be modified due to degradation caused by endogenous enzymes
or by the activity of sourdough associated microorganisms during fermentation. Those
enzyme activities could account for the degradation of the arabinoxylan backbone during
wheat sourdough fermentations liberating free ferulic acid.
Figure 23. Schematic presentation of enzymes (blue colored) involved in ferulic acid (FA) release and conversion to volatile aroma compounds (red colored). (1) Feruloylesterase, (2) Phenolic acid decarboxylase (Pdc/Pda) (Vogel et al., unpublished). The optimal pH-range of 4-5 for endogenous arabinoxylan degrading enzymes (e.g. α-L-
arabinofuranosidase, β-D-xylosidase, and β-1,4-xylanase) is reached expeditious during

Chapter 3
66
sourdough fermentations. In chemically acidified rye sourdough fermentations a decrease of
the total arabinoxylan content resulted in an increase of WE-AX based on acid hydrolysis (6).
Feruloylesterases [E.C. 3.1.1.73] are a subclass of carboxylic acid esterases [E.C. 3.1.1.1] that
are able to hydrolyze the ester bond between hydroxycinnamic acids and sugars present in the
plant cell walls (51). It is common for esterases to be active on a broad range of substrates.
The use of small, soluble substrates allows the determination of kinetic constants, giving some
information on the affinity and catalytic efficiency (51). Although these enzymes exhibit
different substrate specificities, which may overlap with those of other esterases (e.g. acetyl
xylanesterases, general esterases), they are all specific for the hydrolysis of
hydroxycinnamoyl esters, which is evident from their Km and specific activity values for
hydroxycinnamate esters relative to that for general substrates such as p-nitrophenol acetate
(30). Feruloyl esterases have been purified, overexpressed and characterized from a wide
variety of microorganisms, e.g. A. brasiliensis and A. tubingensis (18), containing the
GXSXG motif, a common conserved sequence in lipases (GHSLG). An extracellular feruloyl
esterase has been isolated and purified from the thermophilic Clostridium stercorarium grown
on birchwood xylan (20), the psychrophilic bacterium Pseudoalteromonas halosplanktis
TAC125 possesses a gene coding for a cold-adapted feruloyl esterase (3). The genes encoding
CinA and CinB from the ruminal bacterium Butyrivibrio fibrisolvens E14 have been
expressed at high levels (15, 16), also a novel recombinant ethyl ferulate esterase from
Burkholderia multivorans has been characterized (45).
Liberated ferulic acid could be further decarboxylated (see also Figure 23) either by microbial
enzyme activities (Pdc/Pda) or during thermal release in the beer production process (11, 50).
The resulting capable phenolic aroma precursors, e.g. 4-vinyl-2-methoxyphenol are
undesirable in the beer or wine production process, but could lead to eligible aroma
components in wheat sourdough fermentations. In earlier fermentation studies with
lactobacilli in nutrient broth supplemented with ferulic acid it was elucidated, that specific
strains liberated clove- and vanilla-like flavors. Hydroxycinnamic acids, e.g. ferulic acid,
caffeic acid, and coumaric acid could be metabolized with the help of lactobacilli during
wheat sourdough fermentations to odor active substances. Besides, 4-vinyl-2-methoxyphenol
(clove-like aroma) originated from decarboxylation of ferulic acid, also 4-ethyl-2-methoxy-
phenol (smoky aroma), vanillin (vanilla aroma), and 2-methoxyphenol (smoky aroma) could
be generated during reduction-, oxidation- and decarboxylation reactions. The production of
vanillin from simple phenols by wine-associated lactic acid bacteria was determined by

Chapter 3
67
Bloem et al. (5). The ferulic acid metabolism via decarboxylation to produce 4-vinylguaiacol
and a further conversion to vanillin as proposed in figure 23 was demonstrated by Li et al.
(34).
In previous studies, the release of ferulic acid during wheat sourdough fermentations with
lactobacilli was shown by Wieser et al. (unpublished). These measurements were performed
in addition to the analyses mentioned in chapter 2.
Figure 24. Content of free ferulic acid during wheat sourdough fermentations with lactobacilli. CHE, chemically acidified dough; SAK, L. sakei sourdough; PLA, L. plantarum sourdough; SAN, L. sanfranciscensis sourdough. The total free ferulic acid content was 2.36 ± 0.05 µg/g dry mass in the flour „Tommi“, and
following initial ferulic acid concentrations of the doughs were determined for the different
approaches: chemically acidified dough 2.55 ± 0.01 µg/g; L. plantarum dough 2.76 ± 0.16
µg/g; L. sakei dough 3.19 ± 0.25 µg/g; and L. sanfranciscensis dough 3.13 ± 0.26 µg/g. The
ferulic acid content from sourdoughs fermented with Lactobacillus sanfranciscensis increased
during a 24 hour period, whereas the free ferulic acid content decreased in the two other
fermented doughs with L. sakei and L. plantarum over the fermentation period; the content of
ferulic acid remained constant in the chemically acidified control. This above-mentioned
result was the starting point for the evaluation of lactobacilli able to release ferulic acid during
wheat sourdough fermentations and further to generate volatile aroma compounds.
By using database analysis the sequenced Lactobacillus genomes were examined for putative
arabinoxylan degrading enzymes to identify distinctive features for the metabolism of plant
cell wall backbone in lactobacilli. The genome of L. brevis ATCC 367 (TMW1.1326) is

Chapter 3
68
harboring two genes for α-L-arabinofuranosidases, and two β-xylosidase genes (see also
appendix, chapter 5). The present study showed the heterologous cloning and biochemical
characterization of a α-L-arabinofuranosidase and β-xylosidase, respectively from
Lactobacillus brevis TMW1.1326. Moreover, the distribution of esterase activity in
lactobacilli was shown able to hydrolyze phenolic acid esters. The physiological tests for
predicted cinnamoyl esterase activity could be ensured on a genetically background. Predicted
esterases of lactobacilli able to hydrolyze esterifies hydroxycinnamates were heterologously
expressed and characterized. Moreover, the fate of the free liberated ferulic acid was verified
by a PCR-screening for phenolic acid decarboxylase genes in selected lactobacilli. In
fermentation studies with lactobacilli using mMRS broth supplemented with ferulic acid,
coumaric acid or wort, the fermentation supernatants were analysed by HPLC to determine
the degradation of the substrates to capable aroma compounds, e.g. 4-vinyl-2-methoxyphenol.

Chapter 3
69
3.1 MATERIALS AND METHODS
3.1.1 Used strains, primer, media, and restriction enzymes
3.1.1.1 Used strains
Table 11. Used microorganisms and their cultivation conditions Strain TMW Cultivation conditions Source, Reference B. subtilis 2.46 LB, 30°C, aerobic DSM 347 W. confusa 1.928 MRS, 30°C, anaerobic ACA-DC 3396 L. amylovorus 1.653 MRS, 37°C, anaerobic SER Sauerteig 1/5 L. amylolyticus 1.1078 MRS, 48°C, anaerobic Hofbräuhaus FS L. zymae 1.943 MRS, 30°C, anaerobic ACA-DC 3411 L. hilgardii 1.1298 MRS, 37°C, anaerobic BöckerKr-E/2 L. brevis 1.1326 MRS, 30°C, anaerobic ATCC 367 L. pentosus 1.10 MRS, 30°C, anaerobic DSM 20314T L. perolens 1.501 MRS, 30°C, anaerobic Gent LAB 1191 L. plantarum 1.460 MRS, 30°C, anaerobic Gent LAB 1146 L. plantarum 1.468 MRS, 30°C, anaerobic Gent LAB 1158 L. spicheri 1.262 MRS, 30°C, anaerobic DSM 15429T L. sanfranciscensis 1.53 MRS, 30°C, anaerobic DSM 20451T
L. sanfranciscensis 1.1304 MRS, 30°C, anaerobic BRS1 L. fructivorans 1.1253 MRS, 30°C, anaerobic DSM 20203T L. farciminis 1.68 MRS, 30°C, anaerobic DSM 20184T L. mindensis 1.1206 MRS, 30°C, anaerobic DSM 14500T L. rossiae 1.164 MRS, 30°C, anaerobic Bier 23, Dr. Vogel L. sakei 1.22 MRS, 30°C, anaerobic LTH 677 L. paralimentarius 1.256 MRS, 30°C, anaerobic DSM 13238 L. alimentarius 1.62 MRS, 30°C, anaerobic DSM 20249T L. casei 1.1250 MRS, 30°C, anaerobic DSM 20001T L. nantensis 1.1265 MRS, 30°C, anaerobic GO-S11 L. helveticus 1.1176 MRS, 37°C, anaerobic DSM 20075T L. delbrueckii 1.1379 MRS, 37°C, anaerobic CLbDb 79 L. johnsonii 1.1179 MRS, 37°C, anaerobic DSM 10533T L. crispatus 1.143 MRS, 37°C, anaerobic Gerti (pig faeces) L. fermentum 1.890 MRS, 37°C, anaerobic WVS 48/B4 L. acidophilus 1.697 MRS, 37°C, anaerobic Nestlé, CRN La1 L. gasseri 1.1173 MRS, 37°C, anaerobic DSM 20243T L. pontis 1.1086 MRS, 37°C, anaerobic DSM 8475T L. pontis 1.1463 MRS, 37°C, anaerobic LTH 4819 L. panis 1.1318 MRS, 37°C, anaerobic Wort isolate L. frumenti 1.103 MRS, 37°C, anaerobic Isolate M. Müller L. reuteri 1.106 MRS, 37°C, anaerobic Isolate M. Müller L. buchneri 1.1162 MRS, 37°C, anaerobic DSM 20057T Bifidobact. lactis 2.462 BIFIDO, 37°C, anaerobic DSM 10140T E. coli TOP10 2.580 LB, 37°C, aerobic Invitrogen TOP10

Chapter 3
70
All lactobacilli strains used in this study are aerotolerant and were incubated under anaerobic
conditions. Broth or agar plates of mMRS were used for cultivation of the strains at the stated
temperatures (see table 11). Dilution streaks were performed on agar plates and incubated for
24 hours to ensure the purity of the cultivated strains. Using the pure dilution streak, a pre
culture of the specific strain in broth was inoculated, and a second culture using 1% of the
first culture was inoculated in 10 ml mMRS. The working culture was then inoculated from
the second culture and incubated overnight. Broth cultures were incubated in sterile, gas-tight
Sarstedt-test tubes (normally 50 ml). Agar plates were incubated in an anaerobic chamber
using 80% of nitrogen and 20% carbon dioxide gas. E. coli strains were incubated aerobically
in Erlenmeyer flasks on a horizontal shaker (220 U/min) in LB-broth at 37°C, for maintaining
plasmids 100 µg x L-1 ampicillin was added.
3.1.1.2 Primers
Table 12. Used primers for PCR and cloning experiments Primer Sequence (5` to 3`) Tm [°C] GASS-Klon-for TAT ACC ATG GTT ATG AAG TTA AAG AAA AAG 63.0 GASS-Klon-rev TAT ATC TAG ACG AAA AGT ATT ATT ATC TTG 61.0 GASS-for1 CTT AAA CTT GGTT GGA AC 49.0 REU-Klon-for TAT ACC ATG GAA ATA ACA ATC AAA CG 60.0 REU-Klon-rev TAT ATC TAG ACG ATT TTT TAA AAA GTT AGC TAC 64.0 REU-for1 CGA CGA TTA AAA ACG ATA C 47.0 PLA-Klon-for TAT ACC ATG GTT ATG ACA TCG ATG GAA TTT AAG 68.0 PLA-Klon-rev TAT ATC TAG AAA TTT AAA CGC GGC CAG TGC TAA 69.0 PLA-for1 TTC TGC GTT TTG ACT TCA 49.0 1890-Klon-for TAT ACC ATG GAA GTT GCA ATC AAG A 61.0 1890-Klon-rev TAT ATC TAG ATT GTT TAA GAA ATC GGC CAC 65.0 1890-Est-for1 GTT TTA AGG GTG ACC TAG 51.0 HELV-Klon-for TAT ACC ATG GTT ATG TCC CGC ATT ACG ATT G 70.0 HELV-Klon-rev TAT ATC TAG ATT AAA CGC AGG TTT TAA AAA TTG C 65.0 HELV-for1 GTT CGT TTT GAT TTT AAT G 46.0 ACID-Klon-for TAT ACC ATG GTT ATG TCT CGC ATTA ACA ATT G 67.0 ACID-Klon-rev TAT ATC TAG ACG AAA TAG GGG CTT CAA AAA TTC 68.0 ACID-for1 CAA ATT AGC CGA TAA CTT A 49.0 pBAD-for CTA CTG TTT CTC CAT ACC CG 58.0 pBAD-rev CTG ATT TAA TCT GTA TCA 44.6 AFN I CCN GGN GGN AAY TTY GT 48.0-58.0 AFN II GGN AAY GAR ATG GAY GG 48.0-56.0 AFC CCA NAC RTT CCA YTC RTC 50.0-58.0 arabino-2-for CAT TAA AAC GTG GTG TTT G 50.2 arabino-2-Klon-for TAT ACT CGA GAT GCA AGG TTC TAC AAA G 62.2 arabino-2-Klon-rev TAT ATC TAG ATT ATC TCG GAG CTT AAA CCG 64.0 b-xyl-1-for CAT TTT GAA GGA TTT GAT C 48.0 b-xyl-1-Klon-for TAT ACC ATG GTT ATG ACT TTA ATT CAA AAT 58.0

Chapter 3
71
b-xyl-1-Klon-rev TAT ATC TAG AAA TTC ATG AGT TAA GTC CTC 60.0 pdc-f GAN AAY GGN TGG GAR TAY GA (17) pdc-r GGR TAN GTN GCR TAY TTY T 50°C PAD-for CCA CAC CGT TGA TTA CCG 56.0 PAD-rev GAT AAG TGG CAT ACT TTT CAC G 56.5 coumaric-for GGC ACA CAC TTT ATY TAC AC 54.2 coumaric-rev TTG RTA AGT GAC CGT AAT TTC 53.0 3.1.1.3 Media and buffers
All the common used media and buffers are listed in the appendix at the end of this thesis (see
chapter 5). Following, specific buffer solutions were used for the determination of the pH-
dependent cinnamoyl esterase-activity using spectrophotometer. The evaluation of the
heterologously in E. coli TOP10 expressed cinnamoyl esterase-activity of predicted
cinnamoyl esterases, after purification using FPLC was performed with the help of a
spectrophotometer (Tecan) measured in a pH-range of 4.0–9.0. The pH-values were gradually
increased with 0.5 steps up to a pH-value of 9.0. For the different pH-ranges the indicated
buffers (see tables 13-16) were used.
Table 13. Used buffer solutions for the pH-dependent determination of cinnamoyl esterase-activity pH-value buffer 4.0-6.0 Citrate buffer 6.5-8.0 Sodium phosphate buffer 8.5-9.0 Tris-HCL-buffer The preparation of citrate buffer was performed, as follows: 21.01 g of citric acid was
dissolved in distilled water, mixed with 200 ml of sodium hydroxide (1 M), and filled up to
1000 ml with distilled water. 100 ml buffer solution with the respective pH-value was
prepared as shown in table 14; the citrate buffer solution – hydrochloric acid (1 M) up to pH-
value of 4.5 and citrate buffer solution - sodium hydroxide (1 M) up to pH-value of 6.0 were
mixed in the appropriate relation according to table 14. The final pH-values of the solutions
were controlled using a pH meter.
Table 14. Preparation of citrate buffer solution in the pH-range of 4.0–6.0 pH Citrate solution in ml Hydrochloric acid in ml Sodium hydroxide in ml 4.0 56.0 44.0 --- 4.5 71.9 28.1 --- 5.0 96.4 --- 3.6 5.5 72.3 --- 27.7 6.0 59.6 --- 40.4

Chapter 3
72
The preparation of sodium phosphate buffer was performed using a mixture of di-sodium
hydrogen phosphate-di-hydrate (Na2HPO4 x 2 H2O) and sodium di-hydrogen phosphate
hydrate solutions (1 M). 177.99 g Na2HPO4 x 2 H2O and 119.98 g NaH2PO4 x H2O were
dissolved in 1000 ml distilled water. 100 ml buffer solution with the respective pH-value was
prepared as shown in table 15; the final pH-values of the solutions were controlled using a pH
meter.
Table 15. Preparation of sodium phosphate buffer solution in the pH-range of 6.5–8.0 pH Na2HPO4 x 2 H2O in ml NaH2PO4 x H2O in ml 6.5 18.2 81.8 7.0 57.7 42.3 7.5 66.1 33.9 8.0 93.2 6.8 The preparation of Tris (hydroxyl methyl)-amino methane – hydrochloric acid buffers (Tris-
HCL) was performed, as follows: 121.14 g Tris-HCL was dissolved in 1000 ml distilled
water. 100 ml buffer solution with the respective pH-value was prepared as shown in table 16;
50 ml Tris-HCL solution was mixed with hydrochloric acid (1 M) and distilled water. The
final pH-values of the solutions were controlled using a pH meter.
Table 16. Preparation of Tris-HCL buffer solution in the pH-range of 8.5–9.0 pH Tris-HCL in ml Hydrochloric acid in ml Distilled water in ml 8.5 50.0 14.7 35.3 9.0 50.0 5.7 44.3 The prepared buffer solutions were stored at 4°C; a defined amount of substrate was added to
the buffer solutions to evaluate the predicted cinnamoyl esterase activity.
3.1.1.4 Plasmids and general molecular techniques
The plasmid pBADB/Myc-His B (Invitrogen) was used for all cloning approaches in E. coli
TOP10 (see also chapter 5.1.6). General techniques regarding cloning, DNA manipulations,
and agarose gel electrophoresis were performed as described by Sambrook et al. (48)
Chromosomal DNA of Lactobacillus strains were isolated according to the method of
Lewingston et al. (33), and E. coli plasmid DNA was isolated with the PegGold plasmid
miniprep kit I from Peqlab GmbH (Erlangen, Germany). Restriction endonuclease digestions
and ligations with T4-DNA ligase were performed following the recommendations of the
supplier (Fermentas, St. Leon-Rot, Germany). PCR was carried out in thermocyclers (Primus
96plus, MWG-Biotech, Ebersberg, Germany) by using Arrow-Taq Polymerase and dNTP’s

Chapter 3
73
from MP Biomedicals (Heidelberg, Germany). PCR-products were purified using the
QIAquick PCR Purification Kit (Qiagen, Hilden, Germany). Sequencing of PCR products or
plasmids was performed by GATC. Transformations were performed with a Bio-Rad gene
pulser apparatus (Bio-Rad Laboratories, USA) in 0.2 mm cuvettes (Biozym Scientific GmbH,
Germany) at 2.5 kV, 25 µF and 200 Ω for E. coli. Electro competent E. coli cells were
prepared according to chapter 5.1.8.
Following restriction endonucleases were used in this study: Nco I, Xho I, Xba I (Fermentas).
3.1.2 Preparation of mMRS-media with supplemented ethyl ferulate (EF)
For cultivation of lactobacilli mMRS-media was prepared according to chapter 5.1.7. Ethyl
ferulate was dissolved in DMSO and sterile filtered; ethyl ferulate (final concentration of
0.1%) was added to 50 ml mMRS broth and inoculated with 1 ml overnight grown
Lactobacillus suspension for fermentation studies.
3.1.3 Predicted cinnamoyl esterase activity of lactobacilli determined with plate
screening assay
Cinnamoyl esterase activity in lactobacilli was evaluated using mMRS agar plates
supplemented with 0.1% ethyl ferulate. Solidified agar plates showed a distinct turbidity due
to existence of ethyl ferulate. The screening assay was performed with sterile sensi-discs (BD
Diagnostics, Germany) wetted with 20 µl of an overnight grown culture of the specific
Lactobacillus strain, placed in the middle of an agar-plate. The prepared plates were incubated
for three days under anaerobic conditions at the appropriate temperatures. The predicted
cinnamoyl esterase activity was measured as the diameter of a clearing zone around the point
of inoculation expressed in millimeters. LB agar-plates supplemented with 0.1% ethyl
ferulate, 75 µg x L-1 ampicillin for maintaining plasmids, and a final concentration of 2 mM
arabiniose were used for the determination of recombinant cinnamoyl esterase activity in E.
coli TOP10.
3.1.4 Fermentations with different lactobacilli in broth supplemented with cinnamic acid
derivatives
The existence of cinnamoyl esterase activity in lactobacilli was evaluated in fermentation
approaches using different cinnamic acid derivatives, e.g. ethyl ferulate, methyl coumarate,
and methyl caffeate, respectively. Fermentations were performed in 50 ml Erlenmeyer flasks
with mMRS broth inoculated with 1 ml of an overnight grown pre culture. The incubation of

Chapter 3
74
the flasks was performed on a horizontal shaking device (140-150 U/min) to ensure a steady
mixture of the sample. The final concentration of methyl caffeate, methyl coumarate, and
ethyl ferulate was 2 mM. The substances were dissolved in DMSO, sterile filtered and then
supplemented to the broth.
3.1.4.1 Extraction of the phenolic end-products after fermentation
After three days of fermentation the samples were centrifuged at 7.000 U/min and 4°C for ten
minutes. The supernatant was poured off, and extracted with methyl tert-butyl ether (MTBE)
under vigorous shaking in a ratio of 1:1. The upper phase was removed after separation and
collected in an Erlenmeyer flask; the extraction process was conducted twice to achieve a
higher yield of phenolic compounds. Subsequently, the samples were poured through a folded
filter and carried over in a round bottom flask. The flask was attached to a rotary evaporator;
the samples were evaporated under rotation in a water bath at 45°C and negative pressure of
300-400 mbar. Finally, the concentrated samples were flushed with nitrogen till complete
dryness, and then resuspended in 1.5 ml methanol.
3.1.4.2 Thin layer chromatography for the determination of phenolic compounds
The degradation of ethyl ferulate, methyl caffeate, and methyl coumarate by the selected
lactobacilli during fermentation was visualized using thin layer chromatography (TLC).
Standard solutions (final concentration of 10 mM) were prepared of the expected end-
products, e.g. ferulic acid, coumaric acid, and caffeic acid, respectively. The TLC analyses
were performed on silica gel plates 60 WF254S (Merck), 10 µl of standard solutions and 10
µl of sample solutions were applied to the plates. The mobile phase consisted of chloroform,
methanol, and formic acid in a ratio of 85:15:1 (v/v/v), the TLC chamber was saturated with
the mobile phase at least one hour before analysis. After separation and developing, plates
were dried in the air under a safety cabinet. Phenolic compounds were visualized under
ultraviolet light (254 nm).
3.1.5 Purification of heterologously expressed protein using FPLC
700 ml LB broth supplemented with 100 µg x L-1 ampicillin in an Erlenmeyer flask was
inoculated 1% with overnight grown pre culture and incubated on a horizontal shaking device
at 220 U/min and 37°C up to an optical density of 0.6-0.7 for the heterologous expression of
the recombinant proteins. The E. coli TOP10 culture was shaken after supplementation of

Chapter 3
75
arabinose (final concentration of 1 mM) for 4 hours at 30°C. The cultures were centrifuged
(6000 rpm, 10 minutes, 4°C), and the cell pellet was resuspended in 50 ml buffer A
(application buffer, 20 mM NaH2PO4, 500 mM NaCl, 50 mM imidazole, and pH-value of
7.4). Subsequently, one washing step with buffer A was performed, and the cell pellet was
then resuspended in 10 ml buffer A, all washing steps were performed at 4°C with cooled
buffer A. The cells were solubilized with a Sonoplus Homogeniser HD2070 (Bandelin,
Bering) to liberate crude cellular extracts (cycle 0.5/90%/20 s); cell suspensions on ice were
treated five-times as stated with breaks lasting at least two minutes. Finally, the crude cellular
extracts were centrifuged for 15 minutes at 4°C and 12.000 U/min to separate the
heterologously expressed proteins from cell debris. The purifications of the recombinant
proteins were performed with FPLC (Fast Protein Liquid Chromatography) and the usage of
HisTrap HP-affinity columns (see also manufacturer’s instructions, Amersham Biosciences).
5 ml of the crude cellular extract was applied to the 5 ml loop of the FPLC, and a
computerized concentration gradient between buffer A and buffer B (elution buffer, 20 mM
NaH2PO4, 500 mM NaCl, 500 mM imidazole, and pH-value of 7.4) performed the
purification run. While target protein was bound to the column due to the His-tag, residual
crude proteins were flushed out in a washing step of five minutes (2 ml/min) with buffer A. A
gradient program was performed from 100% buffer A and 0% buffer B to 0% buffer A to
100% buffer B in ten minutes (2 ml/min). Release of the target protein was achieved from the
His-Trap column by running the program for five minutes (2 ml/min) with 100% buffer B.
Protein-rich fractions were determined based on peak identification in the elution diagram;
these fractions were immediately kept on ice till further analyses were conducted. The eluate
was dialyzed (VISKING®, dialysis tubing 20/32) against 0.1 M sodium phosphate buffer (pH
7.0) at 4 °C. After 4 hours the buffer was exchanged and the dialyses was performed
overnight. Determination of protein concentrations (7) and SDS-PAGE was performed
according to chapter 5.1.9.
3.1.6 Determination of predicted cinnamoyl esterase activity of the purified recombinant
proteins using spectrophotometer
The determination of activity according to Michaelis-Menten was performed with the
substrate p-nitrophenyl acetate (p-NPA) by using a spectrophotometer (Tecan). P-nitrophenyl
acetate is an achromatic, crystalline substance; p-nitrophenyl and acetate is generated after
hydrolysis of p-NPA. In aqueous solutions a yellow color occurs, the absorption optimum of

Chapter 3
76
p-nitrophenyl is 400 nm and the solubility in water is 16 g/l at 25°C. The substrate was often
used for cinnamoyl esterase activity determinations, because of the sterical similarity to
ferulic acid (22, 31, 45). The activity determination of the purified heterologous expressed
proteins was performed in 100 mM sodium phosphate buffer with a pH-value of 7.0 at
ambient temperature. Serial dilutions were prepared of the substrate ranging from 0.075 mM
to 4.0 mM. 2 µl of sample was pipetted to 200 µl of substrate-sodium phosphate buffer. The
liberated p-nitrophenyl was measured at 405 nm using a spectrophotometer; sodium
phosphate buffer without supplemented substrate served as a reference. The activity of the
predicted cinnamoyl esterases against the substrate p-NPA was measured in 50 cycles every
20 seconds at 405 nm. A calibration curve up to 5 mM was erected out of a serial dilution of
p-nitrophenyl. Km und Vmax-values were evaluated after the concentration determination of
liberated p-nitrophenyl using SigmaPlot 10.0. All analyses were performed in triplicate.
3.1.6.1 Determination of pH-dependent esterase acitivity
Evaluation of pH-dependent esterase activity was determined with the indicated buffer
systems according to chapter 3.1.1.3. A pH-range of 4.0-9.0 was covered by using the
different buffer systems, e.g. citrate buffer, sodium phosphate buffer, and Tris-HCL buffer,
respectively. The model substrate p-nitrophenyl acetate was used to perform the pH-
dependent activity tests. The samples were prepared as mentioned under chapter 3.1.6; all
analyses were measured over 50 cycles every 20 seconds at 405 nm in triplicate.
3.1.6.2 Determination of substrate side chain length-dependent esterase activity
Evaluation of side chain-dependent esterase activity of the heterologous expressed predicted
cinnamoyl esterases was determined using p-nitrophenyl acetate (p-NP-C2), p-nitrophenyl
butyrate (p-NP-C4), and p-nitrophenyl caprylate (p-NP-C8) as a substrate. All measurements
were performed in sodium phosphate buffer (pH-value of 7.0) at ambient temperature. The
samples were prepared as mentioned under chapter 3.1.6; all analyses were measured over 50
cycles every 20 seconds at 405 nm in triplicate.
3.1.6.3 Determination of temperature-dependent esterase activity by using HPLC
The evaluation of the temperature-dependent activity of the heterologous expressed predicted
cinnamoyl esterases was performed in a temperature range of 20°C, 30°C, 35°C, 40°C, 45°C,
50°C, and 60°C. Following recombinant esterases of lactobacilli were used for the

Chapter 3
77
temperature-dependent characterization: L. reuteri TMW1.106, L. gasseri TMW1.1173, L.
acidophilus TMW1.697, and L. plantarum TMW1.460. Ethyl ferulate as the substrate was
mixed in a reaction approach with the FPLC-purified esterases. For evaluation purposes of the
chromatograms different standard solutions of ethyl ferulate and ferulic acid were compared
with retention times resulted from reactions with the purified esterases and ethyl ferulate as a
substrate. The reaction mixture was prepared as follows: 900 µl sodium phosphate buffer (pH-
value of 7.0), and 100 µl 100 mM ethyl ferulate in methanol (final concentration 10 mM)
were mixed, and the enzyme kinetic reaction was started after the addition of 10 µl purified,
dialyzed protein fraction. Before, the amount of added protein was determined according to
Bradford (8); therefore, all approaches were performed with a standardized protein
concentration. The reactions were stopped by using a heating block thermostat at 95°C.
Empty 1.5 ml reaction tubes were incubated at 95°C, 500 µl reaction mixtures were pipetted
into the empty reaction tubes followed by the addition of 500 µl methanol at the end of the
reaction time. The reaction inactivation was continued for 2-3 minutes at 95°C. The
inactivated mixture was transferred to HPLC vials by using a sterile syringe and filtration
through a 0.2 µl filter. HPLC analyses were performed according to chapter 3.1.9.1.
3.1.7 Determination of α-L-arabinofuranosidase and xylosidase activity of the purified
recombinant proteins using spectrophotometer
The evaluation of the temperature and pH-dependent activity of the purified, heterologous
expressed enzymes was performed with substrate solutions of para-nitrophenyl arabinofurano-
side (p-NP-ara), and para-nitrophenyl xylopyranoside (p-NP-xyl) in sodium phosphate buffer,
respectively. 20 µl of sample was pipetted to 200 µl of substrate-sodium phosphate buffer
(final concentration of substrate 2 mM). The liberated p-nitrophenyl was measured at 405 nm
using a spectrophotometer; sodium phosphate buffer without supplemented substrate served
as a reference. Determination of the temperature-dependent activity up to 40°C was
performed directly in the spectrophotometer; higher temperatures were not supported by the
apparatus. For temperature-dependent activity characterization above 40°C, the reactions were
performed in 1.5 ml test tubes and the usage of a water bath. The liberated p-nitrophenyl was
measured also in the spectrophotometer. The pH-dependent activity was evaluated according
to chapter 3.1.1.3 and chapter 3.1.6.1, respectively. Kinetic parameters of the purified
enzymes were determined by the addition of increasing concentrations from 0.5 mM to 4.5
mM of p-NP-ara and p-NP-xyl; the enzymatic activity [mmol/l] was measured in 20 cycles

Chapter 3
78
every 10 seconds at 405 nm. Km und Vmax-values were evaluated after the concentration
determination of liberated p-nitrophenyl using SigmaPlot 10.0. All analyses were performed
in triplicate.
3.1.7.1 Thin layer chromatography for the determination of pentose monosaccharides
The degradation of arabinan, xylan, and wheat arabinoxylan by the recombinant enzymes
from L. brevis TMW1.1326 was visualized using thin layer chromatography (TLC). Standard
solutions (final concentration of 10 mM) were prepared of the expected end-products, e.g.
arabinose, and xylose, respectively. The TLC analyses were performed on silica gel plates 60
WF254S (Merck), 10 µl of standard solutions and 10 µl of sample solutions were applied to
the plates. The recombinant enzymes ara-2 and xyl-1 were added to sodium phosphate buffer
(0.1 M) supplemented with arabinan, xylan, or wheat arabinoxylan (final concentration 10
mM). The reactions were stopped after 6 hours by using a heating block thermostat at 95°C.
The mobile phase consisted of ethyl acetate, acetic acid, and water in a ratio of 2:1:1 (v/v/v),
the TLC chamber was saturated with the mobile phase at least one hour before analysis. After
separation and developing, plates were dried in the air under a safety cabinet. Sugars were
visualized after spraying the TLC plates with 5% sulphuric acid in ethanol (v/v), followed by
heating in a dry oven for 10 minutes at 120°C.
3.1.8 Sequencing of the cloned genes into the expression vector pBAD-MycHis B
Extraction of the pBAD-Myc His B vector hosting the cloned genes was achieved with
peqGOLD plasmid miniprep Kit 1 according to manufacturer’s instruction. The evaluation of
plasmid-DNA amount in the samples was determined by using Nanodrop (peqLAB
Biotechnology GmbH). The sequencing of the purified vectors was conducted by GATC
Biotech AG (Konstanz, Germany) with the help of primer pBAD-for. The results of the DNA-
sequencing were translated into amino acid sequences by using Transeq (EMBL) and
alignment was achieved with known sequences for hydrolases/esterases in the databases with
the program ClustalW (EMBL).
3.1.9 Screening of phenolic acid decarboxylase genes using PCR and verification of
decarboxylase activity in lactobacilli
Genomic DNA of lactobacilli was used as a template in PCR with primers according to table
12. In previous studies, PCR was performed with primers pdc-f and pdc-r according to de las
Rivas (17). All PCR´s were performed as stated in annex chapter 5, with the specific
Chapter 3
79
annealing temperatures of the respective primers. The activities of decarboxylases were
determined in fermentations with lactobacilli in MRS broth supplemented with ferulic acid
(FA) and coumaric acid, respectively. The degradation of the substrates and the accumulation
of active aroma compounds were analyzed by using HPLC.
3.1.9.1 HPLC analysis of volatile aroma compounds after fermentations with lactobacilli in
MRS supplemented with hydroxycinnamates
MRS broth supplemented with 0.5 mM ferulic acid and coumaric acid (stock solution of 250
–500 mM in ethanol), respectively, was fermented under the stated conditions in table 11 with
lactobacilli for 72 hours. After 24, 48, and 72 hours of fermentation samples were drawn,
filtered and analysed by using HPLC. The growth and purity of the fermentation flora was
determined by pH-measurements and evaluation of the total plate count. The supernatants of
the fermentations with broth supplemented with hydroxycinnamates and wort were analyzed
by reverse phase HPLC. The analyses were performed with a Dionex Ultimate 3000
apparatus, equipped with a C18 RP column (Phenomenex Kinetex 100 mm x 4.6 mm, 2.6
µm), a column oven heated up to 30°C, and a UV-detector adjusted to following wavelengths:
260 nm, 280 nm, 300 nm, 320 nm. The flow rate was 1.3 ml/minute; the mobile phase
consisted of eluent A (750 ml MeOH + 240 ml H2O + 10 ml o-phosphoric acid) and eluent B
(H2O), the separation was achieved by following gradient program: 0-3 mins: 55% eluent B;
3-4.7 mins: 35% eluent B; 4.7-7.03 mins: 20% eluent B; 7.03 mins: 55% eluent B.
3.1.10 Wort fermentations with a combination of aroma active starter cultures
Subsequently, combinations of strains were defined for wort fermentations after evaluation of
the PCR results in the screening approach for decarboxylases. Wort as a substrate is similar to
liquid sourdough. The fermentations were performed with wort (approximately 16°P) from
the “Bayerische Staatsbrauerei Weihenstephan” – Weihenstephaner Original beer. 30 ml wort
was inoculated with 1 ml of an overnight grown pre culture, washed onetime with sterile tap
water in a 100 ml Erlenmeyer flask. The Erlenmeyer flasks were wrapped in aluminum foil,
closed with a cotton ball and incubated at 27°C without shaking for 120 hours (5 days). The
accumulated aroma compounds were analyzed by HPLC at t=0, one day, two days, three
days, and at the end of the fermentation period after five days. The growth and purity of the
fermentation culture was confirmed by pH-measurements after 24 hours and at the end of the
fermentation period; furthermore, the total plate count was evaluated after 24 hours of

Chapter 3
80
fermentation. In parallel, a chemically acidified (pH 3.3-adjusted with lactate) control
fermentation was also analyzed.
3.1.11 Sourdough fermentations with Lactobacillus pontis TMW1.1086
Sourdoughs were prepared with 20 g flour (type 550, brand Rosenmehl), 29 ml tap water, and
10 ml pre-washed culture of L. pontis supplemented with 0.1 g/l cycloheximide. Overnight
grown cultures of L. pontis were centrifuged (5000 rpm, 10 mins, ambient temperature), and
the supernatant was discarded. The cells were washed onetime with 10 ml tap water and
finally resuspended in 10 ml tap water. The sourdough was inoculated with approx. 107-108
cfu/g dough. The sourdoughs were prepared in 200 ml Erlenmeyer flasks and incubated for 48
hours at 37°C. Dough samples were sent to FSI for active aroma compound analyses by using
GC/MS.

Chapter 3
81
3.2 RESULTS
3.2.1 Determination of predicted cinnamoyl esterase activity in lactobacilli
Screening of the selected lactobacilli in respect for predicted cinnamoyl esterase activity
showed the formation of a clearing zone around the point of inoculation using agar plates
supplemented with ethyl ferulate after three days of incubation. Remarkably, the thermophilic
lactobacilli showed the highest activities, e.g. L. acidophilus, L. johnsonii, L. helveticus, L.
fermentum, and L. reuteri, respectively. Two exceptions were found, L. brevis and L. rossiae,
they showed also a certain activity after incubation at 30°C.
Table 17. Screening for cinnamoyl esterase activity in lactobacilli with mMRS agar plates supplemented with 0.1% ethyl ferulate and ethyl coumarate (final concentration). +++: high activity, > 20 mm diameter; ++: average activity, < 20 mm diameter; +: low activity, <10 mm diameter; -: no activity; n.d.: not determined. Red colored are the lactobacilli used for cloning and screening experiments. Strain TMW Cinnamoyl esterase activity Ethyl ferulate Ethyl coumarate B. subtilis 2.46 +++ n.d. L. brevis 1.1326 ++ + L. nantensis 1.1265 + n.d. L. helveticus 1.1176 ++ n.d. L. casei 1.1250 - n.d. L. buchneri 1.1162 - n.d. L. alimentarius 1.62 + n.d. L. reuteri 1.106 ++ n.d. L. frumenti 1.103 + n.d. L. paralimentarius 1.256 - n.d. L. rossiae 1.162 ++ n.d. L. mindensis 1.1206 - n.d. L. pontis 1.1463 - + L. pontis 1.1086 ++ n.d. L. panis 1.1318 + n.d. L. farciminis 1.68 + n.d. L. gasseri 1.1173 ++ n.d. L. acidophilus 1.697 +++ n.d. L. fermentum 1.890 ++ n.d. L. fructivorans 1.1253 - n.d. L. crispatus 1.143 - n.d. L. sanfranciscensis 1.53 + n.d. L. sanfranciscensis 1.1304 ++ n.d. L. spicheri 1.262 + n.d. L. plantarum 1.460 + ++ L. plantarum 1.468 ++ ++ L. johnsonii 1.1179 +++ n.d.

Chapter 3
82
L. delbrueckii 1.1379 - n.d. L. perolens 1.501 - n.d. L. amylolyticus 1.1078 + n.d. L. amylovorus 1.653 + n.d. L. hilgardii 1.1298 - n.d. L. pentosus 1.10 + n.d. L. sakei 1.22 - n.d. L. zymae 1.943 ++ n.d. W. confusa 1.928 - n.d. The sizes of the clearing zone and therefore the esterase/hydrolase activities varied between 0
mm, e.g. L. casei TMW 1.1250, and 60 mm in screenings with L. johnsonii TMW1.1179.
Some strains, e.g. L. casei, L. buchneri, L. paralimentarius, L. mindensis, L. fructivorans, L.
crispatus, L. delbrueckii, and L. perolens exhibited no feruloyl esterase activity in the plate
screening method with ethyl ferulate. Either their genetic background is not capable to
hydrolyze ethyl ferulate or the enzyme is not transcribed. Furthermore, present phenolic
compound concentrations could have an inhibitory effect on specific lactobacilli; their growth
on the sensi-disc was prevented by the selected concentration of 0.1% ethyl ferulate.
3.2.2 Heterologously expression of predicted hydrolases/esterases from lactobacilli and
characterizations of the recombinant enzymes
Based on the executed plate screenings from chapter 3.2.1 with different lactobacilli and ethyl
ferulate as a substrate, the sequenced Lactobacillus genomes were examined for putative
hydrolases/esterases able to release bonded hydroxycinnamates using database analysis
(BlastX, EMBL-Heidelberg). Predicted cinnamoyl esterases of different lactobacilli were
aligned for homologous regions by ClustalW. The conserved regions of predicted esterases
from L. helveticus (Accession YP_001578032), L. acidophilus (YP194675), L. gasseri
(YP815563), L. plantarum (YP_004890534), L. reuteri (YP_001842568), and L. fermentum
(YP_001844134) could be clearly seen (see figure 25). The amino acid sequences of two
cinnamoyl esterases from L. johnsonii were aligned together with the above mentioned
sequences. Following sequences accordance could be seen on amino acid level for the L.
johnsonii cinnamoyl esterase (Accession No. ADD11991, (31, 32)) by using the database
BlastP:
- L. gasseri (YP 815563): 88% Identities; 95% Positives, 0% Gaps on 249 amino acids (aa). - L. acidophilus (YP 194675): 70% Identities; 84% Positives, 0% Gaps on 244 aa. - L. helveticus (YP_001578032): 70% Identities; 81% Positives, 2% Gaps on 248 aa. - L. plantarum (YP_004890534): 52% Identities, 68% Positives, 2% Gaps on 238 aa. - L. reuteri (YP_001842568): 49% Identities, 65% Positives, 2% Gaps on 249 aa.

Chapter 3
83
- L. fermentum (YP_001844134): 50% Identities, 67% Positives, 2% Gaps on 222 aa.
L.johnsonii2 ------------METTIKRDGLNLHGLLEGTDKIENDTIAILMHGFKGDLGYDDSKILYA 48 L.reuteri -----------MMEITIKRDGLKLYGLLEGTTTIKNDTIAILMHGFKGNLGYDDSKILYA 49 L.fermentum ------------MEVAIKSAGLTLRGLLEGSNQVPNDRIAILMHGFKGDLGYTEENLLNQ 48 L.plantarum ---------MTSMEFKIKRDGLALQARLE-TPAAPSSTLVILMHGFTADMGYDTTQFVPQ 50 L.johnsonii1 -----------MATITLERDGLQLVGTREEPFGEIYD-MAIIFHGFTANR---NTSLLKE 45 L.gasseri MKLKKKKVGIYMATITIERDGLNLVGTREEPFGEIYD-MAIIFHGFTANR---NTPLLKE 56 L.acidophilus -----------MSRITIERDGLTLVGDREEPFGEIYD-MAILMHGFTANR---NTPLLRQ 45 L.helveticus -----------MSRITIERDGLTLVGDREEPFGEIYD-MAIIMHGFAANR---NTDLLRQ 45 :: ** * . * . . :.*::*** .: :: L.johnsonii2 LSHYLNDQGLPTIRFDFDGCGKSDGKFEDMTVYSEILDGIKILDYVRNTVKAKHIYLVGH 108 L.reuteri LSHYLNQQGIPTLRFDFDGTGHSDGEFKDMTVFSEILDGMKIIDYAHTTMQAKKIYLIGH 109 L.fermentum LAHRLNDQGLATLRFDFAGCGKSDGRFSDMTVLSELQDGMKIIDYARQEVQAKEIILVGH 108 L.plantarum LAQALVAHGLAVLRFDFNGHGCSEGRFQDMTVINEIADAKAVLDEA-LTLHYDHIVLAGH 109 L.johnsonii1 IANSLRDENIASVRFDFNGHGDSDGKFENMTVLNEIEDANAILNYVKTDPHVRNIYLVGH 105 L.gasseri IADELRDENIASVRFDFNGHGDSDGKFENMTVLNEIEDANAILNYVKTDPHVRNIYLVGH 116 L.acidophilus IADNLRDENVASVRFDFNGHGESDGAFEDMTVCNEIADAQKILEYVRTDPHVRNIFLVGH 105 L.helveticus IADDLRDENVASVRFDFNGHGESDGKFEDMTVCNEIADGKAILDYVRTDPHVRDIFLVGH 105 ::. * ..:. :**** * * *:* *.:*** .*: *. ::: . : .* * **
α/β subdomain L.johnsonii2 SQGGVVASMLAGYYRDVIEKLALLSPAATLKSDALDGVCQGSTYDPTHIPETVNVS---- 164 L.reuteri SQGGVVASMLAAYYRDIITKLVLLAPAATLKDDALKGVCQGSQYDPNHIPETVDVH---- 165 L.fermentum SQGGVVASMLAAYYRDVIDKLVLLAPAATLKDDALIGTCQGTTYDPNHIPDYVTVG---- 164 L.plantarum SQGGVVASMLAGYYPDVVDKLILMAPAATLKSDAQQGVLQGATYDPQHIPAYLNIRD--- 166 L.johnsonii1 SQGGVVASMLAGLYPDLIKKVVLLAPAATLKSDALEGNTQGVTYNPDHIPDRLPFKD--- 162 L.gasseri SQGGVVASMLAGLYPDIIKKVVLLAPAATLKTDALNGSTQGVKYNPDHIPDRLPFKD--- 173 L.acidophilus SQGGVVASMLAGLYPDIVKKVVLLAPAAQLKDDALNGDTQGATYNPEHIPAAIPFHG--- 162 L.helveticus SQGGVVASMLAGLYPDVVKKVVLLAPAAQLKDDALRSNTQGATYDPNHIPDVVPLVGNKL 165 ***********. * *:: *: *::*** ** ** . ** *:* *** : . L.johnsonii2 GFEVGGAYFRTAQLLPIYQTAEHYNRETLLIHGLADKVVSPNASRKFHTLLPKSELHLIP 224 L.reuteri GFTVGGDYFRTAQLLPIYETAQHYSGPTLLIHGLADNVVSPEASKKYNVIMPNSELHLIP 225 L.fermentum GFKVGGDYFRTAQLLPIYETAQHYAGPVLMIHGLADTVVDPKASQKYNVMYQNGVIHFLE 224 L.plantarum GLKVGGFYLRTAQQLPIYEVAQQYAGSVTLIHVTADTVVSPQASEKYHEVYQHSQLHWVQ 226 L.johnsonii1 -LTLGGFYLRIAQQLPIYEVSAQFTKPVCLIHGTDDTVVSPNASKKYDQIYQNSTLHLIE 221 L.gasseri -LTLGGFYLRIAQQLPIYEVSVHFTRPVCLIHGANDTVVSPDASKKYDQVYENSTLHLVE 232 L.acidophilus -KKLGGFYLRTAQVLPIYEIAKHYTNPVSIIVGSNDQVVAPKYSKKYDEVYENSELHMVP 221 L.helveticus GMKLGGFYLRTAQVLPIYEVSQCFTRPVSVIAGTNDQVVDPKYAKKYDEVYENSELHMIP 225 :** *:* ** ****: : : . :* * ** *. :.*:. : :. :* : L.johnsonii2 DEGHMFNGK--NRPEVLKLVGEFLIK---- 248 L.reuteri EEGHMFNGS--RRQEILELVANFLKN---- 249 L.fermentum GASHQLRGDGDQRETTLQLVADFLN----- 249 L.plantarum DGGHRFSGD--ARATAIQLALAAFK----- 249 L.johnsonii1 GADHCFSDS--YQKNAVNLTTDFLQNNNAF 249 L.gasseri GADHSFTDT--YQKTAADLTAEFLQDNNTF 260 L.acidophilus DADHSFTGQ--YKDSAVDLTAEFLKP--LF 247 L.helveticus NADHRFSGG--YKDMAADLTAQFLKP--AF 251 .* : . : .*. :
Figure 25. Alignment of predicted cinnamyol esterases from different genome sequenced lactobacilli – all six proteins, besides the L. johnsonii ones were heterologously expressed in E. coli and characterized. An asterix indicates a position with a fully conserved amino acid residue; a colon indicates a position with a fully conserved strong group and a period indicates a position with a fully conserved weaker group. Red colored is the consensus sequence motif for carboxyl esterases Gly-x-Ser-x-Gly (x represents an arbitrary amino acid residue); blue marked is the presumed catalytic triad (Ser – His – Asp). Grey shaded: α/β-subdomain; brown marked are the amino acids of the hydrophobic cavity; green marked are amino acids responsible for substrate binding in the α/β-subdomain of the cinnamoyl esterases.

Chapter 3
84
The sequence motif GHSQG is also present in a cinnamoyl ester hydrolase from the ruminal
bacterium Butyrivibrio fibrisolvens El4 (15, 16). DNA sequences for predicted esterases in the
genomes from L. brevis ATCC367 and L. johnsonii (see Accession No. ADD11991 and
ADD11992 correspondent to (31, 32)) showed also a similar motif as the mentioned above.
However, the specific genes were cloned in E. coli TOP10, but the recombinant proteins
exhibited no activity after separation and purification; therefore, the genetic background for
the clearing zones in plate screening methods with ethyl ferulate and these strains (see table
17) could not be biochemically verified.
All aligned amino acid sequences showed distinct features of cinnamoyl esterases; the
inserted α/β-subdomain was previously identified as a prominent structure necessary for
phenolic ring building and the formation of the catalytic pocket. The active site is formed by
the classical triad of Ser, His, and Asp (21), the role of His is to deprotonate Ser so that Ser
can perform a nucleophilic attack on the carbon atom of the carbonyl group of the
hydroxycinnamates, while Asp stabilizes the protonated His (32). The 4-hydroxyl group
(ethyl ferulate, ferulic acid, and caffeic acid) and 3-hydroxyl group (caffeic acid) of the
aromatic ring of the substrates are hydrogen bonded to Asp and Tyr, respectively (green
marked, see figure 25). Moreover, Asp and Gln from the inserted α/β-subdomain are
important in recognizing the caffeic and feruloyl esters (32). The structure of the α/β-
subdomain is also important for holding the phenolic ring of the phenolic esters in the correct
position, site-directed mutagenesis of the subdomain showed the assumption; no activity was
detected with any of the phenolic esters as a substrate for the predicted cinnamoyl esterase of
L. johnsonii (32). SignalP program results showed that there were no predicted signal peptides
available for all above listed amino acid sequences (data not shown).
3.2.2.1 Verification of the heterologous expression using SDS page gel and activity
determination using mMRS plates supplemented with ethyl ferulate
As an example, the cloning success, and therefore, the heterologous expression of the
predicted cinnamoyl esterase of L. plantarum TMW1.460 was shown after purification using
FPLC and separation of the protein rich fraction. SDS gel was prepared with a molecular
marker (100 bp ladders), crude cellular extract of L. plantarum, and the predicted cinnamoyl
esterase of L. plantarum (data not shown). The definitive mass of the enzymes was
determined with the help of ExPASy (Swiss Institute of Bioinformatics). The heterologously

Chapter 3
85
expressed predicted cinnamoyl esterases (see chapter 3.2.2) from the lactobacilli had similar
pI ranging from 5.04 – 5.78, and theoretical Mw ranging from 27.1-28.9 kDa.
Figure 26. Plate assay with LB agar and supplemented ethyl ferulate (0.1%). (A) Control with E. coli TOP10 hosting the vector pBAD/Myc-His B without insert; (B) E. coli TOP10 with pBAD/Myc-His B and the cloned predicted cinnamoyl esterase from L. plantarum TMW1.460. The plate assay was performed with LB agar plates supplemented with ethyl ferulate (final
concentration 0.1%), 75 ppm ampicillin and arabinose (final concentration 1 mM). The sensi-
discs were wetted with 20 µl E. coli TOP10 cells and incubated aerobically at 37°C for two
days. The cloning success of the predicted cinnamoyl esterase from L. plantarum TMW1.460
(exemplary for all cloning approaches) could be seen in figure 26, due to an intact
recombinant cinnamoyl esterase a clearing zone around the point of inoculation was observed.
3.2.2.2 Enzyme kinetics of the heterologously expressed cinnamoyl esterases from
lactobacilli and pH-dependent activity
Evaluations of the relative enzymatic activity of the recombinant proteins were performed
with the substrate para-nitrophenyl acetate (p-NP-C2); the substrate was also used in other
studies related to activity determination of predicted cinnamoyl esterases (31, 45). The
enzymatic reactions were performed in 100 mM sodium phosphate buffer with a pH-value of
7.0 at ambient temperature. The recombinant esterases from lactobacilli exhibited diverse
affinities to p-NP-C2. The highest affinity towards the substrate was achieved by the esterase
of L. plantarum TMW1.460, the lowest affinity was measured for the esterase of L. reuteri
TMW1.106 (see table 18). The highest reaction velocities were achieved of the heterologous
expressed cinnamoyl esterases from L. gasseri TMW1.1173 and L. helveticus TMW1.1176 in
comparison to the other lactobacilli predicted by the Michaelis-Menten equation. The Km-
values, and therefore the affinity of the heterologous expressed esterases towards the substrate

Chapter 3
86
p-NP-C2, and the maximum reaction velocities Vmax of the esterases were not correlated to
each other.
Table 18. Enzyme kinetics of the recombinant cinnamoyl esterases in reactions with the substrate p-nitrophenyl acetate Esterase of strain Km [µmol*l -1] Vmax [µmol*mg-1*min -1] L. plantarum TMW1.460 5.25 91.21 L. gasseri TMW1.1173 7.63 134.35 L. fermentum TMW1.890 8.54 76.98 L. acidophilus TMW1.697 17.25 46.30 L. helveticus TMW1.1176 21.67 129.67 L. reuteri TMW1.106 28.21 4.57
3.2.2.3 Characterization of the pH-dependent activity of the cinnamoyl esterases
The pH optimum related to enzymatic activity of the heterologous expressed cinnamoyl
esterases was determined in a pH range of 4.0–9.0. Different buffer systems were used to
cover the range (see chapter 3.1.1.3); p-NP-C2 was also used as a substrate in the pH-
dependent characterization of the recombinant proteins. The relative activities of all
cinnamoyl esterases were increased from a pH-value of 4.0 to 7.0; the highest activity at a
pH-value of 7.0 was achieved by the esterase of L. fermentum TMW1.890.
pH values
4 4,5 5 5,5 6 6,5 7 7,5 8 8,5 9
rela
tive
hydr
olas
e ac
tivity
[mm
ol*m
g-1*m
in-1
]
0
2
4
6
8Lb. plantarum WCSF1 (CAD65143.1)Lb. reuteri JCM 1112 (BAG26088)Lb. gasseri ATCC 33323 (ABJ61050)Lb. acidophilus NCFM (AAV43644)Lb. helveticus DPC 4571 (ABX27728)Lb. fermentum IFO 3956 (BAG27654)
Figure 27. Determination of the pH optimum of the recombinant cinnamoyl esterases.

Chapter 3
87
Generally, the relative activities of all recombinant cinnamoyl esterases showed an optimum
between a pH-value of 7.0–8.0; with the exception of the esterase from L. helveticus
TMW1.1176, their pH optimum was located at a pH-value of 8.5. At the higher pH-value of
9.0 all cinnamoyl esterases showed a decreased relative activity, nonetheless the activity of
the esterase from L. acidophilus TMW1.697 remained on a remarkable high level. The
relative activity of the esterase from L. gasseri TMW1.1173 was already at a constant high
level beginning with pH 5.5. The activities of the esterases from L. reuteri TMW1.106 and L.
helveticus TMW1.1176, respectively, showed overall the lowest activities throughout the pH
range from 4.0–9.0. This fact could be explained with the lowest affinity of the esterases from
L. reuteri and L. helveticus towards the substrate p-NP-C2 (see table 18).
3.2.2.4 Characterization of the substrate side-chain length-dependent activity of the
cinnamoyl esterases
Three different substrates with diverse side chain lengths were used to determine the relative
enzymatic activity of the cinnamoyl esterases; all reactions were performed in sodium
phosphate buffer with a pH-value of 7.0 at ambient temperature. Following substrates were
used: p-nitrophenyl acetate (p-NP-C2), p-nitrophenyl butyrate (p-NP-C4), and p-nitrophenyl
caprylate (p-NP-C8).
Lactobacilli TMW-Strain
1.106 1.460 1.890 1.697 1.1173 1.1176
rela
tive
hydr
olas
e ac
tivity
[mm
ol*m
g-1*m
in-1
]
0
2
4
6
8
10
12
p-NP-C2p-NP-C4p-NP-C8
Figure 28. Determination of the substrate side chain length-dependent activity of the heterologously expressed cinnamoyl esterases. 1.106 = L. reuteri, 1.460 = L. plantarum, 1.890 = L. fermentum, 1.697 = L. acidophilus, 1.1173 = L. gasseri, 1.1176 = L. helveticus.
TMW strain collection

Chapter 3
88
All heterologously expressed cinnamoyl esterases showed a substrate side chain length-
dependent activity. When substrates were used with enlarged side chain lengths, e.g. p-NP-C8
the activities were drastically decreased. The highest activity towards p-NP-C8 was measured
for the esterase from L. gasseri TMW1.1173; nonetheless the activity was a fraction in
comparison with the relative activity towards p-NP-C2. Interestingly, the relative activity
towards p-NP-C2 and p-NP-C4 was comparable in reactions with the esterase from L.
acidophilus TMW1.697.
3.2.2.5 Characterization of the temperature-dependent activity of the cinnamoyl esterases
For the determination of a temperature-dependent activity only the esterases from L.
acidophilus TMW1.697, L. plantarum TMW1.460, L. gasseri TMW1.1173, and L. reuteri
TMW1.106 were selected; the activities were evaluated in a temperature range from 20–60°C
(data not shown). The cinnamoyl esterase from L. gasseri showed a maximum activity at
45°C; then a drastically decrease in activity was evaluated beginning at 50°C to 60°C. The
esterase from L. plantarum showed almost same activities in the temperature range from 20–
35°C, following a constant decrease at higher temperatures. The temperature-dependent
activities of the esterases of L. acidophilus and L. reuteri showed virtually the same course; a
constant decrease in acitivity was observed from 20–60°C.
3.2.3 Fermentations with different lactobacilli in broth supplemented with cinnamic acid
derivatives
The metabolisms of phenolic compounds during three day fermentations with lactobacilli
were visualized using thin layer chromatography. For the evaluation following strains of the
genus Lactobacillus were used: L. panis TMW1.1318, L. acidophilus TMW1.697, L.
sanfranciscensis TMW1.53, L. fermentum TMW1.890, L. pontis TMW1.1086, L. plantarum
TMW1.460, L. reuteri TMW1.106, L. gasseri TMW1.1173, and L. johnsonii TMW1.1179.
The fermentations in mMRS were started after supplementation of the particular substrate
(final concentration of 2 mM); the analyses were conducted with methyl caffeate, methyl
coumarate, and ethyl ferulate. Subsequently, the samples were processed as stated in chapter
3.1.4. For example, only the results are shown for the fermentations with methyl caffeate as
the substrate, because the results are representative for ethyl ferulate and methyl coumarate as
well.

Chapter 3
89
Figure 29. Thin layer chromatography analysis (TLC) of three day fermentations with lactobacilli in mMRS supplemented with methyl caffeate, visualized at 254 nm UV-light. 1: Standard, caffeic acid; 2: Standard, methyl caffeate; 3: Standard-Mix, caffeic acid and methyl caffeate; 4: L. panis TMW1.1318; 5: L. acidophilus TMW1.697; 6: L. sanfranciscensis TMW1.53; 7: L. fermentum TMW1.890; 8: L. pontis TMW1.1086; 9: L. plantarum TMW1.460; 10: L. reuteri TMW1.106; 11: L. gasseri TMW1.1173; 12: L. johnsonii TMW1.1179.
The degradation of the substrate methyl caffeate after three days of fermentation with
different lactobacilli is shown in figure 29. L. panis TMW1.1318, L. acidophilus TMW1.697,
and L. fermentum TMW1.890 exhibited the highest activity towards the substrate; almost the
whole substrate was degraded to caffeic acid. A lower affinity towards the substrate methyl
caffeate was shown in fermentations with L. plantarum TMW1.460, L. reuteri TMW1.106, L.
gasseri TMW1.1173, and L. johnsonii TMW1.1179, respectively. No liberation of caffeic
acid could be seen in fermentations with L. sanfranciscensis TMW1.53 and L. pontis
TMW1.1086. As mentioned before, these results are representative also for the other
fermentations with the substrates ethyl ferulate and methyl coumarate (data not shown). The
decreased activity, e.g. L. plantarum and showing of none activity, e.g. L. sanfranciscensis
could be either derived from an inhibitory effect of the phenolic compound against the
fermentation flora, or the fermentation organism is genetically not equipped with the specific
gene of interest. Moreover, the predicted enzyme could not be expressed under the
perspective fermentation conditions of the above indicated approach.
1 2 3 4 5 6 7 8 9 10 11 12

Chapter 3
90
3.2.4 Screening of lactobacilli for α-L-arabinofuranosidase genes using PCR
In this chapter a screening was performed for key enzymes in lactobacilli, e.g. α-L-
arabinofuranosidase involve in the release of bonded ferulic acid out of arabinoxylan (see
chapter 1 and figure 23, respectively). The evaluation of the existence of α-L-arabino-
furanosidase genes in Lactobacillus strains was determined by PCR using degenerated
primers AFN-I/AFC and AFN-II/AFC, respectively (44). The screening by PCR with
genomic DNA and the stated primers was conducted with following strains: Bifidobacterium
lactis TMW2.462, L. sanfranciscensis TMW1.1304, L. brevis TMW1.1326 (ATCC 367), L.
sakei TMW1.22, L. pontis TMW1.1086, L. plantarum TMW1.460, L. sanfranciscensis
TMW1.53, and L. pentosus TMW1.10. Arabinofuranosidases are playing a major
physiological role in Bifidobacteria (35); therefore, Bifidobacterium lactis TMW2.462 was
selected as a reference in the PCR.
AFN-I/AFC (700 bp) AFN-II/AFC (400 bp)
M 1 2 3 4 5 6 7 8 M 1 2 3 4 5 6 7 8 Figure 30. Screening for arabinofuranosidase genes in lactobacilli using PCR. Predicted amplificate sizes of AFN-I/AFC: 700 bp, AFN-II/AFC: 400 bp. M= 100 bp standard. Lane 1: B. lactis, Lane 2: L. sanfranciscensis TMW1.1304, Lane 3: L. brevis, Lane 4: L. sakei, Lane 5: L. pontis, Lane 6: L. plantarum, Lane 7: L. sanfranciscensis TMW1.53, Lane 8: L. pentosus. The screening confirmed the unique occurrence of α-L-arabinofuranosidase genes in
Lactobacillus brevis TMW1.1326; the amplificates were also seen in the reference
Bifidobacterium lactis. Besides, all other evaluated strain DNA’s showed no PCR product in
the desired size.
500 bp
1000 bp

Chapter 3
91
Enterococcus ---MEATMLISSVKRVGKVDPRLYSSFIEHMGRAVYEGIYQPDHPSANKSGFRQDVIHLV 57 Geobacillus MATKKATMIIEKDFKIAEIDKRIYGSFIEHLGRAVYGGIYEPGHPQADENGFRQDVIELV 60 Ara-1-brevis ---MQGKLTVDPASQIAKIDDRVYSALIEHLGRSVYDGLYQPNHPQSDQDGFRQDVIDAV 57 Ara-2-brevis ---MQGSTKIQIQDVVAPIDRRLYGAFIEQLGRAVYTGIYQPDHPTADSDGFRTDVIDAI 57 :.. :. :. :* *:*.::**::**:** *:*:*.** ::..*** ***. : AFN-I Enterococcus KELNIPMIRYPGGNFVSGFRWEDSIGPIANRPRRLDLAWRTIETNEVGIHEFYNWCQHVG 117 Geobacillus KELQVPIIRYPGGNFVSGYNWEDGVGPKEQRPRRLDLAWKSVETNEIGLNEFMDWAKMVG 120 Ara-1-brevis KSLNIDLIRYPGGNFVSGFNWEDSIGPKSTRPTRLDLAWRSIETNQFGLHEFMKWTQKTG 117 Ara-2-brevis KTLNVPLIRYPGGNFLSQYRWEDGIGPKSQRPVRLDLAWRELETNQFGLHEFMRWADKVN 117 * *:: :********:* :.***.:** ** ******: :***:.*::** * . .. AFN-II Enterococcus AEINMAVNLGTRGVDAARNLVEYCNFPKGTYWSDLRRSNGQESPFGIKTWCLGNEMDGPW 177 Geobacillus AEVNMAVNLGTRGIDAARNLVEYCNHPSGSYYSDLRIAHGYKEPHKIKTWCLGNEMDGPW 180 Ara-1-brevis TRPDMAVNLGSRGIDAARNLVEYCNFSGGTYWSDLRKQNGAEEPFNIKTWCLGNEMDGDW 177 Ara-2-brevis AVPNMAVNLGTRGIQAAADLIEYCNFPKGTYLSDLRRQNGAEHPFAIKTWCLGNEMDGPW 177 : :******:**::** :*:****.. *:* **** :* : *. ************ * Enterococcus QIGHKTAEEYGRLAEETAKAMKLVDDSIEVVLCGSSNRQMPTFGDWELTVLDQAYDQIDY 237 Geobacillus QIGHKTAVEYGRIACEAAKVMKWVDPTIELVVCGSSNRNMPTFAEWEATVLDHTYDHVDY 240 Ara-1-brevis QIGHKTADEYGRLAHETAKVMRLVDPSIDLVVSGSSTREMATFGSWEETVLDHTYDDVDY 237 Ara-2-brevis EIGAKSAGEYAHLANETAKAMRRVDDTLELVACGSSSMDNPTFGNWEETVLDACYDNVDY 237 :** *:* **.::* *:**.*: ** ::::* .***. : .**..** **** **.:** AFC Enterococcus LSLHQYYGNQKND----LSHYLARSLDMDRFISEVTAMCDTVKAKKHSKKQINLSFDEWN 293 Geobacillus ISLHQYYGNRDND----TANYLALSLEMDDFIRSVVAIADYVKAKKRSKKTIHLSFDEWN 296 Ara-1-brevis LSLHRYYDNEEND----LANFLAKSIDFDEFISGIVAVCDAVKARKHSHKTLNLALDEWN 293 Ara-2-brevis LSLHRYYGYYNDDDPTELDNFLGKNHDLDDFIKGVVAMCDAVKARKRSTKTINLSFDEWN 297 :***:**. .:* ::*. . ::* ** :.*:.* ***:*:* * ::*::**** Enterococcus IWYHSAEQDEQAAPWQIAPPLLEDNYNFEDALLLGCLLITLLKHADRVKIACLAQLVNVI 353 Geobacillus VWYHSNEADKLIEPWTVAPPLLEDIYNFEDALLVGCMLITLMKHADRVKIACLAQLVNVI 356 Ara-1-brevis VWYHSHKQDDETAPWQQAPHLLEDHYNFEDALMVGTMLITLLKHADRVKIACLAQLVNVI 353 Ara-2-brevis VWYHSNDADTQVTPWQVGPHLLEDIYNFEDALLIGSLLMTLLRNADRVKIACLAQLVNVI 357 :**** . * ** .* **** *******::* :*:**:::**************** Enterococcus APIRTETNGEAWRQTIYYPFMQAAVYGQGEVLSPQIRSANYATEDFEEVPYLESIAVIND 413 Geobacillus APIMTEKNGPAWKQTIYYPFMHASVYGRGVALHPVISSPKYDSKDFTDVPYLESIAVYNE 416 Ara-1-brevis APIMTDEHG-IWLQSIFFPFLQISKYGRGIALTPQQTATTYDSKDFKDVPYLDSLAVYNS 412 Ara-2-brevis APIMTDENGGVWRQSIFYPFMQVANYGQGVVLTDHSTSPTYNSREFTDVAYLDTVTTYDA 417 *** *: :* * *:*::**:: : **:* .* :..* :.:* :*.**::::. : Enterococcus K--ELVIFAVNR-GEEEMNLTVHLSELSLEGVIDFSEMSGFDTKATNLPKSEQVKPSHST 470 Geobacillus EKEEVTIFAVNRDMEDALLLECDVRSFEDYRVIEHIVLEHDNVKQTNSAQSSPVVPHRNG 476 Ara-1-brevis ENHEIVIFAENK-GNTTMDFQTDLHDLNAQTVIEATQFCGYDIKQTN--ENQQMALHPNS 469 Ara-2-brevis ATQTVTVFAENKHQTETLDFELNFGELMIDRLLDATQFYGYDVKADNRDGHMQLQPLP-- 475 :.:** *: : : .. .: ::: : : * * : Enterococcus NVKAEDGKINCLLKPLSWNVVRCRLSDEGGTKNER 505 Geobacillus DAQLSDRKVSATLPKLSWNVIRLGKR--------- 502 Ara-1-brevis NVHLSDNTLTASLQPLSWNMFRLHVTH-------- 496 Ara-2-brevis -ARTDTHHAHTKLQPLSWNVLRFKLRD-------- 501 .: . * ****:.*
Figure 31. Alignment of α-L-arabinofuranosidase amino acid sequences from different micro- organisms, Enterococcus faecium (EJY49498), Geobacillus stearothermophilis (ACE73682), and L. brevis ATCC 367 (YP_795848 and YP_796302). Grey shaded are the regions from the derived primers AFNI, AFNII, and AFC used in this PCR approach. An asterix indicates a position with a fully conserved amino acid residue; a colon indicates a position with a fully conserved strong group and a period indicates a position with a fully conserved weaker group.

Chapter 3
92
Harboring α-L-arabinofuranosidase genes inside the genome is not widespread among
lactobacilli. Recently, predicted enzymes were also seen in the genomes of Lactobacillus oris
PB013-T2-3, Lactobacillus parafarraginis F0439, Lactobacillus kisonensis F0435, and
Lactobacillus buchneri NRRL B-30929.
3.2.5 Heterologously expression of a predicted α-L-arabinofuranosidase and xylosidase
from L. brevis TMW1.1326 and characterization of the recombinant enzymes
The interaction of both enzymes is the basis for the liberation of ferulic acid out of the
arabinoxylan backbone. The genome of L. brevis TMW1.1326 (ATCC 367) is harboring two
genes for α-L-arabinofuranosidase, and two β-xylosidase genes. In each case one specific
gene for α-L-arabinofuranosidase and β-xylosidase was cloned in E. coli and the recombinant
enzymes were further characterized. Following sequence accordance could be seen on amino
acid level for the L. brevis α-L-arabinofuranosidase (YP_796302) by using the database
BlastP:
- L. oris (ZP_07729105): 69% Identities; 80% Positives, 1% Gaps on 502 amino acids (aa). - Carnobacterium (YP_004374029): 59% Identities; 75% Positives, 4% Gaps on 509 aa. - L. brevis (YP_795848): 59% Identities; 75% Positives, 3% Gaps on 503 aa. - L. parafarraginis (ZP_09393561): 61% Identities, 75% Positives, 2% Gaps on 500 aa. According to the current classification of glycosyl hydrolases the enzymes could be classified
as α-L-arabinofuranosidases. The enzyme catalyzes the hydrolysis of non-reducing terminal
α-L-arabinofuranosidic linkages in L-arabinose-containing polysaccharides [EC: 3.2.1.55]
(NCBI, Conserved domains). Following sequence accordance could be seen on amino acid
level for the L. brevis β-xylosidase (YP_794569) by using the database BlastP:
- W. confusa (ZP_10258500): 71% Identities; 83% Positives, 0% Gaps on 552 aa. - L. oris (EGS35772): 68% Identities; 81% Positives, 1% Gaps on 552 aa. - L. antri (ZP_05746624): 68% Identities; 80% Positives, 1% Gaps on 552 aa. According to the current classification of glycosyl hydrolases the enzymes could be classified
as β-D-xylosidase in the glycosyl hydrolase family 43. The glycosyl hydrolase family 43
includes mostly enzymes that have been characterized to have β-1,4-xylosidase activity [EC:
3.2.1.37]. They are part of an array of hemicellulases that are involved in the final breakdown
of plant cell-wall whereby they degrade xylan (NCBI, Conserved domains). The cloning of
the α-L-arabinofuranosidase gene was performed after obtaining a PCR product with primers
arabino-Klon-for/arabino-Klon-rev (see table 12) harboring Xho I and Xba I restriction sites
and isolated genomic DNA as a template; digestion and ligation into the Xho I and Xba I
restriction sites of vector pBAD/Myc-His B resulted in a replicating integration vector, which

Chapter 3
93
was cloned in electro competent cells of E. coli TOP10 by electroporation (see also chapter
5.1.8). The constructed vector harboring the cloned gene was isolated with the PegGold
plasmid miniprep Kit I for DNA sequencing. The expression and purification of the
heterologously expressed enzyme was performed as stated in chapter 3.1.5. The identical
cloning process was conducted for the heterologous expression of the xylosidase from L.
brevis; with primers b-xyl-1-Klon-for/b-xyl-1-Klon-rev (see table 12) harbouring Nco I and
Xba I restriction sites and isolated genomic DNA a PCR product was obtained. This time, the
digestion and ligation was conducted with the help of the Nco I and Xba I endonucleases. The
cloning success and, therefore, the heterologous expression of the predicted enzymes of L.
brevis TMW1.1326 is shown after purification using FPLC and separation of the protein rich
fraction. SDS gel was prepared showing a molecular marker, crude cellular extracts of L.
brevis, and the predicted purified enzymes.
Figure 32. SDS-PAGE gel of the heterologously expressed enzymes. M= molecular weight marker. Lane 1: Purified xylosidase, Lane 2: crude cellular extract of E. coli TOP10 (xylosidase), Lane 3: Purified α-L-arabinofuranosidase, Lane 4: crude cellular extract of E. coli TOP10 (arabino-furanosidase). 3.2.5.1 Characterization of the temperature and pH-dependent activity of the α-L-
arabinofuranosidase and xylosidase from L. brevis TMW1.1326
The effects of temperature and pH-value on the enzymes activities were determined with p-
NP-ara and p-NP-D-xyl as the substrates according to chapter 3.1.7. The activities at the
optimal temperature and optimal pH-value were defined as 100%. The recombinant
arabinofuranosidase showed maximum of activity between a pH-value of 6-7, and at 45°C.
30 kDa
55 kDa
M 1 2 3 4 M

Chapter 3
94
The xylosidase of L. brevis showed an activity maximum in the pH-range of 6.5-7.5, and at
25°C. Remarkably, the heterologous expressed arabinofuranosidase showed optimal activity
at 45°C, whereas the xylosidase exhibited almost none activity towards the substrate already
at a temperature of 40°C. The xyl-1 enzyme hydrolyzed p-nitrophenol-β-D-xylopyranoside
with an apparent Km of 9.05 µmol x L-1 and Vmax-value of 11.82 µmol x mg·min-1.
Figure 33. Temperature -and pH-dependent relative activities of the recombinant enzymes. 1A: Temperature-dependent activity of arabinofuranosidase, 1B: pH-dependent activity of the arabino-furanosidase, 2A: Temperature-dependent activity of the xylosidase, 2B: pH-dependent activity of the xylosidase 3.2.5.2 TLC analysis of the heterologously expressed enzymes against branched poly-
saccharides
Substrate specificity was analyzed with TLC, showing that both enzymes were active in a
coupled reaction against water-soluble wheat arabinoxylan. Thin layer chromatography
analysis (TLC), visualized the activities of the recombinant enzymes according to chapter
3.1.7.1. Arabinose and xylose were released in reactions with the enzymes and arabinan and
xylan as a substrate, respectively. Both enzymes exhibited also activity when wheat
1A 2A
1B 2B

Chapter 3
95
arabinoxylan was used; therefore, it could be assumed that both enzymes are able to release
pentoses out of branched polysaccharides.
Figure 34. TLC analysis of the activity of the recombinant enzymes against branched polysaccharides. Lane 1= Arabinan + ara-2; Lane 2= Xylan + xyl-1; Lane 3= Xylose (10mM); Lane 4= Arabinose (10mM); Lane 5= Wheat arabinoxylan + ara-2; Lane 6= Wheat arabinoxylan + xyl-1; Lane 7= Wheat arabinoxylan +ara-2 +xyl-1. The relative Rf-values were measured for each sample.
3.2.6 Screening of phenolic acid decarboxylase genes using PCR and verification of
decarboxylase activity in lactobacilli
The introduction of this chapter concerned with the enzymatic conversion of ferulic acid to 4-
vinylguaiacol with the help of phenolic acid decarboxylase (see figure 23). In additional
studies performed at our department, a decarboxylase-PCR product with the selected primers
according to de las Rivas (17) was obtained for the Lactobacillus plantarum strains
(TMW1.460, and TMW1.468), Lactobacillus pontis (TMW1.1068, TMW1.1463, and
TMW1.1469), and Lactobacillus brevis TMW1.1326. None of the Lactobacillus sanfrancis-
censis strains (TMW1.52, TMW1.53, and TMW1.1304) showed a PCR amplificate. In this
approach, only four different lactobacilli were tested in PCR screenings for decarboxylase
genes with genomic DNA and degenerated primers. L. plantarum TMW1.460 showed an
amplificate for a PDA and PDC gene, L. sakei TMW1.22 only for a PDC gene, L. fermentum
TMW1.890 and L. sanfranciscensis TMW1.53 exhibited no specific PCR product. Both PCR
screenings indicated that the examined Lactobacillus sanfranciscensis strains harboring none
phenolic acid decarboxylase gene. Moreover, two different sequences for phenolic acid
decarboxylases were obtained in the screening studies with L. pontis TMW1.1086 (data not
shown).
1 2 3 4 5 6 7

Chapter 3
96
Figure 35. PCR products obtained for decarboxylase genes in lactobacilli. The used primers are also shown in table 12. Lane 1: L. plantarum TMW1.460, Lane 2: L. sakei TMW1.22, Lane 3: L. fermentum TMW1.890, Lane 4: L. sanfranciscensis TMW1.53, M: 100 bp standard.
The activity of decarboxylases in lactobacilli was evaluated in fermentation studies with
mMRS supplemented with ferulic acid (FA) and coumaric acid (p-CA), respectively. Both
substrates were tested, because of the diverse substrate preference of phenolic acid
decarboxylases (46). The fermentations and subsequent analyses of supernatants were
conducted as stated in chapter 3.1.9.1. Various lactobacilli were identified able to
decarboxylate the hydroxycinnamates to 4-vinylguaiacol and 4-vinylphenol.
Table 19. Screening for harbored pdc/pda genes and enzyme activities of lactobacilli Strain pdc/pda Activity towards FA p-CA L. plantarum TMW1.460 + +* + L. plantarum TMW1.468 + +* + L. pontis TMW1.1463 + - - L. pontis TMW1.1469 + + +** L. pontis TMW1.1086 + ++ ++ L. brevis TMW1.1326 + +(72h) + +, Decarboxylation to vinyl-derivate examined with HPLC; -, no decarboxylation detected; *Detection of hydroferulic acid; **Content of 4-vinylphenol decreased – increase of 4-ethylphenol
1 2 3 4 M 1 2 3 4 M
PAD-for/rev coumaric-for/rev

Chapter 3
97
Predominantly, ρ-CA was converted by lactobacilli in the fermentation approaches. After 24
hours of fermentation, the supplemented ρ-CA was completely converted to 4-vinylphenol by
L. plantarum (TMW1.460 and TMW1.468), and L. brevis TMW1.1326. Lactobacillus pontis
TMW1.1086 accumulated the maximum amounts of 4-vinylphenol compared to other
lactobacilli during the fermentation period. As shown in figure 36, 4-vinylphenol was
accumulated to higher amounts after 48 hours in fermentations supplemented with coumaric
acid as a substrate compared to the generation of 4-vinylguaiacol from ferulic acid as a
substrate.
Figure 36. Metabolism of coumaric acid (left) and ferulic acid (right) in fermentations with L. pontis TMW1.1086. Shown are the time-points: t= 0 directly after inoculation, t= 24 h, t= 48 h, and t= 72 h.
4-vinylphenol was converted exclusively by L. pontis TMW1.1469 to 4-ethylphenol during
the fermentation period. The strains of Lactobacillus plantarum metabolized the
supplemented ferulic acid almost completely; however, 4-vinylguaiacol was not accumulated,
but the strains reduced ferulic acid to hydroferulic acid. L. brevis TMW1.1326 generated only
minimal amounts of 4-vinylguaiacol after 72 hours of fermentation.
L. plantarum TMW 1.468 FA
time (min)
0 2 4 6 8 10 12
sign
al (
mA
U)
-100
0
100
200
300
400t0 24h
L. pontis TMW 1.1469 pCA
time (min)
8 10 12 14 16 18 20 22
sign
al (
mA
U)
0
100
200
300
t024h48h 72h
Hydro-FA
FA p-CA
4-VP 4-EP

Chapter 3
98
Figure 37. Metabolism of p-CA to 4-vinylphenol (highest peak after 24 hours) and 4-ethylphenol (highest peak after 72 hours) by L. pontis TMW1.1469 (right). Accumulation of hydroferulic acid after 24 hours of fermentation with L. plantarum TMW1.468 and ferulic acid as a substrate (left).
3.2.7 Wort fermentations with a combination of aroma active starter cultures
Subsequently, combinations of strains were chosen to perform wort fermentations. As stated
in chapter 3.2.4 and following passages, α-L-arabinofuranosidase and xylosidase genes were
detected, heterologously expressed and characterized in L. brevis TMW1.1326; therefore, L.
brevis was also picked for wort fermentations. The following culture fermentation
combinations were performed, and the accumulated aroma active compounds were analyzed
after 120 hours:
1.) Lactobacillus brevis TMW1.1326 2.) Lactobacillus brevis TMW1.1326 and Lactobacillus pontis TMW1.1086 3.) Lactobacillus brevis TMW1.1326 and Lactobacillus plantarum TMW1.460 4.) Lactobacillus pontis TMW1.1086
10 µM free ferulic acid and 4 µM free coumaric acid were detected in the substrate (wort) at
the fermentation start. Predicted cinnamoyl esterase activity in L. brevis TMW1.1326 (see
also chapter 3.2.2) could account for liberating almost exclusively p-CA during wort
fermentation. The chemically acidified reference did not show any liberation of p-CA and
after 120 hours of fermentation only 2 mM ferulic acid were liberated. Thus, only 4-
vinylphenol was accumulated during wort fermentations with L. brevis TMW1.1326. The
assumption from the screening approach (see chapter 3.2.6) that the strains predominantly
converted p-CA could also be seen in the wort fermentations. Fermentations with a culture
combination of L. brevis TMW1.1326 and L. pontis TMW1.1086 increased the 4-
vinylguaiacol amount as expected. The results clearly demonstrated that the predicted
cinnamoyl esterase of L. brevis predominantly liberated coumaric acid, because an increase
amount of 4-vinylphenol was accumulated in relation to the amount of free available p-CA.
On the other hand, 4-vinylguaiacol was not accumulated to higher amounts; not the whole
quantity of free ferulic acid was converted to 4-vinylguaiacol.

Chapter 3
99
Table 20. Results of the wort fermentations with a combination of cultures. Strain TPC pH Metabolites (24h) (24h and 120h) (120h) 1.) L. brevis TMW 1.1326 5.0 x 10⁸ 3.9 no 4VG; FA decrease to < 2 µM 3.5 24.5 µM 4VP; 1.8 µM ρ-CA
2.) L. brevis TMW1.1326 3.0 x 10⁸ 3.8 10.6 µM 4VG; 0.7 µM FA L. pontis TMW1.1086 3.4 58.7 µM 4VP; ρ-CA converted
3.) L. brevis TMW1.1326 1.0 x 10¹⁰ 3.5 no 4VG; FA converted; HFA L. plantarum TMW1.460 3.3 7.0-9.3 µM 4VP; 20.8 µM ρ-CA
4.) L. pontis TMW1.1086 2.9 x 10⁸ 4.1 6.9 µM 4VG; 0.7 µM FA 3.6 56.5 µM 4VP; 0.4 µM ρ-CA TPC, total plate count; FA, ferulic acid; p-CA, coumaric acid; 4VG, 4-vinylguiacol; 4VP, 4-vinylphenol; HFA, hydroferulic acid.
Fermentations with a culture combination of L. brevis TMW1.1326 and L. plantarum
TMW1.460 accumulated hydroferulic acid instead of 4-vinylguaiacol; surprisingly, 4-
vinylphenol was generated in lesser amounts as expected, in the previous screening
approaches (see chapter 3.2.6) almost 100% of ρ-CA was converted to 4-vinylphenol. In wort
fermentations with L. pontis TMW1.1086 almost equal amounts of 4-vinylguiacol and 4-
vinylphenol were detected in comparison to the fermentation approach with the mixed
fermentation culture of L. brevis TMW1.1326 and L. pontis TMW1.1086.
3.2.8 Sourdough fermentations with Lactobacillus pontis TMW1.1086
Three independent wheat sourdough fermentations with L. pontis TMW 1.1086 were
performed to evaluate the accumulation of 4-vinylguaiacol during the fermentation period. An
unfermented reference served as a control. The growth rates of the inoculated strain were
checked after 24 hours and 48 hours of fermentation by total plate counts and RAPD-PCR. L.
pontis TMW1.1086 exhibited average plate counts of 3.3 x 10⁸ cfu/g dough after 24 hours,
and 2.0 x 10⁸ cfu/g dough after 48 hours. The pH-value of the dough dropped from 6.25 to a
pH-value of 3.5. Dough samples were analyzed at FSI by using GC/MS; due to deficiency of
an internal standard no quantification could be assured. Nonetheless, in the control dough
only traces of 4-vinylguaiacol were detected. In the doughs fermented with L. pontis
TMW1.1086 a distinct peak for 4-vinylguaiacol was observable; however, there could not be
detected any clove-like aroma in the dough due to underdose concentrations of 4-
vinylguaiacol beyond the aroma threshold.

Chapter 3
100
3.3 DISCUSSION
3.3.1 Determination of activities in lactobacilli able to liberate free forms of
hydroxycinnamates during fermentations
Phenolic acids in wheat are mostly present in bonded form through ester linkages to
arabinoxylan chains (see figure 23 and 9, 26), these fiber-bond phenolic acids could be
potentially released during fermentations. Different wheat cultivars showed high variability in
the total phenolic contents; nonetheless, highly significant correlations between the
hydroxycinnamates could be seen (25); p-coumaric acid and all the diferulic acid derivates
were evaluated, resulted in a content estimation of the diferulic acid derivates when the ferulic
acid concentration is known. Therefore, in addition to the selection of capable starter cultures
in respect to gain designated aroma profiles, attention should be addressed to the right choice
of wheat cultivar. Many studies focus on bioprocessing of cereal grains to improve in vitro
bioaccessibility of phenolic compounds; mainly commercially available enzyme mixtures are
used composed of xylanase, β-glucanase, α-amylase, cellulase, and also ferulic acid esterase
(2, 39, 42).
In a first step, plate screenings of different lactobacilli to liberate bonded phenolic acids
showed an insight into the ability of positive tested lactobacilli to act as starter cultures for
generating relevant active odors in wheat sourdough fermentations. The screening approach
was performed and provided similar results as previous studies (12, 19, 23). Affirmed were
the results from the plate screening approach by broth fermentations with selected lactobacilli
and supplemented hydroxycinnamate esters (see chapter 3.2.3). Moreover, more than 30
feruloyl esterases have been purified and characterized from fungi (49); in addition also from
a wide range of bacteria and yeasts (10, 11, 20, 41). A feruloyl esterase from a metagenomic
library was classified as a FEF1 family (subfamily 1B) feruloyl esterase and aligned amongst
others with an acetylesterase from Lactobacillus plantarum WCFSI (NP_786061), showing
similar sequences (10). Contradictory to these hypothetical sequence comparisons are the
results of Hole et al. (26), showing that L. plantarum WCFSI liberated under the stated
conditions only lesser amounts of free ferulic acid in comparison with other lactobacilli. In
turn, the L. plantarum WCFSI sequence (NP_786061) showed no similarities of predicted
esterases with any sequences of the 78 genomes in the genus lactobacilli (data not shown).
Thus, a clear classification of predicted feruloyl esterases in the family Lactobacillaceae is
challenging. It seems that common enzymes like hydrolases/esterases/lipases of lactobacilli
Chapter 3
101
could account for a ferulic acid release during fermentations of different substrates. Their
activities towards the bonded phenolic compounds could be a combination of enzymatic
reactions and the existing redox potential in the system. Moreover, endogenous wheat flour
enzymes could contribute to the release of ferulic acid during sourdough fermentations, the
continuous pH-drop from approx. 7 to 3.5 during microbiological fermentations serves global
enzymatic optima.
Based on the results of chapter 3.2.2 all heterologously expressed enzymes could be termed as
cinnamoyl esterases; supportive were the results by Lai et al. (32). The characterization of the
heterologously expressed cinnamoyl esterases from the selected lactobacilli showed generally
a peakedness of activity between a pH-value of 7.0-8.0. This result is in agreement with a
feruloyl esterase from a Holstein cow rumen library, it was shown that the pH-optimum of
FAE-SH1 was around 8.0 (10). The temperature-dependent activity of the recombinant
enzyme of L. gasseri showed an optimum at 45°C with ρ-nitrophenyl acetate as the substrate,
whereas the FAE-SH1 enzyme showed a maximum of activity towards methyl ferulate at
40°C (10). A feruloyl esterase from a soil metagenomic library displayed optimal activity at
40°C and pH 6.8, the recombinant enzyme was stable in a broad pH range of 5-10 over 24
hours (49). Furthermore, a feruloyl esterase from Streptomyces ambofaciens was partially
purified from culture supernatant; the enzyme was optimally active at pH 7.0 and 40°C (29).
The purification and characterization of an extracellular feruloyl esterase from the
thermophilic anaerobe Clostridium stercorarium was conducted by Donaghy et al. (20), the
purified feruloyl esterase had an apparent mass of 33 kDa and showed optimum activity at pH
8.0 and 65°C. Besides, the purified enzyme released ferulic, ρ-coumaric, caffeic and sinapinic
acid from the respective methyl esters. The recombinant enzymes in this study were also
active in reactions against methyl coumarate, methyl caffeate, and ethyl ferulate, respectively
(data not shown). Hence, the characterization results for the heterologous expressed
cinnamoyl esterases evaluated in this study are in accordance with other approaches from
different bacteria. It has to be noted, that the recombinant enzymes showed substrate side-
chain length-dependent activity towards different ρ-nitrophenyl esters, indicating only less
activities towards longer side chains (see chapter 3.2.2.4). Thus, the cinnamoyl esterases
could be only active against short chain esters of hydroxycinnamates, e.g. ethyl ferulate,
methyl coumarate. Therefore, an enzymatic liberation enforced by lactobacilli of bonded
ferulic acid out of the arabinoxylan during wheat sourdough fermentations is questionable,
because of the networked ferulic acid with arabinoxylan, and possible cross-linking forming

Chapter 3
102
diferulates. In fermentation studies with lactobacilli in MRS broth supplemented with γ-
oryzanol from rice, no liberation of free ferulic acid could be detected under the chosen
conditions (data not shown). Steryl ferulates of γ-oryzanol were only hydrolyzed by
cholesteryl esterase (40); lipase preparations from different sources (animal, plant, bacteria,
and fungi) were not able to hydrolyze steryl ferulates of γ-oryzanol. Furthermore, cholesterol
esterase was capable of hydrolyzing sitosteryl ferulate and campesteryl ferulate, which are
present only in small amounts in rice γ-oryzanol but are the major steryl ferulates in other
cereals such wheat and rye (38). The total steryl ferulate content of wheat grains was 6.3
mg/100 g, and the steryl ferulate content ranged from trace amounts in flours with low ash
content to 34 mg/100 g in wheat brans, respectively (24, 43). As shown in figure 24, the free
ferulic acid content in the experiments with flour “Tommi” was approx. 2.4 µg/ g, thus being
the 100-fold minor content of ferulic acid as postulated for steryl ferulates.
The ability of lactobacilli to liberate ferulic acid in wheat sourdough fermentations was shown
for L. sanfranciscensis TMW1.53 (see figure 24), thus the lactobacilli genomes were screened
using database for arabinoxylan degrading enzymes. L. brevis TMW1.1326 encoded several
proteins with the ability to hydrolyze glycosylated plant secondary metabolites. The
characterization of the heterologous expressed α-L-arabinofuranosidase was shown in this
study and from Michlmayr et al. (37). The recombinant enzyme showed optimal activity at a
pH-value of 6.5 and 45°C, whereas the heterologously expressed Abf2 of L. brevis exhibited
their optimal activity towards p-nitrophenyl-α-L-arabinofuranoside at pH 5.5 and over a
temperature range of 40–60°C (37). The discrepancies could be explained with the different
types of buffer used in each study. For the recombinant β-xylosidase an optimal activity could
be seen at pH 7.0 and 25°C, these results are comparable to a measured activity of β-D-
xylosidase by Michlmayr et al. (36). Moreover, a β-D-xylosidase from Bifidobacterium breve
K-110 was characterized having Km and Vmax values towards p-nitropenyl-β-D-xylo-
pyranoside of 1.45 mM and 10.75 µmol/min/mg (28), and an optimal activity at pH 6.0 and
45°C. As mentioned, the temperature optimum for the xylosidase in this study was at 25°C,
indicating that the encoding gene was from a mesophilic microorganism. It was also shown,
that the heterologously expressed enzymes were active in a coupled reaction against water-
soluble wheat arabinoxylan. Also, the activities against branched polysaccharides derived
from natural plant cell walls suggest that these enzymes may play an important role in the
degradation of hemicelluloses in the diet of L. brevis TMW1.1326. Liberated phenolic
compounds could be further metabolized and account for aroma in sourdough fermentations.

Chapter 3
103
In vitro fermentations by human fecal microbiota of wheat arabinoxylan showed that a 66
kDa fraction was particularly selective for lactobacilli. Interestingly, the phenolic content
from this fraction contained nearly 60% more bond ferulic acid than the 354 kDa fraction, the
other way round could be seen in the bonded diferulic acid (27). Thus, larger fractions of
arabinoxylan composed of diferulates were probably not as accessible for lactobacilli as the
minor fractions.
In PCR screening approaches for phenolic acid decarboxylase genes in lactobacilli, several
strains were determined harboring a PDA/PDC gene. Thus, the ability to metabolize
hydroxycinnamic acids by lactobacilli during wheat sourdough fermentations could lead to a
revised selection of starter cultures, thereby enhancing desired active aroma odors. The
substrates ρ-coumaric acid and ferulic acid were decarboxylated during broth fermentations
with all chosen lactobacilli (see chapter 3.2.6) to their correspondent vinyl derivate.
Notwithstanding were the results for the L. plantarum strains TMW1.460 and TMW1.468 in
fermentations with supplemented ferulic acid, both strains accumulated hydroferulic acid (see
figure 37). A proposed pathway for the degradation of ρ-coumaric acid in L. plantarum
supported this result, a knockout mutant of the ρ-coumarate decarboxylase gene showed two
other inducible enzymatic activities involved in phenolic acid metabolism (4). The LPD1
mutant accumulated phloretic acid or 4-ethylphenol in fermentations with supplemented ρ-
coumaric acid. Thus, a phenolic acid reductase and a putative phloretic acid decarboxylase
were assumed for phenolic acid metabolism in L. plantarum. During the fermentation period
with L. pontis TMW1.1469 and supplemented ρ-coumaric acid, a decrease in accumulated 4-
vinylphenol was detected and an increase of 4-ethylphenol after 48 hours of fermentation
(figure 36). An enzymatic background for this reaction is proposed also by other studies (4,
47, 50). The ability of L. brevis TMW1.1326 to degrade ferulic acid to its correspondent vinyl
derivate guaiacol was not incisive, after 72 hours of fermentation only traces of 4-
vinylguaiacol could be detected. Curiel et al. confirmed this outcome; moreover, L. brevis
strains were unable to subsequently reduce or metabolize the accumulated vinyl derivates. In
L. brevis, 4-vinylphenol, 4-vinylcatechol, and 4-vinylguaiacol were the final metabolic
products from ρ-coumaric, caffeic or ferulic acids, respectively (13). L. pontis TMW1.1086
accumulated the highest amounts of 4-vinylphenol or 4-vinylguaiacol from the corresponding
phenolic acids; however, metabolism of phenolic acids by L. pontis was conducted in favour
of ρ-coumaric acid. In PCR screenings two putative phenolic acid decarboxylase sequences
were obtained for L. pontis TMW1.1086. The first sequence from L. pontis TMW1.1086

Chapter 3
104
showed highest similarities with phenolic acid decarboxylase from L. fermentum (AAF82764;
89% identity and 98% similarity in 81 amino acids) and L. farciminis (ZP_08577747; 90%
identity and 96% similarity in 81 amino acids). The other putative decarboxylase sequence
from L. pontis TMW1.1086 showed highest similarities with ρ-coumaric acid decarboxylase
from L. plantarum JDM1 (YP_003064516; 97% identity and 97% similarity in 78 amino
acids) and Pediococcus acidilactici DSM20284 (ZP_06196879; 88% identity and 95%
similarity in 78 amino acids). In wort fermentations with a combination of aroma active
starter cultures, the results from the screenings were merged together; a combination of L.
brevis TMW1.1326 and L. pontis TMW1.1086 showed capable results related to the
generation of active aroma odors. With the culture combination and wort as the fermentation
substrate, almost 11 µM 4-vinylguaiacol and 60 µM 4-vinylphenol were accumulated after
120 hours. The combination of cultures in wort fermentations was also performed in a study
of van Beek et al.; it was assumed that the combined activities of bacteria and yeast
decarboxylate ρ-coumaric acid, and would then reduce 4-vinylphenol to 4-ethylphenol more
effectively than either microorganism alone in pure cultures (50).
The ability to generate active aroma odors in wheat sourdough fermentations was shown for
L. pontis TMW1.1086, a distinct peak for 4-vinylguaiacol was observable. Odor-active
compounds in whole meal (WWF-F) sourdough and sourdough made from white wheat flour
(WF 550-F) were evaluated; a clove-like and vanilla-like aroma were detected in higher
concentrations in whole meal sourdough compared to sourdoughs prepared with white wheat
flour (14). Thus, the selection of strains capable of generating aroma active substances in
wheat sourdough fermentations and the best choice of wheat cultivar in respect to phenolic
contents could lead to aroma enhancement. A combination of strains for substrate
fermentations apparently has potential in regard to the ability to liberate improved aroma
doughs; combined yeasts and lactic acid bacteria cultures were used in cereal associated
fermentations since the beginning of time. The central theme of this chapter was to show that
lactobacilli have the genetic background for arabinoxylan degrading enzymes; thus, liberating
free forms of phenolic acids, e.g. ferulic –and coumaric acid, respectively. In addition, the
redox potential in the dough system could further the liberation of bonded phenolic
compounds; thus, the determination of redox potential during wheat sourdough fermentations
could also help in the decision to the appropriate starter culture. The free form of phenolic
acids could contribute to enhancement of aroma in wheat sourdough fermentations due to
microbial decarboxylation reactions. With the multitude of sequenced Lactobacillus genomes

Chapter 3
105
and characterizations of novel species in the genus Lactobacillus the alternatives for starter
culture selection are increasing.

Chapter 3
106
REFERENCES
1. Amado, R., Neukom, H. (ed.). 1985. New approaches to research on cereal carbohydrates. Elsevier Science Publishers. Hill, R.D., Munck, L., Amsterdam.
2. Anson, N. M., E. Selinheimo, R. Havenaar, A. Aura, I. Mattila, P. Lehtinen, A. Bast, K. Poutanen, and G. R. M. M. Haenen. 2009. Bioprocessing of wheat bran improves in vitro bioaccessibility and colonic metabolism of phenolic compounds. J Agric Food Chem 57:6148-6155.
3. Aurilia, V., A. Parracino, M. Saviano, M. Rossi, and S. D'Auria. 2007. The psychrophilic bacterium Pseudoalteromonas halosplanktis TAC125 possesses a gene coding for a cold-adapted feruloyl esterase activity that shares homology with esterase enzymes from gamma-proteobacteria and yeast. Gene 397:51-7.
4. Barthelmebs, L., C. Divies, and J. F. Cavin. 2000. Knockout of the p-coumarate decarboxylase gene from Lactobacillus plantarum reveals the existence of two other inducible enzymatic activities involved in phenolic acid metabolism. Appl Environ Microbiol 66:3368-75.
5. Bloem, A., A. Bertrand, A. Lonvaud-Funel, and G. de Revel. 2007. Vanillin production from simple phenols by wine-associated lactic acid bacteria. Lett Appl Microbiol 44:62-67.
6. Boskov-Hansen, H., Andreasen, M. F., Nielsen, M. M., Larsen, L. M., Bach Knudsen, K. E., Meyer, A. S., Christensen, L. P., Hansen, A. 2002. Changes in dietary fibre, phenolic acids and activity of endogenous enzymes during rye bread-making. Eur. Food Res. Technol. 214:33-42.
7. Bradford, M. M. 1976. A rapid and sensitive method for the quantification of microgram quantities of protein utilizing the principle of protein-dye binding. Anal Biochem 72:248-254.
8. Bradford, M. M. 1976. A rapid and sensitive method for the quantitation of microgram quantities of protein utilizing the principle of protein-dye binding. Anal Biochem 72:248-254.
9. Bunzel, M., Ralph, J., Marita, J. M., Hatfield, R. D., Steinhart, H. 2001. Diferulates as structural components in soluble and insoluble cereal dietary fibre. Journal of the Science of Food and Agriculture 81:653-660.
10. Cheng, F., J. Sheng, T. Cai, J. Jin, W. Liu, Y. Lin, Y. Du, M. Zhang, and L. Shen. 2012. A protease-insensitive feruloyl esterase from china holstein cow rumen metagenomic library: Expression, characterization, and utilization in ferulic acid release from wheat straw. J Agric Food Chem 60:2546-2553.
11. Coghe, S., K. Benoot, F. Delvaux, B. Vanderhaegen, and F. R. Delvaux. 2004. Ferulic acid release and 4-vinylguaiacol formation during brewing and fermentation: indications for feruloyl esterase activity in Saccharomyces cerevisiae. J Agric Food Chem 52:602-8.
12. Couteau, D., A. L. McCartney, G. R. Gibson, G. Williamson, and C. B. Faulds. 2001. Isolation and characterization of human colonic bacteria able to hydrolyse chlorogenic acid. J Appl Microbiol 90:873-81.
13. Curiel, J. A., H. Rodriguez, J. M. Landete, B. De las Rivas, and R. Munoz. 2010. Ability of Lactobacillus brevis strains to degrade food phenolic acids. Food Chemistry 120:225-229.
14. Czerny, M., and P. Schieberle. 2002. Important aroma compounds in freshly ground wholemeal and white wheat flour - Identification and quantitative changes during sourdough fermentation. J Agric Food Chem 50:6835-6840.

Chapter 3
107
15. Dalrymple, B. P., and Y. Swadling. 1997. Expression of a Butyrivibrio fibrisolvens E14 gene (cinB) encoding an enzyme with cinnamoyl ester hydrolase activity is negatively regulated by the product of an adjacent gene (cinR). Microbiology 143 ( Pt 4):1203-10.
16. Dalrymple, B. P., Y. Swadling, D. H. Cybinski, and G. P. Xue. 1996. Cloning of a gene encoding cinnamoyl ester hydrolase from the ruminal bacterium Butyrivibrio fibrisolvens E14 by a novel method. FEMS Microbiol Lett 143:115-20.
17. De las Rivas, B., H. Rodriguez, J. A. Curiel, J. M. Landete, and R. Munoz. 2009. Molecular screening of wine Lactic acid bacteria degrading hydrocinnamic acids. J Agric Food Chem 57:490-494.
18. de Vries, R. P., B. Michelsen, C. H. Poulsen, P. A. Kroon, R. H. van den Heuvel, C. B. Faulds, G. Williamson, J. P. van den Hombergh, and J. Visser. 1997. The faeA genes from Aspergillus niger and Aspergillus tubingensis encode ferulic acid esterases involved in degradation of complex cell wall polysaccharides. Appl Environ Microbiol 63:4638-44.
19. Donaghy, J., P. F. Kelly, and A. M. McKay. 1998. Detection of ferulic acid esterase production by Bacillus ssp. and lactobacilli. Appl Microbiol Biotechnol 50:257-260.
20. Donaghy, J. A., K. Bronnenmeier, P. F. Soto-Kelly, and A. M. McKay. 2000. Purification and characterization of an extracellular feruloyl esterase from the thermophilic anaerobe Clostridium stercorarium. J Appl Microbiol 88:458-66.
21. Ekici, Ö. D., M. Paetzel, and R. E. Dalbey. 2008. Unconventional serine proteases: Variations on the catalytic Ser/His/Asp triad configuration. Protein Science 17:2023-2037.
22. Goldstone, D. C., S. G. Villas-Boas, M. Till, W. J. Kelly, G. T. Attwood, and V. L. Arcus. 2010. Structural and functional characterization of a promiscuous feruloyl esterase (Est1E) from the rumen bacterium Butyrivibrio proteoclasticus. Proteins 78:1457-1469.
23. Guglielmetti, S., I. De Noni, F. Caracciolo, F. Molinari, C. Parini, and D. Mora. 2008. Bacterial cinnamoyl esterase activity screening for the production of a novel functional food product. Appl Environ Microbiol 74:1284-1288.
24. Hakala, P., A. Lampi, V. Ollilainen, U. Werner, M. Murkovic, K. Wähälä, S. Karkola, and V. Piironen. 2002. Steryl phenolic acid esters in cereals and their milling fractions. J Agric Food Chem 50:5300-5307.
25. Hernandez, L., D. Afonso, E. M. Rodriguez, and C. Diaz. 2011. Phenolic compounds in wheat grain cultivars. Plant Foods Hum Nutr 66:408-415.
26. Hole, S. A., I. Rud, S. Grimmer, S. Sigl, J. Narvhus, and S. Sahlstrom. 2012. Improved bioavailability of dietary phenolic acids in whole grain barley and oat groat following fermentation with probiotic Lactobacillus acidophilus, Lactobacillus johnsonii, and Lactobacillus reuteri. J Agric Food Chem 60:6369-6375.
27. Hughes, S. A., P. R. Shewry, L. Li, G. R. Gibson, M. L. Sanz, and R. A. Rastall. 2007. In vitro fermentation by human fecal microflora of wheat arabinoxylans. J Agric Food Chem 55:4589-4595.
28. Hyun, Y., B. Kim, and D. Kim. 2012. Cloning and characterization of ginsenoside RA1-hydrolyzing beta-D-xylosidase from Bifidobacterium breve K-110. J. Microbiol. Biotechnol. 22:535-540.
29. Kheder, F., S. Delaunay, G. Abo-Chameh, C. Paris, L. Muniglia, and M. Girardin. 2009. Production and biochemical characterisation of a type B ferulic acid esterase from Streptomyces ambofaciens. Canadian Journal of Microbiology 55:729-738.

Chapter 3
108
30. Kroon, P. A., and G. Williamson. 1999. Hydroxycinnamates in plants and food: current and future perspectives. Journal of the Science of Food and Agriculture 79:355-361.
31. Lai, K. K., G. L. Lorca, and C. F. Gonzalez. 2009. Biochemical properties of two cinnamoyl esterases purified from a Lactobacillus johnsonii strain isolated from stool samples of diabetes-resistance rats. Appl Environ Microbiol 75:5018-5024.
32. Lai, K. K., P. J. Stogios, C. Vu, X. Xu, H. Cui, S. Molloy, A. Savchenko, A. Yakunin, and C. F. Gonzalez. 2011. An iserted alpha/beta subdomain shapes the catalytic pocket of Lactobacillus johnsonii cinnamoyl esterase. Plosone 6:e23269.
33. Lewingston, J., S. D. Greenaway, and B. J. Spillane. 1987. Rapid small scale preparations of bacterial genomic DNA suitable for cloning and hydridization analysis. Lett. Appl. Microbiol 5:51-53.
34. Li, X., J. Yang, X. Li, W. Gu, J. Huang, and K. Q. Zhang. 2008. The metabolism of ferulic acid via 4-vinylguaiacol to vanillin by Enterobacter sp. Px6-4 isolated from Vanilla root. Process Biochemistry 43:1132-1137.
35. Margolles, A., and C. G. De los Reyes-Gavilan. 2003. Purification and functional characterization of a novel alpha-L-arabinofuranosidase from Bifidobacterium longum B667. Appl Environ Microbiol 69:5096-5103.
36. Michlmayr, H., C. Schümann, N. M. Barreira braz da Silva, K. D. Kulbe, and A. M. del Hierro. 2010. Isolation and basic characterization of a beta-glucosidase from a strain of Lactobacillus brevis isolated from a malolactic starter culture. Journal of Applied Microbiology 108:550-559.
37. Michlmayr, H., C. Schümann, K. D. Kulbe, and A. M. del Hierro. 2011. Heterologously expressed family 51 alpha-L-arabinofuranosidases from Oenococcus oeni and Lactobacillus brevis. Appl Environ Microbiol 77:1528-1531.
38. Miller, A., L. Majauskaite, and K. Engel. 2004. Enzyme-catalyzed hydrolysis of gamma-oryzanol. Eur Food Res Technol 218:349-354.
39. Moore, J., Z. Cheng, L. Su, and L. Yu. 2006. Effects of solid-state enzymatic treatments on the antioxidant properties of wheat bran. J Agric Food Chem 54:9032-9045.
40. Moreau, R. A., and K. B. Hicks. 2004. The in vitro hydrolysis of phytosterol conjugates in food matrices by mammalian digestive enzymes Lipids 39:769-776.
41. Mukherjee, G., R. K. Singh, A. Mitra, and S. K. Sen. 2007. Ferulic acid esterase production by Streptomyces sp. Bioresour Technol 98:211-213.
42. Napolitano, A., S. Lanzuise, M. Ruocco, G. Arlotti, R. Ranieri, S. H. Knutsen, M. Lorito, and V. Fogliano. 2006. Treatment of cereal products with a tailored preparation of Trichaderma enzymes increases the amount of soluble dietary fiber. J Agric Food Chem 54:7863-7869.
43. Nyström, L., M. Mäkinen, A. Lampi, and V. Piironen. 2005. Antioxidant activity of steryl ferulate extracts from rye and wheat bran. J Agric Food Chem 53:2503-2510.
44. Park, J., N. S. Han, and T. Kim. 2007. Rapid detection and isolation of known and putative alpha-L-arabinofuranosidase genes using degenerate PCR primers. J. Microbiol. Biotechnol. 17:481-489.
45. Rashamuse, K. J., S. G. Burton, and D. A. Cowan. 2007. A novel recombinant ethyl ferulate esterase from Burkholderia multivorans. J Appl Microbiol 103:1610-20.
46. Rodriguez, H., J. A. Curiel, J. M. Landete, B. De las Rivas, F. L. de Felipe, C. Gomez-Cordoves, J. M. Mancheno, and R. Munoz. 2009. Food phenolics and lactic acid bacteria. International Journal of Food Microbiology 132:79-90.

Chapter 3
109
47. Rodriguez, H., J. M. Landete, B. De las Rivas, and R. Munoz. 2008. Metabolism of food phenolic acids by Lactobacillus plantarum CECT 748T. Food Chemistry 107:1393-1398.
48. Sambrook, J., E. F. Fritsch, and T. Maniatis. 1989. Molecular cloning: A laboratory manual. Cold Sping Harbor Laboratory Press Woodburry, N.Y., 2nd ed.
49. Sang, S. L., G. Li, X. P. Hu, and Y. H. Liu. 2011. Molecular cloning, overexpression and characterization of a novel feruloyl esterase from a soil metagenomic library. Journal of Molecular Microbiology and Biotechnology 20:196-203.
50. Van Beek, S., and F. G. Priest. 2000. Decarboxylation of substituted cinnamic acids by lactic acid bacteria isolated during malt whiky fermentation. Appl Environ Microbiol 66:5322-5328.
51. Williamson, G., P. A. Kroon, and C. B. Faulds. 1998. Hairy plant polysaccharides: a close shave with microbial esterases. Microbiology 144 ( Pt 8):2011-23.

Chapter 4
110
4 4. INSIGHTS INTO THE OXIDATIVE STRESS RESPONSE OF
LACTOBACILLUS SANFRANCISCENSIS
Lactobacillus (L.) sanfranciscensis (see also chapter 1) is an aerotolerant and obligatory
heterofermentative microorganism frequently predominant in traditionally produced
sourdoughs. In the early phase of evolvement, sourdough contains a lot of dissolved oxygen;
it could be also introduced into the dough during the kneading. In both situations, an oxygen
tolerant organism has advantages in competition as compared to strictly anaerobic organisms
(26).
In this study the contribution of glutathione reductase to oxygen tolerance of L.
sanfranciscensis TMW1.53 was examined and compared to a CyuC defective mutant of L.
reuteri. Deletion of the cell-wall bound cystine-binding protein CyuC in L. reuteri decreases
oxygen tolerance of the mutant strains (46). The CyuC of L. reuteri (previously MAP, mucus
adhesion protein and BspA, basic surface protein) is part of an operon consisting of a
cystathionine-γ-lyase (CgL), an ATP-binding protein, a hydrophobic membrane protein and a
surface-bound cystine binding protein (46, 56). CgL accepts cysteine, cystine, and methionine
as substrates for conversion to low-molecular weight thiol compounds (52). It was suggested
that four proteins encoded by the operon act in concert by extracellular aggregation: ATP-
dependent transport and conversion of cystathionine-γ-lyase (CgL). Furthermore, the
influence of Nox-activity in L. sanfranciscensis TMW1.53 was evaluated under aerobic
conditions to maintain the catabolic flux. By inactivation of the native NADH-oxidase gene,
the hypothesis should be ensured that besides fructose O2 can react as an electron acceptor.
The effect of agitation and aeration on accumulation of organic acids during broth
fermentations should show the direct impact of the NADH oxidase on regenerating pyridine
nucleotides to maintain the catabolic flux. Moreover, using transport-studies, a manganese-
dependent growth response should be demonstrated in L. sanfranciscensis TMW1.53.
An insight of the oxidative stress response in L. sanfranciscensis should be devised, also in
respect to other enzymatic reactions involved when cells were exposed to oxidative stress.

Chapter 4
111
4.1 MATERIALS AND METHODS
4.1.1 Used strains, media, plasmids, primers, and growth conditions
Lactobacillus sanfranciscensis was cultivated in MRS-media (composition per L: 10 g
peptone from casein, 5 g meat extract, 5 g yeast extract, 4.0 g KH2PO4, 2.6 g K2HPO4 x
3H2O, 3.0 g NH4Cl, 1 g Tween 80, 0.2 mg each of biotin, folic acid, nicotinic acid, pyridoxal
phosphate, thiamin, riboflavin, cobalamin and panthothenic acid), with slight modifications
for five different MRS-compositions: MRS1: + 1 ml manganese/magnesium-stock solution
(0.1 g MgSO4 x 7H2O, 0.05 g MnSO4 x H2O per L), + 0.5 g L-1 cysteine, containing 10 g x L-1
maltose, 5 g x L-1 fructose and 5 g x L-1 glucose; MRS2: - Mn/Mg-stock solution, + 0.5 g L-1
cysteine, containing 10 g x L-1 maltose, 5 g x L-1 fructose and 5 g x L-1 glucose; MRS3: -
Mn/Mg-stock solution, - 0.5 g L-1 cysteine, containing 10 g x L-1 maltose and 5 g x L-1
glucose; MRS4: - Mn/Mg-stock solution, + 0.5 g L-1 cysteine, containing 10 g x L-1 maltose
and 5 g x L-1 glucose; MRS5: + Mn/Mg-stock solution, – 0.5 g L-1 cysteine, containing 10 g x
L-1 maltose and 5 g x L-1 glucose. MRS1 was used for all the experiments concerning the
glutathione reductase of L. sanfranciscensis; MRS1-MRS5 media were used in the
approaches related to the NADH oxidase (nox) of L. sanfranciscensis. To maintain plasmids,
10 µg L-1 erythromycin was added to the nutrient where indicated. L. sanfranciscensis
TMW1.53 was cultivated under anaerobic conditions at 30ºC, L. reuteri BR11 (56) and L.
pontis TMW1.84 at 37°C. E. coli DH5α was cultivated aerobically in LB medium at 37 °C,
for maintaining plasmids 100 µg x L-1 ampicillin was added. Anaerobic cultures were
incubated in 50 ml falcon tubes (Sarstedt, Germany); for aerated cultures, L. sanfranciscensis
was incubated in 300 ml shaking flasks at 30°C in an orbital shaker at 220 rpm. The plasmid
pME-1 (Ehrmann et al., 2004, unpublished) was transformed in E. coli DH5α and was used
for the construction of the integration vectors pME-1∆gshR and pME-1∆nox as described
below. The plasmid PNG201 was transformed in L. reuteri BR11 according to Turner et al.
(56), a L-cystine uptake system mutant was established by disruption of the bspA locus.
Table 21. Used primers for PCR and cloning experiments Primer Sequence (5` to 3`) Use gshknockV TAT ATG GAT CCA ACA TGA TGT TAA GGA AT Cloning gshknockR TAT ATG GAT CCA TTC GAA AAT GGC AGT TG Cloning GTDHV TAT ATT TGG GGA GTG GAC PCR GTDHR ATT CGA AAA TGG CAG TTG PCR GTDHV1 GGG AGT GGA CAT GGA ACG Southern Blot GTDHR2 ATT CGA AAA TGG CAG TTG Southern Blot eryV GAC TCA AAA CTT TAT TAC TTC Cloning

Chapter 4
112
T7 GTA ATA CGA CTC ACT ATA GGG C Cloning Deg-gshRV GGY GGH ACT TGY CCW AAY Screening Deg-gshRR ATH CCS ACT TGM GCW A Screening gshRV1 GTG ATC AGG CAG AAG ATT C inverse PCR gshRR1 GCA ATC ACA ATT TTA TCT GC inverse PCR gshRV2 AGA TTC AAT TAG TAC GAT TCT inverse PCR gshRR2 CAA TTA ATC TCT GGA ATT CCA inverse PCR cyuC-for3 GCT CCT TAT GCT TAT C cDNA cyuC-rev3 CGT GCA TCA AAT CTT TG cDNA nox-knock-for TAT ACT GCA GGC AAT CTT GGA GCT AAC G Cloning nox-knock-rev TAT ACT GCA GGC TAA AGG AAT GTA GGC G Cloning Nox-for1 GCA ATC TTG GAG CTA ACG Southern Blot Nox-rev1 GCT AAA GGA ATG TAG GCG Southern Blot Nox-klon-for TAT ACC ATG GTT ATG AAA GTT ATT GTA GTA Cloning Nox-klon-rev TAT ATC TAG ATA TTT ATG TGC TTT GTC AGC Cloning MntH1-for GCA CCA TAA ACT AAT TGA cDNA MntH1-rev GAC TTA CTA GTT CTA GCC cDNA MntH2-for ATG GCC GCA AAT TTA ACT cDNA MntH2-rev GAA GTT GCC CTA TCT AAC cDNA restriction sites are underlined
4.1.2 General molecular techniques
General techniques regarding cloning, DNA manipulations and agarose gel electrophoresis
were performed as described by Sambrook et al. (49) Chromosomal DNA of L.
sanfranciscensis was isolated according to the method of Lewingston et al. (31) and E. coli
plasmid DNA was isolated with the PegGold plasmid miniprep kit I from Peqlab GmbH
(Erlangen, Germany) or with the Wizard Plus SV Minipreps DNA Purification System from
Promega (Madison, USA) according to the manufacturer’s instructions. Restriction
endonuclease digestions and ligations with T4-DNA ligase were performed following the
recommendations of the suppliers (Fermentas, St. Leon-Rot, Germany). PCR was carried out
in thermocyclers (Primus 96plus, MWG-Biotech, Ebersberg, Germany; Applied Biosystems,
Foster City, USA) by using Arrow-Taq Polymerase and dNTP’s from MP Biomedicals
(Heidelberg, Germany) or Invitrogen (Burlington, Canada). PCR-products were purified using
the QIAquick PCR Purification Kit (Qiagen, Hilden, Germany; Mississauga, Canada)
according to the instructions of the supplier. Sequencing was carried out by the didoexy
method of Sanger et al. (50) by using GenomeLabTM DTCS-Quick Start Kit (Beckman
Coulter, Fullerton, USA) in combination with an Applied Biosystems model 377A automated
sequencing system or by the external laboratory GATC. Nucleotide and amino acid sequence
analysis was carried out using the DNAsis Max for Windows software (Hitachi, Berlin,
Germany) or by using the DNAStar for Windows software (DNASTAR, Madison, USA).

Chapter 4
113
Transformations were performed with a Bio-Rad gene pulser apparatus (Bio-Rad
Laboratories, Hercules, USA) in 0.2 mm cuvettes (Sarstedt, Nürnbrecht, Germany; Bio-Rad
Laboratories, Hercules, USA) at 2.5 kV, 25 µF and 200 Ω for E. coli and at 1.2 kV, 25µF and
1000 Ω for Lactobacillus sanfranciscensis and L. reuteri BR11.
4.1.3 Sequence and mRNA isolation of genes coding for manganese transport protein in
L. sanfranciscensis TMW1.53.
Genes coding for a manganese transport protein were sequenced based on a clone library of L.
sanfranciscensis TMW1.53 done previously in our lab. RNA was isolated from cells of L.
sanfranciscensis grown aerobically (shaking at 220 rpm) in 50 ml of MRS1 broth to an optical
density of 0.5 at 590 nm. Bacterial cells in the supernatant were harvested by centrifugation
(15 min, 4.500 rpm) and resuspended in 3 mL Tris-HCl buffer (50 mM, pH 7.0) with 3 mL
RNAprotect (Qiagen, Hilden, Germany). This cell suspension was used for RNA isolation
with the Qiagen RNeasy Mini kit. DNA was removed by incubation with RQ1 RNase-free
DNase (Promega, Mannheim, Germany). Reverse transcription was performed by incubation
of RNA with random hexamer primers (Random hexadeoxynucleotides, Promega) at 70°C for
10 minutes. After cooling on ice, 1 µL dNTPs (25 mM), 1 µL reverse transcriptase (200 U
µL-1, M-MLV-RT, RNase H minus, Promega), 5 µL reaction buffer (supplied with reverse
transcriptase) and 5 µL RNase free water were added. The sample was incubated at 25°C for
10 minutes, subsequently at 42°C for 110 minutes and the reaction was stopped by heating the
sample at 72°C for 15 minutes. A fragment of the manganese transport proteins of L.
sanfranciscensis was amplified using Taq polymerase and primers MntH1-for and MntH1-
rev, Mnth2-for and MntH2-rev, respectively, and cDNA as template (Table 21). All PCR
reactions were also carried out with DNAse-digested RNA preparations to verify absence of
chromosomal DNA.
4.1.3.1 Measurement of the intracellular manganese levels in growing cells of L.
sanfranciscensis using fluorescence analysis
Cells of L. sanfranciscensis were grown to an optical density of 1 at 590 nm under static,
anaerobic conditions or shaking (220 rpm) in MRS1 or MRS2, respectively. The cells were
harvested by centrifugation at room temperature (7000 x g, 15 min) and washed three times
with MES buffer (0.1 M). Cells were resuspended in 0.1 M MES buffer to an optical density
of 1 at 590 nm. In order to liberate free intracellular manganese (25) from the cells, a volume

Chapter 4
114
of 1 ml of the cell suspension was boiled for 10 minutes in a water bath and centrifuged at
room temperature (7.000 x g, 10 minutes). The supernatant was taken for the calcein
fluorescence assay. Calcein emits fluorescence in the presence of metal ions such as Mg2+ in
basic conditions; bond to Mn2+, the calcein fluorescence is quenched. For determination of
free manganese, 0.5 ml of supernatant was mixed with an equal amount of Tris buffer (0.5 M,
pH 8.8). To ensure reducing conditions (17) 1 mM DTT was added. 20 µl of calcein solution
(5 µM calcein, 16 mM MgCL2 in 25 mM tris buffer pH 8.8) were added to the sample, and
the fluorescence (λEx: 488 nm, λEm: 511 nm, slit: 5 nm) was measured in a Luminescence
Spectrometer LS 50B (Perkin Elmer, Rodgau-Jügesheim, Germany). For manganese
quantification, a calibration curve was recorded in the range from 0.1 µM to 10 µM Mn2+. The
amount of intracellular manganese, which was released from the cells (at OD590nm= 1) to a
volume of 1 ml MES buffer, was calculated.
4.1.4 Southern hybridization
Genomic DNA was digested with EcoRV, HindIII and NcoI, separated on a 0.7% agarose gel,
and then transferred to nylon membranes (Amersham Biosciences). A 921 bp fragment of L.
sanfranciscensis TMW1.53 obtained with primers GTDHV1 and GTDHR2 (Table 21) was
labeled with DIG-DNA Labeling Mixture (Roche Diagnostics). Hybridization and washing
were performed basically according to the manufacturer's instructions. The same approach
was conducted for the evaluation related to the NADH oxidase of L. sanfranciscensis;
however, genomic DNA was digested with EcoRI, HindIII and BamHI. A 694 bp fragment of
L. sanfranciscensis was obtained with primers Nox-for1 and Nox-rev1 (Table 21).
4.1.5 Creation of knock-out mutants for NADH oxidase and glutathione reductase from
L. sanfranciscensis TMW1.53
4.1.5.1 Insertional inactivation of the NADH-oxidase gene (nox) by single crossover
integration
Based on the submitted DNA sequence (Accession No.: BAB19268) of the NADH-oxidase
gene from L. sanfranciscensis TMW1.53, primers nox-knock-for and nox-knock-rev were
designed for PCR, carrying PstI restriction sites (Table 21). For insertional inactivation of the
NADH-oxidase gene, a 694-bp fragment of the NADH-oxidase gene was obtained with PCR
using primers nox-knock-for and nox-knock-rev. Digestion and ligation into the PstI
restriction site of plasmid pME-1 resulted in the non-replicating integration vector pME-
1∆nox, which was cloned in E. coli DH5α and isolated with the PegGold plasmid miniprep

Chapter 4
115
kit I. For preparation of electro competent cells of L. sanfranciscensis, the strain was grown in
MRS1 broth supplemented with 1% (w/v) glycine to an optical density (590 nm) of 0.7. The
cells were harvested by centrifugation at 4 °C (4000 x g, 15 minutes) and washed four times
with 50 mL of 10 mM MgCl2 solution, once with glycerol (10% v/v) and once with glycerol-
sucrose solution (10% v/v, 0.5 M). Cells were resuspended in glycerol-sucrose solution and
stored at –80°C in 100 µL aliquots. All washing and storage solutions were cooled on ice.
After electroporation, cells were incubated in MRS1 at 30°C for 3 hours prior to plating on
MRS1 supplemented with 10 ppm erythromycin. To verify the insertion of plasmid pME-
1∆nox into the NADH-oxidase gene in cells from erythromycin-resistant colonies, PCR was
carried out with primers targeting the regions upstream and downstream of the NADH-
oxidase gene (nox-klon-for and nox-klon-rev, respectively) and the plasmid borne regions
from pME-1 (eryV, and T7, Table 21). PCR products obtained with primers nox-klon-
for/eryV and nox-klon-rev/T7 were sequenced.
4.1.5.2 Insertional inactivation of the glutathione reductase gene by single crossover
integration
Based on a 771 bp fragment of the glutathione reductase gene from L. sanfranciscensis
TMW1.53 (Vermeulen et al., 2006, unpublished) primers gshRV1/V2 and gshRR1/R2 were
designed for inverse PCR (Table 21). Chromosomal DNA of L. sanfranciscensis was digested
with PstI, religated, and used as template for inverse PCR to yield a product with a size of
about 2.500 bp. For insertional inactivation of the glutathione reductase gene, a 765-bp
fragment of the glutathione reductase gene was obtained with PCR using primers gshknockV
and gshknockR (Table 21), carrying BamHI restriction sites. Digestion and ligation into the
BamHI restriction site of plasmid pME-1 resulted in the non-replicating integration vector
pME-1∆gshR, which was cloned in E. coli DH5α and isolated with the Wizard Plus SV
Minipreps DNA Purification System as recommended by the supplier. The preparation of
electro competent L. sanfranciscensis cells, and the electroporation was performed according
to chapter 4.1.5.1. PCR with primers targeting the regions upstream and downstream of the
glutathione reductase gene (GTDHV and GTDHR, respectively) and the plasmid-borne
regions from pME-1 (eryV and T7, Table 21) were used to verify the insertion of plasmid
pME-1∆gshR into the glutathione reductase gene. To ensure a single crossover integration of
pME-1∆gshR into the gshR gene of L. sanfranciscensis TMW1.53∆gshR, the PCR products
obtained with primers T7/GTDHV and GTDHR/eryV were sequenced.

Chapter 4
116
4.1.6 Preparation of crude cellular extracts and determination of NADH-oxidase,
glutathione reductase or cystathionine-γ-lyase activity
L. sanfranciscensis cells grown under anaerobic and aerobic conditions to mid-exponential
phase were harvested by centrifugation and after disruption the crude cellular extract was used
for the assay. NADH-oxidase activity in crude cellular extract was determined at 340 nm
(absorption coefficient 6.22 x 10³ M-1 cm-1) using 0.2 mM NADH, 50 mM HEPES-buffer (pH
7.0), 1 mM dithiothreitol, and limiting amounts of the crude cellular extract. The assay was
carried out at 30°C; 1 U corresponds to the oxidation of 1 µmol NADH per min. Protein
concentrations were measured by the method described by Bradford (4).
GshR activity in extracts was measured at 25ºC by monitoring the oxidation of NADPH in the
reaction mixture (1 ml) at 340 nm. The reaction mixture contained 640 µl sodium phosphate
buffer (143 mM NaH2PO4, 143 mM Na2HPO4, mixture 1:1 + 5 mM EDTA), 120 µl GSSG
(10mM), 100 µl NADPH (1mM) and 100 µl extracts. The reduced GSH-content was
measured by adding 20 µl of reagent B (39.6 mg 5,5-dithiobis-(2-nitrobenzoic acid) in 10 ml
0.5 M sodium phosphate buffer, pH 7.0). After incubation for 30 min in the dark, the
absorbance was measured at 405 nm. Cystathionine-γ-lyase activity was determined
according to Smacchi et al. (52). Cystathionine (5 mM, final concentration) was used as
substrate in the presence of 50 mM KPi buffer (pH 8.0)-PLP. The enzyme activity was
determined by quantification of ketobutyrate and ammonia produced in the enzymatic
reaction.
4.1.7 Determination of intracellular and extracellular sulfhydryl levels
Cystein transport by L. sanfranciscensis was determined according to Turner et al. (56). Cells
grown aerobically to mid-exponential phase were harvested by centrifugation, washed twice
in KPM solution (0.1 M K2HPO4 adjusted to pH 6.5 with H3PO4 and containing 10 mM
MgSO4 x 7 H2O), and suspended in KPM to a OD of 0.5. Portions (0.5 ml each) of this
suspension were supplemented with 10 µl of 10 µM L-cysteine and 10 µl of 1 M D-glucose,
and the suspension was then incubated at 30°C for 1 h. The cells were then pelleted, and the
supernatant was removed and put on ice. Fifty microliters of a 10 mM solution of DTNB in
KPM was added to the supernatant, and the absorbance at 412 nm was measured. The pelleted
cells were washed twice with 1 ml of KPM and resuspended in a solution containing 200 µl of
water, 4 µl of 0.5 M EDTA, 10 µl of 1 M Tris-HCL (pH 8), 20 µl of 10 mM DTNB, and 100
µl of 10% SDS, added successively. This mixture was incubated at 30°C for one hour, cellular
debris was removed by centrifugation and the absorbance of the supernatant was measured at

Chapter 4
117
412 nm. Assays containing no bacterial cells or no L-cysteine served as control. Sulfhydryl
concentrations were calculated based on the absorbance at 412 nm and the molar extinction
coefficient of 5-thio-2-nitrobenzoic acid of 13.6 L (mol cm)-1, and were corrected to an
optical density of 1.0. The intracellular accumulation of thiols during incubation was
calculated as follows:
([thiol] (cells in KPM-cysteine) - [thiol](cells in KPM without cysteine)) x (cell density)-1
The decrease in extracellular thiols during incubation was calculated as follows:
[thiol] (KPM-cysteine) - [thiol](cells in KPM - cysteine)
4.1.8 Sequence and expression of a gene coding for a CyuC-like protein in L.
sanfranciscensis TMW1.53
A gene coding for a CyuC-like protein was sequenced based on several rounds of PCR with
primers derived from the cyuC of L. reuteri BR11. RNA was isolated from cells of L.
sanfranciscensis that were grown aerobically (shaking at 220 rpm) in 50 ml of MRS-broth to
an optical density at 595 nm of 0.5. Bacterial cells in the supernatant were harvested by
centrifugation (15 min, 4500 rpm) and resuspended in 3 mL Tris-HCl buffer (50 mM, pH 7.0)
with 3 mL RNAprotect (Qiagen, Hilden, Germany). This cell suspension was used for RNA
isolation with the Qiagen RNeasy Mini kit. DNA was removed by incubation with RQ1
RNase-free DNase (Promega, Mannheim, Germany). Reverse transcription was performed by
incubation of RNA with random hexamer primers (Random hexadeoxynucleotides, Promega)
at 70°C for 10 minutes. After cooling on ice, 1 µL dNTPs (25 mM), 1 µL reverse
transcriptase (200 U µL-1, M-MLV-RT, RNase H minus, Promega), 5 µL reaction buffer
(supplied with reverse transcriptase) and 5 µL RNase free water were added. The sample was
incubated at 25°C for 10 minutes, subsequently at 42°C for 110 minutes and the reaction was
stopped by heating the sample at 72°C for 15 minutes. A fragment of the CyuC-like protein of
L. sanfranciscensis was amplified using Taq polymerase and primers cyuC-for3 and cyuC-
rev3 and cDNA as template (Table 21). All PCR reactions were also carried out with DNAse-
digested RNA preparations to verify absence of chromosomal DNA.
4.1.9 Determination of the optical density, pH, organic acids formed during
fermentation
Samples of 250 µl were taken for determination of optical density at 590 nm (OD590nm) using
a plate absorbance reader (Sunrise, Tecan, Germany). Samples of 1.5 ml were taken for
determination of metabolites during fermentation. The concentration of the fermentation

Chapter 4
118
substrates and end products were determined by HPLC. Cells were removed by centrifugation
(14,000 x g for 5 minutes). The concentrations of lactic acid and acetic acid in the supernatant
were determined with a polyspher OAKC column (Merck, Darmstadt, Germany). The flow
rate was 0.4 ml min-1, the mobile phase consisted of 5 mM of H2SO4 liter-1, and the
temperature of the column was 70°C. The pH was measured with a glass electrode and cell
counts were determined on MRS1-agar. The appropriate dilution was plated by using a spiral
plater (IUL, Königswinter, Germany), and plates were incubated at 30°C for 48 hours under a
controlled atmosphere (76% N2, 20% CO2, 4% O2).
4.1.10 Influence of oxidants treatment on growth inhibition determined with a plate
assay
Different MRS-plates compositions (according to media and growth conditions) were covered
with 1 ml of an overnight culture from L. sanfranciscensis or the cognate mutant
TMW1.53∆nox. After the plates dried up, sterile sensi-discs (BD Diagnostics, Germany)
supplemented with diamide (final concentration of 1 M), H2O2 (final concentration of 5 mM)
and paraquat (final concentration of 5 M) were placed in the middle of the agar-plates. Plates
were incubated at 30°C for 48 h under a controlled atmosphere (76% N2, 20% CO2, 4% O2).
The growth inhibition towards the oxidants was measured as the diameter of growth inhibition
expressed in millimeters.
4.1.11 Determination of the effect of oxidants treatment on growth rates in MRS broth
According to Turner et al. (56) 500 µL of log-phase cells were added to 4.5 ml of MRS
supplemented with 0.5 g L-1 cysteine or without added cysteine containing either 500 µl of
sterile double-distilled water (ddH2O) (0 mM paraquat), 166 µl of 1 M paraquat (methyl
viologen; Sigma), and 333 µl of sterile ddH2O (30 mM paraquat) or 500 µl of 1 M paraquat
(90 mM paraquat). The cultures were incubated at 30°C without shaking. Growth was
monitored by measuring the optical density at 590 nm (OD590nm).
The influence of diamide treatment on growth rates was determined in 10 ml of MRS1 and
MRS2 broth, respectively, and inoculated with overnight cultures of Lactobacillus
sanfranciscensis and TMW1.53∆nox. The strain cultures were incubated at 30°C under static
conditions in both media, and were supplemented with 5 mM of diamide during a five hour
time course after they reached an optical density at 590 nm of 0.4.

Chapter 4
119
4.1.12 Nucleotide accession numbers
The nucleotide sequence of the Lactobacillus sanfranciscensis TMW1.53 glutathione
reductase (gshR) and CyuC-like protein genes have been assigned the GeneBank accession
numbers DQ866807 and EF422159, respectively. The sequence of the genomic region of nox
has been registered with the DDBJ/EMBL/GenBank databases under the accession number
AB035801. The nucleotide sequences of the Lactobacillus sanfranciscensis TMW1.53
predicted Mn2+/Fe2+ transporters of the Nramp family MntH1 and MntH2 protein genes have
been assigned the Gene Bank accession numbers FJ440569 and FJ440570, respectively.

Chapter 4
120
4.2 RESULTS
4.2.1 Nucleotide sequence analysis of the L. sanfranciscensis TMW1.53 glutathione
reductase gene
The sequence of a complete open reading frame termed gshR encoding a putative glutathione
reductase was obtained by inverse PCR. Sequence analysis indicated the presence of an
imperfect Shine-Dalgarno sequence (AAGGAG), putative -10 and -35 sequences
corresponding to consensus sequences proposed for lactobacilli (38), and a palindromic
sequence downstream from the termination codon (TAAAAACA-TGTTTTTA), indicating
that the glutathione reductase gene is expressed as monocistronic mRNA. Southern
hybridization of genomic DNA from L. sanfranciscensis TMW1.53 with a probe targeting
gshR demonstrated that its chromosome harbours a single copy of the gene (data not shown).
4.2.2 Analysis of the amino acid sequence compared with bacterial glutathione
reductases
GshR codes for a 446-amino-acid protein GshR with a predicted relative molecular weight MR
of 48614 and a predicted pI of 4.79 (see chapter 2.2.7, figure 18). Blast searches showed
highest similarities with putative glutathione reductases from Lactobacillus plantarum gshR2
(EMBL AL935255; 51% identity and 69% similarity in 445 amino acids) and Lactococcus
lactis (EMBL AE006318; 33% identity and 54% similarity in 437 amino acids). Moreover,
GshR exhibited high similarities to the glutathione reductases from Cyanobacterium
anabaena (EMBL X89712; 31% identity and 58% similarity in 427 amino acids),
Pseudomonas aeruginosa (EMBL X54201; 31% identity and 50% similarity in 444 amino
acids) and Enterococcus faecalis (EMBL AE016830; 29% identity and 55% similarity in 436
amino acids), these enzymes were characterized on biochemical level. The glutathione
reductase of E. coli (EMBL M13141) showed 26% identity and 53% similarity in 436 amino
acids.
The superfamily flavoprotein pyridine nucleotide reductases share similarities in sequence
and structure (57). The sequences of the glutathione reductases contain two dinucleotide-
binding motifs (DBM), the first domain is involved in binding FAD, the second one in
NAD(P)H. The GG doublet is perfectly conserved within the different glutathione reductases
and appears 5 residues downstream of the DBM. This motif contains also the two redox-
active cysteine-residues (see figure 38). GshR of L. sanfranciscensis contains two

Chapter 4
121
dinucleotide-binding motifs (DBM) and the GG doublet that are highly conserved in different
glutathione reductases (57). Most glutathione reductases contain the highly conserved
NAD(P)H binding site sequence (GxGYIAx18Rx5R) (34); however, in L. sanfranciscensis
the first arginine residue in the Rx5R motif is replaced by histidine. The ATG and GD motifs
that are present in most flavoproteins with two dinucleotide-binding domains (57) are also
present in GshR of L. sanfranciscensis.
DBM FAD GG Ec. faecalis ---MKTYDYIVIGGGSGGIASANRAGMHGANVLLIEGNEIGGTCVNVGCVPKKVMWQASS 57 E. coli --MTKHYDYIAIGGGSGGIASINRAAMYGQKCALIEAKELGGTCVNVGCVPKKVMWHAAQ 58 C. anabaena --MTFDYDLFVIGAGSGGLAASKRAASYGAKVAIAENDLVGGTCVIRGCVPKKLMVYGSH 58 P. aeruginosa --MSFDFDLFVIGAGSGGVRAARFAAGFGARVAVAESRYLGGTCVNVGCVPKKLLVYGAH 58 L. sanfranciscensis MSNEFEYDVLYLGSGHGTFNGAIPLASKGFKIGVIEDGLIGGTCPNRGCNAKILLDMITT 60 L. plantarum MTNKYDYDVLYIGAGHATFDGAAPLAKTGVRVGVIESGLIGGTCPNRGCNAKITLDEPVK 60 Lc. lactis -----MFDYIIIGAGPGGLGLAYRLKTKDNKIGIIENDKWGGTCPNYGCDPTKMMMAVVE 55 :* : :*.* . . . . : * **** ** .. : Ec. faecalis MMEMMERDTAGYGFDVEIKNFSFKQLVENREKYIDFLHGAYNRGLDSNNIERIHGYATFT 117 E. coli IREAIHMYGPDYGFDTTINKFNWETLIASRTAYIDRIHTSYENVLGKNNVDVIKGFARFV 118 C. anabaena FPALFED-AAGYGWQVGKAELNWEHFITSIDKEVRRLSQLHISFLEKAGVELISGRATLV 117 P. aeruginosa FSEDFEQ-ARAYGWSAGEAQFDWATLIGNKNREIQRLNGIYRNLLVNSGVTLLEGHARLL 117 L. sanfranciscensis TQHDVKELQGSGLAG--IPEINWKDNVEHKDEVIQLLPEAIGNMMTNAGIDLIYGKGKLV 118 L. plantarum LTRETARLN-DILSS--APTINWTANVAHKQEIIDPLPAGLTARLEDGGATIIHGHATFK 117 Lc. lactis AKSRVEQLKGQGISG--ELNIDWKGLKSRKLNITDPYEKSTFTGLKNAGIETIYGSAAFN 113 :.: : . . : * . :
ATGFAD DBMNAD(P)H Ec. faecalis GEQTIEVNGTE-YTAPHILIATGGRPKKLGIPGEEYALDSNGFFALEEMPKRVVFVGAGY 176 E. coli DAKTLEVNGET-ITADHILIATGGRPSHPDIPGVEYGIDSDGFFALPALPERVAVVGAGY 177 C. anabaena DNHTVEVGERK-FTADKILIAVGGRPIKPELPGMEYGITSNEIFHLKTQPKHIAIIGSGY 176 P. aeruginosa DAHSVEVDGQR-FSAKHILVATGGWPQVPDIPGKEHAITSNEAFFLERLPRRVLVVGGGY 176 L. sanfranciscensis DDHSIKVGNKE-YSADKIVIATGAHYRKLDISGNELTHDGTDFLSLKNQPERMTVIGSGY 177 L. plantarum DAHTVVVDDQQTITAEKIVIATGLKPHRLDIPGTKLAHDSSDFMNLKRLPQSIVIIGAGY 177 Lc. lactis DQGKLEVEGKT-YQAKTYIIATGSRPRLLDIDGKEFLKTSNDFLALEEFPAQISFLGSGP 172 . .: * * ::*.* : * : . : * * : .:*.* Ec. faecalis IAAELAGTLHGLGAETHWAFRHERPLRSFDDMLSEKVVERYQEMGMQIHPNATPAKIEKT 236 E. coli IAVELAGVINGLGAKTHLFVRKHAPLRSFDPMISETLVEVMNAEGPQLHTNAIPKAVVKN 237 C. anabaena IGTEFAGIMRGLGSQVTQITRGDKILKGFDEDIRTEIQEGMTNHGIRIIPKNVVTAIEQV 236 P. aeruginosa IAVEFASIFNGLGAETTLLYRRDLFLRGFDRSVREHLRDELGKKGLDLQFNSDIARIDKQ 236 L. sanfranciscensis IALEFANIAAASGTKVTVLMHHDVALRKFYQPFVKVVLNKLAELDVKFVTNVNPQSIEKI 237 L. plantarum IGMEFATIANAAGAQVTVMLHGDQALRDFYQPFVAQVVDDLTERGVTFIKNANVQAFTKQ 237 Lc. lactis ISLELAQIAKAAGSDVTIISRKKARVAHFDEEMGQEFINYLKAQGIKFIEDISVDKVEKV 232 *. *:* . *:.. : . : * . . : . : . . :
ATGNAD(P)H Ec. faecalis AQN-EYVITFENGESITTDAVIFGTGRQPNTDQLGLENTKVALDEKGY----------VK 285 E. coli TDG-SLTLELEDGRSETVDCLIWAIGREPANDNINLEAAGVKTNEKGY----------IV 286 C. anabaena PEGLKISLSGEDQEPIIADVFLVATGRVPNVDGLGLENAGVDVVDSSIEGPGYSTMNAIA 296 P. aeruginosa ADG-SLAATLKDGRVLEADCVFYATGRRPMLDDLGLENTAVKLTDKGF----------IA 285 L. sanfranciscensis DDD--LIVKT-NQGDFKADWVLNATGRPANVEGIGLDEVGVKYNHQGI-----------E 283 L. plantarum DDQ--FQVSYGDHQQLTTDWILDATGRIPNLDGLGLDRIGVKYDRHGV-----------Y 284 Lc. lactis ADG--FLLTDGTDFEHKTDLVIAGVGRQPNSDKLNLEKVGVETDAKGI-----------K 279 : .* .: . ** . : :.*: * .
GD motif G helix Ec. faecalis VDKFQNTTQNGIYAVGDVIG--KIDLTPVAIAAGRRLSERLFNGQTDLYLDYNLVPTVVF 343 E. coli VDKYQNTNIEGIYAVGDNTG--AVELTPVAVAAGRRLSERLFNNKPDEHLDYSNIPTVVF 344 C. anabaena VNEYSQTSQPNIYAVGDVTD--RLNLTPVAIGEGRAFADSEFG-NNRREFSHETIATAVF 353 P. aeruginosa VDEHYQTSEPSILALGDVIG--RVQLTPVALAEGMAVARRLFKPEEYRPVDYKLIPTAVF 343 L. sanfranciscensis VNDHLQTNIPSIYAAGDVLDKKVGKLTPTAIFES-EYLTDLFSGVTDKSIDYPAVPSAVF 342 L. plantarum VNDHLQTNVPNIYAAGDVLANDLPKVTPAAYFES-KYLMRLFSGQTSAPIDYPVIPSVVF 343 Lc. lactis VNEYLQTSNSKIYAMGDVLSKNQPHLTPVSSFEG-AYLGENLVKDEPQKIAYPAIPTIIF 338 *:.. :*. * * ** .:**.: . : . : :.: :* Ec. faecalis THPPVATIGLTEKAALEEYGEDQVKIYRSSFTPMYFALGEYRQKCDMKLICVGKEEKIVG 403 E. coli SHPPIGTVGLTEPQAREQYGDDQVKVYKSSFTAMYTAVTTHRQPCRMKLVCVGSEEKIVG 404 C. anabaena SNPQASTVGLTEAEARAKLGDDAVTIYRTRFRPMYHSFTGKQERIMMKLVVDTKTDKVLG 413 P. aeruginosa SLPNIGTVGLTEEEALS--AGHKVKIFESRFRPMKLTLTDDQEKTLMKLVVDAHDDRVLG 401 L. sanfranciscensis TTPRIAQVGISVDEDET--NSNKYTIKDVDLATDWFRMTKNENEGTSKLIYD-NHGVLVG 399 L. plantarum TSPRIAQAGMKIPAAEK--AG--LTVSDNDLADYWYYQVSKEPIAASKQVHD-QDGHLVG 398 Lc. lactis GTAKLAEVGHLAGEG--------IHTKTLDLSSWYTYKRINDPLAKLKVALN-EKREIVG 389 . . * : * ::*

Chapter 4
122
Ec. faecalis LHGIGIGVDEMLQGFAVAIKMGATKADFDNTVAIHPTGSEEFVTMR---- 449 E. coli IHGIGFGMDEMLQGFAVALKMGATKKDFDNTVAIHPTAAEEFVTMR---- 450 C. anabaena AHMVGENAAEIIQGVAIAVKMGATKKDFDATVGIHPSSAEEFVTMR---- 459 P. aeruginosa CHMVGAEAGEILQGIAVAMKAGATKQAFDETIGIHPTAAEEFVTLRTPTR 451 L. sanfranciscensis ATEVSDQAEDSISTILPAIEYQLTPKQIKHMISLFPTIGSESWSKL---- 445 L. plantarum VTEISDQAEDAVNALLPAIEYQLDREQIDRLIGIFPTIGYAAWHRA---- 444 Lc. lactis ASTVSSVADEVINLINILIQQKMTLADVEKMIFTYPTVASDLEYFY---- 435 :. : :. . :: .. : .*: .
Figure 38. Amino acid sequence of the glutathione reductase of L. sanfranciscensis TMW1.53 and multiple alignment with the glutathione dehydrogenases of Enterococcus faecalis, Cyanobacterium anabaena, Pseudomonas aeruginosa and Escherichia coli as well as the putative glutathione reductases from Lactobacillus plantarum and Lactococcus lactis. The shaded boxes indicate the highly conserved dinucleotide binding motifs (DBM) for FAD-binding and NAD(P)H-binding. Other conserved sequence motifs in flavoproteins such as GC, ATGFAD, GD and the G helix are also indicated (57).
4.2.3 Insertional inactivation of the glutathione reductase gene and glutathione
reductase activity of the mutant strain
L. sanfranciscensis TMW1.53 was transformed with the non-replicating plasmid pME-
1∆gshR yielding strain L. sanfranciscensis TMW1.53∆gshR. Sequencing of the disrupted
glutathione reductase gene ensured that a single crossover integration of pME-1∆gshR into
the chromosomal gshR gene of TMW1.53∆gshR has taken place (see figure 39).
ATG
GTDHV
915 bp
gshknockR
T7 3.500 bp eryV
gshknockV
1.150 bp TAA
0 bp 1000 bp 2000 bp
GTDHV T7
eryV GTDHR
complete gshR
gshknockV gshknockR
GTDHR
3000 bp 4000 bp 5000 bp
Figure 39. Integration of pME-1∆gshR into gshR of L. sanfranciscensis TMW1.53. The location of primers and the corresponding PCR products that were used for sequencing of the disrupted gshR are indicated. Sequences derived from the integration plasmid are shaded black. ATG, start codon of gshR, TAA, stop codon of gshR. Crude cellular extracts of the ∆gshR-mutant exhibited a glutathione-reductase activity of 14
nmol min-1 mg-1 compared to an activity of 45 nmol min-1 mg-1 in the wild type strain,
indicating that gshR encodes an active glutathione reductase.

Chapter 4
123
4.2.4 Contribution of the glutathione reductase to the oxygen tolerance of L.
sanfranciscensis
The tolerance of L. sanfranciscensis TMW1.53 and its ∆gshR mutant towards oxygen and
superoxide radicals was determined in mMRS medium, which contains 0.5 g L-1 cysteine, and
in mMRS without cysteine. The wild type strain tolerated aerobic conditions in either medium
whereas ∆gshR grew significantly slower in the presence of oxygen.
A
time (h)
0 2 4 6 8
Cel
l den
sity
(O
D59
0 nm
)
0.0
0.5
1.0
1.5
2.0
2.5 B
0 2 4 6 8
Figure 40. Growth of L. sanfranciscensis TMW1.53 (, ∆) and L. sanfranciscensis TMW1.53∆gshR (, ) at aerobic conditions (black symbols) and anaerobic conditions (open symbols). Experiments were carried out in mMRS without cysteine (panel A) and in mMRS containing 0.5 g L -1 cysteine (panel B). Results are representative for three independent experiments. This difference was not observed in the absence of oxygen or in the presence of 0.5 g L-1
cysteine (see figure 40), indicating that the gshR mutant strain is more sensitive to oxidative
stress because it is unable to maintain a high intracellular levels of thiols. To determine the
sensitivity of L. sanfranciscensis TMW1.53∆gshR to the superoxide radicals, the growth of
the mutant strain and L. sanfransicensis TMW1.53 were compared in growth medium
supplemented with the superoxide-generating paraquat in concentrations ranging from 0
mmol to 49 mmol. Growth of L. sanfranciscensis TMW1.53 was unaffected by paraquat, but
paraquat strongly inhibited the growth of L. sanfranciscensis TMW1.53∆gshR in the absence
of cysteine (Figure 41). When cysteine was added to the medium, paraquat did not affect
growth of either strain (data not shown).

Chapter 4
124
A
time (h)
0 4 8 12 16 20 24
Cel
l den
sity
(O
D59
0 nm
)
0.5
1.5
2.5
3.5
0.0
1.0
2.0
3.0B
0 4 8 12 16 20 24
Figure 41. Growth of L. sanfranciscensis TMW1.53∆gshR (Panel A) and L. sanfranciscensis TMW1.53 (Panel B) in mMRS without addition of cysteine. To the media were added 0 (), 30 () or 49 () mM paraquat. Results are representative for two independent experiments.
4.2.5 Cysteine and cystine transport by L. sanfranciscensis TMW1.53
To affirm that cysteine transport complements the protective effect of glutathione reductase
during aerobic growth, cysteine transport by aerobically grown cells of L. sanfranciscensis
TMW1.53 and TMW1.53∆gshR was estimated by determination of intra- and extracellular
thiol levels after incubation in buffer with cysteine. The intracellular sulfhydryl levels prior to
cystein supplementation were 2.7 ± 0.8 and 2.9 ± 0.9 nmol / unit cell density for the wild type
and mutant strains, respectively, and intracellular thiol levels increased by 27 ± 5 and 24 ± 6
nmol / unit cell density, respectively, upon addition of cysteine to cellular suspensions. A
concomitant decrease of thiol levels in the buffer by 110 ± 7 and 103 ± 6 nmol, respectively,
was observed.
L. reuteri BR11 harbors separate transport systems for cystine and cysteine. Cystin transport
is mediated by CyuC and cognate ATP-binding and membrane-spanning proteins (20, 21). L.
sanfranciscensis TMW1.53 harbors an open reading frame coding for a 264 amino acid
protein. The predicted gene product is 46% identical 63% similar to cyuC of L. reuteri BR11.
The expression of cyuC in L. sanfranciscensis was verified by amplification of a 637 bp
fragment of cyuC from cDNA library obtained from exponentially growing cells of L.
sanfranciscensis TMW1.53. Moreover, the genome sequence of L. sanfranciscensis
TMW1.1304 is harboring a permease for L-cystine transport tcyB (60).

Chapter 4
125
4.2.6 Gene arrangement and regulation of nox
The nox gene is of 1356 bp length and translation renderes a protein of 452 aa length, with
67% homology to the NOX of L. brevis (15). Putative -10 and -35 promoter sequences were
found as TACAAT and as TTGTGT located -41 to -52 and -70 to -75 nt upstream the nox
start codon. A palindromic sequence located downstream of nox could function as a
termination signal, covered by nt 1543-1559 and nt 1569-1587 (Accession AB035801). Taken
together, these observations indicate that the nox gene of L. sanfranciscensis is transcribed as
monocistronic unit. A sequence TGTAAACGATTA-CA spanning from nt -27 to nt -40 from
the nox start codon, showed high homology to a variety of cre sequences proven or believed
to be involved in catabolite regulation in Gram-positive bacteria. The positional distribution
of cre´s known to be active has been reported to be within approximately +/- 200 bp of the
translation start site (19). In agreement with this, the nox cre sequence is located between the-
10 region and the probable ribosome binding site.
4.2.7 Insertional inactivation of the NADH oxidase gene and Nox activity of the mutant
strain
L. sanfranciscensis TMW1.53 was transformed with the non-replicating plasmid pME-1∆nox
yielding strain L. sanfranciscensis TMW1.53∆nox. Sequencing of the disrupted NADH
oxidase gene ensured that a single crossover integration of pME-1∆nox into the chromosomal
nox gene of TMW1.53∆nox has taken place. Moreover, by southern hybridization the
integration success of the non-replicating plasmid PME-1∆nox into the native NADH oxidase
gene was assured. Crude cellular extracts of the ∆nox-mutant exhibited a specific NADH
oxidase activity of 0.01 U mg-1 compared to an activity of 0.10 U mg-1 in the wild type strain,
indicating that nox encodes an active NADH oxidase. The growth condition had no effect on
specific NADH-oxidase activity; activities were the same under aerobic and anaerobic
conditions in L. sanfranciscensis TMW1.53 cultures grown in MRS1.
4.2.8 The effect of aeration on growth in different media compositions
The growth of Lactobacillus sanfranciscensis TMW1.53 and its cognate mutant
TMW1.53∆nox in different MRS media compositions were determined in static, anaerobic
conditions and compared with the growth velocity in aerated cultures (see figure 42). Under
static, anaerobic growth conditions the wild type strain (panel A) and the mutant strain (panel
C) exhibited growth only in MRS media supplemented with fructose. The final OD after 24

Chapter 4
126
hours was higher and the growth velocity was increased in cultures of the wild type strain
compared to the mutant strain in MRS2. In both strains, the lag-phase was highly increased in
media without fructose supplementation during the time course.
Figure 42. Growth of Lactobacillus sanfranciscensis TMW1.53 (panel A and B) and TMW1.53∆nox (panel C and D) under static, anaerobic growth conditions (panel A and C) and under aerobic (220 rpm) conditions (panel B and D). Depicted is the time course of the increase of optical density at 590 nm (OD590nm) in modified MRS medium, MRS1: ; MRS2: ; MRS3: ; MRS4: ∆; MRS5: . Results are representative for three independent experiments. L. sanfranciscensis TMW1.53 was able to grow in all five media compositions in aerated
cultures, the final OD was higher in MRS1 and MRS5 supplemented with a
manganese/magnesium stock solution compared to the media without Mn/Mg
supplementation (panel B). L. sanfranciscensis TMW1.53 showed a manganese dependent
growth response, the final OD and growth velocity was increased in media supplemented with
manganese. L. sanfranciscensis TMW1.53 harbors two open reading frames coding for
putative Mn2+/Fe2+ transporters of the nramp family. The predicted gene product of MntH1
fragment is 86% identical 94% similar to a predicted manganese Nramp protein of P.

Chapter 4
127
pentosaceus ATCC 25745 and MntH2 fragment is 70% identical 86% similar to a predicted
manganese Nramp protein MntH2 of L. plantarum WCSF1. The expression of MntH1 and
MntH2 in L. sanfranciscensis was verified by amplification of a 318 bp fragment of MntH1
and a 239 bp fragment of MntH2 from cDNA library obtained from aerobically, exponentially
growing cells of L. sanfranciscensis TMW1.53 in MRS1. The mutant strain was only able to
grow in MRS supplemented with fructose in aerated cultures during the time course; in media
lacking fructose, the lag-phase was highly increased (panel D). Again as shown in panel C,
the final OD was higher in MRS1 supplemented with manganese, and the growth velocity was
increased compared to cultures of the mutant strain grown in MRS2. Remarkably, the growth
of L. sanfranciscensis TMW1.53∆nox under anaerobic conditions was qualitatively
comparable to the growth of the mutant in aerated cultures in all five media compositions.
4.2.9 Determination of intracellular manganese levels in L. sanfranciscensis under static,
anaerobic or aerobic conditions
The intracellular manganese content in cells of L. sanfranciscensis was determined for
different growing conditions and media compositions at an optical density (OD590nm) of 1. The
results are the means ± standard deviations from three independent experiments. The
manganese levels in cells of L. sanfranciscensis were 10.07 ± 0.8 µM ml-1 under aerobic
conditions (220 rpm, shaking) and 12.52 ± 0.1 µM ml-1 under static, anaerobic conditions in
MRS-1, respectively. In MRS-2 broth without supplemented manganese the contents were 9.4
± 0.7 µM ml-1 under aerobic conditions, and 12.05 ± 0.1 µM ml-1 under static, anaerobic
conditions, respectively.
4.2.10 Effect of agitation and aeration on formation of organic acids during
fermentation
The growth and metabolites formed by L. sanfranciscensis TMW1.53 and mutant
TMW1.53∆nox upon growth in MRS1 were determined under anaerobic conditions and in
aerated cultures (see figure 43). L. sanfranciscensis TMW1.53 grew to cell counts of 1.6 ±
0.55 x 10⁸ cfu/ml after 12 h of fermentation, and to cell counts of 1.85 ± 0.49 x 10⁸ cfu/ml
after 24 h of fermentation in aerated cultures. The cognate mutant TMW1.53∆nox grew to 1.2
± 0.66 x 10⁸ cfu/ml after 12 h of fermentation, and to cell counts of 1.5 ± 0.65 x 10⁸ cfu/ml
after 24 h of fermentation, respectively. Under static, anaerobic conditions the wild type
formed a fermentation ratio of lactate to acetate of 1.79 during a fermentation time of 12
hours, after 24 hours of fermentation the ratio increased to 3.81. The formation of acetate

Chapter 4
128
during static, anaerobic fermentation can be explained by the existence of oxygen in the head-
space of the falcon tubes.
Figure 43. Formation of organic acids in aerated cultures (panel A), under anaerobic, statically conditions (panel B) after 12 hours and 24 hours of fermentation in MRS1. The concentrations of lactate (black bar) and acetate (grey shaded bar) in samples of L. sanfranciscensis TMW1.53 (wt) and TMW1.53∆nox (nox) are given. Shown are the means ± standard deviations from five independent experiments. The mutant TMW1.53∆nox strain showed a fermentation ratio of lactate to acetate of 1.38
after a 12 hours fermentation time and a ratio of 2.98 after 24 hours of fermentation (panel B).
In contrast to stationary fermented L. sanfranciscensis TMW1.53 cells, the wild type strain
formed almost equimolar amounts of lactate and acetate under aerobic conditions. Thus,
resulted in a fermentation ratio of 1.19 after 12 hours of fermentation and ended in a ratio of
lactate to acetate of 1.09 at the end of the time course. The ratio of lactate to acetate in
fermentations with TMW1.53∆nox remained almost unaffected during the fermentation time
under different oxygen proportions. Under agitation and aerobic conditions the ratio of lactate
to acetate was 1.70 after 12 hours of fermentation, and resulted in a ratio of 3.05 after 24
hours of fermentation (panel A).
4.2.11 Growth of L. sanfranciscensis TMW1.53 and mutant TMW1.53∆nox in MRS
maltose medium supplemented with various fructose concentrations in aerated cultures
The growth of L. sanfranciscensis TMW1.53 and mutant TMW1.53∆nox in MRS maltose (10
g L-1) broth with various fructose concentrations under aerobic conditions (220 rpm) is shown
in figure 44. Under aerobic conditions the wild type strain showed an independent growth
response in regard to the availability of fructose. In contrast, growth of the mutant strain
TMW1.53∆nox was dependent on the availability of fructose. The mutant strain showed a

Chapter 4
129
fructose dependent growth response, the growth velocity was increased in media
supplemented with different amounts of fructose. Cultures of the mutant strain grown in MRS
without fructose reached comparable OD-values at the end of the fermentation when 5 mM
fructose was supplemented after 6 hours of fermentation.
Figure 44. Growth of L. sanfranciscensis TMW1.53 (wt) and mutant TMW1.53∆nox (nox) in MRS maltose (10 g L-1) with various fructose concentrations under aerobic conditions (220 rpm). , wt in maltose without fructose; , wt in maltose + fructose (10 mM); , nox in maltose without fructose; ∆, nox in maltose + fructose (2 mM); , nox in maltose + fructose (5 mM); , nox in maltose + fructose (10 mM); , nox in maltose without fructose, after 6h + fructose (5 mM). Shown are the means ± standard deviations from three independent experiments.
The final OD-values of the mutant strain in media supplemented with fructose were
comparable to the values of the wild type strain at the end of the time course. Moreover, the
mutant strain TMW1.53∆nox was unable to grow in media without fructose under aerobic
conditions, whereas the wild type strain showed a fructose independent growth response
under aerobic conditions.
4.2.12 Influence of oxidants treatment on growth inhibition of L. sanfranciscensis
TMW1.53 and mutant TMW1.53∆nox in a plate assay
To verify the protective role of Nox against oxidative stress in L. sanfranciscensis, the
sensitivities of the wild type strain and the mutant TMW1.53∆nox to oxidants, such as
diamide (thiol-specific oxidant), H2O2 and paraquat were determined using a disc sensitivity
assay. The results in table 22 indicated that the mutant strain was more sensitive to diamide
treatment in comparison to the wild type strain on MRS-plates without fructose
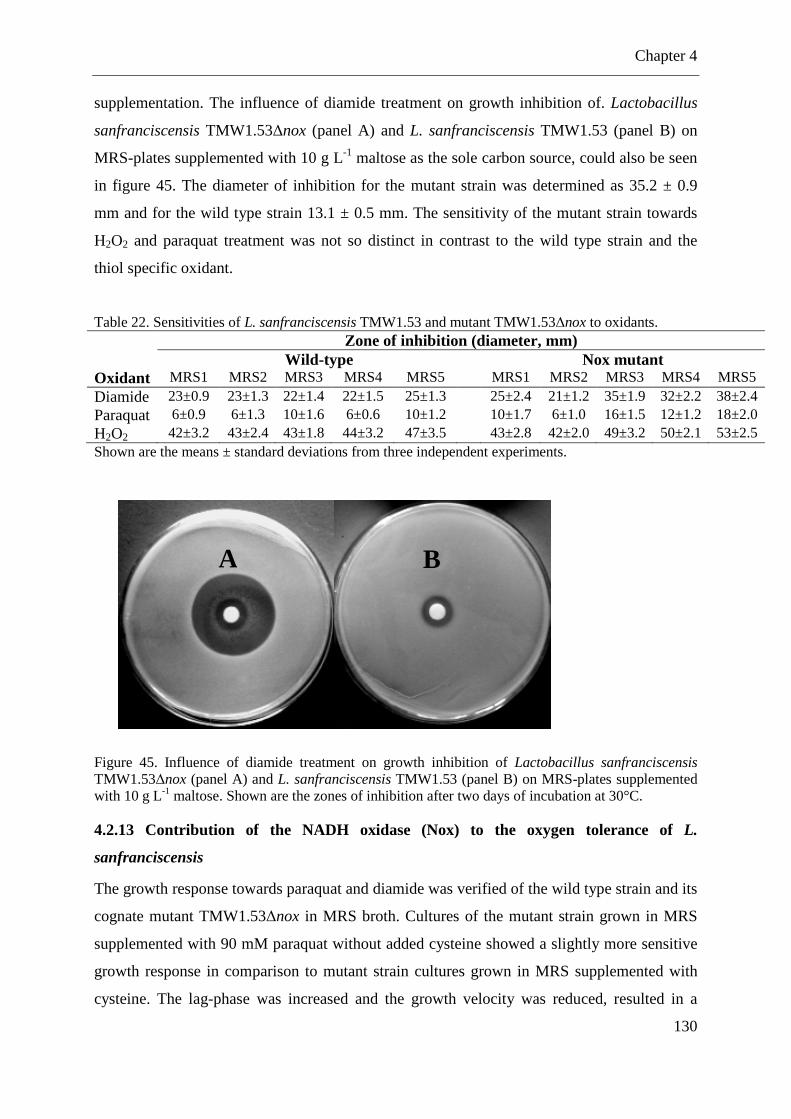
Chapter 4
130
supplementation. The influence of diamide treatment on growth inhibition of. Lactobacillus
sanfranciscensis TMW1.53∆nox (panel A) and L. sanfranciscensis TMW1.53 (panel B) on
MRS-plates supplemented with 10 g L-1 maltose as the sole carbon source, could also be seen
in figure 45. The diameter of inhibition for the mutant strain was determined as 35.2 ± 0.9
mm and for the wild type strain 13.1 ± 0.5 mm. The sensitivity of the mutant strain towards
H2O2 and paraquat treatment was not so distinct in contrast to the wild type strain and the
thiol specific oxidant.
Table 22. Sensitivities of L. sanfranciscensis TMW1.53 and mutant TMW1.53∆nox to oxidants.
Zone of inhibition (diameter, mm) Wild-type Nox mutant
Oxidant MRS1 MRS2 MRS3 MRS4 MRS5 MRS1 MRS2 MRS3 MRS4 MRS5 Diamide 23±0.9 23±1.3 22±1.4 22±1.5 25±1.3 25±2.4 21±1.2 35±1.9 32±2.2 38±2.4 Paraquat 6±0.9 6±1.3 10±1.6 6±0.6 10±1.2 10±1.7 6±1.0 16±1.5 12±1.2 18±2.0 H2O2 42±3.2 43±2.4 43±1.8 44±3.2 47±3.5 43±2.8 42±2.0 49±3.2 50±2.1 53±2.5 Shown are the means ± standard deviations from three independent experiments.
Figure 45. Influence of diamide treatment on growth inhibition of Lactobacillus sanfranciscensis TMW1.53∆nox (panel A) and L. sanfranciscensis TMW1.53 (panel B) on MRS-plates supplemented with 10 g L-1 maltose. Shown are the zones of inhibition after two days of incubation at 30°C.
4.2.13 Contribution of the NADH oxidase (Nox) to the oxygen tolerance of L.
sanfranciscensis
The growth response towards paraquat and diamide was verified of the wild type strain and its
cognate mutant TMW1.53∆nox in MRS broth. Cultures of the mutant strain grown in MRS
supplemented with 90 mM paraquat without added cysteine showed a slightly more sensitive
growth response in comparison to mutant strain cultures grown in MRS supplemented with
cysteine. The lag-phase was increased and the growth velocity was reduced, resulted in a
A B

Chapter 4
131
decreased final OD-value (see figure 46). In contrast, growth of the wild type strain towards
paraquat was unaffected in both media compositions. The mutant TMW1.53∆nox showed
also a distinct growth response towards diamide in MRS broth, indicated by a decreased
growth rate during a five hour time course. The mutant strain showed an increased OD-value
of 0.570 in MRS1 and of 0.406 in MRS2 during the time course, in comparison, the wild type
strain showed an increased OD-value of 0.639 in MRS1 and 0.658 in MRS2. Thus, indicating
that growth of the mutant strain was affected by diamide in culture fermentations.
Figure 46. Growth response of L. sanfranciscensis TMW1.53 (wt) and mutant TMW1.53∆nox (nox) in MRS supplemented with 0.5 g L-1 cysteine (panel A) and MRS without addition of cysteine (panel B). To the media were added different amounts of paraquat. , wt without paraquat; , wt + 30 mM paraquat; , wt + 90 mM paraquat; ∆, nox without paraquat; , nox + 30 mM paraquat; , nox + 90 mM paraquat. Results are representative for three independent experiments.
4.2.14 Other enzymes and antioxidative compounds involved in the oxidative stress
response of L. sanfranciscensis
Based on this work using inverse PCR and degenerated primers of known sequences for
specific genes of interest involved in oxidative stress response from other bacteria, the
genome sequence approach of L. sanfranciscensis TMW1.1304 by Vogel et al. (60), and
partial genome sequence of L. sanfranciscensis TMW1.53 (40), respectively, a scheme is
proposed for the enzymes included in the detoxification of reactive oxygen species and
possible effects of antioxidative compounds in L. sanfranciscensis.

Chapter 4
132
ROS: .OH – ROO. – O2-
OUT
IN
Mn2+, Cys, GSH, FrcH2O2 + Fe2- .OH + OH- + Fe3+
O2- + Fe3+ O2 + Fe2+
Oxidases
H2O22H2O
Antioxidative
compounds1 2
.
43
Iron, Mn2+
Protein
damageS-S SH-SH
Peroxidases
O2
TrxAred
TrxAox
TrxBox
TrxBred
2 GSH GS-SG
NADH, H+NAD+
9
DonorredDonorox
Oxidoreductases
Redoxhomeostasis
Cys, GSH
Fructose/Mannitol
1 NADH oxidase (nox)2 Superoxide dismutase3 Thiol peroxidase4 NADH peroxidase5 Ribonucleotide reductases (RNRs)6 GshR/Glutaredoxin7 Thioredoxin8 Thioredoxin reductase9 Other oxidoreductases10 Mannitol dehydrogenase11 Manganese transporter12 Cystin-cysteine transporter (thiol)
8
7
6
10
Internal Mn2+-pool
NADPH, H+
NADP+
NADPH, H+
NADP+
RNRs
11 12
Figure 47. Insight of involved enzymes to achieve redox homeostasis in Lactobacillus sanfranciscensis under oxidative stress conditions (similar to (7)). Key antioxidant enzymes are indicated by numbers, a reference is included for enzymes that were characterized on genetically and/or biochemical level, the presence of other enzymes is deduced from literature data.
1. NADH oxidase (this work, from chapter 4.2.6; (22, 35, 44, 53))
2. Predicted superoxide dismutase (10)
3. Thiol peroxidase (60)
4. NADH peroxidase (this work, see chapter 5.2; (40))
5. Ribonucleotide reductases (RNRs; this work, see chapter 5.2; (40, 60))
6. Glutathione reductase/Glutaredoxin (this work, from chapter 4.2.1; (23, 40, 60))
7. Thioredoxin (this work, see chapter 5.2; (40, 60))
8. Thioredoxin reductase (this work, see chapter 5.2; (40, 60))
9. Other oxidoreductases (40, 60)
10. Mannitol dehydrogenase (this work, chapter 4.2.11; (28, 40, 60))
11. Manganese transporter (this work, from chapter 4.2.8; (60))
12. Cystin-cysteine transporter (thiol; this work, chapter 4.2.5; (60))

Chapter 4
133
The proposed scheme (figure 47) showed not the all-encompassing response of L.
sanfranciscensis due to oxidative stress, but focuses on main enzymes involved and non-
enzymatic actions inside the cell, respectively, to overcome the toxic effect of reactive oxygen
intermediates. L. sanfranciscensis do not produce typical heme-containing cytochromes and
catalases (60); nonetheless, the organism is well adapted to growth in aerobic environment.
The defence of aerotolerant microorganism to oxygen toxicity are enzymes transforming the
intermediates, such as peroxidases, or much simpler, the involvement of oxygen in the
metabolism. Several reactive oxygen species could be generated during the cellular metabolic
action; oxygen is partially reduced to water leading to the formation of reactive O2 species,
e.g. superoxide anion radical (O2-), the hydroxyl radical (OH-), and hydrogen peroxide
(H2O2). These oxygen intermediates have a high oxidizing potential and thus are responsible
for cellular oxygen toxicity (8, 14).
The effect of the NADH oxidase (nox) was evaluated in this study, whereas the main function
of the enzyme was the regeneration of the oxidized pyridine nucleotide under aerobic
conditions (see figure 42 and 43, respectively); thus, enabling the organism to produce acetate
from acetyl-phosphate and the synthesis of an additional ATP (22). The genome of L.
sanfranciscensis TMW1.1304 is harboring amongst others at least three L-lactate
dehydrogenases and three D-lactate dehydrogenases (ldh), it was proposed that their key
function is NAD+ regeneration (60). The occurrence of a superoxide dismutase in L.
sanfranciscensis CB1 was postulated by de Angelis et al. (10), although an analog sequence
for a SodA gene is missing in the genome of L. sanfranciscensis TMW1.1304. All the
peroxidases, e.g. thiol peroxidase, NADH peroxidase, and a putative thioredoxin reductase as
well as other oxidoreductases were presented into figure 47 based on homologous sequences
to other microorganism on nucleotide level (40, 60). The influence of the glutathione
reductase during the aerobic life of L. sanfranciscensis TMW1.53 was shown in figure 40 and
41, respectively (23). The expression of the proteins, thioredoxin, thioredoxin reductase,
glutaredoxin-like NrdH, and the ribonucleotide reductases NrdE and NrdF inside the cells by
the wild type strain of L. sanfranciscensis TMW1.53 under aerobic conditions (shaking 220
rpm) was evaluated according to chapter 4.1.8. All cDNAs showed a specific PCR amplificate
with primers derived from the gene sequences (see chapter 5.2, data not shown); indicating
their expression under aerobic growth conditions of the strain. The transfer of antioxidative
compounds, e.g. manganese, cysteine or cystine, glutathione was somehow shown in chapter
4 for L. sanfranciscensis TMW1.53, and on further genetically level for L. sanfranciscensis

Chapter 4
134
TMW1.1304 (60). A proposed ability of L. sanfranciscensis TMW1.1304 to convert L-
alanine into L-cysteine by using a cysteine desulfurase is given on genetically level (60); thus,
participating in maintaining redox homeostasis during the aerobic life of the strain.

Chapter 4
135
4.3 DISCUSSION
4.3.1 Influence of the glutathione reductase during the aerobic life of L. sanfranciscensis
TMW1.53
This study considered a potential role of glutathione reductase to the oxygen tolerance of L.
sanfranciscensis. Generally, aerobic growth of lactic acid bacteria requires the presence of
catalase and / or NADH-oxidases to remove hydrogen peroxide (9, 35). Several thiol-active
enzymes additionally contribute to the tolerance of lactic acid bacteria to oxygen, including
the thioredoxin-thioredoxin reductase (Trx-TrxR) couple (58, 59), cyst(e)ine uptake and
metabolism (56), and the glutathione-glutathione reductase system.
Streptococci harbor glutathione reductases that enable the cells to create a reducing
environment and which are overexpressed during aerobic growth (41, 55, 63). Some strains of
Lactococcus lactis accumulate glutathione in response to aerobic conditions (32). This study
demonstrated that gshR-deficient mutants of L. sanfranciscensis TMW1.53 exhibited a
decrease tolerance to oxygen and superoxide. Moreover, the insertional deletion of gshR
reduced the aerobic growth rate of L. sanfranciscensis but did not fully eliminate oxygen
tolerance in this strain. Putative thioredoxin, glutaredoxin, and thioredoxin reductase genes
may serve as additional pathways to maintain intracellular redox homeostasis in the absence
of an active glutathione reductase.
Oxygen tolerance in L. sanfranciscensis TMW1.53∆gshR could be restored by addition of
cysteine to the medium, indicating that the gshR mutant strain is more sensitive to oxidative
stress because it is unable to maintain high intracellular levels of thiols. Little is known about
cysteine transport systems in lactic acid bacteria; in Saccharomyces cerevisiae, several
permeases with broad specificity contribute to cysteine transport (12). Bacterial cystine
transport systems exhibit a high specificity for cystine (6, 20, 21). L. sanfranciscensis
internalized cysteine to increase intracellular thiol levels and the rates of cysteine transport as
well as the intracellular thiol levels were generally in agreement with cysteine transport in L.
reuteri (56). Moreover, the strain expressed a gene with high homology to CyuC of L. reuteri.
Because L. sanfranciscensis does not exhibit cystathionine-γ-lyase activity to liberate thiols
from cystine or cysteine, it remains unclear whether cystine transport contributes to
intracellular thiol homeostasis or serves nutritional requirements.
In conclusion, this study demonstrated that GshR of L. sanfranciscensis plays an important
role to the oxygen tolerance of L. sanfranciscensis. It is remarkable that gshR homologues

Chapter 4
136
were furthermore detected in several other species of lactobacilli, whereas L. pontis, and L.
reuteri, species that are not capable of growth at aerobic conditions (54), are harboring no
gshR homologue, and exhibited no GshR activity. Thus, lactobacilli differ in their use of thiol-
dependent redox systems, and the contribution of the various thiol compounds to the oxygen
tolerance and aerobic growth of lactobacilli may prove a relevant area of future research.
4.3.2 The influence of changes in fermentation conditions on the growth response of
Lactobacillus sanfranciscensis TMW1.53 and mutant TMW1.53∆nox
Moreover, the functional characterization of a NADH oxidase in L. sanfranciscensis
TMW1.53 was carried out using a Nox-deficient mutant of the wild type strain. Gene
regulation of nox could be due to catabolite regulation; the clear homology between the
sequences upstream of the L. sanfranciscensis nox gene and the cre consensus sequence
account for a catabolite regulation in L. sanfranciscensis. Catabolite regulation of nox makes
sense in a way that the use of oxygen as electron acceptor, which is catalyzed by Nox,
represents a link to the central sugar metabolism of L. sanfranciscensis. The question remains
whether glucose or some kind of oxygen mediated regulation is the trigger for gene
regulation. However, Oxy-R dependent binding sites as in the gene coding for the NADH
peroxidase of E. faecalis (47) were not found.
Compared to the aerobic respiration of Lactococcus lactis, which involves the expression and
regulation of several proteins in the presence of available heme (42), L. sanfranciscensis lacks
the respiratory chain. The growth velocity and metabolite formation was not enhanced under
respiratory conditions (aerobic, plus 8 µM heme, and menaquinone), done previously in our
lab, thus an activated electron transport chain could be excluded in L. sanfranciscensis. The
non-existence of genes essential for respiratory metabolism could be supposed in
Lactobacillus sanfranciscensis, e.g. cytochrome oxidase, menaquinone biosynthesis and heme
uptake.
The flavoprotein NADH oxidase of L. sanfranciscensis catalyses the direct reduction of O2 to
H2O by NADH (44). In turn, aerobic growth of L. sanfranciscensis in different MRS-media
compositions was found to result in a higher final cell yield and growth rate than anaerobic
growth, suggesting more efficient production of ATP during aerobic growth, as also described
by Stolz et al. 1995 (53). L. sanfranciscensis has been shown to use the acetate branch
whenever electron-acceptors such as fructose or oxygen are available, thereby increasing its
energy and growth yield. The wild type strain could grow in all five media-compositions with
an enhanced growth velocity and final OD-value in media supplemented with manganese

Chapter 4
137
under aerobic conditions. In aerated cultures, the availability of fructose was not a limiting
growth factor, in contrast to higher cell yields in cultures incubated with manganese. Thus,
indicating the role of Mn2+ in the detoxification of superoxide by superoxide dismutase
(SodA) (10), and also the non-enzymatic detoxification of free radicals (25). For example, L.
plantarum maintains a remarkably high cytoplasmic concentration of Mn2+, but is essentially
devoid of iron and heme (2), it is suggested that a large portion of Mn2+ is ‘free’ in a chemical
relevance and substitutes functionally for iron and heme (25). Thus, the lesser amount of
intracellular manganese in aerobically grown cells of L. sanfranciscensis could count for the
fact, that ‘free’ manganese provides a basis for a chemical quenching agent of radicals. An
enhanced manganese-coupled SodA activity could not be seen in L. sanfranciscensis CB1,
when the cells were cultivated in the presence of 0.1 mM paraquat (10). The two manganese
transporters MntH1 and MntH2 could be essential for Mn2+ homeostasis in L.
sanfranciscensis TMW1.53.
The mutant strain TMW1.53∆nox showed a fructose-dependent growth response under
aerobic conditions, by lacking an active Nox enzyme the strain was unable to use oxygen as
an electron acceptor. In contrast to the wild type strain, the mutant grew only in MRS
supplemented with fructose, by using the carbohydrate as an external electron acceptor. The
availability of an external electron acceptor will decide whether ethanol or acetate (+ATP) is
formed. Lucey and Condon assumed that the ethanol branch is no more than a salvage route,
permitting growth when an external electron acceptor is not available (37).
The shut-down of the ethanol branch of the phosphoketolase pathway in the presence of
oxygen seems to be very common among heterofermentative lactic acid bacteria. Acetyl
phosphate is a key metabolic intermediate in the heterofermentative pathway of L.
sanfranciscensis, representing a branching point of the carbon flux (27). The increased
acetate/lactate ratio accumulated during fermentation of L. sanfranciscensis under aerobic
conditions showed that an electron balance was achieved by using oxygen as an external
electron acceptor. The mutant strain was unable to regenerate reduced coenzymes in form of
NADH by Nox in aerated cultures, and resulted in a decreased acetate/lactate ratio. The
carbon flux was directed towards the reduced end product ethanol when reduced coenzymes
were regenerated. Some heterofermentative lactic acid bacteria ferment fructose, using it both
as a growth substrate and as an electron acceptor (18, 33, 48), L. sanfranciscensis used
fructose exclusively as an external electron acceptor. The mutant strain TMW1.53∆nox
showed that with an increase of fructose concentration in the medium, the same maximum

Chapter 4
138
OD value was achieved in comparison to the wild type strain at the end of the fermentation.
However, growth was fully impaired in medium without added fructose. This study
additionally considered a potential role of NADH oxidase from L. sanfranciscensis to
overcome oxygen toxicity. Generally, aerobic growth of lactic acid bacteria requires the
presence of catalase, superoxid dismutase, and / or NADH-(per)oxidases to remove reactive
oxygen species (9, 36). Several thiol-active enzymes additionally contribute to the tolerance
of lactic acid bacteria to oxygen, including the thioredoxin-thioredoxin reductase (Trx-TrxR)
couple (58, 59), cyst(e)ine uptake and metabolism (56), and the glutathione-glutathione
reductase system (23). This study showed that the mutant strain TMW1.53∆nox exhibited a
decrease tolerance to thiol specific oxidative stress and superoxide. The inhibition of growth
upon diamide treatment on MRS-plates could be restored by supplementation of fructose; in
cultures of the mutant strain, the inhibition of diamide could be restored by manganese
supplementation. Recently it was shown, that Candida albicans induced several
oxidoreductases after treatment with the thiol oxidizing agent (30). Moreover, the insertional
deletion of nox reduced slightly the growth rates after treatment with paraquat in MRS
without added cysteine. The growth deficit could be restored by addition of cysteine. L.
sanfranciscensis internalized cysteine to increase intracellular thiol levels; the rate of cysteine
transport, as well as the intracellular thiol levels were generally in agreement with cysteine
transport in L. reuteri (56). Moreover, the strain expressed a gene with high homology to
CyuC of L. reuteri (23).
In conclusion, for heterofermentative lactic acid bacteria, it has been observed that under
aerobic conditions the growth yield, as well as the ATP yield, was markedly higher than that
under anaerobic conditions. The balance between attempting to attain maximal energy yields
and maintaining redox balance is shifted in favor to the energy gain, when L. sanfranciscensis
transfers the electrons to external electron acceptors such as fructose or oxygen. The
importance of NADH oxidase is likely to lie in maintaining the intracellular redox balance,
thus assuring fast aerobic growth by the consumption of NADH. The essential function of
Nox is that it allows O2 to act as a terminal electron acceptor, just like in more conventional,
but much more complex respiratory systems (42). Interestingly, the fact that L.
sanfranciscensis exhibits one of the smallest genomes approximately (1.3 Mb) (11, 60) is
accompanied by a one enzyme minimalistic strategy to improve energy yield under
aerobiosis. Several other species of lactobacilli like L. pontis, L. reuteri, L. fermentum and L.
amylovorus are described not being able to grow under aerobic conditions (54). The defense

Chapter 4
139
of L. sanfranciscensis to oxygen toxicity is the involvement of oxygen in the metabolism by
Nox-activity. Thus, lactobacilli differ in their response to oxygen, and their ability to use O2
in central carbon flux may prove a relevant area of future research.
4.3.3 Insight into the oxidative stress response of L. sanfranciscensis
The microorganism is lacking heme and is devoid of cytochromes, exceptional is a gene for
cytochrome d ubiquinol oxidase subunit 1 in the genome of L. sanfranciscensis TMW1.1304
(60). Moreover, the observation of even weak catalase activity is not notable (data not
shown), which has been shown to be associated with a class of catalases that is independent of
a heme requirement (62). The activity of non-heme catalase was found to be widespread
among strains of lactobacilli (13); a non-heme catalase of L. plantarum ATCC14431 was
heterologously expressed in several lactobacilli, but was found to be only active in L. casei;
thus, the result was attributed to the comparable internal manganese levels inside both strains,
whereas the other genetically modified LAB exhibited a 10- and 100-fold lesser internal
amount of manganese (45). The co-expression of superoxide dismutase and catalase provides
extensive oxidative stress resistance in L. rhamnosus; upon addition of 10 mM H2O2, the
survival ratio of the recombinant strain was 400-fold higher than that of the wild type strain
(1). Furthermore, the expression of a recombinant manganese SodA gene in lactobacilli
provides protection against hydrogen peroxide toxicity (5); the activity was pronounced in L.
reuteri compared to the other strains due to the availability of sufficient manganese ions
inside the cell. The maintenance of high intracellular Mn-levels in L. reuteri could be
guaranteed by Mn(II)/Fe(II) transporter (Accession number: AE014283), and a putative
proton-dependent manganese transporter (Accession number: AY267207). Both transporters
belong to the MntH or Nramp superfamily, similar to the presented manganese transporters
for L. sanfranciscensis in chapter 4.2.8. An active superoxide dismutase for L.
sanfranciscensis CB1 was postulated by de Angelis et al. (10), although in the genome
approaches no homologous sequence of SodA was observed in L. sanfranciscensis TMW1.53
(40) and L. sanfranciscensis TMW1.1304 (60), respectively. A study by Archibald and
Fridovich (1981) demonstrated that lactic acid bacteria, which contained high intracellular
levels of Mn2+, were devoid of true superoxide dismutase activity. Conversely, those which
possessed true SodA activity did not contain high levels of Mn2+. It was proposed that high
Mn2+-levels represents a substitution for SodA activity (3). The determination of intracellular
manganese levels in L. sanfranciscensis TMW1.53 was shown in chapter 4.2.9, and already
discussed in chapter 4.3.2; thus, the adaption of high intracellular levels of manganese

Chapter 4
140
resultant from life in manganese rich media (flour, plant sources) could lead to an increased
oxygen tolerance in L. sanfranciscensis.
As mentioned in chapter 1, NADH peroxidases or thiol peroxidases resume the role of heme-
containing catalases by reducing intracellular levels of H2O2, while also regenerating oxidized
pyridine nucleotide (20, 47). The sequence of a glutathione peroxidase was derived from
alignments with known sequences from the database for L. sanfranciscensis TMW1.1304
(60), and a sequence for NADH peroxidase was generated by using inverse PCR technique
(see chapter 5.2 and (40)) in L. sanfranciscensis TMW1.53. Both possible enzymes could
have a main impact in detoxification of H2O2 in L. sanfranciscensis as shown in figure 47; the
peroxidases might have exceed importance in maintaining redox homeostasis compared to
GshR (23) due to the absence of a heme-catalase in the genome of L. sanfranciscensis (60).
The ability to respond to reactive oxygen intermediates requires mechanism to minimize the
occurrence of thiol oxidation (figure 47); the influence of the glutathione reductase to the
aerobic life of L. sanfranciscensis TMW1.53 was presented earlier in this thesis (see also
(23)); the genome of L. sanfranciscensis TMW1.1304 contain no homologous genes for γ-
glutamylcysteine synthetase (gshA) and glutathione synthetase (gshB), indicating that
glutathione has to be imported from the medium (60). A complete glutathione system for L.
fermentum was presented by Kullisaar et al. (29); glutathione synthesis, uptake and redox
turnover ability arranged in L. fermentum lead to an increase in tolerance against oxidative
stress of the strain. Glutathione was found to provide protection against exposure to H2O2 and
is most likely functional as a scavenger of reactive oxygen intermediates (51). Other studies
revealed that the protective role of reduced glutathione against cryodamage of the cell
membrane of L. sanfranciscensis is partly due to preventing peroxidation of membrane fatty
acids and protecting Na(+),K(+)-ATPase (64). Moreover, it is proposed that glutathione could
protect certain key metabolic enzymes via S-thiolation against cold stress in L.
sanfranciscensis; protein SH groups form mixed disulfides with low-molecular weight thiols.
Another predicted protective mechanism of glutathione against cold stress is its role in
preventing intracellular pH-drop; L. sanfranciscensis cells cultivated in broth supplemented
with glutathione showed a significant increase in intracellular pH during the cold-treated
process for 30 days in comparison to cells without added glutathione (65). The inactivation of
a gene responsible for glutathione production in L. plantarum WCFS1 affected survival of the
strain under H2O2 stress; an overlap between the glutaredoxin and thioredoxin system was
postulated for L. plantarum using DNA-microarrays (51). Extracellular low-molecular weight

Chapter 4
141
thiols, e.g. glutathione, cystine, and cysteine, respectively, were demonstrated to be the major
contributors to changes in the redox potential (Eh). The possible role of changes in thiol
concentrations inside and outside of cells in the processes of signal transduction and redox
regulation of cellular functions was discussed by Oktyabrskii et al. (39). It was proposed that
in tested bacterial cultures like E. coli, glutathione and cysteine may be responsible for the
major contribution to the generation of Eh leaps.
Furthermore, on the basis of sequence similarity, a glutaredoxin-like protein, two thioredoxin
reductases, a putative thioredoxin peroxidase, and three thioredoxin-like proteins were
identified in the genome of L. sanfranciscensis TMW1.1304 (60). Some of these genes were
also found in L. sanfranciscensis TMW1.53 (see chapter 4.2.14 and 5.2); their impact remains
to be evaluated during aerobic conditions, but the expression was already shown in broth
fermentations. The overexpression of gene trxB1 resulted in a 3-fold overproduction of
thioredoxin reductase (TR) activity and higher resistance toward diamide and H2O2 in L.
plantarum WCFS1. Disruption of trxB1 resulted in a cognate mutant strain with decreased TR
activity (2.5-fold) and in a 19% lower growth rate under aerobic conditions compared to the
wild-type (51). Thus, both systems, glutathione-glutathione reductase and thioredoxin-
thioredoxin reductase, respectively, are playing a crucial role in resistance towards oxidative
stress in lactobacilli (see also figure 47). Redox-sensitive amino acid side chains such as
cysteine-thiols that monitor redox signals including oxygen, cytoplasmic redox state or the
production of reactive oxygen species are common in bacteria beside other specific sensors
(16). Redox sensors control the processes that function to maintain redox homeostasis, usually
at the level of transcription. The OxyR transcription factor is a key regulator of the E. coli
response to oxidative stress (61). The genome approach of L. sanfranciscensis TMW1.1304
revealed a redox-sensing transcriptional repressor (rex) (60), his function during aerobic
conditions or in regeneration of pyridine nucleotide seems to be another trigger for L.
sanfranciscensis to cope environmental stress.
In addition, genes for ribonucleotide reductases nrdI, nrdH (glutaredoxin-like), nrdE, and
nrdF were observed in the genome of L. sanfranciscensis TMW1.53 (this work and (40); the
operon consists of a gene cluster nrdHEF (see chapter 5.2). As mentioned in chapter 4.2.14,
those genes were expressed during aerobic growth of the strain in fermentation broth.
Staphylococci contain a class Ib NrdEF ribonucleotide reductase (RNR) that is responsible for
the synthesis of deoxyribonucleotide precursors for DNA synthesis and repair under aerobic
conditions. The genes encoding RNR are contained in an operon consisting of three genes,

Chapter 4
142
nrdIEF, whereas many other class Ib RNR operons contain a fourth gene, nrdH, that
determines a thiol redoxin protein named NrdH (43). In vitro, S. aureus NrdH was found to be
an efficient reductant of disulfide bonds in low-molecular weight substrates. Moreover, its
ability to reduce NrdEF is comparable to that of thioredoxin-thioredoxin reductase (43). The
ribonucleotide reductase system of L. lactis was presented by Jordan et al. (24), they showed
that the system consist of an NrdEF-type enzyme, and a small electron transport protein
NrdH. The NrdEF enzymes use NrdH proteins as electron transporter in place of thioredoxin
or glutaredoxin used by NrdAB enzymes. The impact of RNR during the aerobic life of
lactobacilli involved in glutaredoxin-like and thioredoxin-thioredoxin reductase systems may
prove also a relevant area of future research due to non-existence of scientific work related to
this phenomenon.
In conclusion, as proposed in figure 47, L. sanfranciscensis is well adapted to maintain redox-
homeostasis during oxidative stress. The influences of some key enzymes involved in
detoxification of oxygen intermediates were evaluated based on cognate knockout mutants of
L. sanfranciscensis. An almost complete glutathione system is existent in L. sanfranciscensis;
composed of glutathione reductase, peroxidase, and glutaredoxin-like proteins, only genes for
the synthesis of GSH are missing in the genome of L. sanfranciscensis. Uptake of thiol
substrates from the environment are accomplished with the help of several transporter
systems. Nonetheless, several more factors have to be elucidated, e.g. peroxidases,
thioredoxin reductase-thioredoxin system, RNR, and redox sensors inside the cells of L.
sanfranciscensis to get an overall picture of the oxidative stress response.

Chapter 4
143
REFERENCES
1. An, H., Z. Zhai, S. Yin, Y. Luo, B. Han, and Y. Hao. 2011. Coexpression of the
superoxide dismutase and the catalase provides remarkable oxidative stress resistance in Lactobacillus rhamnosus. J Agric Food Chem 59:3851-3856.
2. Archibald, F. S. 1986. Manganese: its acquisition by and function in the lactic acid bacteria. Crit. Rev. Microbiol. 13:63-109.
3. Archibald, F. S., and I. Fridovich. 1981. Manganese, superoxide dismutase, and oxygen tolerance in some Lactic acid bacteria. Journal of Bacteriology 146:928-936.
4. Bradford, M. M. 1976. A rapid and sensitive method for the quantitation of microgram quantities of protein utilizing the principle of protein-dye binding. Anal Biochem 72:248-54.
5. Bruno-Barcena, J. M., J. M. Andrus, S. L. Libby, T. R. Klaenhammer, and H. M. Hassan. 2004. Expression of a heterologous manganese superoxide dismutase gene in intestinal lactobacilli provides protection against hydrogen peroxide toxicity. Appl. Environ. Microbiol. 70:4702-4710.
6. Burguière, P., S. Auger, M. F. Hullo, A. Danchin, and I. Martin-Verstraete. 2004. Three different systems participate in L-cystine uptake in Bacillus subtilis. J. Bacteriol. 186:4875-4884.
7. Chaillou, S., M. Champomier-Verges, M. Cornet, A. Crutz-Le Coq, A. Dudez, V. Martin, S. Beaufils, E. Darbon-Rongere, R. Bossy, V. Loux, and M. Zagorec. 2005. The complete genome sequence of the meat-borne lactic acid bacterium Lactobacillus sakei 23K. Nat Biotechnol 23:1527-1533.
8. Cheeseman, K. H., and T. F. Slater. 1993. An introduction to free radical biochemistry. British Medical Bulletin 49:481-493.
9. De Angelis, M., and M. Gobbetti. 2004. Environmental stress responses in Lactobacillus: a review. Proteomics 4:106-22.
10. De Angelis, M., and M. Gobbetti. 1999. Lactobacillus sanfranciscensis CB1: manganese, oxygen, superoxide dismutase and metabolism. Appl Microbiol Biotechnol 51:358-63.
11. Dellaglio, F., S. Torriani, and G. Zapparoli. 1998. Differentiation of Lactobacillus sanfranciscensis strains by randomly amplified polymorphic DNA and pulsed-field get electrophoresis. FEMS Microbiol Lett 166:325-332.
12. During-Olson, L., B. Regenberg, C. Gjermansen, M. C. Kielland-Brandt, and J. Hansen. 1999. Cysteine uptake by Saccharomyces cerevisiae is accomplished by multiple permeases. Curr. Genet. 35:609-617.
13. Engesser, D. M., and W. P. Hammes. 1994. Non-heme catalase activity of lactic acid bacteria. Systematic and Applied Microbiology 17:11-19.
14. Fridovich, I. 1981. Superoxide radical and superoxide dismutases. D.L. Gilbert (ed.), Oxygen and Living Process, Springer-Verlag, New York:250-272.
15. Geueke, B., B. Riebel, and W. Hummel. 2003. NADH oxidase from Lactobacillus brevis: a new catalyst for the regeneration of NAD. Enzyme and Microbial Technology 32:205-211.
16. Green, J., and M. S. Paget. 2004. Bacterial redox sensors. Nature 2:954-967. 17. Hasinoff, B. B. 2003. The intracellular iron sensor calcein is catalytically oxidatively
degraded by iron(II) in a hydrogen peroxide-dependent reaction. Journal of Inorganic Biochemistry 95:157-164.

Chapter 4
144
18. Helanto, M., J. Aarnikunnas, A. Palva, M. Leisola, and A. Nyyssölä. 2006. Characterization of genes involved in fructose utilization by Lactobacillus fermentum. Archives of microbiology 186:51-59.
19. Hueck, C. J., W. Hillen, and M. H. Saier, Jr. 1994. Analysis of a cis-active sequence mediating catabolite repression in gram-positive bacteria. Res Microbiol 145:503-18.
20. Hung, J., D. Cooper, M. S. Turner, T. Walsh, and P. M. Giffard. 2003. Cystin uptake prevents production of hydrogen peroxide by Lactobacillus fermentum BR11. FEMS Microbiol Lett 227:93-99.
21. Hung, J., M. S. Turner, T. Walsh, and P. M. Giffard. 2005. BspA (CyuC) in Lactobacillus fermentum BR11 is a highly expressed high-affinity L-cystine-binding protein. Curr. Microbiol. 50:33-37.
22. Jänsch, A., S. Freiding, J. Behr, and R. F. Vogel. 2011. Contribution of the NADH-oxidase (Nox) to the aerobic life of Lactobacillus sanfranciscensis. Food Microbiology 28:29-37.
23. Jänsch, A., M. Korakli, R. F. Vogel, and M. G. Ganzle. 2007. Glutathione reductase from Lactobacillus sanfranciscensis DSM20451T: contribution to oxygen tolerance and thiol exchange reactions in wheat sourdoughs. Appl Environ Microbiol 73:4469-76.
24. Jordan, A., E. Pontis, F. Aslund, U. Hellman, I. Gilbert, and P. Reichard. 1996. The ribonucleotide reductase system of Lactococcus lactis. Characterization of an NrdEF enzyme and a new electron transport protein. J Biol Chem 271:8779-8785.
25. Kehres, D. G., and M. E. Maguire. 2003. Emerging themes in manganese transport, biochemistry and pathogenesis in bacteria. FEMS Microbiol Rev 27:263-90.
26. Knorr, R. 2000. Adaption and stress response of the carbohydrate metabolism of Lactobacillus sanfranciscensis - Biochemical and genetic characterization of key enzymes involved in acetate production. Grauer.
27. Knorr, R., M. A. Ehrmann, and R. F. Vogel. 2001. Cloning, expression, and characterization of acetate kinase from Lactobacillus sanfranciscensis. Microbiol Res 156:267-77.
28. Korakli, M., and R. F. Vogel. 2003. Purification and characterisation of mannitol dehydrogenase from Lactobacillus sanfranciscensis. FEMS Microbiol Lett 220:281-286.
29. Kullisaar, T., E. Songisepp, M. Aunapuu, K. Kilk, A. Arend, M. Mikelsaar, A. Rehema, and M. Zilmer. 2010. Complete glutathione system in probiotic Lactobacillus fermentum ME-3. Applied Biochemistry and Microbiology 46:481-486.
30. Kusch, H., S. Engelmann, D. Albrecht, J. Morschhauser, and M. Hecker. 2007. Proteomic analysis of the oxidative stress response in Candida albicans. Proteomics 7:686-97.
31. Lewingston, J., S. D. Greenaway, and B. J. Spillane. 1987. Rapid small scale preparations of bacterial genomic DNA suitable for cloning and hydridization analysis. Lett. Appl. Microbiol 5:51-53.
32. Li, Y., J. Hugenholtz, T. Abee, and D. Molenaar. 2003. Glutathione protects Lactococcus lactis and oxidative stress. Applied and Environmental Microbiology 69:5739-5745.
33. Liu, S., B. Saha, and M. Cotta. 2005. Cloning, expression, purification, and analysis of mannitol dehydrogenase gene mtlK from Lactobacillus brevis. Appl Biochem Biotechnol 121-124:391-401.

Chapter 4
145
34. Loprasert, S., W. Whangsuk, R. Sallabhan, and S. Mongkolsuk. 2005. The unique glutathione reductase from Xanthomonas campestris: gene expression and enzyme characterization. Biochem. Biophys. Res. Comm. 331:1324-1330.
35. Lountos, G. T., R. Jiang, W. B. Wellborn, T. L. Thaler, A. S. Bommarius, and A. M. Orville. 2006. The crystal structure of NAD(P)H oxidase from Lactobacillus sanfranciscensis: Insights into the conversion of O2 into two water molecules by the flavoenzyme. Biochem. 45:9648-9659.
36. Lountos, G. T., R. Jiang, W. B. Wellborn, T. L. Thaler, A. S. Bommarius, and A. M. Orville. 2006. The crystal structure of NAD(P)H oxidase from Lactobacillus sanfranciscensis: insights into the conversion of O2 into two water molecules by the flavoenzyme. Biochemistry 45:9648-59.
37. Lucey, C. A., and S. Condon. 1986. Active role of oxygen and NADH oxidase in growth and energy metabolism of Leuconostoc. J. Gen. Microbiol. 132:1789-1796.
38. McCracken, A., M. S. Turner, P. Giffard, L. M. Hafner, and P. Timms. 2000. Analysis of promoter sequences from Lactobacillus and Lactococcus and their activity in several Lactobacillus species. Arch Microbiol 173:383-389.
39. Oktyabrskii, O. N., and G. V. Smirnova. 2012. Redox potential changes in bacterial cultures under stress conditions. Microbiology 81:131-142.
40. Pavlovic, M. 2006. Genexpression und -regulation bei Lactobacillus sanfranciscensis unter sublethalem Hochdruck. Technische Universität München, Freising.
41. Pebay, M., A. C. Holl, J. M. Simonet, and B. Decaris. 1995. Characterization of the gor gene of the lactic acid bacterium Streptococcus thermophilus CNRZ368. Research in Microbiology 146:371-383.
42. Pedersen, M. B., C. Garrigues, K. Tuphile, C. Brun, K. Vido, M. Bennedsen, H. Mollgaard, P. Gaudu, and A. Gruss. 2008. Impact of aeration and heme-activated respiration on Lactococcus lactis gene expression: identification of a heme-responsive operon. J Bacteriol 190:4903-11.
43. Rabinovitch, I., M. Yanku, A. Yeheskel, G. Cohen, I. Borovok, and Y. Aharonowitz. 2010. Staphylococcus aureus NrdH redoxin is a reductant of the class Ib ribonucleotide reductase. Journal of Bacteriology 192:4963-4972.
44. Riebel, B., P. R. Gibbs, W. B. Wellborn, A. S. Bommarius. 2003. Cofactor Regeneration of both NAD+ from NADH and NADP+ from NADPH:NADH Oxidase from Lactobacillus sanfranciscensis. Advanced Synthesis & Catalysis 345:707-712.
45. Rochat, T., J. J. Gratadoux, A. Gruss, G. Corthier, E. Maguin, P. Langella, and M. van der Guchte. 2006. Production of a heterologous nonheme catalase by Lactobacillus casei: an efficient tool for removal of H2O2 and protection of Lactobacillus bulgaricus from oxidative stress in milk. Appl. Environ. Microbiol. 72:5143-5149.
46. Roos, S., P. Aleljung, N. Robert, B. Lee, T. Wadström, M. Lindberg, and H. Jonsson. 1996. A collagen binding protein from Lactobacillus reuteri is part of an ABC transporter system? FEMS Microbiol Lett 144:33-38.
47. Ross, P., A. Claiborne 1997. Evidence for regulation of the NADH peroxidase gene (npr) from Enterococcus faecalis by OxyR. FEMS Microbiology Letters 151:177-183.
48. Saha, B. C. 2004. Purification and characterization of a novel mannitol dehydrogenase from Lactobacillus intermedius. Biotechnol Prog 20:537-42.
49. Sambrook, J., E. F. Fritsch, and T. Maniatis. 1989. Molecular cloning: A laboratory manual. Cold Sping Harbor Laboratory Press Woodburry, N.Y., 2nd ed.
50. Sanger, F., S. Nicklen, and A. R. Coulson. 1977. DNA sequencing with chain-terminating inhbitors. Proc. Natl. Acad. Sci. 74:5463-5467.

Chapter 4
146
51. Serrano, M. L. 2008. Oxidative stress response in Lactobacillus plantarum WCFS1: A functional genomics approach, Wageningen.
52. Smacchi, E., and M. Gobbetti. 1998. Purification and characterization of cystathionine gamma-lyase from Lactobacillus fermentum DT41. FEMS Microbiol Lett 166:197-202.
53. Stolz, P., G. Böcker, W. P. Hammes, and R. F. Vogel. 1995. Utilization of electron acceptors by lactobacilli isolated from sourdough. Z Lebensm Unters Forsch 201:91-96.
54. Stolz, P., G. Böcker, W. P. Hammes, and R. F. Vogel. 1995. Utilization of electron acceptors by lactobacilli isolated from sourdough II Lactobacillus pontis, L. reuteri, L. amylovorus, and L. fermentum. Z Lebensm Unters Forsch 201:402-410.
55. Thomas, E. L. 1984. Disulfide reduction and sulfhydryl uptake by Streptococcus mutans. Journal of Bacteriology 157:240-246.
56. Turner, M. S., T. Woodberry, L. M. Hafner, and P. M. Giffard. 1999. The bspA locus of Lactobacillus fermentum BR11 encodes an L-cystine uptake system. J Bacteriol 181:2192-8.
57. Vallon, O. 2000. New sequence motifs in flavoproteins: evidence for common ancestry and tools to predict structure. Proteins: Struct. Function Gen. 38:95-114.
58. van de Guchte, M., P. Serror, C. Chervaux, T. Smokvina, S. D. Ehrlich, and E. Maguin. 2002. Stress responses in lactic acid bacteria. Antonie Van Leeuwenhoek 82:187-216.
59. Vido, K., H. Diemer, A. Van Dorsselaer, E. Leize, V. Juillard, A. Gruss, and P. Gaudu. 2005. Roles of thioredoxin reductase during the aerobic life of Lactococcus lactis. J Bacteriol 187:601-10.
60. Vogel, R. F., M. Pavlovic, M. Ehrmann, A. Wiezer, H. Liesegang, S. Offschanka, S. Voget, A. Angelov, G. Böcker, and W. Liebl. 2011. Genomic analysis reveals Lactobacillus sanfranciscensis as stable element in traditional sourdoughs. Microbial Cell Factories 10:P. S6 1-11.
61. Wang, X., P. Mukhopadhyay, M. J. Wood, F. W. Outten, J. A. Opdyke, and G. Storz. 2006. Mutational analysis to define an activating region on the redox-sensitive transcriptional regulator OxyR. J Bacteriol 188:8335-8342.
62. Whittaker, J. W. 2012. Non-heme manganese catalase - The "other" catalase. Archives of Biochemistry and Biophysics 525:111-120.
63. Yamamoto, Y., Y. Kamio, and M. Higuchi. 1999. Cloning, Nucleotide Sequence, and disruption of Streptococcus mutans glutathione reductase gene (gor). Biosci. Biotechnol. Biochem. 63:1056-1062.
64. Zhang, J., G. C. Du, Y. Zhang, X. Y. Liao, M. Wang, Y. Li, and J. Chen. 2010. Glutathione protects Lactobacillus sanfranciscensis against freeze-thawing, freeze-drying, and cold treatment. Appl Environ Microbiol 76:2989-2996.
65. Zhang, J., Y. Li, W. Chen, G. C. Du, and J. Chen. 2012. Glutathione improves the cold resistance of Lactobacillus sanfranciscensis by physiological regulation. Food Microbiol 31:285-292.

Concluding remarks
147
CONCLUDING REMARKS
The comprehensive aim of this thesis was to find and characterize metabolic activities of
lactobacilli that are relevant in wheat sourdough fermentations and contribute to the final
bread aroma and volume, respectively. This aspect was outlined in the title of this thesis
“Contribution of thiol- and hydroxycinnamic acids metabolism of sourdough lactobacilli on
structural and sensorial properties of wheat breads”. Moreover, an insight was given into the
oxidative stress response of L. sanfranciscensis; this germ is the predominant microorganism
in type-I-sourdough fermentations. In the early phase of evolvement, sourdough contains a lot
of dissolved oxygen; it could be also introduced into the dough during the kneading. In both
situations, an oxygen tolerant microorganism has advantages in competition as compared to
strictly anaerobic organisms. It should be mentioned that in all chapters of this thesis focus
was laid on L. sanfranciscensis. Nonetheless, screening approaches in chapter 3 confirmed
that L. sanfranciscensis is not capable to generate volatile aroma odors in fermentations with
phenolic compounds. Therefore, other lactobacilli were utilized to find enzyme activities able
to generate volatile aroma compounds from hydroxycinnamic acids.
The importance of gluten proteins for the baking quality of wheat flours is explained by their
ability to form high molecular weight aggregates that are stabilised by covalent bonds and
non-covalent interactions between monomers. The use of sourdough in wheat baking
improves the sensorial and nutritional quality of the products. Especially proteolytic events
during fermentation are highly relevant for the aroma formation in wheat breads; however, the
amount of the glutenin macropolymer is strongly reduced during sourdough fermentations.
Lactobacilli from sourdough were characterized with respect to their glutathione reductase
(GshR) activity; L. sanfranciscensis, the cognate mutant ∆gshR, and two strains (L. reuteri
and L. pontis) that are GshR–negative, respectively, were used to evaluate their impact on
thiol levels during wheat sourdough fermentations. L. sanfranciscensis increased thiol levels
in wheat doughs, whereas a decrease of thiols was observed in wheat doughs fermented with
L. sanfranciscensis ∆gshR. The extracellular accumulation of thiols is particularly relevant in
wheat doughs. The quality and quantity of gluten proteins in wheat flours is of paramount
importance for wheat bread quality, and the intermolecular disulfide crosslinks of glutenin
subunits to form the glutenin macropolymer are dependent on the presence or absence of low
molecular weight sulfhydryl compounds. The direct impact of the glutathione reductase of L.
sanfranciscensis on gluten proteins during sourdough fermentations was shown in figure 21.

Concluding remarks
148
The degradation of the glutenin fraction was deviating by approx. 20% between the wild type
strain of L. sanfranciscensis and the mutant TMW1.53∆gshR. Thus, the knockout of a single
enzyme activity resulted in a decreased glutenin network breakdown during wheat sourdough
fermentations. It should be noted that attention should focus not only on single enzyme
reactions by the sourdough microbiota, but also on an overall screening approach of different
lactobacilli in regard to redox potential during wheat sourdough fermentations. Thus, an
overall perception concerning the reductive or oxidative potential of lactobacilli during
fermentations could lead to the best selection of fermentation microorganism in respect to the
desired quality parameter.
Crucial results were obtained in respect to the content of ferulic acid during wheat sourdough
fermentations (see figure 24) while performing the analyses for the above mentioned
determinations on thiol levels; thus, resulted in the examinations of chapter 3 “Distribution of
enzyme activities in lactobacilli able to generate volatile aroma compounds from hydroxy-
cinnamic acids”. The liberation of ferulic acid during wheat sourdough fermentations by L.
sanfranciscensis was the starting point, and led to the following questions: Are lactobacilli
able to release bonded ferulic acid in arabinoxylan during wheat sourdough fermentations? Is
this a strain specific phenomenon? Is the liberation of ferulic acid during fermentations
achieved by microbial or exogenous enzyme activities? Is the redox potential in the dough
system the main factor for ferulic acid release during sourdough fermentations? What are the
fates of free forms of phenolic acids in fermentations? By using database analysis the
sequenced Lactobacillus genomes were examined for putative arabinoxylan degrading
enzymes to identify distinctive features for the metabolism of plant cell wall backbone in
lactobacilli. The cascade for generating volatile aroma compounds by degradation of
arabinoxylan should be composed of the following enzymes: 1. endo-1,4-β-xylosidase and
xylanase, 2. α-L-arabinofuranosidase, 3. cinnamoyl esterase, 4. phenolic acid decarboxylase
(see also figure 23). L. brevis TMW1.1326 encoded several proteins with the ability to
hydrolyze glycosylated plant secondary metabolites. The characterization of the recombinant
α-L-arabinofuranosidase and β-xylosidase, respectively, confirmed active enzymes with the
ability to degrade water-soluble wheat arabinoxylan. Cinnamoyl-esterase activity of
lactobacilli was determined using a plate screening approach with ethylferulate as the
substrate; the free form of hydroxycinnamic acids is the requirement for gaining volatile
aroma compounds during fermentations. The physiological tests for predicted cinnamoyl
esterase activity could be ensured on a genetically background. Predicted esterases of

Concluding remarks
149
lactobacilli able to hydrolyze esterifies hydroxycinnamates were heterologously expressed
and characterized. Moreover, the fate of the free liberated ferulic acid was verified by a PCR-
screening for phenolic acid decarboxylase genes in selected lactobacilli. In fermentation
studies with lactobacilli using mMRS broth supplemented with ferulic acid and coumaric
acid, respectively, the fermentation supernatants were analysed by HPLC to determine the
conversion of the substrates to volatile aroma compounds, e.g. 4-vinyl-2-methoxyphenol.
Moreover, a combination of L. brevis TMW1.1326 and L. pontis TMW1.1086 showed
capable results related to the generation of active aroma odors. With the culture combination
and wort as the fermentation substrate, almost 11 µM 4-vinylguaiacol and 60 µM 4-
vinylphenol were accumulated after 120 hours. Thus, the selection of strains capable of
generating aroma active substances in wheat sourdough fermentations and the best choice of
wheat cultivar in respect to phenolic contents could lead to aroma enhancement. A
combination of strains for substrate fermentations seems to have potential in regard to the
ability to liberate improved aroma doughs.
Finally, an insight of the oxidative stress response in Lactobacillus sanfranciscensis was
given; two main enzyme activities NADH oxidase and glutathion reductase, respectively,
were examined in L. sanfranciscensis and their role in maintaining redox homeostasis was
elucidated. This study demonstrated that GshR of L. sanfranciscensis plays an important role
to the oxygen tolerance of L. sanfranciscensis (see chapter 4). An almost complete glutathione
system is existent in L. sanfranciscensis; composed of glutathione reductase, peroxidase, and
glutaredoxin-like proteins, only genes for the synthesis of GSH are missing in the genome of
L. sanfranciscensis. Uptake of thiol substrates from the environment are accomplished with
the help of several transporter systems. Moreover, for heterofermentative lactic acid bacteria,
it has been observed that under aerobic conditions the growth yield, as well as the ATP yield,
was markedly higher than that under anaerobic conditions. The balance between attempting to
attain maximal energy yields and maintaining redox balance is shifted in favor to the energy
gain, when L. sanfranciscensis transfers the electrons to external electron acceptors such as
fructose or oxygen. The importance of NADH oxidase is likely to lie also in maintaining the
intracellular redox balance, thus assuring fast aerobic growth by the consumption of NADH.
The essential function of Nox is that it allows O2 to act as a terminal electron acceptor, just
like in more conventional, but much more complex respiratory systems. L. sanfranciscensis is
lacking heme and is devoid of cytochromes, exceptional is a gene for cytochrome d ubiquinol
oxidase subunit 1 in the genome of L. sanfranciscensis TMW1.1304. A higher growth yield

Concluding remarks
150
for L. sanfranciscensis under aerobic conditions in medium supplemented with heme and
menaquinone, respectively, could not be seen in comparison to normal nutrient broth (data not
shown). Thus, an activation of a respiratory chain in L. sanfranciscensis was not observed.

Appendix
151
5 5. APPENDIX
5.1 GENERAL MATERIALS AND METHODS
5.1.1 Used equipment in the studies according to chapter 2, 3, and 4.
Table 23. Equipment Equipment Model Supplier Anaerocult devices Anaerobic jar Merck Millipore Analytical balance CPA Sartorius, Scaltec Instruments Autoclave 2540 ELV, Varioklav Systec GmbH, H+P Labortechnik Blotting oven MINI 10 MWG Biotech AG Centrifuge Sigma 1K15, 6-16K Sigma Labortechnik J-6, J-2 Beckman Hermle Z383K, Z382K Hermle Labortechnik Electroporation system Bio-Rad Gene pulser Bio-Rad Laboratories Fluorescence microscopy Stereomikroskop Carl Zeiss GmbH FPLC Biologic HR Bio-Rad Laboratories Model 2128 Collector Bio-Rad Laboratories Gel chamber Easy Cast Owl Separation Systems Gel documentation Herolab Herolab HPLC Ultimate 3000 Dionex Incubator Certomat B. Braun Biotech Heraeus B5042E Heraeus Instruments Memmert INB Memmert GmbH & Co. KG Laminar flow HERA safe Heraeus Instruments Luminescence Spectrometer LS 50B Perkin Elmer Microscope Axiolab Carl Zeiss GmbH MQ water Euro 25, RS90-4/UF pure SG Wasseraufbereitung GmbH water system Nanodrop Nanodrop 1000 Peqlab Biotechnologie GmbH PCR-Cycler Primus 96 Plus MWG Biotech AG Mastercycler gradient Eppendorf AG Cycler Applied Biosystems pH electrode InLab 412 Mettler-Toledo pH device Knick pH 761 Knick Photometer Novaspellq Pharmacia Biotech Pipettes Pipetman Gilson-Abomed Plate readers TECAN Spectrafluor TECAN GmbH TECAN Sunrise TECAN GmbH Power supplies MPP 2x3000 Power S. MWG Biotech AG Electrophoresis PS EPS3000 Pharmacia Biotech

Appendix
152
Rotary evaporator VV2000 Heidolph Sequencer Model 377A Applied Biosystems SDS-PAGE Mini Protean III-System Bio-Rad Laboratories Shaking devices Certomat R B. Braun Biotech International Vortex 2 Genie Scientific Industries Inc. Spiral plater - IUL Stirrer - IKA Labortechnik Thermo block Techne DRI-Block DB3 Thermo-Dux GmbH Ultrasonic bath Sonorex Super RK 103H Bandelin electronic Ultra sonification UP 200S Dr. Hielscher GmbH SONOPLUS/SH70G Bandelin electronic UV table Herolab UVT 28M Herlab GmbH Laborgeräte Vacuum controler - KNF Neuberger Water bath Lauda BD LAUDA Dr. Wobser GmbH
5.1.2 Expendable materials
Other materials used in the studies according to chapter 2, 3, and 4.
Table 24. Other materials Material Type Supplier Anaerocult C mini, A Merck Electroporation cuvettes - Biozym Scientific GmbH Filter, sterile Filtropur S 0.2 µm Sarstedt HPLC column C18 rp 100 x 4.6 mm Phenomenex Ltd. Polyspher OAKC column Merck Microtiter plates Multi well 96 flat bottom Sarstedt Nylon membranes - Amersham Biosciences PCR reaction tubes 100 µl Sarstedt Petry dishes 92 x 16 mm Sarstedt Pipet tips 2 µl, 10 µl, 200 µl, 1000 µl Peqlab Reaction tubes 2 ml, 1.5 ml, 200 µl Eppendorf Sensi-discs sterile Becton Dickinson GmbH Tubes, sterile 5 ml, 15 ml, 50 ml Sarstedt TLC Silica gel TLC 60 WF 254S Merck VISKING dialysis tubing 20/32 SERVA FPLC columns HisTrap HP Amersham Biosciences
5.1.3 Kits
Kits used in the studies according to chapter 2, 3, and 4.
Table 25. Commercially available kits Kit Type Supplier DIG-DNA Labeling Mixture Southern hybridization Roche Diagnostics E.Z.N.A. Bacterial DNA Kit DNA isolation Omega Bio-Tek Inc. GenomeLab DTCS-Quick Start Kit Sequencing Beckman Coulter KOD hot start DNA polymerase DNA polymerase Novagen EMD chemicals PeqGold plasmid miniprep kit Plasmid miniprep PEQLAB Biotechnologie PeqGold gel extraction kit Gel extraction PEQLAB Biotechnologie QIAquick PCR purification kit PCR purification Qiagen GmbH

Appendix
153
RNeasy Mini kit RNA isolation Qiagen GmbH Wizard Plus SV Minipreps DNA Plasmid isolation Promega
5.1.4 Chemicals
Chemicals used in the studies according to chapter 2, 3, and 4.
Table 26. Chemicals Chemical Purity Supplier 6 x DNA loading dye - Fermentas GmbH Acetic acid 99-100% Merck Acetone HPLC grade Carl Roth GmbH Acetonitril HPLC grade Carl Roth GmbH Acrylamid-bis solution 30 % (w/v) SERVA Agar - Difco Agarose - Biozym Scientific GmbH Ampicillin sodium salt 93.3% Gerbu Biotechnik GmbH Ammonium chloride ≥ 99.5% p.a. Carl Roth GmbH Ammonium persulfate Electrophoresis grade SERVA Arabinan ~ 95% Megazyme Arabinose > 98% Sigma-Aldrich Arrow Taq-polymerase - MP Biomedical Arrow Taq-polymerase - Invitrogen Bio-Rad Protein assay - Bio-Rad Lab. GmbH Biotin ~ 98% Sigma-Aldrich Boric acid ≥ 99.5% Carl Roth GmbH Bromphenol blue Electrophoresis Sigma-Aldrich BSA fraction V for bio use Merck CaCl2 x 2 H2O p.a. Merck Caffeic acid - Sigma-Aldrich Calcein - Sigma-Aldrich Chloroform p.a. Merck Citric acid p.a. Sigma-Aldrich Cobalamine p.a. Sigma-Aldrich Coumaric acid - Sigma-Aldrich Cyanocobalamine p.a. Sigma-Aldrich Cycloheximide - Sigma-Aldrich Cystathionine - Sigma-Aldrich Cysteine hydrochloride p.a. Merck Diamide - Sigma-Aldrich Di-ammonium hydrogen citrate p.a. Merck Dithiothreitol - Sigma-Aldrich DMSO ≥ 99.5% p.a. Carl Roth GmbH DNA Polymerase - Promega dNTP - MP Biomedical, Invitrogen DTNB - Sigma-Aldrich DTT high purity Gerbu Biotechnik GmbH EDTA for molecular biology Sigma-Aldrich Erythromycin - Sigma-Aldrich Ethanol, denatured 99% with 1% MEK Laborbedarf Nierle

Appendix
154
Ethanol, absolute ≥ 99.8% VWR Ethidium bromide 1% in H2O Merck Ethyl acetate p.a. Merck Ethyl ferulate 98% Sigma-Aldrich FD restriction buffer - Fermentas GmbH FD restriction enzymes - Fermentas GmbH Ferulic acid 99% Sigma-Aldrich Folic acid p.a. Sigma-Aldrich Formic acid p.a. Sigma-Aldrich Fructose for biochemical use Sigma-Aldrich Glucose for biochemical use Sigma-Aldrich Glycerol 99.5% high purity Gerbu Biotechnik GmbH Glycine p.a. Merck GSH - Sigma-Aldrich GSSG - Sigma-Aldrich H2O2 - Sigma-Aldrich HCl 37% p.a. Merck HEPES buffer - Sigma-Aldrich Imidazole for biochemical use Sigma-Aldrich IPTG p.a. Gerbu Biotechnik GmbH Iron sulfate heptahydrate p.a. Fluka Chemie GmbH Isopropanol p.a. Scharlau Chemie S.A. KH2PO4 p.a. Carl Roth GmbH K2HPO4 x 3H2O p.a. Merck Kalium acetate p.a. Merck KCl p.a. Merck Ketobutyrate - Sigma-Aldrich KPi buffer - Sigma-Aldrich Lactic acid p.a. Sigma-Aldrich Lysozyme - SERVA 2-Mercaptoethanol - Sigma-Aldrich Maltose for biochemical use Merck Meat extract - Merck MES buffer - Sigma-Aldrich Methanol HPLC-grade Mallinckrodt Baker B.V. Methyl caffeate - Sigma-Aldrich Methyl coumarate - Sigma-Aldrich Methyl-tert-butylether - Oxeno GmbH MgCl2 x 6 H2O p.a. Merck MgSO4 x 7 H2O p.a. Merck MnCl2 p.a. Merck MnSO4 x 4 H2O p.a. Merck MTT - Sigma-Aldrich NaCl p.a. Merck NADH - Sigma-Aldrich NADPH - Sigma-Aldrich NaH2PO4 p.a. Sigma-Aldrich Na2HPO4 p.a. Sigma-Aldrich NaOH p.a. Merck NH4Cl p.a. Merck

Appendix
155
n-Hexane p.a. Merck n-Propanol p.a. Merck Nicotinic acid p.a. Sigma-Aldrich Ninhydrin p.a. Merck PAGERulerTM Protein Ladder - Fermentas GmbH Pantothenic acid p.a. Sigma-Aldrich Paraffin oil - Sigma-Aldrich Paraquat - Sigma-Aldrich Peptone from caseine for microbiology Merck Phenazine methosulfate - Sigma-Aldrich Phosphoric acid HPLC grade Sigma-Aldrich p-Nitrophenol spec. grade Sigma-Aldrich p-Nitrophenolacetate - Sigma-Aldrich p-Nitrophenolbutyrate - Sigma-Aldrich p-Nitrophenolcaprylate - Sigma-Aldrich p-Nitrophenyl arabinofuranoside - Sigma-Aldrich p-Nitrophenyl xylopyranoside - Sigma-Aldrich Pyridoxal 5’-phosphate - Sigma-Aldrich Primer - MWG-Biotech AG 1-propanol > 99.5% Carl Roth GmbH Proteinase K - Roche diagnostics Pyridoxal-HCl p.a. Sigma-Aldrich Random hexadeoxynucleotides - Promega Reverse transcriptase - Promega Riboflavin p.a. Sigma-Aldrich RNase H minus - Promega RNAprotect - Qiagen GmbH RNAse - Roche diagnostics RQ1 RNase-free DNase - Promega SDS research grade SERVA Sodium acetate x 3 H2O p.a. Merck Sodium citrate p.a. Merck Sodium gluconate p.a. Merck Sodium phosphate p.a. Merck Sucrose HPLC-grade Gerbu Biotechnik GmbH Sulfuric acid p.a. Merck T4 DNA Ligase - Fermentas GmbH TEMED p.a. Merck Thiamine HCl - Sigma-Aldrich Thymine p.a. Sigma-Aldrich Tris ultra pure MP Biomedicals Tris base ultra pure ICN Biomedicals GMBH Tris HCl p.a. Merck Tween 80 - Mallinckrodt Baker B.V. Water molecular biology grade Sigma-Aldrich Wheat arabinoxylan insoluble ~ 80% Megazyme Wheat arabinoxylan soluble > 95% Megazyme Wort pre-stage beer process Weihenstephaner Xylan - Megazyme Xylose - Sigma-Aldrich

Appendix
156
Yeast extract for microbiology Merck
5.1.5 Restriction enzymes
All restriction enzymes used in this work were provided by MBI Fermentas GmbH, St. Leon-
Rot, Germany and applied as recommended in manufacturer’s instructions. Sometimes Fast
Digest enzymes were used to reduce the incubation times.
5.1.6 Plasmids
As mentioned in chapter 3, heterologously expression of enzymes was achieved with the help
of plasmid pBADB/Myc-His B (Invitrogen). The pBAD/Myc-HisB plasmid is a pBR322-
derived expression vector designed for regulated, dose-dependent recombinant protein
expression and purification in E. coli. Optimum levels of soluble, recombinant protein are
possible using the araBAD promoter (PBAD) from E. coli. The regulatory protein, AraC, is
provided on the pBAD/Myc-His vectors allowing regulation of PBAD. In the presence of L-
arabinose, expression from PBAD is turned on while the absence of L-arabinose produces very
low levels of transcription from PBAD.
Figure 48. The figure summarizes the features of the pBAD/Myc-His vector, for more information see also www.invitrogen.com.
The plasmid pME-1 (see chapter 2 and 4) was transformed in E. coli DH5α and used for the
construction of the integration vector pME-1∆gshR and pME-1∆nox, respectively. The
plasmid PNG201 was transformed in L. reuteri BR11 (formerly L. fermentum BR11)
according to Turner et al. (see chapter 4) to obtain L. reuteri BR11∆cyuC defective in the L-
cystine binding protein CyuC.

Appendix
157
5.1.7 Media
Lactobacilli listed in chapter 2 and 3 were cultivated in modified MRS (mMRS) medium
according to Stolz et al. (1995).
Table 27. Composition of mMRS-medium Reagent Quantity Maltose 10.0 g Fructose 5.0 g Glucose 5.0 g Peptone from casein 10.0 g Yeast extract 5.0 g Meat extract 5.0 g K2HPO4 x 3H2O 4.0 g KH2PO4 2.6 g NH4Cl 3.0 g L-Cystein-HCl 0.5 g Tween 80 1.0 g Mg2+-Mn2+-stock solution 1.0 ml Vitamin-Mix-stock solution 1.0 ml MQ water ad 1.0 L pH 6.2
For agar plates, 1.5% agar was additionally added. The components were dissolved in 800 ml
MQ water; all sugars were dissolved separately in 200 ml MQ water. Sugars and the other
components were autoclaved separately, and mixed together after cooling. Finally, 1 ml sterile
filtrated Mg2+-Mn2+-stock solution (MgSO4 x 7 H2O, 100 g/L; and MnSO4 x 4 H2O, 50 g/L)
and 1 ml vitamin-mix-stock solution (0.2 g/L cobalamine, 0.2 g/L folic acid, 0.2 g/L nicotinic
acid, 0.2 g/L panthotenic acid, 0.2 g/L pyridoxal-HCl, and 0.2 g/L thiamine) were added.
All E. coli strains (e.g. TOP10, DH5α) were cultivated using LB broth (peptone from casein
10 g/L, yeast extract 5 g/L, NaCl 5 g/L, MQ water ad 1 L, pH-value of 7.2) or LB agar plates,
additionally 1.5% agar was supplemented.
5.1.8 Preparation of electro competent E. coli cells and transformation approach
200 ml LB broth in an Erlenmeyer flask was inoculated 1% with an overnight grown pre-
culture of E. coli. The cells were incubated on a horizontal shaker 250 U/min at 37°C, and
grown to an optical density (OD 590nm) of 0.5–0.6. Following, the cells were harvested by
centrifugation (4°C, 6000 U/min, 15 minutes) and washed twice with 200 ml sterile, ice-cold
MQ water and once with 30 ml glycerol (10% (v/v)). Subsequently, the washed cells were
resuspended in 1 ml glycerol (10% (v/v)), aliquoted to 100 µl and deep-frozen in an ethanol
bath (-80°C) or used directly in transformations using electroporation. The transformations

Appendix
158
were conducted with a Gene Pulser using appropriate cuvettes. 100 µl electro competent cells
were thawed and mixed together with 2 µl ligation mix, then transferred to pre-cooled
cuvettes. After transformation, 900 µl SOC broth (yeast extract 5 g/L, tryptone 20 g/L, NaCl
0.6 g/L, potassium chloride 0.2 g/L, magnesium chloride 10 mM, magnesium sulphate 10
mM, and glucose 20 mM) was instantly added to the cells; the cells were incubated at 37°C
and 220 U/min for one hour. Subsequently, the cells were streaked out on LB agar plates
supplemented with ampicillin and incubated aerobically overnight at 37°C. Grown
transformants were picked with sterile toothpicks and again struck out on LB agar plates
supplemented with ampicillin. The cloning success was assured with colony PCR using
specific primer sets (forward primer: derived from the cloned gene; reverse primer: derived
from vector pBADB/Myc-His B). Positive clones were incubated in 25 ml LB broth
supplemented with ampicillin, harvested, and cryo cultured.
5.1.9 Determination of protein concentrations and performance of SDS-PAGE gels
The Bio-Rad protein assay, based on the method of Bradford was used for determining
protein concentrations. One dimensional sodium dodecyl sulphate polyacrylamide gel
electrophoresis (SDS-PAGE) was performed to evaluate protein size distribution in crude
cellular extracts as well as purified fractions after FPLC. The 12% polyacrylamide gels were
prepared as follows. The separating gel contained 3.35 ml MQ water, 2.5 ml Tris-HCl (1.5 M,
pH 8.8), 40 µl of 25% SDS solution and 4 ml of acrylamide/bis 30%. The stacking gel
consisted of 3.05 ml MQ water, 1.25 ml Tris-HCl (0.5 M, pH 6.8), 20 µl of 25% SDS solution
and 665 µl of acrylamide/bis 30%. The cross-linking of the gels was started after
supplementation of 50 µl ammonium persulfate (APS) 10% and 12 µl TEMED. After gel
formation, 10 µl of sample was mixed with 10 µl of denaturating buffer and heated for five
minutes at 94°C.
Table 28. Composition of denaturating and electrophoresis buffer Denaturating buffer Electrophoresis buffer Reagent Quantity Reagent Quantity Tris-HCl 0.5 M pH 6.8 1.0 ml Tris base 9.0 g Glycerol 87% 920 µl Glycine 43.2 g SDS 25% 700 µl SDS 3.0 g 2-Mercaptoethanol 400 µl MQ water 600 ml Bromphenol blue 400 µl pH 8.3 MQ water 4.58 ml

Appendix
159
10 µl of denatured protein fractions were applied to the gel cavities; for protein size
determination 10 µl PAGERulerTM protein ladder was used. Separation was started at 70 V for
15 minutes, and then voltage was increased to 120 V for approx. two hours. Proteins were
visualized by Coomassie staining method. Following, the gels were immersed in staining
solution (filtrated mixture of 80 ml MQ water, 120 ml ethanol, 100 ml acetic acid (20%), and
one tablet PhatGelTMBlueR) and heated in a microwave for one minute. Subsequently, the
gels were gently shaken for at least 10 minutes. Staining solution was discarded and a de-
staining solution (40 ml ethanol, 20 ml acetic acid (100%), 140 ml water) was applied and
heated again in the microwave for approximately one minute. The de-staining solution was
exchanged and the gels were shaken for 3-4 hours. Finally, the gels were washed with MQ
water and digitalized by scanning.
5.1.10 PCR and agarose gel electrophoresis
Generally, DNA was amplified with thermo cyclers (PRIMUS 96 plus) by using Taq Core
polymerase. Unless stated otherwise, 1.5 mM MgCl2, 0.2 mM dTNPs, 0.5 µM primers, water,
and 1.5 U Taq polymerase were used for PCR. Standard conditions for PCR were as follows:
Initially, genomic DNA was denatured (94°C/3 min). Following, 32 cycles were performed
consisting of a denaturation step (94°C/1 min), a primer annealing step (melting temperature
of primer minus 3°C/45 seconds), and an elongation step (72°C, depending on fragment
length – extension rate of the polymerase, 1 kb/minute). PCR’s for cloning or sequencing
purposes were performed with a proof-reading polymerase (KOD Hot Start DNA
polymerase). 1.5 mM MgSO4, 0.2 mM of each dNTP, 0.3 µM of primers, water, and 0.02
U/ml KOD polymerase was used in PCR. Standard conditions for PCR were as follows:
Initially, genomic DNA was denatured (94°C/20 seconds). Following, 32 cycles were
performed consisted of a denaturation step (94°C/20 seconds), a primer annealing step (lowest
primer Tm°C for 15 seconds), and an elongation step (70°C, depending on fragment length –
extension rate of KOD, 1 kb/15 seconds for targets of 500–1000 bp).
Agarose gel electrophoresis was performed to evaluate the amplification success. 1–1.5%
agarose gels were prepared with 0.5 x TBE buffer (10 x TBE buffer: 150 g/L Tris, 26.2 g/L
boric acid, 9.0 g/L EDTA, pH-value of 8.9) or 1 x TAE buffer (50 x TAE buffer: 0.1 M
EDTA, 1 M acetic acid (100%), 2 M Tris, pH-value of 8.2), respectively. PCR products were
mixed with a loading dye in a ration of 5:1. Separation was routinely performed in
electrophoresis chambers (120 x 138 mm) at 90–120 V for one hour. DNA ladders were
applied and served as a control. Gels were stained with ethidium bromide; the DNA was

Appendix
160
visualized under UV-light (wavelength 320 nm) and finally digitalized by gel documentation
system.
5.1.11 Isolation of genomic DNA, plasmids, and purification of PCR products
PCR products obtained in chapter 2, 3, and 4 were purified using the QIAquick PCR
purification kit; for preparative TAE agarose gels the isolation was achieved by using the
PeqGold gel extraction kit. Plasmids were isolated with the help of PegGold plasmid miniprep
kit or Wizard Plus SV Minipreps DNA kit according to the manufacturer’s instructions.
Chromosomal DNA of lactobacilli for screening studies was isolated using the E.Z.N.A.
bacterial DNA kit. In general, the evaluation of the isolation success was determined by
analytical agarose gel electrophoresis. Moreover, the amount of DNA was quantified by
analysis with a Nanodrop 1000 device according to the manufacturer’s instructions.
5.1.12 Digestion and ligation
Restriction enzyme digestions with the appropriate enzymes and ligations with T4-DNA
ligase were performed according to the recommendations of the manufacturer (Fermentas).
5.2 SEQUENCES
The nucleotide sequence of the Lactobacillus sanfranciscensis TMW1.53 glutathione
reductase (gshR) and CyuC-like protein genes have been assigned the GeneBank accession
numbers DQ866807 and EF422159, respectively. The sequence of the genomic region of nox
has been registered under the accession number AB035801. The nucleotide sequences of the
Lactobacillus sanfranciscensis TMW1.53 predicted Mn2+/Fe2+ transporters of the nramp
family MntH1 and MntH2 protein genes have been assigned with accession number FJ440569
and FJ440570, respectively. The genes of the heterologously expressed cinnamoyl esterases
of lactobacilli used in chapter 3 possess the following accession numbers: BAG26088 for
Lactobacillus reuteri TMW1.106, BAG27654 for Lactobacillus fermentum TMW1.890,
CAD65143.1 for Lactobacillus plantarum TMW1.460, ABJ61050 for Lactobacillus gasseri
TMW1.1173, AAV43644 for Lactobacillus acidophilus TMW1.697, and ABX27728 for
Lactobacillus helveticus TMW1.1176. The cloned genes of Lactobacillus brevis TMW1.1326
for α-L-arabinofuranosidase protein and β- xylosidase protein possess the accession numbers
YP_796302 and YP_794569, respectively.

Appendix
161
Sequence of the cystathionine-γ-lyase of Lactobacillus fermentum TMW1.890:
ATGAAGTTTAACACCCAATTAATTCACGGCGGCATTAGCGAAGACCCAACCACCGGGGCGGTTTCGACCCCAATTTACCGCTCCTCAACCTTCCGTCAACACGTCCTCGGCGGTGGCCCCAAGTGGGAATACGCCCGGACCGGCAACCCGACCCGGGCCTCCTTGGAACTCTTAATGGCCCAACTAGAAGAAGGGGTTGCTGGCTTCGCCTTTGCCTCGGGATCGGCCGCCATCCACGCCGTCTTTTCCCTCTACTCCTCCGGCGATCACTTCATCATTGGTAAGGACGTCTACGGGGGGACCTTCCGTTTGATCAACAAGGTCCTGAAGCGTTTCGGCCTCGAATTTACGGTTGTCGACACCCAGGACCTAGCGGCGGTCGAAGCGGCCGTGCAAGACAACACGGTGGCCATTTACTTTGAAACACCCACCAACCCGCTCTTGGAGGTTTCAGACATCGAAGCGATTGCTAAGATCGCCAAGAAGCATGGCTTAAAGACGGTCATTGATAACACCTTTGCCACGCCGTATAACCAACGCCCGCTGACCCTGGGCGCCGACATTGTAGTTCACTCTGCCACCAAGTACCTGGGCGGTCACTCCGACGTGGTGGGGGGGATTGCCGTTACGAACGACGAGGAAATTGCCGAACAGTTGGCCTTCATCCAAAACTCGATTGGCGCCGTCCTTGGGCCCGACGACTCCTGGCTTCTGATGCGGGGGATTAAGACCCTCGGCGCCCGAATGCGGATCCACCATGAAAACACCGCCGCCGTCATTGAACTGTTGGAAAAGGACCCGCGGGTTGCTCGGGTACTGTACCCGGGGCTGCCAGATTTCCCGGGACATGATATCGCGGCTAAGCAAATGGACCACTTCGGCGCCATGGTGTCCTTTGAACTGCAAACGGGGCTCTCGGCAAAGAAGTTTGTCGAAAGCCTGCAGGTGATTACCCTAGCCGAAAGCCTCGGTGGGATCGAGAGCCTGATTGAAGTGCCGGCGGTGATGACCCACGGTTCCATTCCGCGTGAGGTCCGCCTGCAAAACGGGATTAAGGACGAATTGATCCGCTTGTCGGTTGGGATCGAAGACGAAGAAGACCTCGTGGCAGACTTACAGCAAGCCCTGGACCAATTATAG MKFNTQLIHGGISEDPTTGAVSTPIYRSSTFRQHVLGGGPKWEYARTGNPTRASLELLMAQLEEGVAGFAFASGSAAIHAVFSLYSSGDHFIIGKDVYGGTFRLINKVLKRFGLEFTVVDTQDLAAVEA AVQDNTVAIYFETPTNPLLEVSDIEAIAKIAKKHGLKTVIDNTFATPYNQRPLTLGADIVVHSATKYLGGHSDVVGGIA VTNDEEIAEQLAFIQNSIGAVLGPDDSWLLMRGIKTLGARMRIHHENTAAVIELLEKDPRVARVLYPGLPDFPGHDIAAK QMDHFGAMVSFELQTGLSAKKFVESLQVITLAESLGGIESLIEVPAVMTHGSIPREVRLQNGIKDELIRLSVGIEDEEDLVADLQQALDQL
Sequences of L. sanfranciscensis TMW1.53 related to genes involved in the oxidative stress
response (see also chapter 4.3.8):
Glutaredoxin-like NrdH (accession number: ABK51755)
…MNSITVFTKNNCIQCKMTKRFLEEHNIDFVEKNTSENPEFVTYLKELGFQVVPVVEVEGAESFTGFRPDCLNKLVA
EFA
Thioredoxin (accession number: ABK51756)
…MTIVDFWAPWCGPCKIMDPILDKLEQQFAGKVKFAKVNVDNQQEIAKEYSVY GMPTFVLFKNGKGVEKVTGVY
PIEKLTHYLNRKLEEVENSNG
Thioredoxin reductase (accession number: ABK51757)
MSRKLYDITIIGGGPIGMFAGFYAGMRNAKVQIIESLSELGGQVNALYPEKTILDVAGFAGLKGSELINNLQTQLDTM
PEVEQRVGTKVTNVIRKDDHFEIETDQATYETKAVILATGNGSFKPRELRADNVDAVAEKFITYSVRDLKKFANQD
VIVAGGGDSAVDMALMLEPVANHVSLLHRRNEFRGLENMVDKLKASSVEILTPYLIKQLDEIDGRLQVTAKKNEFK
LISS....
Nach Submission vervollständigt zu:
MSHKLYDITIIGGGPIGMFAGFYAGMRNAKVQIIESLSELGGQVNALYPEKTILDVAGFAGLKGSELINNLQTQLDT
MPEVEQRVGTKVTNVIRKDDHFEIETDQATYETKAVILATGNGSFKPRELRADNVDAVAEKFITYSVRDLKKFANQ
DVIVAGGGDSAVDMALMLEPVANHVSLLHRRNEFRGLENMVDKLKASSVEILT PYLIKQLDEIDGRLQVTAKKLKT
DDESTFMADKLVVNYGFISNNKDLESWQIQPALNHHLVEVNSEMETSEPGVFSIGDQATYPGKDTLIVTGFGEAPVA
INEIMKRLYPDRRMPIHSTALHK

Appendix
162
Ribonucleotide reduction protein NrdI
MKPLKLIFISNTGNTRNFAENLVNYAQEQNQKNPDYPLLSIEEISEQTDFGNETEPYFVSVPTYLSGGDGTGDNVKEV
MTTILGEYLDYHDNAKQCLGIIGSGNKNFNIQYCLTAKRYSKRFNVPFLADFELRGNDKDVQRIYEDMVERTKEVN
Q
Ribonucleotide reduction protein NrdH (rot ), NrdE (grün), NrdF (blau) AAAACTCGTGATCCATAGTCAATGGTGCTTTTAGAAACACACCGTTATCTGAAACAAAACTAAGCGTGTAATTCAATAAGGTATATTCCCAATG
TTTTTCATCATGTTGAACATCTGGATTTTCTGTGTAATAAAAGTTGTTCATGATAGCACGTCCTCAAAAATATTTTTTAGTTTCACACACTATA
TATAGCGTGTTTCTCAAGTGCACACTCCATATATGGTGTGTTTTCATTTGAAAGATTAAGTGTTCGTAGTAAAATCTATT
ATATCGTATAAACAGGAGATGAAGATTATGAATTCAATTACAGTATTTACTAAAAACAATTGTATCCAATGTAAAATGACTAAGCGTTTCCTTG
AGGAACACAACATCGATTTCGTAGAAAAAAACACTTCTGAAAACCCAGAATTTGTTACCTACTTAAAAGAGTTAGGTTTCCAAGTAGTTCCAGT
TGTTGAAGTCGAAGGTGCCGAATCATTTACTGGTTTTAGACCTGATTGCCTAAACAAACTAGTAGCAGAATTCGCTTAA
CATTATATTACCTATTATACACAACAAGGAGCACTAGGAAT
ATGTCGCTAAAAGACCAAACTGATGTTAGTTATTATAGATTAAATAACGAGATCAACATCCCATCAAAAGATGGAAAAATTAGACTAGAAAAAG
ATAAAGAAGCCCTAGATGCTTTTATTAAAGAAAACGTGATTCCTAATACCGTAAAGTTTGATTCTTTAAAGGATCGTTTGGATTACTTAACTAA
AAATAACTACATTGAAGCTAGCTTTTTAGAAAAGTATCCTTTTTCATTTATTGAAAAACTTTACCAATACTTAGAGGATCAACATTTTACCTTT
AAATCATTTATGGCTGCCTATAAATTTTATGCACAATATGCCTTAAAAACAAATGATGGTAATCAATATCTTGAAAGATACATTGATCGGACTG
CAATGAACGCCCTCTTTTTAGCTGACGGTGATCAAGAATTAGCAATGCGTTTAGCTGATGAATTAATTCACCAACGTTTCCAACCAGCTACGCC
AACTTTCTTAAACGCTGGAAAAAAACGGCGTGGAGAATTAATTTCATGTTTCTTAATCCAAACTACTGATGATATGAATAGTATCGGAAGAACC
ATTAATTCGGCCTTACAACTCTCTAAAATTGGTGGAGGTGTAGGAATTAACCTTTCTAACCTTCGTGCTGCTGGAGATCCAATTAAGCACATTC
AAGGCGCTGCTAGTGGAGTAATGCCAGTCATGAAACTGTTAGAAGACAGTTTTACCTACTCAAATCAATTAGGCCAACGTCAAGGTGCTGGTGT
TGTTTATCTTAGTGTCTTTCATCCTGATATTATTGACTTTCTTTCAGTTAAAAAAGAAAATGCTGATGAAAAAATTCGAGTTAATACCTTATCT
TTAGGACTAACCGTTCCTGATAAGTTTTATGAACTTGCTAAAAATGATCAAGATATGTATCTCTTTAGCCCTTATGATGTGGAAAAAGAATATG
GAGTTCCATTCTCTTACGTTGACATCACTAAAGAATATGACAATTTAGTTGCTAACGAAAACATCCGCAAGAAAAAAATGAAGGCTCGTGATTT
AGAAACCGAAATCGGTAAATTACAACAAGAATCCGGTTATCCTTACATCATGAACATTGATACTGCTAACCGGGAAAAACCAGTTGCCGGTAAA
ATTGTCATGAGTAACTTGTGTTCTGAAATTATGCAAGTGCAAACCCCATCAATCATTAATGACTTGCAACAGTATGACCAATTAGGGACTGATA
TTTCATGTAACCTAGGTTCAACAAACGTCGTTAATTTGATGAAATCAGATGATTTTGGTGAATCTGTTAACACAATGGTGCGTGCCTTAACCTA
CGTGACCGATGAAAGTAAAATTGATGTTGTTCCTTCAATTAGAAGAGGAAATGATTTAAGCCATTCGATTGGACTTGGTGCCATGGGTCTTCAC
TCATTTCTCGCTTTAAATCATATGTATTACGGTTCGCCTGAATCAATCGAATTTACTGGTGTTTACTTTATGCTCTTGAACTACTGGACTCTAG
TTGCATCTAACAAGATTGCTAAAGAACGCGGTAAGTCATTCCATAACTTTGAAAACAGTAAATATGCAGATGGTACTTATTTTGATAAGTACAC
CGCCAAAGATTGGGGTCCCCAATCAGAAAAAGTTAAGGACCTCTTCAAGGGTACCTTTGTGCCTTCTGAAAAAGACTGGGAAGAGCTTAAGAAG
TCAGTTATGACTTATGGTTTATATCATCAAAACCGGATGGCAGTTGCTCCTAATGGTTCAACAGCCTACATTGGTGACGCTACCGCAAGTATTG
CCCCAATCGTTAGTCGAATTGAAGAACGACAAGATGCTAAAATTGGAACAATTTTTTATCCCGTTCCTTACCTTTCAAACGATACCCTTCCATA
TTATGAATCAGCTTATGATATTGATATGCGTAAAGAAATCGATATCTTTGCTGAAGCCCAAAAACACGTTGATCAAAGTTTAAGTATGACCCTC
TTCATGCGTTCTACCATTCCTGAAGGGATGTACGAATGGAAAAATGGTCGTGATCCAAAGATGTCAACACGTGATTTAACAATCTTAAGAAATT
ATGCTTACCATAAAGGCATTAAATCAATTTACTACGTTAGAACTTTCACTGATAACAACGACACAGTTGGTGCTAACGAATGTCAAAGCTGTGT
CATTTAG
GAGGATTATATCA
ATGAATATGAACGAAATTTTAACGGGTAAGTTAAAGGGTAATTACAAAGCCATTAACTGGAATCGAGTTGATGACGATGTTGATGAAGCAACCT
GGCACAAACTTACAGAACAATTTTGGTTAGATACCCGAGTACCAGTTTCTAACGATTTAAAAGATTGGCGTGAACTTGATGACGATCACAAATG
GCTCGTTGGACATGTCTTTGGTGGATTAACTTTATTAGATACCCTTCAATCTCAAGATGGAATGGCATCATTAAGAGCAGATGCACATACTCAA
CATGAAGTTGCGGTATTAAACAATATTCAATTCATGGAATCAGTCCATGCTAAAAGCTATTCTACAATCTTTTCAACTTTAAACACTCCTAAAG
AAATCAATGAAATTTTTGACTGGAGTGATTCTGAAGAATTTTTACAAAGCAAAACCAAAAGAATTTATAACCTTTATCATAATGATGAACACCC
ATTAAAAAAGAAAATTTCAAGTGTATTTCTAGAAACCTTTCTCTTTTACTCTGGATTCTTCACCCCACTTTGGTATCTAGGTCATAATAAATTG
ACCAATGTGGCTGAAATCATCAAGTTAATTATTCGGGATGAATCAGTTCACGGTACCTATGTTGGTTACAAATTTCAGATTCAATTTAATCAAT
TAAGTCCTAATGAACAAGCTGAACTTAAAGATTGGATGTATAACTTCCTTTATGACTTATACGAAAACGAGGTTAATTACACCCATCTTTTATA
TGATAAAACTGGTTTAACAGATAAAGTGCTTACTTTCATCCGTTACAATGCCAATAAAGCTTTAATGAACTTGGGTCAAGACCCAATGTTTCCA
GATACTGCTGAAGATGTTAACCCCGTTGTGATGAACGGAATTTCAACTTCAACAGTTAATCATGACTTCTTCTCAGAAGTTGGAAATGGTTATC
GTCTTGGTAATGTTGAAGCAATGTCAGATGATGATTATCTATTTGGTTCTTGGGAAGATAAACACAAAAATAAATAA

Appendix
163
ATTTTAAATAGTAAAAGAGCCACTTCAATGAAGTGGCTCTTTTTTTAAACTATTTTTCACTATATTTCTTAAAATTAGTTTTAATAAAATCAGC
TGGAATGTTTTTTAAATCAACTGCGTTAATC
NADH peroxidase
ATGAAAGTAGCAGTTGTAGGTTCATCACACGGTGGTTTTGAAACTGTAAGAGGAGTATTACACGATTTTCCCAATGCTGAGATTGATTGGTATGAAAAGGGCGATTTTGTTTCTTTATTATCATGTGGAATTGAATTGTATCTTCAAGGAGTCGTTAAGGATGTTAATTCCGTTAGTTATGCAACAATTGGTGGAATGGAAGCAAAGGGCGTTCATGTTTATATTAATTCTGAAGTGACTAGCATTGACCCAGAACAACATTCAATTAAGGTTGTTGATGTTAATAACGGTGAAGAAACTGAAAGTAAATATGATAAGTTAGTTCTTTCGTTAGGAGCGGTTCCTTTTGAACTACCTGTGCCAGGAAAAGATTTAAAGAATATTTATGCTATGCGTGGATGTGACTGGGAAATTCTTTTAAAGAAAGCTGAAGTTGACCCTGATATTAATAATGTCTCAGTCATTGGTTCAGGTTATATTGGAATTGAAGCCGCCGAATCATTTGCAAAGGCCGGTAAGAAAGTTACTATTATTGATCAAAATCCAACTATTTTAGGAACTTATTTAGATT CAGAATTTACAGATATCTTAACTAAAACGCTTGAAGATCACGGTATTCAATCCGTTAAAGAATTTATTGGTAATGATGAAAATAAAGTAACCAGTTTGGTAACGACAACTGGTGAAACTATTCCTACTGATTTAGTGATTGAAGCTGCAGGAATTTGTCCAGCAACTGAATGGTTGAAAGATACTGTTAAACTTGATAGCCAAGGCTTAATTATGACTGATGAATATCAAGAAACTAGTCAACCAGATATTTTTGCCGTTGGTGATGCCACTAAAATTGAGTTTGCCCCAACTGGAACCAAAAAATTAATTGCGCTTGCACCAAATGCTCGTCGACAAGGTCGTTCAGCTGCTTATAATTTAAATGAAAAACGTCGCAAAACAACTGCTGTCTCTGGATCATCTGCACTTCATGTCTATAATTACAAGTTTGCTTCAACTGGATTAAAAGATGTTACCGCTAAAAAAATGGGTATTGACGTTGAATCAGTATTTTTAACTGATGATAAAGTACCA GCTTTTGTACCAGCTTCAAACAATGCAAAAGTATACTTCAAATTAACTTTTGATCCGCGTACTCGTGAAGTTTTAGGGGCTCAAATTATGTCTAAACAAGATGTAACGGCTAATATCAATGCAATTTCGCTAGCAATCCAAAAACACA TGACAGTTGATGAATTGGCTTATGCTGATTTCTTCTTCCAACCAGGCTTTGACCGTCCTTGGAACGTTATGAATATTGCAGCACAAAAAGCACAAGATAA

164
6 6. ABBREVIATIONS 4VG 4-vinylguiacol 4VP 4-vinylphenol A. Aspergillus A arabinose aa amino acids approx. approximately APS Ammonium persulfate ara-2 α-L-arabinofuranosidase (heterologous expressed) Asp aspartic acid ATP Adenosine-5'-triphosphate AX arabinoxylan B. Bacillus bp base pairs BSA bovine serum albumine BspA basic surface protein C. Clostridium C carbon cDNA copy DNA cfu colony forming unit CO2 carbon dioxide DFT dehydro-ferulic acid-tyrosine DTNB 5,5'-dithiobis-(2-nitrobenzoic acid) DTT Dithiothreitol CgL cystathionine-γ-lyase DBM dinucleotide-binding motifs DMSO dimethyl sulfoxide DNA desoxyribo nucleic acid dNTP desoxy nucleotide triphosphate E. Escherichia E.C. Enzyme Commission EDTA Ethylenediaminetetraacetic acid EF ethyl ferulate e.g. for example FA ferulic acid FAD Flavin adenine dinucleotide FAN free amino nitrogen Fe iron FD fast digest FPLC fast protein liquid chromatography

165
FSI Forschungsstelle 1 Garching GC/MS Gas chromatography–mass spectrometry Gln glutamine Gly glycine GMP glutenin macropolymer GS glutenin subunits GSH glutathione (reduced) GshR glutathione reductase GSSG glutathione (oxidized) H2O water H2O2 hydrogen peroxide HCL hydrochloric acid HEPES 4-(2-hydroxyethyl)-1-piperazineethanesulfonic
acid HFA hydroferulic acid His histidine HMW high molecular weight HPLC high performance liquid chromatography IPTG Isopropyl-β-D-thiogalacto pyranoside L. Lactobacillus LAB Lactic acid bacteria LB lysogeny broth LMW low molecular weight MAP mucus adhesion protein MES 2-(N-morpholino)ethanesulfonic acid Mg magnesium MRS de Man, Rogosa and Sharpe mMRS modified MRS medium Mn manganese MTBE Methyl-tert-butylether MTT 3-(4,5-Dimethylthiazol-2-yl)-2,5-
diphenyltetrazolium bromide Mw molecular weight N2 nitrogen NAD Nicotinamide adenine dinucleotide NADH Nicotinamide adenine dinucleotide (reduced) NADPH Nicotinamide adenine dinucleotide phosphate NCBI National Center for Biotechnology Information n.d. not detected No. Number Nox NADH oxidase NSP non-starch polysaccharides nt nucleotide O2 oxygen OD optical density PAGE polyacrylamide gel electrophoresis p-CA coumaric acid PCR polymerase chain reaction PDA phenolic acid decarboxylase PDC para-coumaric acid decarboxylase

166
PLP pyridoxal 5'-phosphate PMS phenazine methosulfate p-NPA or p-NP-C2 para-nitrophenyl acetate p-NP-ara para-nitrophenyl arabinofuranoside p-NP-C4 para-nitrophenyl butyrate p-NP-C8 para-nitrophenyl caprylate p-NP-xyl para-nitrophenyl xylopyranoside RAPD random amplification of polymorphic DNA RNA Ribonucleic acid SDS sodium dodecyl sulphate Ser serine SOC super optimal broth + glucose SOD superoxide dismutase TA dough yield TAE Tris-acetate-EDTA TBE Tris-borate-EDTA TEMED Tetramethylethylenediamine TLC Thin layer chromatography Tm melting temperature TMW Technische Mikrobiologie Weihenstephan TPC Total plate count Tris Tris-(hydroxymethyl-) aminomethane Trx thioredoxin TrxR thioredoxin reductase Tyr tyrosine U Units UV ultraviolet v Volume W. Weissella WE-AX water extractable arabinoxylan WU-AX water unextractable arabinoxylan X xylose xyl-1 xylosidase (heterologous expressed) Table 29. One letter code for nucleotides A ATP T TTP G GTP C CTP M A/C R A/G W A/T S G/C Y C/T K G/T H A/C/T D A/G/T N A/T/G/C

167
Table 30. One letter code for amino acids A alanine C cysteine D aspartic acid E glutamic acid F phenylalanine G glycine H histidine I isoleucine K lysine L leucine M methionine N asparagine P proline Q glutamine R arginine S serine T threonine V valine W tryptophan Y tyrosine X any amino acid Table 31. Units of measurements µl, ml, l microliter, milliliter, liter nm, µm, mm, cm nanometer, micrometer, millimeter, centimeter nmol, µmol nanomol, micromol µM, mM, M micromolar, millimolar, molar ppm parts per million s, min, h second, minute(s), hour mbar, bar millibar, 100.000 Pascal µg, mg, g microgramme, milligramme, gramme U Unit rpm rounds per minute °C, °P degree Celsius, degree Plato kV kilo Volt µF micro Farad g gravitational acceleration kDa kilo Dalton % percentage