contribution of the automotive industry to the … · and do not necessarily reflect those of the...
TRANSCRIPT

Contribution of the Automotive Industry to the Economies of All Fifty States
and the United States
3005 Boardwalk Drive Ann Arbor, MI 48108 www.cargroup.org
January 2015
All statements, findings, and conclusions in this report are those of the authors and do not necessarily reflect those of the Alliance of Automobile Manufacturers.

©Center for Automotive Research 2015 i
Contribution of the Automotive Industry to the Economies of All Fifty States and the United States Center for Automotive Research Report Prepared by: Kim Hill, Director, Sustainability & Economic Development Strategies Group Director, Automotive Communities Partnership Associate Director, Research Debra Maranger Menk Joshua Cregger Michael Schultz Report Prepared for: Alliance of Automobile Manufacturers 1401 Eye Street, N.W., Suite 900 Washington, DC 20005 January 2015
©Center for Automotive Research 2015 ii
ACKNOWLEDGEMENTS
The Center for Automotive Research (CAR) would like to thank the Alliance of Automobile Manufacturers for support of this work. This study is the result of a group effort. The authors would like to thank our colleagues at CAR for their assistance with this study, in particular, Bernard Swiecki for his assistance with organizing and conducting interviews and Yen Chen for his input and guidance on economic modeling. Additional assistance was provided by Diana Douglass, who contributed greatly to the coordination of the project and the production of this document. The authors would also like to thank the representatives from all of the companies that provided employment and compensation data to inform this study. In particular, the authors would like to thank representatives at all of the automakers that contributed to this study, including BMW, Chrysler, Ford, General Motors, Honda, Hyundai, Kia, Mazda, Mercedes, Mitsubishi, Nissan, Subaru, Toyota, and Volkswagen. The authors would also like to thank representatives at Balluff, Hitachi Automotive Systems Americas, Johnson Controls, Kentucky Automotive Industry Association, Kyosan Denso Manufacturing Kentucky, Toyoda Gosei, and ZF Steering Systems for meeting with CAR researchers and providing insight into the automotive supplier sector. Kim Hill Center for Automotive Research www.cargroup.org
©Center for Automotive Research 2015 iii
TABLE OF CONTENTS
ACKNOWLEDGEMENTS ........................................................................................................................... II
TABLE OF CONTENTS ............................................................................................................................. III
EXECUTIVE SUMMARY ........................................................................................................................... 1
INTRODUCTION .................................................................................................................................... 3
SECTION I ‐ AUTOMOTIVE INDUSTRY BACKGROUND .................................................................................... 5
Overview of the Automotive Industry ........................................................................................ 5 U.S. Automotive Geography .................................................................................................... 5
Recent Developments in the Automotive Industry .................................................................... 7 Economic Significance of Automotive Industry .......................................................................... 9 Sales, Production, and Employment Forecasts ..................................................................... 10
Automotive Investment ......................................................................................................... 11
Research, Development, and Innovation in the Automotive Industry ..................................... 13 Technology Trends in the Automotive Industry ....................................................................... 15 Advanced and Alternative Powertrains ................................................................................ 15
Materials and Joining ............................................................................................................ 17
Connected and Automated Vehicles .................................................................................... 18
Sectors of the Automotive Industry .......................................................................................... 20 Suppliers ................................................................................................................................ 20
Dealers .................................................................................................................................. 21
Medium and Heavy Duty....................................................................................................... 22
Aftermarket Suppliers ........................................................................................................... 24
Role of Small‐ and Medium‐sized Businesses in the Automotive Industry .............................. 25 Kentucky Case Study ................................................................................................................. 26
SECTION II ‐ ESTIMATES OF THE ECONOMIC CONTRIBUTION OF THE MOTOR VEHICLE INDUSTRY TO THE UNITED
STATES ECONOMY .............................................................................................................................. 29
Vehicle Manufacturer Activities ............................................................................................... 30 Automobile Dealerships ............................................................................................................ 33
SECTION III ‐ ESTIMATES OF THE ECONOMIC CONTRIBUTION OF THE MOTOR VEHICLE INDUSTRY TO INDIVIDUAL STATE ECONOMIES ............................................................................................................................. 37
SECTION IV ‐ METHODOLOGY OVERVIEW................................................................................................ 43
The Macroeconomic Model .................................................................................................. 43
Methods & Assumptions ....................................................................................................... 44
BIBLIOGRAPHY ................................................................................................................................... 45
APPENDIX A ...................................................................................................................................... 51

©Center for Automotive Research 2015 iv
©Center for Automotive Research 2015 1
EXECUTIVE SUMMARY
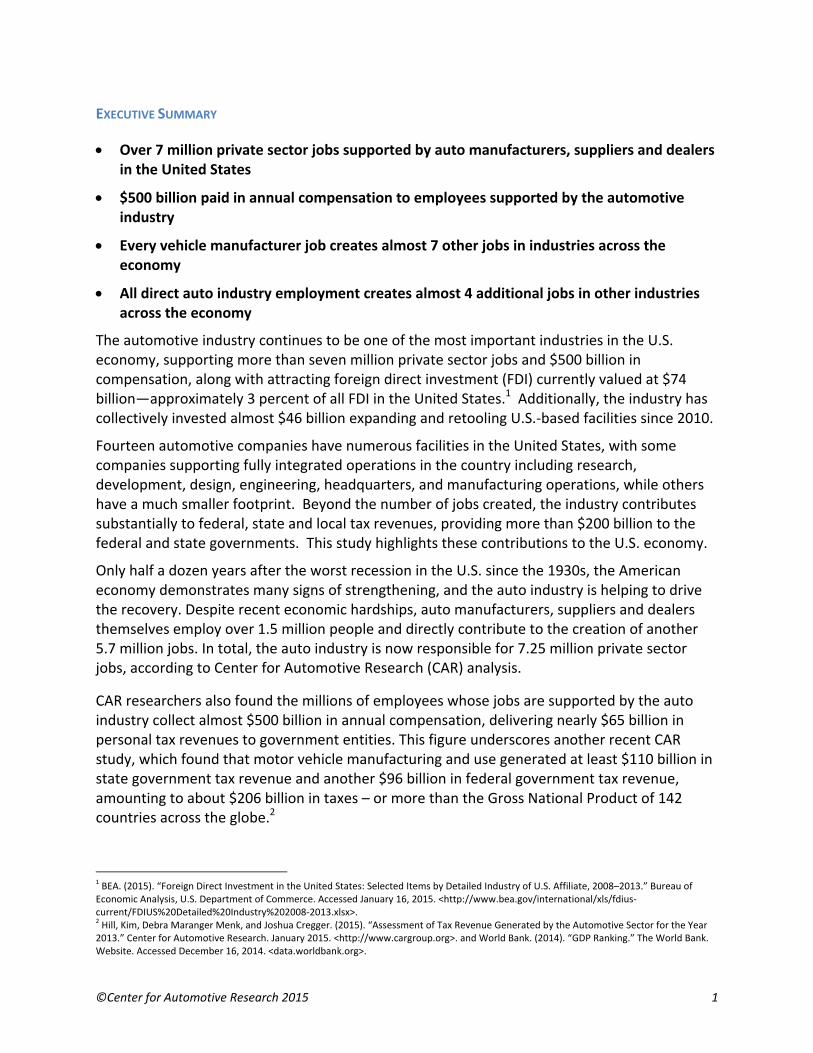
Over 7 million private sector jobs supported by auto manufacturers, suppliers and dealers in the United States
$500 billion paid in annual compensation to employees supported by the automotive industry
Every vehicle manufacturer job creates almost 7 other jobs in industries across the economy
All direct auto industry employment creates almost 4 additional jobs in other industries across the economy
The automotive industry continues to be one of the most important industries in the U.S. economy, supporting more than seven million private sector jobs and $500 billion in compensation, along with attracting foreign direct investment (FDI) currently valued at $74 billion—approximately 3 percent of all FDI in the United States.1 Additionally, the industry has collectively invested almost $46 billion expanding and retooling U.S.‐based facilities since 2010.
Fourteen automotive companies have numerous facilities in the United States, with some companies supporting fully integrated operations in the country including research, development, design, engineering, headquarters, and manufacturing operations, while others have a much smaller footprint. Beyond the number of jobs created, the industry contributes substantially to federal, state and local tax revenues, providing more than $200 billion to the federal and state governments. This study highlights these contributions to the U.S. economy.
Only half a dozen years after the worst recession in the U.S. since the 1930s, the American economy demonstrates many signs of strengthening, and the auto industry is helping to drive the recovery. Despite recent economic hardships, auto manufacturers, suppliers and dealers themselves employ over 1.5 million people and directly contribute to the creation of another 5.7 million jobs. In total, the auto industry is now responsible for 7.25 million private sector jobs, according to Center for Automotive Research (CAR) analysis.
CAR researchers also found the millions of employees whose jobs are supported by the auto industry collect almost $500 billion in annual compensation, delivering nearly $65 billion in personal tax revenues to government entities. This figure underscores another recent CAR study, which found that motor vehicle manufacturing and use generated at least $110 billion in state government tax revenue and another $96 billion in federal government tax revenue, amounting to about $206 billion in taxes – or more than the Gross National Product of 142 countries across the globe.2
1 BEA. (2015). “Foreign Direct Investment in the United States: Selected Items by Detailed Industry of U.S. Affiliate, 2008–2013.” Bureau of Economic Analysis, U.S. Department of Commerce. Accessed January 16, 2015. <http://www.bea.gov/international/xls/fdius‐current/FDIUS%20Detailed%20Industry%202008‐2013.xlsx>. 2 Hill, Kim, Debra Maranger Menk, and Joshua Cregger. (2015). “Assessment of Tax Revenue Generated by the Automotive Sector for the Year 2013.” Center for Automotive Research. January 2015. <http://www.cargroup.org>. and World Bank. (2014). “GDP Ranking.” The World Bank. Website. Accessed December 16, 2014. <data.worldbank.org>.
©Center for Automotive Research 2015 2
The industry as a whole employs about 1,553,000 people directly engaged in designing, engineering, manufacturing, and supplying parts and components to assemble, sell and service new motor vehicles. CAR found vehicle manufacturers—automakers, also known as original equipment manufacturers (OEMs)—directly employed 322,000 people in the U.S. in their respective headquarters and in other operational facilities, such as assembly and manufacturing plants and on research and development campuses. Additionally, there are 521,000 people employed in the automotive parts sector, including workers in the rubber, plastics, battery, aftermarket, and parts export sectors, and another 710,000 people employed in the dealer network selling and servicing new vehicles.
But jobs related to the auto industry go far beyond designing, building and selling vehicles. America’s automakers are also among the largest purchasers of aluminum, copper, iron, lead, plastics, rubber, textiles, vinyl, steel and computer chips. CAR models discerned that every OEM employee had an employment multiplier effect of 7.6 (or 6.6 additional jobs for every direct OEM job), while the employment multiplier for the entire industry is 4.7.3 There are many workers in intermediate and spinoff jobs from the auto industry due to the complex manufacturing supply network with many tiers of suppliers across a wide array of industries.
Breakout of the employment and economic contributions by OEM, all automotive manufacturing, and dealer sectors are as follows:
Direct, intermediate, and spin‐off employment from OEM activities estimated at 2.4 million
Total compensation of $168 billion
Estimated personal tax payments of nearly $23 billion
Total employment generated by all automotive manufacturing (including automakers) is estimated to be 5.6 million
Total compensation of $375 billion
Estimated personal tax payments of nearly $45 billion
Total employment generated by the dealership network is estimated to be 1.65 million
Total compensation of $116 billion
Estimated personal tax payments of approximately $20 billion
These figures are likely to rise as well. CAR’s U.S. automotive employment forecast projects hiring will increase by approximately 10.8 percent, with a compound average growth rate of 2.1 percent from 2013 to 2018. U.S. production is forecast to continue expanding, growing at a compound average growth rate of 2.4 percent, resulting in a projected rise of 12.6 percent in production from 2013 to 2018. CAR’s econometric analysis also suggests auto sales over the next several years will continue to increase, from 15.6 million units in 2013 to 17.6 million units in 2018.
3 The employment multiplier derived from manufacturing vehicles is lower than the previous study completed in 2010, while the parts manufacturing, sales and total industry multipliers are slightly higher than multipliers seen in previous studies. The authors believe that since the recession, increases in productivity, as well as the tendency for manufacturing operations to run three shifts, have dampened the employment contribution, as day‐time, office and business services jobs provide support for around‐the‐clock production.
©Center for Automotive Research 2015 3
INTRODUCTION
The automotive industry is a critical component of economic growth, with extensive
connections across the industrial and cultural fabric of the United States. This report outlines
many known elements and highlights tremendously important associations beyond the market
space of automotive manufacturing. National and regional employment; research,
development and innovation; state and local government revenues; foreign direct investment;
education; health care; U.S. trade; and quality of life are all tied to the automotive industry.
This report reviews many of the factors that support the auto industry’s importance and
standing in the national economy, and provides a current estimate of the industry’s
employment and economic contribution to the national economy and to each of the 50 states
and the District of Columbia.
The paper is organized into several sections: Section I provides qualitative context and current
market metrics for the automotive industry, both of which are needed to truly appreciate the
contributions of the industry to the broader economy and gauge where the industry may be
heading. Section II features an in‐depth quantitative analysis of employment and personal
income associated with the automotive industry. Section II captures the distinct contributions
of assemblers, motor vehicle and parts manufacturing, and dealers to the national economy.
Section III describes the state‐level employment associated with the automotive industry.
Section IV discusses the methodology of the economic modeling used to produce the results
discussed in Section II and Section III. This study updates the economic contribution estimates
from a 2010 study published by the Center for Automotive Research (CAR) on the national
contribution of the automotive industry in the United States.4
The auto industry is one of the most important industries in the United States. It historically has
contributed 3.0 – 3.5 percent to the overall Gross Domestic Product (GDP). The industry directly
employs more than 1.5 million people engaged in designing, engineering, manufacturing, and
supplying parts and components to assemble, sell and service new motor vehicles. In addition,
the industry is a huge consumer of goods and services from many other sectors, including raw
materials, construction, machinery, legal, computers and semi‐conductors, financial,
advertising, and healthcare. Automakers spend an average of $1,200 for research and
development (R&D) per vehicle5 – 99 percent of which is funded by the industry itself. Due to
the industry’s consumption of products from many other manufacturing sectors, it is a major
4 Hill, Kim, Debra Maranger Menk, and Adam Cooper. (2010). “Contribution of the Automotive Industry to the Economies of all Fifty State and the United States.” Center for Automotive Research. Prepared for the Alliance of Automobile Manufacturers, the Association of International Automobile Manufacturers, the Motor and Equipment Manufacturers Association, the National Automobile Dealers Association, and the American International Automobile Dealers Association. April 2010. <http://www.cargroup.org/?module=Publications&event=View&pubID=16>. 5 Hill, Kim, Debra Menk, Bernard Swiecki, and Joshua Cregger. (2014). “Just How High‐Tech is the Automotive Industry?” Center for Automotive Research. Page 9. January 8, 2014. <http://www.cargroup.org/?module=Publications&event=View&pubID=103>.

©Center for Automotive Research 2015 4
driver of the 12 percent manufacturing contribution to GDP. Without the automotive industry,
it is difficult to imagine manufacturing surviving in this country.
During the recession, North American vehicle sales and production fell sharply. In 2007, U.S.
automotive plants built nearly 11 million vehicles; by 2009, production had fallen to slightly
more than half of that, 5.8 million vehicles. To add pressure to the supply chain, prior to the
recession, many suppliers were competing for automaker business primarily on price, leading
them to operate at very narrow margins. The loss of business coupled with razor‐thin margins
led to a reduction in the number of supplier companies. Some companies restructures or
consolidated, but many simply went out of business.6
The U.S. turnaround in vehicle sales happened much more quickly than recovery in other
sectors of the economy. After a low point of 10.4 million vehicles sold in 2009, sales in the
United States have steadily increased and exceeded 16 million units in 2014. Correspondingly,
U.S. automotive production is expected to exceed 11 million vehicles. As production has
increased, suppliers are operating their facilities at very high capacity utilization levels. With the
financial pain of the recession fresh in memory, most suppliers have been reluctant to reopen
closed plants or build new facilities.
As a result of transformation of the automotive industry at the highest levels, coupled with a
faster than expected resurgence in sales, many auto suppliers now find themselves under
intense customer pressure to increase their capacity and capabilities by investing capital,
adding new technologies, increasing efficiency, improving quality, upgrading workforce skills,
and collaborating with other firms.7
As previously mentioned, more than 1.5 million people are employed by the auto industry. In
addition, the industry is a huge consumer of goods and services from many other sectors and
contributes to a net employment contribution in the U.S. economy of more than 7 million jobs.
Approximately 3.8 percent of all U.S. private sector jobs are supported by the strong presence
of the auto industry in the U.S. economy. People in these jobs collectively earn nearly $500
billion annually in compensation and generate $65 billion in tax revenues. Going forward,
motor vehicle sales, production and employment in the industry are expected to continue to
rise. Coupled with relentless technological advances, the automotive industry will continue to
be a significant sector of the U.S. economy.
6 Ibid. Hill, Kim, Debra Maranger Menk, and Adam Cooper. (2010). 7 OESA. (2014). “Automotive Supplier Barometer.” Original Equipment Suppliers Association. November 3‐5, 2014. <http://www.oesa.org/Knowledge‐Center/Automotive‐Supplier‐Barometer/2014‐Supplier‐Barometers/2014‐November‐OESA‐Automotive‐Supplier‐Barometer.pdf>.
©Center for Automotive Research 2015 5
SECTION I ‐ AUTOMOTIVE INDUSTRY BACKGROUND
This section gives a brief overview of the U.S. automotive industry. It discusses the changing
market share and geography of the industry, the effects of the recent recession and subsequent
recovery, near‐term forecasts, recently announced investments, automotive innovation, and
important sectors within the automotive industry, including suppliers, dealers, medium‐ and
heavy‐duty vehicle manufacturers, and automotive aftermarket firms.
Overview of the Automotive Industry
The U.S. automotive landscape is dynamic and constantly shifting. Traditionally, the “Detroit 3”
(D3) domestic automotive assembly firms (Chrysler, Ford, and General Motors) were the
dominant industry force particularly in the U.S. Midwest, the undisputed home of the industry.
However, with the entry of international firms (BMW, Honda, Hyundai‐Kia, Mercedes, Nissan,
Toyota, and Volkswagen) and their investments across the country, the industry is now more
vibrant and complex. Decades of intense competition from many rival automakers have led to
increased quality and choice for consumers. These changes have also led to new job
opportunities and expanded production to new locations.
U.S. Automotive Geography
Within the United States, the top three states for establishments related to automotive
production (including companies producing vehicles, bodies, and parts) are Michigan, Indiana,
and Ohio. Texas is also high on the list, as are other Midwestern (Illinois and Missouri) and
Southern (Tennessee, Kentucky, Alabama, and Mississippi) states. Table 1.1 shows the
establishment count for the top 10 states in the United States, and provides total establishment
counts for the United States, Canada, and Mexico.

©Center for Automotive Research 2015 6
Table 1.1: North American Automotive Manufacturing Establishments, by State and Country
State / Country
Motor Vehicle
Manufacturing
(NAICS 3361)
Body and
Trailer
Manufacturing
(NAICS 3362)
Parts
Manufacturing
(NAICS 3363)
All
Establishments
(NAICS 3361‐
3363)
Michigan 90 95 790 975 Ohio 24 96 479 599 Indiana 23 165 331 519 Texas 31 178 293 502 Illinois 24 55 292 371 Tennessee 9 53 218 280 Missouri 15 74 136 225 Kentucky 11 26 179 216 Alabama 10 41 149 200 Mississippi 8 22 55 85 All Other U.S. 221 1,183 2,659 4,063
United States 466 1,988 5,581 8,035
Canada 157 600 1,080 1,837 Mexico 23 61 670 754
Sources: Bureau of Labor Statistics, Statistics Canada, Instituto Nacional de Estadistica y Geographia, 2014 Note: U.S. and Canadian figures represent 2013 data. Mexican figures are for 2012.
Traditionally, the geographic center of the automotive industry has been located in the
Midwestern states of Illinois, Indiana, Michigan, Missouri, and Ohio, as well as the province of
Ontario in Canada. U.S. automakers have also historically had assembly capacity in other states
in the form of branch assembly plants (e.g., General Motors and Ford assembly plants in states
such as California, Georgia, New York, and Texas),8 though most of those plants have since
closed.9 U.S. foreign direct investment has facilitated the expansion of the automotive industry
beyond the industrial Midwest, as international automakers are largely located in the Southern
states of Alabama, Georgia, Mississippi, and Tennessee. The current automotive footprint,
sometimes referred to as the “automotive corridor” in North America, which can be seen in
Figure 1.1, stretches from the upper Midwest to the Gulf of Mexico.
8 Rubenstein, James M. (1992). “The Changing U.S. Auto Industry: A Geographical Analysis.” Routledge, New York, New York. 1992. 9 Brugeman, Valerie Sathe, Kim Hill, and Joshua Cregger. (2011). “Repurposing Former Automotive Manufacturing Sites: A report on closed auto manufacturing facilities in the United States, and what communities have done to repurpose the sites.” Center for Automotive Research. Prepared for the Office of Recovery for Auto Communities and Workers, U.S. Department of Labor. November 2011. <http://www.cargroup.org/?module=Publications&event=View&pubID=2>.

©Center fo
Figure 1.1
Sources: Cen
The supp
though it
manufac
Michigan
Recent D
In the ea
sustained
supporte
vehicle o
incentive
In 2008 a
of autom
capacity
or Automotive
: North Americ
nter for Automo
plier footprin
t is more ful
turing for a
n, which also
Developmen
rly part of th
d levels of 16
ed by a boom
ownership, a
es.
and 2009 the
motive sales.
during the e
Research 2015
can Automaker
otive Research, 2
nt follows ro
ly developed
longer perio
o hosts more
nts in the Au
his century,
6 million uni
ming stock m
n enhanced
e financial cr
Vehicle asse
early part of
5
r and Automoti
2014 (supplier loc
oughly the sa
d in areas th
od of time. T
e automotive
tomotive In
annual U.S.
its or more t
market, hous
sense of pe
risis and sub
emblers, sup
the decade
ive Supplier Pr
cations from ELM
ame course a
at have bee
The greatest
e assembly p
ndustry
light vehicle
through 200
ing develop
ersonal wealt
bsequent rec
ppliers and d
were vulner
roduction Faci
M Analytics and
as the autom
en engaged w
density of s
plants than a
e sales peake
07. This unpr
ment patter
th, and gene
cession resu
dealers asse
rable when v
ility Locations
d MarkLines)
maker plant
with automo
uppliers is lo
any other st
ed at 17.4 m
recedented s
rns necessita
erous vehicle
lted in a sha
mblers that
vehicle sales
footprint,
otive
ocated in
ate.
million, and
sales activity
ating increas
e purchasing
arp contracti
had expand
s fell 40 perc
7
y was
sed
g
on
ded
cent

©Center for Automotive Research 2015 8
in 2009. While the U.S. automotive industry had been restructuring for many years, the 2009
market crash—and subsequent bankruptcy of two automakers and scores of suppliers—
provided impetus for further reductions in U.S. automakers’ and suppliers’ production capacity.
Since 2010 the U.S. automobile industry has steadily recovered. Many of the leading economic
indicators have come back to pre‐crisis levels.10 Cumulative vehicle sales have registered
double‐digit growth rates each year since the crash, and 2014 U.S. auto sales through
December have increased by 5.8 percent compared to figures from 2013.11
During the recession, automakers and suppliers reduced their liabilities and rationalized
capacity by closing, selling, or consolidating plants. As the economy began to recover,
automakers and automotive suppliers were reluctant to over‐expand and met industry
demands by running extra shifts and overtime at existing facilities rather than building new
capacity. With higher levels of capacity utilization, many companies are now looking to invest in
incremental capacity expansion both in the United States and abroad.12
Many manufacturing companies are also “reshoring” jobs, or bringing previously outsourced
jobs back to the United States.13 A major reason for reshoring jobs is that the wages in formerly
low‐cost countries have increased while real wages have seen little growth in the United States.
A more flexible and productive workforce and intensive use of automated manufacturing
methods has reduced the importance of labor cost when choosing to produce domestically or
abroad, while other factors such as freight and energy costs have become more important. One
example of reshoring in the automotive industry is Ford’s recent decision to relocate some
production from China and Mexico to Ohio and Michigan.14
Concerns with logistics, as well as freight‐in and freight‐out costs, have resulted in pressure on
supplier firms to locate facilities near their customers. Manufacturing firms are also sensitive to
indirect costs, such as the risk associated with more distant supply chains. These concerns have
not only resulted in some companies bringing manufacturing back to the United States, but also
encouraged a re‐agglomeration of automotive suppliers to core automotive‐producing regions.
10 FRED. (2014). “Federal Reserve Economic Data.” Economic Research, Federal Reserve Bank of St. Louis. Accessed June 6, 2014.
<http://research.stlouisfed.org/>. 11 Automotive News. (2014). “U.S. Car and Light‐truck Sales by Make – Dec. 2014 (Ranked by Total Sales).” Automotive News Data Center.
January 5, 2015. <http://www.autonews.com/section/datacenter>. 12 CAR. (2015). “Book of Deals.” Center for Automotive Research. January 2015.
13 Northam, Jackie. (2014). “As Overseas Costs Rise, More U.S. Companies Are 'Reshoring'.” National Public Radio. January 27, 2014.
<http://www.npr.org/blogs/parallels/2014/01/22/265080779/as‐overseas‐costs‐rise‐more‐u‐s‐companies‐are‐reshoring>.; CSG. (2014). “’Made in the USA’ Reshoring Brings Manufacturing Back.” Capitol Ideas: Council of State Governments – Insights & Innovations. March/April 2014. <http://www.csg.org/pubs/capitolideas/2014_mar_apr/2014_mar_apr_images/CIMarApr14.pdf>.; and Economist. (2013). “Reshoring Manufacturing – Coming Home.” Special report: Outsourcing and offshoring. The Economist. January 18, 2013. <http://www.economist.com/news/special‐report/21569570‐growing‐number‐american‐companies‐are‐moving‐their‐manufacturing‐back‐united>. 14 Ibid. Economist. (2013).

©Center for Automotive Research 2015 9
Economic Significance of Automotive Industry
For more than a century, the automotive industry has been a major contributor in shaping the
U.S. economy, and has generated and supported millions of jobs. As of September 2014, the
U.S. motor vehicle and parts manufacturing industry employed more than 870,000 workers.15
Beyond those direct employees working in assembly, body/trailer, and parts plants, there are
many more workers in intermediate and spin‐off jobs that are supported through automotive
production activities.
The economic performance of the automotive industry, as well as manufacturing more broadly,
is important for the continued development and growth of national and regional economies.
Manufacturing and automotive industry trends can be indicators of the state of the economy,
with periods of growth in automotive manufacturing closely linked to periods of growth in the
economy as a whole. As of the second quarter of 2014, the value of U.S. light vehicle sales was
$519 billion on an annualized rate; this is the highest rate ever recorded.16
The economic implications of the automotive industry’s activities extend beyond people
directly employed in the industry, due to the complex manufacturing supply network with
many tiers of suppliers across a wide array of industries. A few of the more obvious industries
supported by automotive manufacturing include motor vehicle parts, primary and fabricated
metal, plastics, and rubber products. Outside of manufacturing, the automotive industry
supports jobs in professional and technical services, administration and services, wholesale and
retail trade, transportation and warehousing, finance and insurance, and management of
companies.
In January 2015, the Center for Automotive Research (CAR) published the study, “Assessment
of Tax Revenue Generated by the Automotive Sector for the Year 2013” for the Alliance of
Automobile Manufacturers.17 The study examined multiple instruments of tax revenue
generation and focused primarily on state and federal tax revenues. Taxes are generated at
various points in the automotive product lifecycle. For instance, in addition to the sales taxes
generated when vehicles are purchased, government agencies collect taxes from a variety of
sources—payroll taxes from employees working in the automotive industry, fuel taxes from gas
stations, registration and license taxes from drivers and vehicle owners, and corporate income
taxes and licensing fees from the automakers, automotive suppliers, and dealerships. These
taxes support a variety of government services throughout the country, such as constructing
and maintaining the highway system, and support a number of jobs in a variety of other
industries.
15 BLS. (2014). Bureau of Labor Statistics, U.S. Department of Labor. Website. Accessed October 24, 2014. <http://www.bls.gov/>.
16 BEA. (2014). Bureau of Economic Analysis, U.S. Department of Commerce. Website. Accessed October 24, 2014. <http://bea.gov/>.
17 Hill, Kim, Debbie Maranger Menk, and Joshua Cregger. (2015). “Assessment of Tax Revenue Generated by the Automotive Sector for the Year
2013.” Center for Automotive Research. January 2015. <http://www.cargroup.org>.

©Center for Automotive Research 2015 10
As a result of the depth and breadth of the automotive industry, every state in the nation
generates tax revenues related to motor vehicle production and use. CAR researchers produced
estimates18 of taxes that are generated by operations related to motor vehicles. In 2013, the
automotive industry generated at least $110.0 billion in state government tax revenue (This
represents approximately 13 percent of state government revenues).19 The estimates of the
federal tax revenues in the tax study do not exhaust all of the contributions made by the
automotive industry, and therefore, the estimates serve as a lower‐bound estimate. In 2013,
the automotive industry generated at least $95.5 billion in federal government tax revenue
(This represents approximately 3.4 percent of federal government revenues).20
Sales, Production, and Employment Forecasts
CAR produces an annual vehicle sales forecast based on an econometric analysis of key
variables of automotive demand. From 2013 to 2018, sales are forecast to increase by
approximately 12.8 percent. Figure 1.2 displays historical and forecasted sales for the U.S.
automotive industry. The forecast suggests that automobile sales over the next several years
will continue to increase, returning to the long‐term trend from 16.9 to 17.6 million units
annually.
Figure 1.2: U.S. Automotive Sales and Forecast, 2007-2018
Source: Center for Automotive Research, January 2015
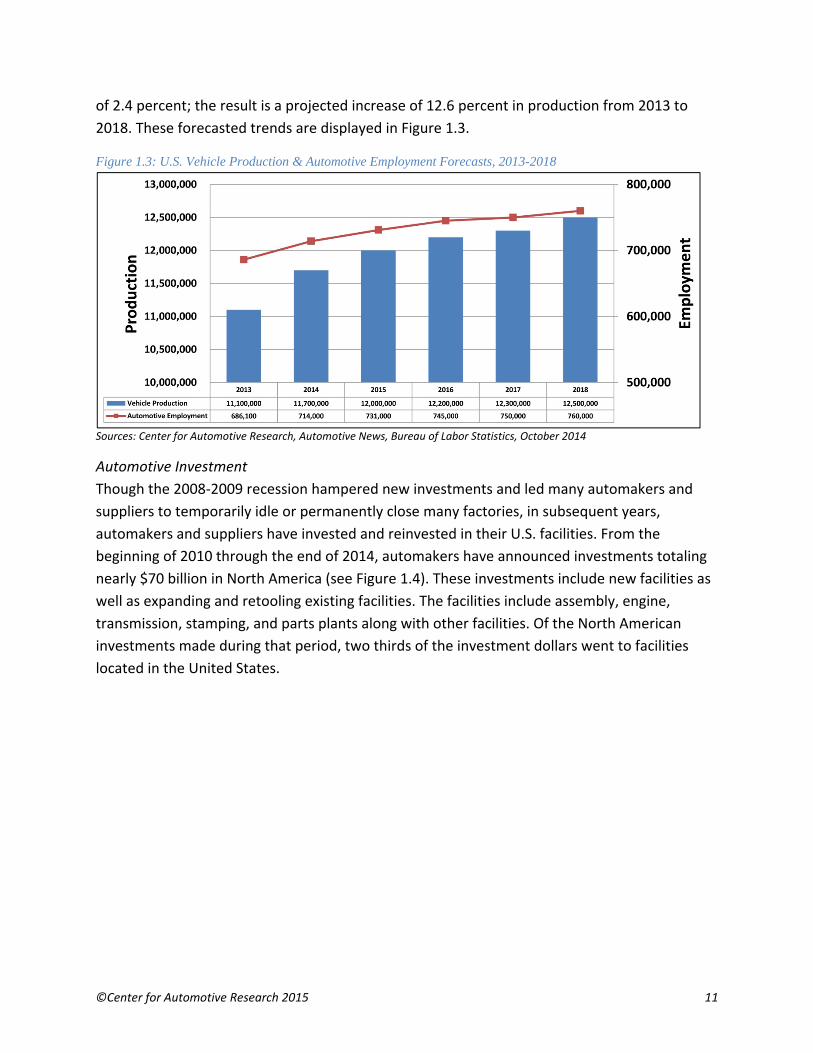
CAR’s U.S. automotive employment forecast projects that from 2013 to 2018, employment will
increase by approximately 10.8 percent, with a compound average growth rate of 2.1 percent.
U.S. production is forecast to continue expanding, growing at a compound average growth rate
18 All modeled numbers used in the text are rounded.
19 Total state revenues for 2013 were approximately $846 billion. See Census. (2013). “State Government Tax Collections: 2013.” United States
Census Bureau, U.S. Department of Commerce. March 2013. <http://factfinder2.census.gov/faces/tableservices/jsf/pages/productview.xhtml?pid=STC_2013_STC003&prodType=table>. 20 Total federal revenues for 2013 were approximately $2.8 trillion. See CBO. (2013). “Monthly Budget Review—Summary for Fiscal Year 2013.”
Congressional Budget Office. November 7, 2013. <https://www.cbo.gov/publication/44716>.
©Center for Automotive Research 2015 11
of 2.4 percent; the result is a projected increase of 12.6 percent in production from 2013 to
2018. These forecasted trends are displayed in Figure 1.3.
Figure 1.3: U.S. Vehicle Production & Automotive Employment Forecasts, 2013-2018
Sources: Center for Automotive Research, Automotive News, Bureau of Labor Statistics, October 2014
Automotive Investment
Though the 2008‐2009 recession hampered new investments and led many automakers and
suppliers to temporarily idle or permanently close many factories, in subsequent years,
automakers and suppliers have invested and reinvested in their U.S. facilities. From the
beginning of 2010 through the end of 2014, automakers have announced investments totaling
nearly $70 billion in North America (see Figure 1.4). These investments include new facilities as
well as expanding and retooling existing facilities. The facilities include assembly, engine,
transmission, stamping, and parts plants along with other facilities. Of the North American
investments made during that period, two thirds of the investment dollars went to facilities
located in the United States.

©Center fo
Figure 1.4
Source: Cen
Of the $6
$18.2 bil
North Am
Many of
investme
all FDI in
21 The investm
facility types,22 BEA. (2015
Economic Ancurrent/FDIU
or Automotive
: Announced N
ter for Automot
69.6 billion i
lion was ann
merican anno
the individu
ent in the Un
the United S
ment totals include including assemb). “Foreign Direct alysis, U.S. DepartS%20Detailed%20
Research 2015
North American
tive Research, Ja
n announced
nounced in 2
ounced auto
ual investme
nited States
States.22
e announcementsbly, engine, transmInvestment in thetment of Commerc0Industry%202008
5
n Automaker In
nuary 2015
d North Ame
2014. Of tha
omaker inve
nts and thei
is currently
s for building new mission, stamping, United States: Sece. Accessed Janua8‐2013.xlsx>.
nvestments, 20
erican autom
t total, $10.5
stments fro
r locations c
valued at $7
and retooling or eand parts plants.lected Items by Deary 16, 2015. <htt
010 – 2014
maker invest
5 billion, or
m 2014 are
can be seen
74 billion—a
expanding existing
etailed Industry ofp://www.bea.gov
tments from
58 percent o
within the U
in Figure 1.5
approximate
g facilities. The tota
f U.S. Affiliate, 200v/international/xls
m 2010 to 20
of the total
United State
5. Foreign di
ely 3 percent
als also cover a ra
08–2013.” Bureau/fdius‐
12
014,21
s.
irect
t of
nge of
of

©Center fo
Figure 1.5
Source: Cen
Other U.S
include:
B
Fo
M
M
T
in
C
T
o
T
Research
The auto
automot
through
was discl
federal g
testing, a
or Automotive
: Announced A
ter for Automot
S. investmen
MW openin
ord opening
Mercedes bu
Mercedes exp
oyota conso
nto a single n
alifornia)
esla establis
peration in C
esla building
h, Developm
omotive indu
ive research
public sourc
losed, only o
government,
and impleme
Research 2015
Automaker Inve
tive Research, Ja
nt announce
g a new reg
g new techni
ilding a new
panding its T
olidating its m
new headqu
shing a small
California
g a $5 billion
ment, and Inn
ustry invests
h and develo
ces. In 2007,
one percent
leaving the
enting new t
5
estments in Nor
nuary 2015
ements not s
ional parts d
cal support
w vehicle pre
Tuscaloosa a
manufacturi
uarters in Tex
l manufactu
n battery “Gi
novation in
heavily in re
opment effor
the last yea
of R&D in th
industry to
technologies
rth America, Ja
shown in the
distribution c
center for F
paration cen
assembly pla
ng, sales and
xas (moving
ring site at a
igafactory” i
the Automo
esearch and
rts are large
ar when fede
he automotiv
bear essent
s (see Figure
January – Dece
e map (but i
center in Tex
ord Racing i
nter and oth
ant in Alabam
d marketing
operations
a former Chr
n Nevada
otive Indust
developme
ly funded by
eral funding
ve industry
tially the full
e 1.6).
ember 2014
ncluded in t
xas
n North Car
her offices in
ma
g, and corpor
from Kentuc
rysler service
ry
ent. Unlike ot
y the industr
for the auto
was funded
cost of crea
he 2014 tota
olina
n California
rate operati
cky and
e parts
ther industr
ry, rather th
omotive indu
through the
ating, design
13
al)
ons
ries,
an
ustry
e
ning,
©Center for Automotive Research 2015 14
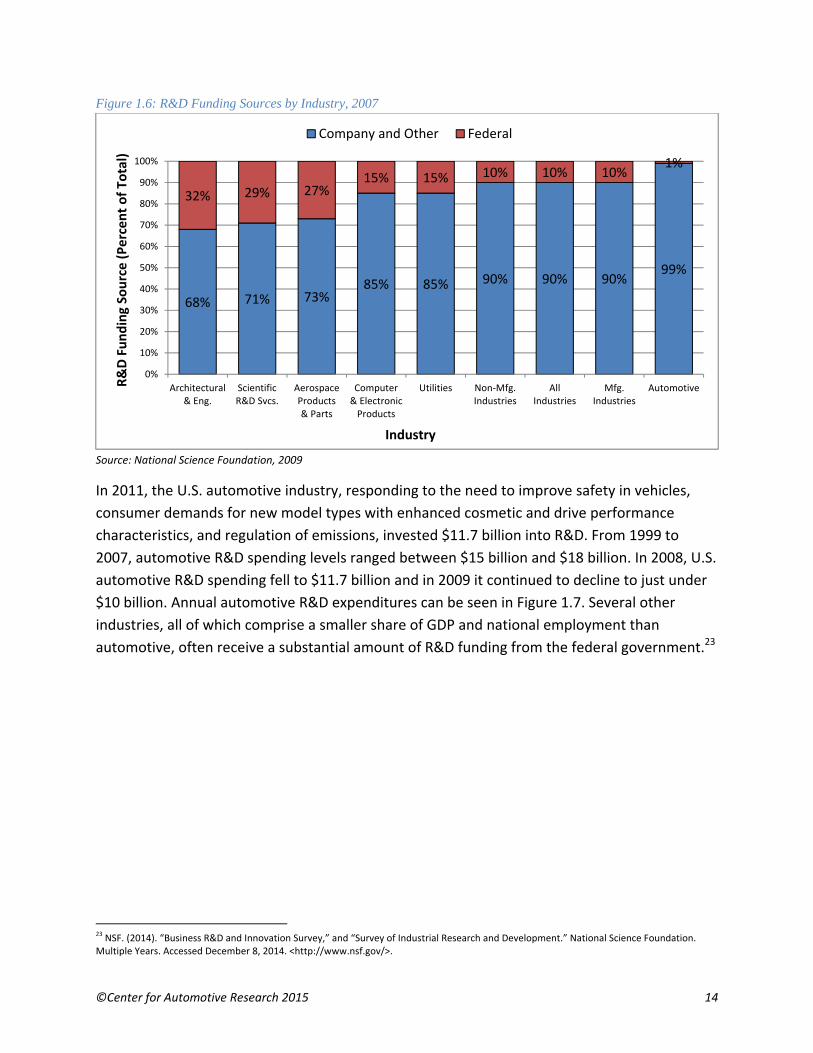
Figure 1.6: R&D Funding Sources by Industry, 2007
Source: National Science Foundation, 2009
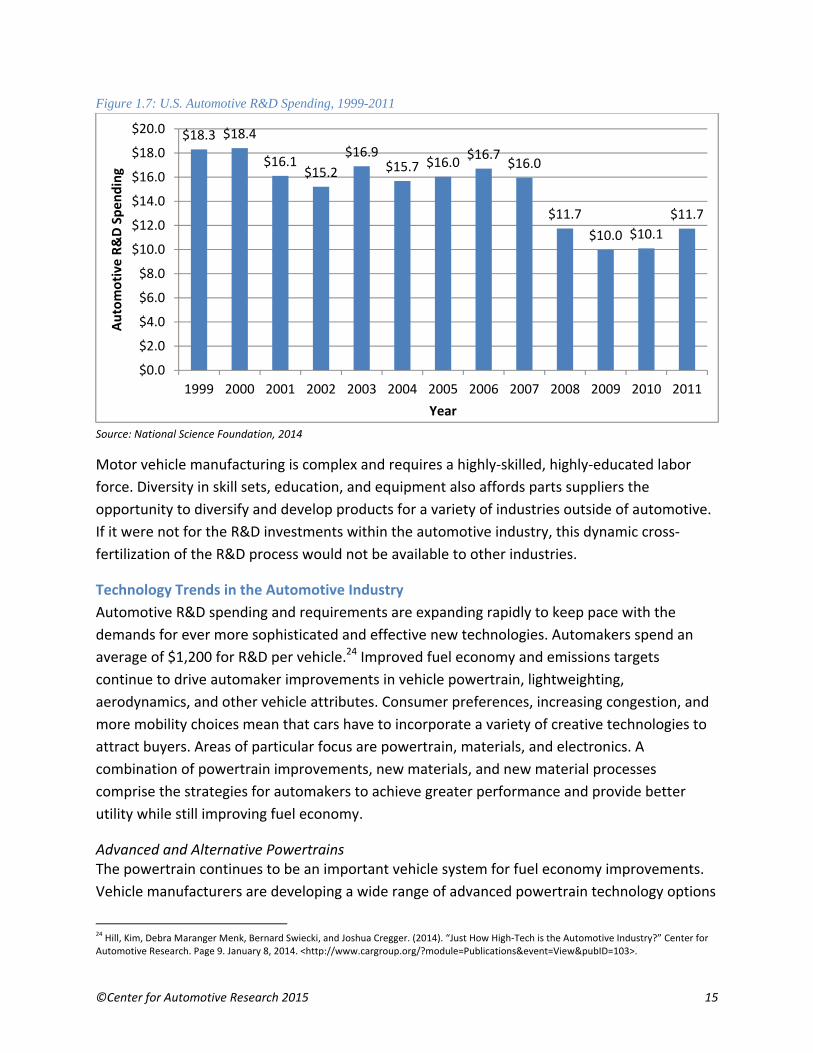
In 2011, the U.S. automotive industry, responding to the need to improve safety in vehicles,
consumer demands for new model types with enhanced cosmetic and drive performance
characteristics, and regulation of emissions, invested $11.7 billion into R&D. From 1999 to
2007, automotive R&D spending levels ranged between $15 billion and $18 billion. In 2008, U.S.
automotive R&D spending fell to $11.7 billion and in 2009 it continued to decline to just under
$10 billion. Annual automotive R&D expenditures can be seen in Figure 1.7. Several other
industries, all of which comprise a smaller share of GDP and national employment than
automotive, often receive a substantial amount of R&D funding from the federal government.23
23 NSF. (2014). “Business R&D and Innovation Survey,” and “Survey of Industrial Research and Development.” National Science Foundation.
Multiple Years. Accessed December 8, 2014. <http://www.nsf.gov/>.
68% 71% 73%85% 85% 90% 90% 90%
99%
32% 29% 27%15% 15% 10% 10% 10%
1%
0%
10%
20%
30%
40%
50%
60%
70%
80%
90%
100%
Architectural& Eng.
ScientificR&D Svcs.
AerospaceProducts& Parts
Computer& ElectronicProducts
Utilities Non‐Mfg.Industries
AllIndustries
Mfg.Industries
AutomotiveR&D Funding Source (Percent of To
tal)
Industry
Company and Other Federal
©Center for Automotive Research 2015 15
Figure 1.7: U.S. Automotive R&D Spending, 1999-2011
Source: National Science Foundation, 2014
Motor vehicle manufacturing is complex and requires a highly‐skilled, highly‐educated labor
force. Diversity in skill sets, education, and equipment also affords parts suppliers the
opportunity to diversify and develop products for a variety of industries outside of automotive.
If it were not for the R&D investments within the automotive industry, this dynamic cross‐
fertilization of the R&D process would not be available to other industries.
Technology Trends in the Automotive Industry
Automotive R&D spending and requirements are expanding rapidly to keep pace with the
demands for ever more sophisticated and effective new technologies. Automakers spend an
average of $1,200 for R&D per vehicle.24 Improved fuel economy and emissions targets
continue to drive automaker improvements in vehicle powertrain, lightweighting,
aerodynamics, and other vehicle attributes. Consumer preferences, increasing congestion, and
more mobility choices mean that cars have to incorporate a variety of creative technologies to
attract buyers. Areas of particular focus are powertrain, materials, and electronics. A
combination of powertrain improvements, new materials, and new material processes
comprise the strategies for automakers to achieve greater performance and provide better
utility while still improving fuel economy.
Advanced and Alternative Powertrains The powertrain continues to be an important vehicle system for fuel economy improvements.
Vehicle manufacturers are developing a wide range of advanced powertrain technology options
24 Hill, Kim, Debra Maranger Menk, Bernard Swiecki, and Joshua Cregger. (2014). “Just How High‐Tech is the Automotive Industry?” Center for
Automotive Research. Page 9. January 8, 2014. <http://www.cargroup.org/?module=Publications&event=View&pubID=103>.
$18.3 $18.4
$16.1$15.2
$16.9$15.7 $16.0
$16.7$16.0
$11.7
$10.0 $10.1
$11.7
$0.0
$2.0
$4.0
$6.0
$8.0
$10.0
$12.0
$14.0
$16.0
$18.0
$20.0
1999 2000 2001 2002 2003 2004 2005 2006 2007 2008 2009 2010 2011
Automotive R&D Spending
Year
©Center for Automotive Research 2015 16
to meet environmental regulations, consumer preferences, and energy‐saving goals. While the
spark‐ignited internal combustion engine (ICE) will remain the dominant technology for the
foreseeable future, other powertrain options will see increased market acceptance, and no
single option is expected to emerge as the best solution. Areas of technology growth related to
powertrain systems include advanced internal combustion engines (gasoline and diesel),
transmissions, vehicle electrification, and alternative fuels. Each of these categories presents a
wide range of technology options and cost considerations.
The internal combustion engine (ICE) has undergone remarkable change in the past decade and
newly developed advanced internal combustion engines are expected to improve ICE
environmental performance and also have a cost advantage vis‐à‐vis other powertrain options.
Automakers continue to improve fuel economy of ICE engines using advanced technologies
such as downsizing, turbocharging, variable compression ratio capability, and lean‐burn engine
operation.
Automatic transmissions will remain the dominant choice for U.S. consumers. In coming years,
consumers should expect to see more vehicles with dual clutch transmissions (DCT),
continuously variable transmissions (CVT), and higher‐geared (seven‐speed or higher)
transmissions.
Electrified vehicles hold both promise and uncertainty. Electric vehicles such as the Chevrolet
Volt, Nissan Leaf, Ford Focus Electric, and Tesla Model S have entered the mainstream—but
certainly not mass market. Vehicle electrification—including mild hybrids, hybrid electric
vehicles, plug in hybrid electric vehicles, and battery electric vehicles—is highly dependent
upon further battery development and consumer acceptance.
Alternative fuels, such as natural gas, hydrogen, and biofuels, will also have a place in the
advanced powertrain mix. Natural gas has been used in vehicles for many years, but has been
mostly limited to heavy‐duty and fleet applications. Promoters of natural gas suggest that its
abundance and relatively clean burning characteristics make it an ideal candidate for increased
usage in motor vehicles. Hydrogen is another alternative fuel that has been researched for
decades. Some automakers are already selling or leasing fuel cell electric vehicles, and s everal
others have announced they will introduce fuel cell electric vehicles in the near future. Biofuels
had strong government support in recent years with tax incentives and a national Renewable
Fuels Standard geared towards increasing biofuels production and use. Issues with the 10
percent ethanol “blend wall” have resulted in regulators reducing biofuels production

©Center for Automotive Research 2015 17
requirements.25 All alternative fuels face infrastructure availability issues as well as the
challenge of relatively inexpensive gasoline.
Materials and Joining Vehicle weight is a considerable factor in vehicle fuel economy; it is estimated that a 10 percent
reduction in vehicle mass can result in a fuel economy improvement of up to 5‐7 percent.26
Though achieving greater fuel economy is a main driver for many lightweighting material and
process technologies, there are other benefits. Weight reduction is also appealing to
automakers because it tends to increase other performance factors valued by consumers: ride
and handling, braking, and acceleration. Another key motivation for using new and more highly
engineered materials is to improve vehicle safety and crashworthiness.
By switching to lightweighting materials, such as high strength steel, aluminum, magnesium,
and composites, and adopting new forming (e.g., hot stamping and high integrity casting) and
advanced joining (e.g., adhesives, friction stir welding, fasteners, and laser welding)
technologies, automakers will be able to significantly reduce the weight of new vehicles. By
2025, automakers are expected to reduce the average vehicle mass by 10 percent or greater
versus 2010 vehicles.27
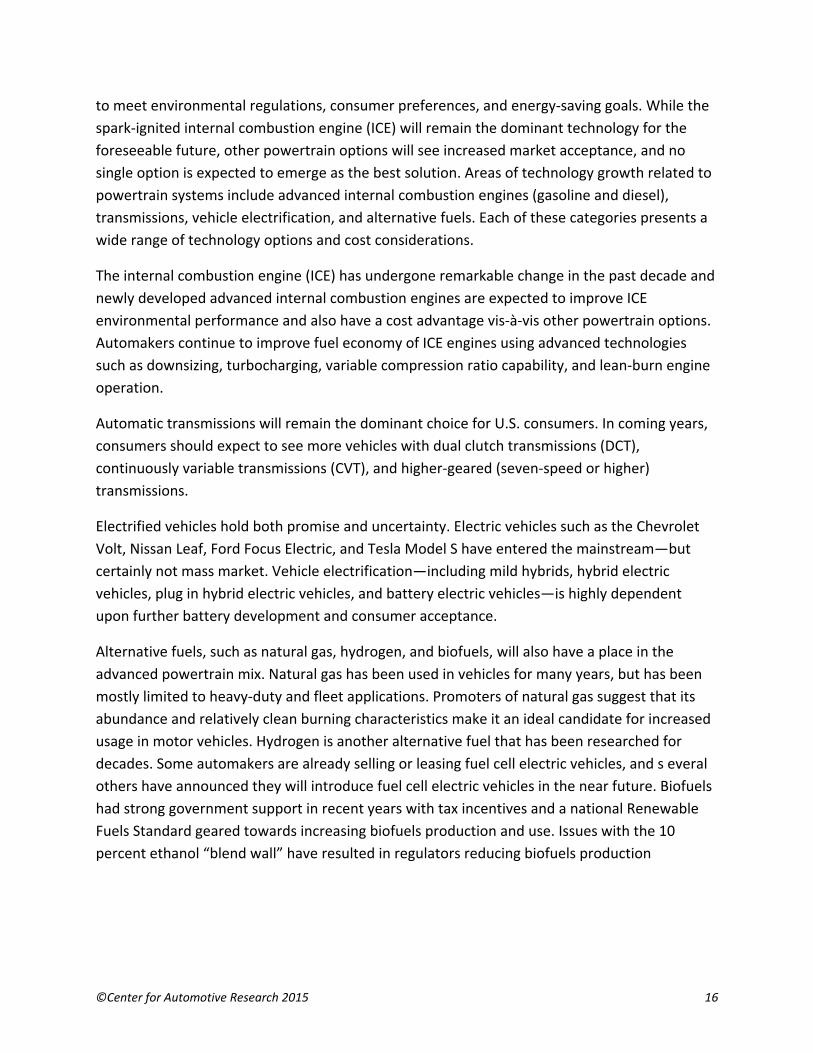
Automakers have historically concentrated on improving the materials used to create vehicles.
In the last few decades, there has been increased use of advanced high strength steel (AHSS),
composites, and aluminum, as well as a decrease in the use of iron castings and regular (mild)
steel. These trends can be seen in Figure 1.8. As automakers continue to implement
lightweighting strategies, these material trends will persist and may even accelerate.
25 CBO. (2014). “The Renewable Fuel Standard: Issues for 2014 and Beyond” Congressional Budget Office. June 2014.
<http://www.cbo.gov/sites/default/files/45477‐Biofuels2.pdf>. 26 NHTSA. (2012). “Corporate Average Fuel Economy for MY 2017‐MY 2025 Passenger Cars and Light Trucks.” National Highway Transportation
Safety Administration, U.S. Department of Transportation. Pages 435‐436. August 2012. <http://www.nhtsa.gov/staticfiles/rulemaking/pdf/cafe/FRIA_2017‐2025.pdf>. 27 This expectation is based on conversations between CAR and representatives from the automotive industry.
©Center fo
Figure 1.8
Sources: Wa
In additio
relates to
technolo
fasteners
die castin
importan
flow ana
ConnecteRoad tra
technolo
infrastru
of autom
connectiv
to their e
enable ve
informat
can sense
systems
28 Wallace, Ri
<http://www
or Automotive
: Vehicle Mate
ard’s Auto and A
on to the ma
o manufactu
ogy involves
s, adhesives,
ng, composit
nt, and comp
lysis, formab
ed and Automnsportation
ogy increasin
cture while
mation. This t
vity, and art
environment
ehicles to in
ion to make
e dangerous
in response.
chard and Gary Si
w.cargroup.org/?m
Research 2015
erial Compositi
American Chemis
aterials them
uring and de
application t
, weld bond
te molds, an
puter‐aided
bility, and cr
mated Vehiccontinues to
ngly enables
advanced dr
transformat
tificial intellig
t in ways tha
stantaneous
e transportat
s situations a
.28
lberg. (2012). “Sel
module=Publication
5
ion in U.S. Ma
stry Council, 201
mselves, muc
sign method
technologies
adhesive, la
nd aluminum
engineering
rash simulati
cles o undergo si
vehicles to c
river assistan
ion is driven
gence system
at human dr
sly commun
tion safer an
and issue dr
lf‐driving Cars: Thens&event=View&p
arket, 1978 – 20
14
ch of the adv
ds. Some of t
s such as joi
aser welding
m forming) te
g (CAE) is use
ions).
ignificant te
communicat
nce systems
n by the prol
ms that are e
ivers cannot
icate with ea
nd more effic
iver warning
e Next Revolution.pubID=87>.
012
vancement
the biggest d
ning (e.g., re
g) and fabrica
echniques. M
ed to model
chnological
te with each
s enable war
iferation of
enabling veh
t. Connected
ach other an
cient. Autom
gs or even ac
.” Center for Auto
in the autom
developmen
esistance sp
ation (hot fo
Material asse
new materi
transformat
h other and w
rnings and lim
sensors, act
hicles to per
d vehicle tec
nd the roadw
mated vehicl
ctively contr
omotive Research a
motive mate
nts in materi
ot welding,
orming, thin‐
essment is a
als (e.g., mo
tions as wire
with surroun
mited amou
tuators, wire
rceive and re
chnology wil
way—provid
e technolog
rol vehicle
and KPMG. Augus
18
rials
ials
‐wall
also
old
eless
nding
unts
eless
eact
l
ding
gy
st 2012.

©Center for Automotive Research 2015 19
Connected vehicle technology will enable vehicles to communicate with each other (vehicle‐to‐
vehicle ‐ V2V) and with the roadway, traffic signals, bridges, and other pieces of infrastructure
(vehicle‐to‐infrastructure ‐ V2I) using technologies such as dedicated short‐range
communications (DSRC) and cellular networks (i.e., 4G LTE connectivity). DSRC is a wireless
channel using the 5.9 GHz spectrum that was specifically designed for use in vehicular
communications. Connected vehicle systems can be embedded, as with factory installed units,
or may be brought into the vehicle in the form of a mobile device that can be plugged into or
wirelessly connected to the vehicle. Many vehicles in operation have some form of connectivity
(such as Chrysler Uconnect, Ford Sync/MyFord Touch, GM OnStar, Hyundai BlueLink, or Toyota
Entune), and vehicles equipped with DSRC will become commercially available in the next two
years. Vehicles equipped with V2V and V2I communication capabilities broadcast information
(brake status, location, direction, speed, and other vehicle data) as they are driven, and the
systems use cues such as sounds, lights, displays, and seat vibrations to alert drivers of various
threats.
Automated vehicle technologies use sensor inputs such as video cameras, radar, and LiDAR (a
laser‐based ranging system) along with computing power and detailed digital maps to issue
warnings or actively react to hazards. Several automated features already exist in many vehicles
sold today, such as automated emergency braking, lane‐keeping assist systems, adaptive cruise
control, and active parking assistance. Automakers may soon offer vehicles that combine some
of these existing systems, allowing a vehicle's speed, steering, and brakes to be automatically
controlled. In the near future, several automakers, including General Motors, Ford, Mercedes,
and Volvo, are set to release systems capable of semi‐automated driving in certain situations,
such as expressway or low‐speed stop‐and‐go (traffic jam) conditions.
The final frontier of automated vehicle technology is the self‐driving, fully‐automated vehicle
capable of operating on the road in mixed‐traffic. Despite the complexity involved, multiple
stakeholders are working to develop such vehicles. Google is testing fully‐automated vehicles
on public roads in Nevada and California, and has logged hundreds of thousands of miles in its
test vehicles. Traditional automakers, such as General Motors, Toyota, and Volkswagen, are
developing advanced automated functionality as well. Additionally, high‐tech automotive
supplier firms such as Bosch, TRW, Delphi, and others are developing advanced technologies
both in cooperation with, and independent from, the automakers.
Currently four states (Nevada, Florida, California, and Michigan) and the District of Columbia
have passed laws addressing fully automated vehicles on public roads, and several other states
throughout the country have considered similar legislation. In May 2013, the National Highway
Traffic Safety Administration released guidelines for states issuing licenses for testing fully
automated vehicles on public roads.
©Center for Automotive Research 2015 20
Sectors of the Automotive Industry
The automotive industry consists of several different sectors upstream and downstream of the
automakers. These other sectors include automotive suppliers, auto dealers, medium‐ and
heavy‐duty vehicle manufacturers, and automotive aftermarket suppliers.
Suppliers
In this report, the automotive supplier sector is defined as a large group of independent, non‐
automaker, parts producers that sell finished goods to both domestic and international
automakers, as well as aftermarket parts replacement retailers. For the purpose of this study,
the automotive supplier group includes employees beyond NAICS 3363 (the industry
classification code for motor vehicle parts) to account for products developed by other
manufacturing industries that are used in the production of vehicles.
The total direct employment count at supplier companies is 521,000 workers;29 this figure
includes employees associated with manufacturing tires, hoses, hardware, lighting, batteries,
and plastics for motor vehicles as well as firms producing aftermarket parts and parts for
export. Without the inclusion of products such as rubber hoses and tires, NAICS 3363 would not
be sufficient to fully describe all products used to manufacture a finished vehicle.30
In recent years, the suppliers’ responsibility to add technology and value to the automobile has
grown. Parts R&D, production, and sub‐assembly have been shifted onto suppliers, as
automakers –facing declining profits and other business operation issues—have spun off many
of their in‐house parts operations. This transition is significant for two reasons: 1) 28‐40 percent
of R&D spending undertaken by the suppliers and approximately 40 percent of all R&D
scientists and engineers in the automotive industry are employed by suppliers,31 and 2) the cost
of R&D was transferred into an industry sector with a large proportion of small‐ to medium‐
sized businesses.
Even though the majority of automotive suppliers are small businesses, many parts
manufacturers have considerable engineering capability to continue refining their products,
develop new products, and integrate those products into automakers’ vehicles.32 The
combination of the added pressure to invest in research without an immediately recognizable
revenue stream and the size make‐up of suppliers has had substantial effect on the viability of
the supplier sector. Not all automotive R&D has been transferred to the supplier sector;
however, automakers still largely fund vehicle engine, body, and transmission design, as well as
parts integration R&D for the development of future model lines.
29 This number represents all automotive manufacturing employees less those employed by the automakers. See Table 2.1.
30 Data from organizations such as Battery Council International and the Rubber Manufacturers Association were used by CAR researchers to
determine what percentage of employees in those industries serve the automotive industry. 31 Ibid. NSF. (2014).
32 This assessment is based on conversations between CAR and representatives from the automotive industry.

©Center for Automotive Research 2015 21
Innovation is key to productivity, yet breakthroughs do not always occur in a timely manner.
The responsibility to design new products has put great financial strain on suppliers. In addition,
the return of vehicle production volumes to their pre‐recession levels has put a tremendous
strain on suppliers as they struggle to meet demand after having reduced their production
capacity just a few short years ago.
Dealers
To the lay person, the automobile dealership is the most visible and tangible component of the
sophisticated automotive manufacturing and distribution system. Dealerships are a perfect
reflection of the fabric of the U.S.—family‐owned businesses operating in communities across
the nation, for generation after generation. Beyond their heartfelt “American Story” aspect, it is
important to understand the contribution of dealerships to the regional economies and
government revenues, especially given the decline and recovery in automobile sales in recent
years and dealership closures during the recession.
Even though the bankruptcies of General Motors and Chrysler were structured, their
occurrence shook the foundation of the automotive industry to its core. As assembly facility
operations slowed and ultimately stopped, the fate of franchise dealerships was closely
followed in communities across the nation. According to company restructuring plans, during
2009‐2010, approximately 2,000‐plus GM and Chrysler dealerships closed.33 Even before the
financial crisis and subsequent bankruptcies, the number of dealerships in the United States
had been declining for decades (from 1988 to 2007, on average, the number of operating
dealerships declined by nearly 200 per year).34 By January 2008, there were 20,770 new‐vehicle
dealerships operating in the United States, but by January 2012, the number had declined by
3,230 and only 17,540 dealerships were operating. Since January 2012, the number of
dealerships has been expanding, albeit slowly. As of January 2014, there were 17,665 new‐
vehicle dealerships in operation.
Even after the closing of thousands of dealerships in recent years, new and used vehicle
dealerships still employ more than 1,000,000 workers (an average of nearly 60 workers per
dealership).35 In 2013, total dealership revenues in the United States were $730 billion, with
57.1 percent of those revenues associated with new vehicles, 31.3 percent with used vehicles,
and 11.6 percent with service and parts. The average pretax profit of a dealership was more
33 Hill, Kim, Debbie Maranger Menk, and Adam Cooper. (2010) “Contribution of the Automotive Industry to the Economies of all Fifty State and
the United States.” Center for Automotive Research. April 2010. <http://www.cargroup.org/?module=Publications&event=View&pubID=16>. 34 NADA. (2006). “NADA Data 2006: Economic Impact of America’s New‐Car and New‐Truck Dealers.” NADA Data. National Automobile Dealers
Association. May 17, 2006. <https://www.nada.org/NR/rdonlyres/538D2699‐BF00‐4C73‐A162‐7A4FBBAC62E0/0/NADA_Data_2006pdf.pdf>. and NADA. (2013). NADA Data 2013: State‐of‐the‐Industry Report.” NADA Data. National Automobile Dealers Association. July 1, 2013. <http://www.nada.org/NR/rdonlyres/1B512AC7‐DCFC‐472C‐A854‐6F5527931A2F/0/2013_NADA_Data_102113.pdf>. 35 NADA. (2014). “NADA Data 2014: Annual Financial Profile of America’s Franchised New‐Car Dealerships.” NADA Data. National Automobile
Dealers Association. May 28, 2014. <http://www.nada.org/NR/rdonlyres/DF6547D8‐C037‐4D2E‐BD77‐A730EBC830EB/0/NADA_Data_2014_05282014.pdf>.

©Center for Automotive Research 2015 22
than $900,000 (2.2 percent of sales) and all three areas (new vehicles, used vehicles, and
service and parts) were profitable. Profitability for service and parts peaked in 2008 (car owners
were maintaining their vehicles rather than replacing them in the midst of the recession), and
have declined in subsequent years, but parts and service still represents the majority of
dealership profits.
Every state in the nation has new car and used car dealerships operating in its communities.
The dealerships’ support local communities through contributions to charities, paying property
taxes, and sponsoring local youth sports teams. These activities are critical to maintaining a
high quality of life in towns and cities across the nation. These contributions should be
considered when assessing the value of dealerships to regional economies and communities.
Medium and Heavy Duty
While not included in the economic modeling of the contribution analysis, the manufacture of
medium and heavy‐duty trucks and parts is a key component of the motor vehicle industry. An
overview of the activity of this sector of the industry is included in this section. Medium duty
trucks include Classes 3 to 6 (10,000 to 26,000 lbs.) and heavy duty trucks include Classes 7 and
8 (26,001 to over 33,000 lbs). A breakout of truck weight classes follows:
Table 1.2: Truck Weight Categories
Type Category Gross Vehicle Weight
Class 1 Light‐Duty
0‐6,000 lb.
Class 2 6,001‐10,000 lb.
Class 3
Medium‐Duty
10,001‐14,000 lb.
Class 4 14,001‐16,000 lb.
Class 5 16,001‐19,500 lb.
Class 6 19,501‐26,000 lb.
Class 7 Heavy‐Duty
26,001‐33,000 lb.
Class 8 33,001 lb. and over Note: This table is based on Federal Highway Administration (FHWA) weight classifications. The U.S. Census Bureau, U.S. Environmental Protection Agency, and Ward’s Automotive Group each use slightly different metrics for delineating light‐, medium‐, and heavy‐duty truck categories, but the FHWA classifications are used the most consistently throughout the industry. Source: U.S. Department of Energy 2014
Currently there are nearly 12.3 million medium‐ and heavy‐duty trucks registered in the United
States.36 Together, the medium‐ and heavy‐duty truck markets in the United States sold more
than 605,000 units in 2013 with revenues of $33.1 billion in 2013, putting the average revenue
36 Ward’s. (2014). “Truck Registrations by State and Type.” Ward's Motor Vehicle Facts & Figures 2014. Page 34. Ward’s Automotive Group,
Southfield, Michigan.
©Center for Automotive Research 2015 23
at approximately $54,700 per vehicle sold.37 Of all Class 4 and above vehicles sold in 2013, over
340,000 were domestically produced and nearly 11,000 were imported.38
Medium‐ and heavy‐duty vehicles comprised nearly 3.8 percent of all U.S. motor vehicle sales in
2013, with medium‐duty trucks accounting for more than 373,000 units sold and heavy‐duty
trucks accounting for more than 232,000 units sold.39 In 2013, the U.S. medium‐duty vehicle
market consisted primarily of Class 3 vehicles (approximately 68 percent of medium‐duty units
sold). Class 5 vehicles represented over 16 percent of medium‐duty units sold and Class 6
vehicles represented nearly 13 percent of medium‐duty units sold. The heavy duty vehicle
market consisted primarily of on‐road interstate trucks in the Class 8 category (nearly 80
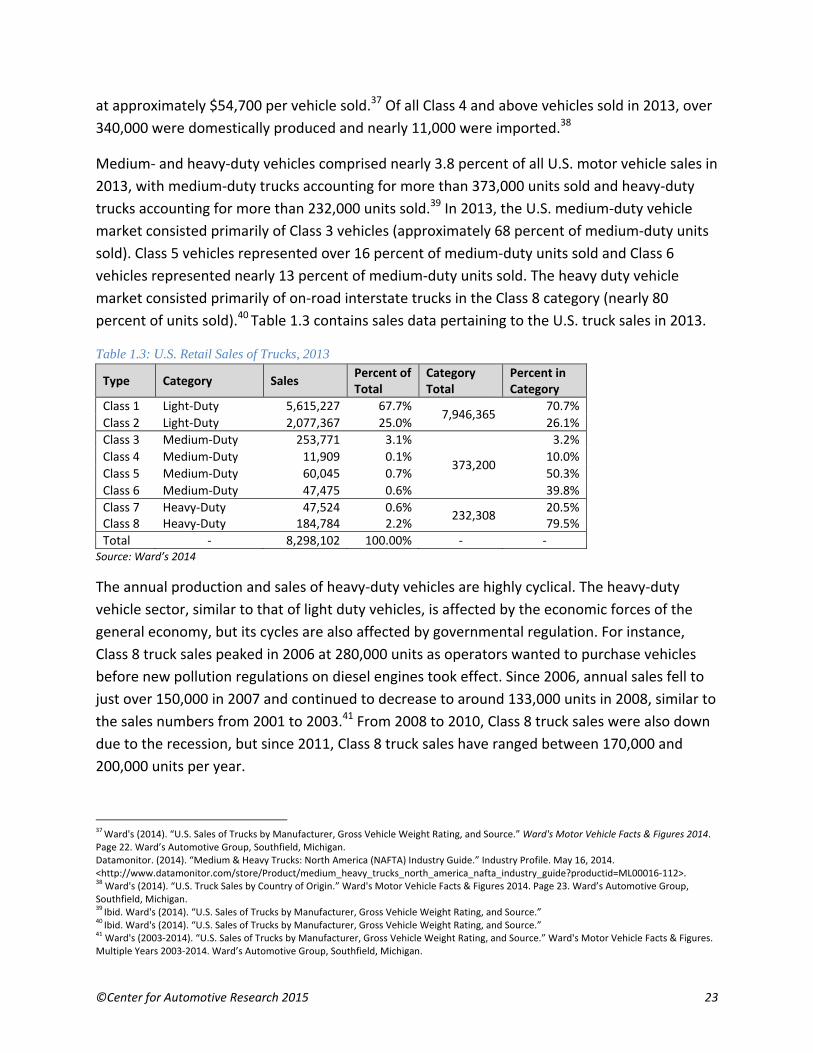
percent of units sold).40 Table 1.3 contains sales data pertaining to the U.S. truck sales in 2013.
Table 1.3: U.S. Retail Sales of Trucks, 2013
Type Category Sales Percent of Total
Category Total
Percent in Category
Class 1 Light‐Duty 5,615,227 67.7%7,946,365
70.7%
Class 2 Light‐Duty 2,077,367 25.0% 26.1%
Class 3 Medium‐Duty 253,771 3.1%
373,200
3.2%
Class 4 Medium‐Duty 11,909 0.1% 10.0%
Class 5 Medium‐Duty 60,045 0.7% 50.3%
Class 6 Medium‐Duty 47,475 0.6% 39.8%
Class 7 Heavy‐Duty 47,524 0.6%232,308
20.5% Class 8 Heavy‐Duty 184,784 2.2% 79.5%
Total ‐ 8,298,102 100.00% ‐ ‐Source: Ward’s 2014
The annual production and sales of heavy‐duty vehicles are highly cyclical. The heavy‐duty
vehicle sector, similar to that of light duty vehicles, is affected by the economic forces of the
general economy, but its cycles are also affected by governmental regulation. For instance,
Class 8 truck sales peaked in 2006 at 280,000 units as operators wanted to purchase vehicles
before new pollution regulations on diesel engines took effect. Since 2006, annual sales fell to
just over 150,000 in 2007 and continued to decrease to around 133,000 units in 2008, similar to
the sales numbers from 2001 to 2003.41 From 2008 to 2010, Class 8 truck sales were also down
due to the recession, but since 2011, Class 8 truck sales have ranged between 170,000 and
200,000 units per year.
37 Ward's (2014). “U.S. Sales of Trucks by Manufacturer, Gross Vehicle Weight Rating, and Source.” Ward's Motor Vehicle Facts & Figures 2014.
Page 22. Ward’s Automotive Group, Southfield, Michigan. Datamonitor. (2014). “Medium & Heavy Trucks: North America (NAFTA) Industry Guide.” Industry Profile. May 16, 2014. <http://www.datamonitor.com/store/Product/medium_heavy_trucks_north_america_nafta_industry_guide?productid=ML00016‐112>. 38 Ward's (2014). “U.S. Truck Sales by Country of Origin.” Ward's Motor Vehicle Facts & Figures 2014. Page 23. Ward’s Automotive Group,
Southfield, Michigan. 39 Ibid. Ward's (2014). “U.S. Sales of Trucks by Manufacturer, Gross Vehicle Weight Rating, and Source.”
40 Ibid. Ward's (2014). “U.S. Sales of Trucks by Manufacturer, Gross Vehicle Weight Rating, and Source.”
41 Ward's (2003‐2014). “U.S. Sales of Trucks by Manufacturer, Gross Vehicle Weight Rating, and Source.” Ward's Motor Vehicle Facts & Figures.
Multiple Years 2003‐2014. Ward’s Automotive Group, Southfield, Michigan.

©Center for Automotive Research 2015 24
U.S. production of heavy‐duty trucks was over 230,000 units in 2013 with assembly facilities
employing 25,900 workers.42 In 2014, employment in the production of heavy‐duty vehicles has
increased to more than 27,000 workers. In addition to manufacturing heavy‐duty trucks, more
than 80,000 individuals were employed manufacturing truck trailers, motor homes, travel
trailers, and campers in 2013.43 This estimate does not include the considerable number of
individuals who work at suppliers to the heavy‐duty truck manufacturers. These suppliers, in
many cases, supply both heavy duty and light duty motor vehicle manufacturers.
Medium‐ and heavy‐duty vehicles are instrumental in keeping America’s economy going by
transporting goods and products in a timely and cost‐effective manner. As of 2012, 70 percent
of America’s freight tonnage is hauled by truck. When considering the value of shipments, this
figure increases to around 74 percent.44 Between 1980 and the present, use of medium‐ and
heavy‐duty trucks on U.S. highways has increased by a factor of two ─ from nearly 1.3 trillion
ton‐miles of freight in 1980 to more than 2.6 trillion ton‐miles of freight in 2011.45
Aftermarket Suppliers
While not explicitly detailed in the economic contribution analysis of this report (Sections II and
III), the aftermarket sector is partially included in the supplier and dealership totals.46 The
aftermarket segment consists of suppliers who provide products for the repair and
maintenance of light and heavy vehicles. For some automotive products, aftermarket sales are
far greater than sales in the new vehicle market. For example, a new car gets only one battery
installed by the vehicle assembler, but during the life of that car, five or six replacement
batteries may be purchased. For frequently replaced service products like oil filters, as many as
35 replacement parts may be used. These aftermarket products are sold through auto parts
stores and used by service technicians in dealerships, garages, and specialty service providers to
maintain the vehicles in use on America’s roadways. As a result, the automotive aftermarket
manufacturers support service and distribution jobs that are not included in this study.
The aftermarket manufacturing supply sector provides parts and equipment for the
maintenance, repair, and enhancement of the more than 250 million light duty vehicles
currently on the road in the United States. In 2011, aftermarket service and retail outlets
42 BLS. (2014). “Employment, Hours, and Earnings from the Current Employment Statistics survey (National).” Bureau of Labor Statistics.
Accessed November 3, 2014. <http://www.bls.gov/ces/data.htm>. 43 Ibid. BLS. (2014).
44 BTS. (2013). “Table 1 ‐ Shipment Characteristics by Mode of Transportation for the United States: 2012.” Commodity Flow Survey. Bureau of
Transportation Statistics, Research and Innovative Technology Administration. December 2013. <http://www.rita.dot.gov/bts/sites/rita.dot.gov.bts/files/publications/commodity_flow_survey/2012/united_states/table1.html>. 45 BTS. (2014). “Table 1‐50 ‐ U.S. Ton‐Miles of Freight (BTS Special Tabulation).” National Transportation Statistics. Bureau of Transportation
Statistics, Research and Innovative Technology Administration. July 2014. <http://www.rita.dot.gov/bts/sites/rita.dot.gov.bts/files/publications/national_transportation_statistics/index.html>. 46 For example, parts and service operations at a dealership are considered aftermarket activities. The category of parts and service is the
largest portion of dealership profits—contributing more than $290,000 in net profit for the average dealership in 2014 (NADA 2014).

©Center for Automotive Research 2015 25
employed nearly 4 million workers and had revenues of nearly $223 billion.47 Revenues are
forecast to increase to $256 billion for 2015. In addition to the light‐duty vehicle aftermarket,
revenue for the medium‐ and heavy‐duty aftermarket was nearly $74 billion in 2011 and the
2015 forecast suggests it will increase to nearly $85 billion in 2015. In total, the U.S. light‐,
medium‐, and heavy‐duty aftermarket value was $296 billion in 2011, and it is forecast to
increase to $341 billion in 2015.48
Role of Small‐ and Medium‐sized Businesses in the Automotive Industry
The automakers are among the largest and most companies in the nation, which can mask the
extent to which the auto industry itself both is comprised of small businesses and supports
small and local businesses. Automakers and large Tier 1 suppliers require services, materials
and products from a large and diverse supply chain. Industries as diverse as printing services,
fabric makers, carpet wholesalers, railroads, employment agencies, design services and
software coding companies all supply the auto industry. Many of these companies are very
small firms, sometimes with the owner as the sole employee. Commonly, in the automotive
corridor (see the map in Figure 1.1), new companies are started as employees of the
automakers or large suppliers see opportunities in niche areas and leave their jobs to start their
own companies. This study includes an anecdotal examination of the influence of the
automotive industry on small businesses within the state of Kentucky as well as the industry’s
general contribution to the state’s economy.
There is no one single definition of small business, but rather a plethora of standards. The
National Small Business Association considers any business with fewer than 500 employees to
be small.49 The federal government, via the Small Business Administration, simultaneously
holds several definitions, contingent upon either number of employees or annual receipts, with
thresholds varying across industries.50 For example, certain manufacturers may still qualify as
small businesses with as many as 1,500 employees, while no form of agricultural business
would be considered small with annual receipts in excess of $9 million.
The 500 employee threshold is the most commonly applied standard.51 Using this standard, 96
percent of automotive establishments are small businesses. In looking at the various sectors of
the industry, 81 percent of motor vehicle manufacturing operations are small businesses, as are
96 percent of vehicle parts manufacturing companies. In terms of the broader economy,
businesses within the automotive industry are, overwhelmingly, small.
47 AAIA. (2013). “Digital Automotive Aftermarket Factbook: 22
nd Edition, 2013.” Automotive Aftermarket Industry Association. 2013.
48 Ibid. AAIA. (2013).
49 NBSA. (2014). National Small Business Association. Website. Accessed December 29, 2014. <http://www.nsba.net/>.
50 SBA. (2014). “What is SBA's Definition of a Small Business Concern?” U.S. Small Business Administration. Accessed December 29, 2014.
<https://www.sba.gov/content/what‐sbas‐definition‐small‐business‐concern>. 51 FactCheck.org. (2010). “What’s a ‘Small Business’?” FactCheck.org, Annenberg Public Policy Center.
<http://www.factcheck.org/2010/08/whats‐a‐small‐business/>.
©Center fo
Kentucky
To highlig
measure
auto sup
automot
The inter
the integ
please se
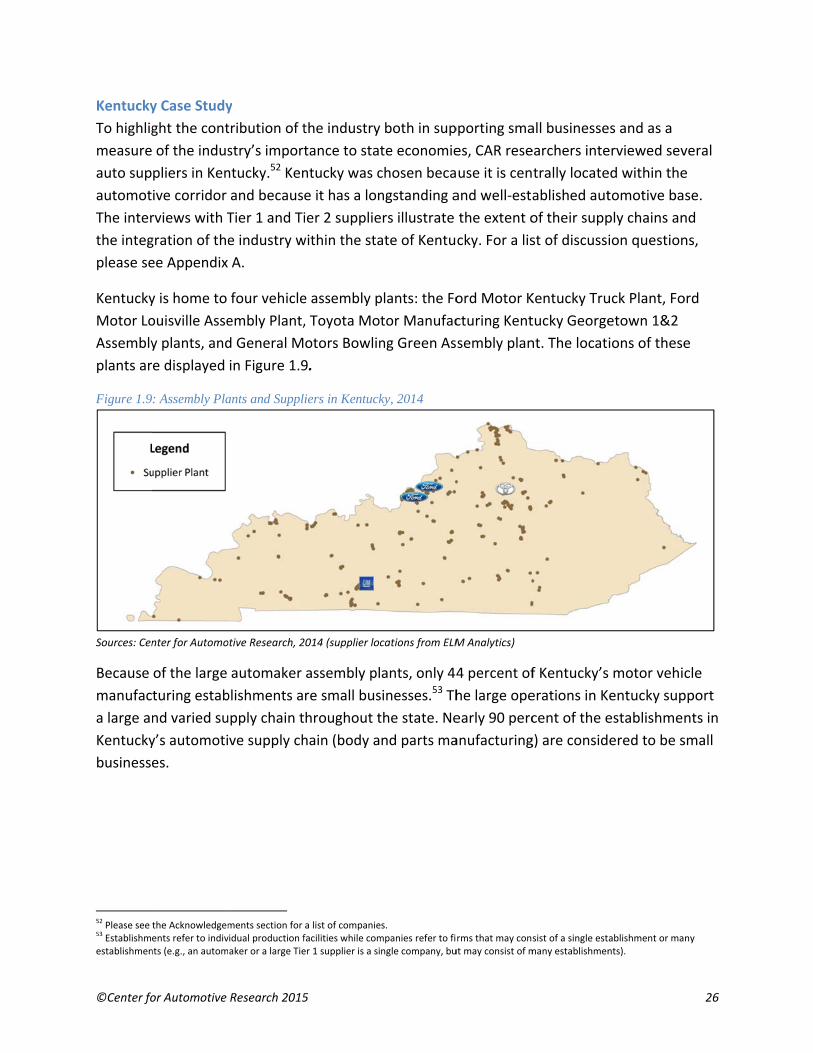
Kentucky
Motor Lo
Assembly
plants ar
Figure 1.9
Sources: Cen
Because
manufac
a large an
Kentucky
business
52 Please see
53 Establishm
establishmen
or Automotive
y Case Study
ght the cont
of the indus
pliers in Ken
ive corridor
rviews with T
gration of the
ee Appendix
y is home to
ouisville Asse
y plants, and
e displayed
: Assembly Pla
nter for Automo
of the large
turing estab
nd varied su
y’s automoti
es.
the Acknowledgements refer to indivnts (e.g., an autom
Research 2015
y
tribution of t
stry’s import
ntucky.52 Ken
and becaus
Tier 1 and Ti
e industry w
A.
four vehicle
embly Plant,
d General M
in Figure 1.9
ants and Suppl
otive Research, 2
automaker
blishments a
upply chain t
ve supply ch
ments section for vidual production faker or a large Tie
5
the industry
tance to stat
ntucky was c
e it has a lon
ier 2 supplie
within the sta
e assembly p
, Toyota Mo
otors Bowlin
9.
iers in Kentuck
2014 (supplier loc
assembly pl
re small bus
hroughout t
hain (body a
a list of companiefacilities while comer 1 supplier is a si
both in sup
te economie
chosen beca
ngstanding a
ers illustrate
ate of Kentu
plants: the Fo
tor Manufac
ng Green As
ky, 2014
cations from ELM
ants, only 44
sinesses.53 Th
the state. Ne
nd parts ma
es. mpanies refer to fingle company, bu
pporting sma
es, CAR rese
use it is cen
and well‐esta
the extent o
cky. For a lis
ord Motor K
cturing Kent
sembly plan
M Analytics)
4 percent of
he large ope
early 90 perc
anufacturing
rms that may conut may consist of m
all businesse
earchers inte
trally locate
ablished aut
of their supp
st of discuss
Kentucky Tru
tucky George
nt. The locat
f Kentucky’s
erations in K
cent of the e
g) are consid
sist of a single estmany establishmen
es and as a
erviewed sev
ed within the
tomotive ba
ply chains an
ion question
uck Plant, Fo
etown 1&2
ions of these
motor vehic
entucky sup
establishmen
ered to be s
ablishment or mants).
26
veral
e
se.
nd
ns,
ord
e
cle
pport
nts in
small
ny

©Center for Automotive Research 2015 27
Table 1.4: Kentucky Business Establishments by Size
All Industries Manufacturing Automotive Vehicle
Manufacturing Body or Parts Manufacturing
All Establishments 89,795 3,776 202 9 193
Less than 50 employees 84,715 2,933 55 4 51
Less than 500 employees 4,840 773 120 0 120
500 or more 240 70 27 5 22
% Below 100 97.40% 86.70% 55.40% 44.40% 51.70%
% Below 250 99.20% 95.00% 77.40% 44.40% 77.60%
% Below 500 99.70% 98.10% 86.40% 44.40% 87.10%
Source: Census, 2012 County Business Patterns, Kentucky Cabinet for Economic Development
Kentucky’s top 10 automotive employers provide approximately 34,200 jobs in Kentucky,
representing nearly 42 percent of the state’s automotive workforce.54 Toyota and Ford are the
top two automotive employers, providing more than 20,000 jobs in the state. Other top
automotive employers in Kentucky include Akebono Brake Industry Co., Hitachi, Martinrea
International, Johnson Controls, Dana Holding Corporation, Grupo Proeza SA de CV, Toyota
Tsusho Corporation, and ZF Friedrichshafen AG.
Most of the companies interviewed by CAR researchers have had a long presence in Kentucky,
with some having been established in the state more than thirty years ago. While anywhere
from 30 to 90 percent of products made by these Kentucky companies are shipped to other
manufacturing plants in Kentucky, almost all export their products worldwide and throughout
the United States. Not all of the suppliers are entirely dedicated to the automotive industry;
some of the companies derive as much as half of their revenues from industries other than auto
manufacturing.
The interviewees expressed an interest in being able to source more materials and purchased
parts locally. These manufacturers, on average, purchase about five to ten percent of their raw
materials and intermediate components from other Kentucky businesses. Most have active
programs to increase their purchases from local businesses and minority‐owned companies. For
the most part, however, the capacity to do so on a large scale has not yet been developed.
Most companies did indicate that small, nearby businesses were critical to operations,
particularly because these smaller local companies have the ability to provide special orders or
emergency services and componentry rapidly and with high quality. These companies often do
not have the capacity to be large‐scale suppliers. One company noted that it has a growing
program to support small and local suppliers, “We want the local business. The closer we can
find them (suppliers) there’s benefit, but they have to have the capability for it and the
54 KYEDC. (2014). Kentucky Cabinet for Economic Development. Website. Accessed January 8, 2015. <http://www.thinkkentucky.com/>.

©Center for Automotive Research 2015 28
experience. I think this can be improved for our area.” Another company mentioned a goal to
increase domestic sourcing, “We want to have 90 percent domestic sourcing and as close as we
can get inside 200 miles.”
The state of Kentucky’s support of its businesses ranked highly among all of the executives
interviewed. Kentucky has numerous programs to stay engaged with and support its resident
companies. Interviewees all commented that they have a great relationship with the Economic
Development Cabinet and a strong relationship with the governor, “Whether it’s training
support or other grants the state offers to any industry, they are always willing and able to
provide us support.” A few of the companies are subsidiaries of foreign‐based corporations,
and representatives from those companies noted that the state and the governor maintain
good relationships with their corporate headquarters and executives, “They do everything
possible within their power to support us.”
From the tour of Kentucky and visits throughout the state, the contributions of the industry to
local economies are evident and valued. The challenge for the industry within the state mirrors
an overall industry concern – namely, the capacity and availability of small suppliers deep into
the supply chain. The state and local economic developers of Kentucky received universally high
marks for their commitment, support, and responsiveness to the concerns of each of the
companies interviewed.
©Center for Automotive Research 2015 29
SECTION II ‐ ESTIMATES OF THE ECONOMIC CONTRIBUTION OF THE MOTOR VEHICLE INDUSTRY TO THE UNITED
STATES ECONOMY
The tables in this section detail the estimated employment contributions to the economies of
each of the 50 states, and the country as a whole, by the U.S. motor vehicle industry.
Employment estimates are broken out by direct employment (people employed directly by
automotive companies), intermediate employment (people employed by suppliers to the motor
vehicle industry), and spin‐off employment (expenditure‐induced employment resulting from
spending by direct and intermediate employees).
Employment and income estimates are derived from analyses using a regional economic model,
supplied by Regional Economic Models, Inc. (REMI), of Amherst, Massachusetts. The model and
methodology used will be discussed further later in this study (Section IV). The employment and
compensation data used to perform the research were provided by motor vehicle companies or
gathered through publicly available data; the intermediate and spin‐off effects were generated
by the model. The remaining data on the U.S. economy and the automotive industry were
collected by CAR from a wide variety of publicly available sources and are listed in the
references. Direct employment data include headquarters, office, research, design and
development, manufacturing, assembly and logistics job classifications. All employment
numbers cited below are rounded; income and tax receipt numbers are also rounded.
Table 2.1 sums the combined effects from all motor vehicle manufacturing and retail
operations. Summing the direct employment from all operations (1,553,000), intermediate
employment (2,316,000) and spin‐off employment (3,381,000), more than 7 million jobs are
supported or directly provided by the industry to the U.S. economy. Comparing total
employment to direct employment produces an overall employment multiplier of 4.755. This
means that there are 3.7 additional jobs in the U.S. economy for every job in the industry. The
industry comprises 3.8 percent of all private sector employment in the United States.
55 The multiplier is determined by dividing the total employment contribution by the number of direct employees: (7,250,000 / 1,553,000) = 4.7.

©Center for Automotive Research 2015 30
Table 2.1: Total Contribution of all Motor Vehicle Manufacturing and Dealership Operations to the Economy of the United States
Source: Center for Automotive Research, 2014
Total compensation for all 7.25 million private sector jobs is nearly $500 billion, which
represents 3.3 percent of the private sector compensation in the U.S. economy. From this
amount, more than $64 billion is paid for personal income taxes and $57 billion in other public
contributions, such as FICA. Net disposable income for these workers totals $370 billion.
Vehicle Manufacturer Activities
Information on U.S. automotive manufacturing and related operations employment was
supplied by each of the major the automakers operating in the United States.56 Together these
automakers employed a total of 322,000 employees in the United States. Automaker
employment was classified according to the North American Industry Classification System
(NAICS) into multiple job‐type categories for input into the model — motor vehicle and motor
vehicle parts manufacturing (category numbers: NAICS 3361‐3363); management of companies
(NAICS 551); professional, scientific and technical services (NAICS 541); securities, commodity
56 Automakers contribution employment data to this study included BMW, Chrysler, Ford, General Motors, Honda, Hyundai, Kia, Mazda,
Mercedes, Mitsubishi, Nissan, Subaru, Toyota, and Volkswagen.
Employment
Direct employment 322,000 843,000 710,000 1,553,000
Intermediate 805,000 2,069,300 246,700 2,316,000
Total (Direct + Intermediate) 1,127,000 2,912,300 956,700 3,869,000
Spin‐off 1,316,000 2,687,700 693,300 3,381,000
Total (Direct + Intermediate + Spin‐off) 2,443,000 5,600,000 1,650,000 7,250,000
Multiplier 7.6 6.6 2.3 4.7
Compensation ($billions nominal) 167.7 375.3 116 491.3
Less: transfer payments & social insurance
contributions‐21.6 ‐41.5 ‐15.9 ‐57.4
Less: personal income taxes ‐23 ‐44.7 ‐19.4 ‐64.1
Equals private disposable personal income
($billions nominal)123.2 289.1 80.7 369.8
Contribution as % of total private economy
Employment 1.6 2.9 0.9 3.8
Compensation 1.7 2.7 0.6 3.3
Economic Impact Automakers
All Motor Vehicle‐
related
Manufacturing
(incl Automakers)
Auto
DealershipsTOTAL
©Center for Automotive Research 2015 31
contracts and investments (NAICS 523); warehousing and storage (NAICS 493); administrative
services, facilities and support services (NAICS 521) and wholesale trade (NAICS 42).
As can be seen in Table 2.1, there are 2,069,300 intermediate jobs that support the direct
employment at auto manufacturers and parts makers. The spin‐off jobs supported by the
incomes and spending of the people who work in the direct and intermediate jobs add another
2,687,700 jobs, bringing the total jobs associated with motor vehicle manufacturing activities in
the United States to 5,600,000 jobs. The ratio of total jobs created to direct employment
produces an employment multiplier of 6.6 (5,600,000 ÷ 843,000). The multiplier for motor
vehicle manufacturing and assembly (automaker) alone is 7.6 (2,443,000 ÷ 322,000). There are
more than six additional jobs in the U.S. economy for every job in automobile manufacturing
operations.
The direct employees of automakers include researchers, engineers, managers and
administrative support, as well as workers on the assembly lines. Because the actual
manufacturing of parts and assembly of vehicles draws on a deep supply chain for components
and materials, manufacturing jobs have a high downstream (intermediate and spin‐off)
employment multiplier. When considering only assembly line employment, the jobs multiplier
for automaker vehicle manufacturing activities is approximately 11.57 That is, for every job on
an assembly line, 10 additional jobs are created or supported in the economy.
Compensation in the private sector associated with the total jobs (direct plus intermediate plus
spin‐off) amounts to $375.3 billion. Estimated personal taxes to be paid, resulting from
employment in automotive manufacturing operations, are nearly $45 billion.
To put the compensation and employment numbers in context, the direct, intermediate, and
spin‐off jobs associated with vehicle and parts manufacturing account for nearly three percent
of employment in the entire U.S. economy and two percent of total U.S. compensation.
Table 2.2 offers a more detailed look at the intermediate and spin‐off employment associated
with vehicle and parts manufacturing. In the intermediate employment category, there are
2,069,300 jobs spread across numerous manufacturing and non‐manufacturing industries. As
mentioned earlier, the intermediate category captures the employment necessary to satisfy
manufacturers’ demands for the materials and services needed to design, produce and sell
motor vehicles. This can be broadly considered the automotive supplier network. This supply
network consists of the Tier 1 suppliers who supply parts and services directly to vehicle
assemblers along with the lower‐tier suppliers who supply the basic materials and services to
57 Not shown in Table 2.1. Vehicle assembly operations and employment are a subset (and comprise approximately 70 percent) of the 322,000
total jobs at automakers.
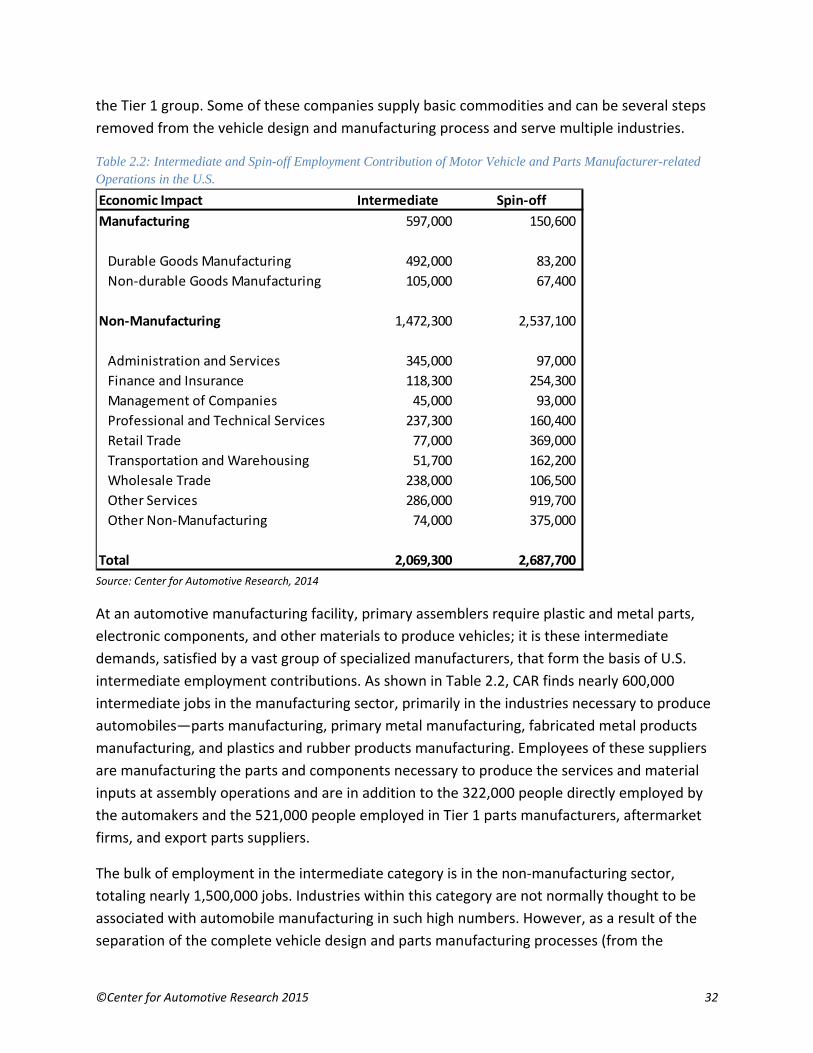
©Center for Automotive Research 2015 32
the Tier 1 group. Some of these companies supply basic commodities and can be several steps
removed from the vehicle design and manufacturing process and serve multiple industries.
Table 2.2: Intermediate and Spin-off Employment Contribution of Motor Vehicle and Parts Manufacturer-related Operations in the U.S.
Source: Center for Automotive Research, 2014
At an automotive manufacturing facility, primary assemblers require plastic and metal parts,
electronic components, and other materials to produce vehicles; it is these intermediate
demands, satisfied by a vast group of specialized manufacturers, that form the basis of U.S.
intermediate employment contributions. As shown in Table 2.2, CAR finds nearly 600,000
intermediate jobs in the manufacturing sector, primarily in the industries necessary to produce
automobiles—parts manufacturing, primary metal manufacturing, fabricated metal products
manufacturing, and plastics and rubber products manufacturing. Employees of these suppliers
are manufacturing the parts and components necessary to produce the services and material
inputs at assembly operations and are in addition to the 322,000 people directly employed by
the automakers and the 521,000 people employed in Tier 1 parts manufacturers, aftermarket
firms, and export parts suppliers.
The bulk of employment in the intermediate category is in the non‐manufacturing sector,
totaling nearly 1,500,000 jobs. Industries within this category are not normally thought to be
associated with automobile manufacturing in such high numbers. However, as a result of the
separation of the complete vehicle design and parts manufacturing processes (from the
Economic Impact Intermediate Spin‐off
Manufacturing 597,000 150,600
Durable Goods Manufacturing 492,000 83,200
Non‐durable Goods Manufacturing 105,000 67,400
Non‐Manufacturing 1,472,300 2,537,100
Administration and Services 345,000 97,000
Finance and Insurance 118,300 254,300
Management of Companies 45,000 93,000
Professional and Technical Services 237,300 160,400
Retail Trade 77,000 369,000
Transportation and Warehousing 51,700 162,200
Wholesale Trade 238,000 106,500
Other Services 286,000 919,700
Other Non‐Manufacturing 74,000 375,000
Total 2,069,300 2,687,700
©Center for Automotive Research 2015 33
automobile manufacturing company to the supplier sector), many more distinct industries have
become major suppliers to the automobile industry. Industries of note in the non‐
manufacturing category are professional and technical services employing 237,300,
administration and services, 345,000 jobs, wholesale trade, 238,000 jobs, and finance and
insurance, 118,300 jobs.
Table 2.2 also shows there are 2,687,700 total spin‐off jobs associated with motor vehicle and
parts manufacturing operations. These are expenditure‐induced jobs, created as a result of
spending by the people employed in the direct and intermediate categories. As could be
expected, a large portion of the spin‐off jobs are in the non‐manufacturing sector of retail
trade, which employs 369,000 people. When employees use their paychecks to purchase goods
(for example: electronics equipment, clothing, food, and even new automobiles), employment
is created to supply their demands.
Automobile Dealerships
Auto assembly operations and motor vehicle parts manufacturing operations are business
operations often clustered together within certain areas in manufacturing‐oriented regions of
the country. Auto dealerships, on the other hand, are found in nearly every community across
the country–in rural and urban areas alike. Just as the manufacturing segment of the motor
vehicle industry has suffered in the recent economic downturn, the retail and service segment
of the industry has also incurred heavy losses. If the amount of column space in news media is
considered a measure of issues of importance, the economic and cultural effect of the
downturn on auto dealerships did not go unnoticed anywhere. The omnipresence of auto
dealerships in communities across the U.S. allow for a deep connection between their business
operations and civic events. “If there were a competitive event to measure the philanthropy of
businesses in America, the local car dealer would always take the top prize. If you go to a Little
League or youth hockey game or any other locally organized sporting event, the sponsors
always seem to be local auto dealers.”58
Employment and income estimates are derived from analyses using the REMI model mentioned
earlier. The employment and compensation data used to perform the research was provided by
the National Automobile Dealers Association (NADA); the intermediate and spin‐off effects
were generated by the model. The remaining data on the U.S. economy and the automotive
industry was collected by CAR from a wide variety of publicly available sources, which are listed
in the references.
While total employment at U.S. auto dealerships is slightly over one million people, the direct
employment and resulting downstream jobs estimates are for new vehicle sales and service
58 Crain, Keith. (2009). “Closing Dealerships? Be Careful”. Automotive News. September 7, 2009.
<http://www.autonews.com/article/20090907/RETAIL/309079865/closing‐dealerships?‐be‐careful>.
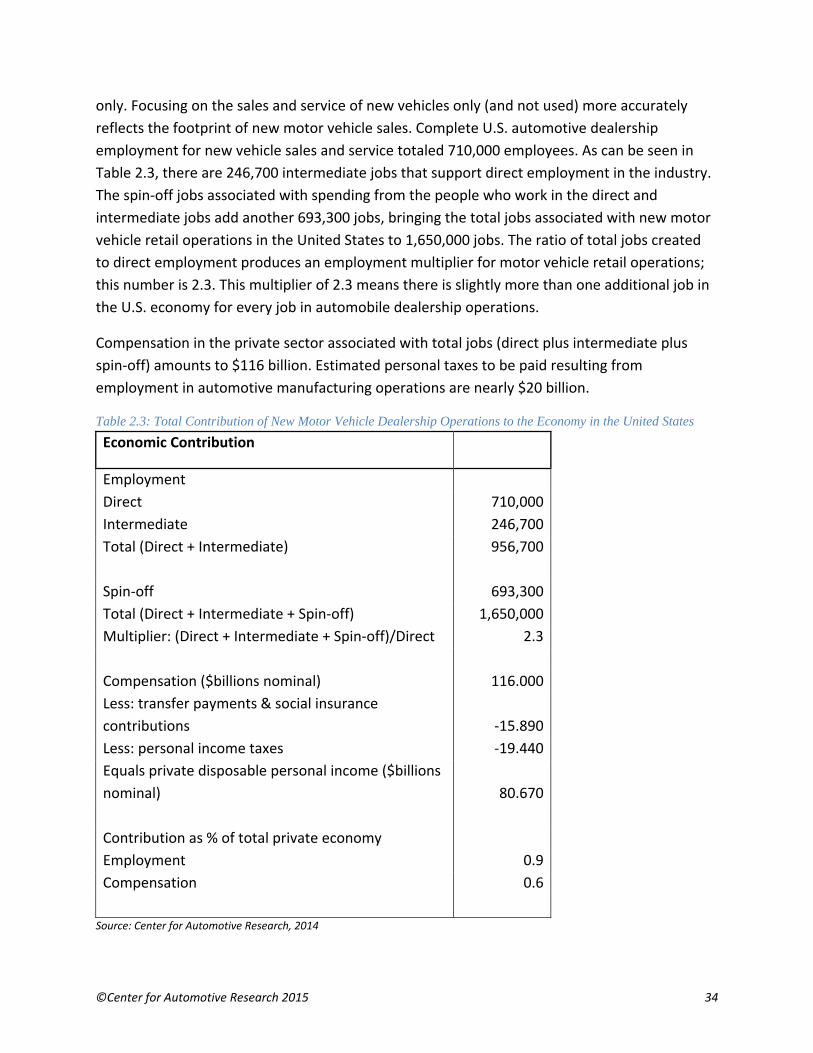
©Center for Automotive Research 2015 34
only. Focusing on the sales and service of new vehicles only (and not used) more accurately
reflects the footprint of new motor vehicle sales. Complete U.S. automotive dealership
employment for new vehicle sales and service totaled 710,000 employees. As can be seen in
Table 2.3, there are 246,700 intermediate jobs that support direct employment in the industry.
The spin‐off jobs associated with spending from the people who work in the direct and
intermediate jobs add another 693,300 jobs, bringing the total jobs associated with new motor
vehicle retail operations in the United States to 1,650,000 jobs. The ratio of total jobs created
to direct employment produces an employment multiplier for motor vehicle retail operations;
this number is 2.3. This multiplier of 2.3 means there is slightly more than one additional job in
the U.S. economy for every job in automobile dealership operations.
Compensation in the private sector associated with total jobs (direct plus intermediate plus
spin‐off) amounts to $116 billion. Estimated personal taxes to be paid resulting from
employment in automotive manufacturing operations are nearly $20 billion.
Table 2.3: Total Contribution of New Motor Vehicle Dealership Operations to the Economy in the United States
Economic Contribution
Employment
Direct 710,000
Intermediate 246,700
Total (Direct + Intermediate) 956,700
Spin‐off 693,300
Total (Direct + Intermediate + Spin‐off) 1,650,000
Multiplier: (Direct + Intermediate + Spin‐off)/Direct 2.3
Compensation ($billions nominal) 116.000
Less: transfer payments & social insurance
contributions ‐15.890
Less: personal income taxes ‐19.440
Equals private disposable personal income ($billions
nominal) 80.670
Contribution as % of total private economy
Employment 0.9
Compensation 0.6
Source: Center for Automotive Research, 2014

©Center for Automotive Research 2015 35
The direct, intermediate, and spin‐off jobs associated with U.S. auto dealerships account for
nearly one percent of employment in the entire U.S. economy and nearly one percent of total
U.S. compensation. Table 2.4 provides a more detailed look at the intermediate and spin‐off
employment associated with dealership operations. In the intermediate employment category,
there are 246,700 jobs spread across numerous industries.
Table 2.4: Intermediate and Spin-off Employment Contribution of New Motor Vehicle Dealership Operations in the U.S.
Source: Center for Automotive Research, 2014
The multiplier effect for new vehicle dealers is much lower than the multiplier associated with
manufacturing activities because 90 percent of the industries that comprise the supplier
network for vehicle dealers are non‐manufacturing industries. In general, manufacturing
industries demand the most from underlying intermediate and supplying industries, as
Economic Impact Intermediate Spin‐Off Total
Office Administrative & Business Support Services 41,544 9,028 50,572
Facilities Support Services 18,351 4,997 23,348
Professional & Tech Services 42,710 45,227 87,937
Accounting, Tax Preparation, Bookkeeping, and Payroll Services 6,387 3,374 9,761
Advertising and Related Services 4,320 2,468 6,788
Architectural, Engineering, and Related Services 6,612 3,954 10,566
Computer Systems Design and Related Services 3,285 4,954 8,239
Legal Services 4,804 3,671 8,475
Management of Companies and Enterprises 3,282 3,335 6,617
Management, Scientific, and Technical Consulting Services 8,122 16,141 24,263
Scientific research and development services 4,542 6,128 10,670
Specialized design services 1,356 1,202 2,559
Finance, Insurance 35,791 55,120 90,911
Manufacturing 12,224 40,936 53,160
Metals, Machinery and Fabricated Metal Prod 3,373 6,995 10,368
Motor Vehicles and Related Equip 1,070 5,571 6,641
All Other Durable Goods 2,711 12,813 15,524
Consumer Non‐durable Goods 5,070 15,557 20,627
Retail Trade 10,147 184,488 194,634
Transportation & Warehousing 8,838 27,713 36,550
Truck Transportation 2,650 10,575 13,226
Warehousing and Storage 1,582 8,753 10,336
All Other Transportation & Warehousing 4,605 8,384 12,989
Information: Publishing, Broadcasting, Internet 6,360 13,141 19,501
Accommodations & Food Services 16,062 43,976 60,038
Wholesale Trade 15,178 12,613 27,791
All Other Services, including Health Care and Education 28,872 149,159 178,031
Construction and Utilities 9,182 96,991 106,173
Forestry, Fishing and Mining 1,441 9,912 11,353

©Center for Automotive Research 2015 36
manufactured goods reach deep into the supply chain ─ all the way to the origin and sourcing of
raw materials.

©Center fo
SECTION II
STATE ECO
The moto
nation. Th
supplier n
nearly eve
employm
Even for t
by the ind
proximity
additiona
spending
The autom
manufact
can be see
intermedi
state labo
Figure 3.1
Note: IncludSource: Cen
or Automotive
II ‐ ESTIMATES
ONOMIES
or vehicle indu
he industry in
network sprea
ery communi
ent and incom
those states w
dustry is signi
y to manufact
l employmen
of direct and
motive indust
uring plants w
en in Figure 3
iate jobs from
or force.
: Automotive I
des direct and inter for Automot
Research 2015
S OF THE ECONO
ustry’s breadt
nfluences an u
ads across ma
ty in the coun
me contributi
with relatively
ficant. In man
uring or tech
nt contributio
intermediate
try is a matur
well establish
3.1, which sho
m automakers
Industry Emplo
termediate jobs,tive Research, 20
5
OMIC CONTRIB
th and depth
unusually larg
any states. Be
ntry. The tabl
ions of the in
y few direct jo
ny states, larg
nical facilities
n from substa
e employees
e industry, w
hed from the
ows the top s
s, parts suppl
oyment as Perc
, but does not in014
BUTION OF THE
of operation
ge number of
eyond that, m
les and figure
dustry to ind
obs in the ind
ge numbers o
s located in n
antial numbe
of the indust
with a large ag
upper Midwe
states for auto
iers, and mot
cent of State La
nclude expenditu
E MOTOR VEH
s extends int
f individual co
motor vehicle
es in this secti
ividual state
dustry, the tot
of jobs are ge
eighboring st
ers of spin‐off
ry.
gglomeration
est to the Gul
omotive emp
tor vehicle de
abor Force
ure induced (spin
HICLE INDUSTRY
o every state
ommunities b
dealerships h
ion examine t
economies.
tal number o
nerated due t
tates. All stat
f jobs resultin
of assembly
lf of Mexico. T
ployment (dire
ealerships), as
n‐off) jobs.
Y TO INDIVIDUA
e economy in
because the
have a presen
the estimated
of jobs suppor
to the state’s
es see major
ng from the
and parts
This concentr
ect and
s a percentag
37
AL
the
nce in
d
rted
s
ration
ge of

©Center fo
In terms o
intermedi
motor veh
expenditu
of jobs to
the map (
Figure 3.2
Note: Includ
Source: Cen
The autom
investmen
nearby sta
Employm
from, any
or Automotive
of sheer num
iate employm
hicle dealersh
ure‐induced (
every state i
(the under 20
: Automotive I
des direct and in
ter for Automot
motive indust
nt in that stat
ates as well. A
ent multiplie
y one state’s e
Research 2015
ber of jobs su
ment contribu
hips, and the
spin‐off) emp
n the nation.
0,000 jobs cat
Industry Emplo
termediate jobs,
tive Research, 20
try employme
te, but is also
As a result, em
rs apply to th
economy.
5
upported by t
ution in the in
suppliers to t
ployment. As
Even among
tegory), the av
oyment by State
, but does not in
014
ent contribut
supported b
mployment m
he national ec
the industry, F
ndustry for mo
these operati
can be seen,
the states in
verage numb
e
nclude expenditu
ion in one sta
y automotive
multipliers are
conomy and a
Figure 3.2 be
otor vehicle a
ons. This map
the industry
the lowest e
ber of support
ure induced (spin
ate is not attr
e industry inv
e not calculat
are not applic
low displays
assemblers, p
p does not in
provides sign
employment c
ted jobs is we
n‐off) jobs.
ributable only
vestments and
ted for individ
cable to, nor c
the direct an
parts supplier
clude
nificant numb
classification
ell over 7,000
y to the
d activities in
dual states.
can be derive
38
d
s,
bers
in
0.
ed

©Center for Automotive Research 2015 39
Table 3.1: Automotive Industry Employment Contribution by State
State
Total Industry Employment Contribution
State Labor Force
Auto Contribution as % of Labor Force
Alabama 165,470 2,118,000 7.8%Alaska 4,790 366,700 1.3%Arizona 68,210 3,049,900 2.2%Arkansas 62,110 1,307,400 4.8%California 381,830 18,757,100 2.0%Colorado 69,060 2,805,100 2.5%Connecticut 63,740 1,886,300 3.4%Delaware 28,220 454,500 6.2%D.C. 10,540 378,800 2.8%Florida 242,335 9,659,600 2.5%Georgia 206,810 4,762,700 4.3%Hawaii 5,270 667,800 0.8%Idaho 24,210 774,400 3.1%Illinois 413,900 6,531,100 6.3%Indiana 420,570 3,245,900 13.0%Iowa 79,000 1,711,600 4.6%Kansas 59,460 1,495,500 4.0%Kentucky 205,800 1,996,800 10.3%Louisiana 84,230 2,165,300 3.9%Maine 19,215 703,800 2.7%Maryland 82,640 3,100,400 2.7%Massachusetts 94,270 3,545,800 2.7%Michigan 943,620 4,737,600 19.9%Minnesota 110,380 2,988,200 3.7%Mississippi 73,820 1,250,100 5.9%Missouri 167,060 3,057,700 5.5%Montana 9,110 520,200 1.8%Nebraska 45,720 1,021,400 4.5%Nevada 24,680 1,368,400 1.8%New Hampshire 13,990 739,800 1.9%New Jersey 137,680 4,528,800 3.0%New Mexico 17,040 922,300 1.8%New York 288,380 9,539,700 3.0%North Carolina 197,465 4,646,400 4.2%North Dakota 31,045 415,500 7.5%Ohio 629,180 5,737,600 11.0%Oklahoma 69,400 1,790,200 3.9%Oregon 46,600 1,957,500 2.4%Pennsylvania 256,360 6,363,500 4.0%Rhode Island 4,760 555,400 0.9%South Carolina 138,800 2,192,200 6.3%South Dakota 30,840 451,400 6.8%Tennessee 268,870 3,001,500 9.0%Texas 460,650 13,039,200 3.5%Utah 45,495 1,436,300 3.2%Vermont 8,645 351,000 2.5%Virginia 152,760 4,263,000 3.6%Washington 60,530 3,488,500 1.7%West Virginia 39,160 796,800 4.9%Wisconsin 182,170 3,098,700 5.9%Wyoming 4,110 311,300 1.3%U.S. Total 7,250,000 156,054,700 4.6%
Source: Center for Automotive Research, 2014

©Center for Automotive Research 2015 40
Table 3.2: All Jobs for Automakers by State (Direct, Intermediate, and Spin-off)
All Jobs for Motor Vehicle Manufacturers (Automakers)
State Direct Intermediate
Expenditure‐Induced
TOTAL
Alabama 12,000 22,700 32,000 66,700Alaska 10 50 100 160Arizona 800 3,500 7,000 11,300Arkansas 300 5,000 7,000 12,300California 13,000 38,000 50,000 101,000Colorado 600 3,000 9,000 12,600Connecticut 200 1,000 6,040 7,240Delaware 200 1,000 8,000 9,200D.C. 100 1,000 3,500 4,600Florida 1,100 10,000 32,000 43,100Georgia 5,800 29,000 45,000 79,800Hawaii 10 100 300 410Idaho 10 200 500 710Illinois 12,500 53,100 94,000 159,600Indiana 25,500 48,000 73,900 147,400Iowa 100 2,000 9,100 11,200Kansas 1,200 2,000 19,060 22,260Kentucky 18,500 20,000 25,000 63,500Louisiana 50 5,000 11,000 16,050Maine 10 250 500 760Maryland 500 5,800 12,700 19,000Massachusetts 200 8,200 16,300 24,700Michigan 124,500 202,000 244,000 570,500Minnesota 200 8,000 18,000 26,200Mississippi 8,000 8,000 9,000 25,000Missouri 10,800 16,000 34,800 61,600Montana 10 100 400 510Nebraska 200 3,000 7,700 10,900Nevada 100 2,600 4,600 7,300New Hampshire 40 900 2,000 2,940New Jersey 3,500 9,000 31,000 43,500New Mexico 10 300 700 1,010New York 5,700 27,400 35,000 68,100North Carolina 1,000 16,000 25,000 42,000North Dakota 10 300 3,700 4,010Ohio 34,500 100,000 152,400 286,900Oklahoma 50 3,500 7,000 10,550Oregon 300 2,200 4,000 6,500Pennsylvania 600 17,000 25,000 42,600Rhode Island 10 100 400 510South Carolina 7,400 10,050 12,000 29,450South Dakota 10 200 6,000 6,210Tennessee 17,500 27,900 55,000 100,400Texas 11,500 58,550 85,000 155,050Utah 50 2,200 5,000 7,250Vermont 10 100 200 310Virginia 700 7,000 22,400 30,100Washington 200 1,300 4,000 5,500West Virginia 1,300 7,300 9,000 17,600Wisconsin 1,100 15,000 50,500 66,600Wyoming 10 100 200 310
U.S. Total 322,000 805,000 1,316,000 2,443,000
Source: Center for Automotive Research, 2014

©Center for Automotive Research 2015 41
Table 3.3: All Jobs for Motor Vehicle Dealers by State (Direct, Intermediate, and Spin-off)
All Jobs for Motor Vehicle Dealers
State Direct Intermediate
Expenditure‐Induced
TOTAL
Alabama 9,900 2,900 11,000 23,800 Alaska 1,700 500 1,600 3,800 Arizona 16,900 6,000 15,100 38,000 Arkansas 5,900 1,600 6,700 14,200 California 77,500 33,200 65,800 176,500 Colorado 11,800 4,800 12,700 29,300 Connecticut 9,300 2,600 8,200 20,100 Delaware 20 10 50 80 D.C. 1,900 500 1,800 4,200 Florida 47,200 17,400 41,300 105,900 Georgia 20,800 7,500 22,000 50,300 Hawaii 1,600 400 1,600 3,600 Idaho 2,800 800 2,700 6,300 Illinois 28,200 11,300 28,500 68,000 Indiana 14,100 4,500 15,800 34,400 Iowa 8,300 2,100 8,500 18,900 Kansas 6,900 1,900 7,200 16,000 Kentucky 8,200 2,300 9,700 20,200 Louisiana 10,700 3,500 12,400 26,600 Maine 6,200 1,700 5,900 13,800 Maryland 15,200 3,900 13,900 33,000 Massachusetts 15,000 5,300 13,300 33,600 Michigan 23,300 8,500 22,500 54,300 Minnesota 12,900 4,800 12,100 29,800 Mississippi 5,200 1,300 6,700 13,200 Missouri 14,400 4,500 14,600 33,500 Montana 2,400 700 2,300 5,400 Nebraska 4,900 1,400 5,100 11,400 Nevada 3,400 900 3,200 7,500 New Hampshire 2,900 800 2,800 6,500 New Jersey 20,600 5,900 20,300 46,800 New Mexico 5,700 1,600 5,400 12,700 New York 32,600 13,900 34,800 81,300 North Carolina 21,500 6,700 21,300 49,500 North Dakota 5,700 1,600 5,400 12,700 Ohio 27,700 9,400 26,800 63,900 Oklahoma 11,200 3,000 10,000 24,200 Oregon 8,400 2,900 7,700 19,000 Pennsylvania 31,200 9,100 28,600 68,900 Rhode Island 1,100 300 1,000 2,400 South Carolina 10,100 2,800 11,400 24,300 South Dakota 2,200 600 2,100 4,900 Tennessee 13,600 4,600 17,300 35,500 Texas 64,300 27,600 65,700 157,600 Utah 5,900 2,600 7,300 15,800 Vermont 3,400 900 3,200 7,500 Virginia 19,600 5,300 18,300 43,200 Washington 14,500 4,700 11,800 31,000 West Virginia 4,100 700 4,100 8,900 Wisconsin 15,700 4,500 14,400 34,600 Wyoming 1,400 400 1,300 3,100
U.S. Total 710,000 246,700 693,300 1,650,000
Source: Center for Automotive Research, 2014

©Center for Automotive Research 2015 42

©Center for Automotive Research 2015 43
SECTION IV ‐ METHODOLOGY OVERVIEW
The estimates in this report of the intermediate and induced employment associated with
direct employment with vehicle assemblers (automakers) and dealerships are produced using a
dynamic, inter‐industry model developed by Regional Economic Models, Inc. (REMI). A total
footprint of the industry, including all vehicle and component manufacturing, as well as new
vehicle dealership employment, was also calculated to arrive at the total industry employment
contribution of 7.25 million jobs. The REMI model is designed for industry‐ and region‐specific
contribution analysis. The major interactions between primary data input and model structure
are described below.
The Macroeconomic Model
To estimate the total employment and compensation provided by parts suppliers, motor
vehicle assemblers and new vehicle dealership operations, the research team at CAR used a 51‐
region, 169 industry sector model developed by REMI to capture effects in all fifty U.S. state
economies, the District of Columbia and the U.S. national economy. The model provides a
baseline forecast of regional and national economies. Various economic scenarios are then
input into the model and simulations based on the new data are calculated by the model
Changes from the baseline are measured using results from these simulations. Underlying
demographic and industry‐specific information for every region are contained in the baseline
forecast.
Trade flows, migration patterns and commuter flows connect each state economy, allowing for
dynamic multi‐regional analysis. Simulation results can be interpreted as the new economic
equilibrium (given a change to the baseline) and are the product of multiple structural equation
iterations across the state economies. A simulation begins with the user inputting a direct
change to the baseline economy. Once this change is entered into the model, new vectors of
transactions between businesses are calculated along with consumer purchases of goods and
services. These vectors may change as estimated household income increases or decreases
under the new scenario being modeled. The model reports the economic changes from the
baseline in a number of variables, with the most easily understood being employment.
The dynamic multi‐regional character of the REMI model is a defining element not found in
other commercial contribution analysis models and enables CAR to produce the results
contained in this study. In essence, the model can simulate economic contributions that may
occur in any one state resulting from changing the levels of employment in any or all of the
other states.

©Center for Automotive Research 2015 44
Methods & Assumptions
The general analytical method is to run independent simulations for motor vehicle assemblers,
all vehicle and component manufacturing, and new vehicle dealership operations by
subtracting the employment of each group from the baseline regional economies at the state
level. This counter‐factual technique allows for the separation of economic activity ─ influenced
by the operations of assemblers, all vehicle and components manufacturing and dealers ─ from
the aggregate economy, and permits the capture of economic contributions from continued
employment in the sectors of interest for any given time period. In general, the difference
between the baseline forecast and the simulation represents the economic contribution of
assemblers, dealers and the total footprint of the industry.
This study should not be interpreted as representing the economic activity that would be lost if
the automotive industry did not operate in the United States. That scenario would generate
significant compensating adjustments (over time) in the economy and is not examined in this
study. CAR’s purpose is to dissect and present the industry’s current presence in the domestic
economy. This study represents a snapshot of the automotive industry’s total employment
contribution on the nation’s economy.
Consideration was paid to the potential of double‐counting activities between supplier,
dealership and assembler runs. Within the framework of the REMI model, there is an inter‐
industry, input‐output (I‐O) table that calculates demand for intermediate inputs used in the
production of a finished good. A more rigorous effort to avoid double‐counting was applied to
this study versus the 2010 study. In this study, all automaker employees who manufacture parts
were not included as direct employees in the assembler simulation. Next, common to both
studies, the automaker simulation model was run first, then the calculated demand for parts
suppliers associated with automakers were discounted (these are the suppliers who will be
included as direct employees of parts manufacturers in the second run). With both types of
parts makers (those employed by automakers and those employed by Tier 1 parts suppliers)
removed from the assemblers simulation, the CAR research team was able to adjust for
systemic double counts and calculate only the net employment effects for the assembler
simulation runs.
As a consequence of this up‐front effort to avoid double counting between segments of the
industry (automakers, parts suppliers and dealerships), the results for each of these segments
can be added together to arrive at the total economic contribution of the industry. These
results fairly represent the size of the industry and its contribution to the U.S. and individual
state economies. All simulation results are relevant to the economic conditions of calendar year
2014.
©Center for Automotive Research 2015 45
BIBLIOGRAPHY
References AAIA. (2013). “Digital Automotive Aftermarket Factbook: 22nd Edition, 2013.” Automotive
Aftermarket Industry Association. 2013.
Automotive News. (2014). Automotive News Data Center. Accessed October 15, 2014.
<http://www.autonews.com/section/datacenter>.
Automotive News. (2014). “U.S. Car and Light‐truck Sales by Make – Dec. 2014 (Ranked by
Total Sales).” Automotive News Data Center. January 5, 2015.
<http://www.autonews.com/section/datacenter>.
BCI. (2014). Battery Council International. Website. Chicago, Illinois. Accessed October 15,
2014. <http://www.batterycouncil.org>.
BEA. (2014). Bureau of Economic Analysis, U.S. Department of Commerce. Website.
Accessed October 24, 2014. <http://bea.gov/>.
BEA. (2015). “Foreign Direct Investment in the United States: Selected Items by Detailed
Industry of U.S. Affiliate, 2008–2013.” Bureau of Economic Analysis, U.S. Department of
Commerce. Accessed January 16, 2015. <http://www.bea.gov/international/xls/fdius‐
current/FDIUS%20Detailed%20Industry%202008‐2013.xlsx>.
BLS. (2014). Bureau of Labor Statistics, U.S. Department of Labor. Website. Accessed
October 24, 2014. <http://www.bls.gov/>.
BLS. (2014). “Employment, Hours, and Earnings from the Current Employment Statistics
survey (National).” Bureau of Labor Statistics. Accessed November 3, 2014.
<http://www.bls.gov/ces/data.htm>.
Brugeman, Valerie Sathe, Kim Hill, and Joshua Cregger. (2011). “Repurposing Former
Automotive Manufacturing Sites: A report on closed auto manufacturing facilities in the
United States, and what communities have done to repurpose the sites.” Center for
Automotive Research. Prepared for the Office of Recovery for Auto Communities and
Workers, U.S. Department of Labor. November 2011.
<http://www.cargroup.org/?module=Publications&event=View&pubID=2>.
BTS. (2013). “Table 1 ‐ Shipment Characteristics by Mode of Transportation for the United
States: 2012.” Commodity Flow Survey. Bureau of Transportation Statistics, Research and
Innovative Technology Administration. December 2013.

©Center for Automotive Research 2015 46
<http://www.rita.dot.gov/bts/sites/rita.dot.gov.bts/files/publications/commodity_flow_
survey/2012/united_states/table1.html>.
BTS. (2014). “Table 1‐50 ‐ U.S. Ton‐Miles of Freight (BTS Special Tabulation).” National
Transportation Statistics. Bureau of Transportation Statistics, Research and Innovative
Technology Administration. July 2014.
<http://www.rita.dot.gov/bts/sites/rita.dot.gov.bts/files/publications/national_transport
ation_statistics/index.html>.
CAR. (2015). “Book of Deals.” Center for Automotive Research. Ann Arbor, Michigan.
Accessed January 8, 2015.
CBO. (2014). “The Renewable Fuel Standard: Issues for 2014 and Beyond” Congressional
Budget Office. June 2014. <http://www.cbo.gov/sites/default/files/45477‐Biofuels2.pdf>.
Census. (2013). “State Government Tax Collections: 2013.” United States Census Bureau,
U.S. Department of Commerce. March 2013.
<http://factfinder2.census.gov/faces/tableservices/jsf/pages/productview.xhtml?pid=ST
C_2013_STC003&prodType=table>.
Census. (2014). “County Business Patterns.” United States Census Bureau, U.S. Department
of Commerce. Accessed October 13, 2014. <http://www.census.gov>.
Crain, Keith. (2009). “Closing Dealerships? Be Careful”. Automotive News. September 7,
2009. <http://www.autonews.com/article/20090907/RETAIL/309079865/closing‐
dealerships?‐be‐careful>.
CSG. (2014). “’Made in the USA’ Reshoring Brings Manufacturing Back.” Capitol Ideas:
Council of State Governments – Insights & Innovations. March/April 2014.
<http://www.csg.org/pubs/capitolideas/2014_mar_apr/2014_mar_apr_images/CIMarAp
r14.pdf>.
Datamonitor. (2014). “Medium & Heavy Trucks: North America (NAFTA) Industry Guide.”
Industry Profile. May 16, 2014.
<http://www.datamonitor.com/store/Product/medium_heavy_trucks_north_america_n
afta_industry_guide?productid=ML00016‐112>.
DOE. (2014). “Vehicle Weight Classes & Categories.” U.S. Department of Energy. Accessed
November 3, 2014. <http://www.afdc.energy.gov/data/widgets/10380>.
Economist. (2013). “Reshoring Manufacturing – Coming Home.” Special report: Outsourcing
and offshoring. The Economist. January 18, 2013.

©Center for Automotive Research 2015 47
<http://www.economist.com/news/special‐report/21569570‐growing‐number‐
american‐companies‐are‐moving‐their‐manufacturing‐back‐united>.
ELM. (2014). “Automotive Industry Data and Supply Chain Database.” ELM Analytics. Last
accessed October 2014. <http://www.elmanalytics.com/>.
FactCheck.org. (2010). “What’s a ‘Small Business’?” FactCheck.org, Annenberg Public Policy
Center. <http://www.factcheck.org/2010/08/whats‐a‐small‐business/>.
FRED. (2014). “Federal Reserve Economic Data.” Economic Research, Federal Reserve Bank
of St. Louis. Accessed June 6, 2014. <http://research.stlouisfed.org/>.
Hill, Kim, Debra Maranger Menk, and Adam Cooper. (2010). “Contribution of the
Automotive Industry to the Economies of all Fifty State and the United States.” Center for
Automotive Research. Prepared for the Alliance of Automobile Manufacturers, the
Association of International Automobile Manufacturers, the Motor and Equipment
Manufacturers Association, the National Automobile Dealers Association, and the
American International Automobile Dealers Association. April 2010.
<http://www.cargroup.org/?module=Publications&event=View&pubID=16>.
Hill, Kim, Debra Maranger Menk, and Joshua Cregger. (2015). “Assessment of Tax Revenue
Generated by the Automotive Sector for the Year 2013.” Center for Automotive
Research. January 2015. <http://www.cargroup.org>.
Hill, Kim, Debra Maranger Menk, Bernard Swiecki, and Joshua Cregger. (2014). “Just How
High‐Tech is the Automotive Industry?” Center for Automotive Research. Page 9. January
8, 2014. <http://www.cargroup.org/?module=Publications&event=View&pubID=103>.
INEGI. (2014). Instituto Nacional de Estadistica y Geografia (Mexican National Institute of
Statistics and Geography), Government of Mexico. Accessed October 2014.
<http://www.inegi.org.mx/>.
KYEDC. (2014). Kentucky Cabinet for Economic Development. Website. Accessed January 8,
2015. <http://www.thinkkentucky.com/>.
MarkLines. (2013) “MarkLines Automotive Industry Portal.” MarkLines Co., Ltd. Last
Accessed May 2013. <http://www.marklines.com/en/>.
NADA. (2006). “NADA Data 2006: Economic Impact of America’s New‐Car and New‐Truck
Dealers.” NADA Data. National Automobile Dealers Association. May 17, 2006.
<https://www.nada.org/NR/rdonlyres/538D2699‐BF00‐4C73‐A162‐
7A4FBBAC62E0/0/NADA_Data_2006pdf.pdf>.
©Center for Automotive Research 2015 48
NADA. (2013). NADA Data 2013: State‐of‐the‐Industry Report.” NADA Data. National
Automobile Dealers Association. July 1, 2013.
<http://www.nada.org/NR/rdonlyres/1B512AC7‐DCFC‐472C‐A854‐
6F5527931A2F/0/2013_NADA_Data_102113.pdf>.
NADA. (2014). “NADA Data 2014: Annual Financial Profile of America’s Franchised New‐Car
Dealerships.” NADA Data. National Automobile Dealers Association. May 28, 2014.
<http://www.nada.org/NR/rdonlyres/DF6547D8‐C037‐4D2E‐BD77‐
A730EBC830EB/0/NADA_Data_2014_05282014.pdf>.
NBSA. (2014). National Small Business Association. Website. Accessed December 29, 2014.
<http://www.nsba.net/>.
NHTSA. (2012). “Corporate Average Fuel Economy for MY 2017‐MY 2025 Passenger Cars and
Light Trucks.” National Highway Transportation Safety Administration, U.S. Department
of Transportation. Pages 435‐436. August 2012.
<http://www.nhtsa.gov/staticfiles/rulemaking/pdf/cafe/FRIA_2017‐2025.pdf>.
Northam, Jackie. (2014). “As Overseas Costs Rise, More U.S. Companies Are 'Reshoring'.”
National Public Radio. January 27, 2014.
<http://www.npr.org/blogs/parallels/2014/01/22/265080779/as‐overseas‐costs‐rise‐
more‐u‐s‐companies‐are‐reshoring>.
NSF. (2014). “Business R&D and Innovation Survey,” and “Survey of Industrial Research and
Development.” National Science Foundation. Multiple Years. Accessed December 8,
2014. <http://www.nsf.gov/>.
OESA. (2014). “Automotive Supplier Barometer.” Original Equipment Suppliers Association.
November 3‐5, 2014. <http://www.oesa.org/Knowledge‐Center/Automotive‐Supplier‐
Barometer/2014‐Supplier‐Barometers/2014‐November‐OESA‐Automotive‐Supplier‐
Barometer.pdf>.
RMA. (2014). Rubber Manufacturers Association. Website. Washington D.C. Accessed
October 15, 2014. <http://www.rma.org>.
Rubenstein, James M. (1992). “The Changing U.S. Auto Industry: A Geographical Analysis.”
Routledge, New York, New York. 1992.
SBA. (2014). “What is SBA's Definition of a Small Business Concern?” U.S. Small Business
Administration. Accessed December 29, 2014. <https://www.sba.gov/content/what‐
sbas‐definition‐small‐business‐concern>.

©Center for Automotive Research 2015 49
Statistics Canada. (2014). Statistics Canada, Government of Canada. Accessed October 2014.
<http://www.statcan.gc.ca/start‐debut‐eng.html>.
Wallace, Richard and Gary Silberg. (2012). “Self‐driving Cars: The Next Revolution.” Center
for Automotive Research and KPMG. August 2012.
<http://www.cargroup.org/?module=Publications&event=View&pubID=87>.
Ward's (2003‐2014). “U.S. Sales of Trucks by Manufacturer, Gross Vehicle Weight Rating,
and Source.” Ward's Motor Vehicle Facts & Figures. Multiple Years 2003‐2014. Ward’s
Automotive Group, Southfield, Michigan.
Ward’s. (2014). “Truck Registrations by State and Type.” Ward's Motor Vehicle Facts &
Figures 2014. Page 34. Ward’s Automotive Group, Southfield, Michigan.
Ward's (2014). “U.S. Sales of Trucks by Manufacturer, Gross Vehicle Weight Rating, and
Source.” Ward's Motor Vehicle Facts & Figures 2014. Page 22. Ward’s Automotive Group,
Southfield, Michigan.
Ward's (2014). “U.S. Truck Sales by Country of Origin.” Ward's Motor Vehicle Facts & Figures
2014. Page 23. Ward’s Automotive Group, Southfield, Michigan.
World Bank. (2014). “GDP Ranking.” The World Bank. Website. Accessed December 16,
2014. <data.worldbank.org>.
Selected CAR Publications Hill, Kim, Debra Maranger Menk, and Joshua Cregger. (2012). “Assessment of Tax Revenue
Generated by the Automotive Sector.” Center for Automotive Research. Prepared for the
Alliance of Automobile Manufacturers. April 2012.
<http://www.cargroup.org/?module=Publications&event=View&pubID=38>.
McAlinden, Sean P., Kim Hill, David Cole, and Debra Maranger Menk. (2009). “Contribution
of Honda to the Economies of Seven States and the United States.” Center for
Automotive Research. Prepared for American Honda Motor Co., Inc. January 2009.
McAlinden, Sean P., Kristen Dziczek, and Debra Maranger Menk. (2008). “CAR Research
Memorandum: The Impact on the U.S. Economy of a Major Contraction of the Detroit
Three Automakers.” Center for Automotive Research. November 4, 2008.
Hill, Kim and Debra Maranger Menk. (2008). “Contribution of a Vehicle Infrastructure
System to the Economy of Michigan: Economic and Industrial Impacts Update and
Benefit‐Cost Analysis.” Center for Automotive Research. Prepared for Michigan
Department of Transportation. June 2008.

©Center for Automotive Research 2015 50
McAlinden, Sean P. and Debra Maranger Menk. (2008). “Country of Origin: Is this Vehicle
Domestic or Import? The U.S. Domestic Content Measurement Programs, 2008.” Center
for Automotive Research. Prepared for Toyota Motor North America, Inc. April 2008.
Hill, Kim. (2007). “How Automakers Plan Their Products: A Primer for Policymakers on
Automotive Industry Business Planning.” Center for Automotive Research. Prepared for
the Environmental Defense Fund. July 2007.
Hill, Kim and Debra Maranger Menk. (2007). “Contribution of Toyota Motor North America
to the Economies of Sixteen States and the United States, 2006.” Center for Automotive
Research. Prepared for Toyota Motor North America. October, 2007.
Hill, Kim and Debra Maranger Menk. (2007). “Contribution of the Motor Vehicle Supplier
Sector to the Economies of the United States and Its 50 States.” Center for Automotive
Research. Prepared for the Motor and Equipment Manufacturers Association. January
2007.
Hill, Kim. (2007). “Evaluation of Economic Impacts of the State of Michigan’s Vehicle
Infrastructure Integration Program.” Center for Automotive Research. Prepared for
Michigan Department of Transportation. September 2007.
Hill, Kim. (2007). “Contribution of Toyota Motor North America to the Economies of Sixteen
States and the United States in 2006.” Center for Automotive Research. Prepared for
Toyota Motor North America, Inc. October 2007.
McAlinden, Sean P., et al. (2003). “Economic Contribution of the Automotive Industry to the
U.S. Economy – An Update.” Center for Automotive Research. Prepared for the Alliance
of Automobile Manufacturers, Fall 2003.
Hill, Kim. (2002). “Michigan Automotive Research & Development Directory, 1st Edition.”
Center for Automotive Research. Prepared for the Michigan Economic Development
Corporation. October 2002.
CAR. (2001). “Contribution of the Automotive Industry to the U.S. Economy in 1998: The
Nation and Its Fifty States.” Institute of Labor and Industrial Relations and the Office for
the Study of Automotive Transportation, University of Michigan and the Center for
Automotive Research. Prepared for the Alliance of Automobile Manufacturers, Inc. and
the Association of International Automobile Manufacturers, Inc. Winter 2001.
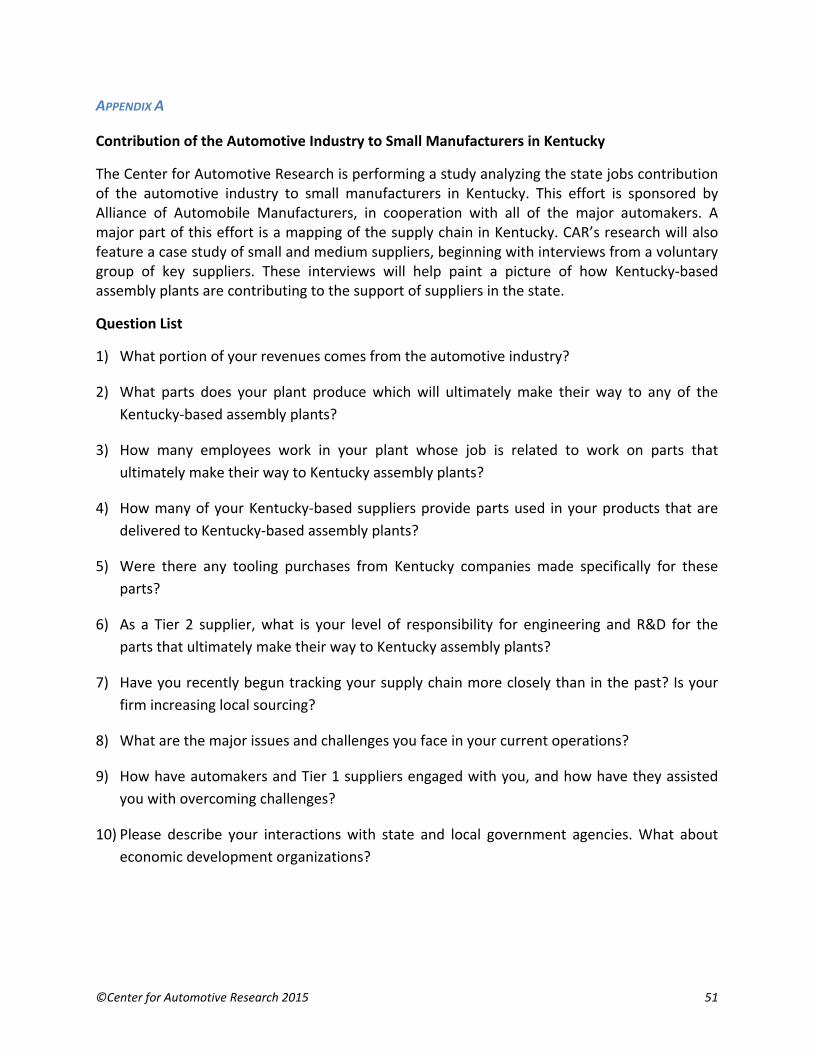
©Center for Automotive Research 2015 51
APPENDIX A
Contribution of the Automotive Industry to Small Manufacturers in Kentucky
The Center for Automotive Research is performing a study analyzing the state jobs contribution of the automotive industry to small manufacturers in Kentucky. This effort is sponsored by Alliance of Automobile Manufacturers, in cooperation with all of the major automakers. A major part of this effort is a mapping of the supply chain in Kentucky. CAR’s research will also feature a case study of small and medium suppliers, beginning with interviews from a voluntary group of key suppliers. These interviews will help paint a picture of how Kentucky‐based assembly plants are contributing to the support of suppliers in the state.
Question List
1) What portion of your revenues comes from the automotive industry?
2) What parts does your plant produce which will ultimately make their way to any of the
Kentucky‐based assembly plants?
3) How many employees work in your plant whose job is related to work on parts that
ultimately make their way to Kentucky assembly plants?
4) How many of your Kentucky‐based suppliers provide parts used in your products that are
delivered to Kentucky‐based assembly plants?
5) Were there any tooling purchases from Kentucky companies made specifically for these
parts?
6) As a Tier 2 supplier, what is your level of responsibility for engineering and R&D for the
parts that ultimately make their way to Kentucky assembly plants?
7) Have you recently begun tracking your supply chain more closely than in the past? Is your
firm increasing local sourcing?
8) What are the major issues and challenges you face in your current operations?
9) How have automakers and Tier 1 suppliers engaged with you, and how have they assisted
you with overcoming challenges?
10) Please describe your interactions with state and local government agencies. What about
economic development organizations?