contribution of self help groups in …ijaer.in/uploads/ijaer_02__101.pdf · this thesis studied...
TRANSCRIPT

International Journal of Agriculture and Environmental Research
ISSN: 2455-6939
Volume:02, Issue:05
www.ijaer.in Copyright © IJAER 2016, All right reserved Page 1438
CONTRIBUTION OF SELF HELP GROUPS IN ENHANCING THE SMALLHOLDER MAIZE FARMER’S INCOME IN
HUYE DISTRICT, RWANDA
1Norbert MUHATURUKUNDO, 2Jaya Shukla, 3Peter Mbabazi
1 Student, Jomo Kenyatta University of Agriculture and Technology, Kigali, Rwanda.
2,3 Lecturer, Jomo Kenyatta University of Agriculture and Technology, Kigali, Rwanda.
ABSTRACT
The purpose of this study is to investigate the contribution of Self help Groups in enhancing the smallholder farmers’ income in Huye District, Rwanda. In the study area there is a problem of low income from agriculture production due to bad agriculture practices, subsistence agriculture, and lack of off farming activities like saving and small plots of land for agriculture activities to farmers. This Thesis studied the socio-economic characteristics of the members of SHGs, the level of saving before and after joining the SHGs and examined the determinants of farm income among SHGs smallholder farmers. By the time this study was conducted, there were a total of 519 smallholder maize farmers (230 males and 289 females) members of SHGs which started their activities in 2012. Semi-structured questionnaires were administered to Seventy Five (75) randomly selected SHG members in order to collect quantitative and qualitative data. The primary data were collected from smallholder maize farmers and entered in Statistical Package for Social Science (SPSS) to be analyzed. Data collected from respondents were analyzed using models and descriptive statistics (percentages and frequencies). The means and standard deviations were used to analyze the difference of farmers on before and post SHGs in terms of production and saving.
Paired sample test were used to explore the significant difference between the Production and savings on basic needs of SHG members before and after joining the SHG. For this research, Multivariate Linear Regression Model were used to assess the most optimal combination of resource in farmers SHGs farms so as to improve even further farms’ production and to
maximize the farm income. The findings showed that most of the smallholder maize farmers’
members of SHGs are in their active and productive age when they can put in their best for optimum productivity, the production and savings increased after joining the SHGs when

International Journal of Agriculture and Environmental Research
ISSN: 2455-6939
Volume:02, Issue:05
www.ijaer.in Copyright © IJAER 2016, All right reserved Page 1439
compared to before. It was also found that the area of land, hired labor, fertilizers and seeds contribute most in maize production. The age of the household head, the household size, the farm size, the maize production quantity, the price and the cost were the major determinants of farm income. This study recommend that in order to increase the farm production and farm income, more effort should be put in grouping farmers into SHGs based on land proximity as this may facilitate their capacity building and land consolidation policy implementation.
Keywords: Farmers Self Help Group, Smallholder farmer’s Income
1. INTRODUCTION
Rwanda is a small, landlocked, resource-poor country with a population of more than 12 million (NISR, 2013). The population density has more than doubled since 1978 from 183 inhabitants per square kilometer (km2) to 415 inhabitants /km2 in 2012 (NISR, 2013). The annual demographic growth rate is 2.6 per cent and the population is expected to increase to about 14.6 million by 2025 (NISR, 2013). From a tragically low starting point in 1994 following the genocide against Tutsi, in two decades Rwanda has achieved impressive economic results. The gross domestic product (GDP) has rebounded with an average annual growth of 7 to 8 per cent in the past ten years while inflation has been reduced to single digits (NISR, 2013). This successful performance was driven by the stable macro-economic and market-oriented policies (IFAD, 2012).
According to MNAGRI (2010), Rwanda is a hilly country where most of the cultivation area is on hillside with an incline of more than 60% slope. The Rwandan agriculture sector employs 80 per cent of Rwandan population and contributes to 33% of GDP and 70% of export revenues (NISR, 2013). Maize is the main food crop, and also doubles as a cash crop (MINAGRI, 2008).
Smallholder agriculture is argued to remain important for economic development and poverty reduction in developing countries, but its development is challenged by the need for institutional innovations to overcome market failures (World Bank, 2008). There is a renewed interest from donors, governments and researchers in cooperative producer organizations as an institutional vehicle to improve smallholder agricultural performance, particularly through improved market participation (Barham, 1995).
In order to remain competitive, farmers need to engage in a process of ongoing adaptation, ensuring that their use of technologies and practices maximizes both efficiency and profitability, while at the same time ensuring long-term economic, social, and environmental sustainability (Robinson, 2003).

International Journal of Agriculture and Environmental Research
ISSN: 2455-6939
Volume:02, Issue:05
www.ijaer.in Copyright © IJAER 2016, All right reserved Page 1440
The debate on the role of agriculture in development was initiated by the classical theorists, led by Arthur Lewis (1954), who viewed economic development as a growth process of relocating productive factors away from agriculture towards a modern industrial sector (Byerlee, et al., 2009).
Following the Green Revolution in Asia, where the positive impact of agricultural growth on rural development was found to be the strongest in countries with agriculture sectors dominated by smallholder farmers, a renewed emphasis was placed on broad-based agricultural growth and productivity increases in rural economies (Diao, 2010). To date, the agriculture sector continues to be viewed as a vehicle through which economic growth and development can be achieved, particularly for developing economies where the agricultural sector is dominated by largely informal, small-scale producers (Machethe, 2004).
The agriculture sector emerges as a key tool in achieving economic growth and poverty reduction and its potential to meet the increasing demand for food, depends largely on the productivity and market access of small farms.
With the increase lack of agricultural production resources, smallholder farmers try to find the means to simultaneously guarantee household food security and maximize income from agriculture. Thus, in pursuing strategies of survival and in seeking prosperity, small farmers gather resources from wherever available, whether through formal or informal systems. In the midst of these, farmers have resulted in a number of options to enhance their farm production and improve their well-being. One of these options includes pooling their resources and working together as members of SHGs.
The justification arises from their potential in realizing pro-poor economic growth and sustainably empowering small scale farmers.
Fischer (2012) indicates that organization among smallholder farmers has proved to be one of the means for smallholder farmers to overcome market imperfections. Strong and vibrant farmers’
organizations can provide opportunities to farmers to effectively play a role in the market economy and benefit from it (Millan et al., 2006). In Rwanda, most of the people lives in the rural areas are below the poverty line and finance to these smallholder farmers is considered as important issues for the Government of Rwanda. The financial requirement is one of the basic needs of the poorer section of the society for socioeconomic development (World Bank, 2009).
To achieve poverty eradication, special focus is needed on strengthening the resilience of rural households and their livelihoods to shocks. Given the predominance of agricultural livelihoods among poor rural households, this agenda will often have a strong agricultural orientation, with a

International Journal of Agriculture and Environmental Research
ISSN: 2455-6939
Volume:02, Issue:05
www.ijaer.in Copyright © IJAER 2016, All right reserved Page 1441
focus on improving sustainability and resilience in agricultural practices. However, the agenda also needs to be relevant to different types of livelihoods that sometimes exist within a single household (MINAGRI, 2011).
Financial benefits mainly income, is the primary motivation for producers to join these farmers’
groups. Failing to get the desired benefit could threaten their participation in such entities. While aiming at increasing farmer’s income by providing services at lower costs and better prices for
their produce. The expected role of farmer organizations could be challenged by various problems such as poor infrastructures, lack of investment, inadequate service provision, poor extension services, competition with local traders, etc. To our knowledge, not much research has been done on farmers’ organizations in Rwanda and empirical studies on their socioeconomic impacts are limited. Therefore, in light of the above mentioned and given the assumed role of farmers’ organizations in Rwanda, the present study seeks to contribute to the existing body of
literature and research on farmer organizations in Rwanda.
Coleman (1999) in his study on Self help groups showed that SHGs have appeared as popular method of working in the company of people in recent years.
This movement comes from the people’s desires to meet their needs and determine their own
destinies through the principle ‘by the people, for the people and of the people’. Self help groups are voluntary gatherings of persons who share needs or problems that are not being addressed by existing organizations, institutions, or other types of groups. The major goal of a self help group is to bring about personal and social economic change for its members and society. All of those groups emphasis face to face interaction among members and stress a set of values or ideology that enhances a member’s personal sense of identity.
Coleman (1999), considered the impact of group lending programs in North East Thailand, the survey showed that the impact of village banks that provide group-loans in villages is insignificant on physical assets, savings, productions, and productive expenditures and on other variables.
Land in Rwanda is the most valuable, productive and contested asset. Several reforms and policies are under implementation in Rwanda, among these, the Land Use Consolidation policy is a key for agricultural transformation. The overarching strategies of economic development and poverty reduction in Rwanda that envisions social transformation through agriculture require shifting from such subsistence farming to commercial oriented agriculture (IFAD, 2012).
The described SHG is an informal organization of farmers from the homogeneous poor section of the society and it is controlled and managed by the members itself. It is an association of 15 to
International Journal of Agriculture and Environmental Research
ISSN: 2455-6939
Volume:02, Issue:05
www.ijaer.in Copyright © IJAER 2016, All right reserved Page 1442
20 local individual members who have neighboring plots and from the same socio-economic backgrounds. These groups start with farming, saving and no with credit; the group then uses its savings to give loans to members to meet their emergency and other needs (MINAGRI, 2010).
In Malawi, similar groups have been found to mobilize savings and substantially invest (72.7%) in farming, with fertilizer accounting for 64.9%. Other similar groups have been reported in West African countries, such as the ‘susu’ of Ghana (Aryeeta, 1992), ‘tontines’ of Cameroon and ‘esusu’ of Nigeria (Bauman, 1994). In Ghana, the groups have managed to form a strong financial base and registered as ‘susu’ company (Aryeetey et, al. 1991). Similar groups have also been operational in Ethiopia (known as iddir), South Africa (known as stokvel), Malawi (Chipeta and Mkandawire, 1991), Tanzania, Zambia and Zaire (Slover, 1992). Despite these few studies, the groups’ contribution to agricultural development is not clearly understood by policymakers. The informal sector is in a way still a “black box” in many countries. Conventional wisdom had
it that these endeavors were comprised of exploitative loans and that credit lent by the informal sector never promoted.
2. STATEMENT OF PROBLEM
Rwanda’s agricultural sector faces a set of unique challenges. Due to the country’s high
population density, land is a scarce commodity, while labor is Rwanda’s most abundant factor
endowment. As a result soil fertility has deteriorated dramatically over time, while fertilizer use, both organic and inorganic remains low. Furthermore, much of Rwanda’s land is at a high risk of
erosion, not least because of the need of smallholders to cultivate slopes of up 55%. Food crops remain dominant in the agricultural, although farmers are beginning to shift slightly towards higher value food crops, such as fruits and vegetables, rice, sorghum, Maize, groundnuts and soybeans. Finally, Rwandan agriculture continues to be characterized by very low levels of input use, especially mineral fertilizer (PSTA-II, 2009)
Since long, Rwanda’s economy is highly dependent on the agriculture sector which is dominated
by small scale, subsistence oriented family farming units and the life of farmers was very challenging because of poor yield and low farm income. The government of Rwanda believes that land fragmentation is a major threat to efficient crop production in the country due to the fact that continuous subdivision of farms has led to small sized land holdings that may be hard to economically operate (MINAGRI, 2010). According to Rwanda National Institute of Statistics (2013), the agricultural production is facing a number of limitations related mainly to land decline of productivity, land fragmentation, non use of adequate fertilizers and improved seeds. The major reasons for low productivity and the reliability of farm income include the non-availability of improved inputs (seeds), inefficient fertilizers use, and weed infestation, shortage of irrigation water, drought and seasonal variation of rainfall, inadequate research efforts and

International Journal of Agriculture and Environmental Research
ISSN: 2455-6939
Volume:02, Issue:05
www.ijaer.in Copyright © IJAER 2016, All right reserved Page 1443
inefficient extension services. Another important factor for the low agricultural land productivity is practicising of traditional farming techniques and lack of investment for adoption of improved agricultural production technologies because the majorities of farmers is resource poor and have small land holdings.
The population of Rwanda has increased the continuous increase in the population and slow growth in agricultural production due to natural resource degradation has resulted in gap in agricultural food items demand and supply. Productivity improvement and the use of additional factors of production would lead to expansion in agricultural production but they are difficult to arrange because of land degradation. In this scenario, productivity improvement with the existing resources by increasing farm efficiencies is more efficient and attainable option. Research and development are considered to be the main forces behind technological change while education and experience and expanded infrastructure are necessary for improving the system’s efficiency.
There is need to explore the factors determinants of farm income among SHGs smallholder farmers in Rwanda. According to Bachke (2009), there is a positive effect on small-scale farmers’ income from being member in farmers’ Groups. Belonging to SHG has led the
groundwork for a successful, sustainable development that can help farming families lift themselves out of poverty. During the SHG meeting, there is a great participatory process whereby farmers share ideas and experiences on how to enhance and sustain their livelihoods, better and sustainable farming methods, how to make composts and fertilize the crop fields. They market and sell their yields collectively and improve the bargaining power of each member. Being in SHG can dramatically improve the farm income. The SHGs look forward to increase their productivity and create new market opportunities for their business (Fernandez, 1995). The SHG is a new concept in Rwandan Agriculture; the purpose of this study was to assess its contribution of SHGs on Rwandan Agricultural productivity and increase of income from the farm activities in smallholder farmers.
In Huye District, Rwanda; there is a problem of low income from agriculture production and this is due to bad agriculture practices, subsistence agriculture with low knowledge on market oriented agriculture and lack of off farming activities among farmers like saving and they have small plots due to land fragmentation.
3. OBJECTIVES OF THE STUDY
The general objective of this study was to analyze the contribution of Self Help Groups in enhancing the smallholder maize farmer’s income in Huye District, Rwanda.
3.1 Specific objectives of the Study
International Journal of Agriculture and Environmental Research
ISSN: 2455-6939
Volume:02, Issue:05
www.ijaer.in Copyright © IJAER 2016, All right reserved Page 1444
1. To study the socio-economic characteristics of the respondents in the study area; 2. To determine the level of saving before and after joining the SHGs; 3. To examine the determinants of farm income among SHGs smallholder farmers in the
study area.
3.2 Hypothesis
Ho: There is significant contribution of farmers SHGs in enhancing the smallholder maize farmer’s income.
H1: There is no significant contribution of farmers SHGs in enhancing the smallholder maize farmer’s income.
4. RESEARCH METHODOLOGY
4.1 Introduction
This section describes the procedures that were followed in conducting the study. It incorporates the area of study, research design, description of target population, sampling strategies, data collection methods, and data quality control and data analysis procedures.
This chapter gives the details of how the research was conducted; the methods that were used for data collection, selection of study area and collected data. It explains techniques that were used for data analysis, limitation of the study and its reliability and validity.
4.2 Research Design
Research can be defined as a scientific and systematic search for pertinent information on specific topic. In order to have a holistic view about this topic, the study employed two different methods to extract the required information which are the quantitative and the qualitative. The quantitative and the qualitative methods represent different research strategies, and they are clearly separated in their views of the role of the theory and which scientific approach to use (Bryman, 2004). Even so, they can of course be combined, for example doing qualitative interviews for specific views on a subject, and combining this with a broader, more general statistically quantifiable survey.
4.3 Population
The population is the total number of elements covered by the research questions. It also covers all the events, things or individuals that are objects of the investigation. However, the
International Journal of Agriculture and Environmental Research
ISSN: 2455-6939
Volume:02, Issue:05
www.ijaer.in Copyright © IJAER 2016, All right reserved Page 1445
populations from which the primary data were collected comprise 519 smallholder maize farmers (230 males and 289 females) members of SHGs in Rusatira Sector, Huye District in Rwanda.
4.4 Sampling frame
This study was conducted among smallholders maize farmers, members of SHGs from Rusatira Sector in Huye District, Southern Province of Rwanda.
4.5 Sample and sampling technique
4.5.1 Sampling Techniques
The objectives stated earlier were examined through an exploratory study of the functioning of selected SHGs in Huye District. The area of study is purposively chosen considering that Huye is among of the districts in the country where the problems of low agricultural productivity, Living standards and economic issues that affect the well-being of the poor community, particularly those of the smallholder farmers, are believed to be rampant (Minagri,2010). It is hoped that this study promoted the concept of Farmers SHGs in Rwanda.
4.5.2 Sample Selection
The quality of the study depends on a clear and precise definition of the target group and in the establishment of clear boundaries that identifies who is included and for what reason, and who is not. The contribution of SHGs in enhancing the smallholder maize farmer’s income and the life
of the members are highly correlated with the time of involvement within the SHG.
4.5.3 Sample Size
By the time this study was conducted, there were a total of 519 smallholder maize farmers (230 males and 289 females) members of SHGs which started their activities in 2012.
For determining the sample size we have used the formula of Alain Bouchard saying that for the population under 1,000,000 individuals with assumed error of 10% and 95% of precision.
As the population members size ( N ) lied between 500 and 1000 individuals with an estimated error of 10% with a precision of 90%; thus No= 88 according to Allain Bouchard table (in Appendix D).
This can be elaborated in the following figures:
N: Population size equals 519 smallholder maize farmers grouped in 30 SHGs in Cyili site.

International Journal of Agriculture and Environmental Research
ISSN: 2455-6939
Volume:02, Issue:05
www.ijaer.in Copyright © IJAER 2016, All right reserved Page 1446
No: Sample size when the population size goes towards infinite is 88
Nc: Corrected sample size or sample size for known number of population
Nc= (N *No) = (519*88) = (45672) = 75. Thus, the sample size is 75 beneficiaries (N +No) (519+88) (607)
75 respondents among 336 were randomly selected and studied.
To collect quantitative and qualitative data, semi-structured questionnaires were administered to Seventy Five (75) randomly selected SHG members.
4.6 Instruments
In order to collect their written reflections on the contribution of SHGs in enhancing the smallholder maize farmer’s income, a semi-structured questionnaire was developed and distributed to the respondents. Broadly the questionnaire covers various aspects such as extent of Assets acquisition, savings, level of income generation, living standards, expenses, trainings, SHGs membership, households farming and agricultural production (inputs and outputs analysis) and Bank services.
4.7 Data collection procedure
The methods used to collect the data included the use of semi-structured questionnaire. To further ascertain data collected through primary data collection methods, various SHG documents were analyzed and pertinent data regarding group meeting attendance, individual savings and loan, and the general performance of the SHGs were gathered. All categories of primary data collection have been conducted in Kinyarwanda after translating the questions from English to Kinyarwanda. Then again the kinyarwanda version responses were translated into English for analysis.
4.8 Pilot test
To ensure that the tools to be used in collecting data yield accurate data, they were pre-tested where by a sample size of 20 respondents were picked on randomly and the responses given enabled the researcher to ascertain that tools used are reliable in respect to the objectives of the study and purpose.

International Journal of Agriculture and Environmental Research
ISSN: 2455-6939
Volume:02, Issue:05
www.ijaer.in Copyright © IJAER 2016, All right reserved Page 1447
4.9 Data Processing and analysis
To achieve the objectives of this study, a sound research methodology with appropriate analysis tools is essential. A methodology that allows drawing meaningful inference from the sample is desirable. The primary data were collected from smallholder maize farmers and entered in Statistical Package for Social Science (SPSS) to be analyzed. Data collected from respondents were analyzed using models and descriptive statistics (percentages and frequencies). The means and standard deviations were used to analyze the difference of farmers on before and post SHGs in terms of production and saving.
Paired sample test were used to explore the significant difference between the Production and savings on basic needs of SHG members before and after joining the SHG. For this research, Multivariate Linear Regression Model were used to assess the most optimal combination of resource in farmers SHGs farms so as to improve even further farms’ production
and to maximize the farm income.
The form of simple and multiple linear regression models are presented below:
ttxy 110
Regression analysis is the art and science of fitting straight lines to patterns of data. In a linear regression model, the variable of interest (the “dependent” variable) is predicted from k other variables (the “independent” variables) using a linear equation.
If y denotes the dependent variable, and 1x , ……, kx , are the independent variables, then the assumption is that the value of y at time t (or row t) in the data sample is determined by the linear equation:
tttttttttt xxxxxxxxxy 88776655443322110
Where the betas are constants and the epsilons are independent and identically distributed (i.i.d) normal random variables with mean zero. α is the so-called intercept of the model-the expected value of Y when all the X’s are zero and βi is the coefficient (multiplier) of the variable Xi. The betas together with mean and standard deviation of the epsilons are the parameters of the model.

International Journal of Agriculture and Environmental Research
ISSN: 2455-6939
Volume:02, Issue:05
www.ijaer.in Copyright © IJAER 2016, All right reserved Page 1448
The corresponding equation for predicting Yt from the corresponding values of the X’s is
therefore:
ttttttttt xbxbxbxbxbxbxbxxbby 88776655443322110
Where the b’s are estimates of the betas obtained by least-squares, i.e., minimizing the squared prediction error within the sample. This is about the simplest possible model for predicting one variable from a group of others, and it rests on the following assumptions.
1. The expected value of Y is a linear function of the X variables. This means: a. if Xi changes by an amount ΔXi, holding other variables fixed, then the expected value of Y changes by a
proportional amount βiΔXi, for some constant βi (which in general could be a positive or
negative number).
b. The value of βi is always the same, regardless of values of the other X’s.
c. The total effect of the X’s on the expected value of Y is the sum of their separate effects.
2. The unexplained variations of Y are independent random variables (in particular, not “auto
correlated” if the variables are time series)
3. They all have the same variance (“homoscedasticity”).
4. They are normally distributed.
These are strong assumptions. You can easily imagine situations in which Y might be a nonlinear function of the X’s (e.g., if there are diminishing marginal effects), or in which there might be interactions among the X’s in their effects on Y (e.g., if the sensitivity of Y to one of
the X’s depends on the values of other X’s), or in which the size of the random deviations of Y
from its expected value might depend on the values of the X’s (e.g., if there is greater or lesser
uncertainty under some conditions), or in which the random deviations might be correlated in time, or in which the errors are not normally distributed (e.g., the error distribution might not be bell-shaped and/or might have some really extreme values). A regression model assumes that there are no such nonlinearities or interactions or changing volatility or autocorrelation or non-normality in the random variations.
The budgetary technique was employed in computing the income of accruing to small farmers from maize production. The arithmetical relations used in capturing profit made are presented below:
Total Cost (TC) = Total fixed cost (TFC) + Total variable Cost (TVC) …………….. (1)

International Journal of Agriculture and Environmental Research
ISSN: 2455-6939
Volume:02, Issue:05
www.ijaer.in Copyright © IJAER 2016, All right reserved Page 1449
Gross Revenue (GR) = Total Farm Output (TFO) * Unit Price Cost ………………… (2)
Gross Margin (GM) = GR – TVC …………………… (3)
Net Farm Income (NFI) = GM – TFC ……………….. (4)
4.10. Reliability and validation One way to conduct research that is both valid and reliable is to be found in the use of multiple methods and multiple sources of data (Case, 2007). (Cohen, Manion et al. 2000), also added that use of two or more methods of data collection in the study which is known as triangulation lead to more valid and reliable data. To assure reliability and validity of the study the various methods of data collection were applied. The researcher collected the primary data from different people.
4.11. Ethical Considerations In the process of the study, the following ethical issues were considered. In order to obtain an informed consent from the respondents, the purpose of the study was explained clearly. Members of the self help group have been asked to give their informed consent orally before filling out the questionnaire or participating in any discussion. Information obtained from the respondents is promised to be kept confidential. Necessary efforts were made so that the languages in the data collection tools considered the culture and the comprehending level of the respondents.
5. RESULTS AND INTERPRETATION
5.0. Introduction This chapter gives the findings and the discussions from different respondents of the study. The key points discussed in this chapter are Socio economic characteristics of the respondents, savings and maize production before and after joining the SHG, the Role played by the Main factors of production on Maize yield among the SHGs members and the determinants of Farm income of SHGs members. Tables and figures have been used in analyzing different findings on the study.
5.1. Socio Economic Characteristics of the respondents
The personal data of the respondents, concern the location, the age, the sex, the marital status, educational level and the number of household members of the smallholder farmers members of the SHGs who were collected (Table 4.1).
International Journal of Agriculture and Environmental Research
ISSN: 2455-6939
Volume:02, Issue:05
www.ijaer.in Copyright © IJAER 2016, All right reserved Page 1450
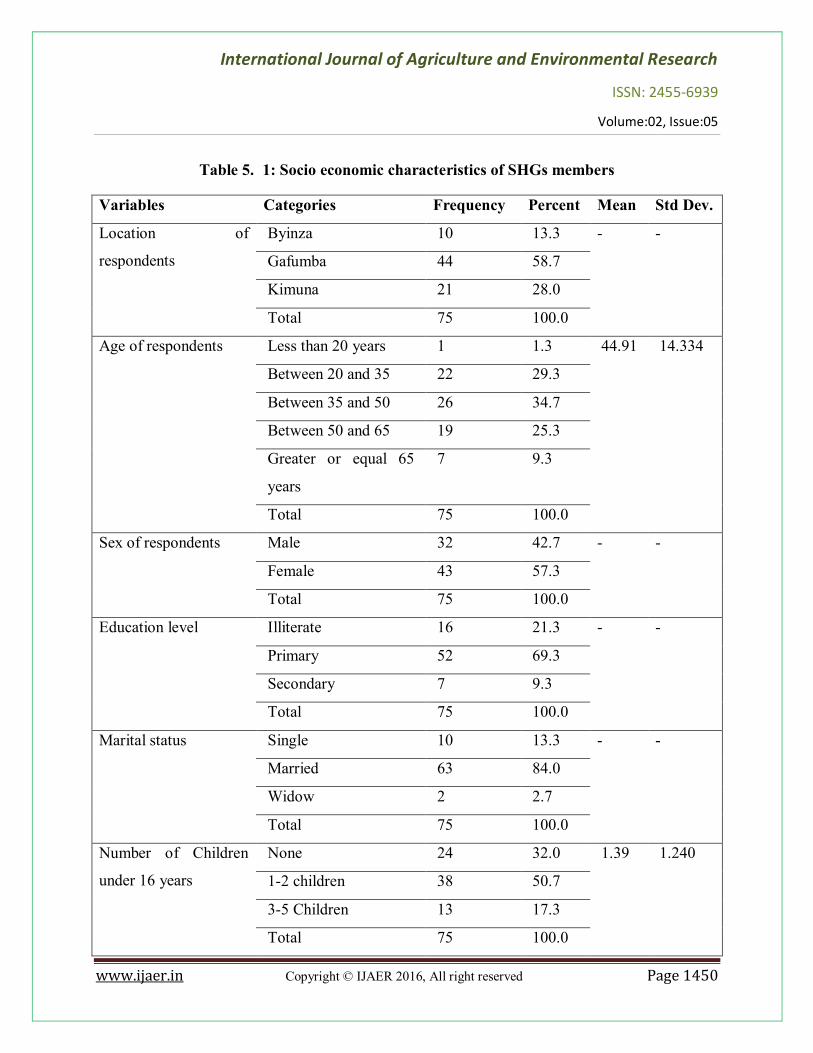
Table 5. 1: Socio economic characteristics of SHGs members
Variables Categories Frequency Percent Mean Std Dev.
Location of
respondents
Byinza 10 13.3 - -
Gafumba 44 58.7
Kimuna 21 28.0
Total 75 100.0
Age of respondents Less than 20 years 1 1.3 44.91 14.334
Between 20 and 35 22 29.3
Between 35 and 50 26 34.7
Between 50 and 65 19 25.3
Greater or equal 65
years
7 9.3
Total 75 100.0
Sex of respondents Male 32 42.7 - -
Female 43 57.3
Total 75 100.0
Education level Illiterate 16 21.3 - -
Primary 52 69.3
Secondary 7 9.3
Total 75 100.0
Marital status Single 10 13.3 - -
Married 63 84.0
Widow 2 2.7
Total 75 100.0
Number of Children
under 16 years
None 24 32.0 1.39 1.240
1-2 children 38 50.7
3-5 Children 13 17.3
Total 75 100.0

International Journal of Agriculture and Environmental Research
ISSN: 2455-6939
Volume:02, Issue:05
www.ijaer.in Copyright © IJAER 2016, All right reserved Page 1451
Number of family
members per
household
2 members 6 8.0 4.67 1.663
3-5 members 45 60.0
More than 5 members 24 32.0
Total 75 100.0
New skills after
joining the SHG
Yes 56 74.7 - -
No 19 25.3
Total 75 100.0
Saving in SHG Fortnightly 10 13.3 - -
Weekly 65 86.7
Total 75 100.0
Loans taken from SHG Yes 58 77.3 - -
No 17 22.7
Total 75 100.0
According to this table, among 75 farmers interviewed, 13.3% are from Byinza, 28% are from Kimuna and 58.7% are from Gafumba cell. All these cells are in Rusatira sector, Huye District, Southern Rwanda. The age categories of the respondents where a big number of the respondents (34.7%) are found between 35 and 50 years and only 1 respondent has less than 20 years old. This shows that 65% of these farmers are in their middle age (i.e. relatively active).
This portrays that most of the smallholder maize farmers’ members of SHGs are in their active
and productive age when they can put in their best for optimum productivity; 42.7% of the respondents are male while 57.3% are female. This shows that participation is farmers SHGs is for all with the majority of women. The majority of smallholder maize farmer’s members of
SHG (69.3%) have primary level of education, while 9.3% have attended the secondary and 21.3% are illiterate. This implies that the education level of the farmers was very low. Education of the farmer plays an important role in decision making and accessing crucial production information. It helps farmers in gaining skills and adapts new technologies.
This table gives the marital status of the respondents where 13% are single, 84% are married and 2.7% are widows. The fact that a big part of these farmers are married showed that they really know the life situation, what they want, and the increase of production and income is very meaningful to them for their living standards improvement; 8% of households have 2 members,

International Journal of Agriculture and Environmental Research
ISSN: 2455-6939
Volume:02, Issue:05
www.ijaer.in Copyright © IJAER 2016, All right reserved Page 1452
60% have 3 to 5 members and 32% are composed of more than 5 members. This table is showing the presence of children under 16 (unproductive people) where 32% of households don’t have any child who is under 16, 50.7% have between 1 to 2 children and 17.3% have 3 to 5
children. This table shows that the farmers SHGs save once a week (86.7%) and once in two weeks (13.3%). This is very important in helping smallholder maize farmers in increasing their savings and having a good culture of saving; 77.3% of the respondents have got loans from the SHG. This can help a farmer doing his daily activities and get solutions to some issues which can arise day to day.
The Study clearly proved that SHGs helped the smallholder farmers to enhance their economic resources base by improving their micro savings. It has helped them to increase their income and banking habits.
5.2. Saving and Maize production before and after the SHGs participation
The farmers SHGs can play a greater role in increasing the production, the productivity and the profitability and this can be of a great importance in Rwandan Agriculture. Smallholder maize farmer’s savings can play a big role in farm production increase by helping the farmers to get
improved seeds, fertilizers and other necessary inputs without any problems, and may help these farmers to get the necessary needs for the day to day life and hence the income, the production and the living standards are improved through the saving which is important in economic development (Table 4.2).
The paired samples t-Test have been used to compare the maize production before and after joining the SHGs (Table 4.3) and the savings before and after SHGs participation (Table 4.7). The source of information regarding the agriculture of the farmers have been recorded (Table 4.4), the same as the variability of prices (Table 4.5) and the savings of these farmers before and after they participate in SHGs (Table 4.6)

International Journal of Agriculture and Environmental Research
ISSN: 2455-6939
Volume:02, Issue:05
www.ijaer.in Copyright © IJAER 2016, All right reserved Page 1453
Table 5.2: Production before joining the SHG (Season A2011) and after joining the SHG (Season A2015)
Production quantity
per class Interval (Kg)
Production quantity (Kg)
before joining SHG
Production quantity (Kg)
after joining SHG
Frequency Percent Frequency Percent
Less than 100 49 65.3 9 12.0
Between 100 and 200 18 24.0 4 5.3
Between 200 and 300 3 4.0 15 20.0
Between 300 and 400 1 1.3 12 16.0
Between 400 and 500 1 1.3 11 14.7
Between 500 and 600 0 0.0 4 5.3
Between 600 and 700 0 0.0 3 4.0
Between 700 and 800 0 0.0 3 4.0
Between 800 and 900 1 1.3 3 4.0
Between 900 and 1000 1 1.3 3 4.0
Greater or equal 1000 1 1.3 8 10.7
Total 75 100.0 75 100.0
This table shows that the production increased after joining the SHG when comparing to before joining the SHG.
Here 75 smallholders farmers were interviewed before joining SHG and the same 75 smallholders farmers were interviewed after Joining the SHG. The production quantity was measured in Kg and the findings show that before joining SHG 49 respondents i.e 65.3% confirm that, the yield was less that 100Kg of Maize and 9 i.e 12.0% confirm that yield was less than 100 Kg of Maize. If we continue to interpret the above table it can seen that 1 i.e 1.3% smallholder argue that, the production was greater or equal to 1000Kg before joining the SHG and 8 smallholder farmers i.e 10.7% confirm that the maize production was greater or equal to 1000Kg. as the production increases, the smallholder farmers demonstrate the advantage of being a member of SHG. the findings show that, SHG was very contributive to enhance the production of Maize among the smallholder farmers in the study area. Another important element here the smallholder Maize farmers were very proud to be the member of SHG.

International Journal of Agriculture and Environmental Research
ISSN: 2455-6939
Volume:02, Issue:05
www.ijaer.in Copyright © IJAER 2016, All right reserved Page 1454
Table 5.3: Paired-Samples t test: Maize Production
Paired Samples Statistics
Mean N Std. Deviation Std. Error Mean
Production quantity
(Kg) after joining the
SHG
691.88 75 1245.176 143.781
Production quantity
(Kg) before joining the
SHG
165.65 75 369.226 42.635
Paired Samples Test
Paired Differences t df Sig. (2-
tailed) Mean Std.
Dev
Std. Error
Mean
Production quantity
(Kg) after joining the
SHG and Production
quantity (Kg) before
joining the SHG
526.227 905.81
1
104.594 5.03
1
74 .000
Paired t test compares means across the same variable and the same cases at two different times. The objective of the study was to compare the variability of production before and after the Small farmers join SHG. The data was collected on the production quantity and 75 small farmers before were interviewed and 75 after joining SHG were interviewed too. The null hypothesis is that the production was not changed (or that the production of 75 small farmers remained unchanged after joining SHG). There is a difference for the mean production quantity before and after joining Self Help Group because the p-value is less than significance level of 5 percent (0.00<0.05). The production quantity before joining Self Help Group is less than the production quantity after joining Self Help Group (165.65< 691.88).
The sample standard deviation for production quantity before is 369.226 kg and for production quantity after joining Self Help Group is 1245.176 kg. this enable the researcher to conclude the

International Journal of Agriculture and Environmental Research
ISSN: 2455-6939
Volume:02, Issue:05
www.ijaer.in Copyright © IJAER 2016, All right reserved Page 1455
rejection of the null hypothesis in favor of the alternative hypothesis which states that there is difference for the mean production quantity before and after joining SHG.
Much of this variability is due to the increase of fertilizers and improved seeds, knowledge gained from different training and so on, and the paired t test design dramatically reduces the standard deviation to 905.811kg, meaning the paired t test has significantly more power for knowing the variability of production quantity.
Table 5.4: Agriculture Production information
Source of Agriculture information Frequency Percent
From SHG meeting 49 65.3
From Radio 2 2.7
Other (Agro dealers, District staffs, RAB) 2 2.7
From SHG meeting, From Radio 16 21.3
From SHG meeting, Other (RSSP Extensionists, Tubura) 6 8.0
Total 75 100.0
This table gives a clear picture of how the smallholder farmers gain information about agriculture up date and the findings show that, 49 i.e 65.3% of smallholder farmers got information from SHG through daily meeting, 16 i.e 21.3 got information from Radio. a big number of the smallholder maize producers got the agriculture information from the SHG (65.3% of the respondents) and this continue to demonstrate/ prove the role of SHG in in enhancing the small holders Maize farmers in the study area.

International Journal of Agriculture and Environmental Research
ISSN: 2455-6939
Volume:02, Issue:05
www.ijaer.in Copyright © IJAER 2016, All right reserved Page 1456
Table 5.5: Variability of Price (Frw/Kg)
Price (Frw/Kg) Frequency Valid Percent 145 1 1.4 150 22 30.1 160 19 26.0 168 10 13.7 170 19 26.0 175 1 1.4 200 1 1.4 Total 73 100.0
The above table explains very clearly the changes in the price per kilo Gramm for different small holders farmers, here 1 farmer sold 1 kg of Maize for 145 Rwf, 22 farmers sold 1kg for 150Rwf, 19 farmers sold it for 16, etc. if we observe on the above table, it will be seen that the price variable was not constant for all farmers interviewed and this can create a divergence of profit among the smallholder farmers. Price should be regulated in such way, that it can be fixed and all farmers can benefit the equal advantage. The price varies from 145 Frw to 200Frw per Kg.
Table 5.6: Savings before joining the SHGs and after joining the SHGs (Frw)
Amount of Saving per class Interval (Frw)
Saving (Frw) before joining SHG
Saving (Frw) after joining SHG
Frequency Percent Frequency Percent No saving 48 64.0 0 0.0 Less 10,000 10 13.3 14 18.7 Between 10,000 and 20,000 4 5.3 25 33.3 Between 20,000 and 30,000 6 8.0 10 13.3 Between 30,000 and 40,000 1 1.3 6 8.0 Between 40,000 and 50,000 4 5.3 2 2.7 Between 50,000 and 60,000 0 0.0 3 4.0 Between 60,000 and 70,000 0 0.0 3 4.0 Between 70,000 and 80,000 0 0.0 3 4.0 Between 80,000 and 90,000 1 1.3 0 0.0 Between 90,000 and 100,000 1 1.3 3 4.0 Greater or equal 100,000 0 0.0 6 8.0 Total 75 100.0 75 100.0
International Journal of Agriculture and Environmental Research
ISSN: 2455-6939
Volume:02, Issue:05
www.ijaer.in Copyright © IJAER 2016, All right reserved Page 1457
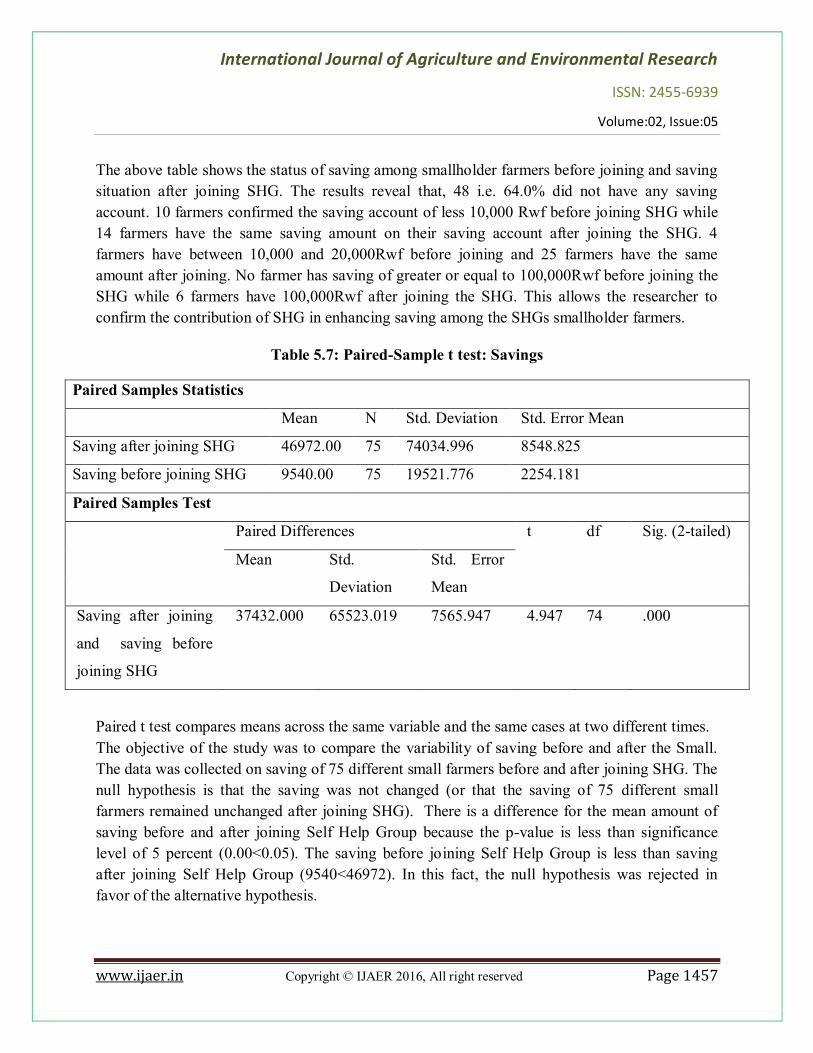
The above table shows the status of saving among smallholder farmers before joining and saving situation after joining SHG. The results reveal that, 48 i.e. 64.0% did not have any saving account. 10 farmers confirmed the saving account of less 10,000 Rwf before joining SHG while 14 farmers have the same saving amount on their saving account after joining the SHG. 4 farmers have between 10,000 and 20,000Rwf before joining and 25 farmers have the same amount after joining. No farmer has saving of greater or equal to 100,000Rwf before joining the SHG while 6 farmers have 100,000Rwf after joining the SHG. This allows the researcher to confirm the contribution of SHG in enhancing saving among the SHGs smallholder farmers.
Table 5.7: Paired-Sample t test: Savings
Paired Samples Statistics
Mean N Std. Deviation Std. Error Mean
Saving after joining SHG 46972.00 75 74034.996 8548.825
Saving before joining SHG 9540.00 75 19521.776 2254.181
Paired Samples Test
Paired Differences t df Sig. (2-tailed)
Mean Std.
Deviation
Std. Error
Mean
Saving after joining
and saving before
joining SHG
37432.000 65523.019 7565.947 4.947 74 .000
Paired t test compares means across the same variable and the same cases at two different times. The objective of the study was to compare the variability of saving before and after the Small. The data was collected on saving of 75 different small farmers before and after joining SHG. The null hypothesis is that the saving was not changed (or that the saving of 75 different small farmers remained unchanged after joining SHG). There is a difference for the mean amount of saving before and after joining Self Help Group because the p-value is less than significance level of 5 percent (0.00<0.05). The saving before joining Self Help Group is less than saving after joining Self Help Group (9540<46972). In this fact, the null hypothesis was rejected in favor of the alternative hypothesis.

International Journal of Agriculture and Environmental Research
ISSN: 2455-6939
Volume:02, Issue:05
www.ijaer.in Copyright © IJAER 2016, All right reserved Page 1458
The sample standard deviation for saving before is 19521.776 Frw and for saving quantity after joining Self Help Group is 74034.996 Frw. Much of this variability is due to different knowledge gained from training and increase of income from production and so on, and the paired t test design dramatically reduces the standard deviation to 65523.019 Frw, meaning the paired t test has significantly more power for knowing the variability of saving.
The maize production factors studied are the area, Labor, Fertilizers and Seed quantity (Table 5.8).
Table 5.8: Regression results of production factors
Variables Coefficients t Sig.
Intercept 92.616 .986 .327
Maize production area (Ares) 13.328 8.002 .000
Quantity of hired labor (Man days) -12.397 -5.383 .000
Fertilizers (Kg) 11.471 2.389 .020
Seeds (Kg) 47.483 6.747 .000
R2=0.923
Adjusted R2 =0.919
a) Dependent Variable: Production quantity (Kg) after joining the SHG b) Predictors: (Constant), Seeds (Kg), Fertilizers (Kg), Maize production area (Ares),
Quantity of hired labor (Man days number)
The form of Multiple Linear Regression model is:
ttttt xxxxy 443322110
X1: Maize production area (Ares), X2: Quantity of hired labor (Man days number), X3: Fertilizers (Kgs), X4: Seed quantity ( Kg)
4321 483.47471.11397.12328.13 xxxxy
Result from Table 5.8 shows that four variables used in this model are statistically in determining maize production factors for SHGs in Huye district within the study period. The coefficient of seeds measured in Kgs was 47.483 and statistically significant at 1% percent level of significance. The coefficients of Area and Labor are statistically significant at 1% level with

International Journal of Agriculture and Environmental Research
ISSN: 2455-6939
Volume:02, Issue:05
www.ijaer.in Copyright © IJAER 2016, All right reserved Page 1459
elasticities of 13.328 and -12.397 respectively. The coefficient of fertilizers is positive 11.471 and statistically significant at 5% level of significance. Moreover, the findings from multi linear regression model estimation confirm that the selected variables explain 92% of change in maize production factors while remaining portion of 8% is due to the factors which are not included in the model. The findings for maize production factors presented in table 5.8, shows that seeds (Kg) correlate positively with maize production factor. Its coefficient is 47.483 and statistically significant at 1% level of significance; this explains that 1% increase in seeds (Kgs) raise maize production by 47.483. Though the seed is the robust determinants of maize production; this calls for government intervention for providing subsidies to SHGs farmers to get improved seeds and increase maize production. Cultivated area found to have positive effect on maize production with coefficient of 13.328 and statistically significant at 1% level of significance. This indicates that 1% increase in cultivated area will raise maize production by 13.328. Therefore government has to enforce programs like land consolidation and urbanization in order to get enough land for cultivation and increase the maize productions. Fertilizers (Kg) and maize production are positively correlated and statistically significant at 1% level of significance. Fertilizers has a coefficient of 11.471which implies that 1% increase in fertilizers (Kgs) will improve maize production by 11.471. The adoption of new technology in agriculture have proved that the use of fertilizers improve the overall agriculture production. If Government keeps providing subsidies to SHGs as well as other farmers; this will make fertilizers more available and as results maize production will increase gradually. Quantity of hired labor affects maize production negatively. The coefficient of Quantity of hired labor is -12.397 which indicates that 1% increase in Quantity of hired labor will decrease maize production by -12.397. The reason is that the labor cost is high and to remedy this problem SHGs farmer as well as other farmers must utilize agricultural tractors. However, the tractor machines are expensive and few of farmers and SHGs only can afford them. This also calls for government intervention to provide some form of subsidies in order to reduce cost of production and ultimately increase the maize production and overall agricultural production in the country.
5.3. The determinants of Farm income of SHGs members
Basically, financial profits are often used in positive analyses of farm behavior as the dominant objective of farmers. The rationale in using this measure is justified by both methodological and individualism aspects. According to FAO, farmers might have different objectives.

International Journal of Agriculture and Environmental Research
ISSN: 2455-6939
Volume:02, Issue:05
www.ijaer.in Copyright © IJAER 2016, All right reserved Page 1460
Moreover, financial profits are often unreliable objectives since they may embed distortions and reduction in the level of reliability of household food supply and increasing risk (FAO, 1997). The productivity is a necessary condition whereas a commercial optimum relates to the market value of the production (Table 5.9).
Table 5.9: Multiple Linear Regression Model results of farm income.
Variables Coefficients T Sig.
Intercept -90487.093 -7.458 .000 Age of household head (Years) 7.141 .146 .885 Household size (Number of persons) 51.979 .114 .910 Farm size (Ares) 2.910 .075 .040 Maize Production (Kg) 174.521 49.028 .000 Price of maize production (Rwf/Kg) 543.433 7.370 .000 Maize Production cost (Rwf) -.107 -2.123 .038 R2=0.999 Adjusted R2=0.999
a. Dependent Variable: Total Income from maize Production b. Independent variable: Maize Production cost, Price of maize production (Frw/Kg), Age
of household head, Household size (Number of persons), Farm size (Ares), Maize Production (Kg)
The form of the Multiple Linear Regression Model is as follow:
ttttttt xxxxxxy 6655443322110 X1: Age of household head (years), X2: Household size (number of persons), X3: farm size (Ares), X4: Maize Production (Kgs), X5: Price of maize production (Rwf/Kg), X6: Maize Production Cost (Rwf)
y=-90487.093+ 7.141X1+ 51.98X2+ 2.91X3+ 174.52X4+ 543.43X5-0.107X6
Table 5.9 presents summary for regression estimation, it shows that four out of six variables employed in the regression are statistically significant in determining total income of SHGs from maize farming for SHGs in Huye district within the study period. The coefficient of Price of maize production (Rwf/Kg) is 543.433 and statistically significant at 1% percent level. Maize production (Kg) coefficient is 174.521 and statistically significant at 1% level. Though, both Farm size (Ares) and Maize Production cost (Rwf) coefficients are statistically significant at 5%

International Journal of Agriculture and Environmental Research
ISSN: 2455-6939
Volume:02, Issue:05
www.ijaer.in Copyright © IJAER 2016, All right reserved Page 1461
level with elasticities of 2.910 and -0.107 respectively. The coefficients of Age of household head (Years) and Household size (Number of persons) are positive but not statistically significant at level, they are not main determinants of income of SHGs. Moreover, the coefficient of determination (R2) is equal to 0.99; it indicates that 99 percent of changes in SHGs farm income can be explained by the selected indicators employed in the model while remaining 0.1 are explained by of factors which are not included in the model.
The multiple linear regression estimates results presented in table 5.9 indicated that maize production (kg) coefficient is 174.521 positive and statistically significant at 1 percent level of significance. It means that one percent increase in maize production (kg) output will cause SHGs income from maize cultivation to increase by 174.521. Though, the contribution of maize production output to total income of SHGs in Huye district is due to the use of improved seeds, loan facilities from bank and fertilizers. Price of maize production (Rwf/Kg) affects farm income of SHGs positively. The coefficient of Price of maize production (Rwf/Kg) is 543.433 statistical significant at 1 percent level of significance; this implies that 1 percent increase in Price of maize production (Rwf/Kg) lead to rise in farm income of SHGs by 543.433 percent. Thus, this positive relationship is due to decrease in cost of production; this reduction of cost of production is due to the government policy for agriculture sector. Among these policies include provision of fertilizers at low cost, improved seeds, technical assistance and bargaining capacity) given to the Farmers of SHGs. The result of the Maize Production cost affects income of SHGs negatively. Its coefficient is -0.107and is statistically significant at 5 percent level of confidence. Thus, one percent increase in the Maize Production cost reduces income of SHGs by 0.107 percent. It means that reduction of income of SHGs by Maize Production cost is caused by higher cost of inputs of production like labor cost, irrigation in case of insufficient rainfall or in dry season and oil price. In addressing this issue, government can keep providing subsidies to farmers in order to reduce and keep stability in cost of production and in due course decrease the price of agricultural output. The coefficient of Farm size is found to be positive 2.910 and statistically significant at 5 percent level of significance in determining income of SHGs. Its coefficient shows that one percent increase in farm size increases income of SHGs by 2.910. It is main determinant of income of SHGs. Thus, the government policies should work to increase cultivation land through programs land use consolidation and urbanization. As a consequence, maize production increases and SHGs get more benefits; which help them to save and get access to loan facilities from bank.

International Journal of Agriculture and Environmental Research
ISSN: 2455-6939
Volume:02, Issue:05
www.ijaer.in Copyright © IJAER 2016, All right reserved Page 1462
Age of household head and Household size are positive but not statistically significant. This explains that these variables are not main determinants of income of SHGs engaged in maize cultivation. The main reason is that SHGs members are coming from different families and also with different age.
The Table 5.10 shows the test of Multicollinearity by the use of VIF test, based on the coefficients output collinearity statistics, obtained respective values of VIF are between 1 and 10, it can be concluded that there is no Multicollinearity at all.
Table 5.10 Results for Multicollinearity testing
Model Unstandardized Coefficients
Standardized Coefficients
t Sig.
Collinearity Statistics
B Std. Error Beta Tolerence VIF
Constant -182742.828 56210.634 -
3251.000 0.002 Age 131.195 218.243 0.009 0.601 0.550 0.934 1.070 Family Size -1782.585 2006.576 -0.014 -0.888 0.378 0.901 1.110 Maize Production 1.677 0.132 0.727 12.686 0.000 0.065 1.500 Farm Size 3048.199 498.091 0.121 6.120 0.000 0.543 1.842 Price 597.554 327.793 0.027 1.823 0.976 0.976 1.025 Cost 1053.792 226.306 0.273 4.656 0.000 0.061 1.263
a. Dependent Variable: Total Value of Income from the farm
6. SUMMARY, CONCLUSIONS AND RECOMMENDATIONS
6.1 Introduction
This chapter gives summary of major findings, conclusion and recommendation. And it is subdivided into three sections. The first section covers the summary of findings; the second section gives the conclusion of the study and the last section talks about the major points of recommendations based on the results of the study.
6.2 Summary
The research examined the contribution of Self Help Groups in enhancing the smallholder maize farmer’s income in Huye District, Rwanda. Data were collected through a field survey conducted

International Journal of Agriculture and Environmental Research
ISSN: 2455-6939
Volume:02, Issue:05
www.ijaer.in Copyright © IJAER 2016, All right reserved Page 1463
in conducted in July and August 2015 from a random sample of 75 smallholder maize producers’
members of SHGs. The paired- samples t test have been used to compare the savings, and the production before joining SHGs and after joining the SHGs. The models have been developed for the main factors of productions, for the farm income and to see the role played by the production on savings of smallholder farmers who joined the SHGs. The findings showed the great role of SHGs in improving the farm production and income of smallholder farmers through the increase of their skills and access to agriculture information and use of required inputs in farm production.
The study clearly proved that SHGs have surely helped the farmers to enhance their economic resource base by improving their micro savings and banking habits. It has also helped them to increase their farm income and contribute to their socio economic development. In general it could be said that this has helped to improve the standard of living of the SHG members like moving from poverty indirectly a step towards economic development of smallholder farmers. The results of this study show that the farmers SHGs have positively contributed on the use of inputs such as improved maize seed and fertilizer, and that yields increases. The SHG has been seen as a major source of information in smallholder maize farmers. The study also shows that farmer’s self-help groups are very important for small-scale farmers. They successfully tap the insufficient financial resources and help build funds, which meet credit demands among poor rural farmers.
6.3 Conclusion
In conclusion, farmers Self Help Groups in the study area have contributed in enhancing the income among the farmers members of SHGs through the increase of production and the economic activities played by these SHGs like savings and working with SACCO for getting loans and all this for input acquisition and the capacity building of the farmers members of SHGs has played a big role in development of these smallholder maize producers. This study agrees that the smallholder farming sector can contribute the development goals set out by the government of Rwanda. However, the contribution of Farmers SHGs should be seen in the light of the historical context of African farming in rural areas and the apparent constraints towards production. However, the success of an expanded smallholder sector will be dependent on various factors such as targeted support programs which are both sustainable and reliable. Finally, despite the limited scope of the study as the results are based on a relatively small sample size, the findings of this thesis research contribute immensely to the limited body of knowledge on farmers’ SHGs and their benefits in Rwanda. In particular, our findings show that
providing support to farmers’ SHGs is important for the intensification and development of

International Journal of Agriculture and Environmental Research
ISSN: 2455-6939
Volume:02, Issue:05
www.ijaer.in Copyright © IJAER 2016, All right reserved Page 1464
smallholder agriculture in Rwanda through provision of improved farm inputs and output marketing.
Farmers’ Self Help Groups are indispensable in facilitating and enhancing farm production and incomes of smallholder farmers in Rwanda. Their potential for realizing pro poor economic grow can no longer be underestimated. However, despite their growing importance, studies on farmers’ SHG in Rwanda are limited and there is still very little in the scientific literature about the importance and impact of farmers’ SHG in Rwanda. This study was set out to fill in the gap
on assessing the contribution of farmers’ SHG in Rwanda. In this respect, the key issues were
addressed in the current research: the economic role of SHGs to the smallholder farmers, Savings, production and change of living standards. These outcomes support the assertions in the farmer SHG literature that farmer SHGs provide a good platform for the provision of farm production inputs and marketing of output; this can immensely enhance farm productivity and increase farm income thereby contributing to the reduction of poverty.
From a policy implication perspective, this is crucial since the integration of smallholder farmers in the market-oriented production through farmer organizations can transform the rural economy through increased incomes. Improving agricultural productivity being one of Rwanda’s
agricultural policy priorities, farmers’ SHG can, in this respect, play an important role in improving the level of agricultural technology adoption and achieving better growth in the sector. In order to reduce poverty and improve food security in rural Rwanda, there is a need to support and promote farmer SHGs. Such approach should also be reinforced with investment in agricultural and transport infrastructure if farmer SHGs are to efficiently play their role and become market outlet for smallholder farmers in Rwanda.
6.4 Recommendations
The following are recommendations from the smallholder Maize farmers Self help groups in Rwanda, especially in Huye district:
1. Based on the finding in the study area, more effort should be put in grouping farmers into SHGs based on land proximity as this may facilitate their capacity building and land consolidation policy implementation;
2. To improve farmers saving, there is a great need to increase investment and thus employment in rural areas, especially in agriculture sector;
3. Encourage the economic development of the smallholder farmers through saving, internal lending and working with the SACCO;

International Journal of Agriculture and Environmental Research
ISSN: 2455-6939
Volume:02, Issue:05
www.ijaer.in Copyright © IJAER 2016, All right reserved Page 1465
4. The farmers should be encouraged to keep records also, they should be thought the recommended quantities of fertilizers and improved seed to use on their farms in order to achieve optimum yield;
5. Price and markets for the produce need a specific policy so that famers get profit from the production;
6. Raising awareness of the role of agricultural self help groups in reducing poverty and improving food security;
7. Assisting the development of agricultural self help groups’ capacities; 8. Supporting the development of enabling environment and better governance frameworks
for agricultural self help groups. 9. Research and development on self help groups should be strengthen in such way the
farmers can benefit fully the adhesion of SHGs in particular and the whole country in general.
REFERENCES
Ayalew Daniel. 2011. “Costs and Benefits of Land Fragmentation”. World Bank. Washington
DC.
Byerlee, D. and Heisey, P.W. 1996. “Past and Potential impacts of maize research in sub Saharan Africa: A Critical assessment”. Food Policy, 21 (3):255-277
Byerlee, D., De Janvry, A., and Sadoulet, E., 2009. “Agriculture for development : Toward a new paradigm.” Annual Review of resource Economics 1:15-31.
Coleman, B. E. 1999. “The impact of group lending in Northeast Thailand,” Journal of Development Economics, 60(1):105- 141.
Fernandez. 2000. “Farmer field schools and local agricultural research committees: Complementary platforms for integrated decision- making in sustainable agriculture.” ODI Agricultural Research and Extension Network: Network Paper No. 105.
Fischer, T and Sriram M. S .2012. “Beyond Micro credit: Putting Development Back into Micro finance”, Vistaar publications, New Delhi.
IFAD .2012. Enabling poor rural people to overcome poverty in Rwanda
MINAGRI .2010. “Strategic plan for agricultural transformation in Rwanda”: Main document.
Kigali: MINAGRI, 2010.

International Journal of Agriculture and Environmental Research
ISSN: 2455-6939
Volume:02, Issue:05
www.ijaer.in Copyright © IJAER 2016, All right reserved Page 1466
MINAGRI .2011. “Strategies for Sustainable Crops Intensification in Rwanda, shifting focus from producing enough to producing surplus”.
NISR. 2011. “Rwanda in statistics and figures 2011”. Kigali.
Robinson, M. S., 2002. “The microfinance revolution: Lessons from Indonesia”. Volume 2, World Bank Publications.