contribution of refractive errors to vision …
TRANSCRIPT

CONTRIBUTION OF REFRACTIVE ERRORS TO VISION IMPAIRMENT
IN THE ASHANTI REGION, GHANA
BY
CLEMENT AFARI
(STUDENT NO. 212561499)
SUBMITTED IN PARTIAL FULFILLMENT, FOR A DEGREE OF MASTER OF
OPTOMETRY IN THE DISCIPLINE OF OPTOMETRY IN THE SCHOOL OF
HEALTH SCIENCES, UNIVERSITY OF KWAZULU-NATAL, DURBAN.
SUPERVISOR: PROF. KOVIN NAIDOO
CO-SUPERVISOR: DR. ANGELA O. AMEDO
7th August, 2014

i
Declaration
I Clement Afari declare that this thesis is my original work and it has not been tendered in
for the award of any Diploma or Degree from any academic institution.
_______________
CLEMENT AFARI
DATE: 7th August, 2014

ii
Acknowledgements My profound gratitude to the following.
The Almighty God; for his wisdom, guidance and protection.
My supervisors; Prof. Kovin Naidoo and Dr. Angela O. Amedo for their supervision and
critique of this work. I stand in awe of your abilities.
I am also grateful to Pirindha Govender and Carrin Martin for editing the thesis and their
useful suggestions.
Sight Savers International and the African Vision Research Institute (AVRI) for funding this
research.
My wife for her emotional and physical support.
The District Health Directors and Disease Control Officers of Ashanti region, Ghana for
their corporation throughout the study.
To my research assistants- Ms. Rita Ohene Larbi and Drs. Augustine Dery, Dillys Amega,
Akua Asare-Ankomah- I am very grateful.
The Department of Optometry and Visual Science, Kwame Nkrumah University of Science
and Technology for the logistical support.
The staff of Discipline of Optometry and staff of AVRI such as Mr. Khathutshelo Percy
Mashige and Farai Chinanayi, UKZN for the immense support.

iii
Abstract Purpose: To determine the prevalence and causes of vision impairment with particular
emphasis on uncorrected refractive error (URE) in Ashanti region, Ghana. A baseline
vision impairment study in the Ashanti region is necessary to effectively plan for refractive
services and blindness prevention strategies.
Methods: A cross-sectional multistage cluster sampling was conducted in 24 communities
in Ashanti region, Ghana. A total of 1420 participants aged 18 years and above were
enumerated using a modified Rapid Assessment of Vision impairment (RAVI) protocol.
This was limited to unaided visual acuity (VA) using a Snellen chart at a distance of 6
meters, near binocular visual acuity and direct ophthalmoscopy for all participants after
obtaining an informed consent. The VA was repeated using a pinhole for participants with
VA ≤ 6/12. A non-cycloplegic refraction was done for those whose pinhole VA improved.
Near vision refraction was also assessed for each participant whose near vision was less
than N8. Simple proportions were used to compute the prevalence of vision impairment
and refractive error in the studied population. The results were analyzed using STATA 11.
Results: One thousand three hundred (1300) of those enumerated (1420), participated in
the study, a response rate of 91.5%. The mean age of the participants was 46.29 (CI 95%
45.29-47.29). The minimum age was 18 years and the maximum 99 years. Prevalence of
vision impairment was 16.15% (n= 210, 95% CI, 14.15 – 18.16). Refractive error was the
leading cause of vision impairment with 47.14% (n = 99, 95% CI of 40.33 - 53.9)
Conclusion: Refractive error was the main cause of visual loss in Ashanti region, Ghana.

iv
Table of Contents
Cover page Declaration ...................................................................................................................................... i
Acknowledgements ......................................................................................................................... ii
Abstract .......................................................................................................................................... iii
List of Figures ............................................................................................................................... viii
List of Tables ..................................................................................................................................ix
CHAPTER ONE - Introduction ........................................................................................................ 1
1.1 Introduction ........................................................................................................................... 1
1.2 Background ........................................................................................................................... 2
1.2.1 Vision impairment and Refractive Error ........................................................................... 2
1.2.2 Vision impairment and Refractive Error in Developing countries ..................................... 3
1.2.3 Vision impairment and Refractive Error in Ghana ............................................................ 4
1.3 Problem Statement ................................................................................................................ 5
1.4 Research Questions .............................................................................................................. 6
1.5. Aim and Objectives .............................................................................................................. 6
1.6 Definitions ............................................................................................................................. 7
1.7 Scope of Study ...................................................................................................................... 7
1.8 Study Structure...................................................................................................................... 7
CHAPTER 2. Literature Review ...................................................................................................... 9
2.1 Introduction ........................................................................................................................... 9
2.2 Methodological Review .......................................................................................................... 9
2.2.1 Age range ....................................................................................................................... 9
2.2.2 Visual Acuity range ....................................................................................................... 10
2.2.3 Examination .................................................................................................................. 10
2.3 Prevalence of Distance Vision Impairment .......................................................................... 12
2.3.1 Global Prevalence Rate ................................................................................................ 12
2.3.2 Prevalence of Vision impairment in Asia ....................................................................... 12
2.3.3 Prevalence of Vision impairment in Europe and North America .................................... 13
2.3.4 Prevalence of Vision impairment in Africa ..................................................................... 14
2.3.5 Prevalence of Vision impairment in Ghana .................................................................... 14
2.3.6 Trend in Age and Prevalence of Vision impairment ....................................................... 14

v
2.3.7 Trends in Gender and Vision Impairment ...................................................................... 15
2.4 Causes of Vision Impairment ............................................................................................... 15
2.4.1 Distant Vision Impairment ............................................................................................. 15
2.4.2 Risk Factors for Distance Vision impairment ................................................................. 15
2.4.3 Refractive Error ............................................................................................................. 16
2.4.4 Cataract ........................................................................................................................ 18
2.4.5 Glaucoma ..................................................................................................................... 19
2.4.6 Corneal Opacities ......................................................................................................... 19
2.4.7 Other causes ................................................................................................................ 19
2.5 Near Vision Impairment/Presbyopia .................................................................................... 19
2.5.1 Risk Factors for Developing Near Vision Loss .............................................................. 20
2.5.2 Prevalence of Near Vision impairment .......................................................................... 20
2.6 Global Burden of Vision Impairment .................................................................................... 21
CHAPTER 3. Methodology ........................................................................................................... 23
3.1 Introduction ......................................................................................................................... 23
3.2 Study Design ....................................................................................................................... 23
3.3 Study Area/Population ......................................................................................................... 23
3.4 Study Sample and Size ....................................................................................................... 26
3.5 Inclusion and exclusion criteria ............................................................................................ 26
3.6 Data Collection Instrument .................................................................................................. 27
3.7 Research Team and Pilot Study .......................................................................................... 29
3.8 Data Collection Process ...................................................................................................... 29
3.9 Data Management ............................................................................................................... 31
3.10 Data Analysis .................................................................................................................... 32
3.11 Reliability and Validity ........................................................................................................ 32
3.12 Ethical Consideration ......................................................................................................... 32
CHAPTER 4. RESULTS ............................................................................................................... 34
4.1 Introduction ......................................................................................................................... 34
4.2 Demographic Characteristics ............................................................................................... 34
4.2.1 Age Distribution ................................................................................................................ 34
4.2.2 Sex Distribution of Participants ......................................................................................... 35
4.2.3 Occupational Distribution of Participants .......................................................................... 35
vi
4.3 Prevalence of Distance Vision Impairment of Adults Aged 18 Years and above in the Ashanti Region (Objective 1). ................................................................................................................. 36
4.3.1 Age Distribution of Participants with Distance Vision Impairment...................................... 36
4.3.2 Sex Distribution of Participants with Vision Impairment .................................................... 37
4.3.3 Occupational Distribution of Participants with Vision Impairment ...................................... 37
4.4 Prevalence of Near Vision Impairment of Adults Aged 18 years and above in the Ashanti Region of Ghana (Objectives 2). ............................................................................................... 38
4.4.1 Age Distribution of Near Vision Impairment ...................................................................... 38
4.5.1 Age and Causes of Vision Impairment .............................................................................. 39
4.5.2 Sex Distribution of Causes of Vision Impairment. .......................................................... 40
4.5.3 Participants’ Occupation and Causes of Vision Impairment. ............................................. 40
4.6 Types of URE that Cause Vision Impairment in the Ashanti Region (Objective 4) ............... 41
4.6.2 Gender Distribution of Participants with Refractive Errors ................................................ 43
4.6.3 Occupational Distribution of Participants with Refractive Errors ........................................ 43
4.6.4 Distribution of Visually Impaired Participants Who had Refractive Error. ....................... 44
Table 4. 9 Distribution of visually impaired participants who had refractive error. ...................... 44
CHAPTER 5. DISCUSSIONS ....................................................................................................... 45
5.1 Introduction ......................................................................................................................... 45
5.2 Demographic characteristics ............................................................................................... 45
5.3 Prevalence of distance vision impairment of adults aged 18 years and above in the Ashanti Region (Objective 1). ................................................................................................................. 45
5.4 Prevalence of near vision impairment of adults aged 18 years and above in the Ashanti Region (Objective 2). ................................................................................................................. 46
5.5 Causes of vision impairment of adults aged 18 years and above in the Ashanti Region (Objective 3). ............................................................................................................................. 47
5.5.1 Refractive error ............................................................................................................. 47
5.5.2 Cataract ........................................................................................................................ 47
5.5.3 Other causes ................................................................................................................ 48
5.6 Types of uncorrected refractive errors that cause vision impairment in the Ashanti Region (Objective 4). ............................................................................................................................. 48
5.6.1 Refractive Error in Visually Impaired Participants .......................................................... 49
5.6.2 Refractive Error and Age ............................................................................................... 50
5.6.3 Refractive Error and Categories of Vision impairment ................................................... 50
CHAPTER 6. CONCLUSION ........................................................................................................ 51
6.1 Introduction ......................................................................................................................... 51
vii
6.2 Limitations ........................................................................................................................... 52
6.3 Recommendations .............................................................................................................. 53
6.4 Significance of Study ...................................................................................................... 53
APPENDIX ................................................................................................................................... 74
APPENDIX A ............................................................................................................................. 74
APPENDIX B ............................................................................................................................. 77
APPENDIX C ............................................................................................................................ 78
APPENDIX D ............................................................................................................................ 79
APPENDIX E ............................................................................................................................. 80
APPENDIX F ............................................................................................................................. 81

viii
List of Figures FIGURE 3. 1 DISTRICTS IN ASHANTI REGION. SOURCE: WIKIPEDIA (2013) ................................ 24
FIGURE 3. 2 FLOW CHART OF EXAMINATION PROCESS ............................................................ 31
FIGURE 4. 1 AGE DISTRIBUTION OF PARTICIPANTS .................................................................. 34
FIGURE 4. 2 SEX DISTRIBUTION OF PARTICIPANTS. .................................................................. 35
FIGURE 4. 3 OCCUPATIONAL DISTRIBUTION OF THE RESPONDENTS. .......................................... 35
FIGURE 4. 4 AGE DISTRIBUTION OF PARTICIPANTS WITH AND WITHOUT DISTANCE VISION
IMPAIRMENT. ................................................................................................................. 36
FIGURE 4. 5 OCCUPATION OF PARTICIPANTS WITH AND WITHOUT VISION IMPAIRMENT. ................ 37
FIGURE 4. 6 DISTRIBUTION OF CAUSES OF VISION IMPAIRMENT. ............................................... 39
FIGURE 4. 7 SEX DISTRIBUTION OF CAUSES OF VISION IMPAIRMENT. ......................................... 40

ix
List of Tables
TABLE 4. 1 SEX DISTRIBUTION OF PARTICIPANTS WITH VISION IMPAIRMENT. ............................... 37
TABLE 4. 2 AGE DISTRIBUTION OF NEAR VISION IMPAIRMENT. ................................................... 38
TABLE 4. 3 SEX DISTRIBUTION OF NEAR VISION IMPAIRMENT. ................................................... 38
TABLE 4. 4 AGE DISTRIBUTION OF CAUSES OF VISION IMPAIRMENT............................................ 39
TABLE 4. 5 OCCUPATION WITH RESPECT TO THE CAUSES OF VISION IMPAIRMENT. ...................... 40
TABLE 4. 6 AGE GROUP DISTRIBUTION OF REFRACTIVE ERROR. ................................................ 43
TABLE 4. 7 GENDER DISTRIBUTION OF PARTICIPANTS WITH REFRACTIVE ERRORS ...................... 43
TABLE 4. 8 OCCUPATIONAL DISTRIBUTION OF REFRACTIVE ERROR AMONG VISUALLY IMPAIRED. .. 43
TABLE 4. 9 DISTRIBUTION OF VISUALLY IMPAIRED PARTICIPANTS WHO HAD REFRACTIVE ERROR. . 44

1
CHAPTER ONE - Introduction
1.1 Introduction
The World Health Organization (WHO) estimates that approximately 285 million people
suffer from vision impairment globally, of which 90% live in developing countries, with
39 million being blind and 246 million have low vision (WHO, 2013c, Pascolini and
Mariotti, 2012). Vision impairment is defined by the WHO as visual acuity (VA) of worse
than 6/18 (WHO, 2013a) but other widely acceptable definitions of vision impairment
include VA 6/12 or worse (Naidoo et al., 2003, Kumah et al., 2013) and VA worse than
6/12 (Nangia et al., 2013, Abdull et al., 2009).
In developed countries, the major cause of vision impairment is age-related macular
degeneration (Kocur and Resnikoff, 2002), while in developing countries it is
uncorrected refractive errors (URE) (43%) (Pascolini and Mariotti, 2012). Cataract
continues to be the main cause of blindness in low and middle-income nations
(Pascolini and Mariotti, 2012), with the at-risk population being people aged fifty years
and above, as they account for 82% of the global blind population (Pascolini and
Mariotti, 2012). Fortunately, 80% of vision impairment is preventable or curable, with a
global reduction over the past 20 years despite an increasingly ageing population
(WHO, 2013c). Much of the reduction in vision impairment is due to the decrease in
infectious etiologies, such as the eradication of trachoma in Morocco in 2007 and
Ghana in 2008 (WHO, 2013c).
As with other developing countries, vision impairment affects the lives of many people in
Ghana, which became a signatory to VISION 2020-THE RIGHT TO SIGHT on 31st
October, 2000, thereby committing its government to work towards eliminating
avoidable vision impairment and blindness by the year 2020 (National Eye Care Unit,
2013). Despite the advances made in combating the infectious diseases that cause
vision impairment, many people are still affected by poor vision and blindness (National
Eye Care Unit, 2013) . This is particularly true in the Ashanti Region of Ghana, where
the adult population living in rural areas have limited access to eye care services, which
are mainly provided in urban areas (Amedo, 2014, Gyasi, 2006). Additionally, there has

2
not been any population–based prevalence study on vision impairment in adult in the
Ashanti Region. As a result, Research is therefore needed to identify the prevalence
and causes of visual impairment among adults and the proportion of vision impairment
attributable to refractive error. This resulted in the aim of this study being to establish
the contribution of uncorrected refractive errors to vision impairment in the Ashanti
Region, Ghana. The results of the study will provide baseline data for other vision
impairment studies in the region, add to the few vision impairment studies in Ghana, as
well as assist in planning eye care programmes, and developing policies and strategies
to reduce vision impairment locally and possibly nationally.
1.2 Background
Vision Impairment is a condition of the eye that can affect people of all ages, and results
in poor vision in one or both eyes. Due to the socio-economic impact of vision
impairment on an individual and country, various measures are being put in place to
reduce the prevalence of vision impairment globally (Smith et al., 2009). To effectively
reduce the prevalence of vision impairment, the various contributing factors and the
relative extent to which they each contribute to vision impairment must be well known
(Fotouhi et al., 2004). The classification of vision impairment and refractive error will be
detailed, followed by an overview of studies in developing countries.
1.2.1 Vision impairment and Refractive Error
The 2006 update of the International Classification of Diseases-10 by the WHO
recognizes the following presenting Visual Acuity classification as the levels of vision
impairment in either eye (WHO, 2013a):
Mild or No Vision impairment: 6/18 or better
Moderate Vision impairment: worse than 6/18 but less than and equal to 6/60
Severe Vision impairment: worse than 6/60 but less than and equal to 3/60
Blindness: worse than 3/60
Other widely acceptable definitions of vision impairment include VA 6/12 or worse
(Kumah et al., 2013, Naidoo et al., 2003) and VA worse than 6/12 (Nangia et al., 2013,
Abdull et al., 2009). Full discussion on definition of vision impairment will be presented
in Chapter 2 (2.2.2 Visual Acuity range)

3
Refractive error is a condition of the unaccommodated eye in which parallel rays from
infinity are not converged on the retina, causing a blur image. In hyperopia, the
refractive power of the eye may be insufficient or the axial length of the eye may be too
short, resulting in images forming behind the retina. In myopia, the refractive power of
the eye may be higher or the axial length of the eye may be too long, resulting in
images forming in front of the retina. In astigmatism, light is focused at different points in
different planes (Remington and Remington, 2012). The major cause of vision
impairment worldwide is refractive error and is easily corrected with lenses (Bourne et
al., 2013, Naidoo et al., 2010, Pascolini and Mariotti, 2012).
1.2.2 Vision impairment and Refractive Error in Developing countries
Uncorrected refractive error can have a significant impact in the life of the affected
individual in that it can result in loss of educational and employment opportunities and
impact on their quality of life (McIntyre et al., 2000). The paucity of country-specific data
regarding the prevalence of blindness and vision impairment in Africa led the WHO in
2004 to recommend that studies be conducted on the prevalence and causes of vision
impairment in sub-Saharan Africa (Resnikoff et al., 2004). This is particularly the case in
developing countries, where access to eye care services can be difficult where they are
available, where schooling facilities for people with disabilities are often limited, and
where the family provides the main support network.
Several studies in rural central India have revealed that uncorrected/under corrected
refractive error accounts for 33% of vision impairment (Marmamula et al., 2012b,
Marmamula et al., 2013c, Nangia et al., 2013, Nangia et al., 2012, Nangia et al., 2010).
In Prakasam District (Andrah Pradesh state), south India, 62% of all vision impairment
cases were due to refractive error (Marmamula, et al, 2013). A Pakistani national
blindness and vision impairment survey uncovered refractive error (43%) as the leading
causes of moderate vision impairment (Dineen et al., 2007). In a Bangladesh national
eye survey, cataract (74%) was the leading cause of blindness, followed by refractive
error (18.7%) and macular degeneration (1.9%) (Dineen et al., 2003).

4
The Liwan Eye Study, which was conducted in southern China, stated that the
incidence of vision impairment was 5.88%, with URE being the main (40.4%) cause
(Wang et al., 2013). It was reported that the leading cause of mild, moderate and severe
vision impairment in Baoshan District, Shanghai Province, China, was uncorrected
refractive error (Zhu et al., 2013). Cheng et al. (2013) reported that various geographical
regions in China have different prevalence rates, with a prevalence of 1.4% in east and
Central China, and 2.5% in western China. Overall, blindness and vision impairment
(after refractive correction) in China was 5.8% (Cheng et al., 2013). It was also reported
that optic atrophy, retinitis pigmentosa and diabetic retinopathy are the main causes of
serious vision impairment in the working age people in Europe (Kocur and Resnikoff,
2002).
In sub-Saharan Africa, Sherwin et al. (2012) estimated that the proportion of vision
impairment due to URE in adults ranged from 12.3% to 57.1%. A Nigerian national
blindness and vision impairment survey using a multistage stratified cluster random
sampling method found that URE was responsible for 57.1% of moderate (<6/18–6/60)
vision impairment (Abdull et al., 2009).
Work done by Naidoo et al. (2014) in a systematic review of 52 published and
unpublished population-based surveys indicated that in 2010, age-standardized
prevalence of moderate to severe vision impairment was estimated to be 4.0%, with a
95% Confidential Interval of 3.4 – 5.0. The main cause of moderate to severe vision
impairment (MSVI) was refractive error (45%) (95% CI 40.8 – 47.7). It was estimated
that West Africa had the highest prevalence of MSVI, with 4.1% in men (95% CI 3.3% –
5.4%), while Southern Africa had the lowest at 2.0% in men (95% CI 1.5% - 3.3%)
(Naidoo et al., 2014), with similar trends being observed in women (Naidoo et al.,
2014).
1.2.3 Vision impairment and Refractive Error in Ghana
Ghana is located in West Africa, and has approximately 25 million inhabitants, with
50.9% being urbanised (Ghana Statistical Service, 2012) . The Ghana Statistical
Service (2012), in its report of the 2010 census, stated that vision impairment is the

5
number one cause of disability in the country. The National Eye Care Unit was
established to achieve the aim of Vision 2020 in Ghana. Their aim was to eradicate
avoidable blindness/vision impairment by the year 2020. Most of its inhabitants rely on
public health services to provide for their health care needs, including optometry (WHO,
2013b). The country has two tertiary institutions that teach optometry, one being located
in Kumasi, Ashanti in the central, and the other in southern Ghana, their combined
annual output of trainees being an average of 50 (Boadi-Kusi et al., 2014). However,
the current ratio optometrist to population ratio is 1:82 000 instead of recommended 1:
10 000, severely limiting the accessibility refractive care for those in need (Boadi-Kusi et
al., 2014). This is compounded by the fact that most optometrist like other professionals
prefer to live in urban areas making it difficult for some people to have access to the
care they need (Gyasi, 2006). Additionally, while the current National Health Insurance
Scheme does provide eye testing services, it does not make provision for optical
devices. This all speaks to the reasons for the refractive error not being corrected, as
there are no services, people cannot access them or afford them.
In Ghana, uncorrected refractive error has also been found to be a leading cause of
reduced vision. In the Agona-Swedru District of the central region, uncorrected
refractive errors was found to account for 85.9% of vision impairment (VA of 6/12 or
worse) in 637 children (11- 18 years) (Ovenseri-Ogbomo and Assien, 2010). They
reported a prevalence of hyperopia of 5%, myopia 1.7% and astigmatism 6.6 %
(Ovenseri-Ogbomo and Assien, 2010). Refractive error has also been reported to be the
main cause of vision impairment in Tema, a city in Ghana (Budenz et al., 2012).
However, no adult population based studies have been done in the Ashanti Region.
The above challenges of skewed distribution of optometrist towards the urban centres,
lack of provision of optical aids under NHIS and lack of baseline data also holds true for
Ashanti Region.
1.3 Problem Statement
Geographically specific epidemiological research is required to address the problem of
vision impairment (Fotouhi et al., 2004) and to enable proper planning of eye care
programmes and strategies to reduce vision impairment (Dandona et al., 1999).
Reports from rural (Agona Swedru district) and urban (Tema, Accra, Kumasi) studies in

6
Ghana indicate that uncorrected refractive error is the main reason for vision impairment
(Budenz et al., 2012, Kumah et al., 2013, Ovenseri-Ogbomo and Assien, 2010). Among
causes of vision impairment, refractive error is known to be most amendable to
treatment and providing treatment could make the best public health impact (Resnikoff,
2002). Currently, there is little available data on vision impairment and its causes in
Ashanti region.
In the absence of recent research on the contribution of uncorrected refractive errors to
vision impairment among adults in the Ashanti Region of Ghana, it not possible to plan
appropriate services, know if enough people are being trained, and the right services
are being provided in the right places. This study therefore seeks to determine the
prevalence of vision impairment in adults aged 18 years and above in the rural Ashanti
Region of Ghana.
1.4 Research Questions
1. What is the prevalence of distance and near vision impairment of adults aged 18
years and above in the Ashanti Region?
2. What are the causes of vision impairment in the Ashanti Region?
3. What are the types of uncorrected refractive error that cause vision impairment
in the Ashanti Region?
1.5. Aim and Objectives
To establish the contribution of uncorrected refractive errors to vision impairment in the
Ashanti Region of Ghana
The study therefore had the following objectives:
1. To determine the prevalence of distance vision impairment of adults aged 18
years and above in the Ashanti Region.
2. To determine the prevalence of near vision impairment of adults aged 18 years
and above in the Ashanti Region.
3. To establish the causes of vision impairment in the Ashanti Region.
4. To establish the types of uncorrected refractive errors that cause vision
impairment in the Ashanti Region.

7
1.6 Definitions
The following definitions apply for this study:
Vision impairment (VI): presenting visual acuity of less than or equal to 6/12 in the better
eye (Kumah et al., 2013, Naidoo et al., 2003).
Near vision impairment: presenting near vision of N8 or worse in both eyes (Marmamula
et al., 2013b).
Myopia: refractive error greater or equal to an equivalent sphere (i.e. sum of the sphere
power and half of the cylindrical power) of -0.50 Diopters in the right eye after
subjective refraction.
Hypermetropia: refractive error greater or equal to an equivalent sphere of +0.50
Diopters in the right eye after subjective refraction.
Astigmatism: refractive error in the right eye of -0.75 and above of cylindrical power,
irrespective of the sphere power.
Refractive error: presenting visual acuity of 6/12 or worse in the better eye which was
correctable to 6/9 or better in the better eye as defined by Marmamula et al.,
(2013c).
Diagnoses of cataract was recorded if presenting VA for that eye was 6/12 or worse and
did not improve with pinhole or refraction and lens opacity, as well as poor red reflex
were observed during ophthalmoscopy. The cataract definition is similar to the
definition used by Marmamula et al. (2013c).
Due to the limited scope of the protocol, all other ocular conditions found among the
visually impaired where grouped under ‘Other causes’.
1.7 Scope of Study
The study is a cross-sectional community-based survey design. A modified version of
the rapid assessment of vision impairment (RAVI) was adopted (full review of RAVI
methodology was discussed in page 11-b. Rapid Assessment Examination). This
included visual acuity (VA) testing, pen torch examination, ophthalmoscopy, near vision
test and pinhole test for those with VA of 6/12 or worse in the better eye. Refraction was
done for those whose pinhole VA improved.
1.8 Study Structure
The thesis is divided into the following Chapters:

8
Chapter 2. Literature Review: reviews the literature about vision impairment and
refractive error.
Chapter 3. Methodology: presents the methods used to achieve the study’s objectives
and outlines.
Chapter 4. Results: presents the results of the study with respect to the four objectives,
with the data being provided in tables and charts.
Chapter 5. Discussion: reviews the study results and discusses them with respect to
results found elsewhere.
Chapter 6. Conclusion: answers the research questions, presents the study limitations
and recommendations, and indicates future areas of research required.

9
CHAPTER 2. Literature Review
2.1 Introduction
This chapter is divided into five sections, the first presenting a methodological review,
these second outlining the trends in demographic parameters and vision impairment,
and the third reviewing the relevance of distance vision impairment. The fourth section
identifies the causes of vision Impairment (distant and near), and the last outlines the
global burden of vision impairment.
2.2 Methodological Review
A review of the studies done in the area of vision impairment and refractive error
revealed a myriad of methodological approaches to collect data. Factors such as age
range, visual acuity and the type of examination have an impact on the prevalence of
vision impairment, each of which will be reviewed.
2.2.1 Age range
The higher odds of developing vision impairment in old age (Abdull et al., 2009,
Freeman et al., 2010, Cheng et al., 2013, Marmamula et al., 2013a) is probably
because most of the causes of vision impairment are degenerative conditions which
develop overtime. Most vision impairment studies were conducted using adults aged 40
years and above (Abdull et al., 2009, Freeman et al., 2010, Cheng et al., 2013,
Marmamula et al., 2013a). Some data do exist for 3-16 year old (Kumah et al., 2013,
Naidoo et al., 2003, Woodhouse et al., 2013, Tarczy-Hornoch et al., 2013, Solebo and
Rahi, 2013, Schulze Schwering et al., 2013, Heijthuijsen et al., 2013). Nevertheless, the
justification for conducting studies in children cannot be over emphasized because a
child who is blind or vision impaired will have more disability years and may be hindered
in their development (Koberlein et al., 2013, Frick, 2012, Bourne et al., 2012). An
assiduous look at the trend of age range used in collecting data on vision impairment
caused by URE however, reveals an exclusion of the reproductive age group (18 to 39
years) even though t people in this age group in most regions of the world are in their
formative years; in school or among the working populace. Since vision is linked to
productivity, it is becoming more common for some current studies on vision impairment
and refractive error to include people of this age group (Freeman et al., 2013, Chan et

10
al., 2013b, Otulana, 2012). In fact some studies include all age groups including
children, young adults and adults in their studies (Otulana, 2012, Ntim-Amponsah,
2007).
2.2.2 Visual Acuity range
The essence of conducting vision impairment studies is to find out the proportion of the
population, at a given time, that cannot see well. Therefore, a lot depends on the cut off
of visual acuity used in the studies. An operational definition of vision impairment as
6/12 VA in the better eye in one study and 6/18 VA in another study of similar
population characteristics and same sampling technique would generate different
results. It stands to reason that the study involving 6/12 would generate higher
prevalence than that which uses 6/18.
It is worth noting that, to the best of the researcher’s knowledge, the WHO document
made no distinction of what is mild vision impairment from what is normal vision. This
created a vacuum with which different researchers in this area chose different limits to
classify mild and normal vision impairment. Some define vision impairment as visual
acuity less than 6/12 (Chou et al., 2013, Robinson et al., 2013, Budenz et al., 2012,
Ezelum et al., 2011, Nangia et al., 2012). Several other researchers use VA equal to or
worse than 6/12 (Chan et al., 2013b, Kumah et al., 2013, Naidoo et al., 2013, Abdull et
al., 2009). The later classification is much popular in research emanating from Africa
and more recent whereas the former classification is much common in studies from
North America. In fact, Nangia et al. (2013) in their study, reported visual acuity less
than 6/12 threshold as “United States standard” and VA of less than 6/18 as the WHO
standard.
2.2.3 Examination
Unlike a recommended standard for classifying vision loss using presenting VA or best
corrected VA by the WHO as discussed above; there seem to be no recommended
standard for eye examination involving vision impairment studies. The protocol for the
eye examination of consenting participants ranges from the comprehensive
methodology (Dilated fundus examination, Visual Field Test, Tonometry, full objective
and subjective refraction) to a simplified methodology using direct ophthalmoscopy and
a pinhole to determine the refractive status of the eye.
11
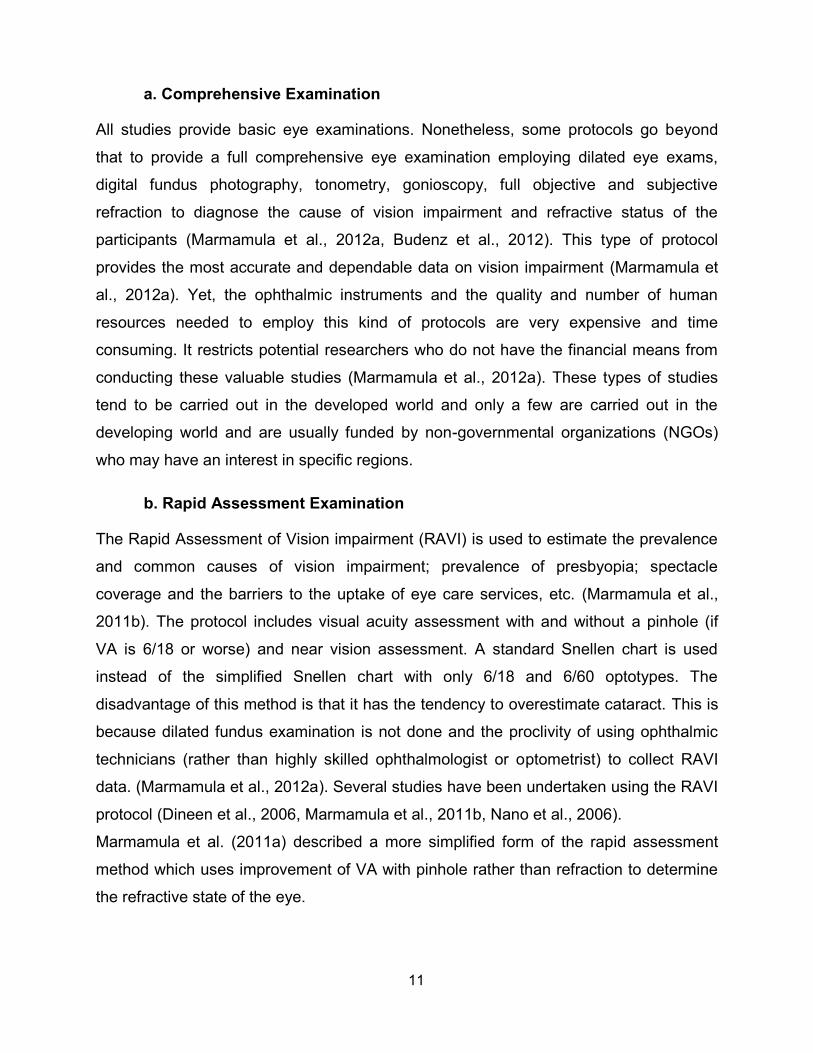
a. Comprehensive Examination
All studies provide basic eye examinations. Nonetheless, some protocols go beyond
that to provide a full comprehensive eye examination employing dilated eye exams,
digital fundus photography, tonometry, gonioscopy, full objective and subjective
refraction to diagnose the cause of vision impairment and refractive status of the
participants (Marmamula et al., 2012a, Budenz et al., 2012). This type of protocol
provides the most accurate and dependable data on vision impairment (Marmamula et
al., 2012a). Yet, the ophthalmic instruments and the quality and number of human
resources needed to employ this kind of protocols are very expensive and time
consuming. It restricts potential researchers who do not have the financial means from
conducting these valuable studies (Marmamula et al., 2012a). These types of studies
tend to be carried out in the developed world and only a few are carried out in the
developing world and are usually funded by non-governmental organizations (NGOs)
who may have an interest in specific regions.
b. Rapid Assessment Examination
The Rapid Assessment of Vision impairment (RAVI) is used to estimate the prevalence
and common causes of vision impairment; prevalence of presbyopia; spectacle
coverage and the barriers to the uptake of eye care services, etc. (Marmamula et al.,
2011b). The protocol includes visual acuity assessment with and without a pinhole (if
VA is 6/18 or worse) and near vision assessment. A standard Snellen chart is used
instead of the simplified Snellen chart with only 6/18 and 6/60 optotypes. The
disadvantage of this method is that it has the tendency to overestimate cataract. This is
because dilated fundus examination is not done and the proclivity of using ophthalmic
technicians (rather than highly skilled ophthalmologist or optometrist) to collect RAVI
data. (Marmamula et al., 2012a). Several studies have been undertaken using the RAVI
protocol (Dineen et al., 2006, Marmamula et al., 2011b, Nano et al., 2006).
Marmamula et al. (2011a) described a more simplified form of the rapid assessment
method which uses improvement of VA with pinhole rather than refraction to determine
the refractive state of the eye.

12
c. Questionnaires
There are several current studies that determined the prevalence rate by administering
only validated questionnaires without any eye examination (Freeman et al., 2013, Iliffe
et al., 2013, Freeman et al., 2010) including one study conducted in Upper East region
of Ghana (Akuamoah-Boateng, 2013). These studies make it clear that their rate are
based on self-reported visual loss. Compared to other methods described above, this
method is less suitable for planning purposes because some participants tend to over or
underestimate their visual difficulty as no visual acuity measurement is done. Moreover,
valuable data such as the cause of vision loss is not determined due to the fact that no
eye examination is performed (Freeman et al., 2013).
2.3 Prevalence of Distance Vision Impairment
Global causes of vision impairment are uncorrected refractive errors (myopia, hyperopia
or astigmatism representing 43 % of all vision impairment); un-operated cataract
representing 33% and glaucoma representing 2% (WHO, 2013c).
2.3.1 Global Prevalence Rate
Worldwide, about 285 million people suffer from vision impairment of which 39 million
are blind and 246 have low vision (WHO, 2013c). The prevalence of moderate to severe
vision impairment (presenting VA worse than 6/18 but equal or better than 3/6) globally
as reported by Stevens et al. (2013b) was 10.4% (95% CI, 9.5% - 12.3%) and blindness
(presenting VA of worse than 3/60), 1.9%. Several global studies of vision impairment
highlighted the wide disparity in the prevalence rate in different geographical regions
(Stevens et al., 2013b, Bourne et al., 2013, Pascolini and Mariotti, 2012) and different
income level of the world (Freeman et al., 2013). The highest prevalence rate of MSVI
in older adults was in South Asia (23.6%) but least (less than 5%) in Europe and North
America (Stevens et al., 2013b).
2.3.2 Prevalence of Vision impairment in Asia
Wang et al. (2013) reported an urban Southern China study, which was a prospective 5-
year study of the prevalence of blindness and vision impairment after conducting a
baseline comprehensive eye examination. Using the WHO and United States of
America (USA) definition of blindness (WHO VA < 3/60) and vision loss (WHO VA <6/18

13
to 3/60, USA VA < 6/12->6/60), the prevalence of vision impairment and blindness were
5.38% and 0.33% respectively (based on the WHO definition) and 9.85% and 1.42%
(based on the United States definition) (Wang et al., 2013). Similarly, Cheng et al.
(2013) also reported that prevalence of visual loss (less than 6/18) in mainland China
was 5.8%. This result was higher than regional geographical estimates of the
prevalence of vision impairment and blindness of 3.6% (95% CI 2.3 to 4.4) and 2.3%
(95% CI 1.7 to 2.8) respectively in East Asia (Wong et al., 2014b).
In South India, Marmamula et al. (2011b) reported that, the rural communities in the
Prakasam district (Andrah Pradesh state) recorded vision impairment prevalence of
30% (95% CI of 27.6% – 32.2%). The study was conducted among marine fishing
populace. Among the weaving communities of the same district however, prevalence
rate was 14% ( (95% CI,12.8 – 15.3) followed by cataract (Marmamula et al., 2013c).
Furthermore, in rural central India, the prevalence of vision impairment or blindness as
per the WHO definition was 22% ( 95% CI 21.1 - 23.5) and 17% when age standardized
(Nangia et al., 2013). These high prevalence rates corroborate the regional estimates of
23% in adult population in South Asia (Stevens et al., 2013b).
2.3.3 Prevalence of Vision impairment in Europe and North America
Most European data reports lower rates (less than 5%) compared to the global average
prevalence rate (10.4%) of vision impairment (Stevens et al., 2013a). .
In a Copenhagen City eye study involving 9980 adults (40 years and above),
prevalence rates of vision impairment and blindness were 0.66% and 0.20%
respectively (Buch et al., 2004). In a recent study among Spanish adults involving 213,
626 participants aged 15 years and above, the prevalence of vision impairment was
2.43% and 0.17% for blindness (Rius et al., 2013).
In the Reykjavik Eye Study in Iceland, prevalence of vision impairment and blindness
was respectively 1.0% and 0.6% and the five-year incidence was respectively 1.1% and
0.4% (Gunnlaugsdottir et al., 2013). The observed lower prevalence rate in Europe was
observed in North America. According to Robinson et al. (2013), the prevalence of
vision impairment in an urban Canadian town was 2.7% (95% CI, 1.8-4.0). The
14
prevalence of vision impairment was 7.5% (95% CI, 6.9 - 8.15) in the United States of
America. (Chou et al., 2013).These results in this high income region aligns well with
estimated prevalence rate of less than 5% as reported by Stevens et al. (2013b).
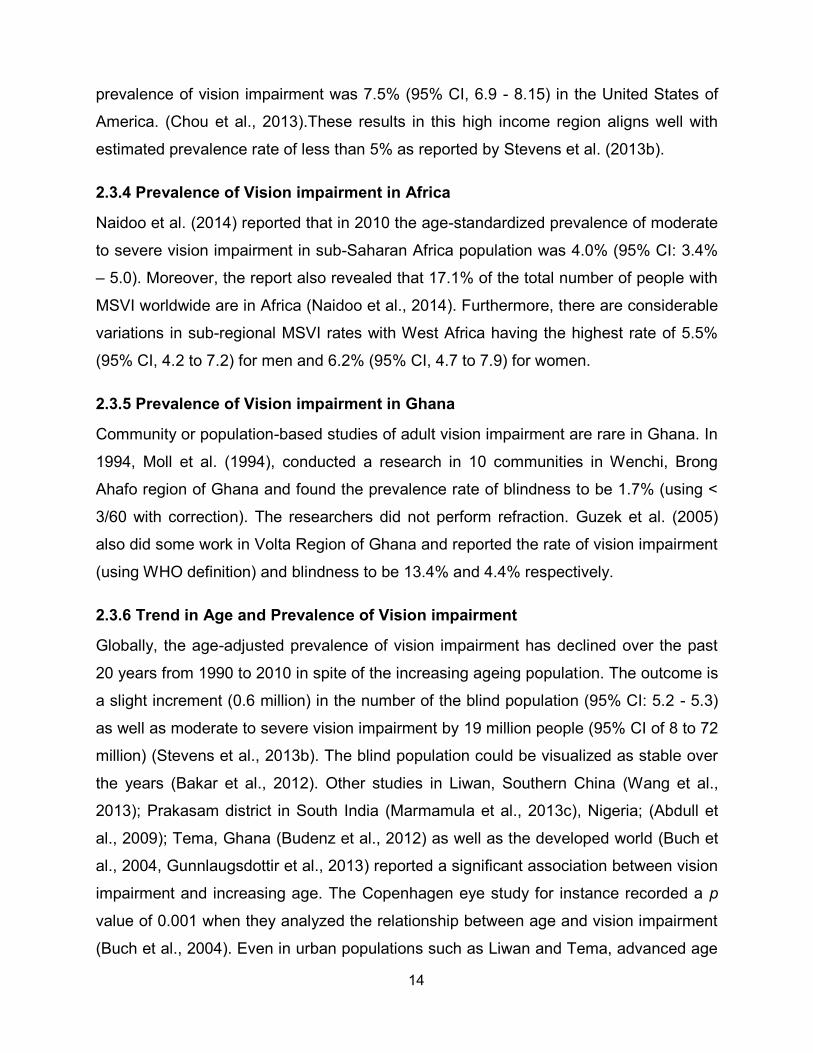
2.3.4 Prevalence of Vision impairment in Africa
Naidoo et al. (2014) reported that in 2010 the age-standardized prevalence of moderate
to severe vision impairment in sub-Saharan Africa population was 4.0% (95% CI: 3.4%
– 5.0). Moreover, the report also revealed that 17.1% of the total number of people with
MSVI worldwide are in Africa (Naidoo et al., 2014). Furthermore, there are considerable
variations in sub-regional MSVI rates with West Africa having the highest rate of 5.5%
(95% CI, 4.2 to 7.2) for men and 6.2% (95% CI, 4.7 to 7.9) for women.
2.3.5 Prevalence of Vision impairment in Ghana
Community or population-based studies of adult vision impairment are rare in Ghana. In
1994, Moll et al. (1994), conducted a research in 10 communities in Wenchi, Brong
Ahafo region of Ghana and found the prevalence rate of blindness to be 1.7% (using <
3/60 with correction). The researchers did not perform refraction. Guzek et al. (2005)
also did some work in Volta Region of Ghana and reported the rate of vision impairment
(using WHO definition) and blindness to be 13.4% and 4.4% respectively.
2.3.6 Trend in Age and Prevalence of Vision impairment
Globally, the age-adjusted prevalence of vision impairment has declined over the past
20 years from 1990 to 2010 in spite of the increasing ageing population. The outcome is
a slight increment (0.6 million) in the number of the blind population (95% CI: 5.2 - 5.3)
as well as moderate to severe vision impairment by 19 million people (95% CI of 8 to 72
million) (Stevens et al., 2013b). The blind population could be visualized as stable over
the years (Bakar et al., 2012). Other studies in Liwan, Southern China (Wang et al.,
2013); Prakasam district in South India (Marmamula et al., 2013c), Nigeria; (Abdull et
al., 2009); Tema, Ghana (Budenz et al., 2012) as well as the developed world (Buch et
al., 2004, Gunnlaugsdottir et al., 2013) reported a significant association between vision
impairment and increasing age. The Copenhagen eye study for instance recorded a p
value of 0.001 when they analyzed the relationship between age and vision impairment
(Buch et al., 2004). Even in urban populations such as Liwan and Tema, advanced age

15
remained a risk for vision impairment. The Tema eye study in Ghana and the Nigerian
study were done among people adults (40 years and above) and age was an important
risk for vision impairment and blindness (Budenz et al., 2012).
2.3.7 Trends in Gender and Vision Impairment
Generally, females have higher odds of developing vision impairment than males
(Bakar et al., 2012). A rather borderline statistical association (p value of 0.06) between
gender and vision impairment was recorded in the Prakasam district weaving
communities of southern India: females remained more at risk than males (Marmamula
et al., 2013c). A recent Spanish adult vision impairment study reported a finding similar
to the global picture in that vision impairment prevalence was highest among females
(Rius et al., 2013). In Africa, Naidoo et al. (2014) also reported same findings and
highlighted the fact that the prevalence rate disparity is getting worse. In Ghana, similar
trends have been discussed in population-based studies conducted by Budenz et al.
(2012), Guzek et al. (2005) and Moll et al. (1994) but the observed disparity was not
statistically significant.
2.4 Causes of Vision Impairment
There are various causes of near and distance vision impairment. Some factors though
not causal, are a notable risk. For instance, worldwide climate variation is not only an
important risk of presbyopia but also cataract and refractive error (Jaggernath et al.,
2013).
2.4.1 Distant Vision Impairment
Distance vision impairment is an issue worldwide because it renders people unable to
contribute effectively to the economic growth of their respective countries. There are
many causes of VI, the major ones being refractive error, cataract, glaucoma, corneal
opacities etc.
2.4.2 Risk Factors for Distance Vision impairment
Risk factors include: being female (Abdull et al., 2009), old age (Freeman et al., 2013,
Marmamula et al., 2013c, Chou et al., 2013), diabetes (Freeman et al., 2013, Al Ghamdi

16
et al., 2012) and poor socio-economic status (Cheng et al., 2013, Marmamula et al.,
2013c, Freeman et al., 2013).
2.4.3 Refractive Error
The increasing publication of URE as a major cause of vision impairment has created a
greater focus on the need to address issues of URE. In developed countries, there is a
shift of the major cause of vision impairment from URE to age-related macular
degeneration (Kocur and Resnikoff, 2002). “The Copenhagen eye study outlined the
following: Persons between ages 20 to 64 years, had myopia-related retinal disorders,
diabetic retinopathy, optic neuropathy, and retinitis pigmentosa as the most common
causes of impaired vision, whiles persons between ages 65 to 84 years, had cataract as
the most frequent cause of vision impairment. Age-related macular degeneration was
the main cause of blindness.” Thus, causes of vision impairment were dependent on the
age group (Buch et al., 2004). Similarly, in the Reykjavik Eye Study in Iceland, age-
related macular degeneration accounted for mainly severe vision impairment among the
middle and older-aged Icelanders (Gunnlaugsdottir et al., 2013).
Despite the slight shift in the developed world, the major cause (43%) of vision
impairment in the world still remains uncorrected/under corrected refractive error
(Pascolini and Mariotti, 2012). The prevalence of refractive error among the visually
impaired has been earlier addressed (was fully discussed in chapter 1 pages 11 to 14).
Global estimates shows that annually, the world economy loses $269 billion in
productivity due to URE (Fricke et al., 2012) and 640 million people are visually
impaired due to refractive error (Holden et al., 2008). However there are regional and
ethnic variations in the contribution of each type of refractive error to vision impairment.
The types of refractive error include myopia, hypermetropia and astigmatism.
a. Myopia
The commonest type of refractive error is myopia and it is a global public health
concern (Saw et al., 2005). Complications of myopia include retinal detachment,
glaucoma, macular degeneration and choriodal neovascularization. Several
theories such as near work (Yeo et al., 2013, Chan et al., 2013a) genetic factors
(Hysi et al., 2014, Verhoeven et al., 2013), peripheral refraction (Ip et al., 2007,

17
Smith et al., 2007), among others, have been espoused as the aetiologies of
myopia.
Prevalence of myopia among people with visual loss and blindness in Asia is
higher than the global estimate (Wong et al., 2014a) and one in four adults in
Europe and North America is myopic (Kempen et al., 2004). In Southern Africa,
Naidoo et al. (2003) reported a prevalence of 2.9% in children living in KwaZulu
Natal. In Ghana, similar vision impairment and refractive error study conducted in
Kumasi revealed that myopia was present in 3.4% of the children (Kumah et al.,
2013). The prevalence rate quoted in these studies may be higher in the general
population because rate of myopia increases with age (Kempen et al., 2004, Pan
et al., 2012, Naidoo et al., 2003). The most comprehensive refractive error study
conducted in West Africa, reported by Ezelum et al. (2011), studies reported a
crude prevalence of 16.2%. Participation of higher number of older people in the
study may account for the high crude prevalence rate.
b. Hypermetropia
Hypermetropia also called far sightedness or hyperopia is an important type of
refractive error. It significantly higher in women than men and prevalence rates
seem to increase with age till 50-59 years where the effect of nuclear sclerosis of
the crystalline lens decreases the prevalence rate (Haegerstrom-Portnoy et al.,
2014, Vincent and Read, 2014). In the most comprehensive population-based
adult refractive error study in Africa, Ezelum et al. (2011) revealed that the
prevalence of hypermetropia in Nigeria was 50.7% which was higher than rates in
Asia but similar to othe studies from European population. However, two most
comprehensive refractive error and vision impairment studies from the Africa
continent were from children population. They reported prevalence of
hypermetropia causing vision impairment (in at least one eye) of 0.3% (Kumah et
al., 2013) to 2.6% (Naidoo et al., 2003).

18
c. Astigmatism
Studies reporting prevalence of astigmatism are rare globally and in the Africa
continent because of the tendency of authors to report on spherical equivalents.
Three studies one from an adult population and two from children. The study
report from Ezelum et al. (2011) in National Eye Survey of Nigeria reported that
63% Nigerian adults were astigmatic. Kumah et al. (2013) revealed that
prevalence of astigmatism in one or both eyes was 13.7% in a Ghanaian children
population.
2.4.4 Cataract
Cataract, a disease of the eye, is the clouding of the clear, natural lens located in the
eye which causes it to loose its transparency and prevent sufficient light from reaching
the retina with eventual vision impairment (Truscott, 2005). The WHO describes
cataract as the second major cause of vision impairment in the world and also the
leading cause of blindness (51 %) in the world: It represents about 20 million people
(Pascolini and Mariotti, 2012). The majority of those who are blind live in developing
countries (Bourne et al., 2013, Stevens et al., 2013b). Cataract together -with age-
related macular degeneration has been described as the main cause of vision
impairment in Sri Lanka (Edussuriya, K, et al, 2009). The situation in Prakasam district
of Southern India and Liwan, an urban city in Southern China is similar (Wang et al.,
2013, Marmamula et al., 2011b).
Data from Africa and Ghana suggests cataract as the leading cause of blindness
(Guzek et al., 2005, Budenz et al., 2012, Pascolini and Mariotti, 2012). A study in
Nigeria revealed that cataract (43%) is the foremost cause of blindness (<3/60) (Abdull
et al., 2009). In the Tema eye study, cataract ranked high among the leading causes of
blindness and vision impairment that did not respond to refractive correction.
Irrespective of URE as the major cause of avoidable vision impairment and blindness,
cataract remains the foremost cause of vision impairment not correctable by refraction
(Budenz et al., 2012). This is reflective of poor cataract service delivery and
infrastructure since cataracts can be succesfully treated with surgery.
19
2.4.5 Glaucoma
Glaucoma is a group of conditions that cause progressive optic nerve head damage
with characteristic visual field loss (Thylefors and Negrel, 1994). It is the number one
cause of irreversible blindness in the world (Freeman et al., 2013, Pascolini and
Mariotti, 2012). The condition is more prevalent and severe in the black population
worldwide (Budenz et al., 2013, Friedman et al., 2006, Racette et al., 2003). In Ghana,
studies conducted by Budenz et al. (2013), shows the prevalence of glaucoma causing
vision loss (6.8%, 95% CI 6.2 – 7.4) is higher than that in South Africa - 5.3% (Rotchford
et al., 2003) and East Africa - 4.2% (Buhrmann et al., 2000), as well as in non-blacks.
2.4.6 Corneal Opacities
Opacities on the cornea cause the cornea to loose its transparency, thereby causing
visual loss through scattering of light rays reaching the retina or by completely blocking
it (Singh et al., 2013). It has been estimated that up to 2 million new cases of monocular
blindness are caused by this condition. In developing countries like India, it is estimated
that it is the fifth biggest cause of visual loss (Gupta et al., 2013, Whitcher et al., 2001).
The global estimate of the prevalence of corneal opacity causing vision loss is 1.0%
(Pascolini and Mariotti, 2012).
2.4.7 Other causes
Other causes of vision impairment vary geographically. For the developed world it is
Age - related Macula Degeneration (AMD), diabetic retinopathies and other retinal
disorders. Causes of vision impairment in developing country includes onchocerciasis,
uveitis, trauma etc (Pascolini and Mariotti, 2012, Freeman et al., 2013). In the near
future, AMD and other retinal conditions contribution to vision loss are likely to increase
because of increased life expectancy in the developing world (Bongaarts, 2009,
Pascolini and Mariotti, 2012).
2.5 Near Vision Impairment/Presbyopia
The progressive, physiological and age-related loss of the eyes ability to focus on near
object is called presbyopia (Remington, 2005, Patel and West, 2007). Currently, there is
no cure for the condition but it can be easily corrected by wearing spectacles or contact
lenses.
20
2.5.1 Risk Factors for Developing Near Vision Loss
Literature has identified presbyopia as the main cause of near vision impairment
(Holden et al., 2008, He et al., 2014). Risk factors for developing presbyopia such as
female gender (Duarte et al., 2003, Hashemi et al., 2012, Ikonne et al., 2010, Morny,
1995) and older age (Morny, 1995, Freeman et al., 2010, Hashemi et al., 2012) have
been reported. Studies viz. a multi-continent collaboration (He et al., 2014), from Fiji
(Brian et al., 2011) North America (Robinson et al., 2013) reported no relationship
between gender and risk of developing presbyopia. Moreover, near vision loss studies
conducted using a West Africa population seems to show that females develop
presbyopia earlier and have higher risk than men (Ikonne et al., 2010, Morny, 1995).
Older people have a higher risk of developing near vision problems because the
crystalline lens loses its elasticity over time (Truscott and Zhu, 2010). Some studies
report a strong relationship between heat and risk of developing presbyopia (Truscott
and Zhu, 2010, Weale, 2003, Jaggernath et al., 2013). Women’s excessive exposure to
heat might explain the observed higher risk because in West African cultural settings
women are disproportionally involved in activities such cooking and farming which
expose them to excessive heat.
In Ghana, little work had been done on near vision impairment. Kumah et al. (2011)
reported that out of 298 teachers (age 36 - 50 years) sampled in Kumasi metropolis,
68% of them had presbyopia. This data unfortunately cannot be extrapolated to the
adult population.
2.5.2 Prevalence of Near Vision impairment
The exact prevalence of this condition globally is not known but it has been estimated
that 1.04 billion are presbyopic (Holden et al., 2008) and it is projected to significantly
increase by 2020 (Ortner C., 2002). Globally, population-based studies of adults above
39 years and using a near VA cut-off of 20/40 revealed that the prevalence of
presbyopia ranges from 68.1% to 61.8%. In Oceania continent, data collected from
1223 individuals in Fiji, aged forty years and above reported a prevalence rate of 68.1
(Brian et al., 2011). In India, Marmamula et al. (2013b), reported the prevalence of

21
presbyopia to be 61.8%. In China,Lu et al. (2011) reported prevalence of 67.3%. Similar
high prevalence was reported in North America. It was reported from a Canadian urban
population-based study that the prevalence of presbyopia was 69.1% (Robinson et al.,
2013). In Africa, it was reported in Tanzania, East Africa that the prevalence was 62%
(Patel, et al., 2007).
Due to the positive link between age and the risk of developing presbyopia, it is
expected that studies conducted in a younger population would yield lower prevalence.
For instance a report from a study conducted among 15-50 years old in Zoba Ma’ekel,
Eritrea shows that prevalence of near vision impairment was 32.9% (Chan et al.,
2013b). But multi-continent population-based studies of adults 35 years and older
reported highest prevalence of 83% (from India, Asia and Durban, South Africa) and
lowest prevalence rate of 49% (from Niger, West Africa) (He et al., 2012). The disparity
in the rate may be due to the Niger study having a higher proportion of younger
participants.
2.6 Global Burden of Vision Impairment
As per studies conducted in over 70 countries, the burden of vision impairment differs
globally across low, middle and high income countries. Freeman et al. (2013) revealed
in their work that low income countries have a higher prevalence of vision impairment as
compared to high income countries. Freeman et al. (2013) also revealed that whereas
6% of people living in low income countries had some form of visual loss only 2% of
people in high income countries had visual loss.
Worldwide, it has been reported that vision impairment and blindness causes loss of
productivity and hence economic stagnation (Wittenborn et al., 2013) early mortality,
loss of weight (Koberlein et al., 2013), loss of earnings, poor quality of life (Tahhan et
al., 2013) and cognitive dysfunction (Ong et al., 2012). Wittenborn et al. (2013) also
reported more young people have visual loss than previously thought or reported and
that more than one third of total cost of eye disorders and vision impairment could be
incurred in young people less than 40 years.

22
Fricke et al. (2012) reported that in 2007, there were 158 million people who had
distance vision impairment. Fricke et al. (2012) also suggested that 28 billion US
dollars will be required to train the needed manpower, constructing and maintaining
refractive error programmes. Additionally, the estimated loss in global gross domestic
product due to refractive error was 269 billion US dollars (Fricke et al., 2012). Holden et
al. (2008) also revealed that 410 million people in the world could not perform optimum
near vision tasks due to presbyopia. They concluded that ameliorating the prevalence of
presbyopia in the world will require significant increase in resources targeted at primary
eye care service providers who in addition to having knowledge of refraction, could also
detect or diagnose permanent blinding conditions such glaucoma and diabetic
retinopathy.
Koberlein et al. (2013) reviewed 22 published articles on the global cost of vision
impairment and highlighted that the “mean annual expense” (MAE) cost of handling
blind people was two times higher than that of non-blind people. They also reported that
apart from the cost of admission, diagnoses and treatment; the cost of productivity loss
of caregivers is very high (US$ purchasing power parities 263 per week). Given that
there has been a yearly increase in cost of blindness and vision impairment worldwide;
the economic implications of vision impairment and blindness make this an urgent
public health matter (Frick, 2012).
23
CHAPTER 3. Methodology
3.1 Introduction
This chapter discusses mainly the operational definition of visual impairment and
blindness together with the method that was used for the collection of data and its
analysis.
3.2 Study Design
The study is a cross-sectional community-based survey design.
3.3 Study Area/Population
Multistage cluster random sampling was employed. Simple random method was
employed in the selection of three (3) districts and for each district, eight (8)
villages/towns were also selected through simple random method. The list of
towns/villages were obtained from the local district assemblies.
Ghana, located in West Africa, has approximately 25 million inhabitants, with 50.9%
being urbanized (Ghana Statistical Service, 2012) . The Ghana Statistical Service
(2012), in its report of the 2010 census stated that vision impairment is the number one
cause of disability in the country. There are two optometry schools, one ophthalmic
nursing school and one postgraduate college training in ophthalmology. All producing
an average of 50 optometrist, 10 ophthalmic nurses and 2 ophthalmologist a year. The
current optometrist to population ratio is 1:82 000 (Boadi-Kusi et al., 2014) and only 74
ophthalmologist in the country with 50% being in Accra, capital city of Ghana (Ministry
of Health, 2014) . About 40% of inhabitants assess medical care using national health
insurance scheme (NHIS) which in eye care covers refraction, visual field test, cataract
surgery, eyelid surgery, A- scan and keratometry (National Health Insurance Authority,
2014) .
The Ashanti Region of Ghana is the third largest administrative region in Ghana, and
lies between longitude 0.15W and 2.25W, latitude 5.5N and 7.6 N. It is made up of 27
districts, and according to the 2010 census, had a population of 4,725,046, constituting
19.5% of the national population, with females constituting 51.6%. The region covers a
land area of 24,389 kilometers square (km2) and has a population density of 194 per
sq.km (Ghana Statistical Service, 2012). Most of the inhabitants access health care
24
including eye care services using the NHIS making the region the number one user of
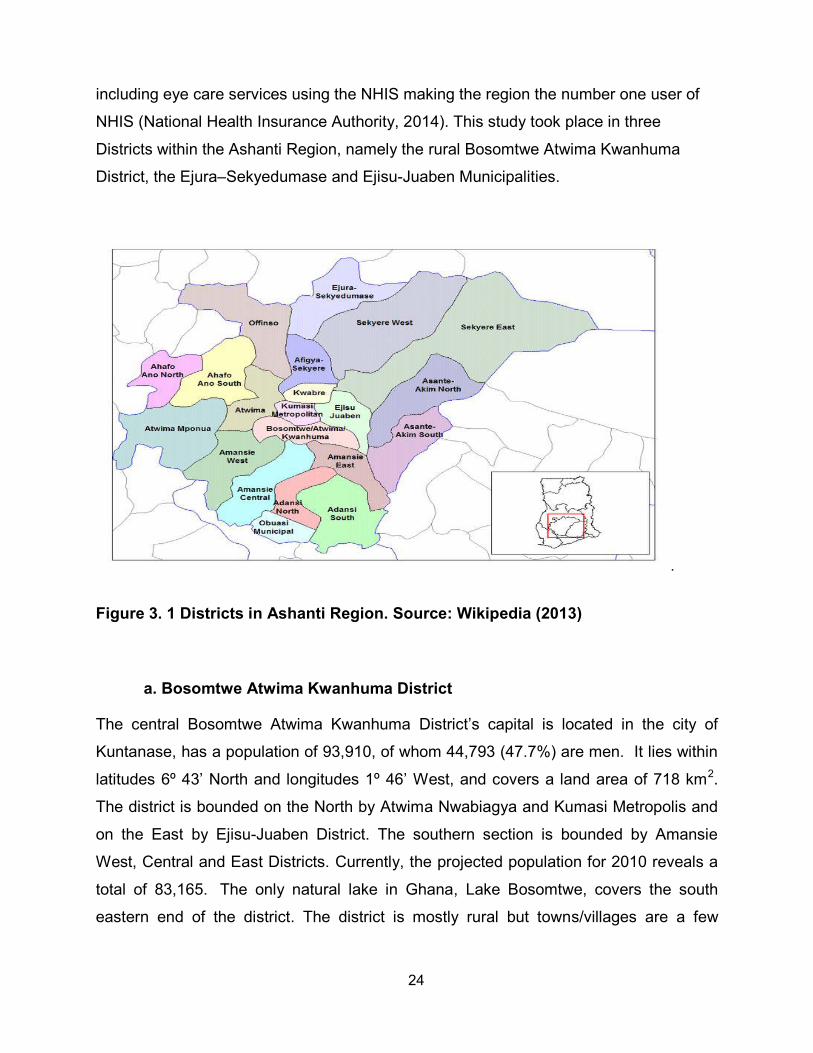
NHIS (National Health Insurance Authority, 2014). This study took place in three
Districts within the Ashanti Region, namely the rural Bosomtwe Atwima Kwanhuma
District, the Ejura–Sekyedumase and Ejisu-Juaben Municipalities.
.
Figure 3. 1 Districts in Ashanti Region. Source: Wikipedia (2013)
a. Bosomtwe Atwima Kwanhuma District
The central Bosomtwe Atwima Kwanhuma District’s capital is located in the city of
Kuntanase, has a population of 93,910, of whom 44,793 (47.7%) are men. It lies within
latitudes 6º 43’ North and longitudes 1º 46’ West, and covers a land area of 718 km2.
The district is bounded on the North by Atwima Nwabiagya and Kumasi Metropolis and
on the East by Ejisu-Juaben District. The southern section is bounded by Amansie
West, Central and East Districts. Currently, the projected population for 2010 reveals a
total of 83,165. The only natural lake in Ghana, Lake Bosomtwe, covers the south
eastern end of the district. The district is mostly rural but towns/villages are a few

25
kilometres apart. According to Ghana Statistical Service, (2012) most of the inhabitants
are farmers.
The District has 3 Health Centers; 3 Maternity Homes and 30 Clinics, which are
inequitably distributed (Ghana-Districts, 2013a). The biggest hospital in the district is the
St. Michael’s Hospital, which has a secondary level eye care facility. The facility has one
ophthalmologist, three optometrist and three ophthalmic nurses.
b. Ejura–Sekyedumase Municipality
The Ejura–Sekyedumase Municipality is located in the northern part of the Ashanti
region and is bounded in the north by Atebubu and Nkoranza districts (both in the
Brong Ahafo Region), on the west by Offinso district, on the East by Sekyere East
district and the South by Sekyere West and Afigya Sekyere District. The district is
located within longitudes 1˚5W and 1˚39’ W and latitudes 7˚9’ N and 7˚36’N,
covers an area of approximately 1,782.2 km2 (690.78 square miles) and is the fifth
largest district in the Ashanti Region’s. Its land size constitutes about 7.3% of the
region’s total land (Ghana-Districts, 2013b) and has a population of approximately
85, 446 (Ghana Statistical Service, 2012). Apart from the district capital Ejura and
the second largest town Sekyedumase which are semi urban towns, the rest are
rural. The district is characterized by scattered settlements with each villages far
apart. The district have two hospitals including the district hospital that has an eye
clinic manned by one optometrist and two ophthalmic nurses.
c. Ejisu-Juaben Municipality
Ejisu-Juaben municipal is one of the 30 administrative and political districts in the
Ashanti region of Ghana. The municipality is known globally for its rich cultural
heritage and tourists attractions notably the booming kente weaving industry. It
covers an area of 637.2 km2, constituting about 10% of the entire Ashanti Region
and with Ejisu as its capital. Currently it has four urban settlements namely, Ejisu,
Juaben, Besease and Bonwire. The total population is 143,762; made up of
68,648 males and 75,114 females. The municipality is located in the central part of
the Ashanti Region and provides enormous opportunity for creating an inland port
for Ghana to serve the northern section of the country. It lies within Latitude 1° 15’

26
N and 1 ° 45’ N and Longitude 6° 15’W and 7° 00’W. Ejisu-Juaben municipality
shares boundaries with six (6) other districts in the Region (Ghana-Districts,
2013c). The eye unit of Juaben hospital has one ophthalmologist, one optometrist
and three ophthalmic nurses.
3.4 Study Sample and Size
With a population of 4,725, 046 in the Ashanti region, vision impairment prevalence rate
of 3.75% from a published work by Kumah. et. al, (2013) in Children in Kumasi, Ashanti
region; 1.25% error margin, design effect of 1.5 and 90% enrolment rate the calculated
sample size was 1420. The prevalence rate from Kumah, et al, (2013) work was used
because it was the only available vision impairment study in the area and since
prevalence rate of vision impairment increases with age, using child eye health
prevalence would ensure that the lowest prevalence group is detected by the sample
size. The equation used was developed by Minassian (1997) in an article titled
“Epidemiology in practice: Sample Size Calculation for Eye Surveys”
Formula for calculating the sample size
n = A / (E^ (2) + (A/N))
Where:
A = 3.8416 PQW
n = minimum sample size required (approximate)
P = assumed population prevalence, in % (which was 3.75%)
Q = 100 - P
E = maximum acceptable random sampling error, in % (which was 1.25%)
W = the likely design effect (1.5)
N = population size (4,725, 046)
3.5 Inclusion and exclusion criteria
Male and female inhabitants of the study area who were 18 years or more where
enumerated. Each participant’s age was confirmed using the Ghana national voters’
identification card. Those younger than 18 years were excluded.

27
3.6 Data Collection Instrument
A designed questionnaire (Appendix A) was used to collect data on demographic
characteristics such as:
Demographic details: age, gender, occupation and address
Occupation was categorized as farmers, public servants, artisans, students,
unemployed and others
Six pieces of equipment were used to obtain the data needed to meet objectives 1, 2, 3
and 4, these being to determine the prevalence of distance and near vision impairment
of adults aged 18 years and older. These are:
Snellen Visual Acuity Chart
Pinhole
Near acuity chart
Welch Allyn Ophthalmoscope
Energizer pen touch
Head loupe magnifier
Details of how they were used to achieve the specific objectives are discussed below:
a. In determining the prevalence of distance vision impairment of adults aged 18
years and older in the Ashanti Region, three tests were done on all the study
participants, namely distance VA, and pen touch examination and
ophthalmoscopy. For those with VA equal or worse than 6/12, additional tests
such as pinhole VA and refraction were done. The test were done as described
below:
Visual Acuity (Test 1): a safe, confidential and well illuminated area of the house
was identified. The Snellen chart was securely fixed on wall and a six meter
precut robe used to demarcate the distance of the participant from the chart. The
visual acuity of the right was always tested first. The participants read tumbling
“E” letters of decreasing sizes. The VA was retested with a pinhole if the VA was
6/12 or worse.
Refraction (Test 2): An objective refraction was assessed using Welch Allyn
retinoscope with the patient fixating on the 6/60 optotype of the Snellen chat. The
28
retinoscopy was followed by a non cycloplegic subjective refraction using Shin
Nippon trail frame and trail lens set. Jackson’s cross cylinder was used to refine
the cylinders. Refraction was done monocularly with the right eye tested first.
Pen touch examination (Test 5): An energizer pen touch was used together with
the head loupe magnifier to examine the ocular adnexa. The eye lashes, eyelid
margins, cornea as well as the lens, were checked in that order for signs of
trachoma, trichiasis, corneal opacity or cataract.
Ophthalmoscopy (Test 6): A Welch Allyn Ophthalmoscope was used to examine
the anterior chamber, the lens, the vitreous chamber and the fundus for uveitis,
cataract or posterior segment eye disease through undilated pupil.
b. To determine the prevalence of near vision impairment of adults aged 18 years
and older in the Ashanti Region, two tests were done: near VA and near
refraction.
Near vision assessment (Test 3): Near vision assessment was done binocularly
using near chart (with tumbling “E”) placed at 40cm away from the patient.
Near Refraction (Test 4): Near refraction was done for only participants with near
VA worse than N8. For this test, age appropriate lens addition was used as
starting point with +0.25 Diopter lenses added until the participant could read
better than N8.
c. To establish the causes of vision impairment, two test were done and they are:
Pen touch examination (Test 5): An energizer pen touch was used together with
the head loupe magnifier to examine the ocular adnexa. The eye lashes, eyelid
margins, cornea as well as the lens, were checked in that order for signs of
trachoma, trichiasis, corneal opacity or cataract.
Ophthalmoscopy (Test 6): A Welch Allyn Ophthalmoscope was used to examine
the aqueous chamber, the lens, the vitreous chamber and the fundus for uveitis,
cataract or posterior segment eye disease through undilated pupil.

29
d. To establish types of URE that causes vision impairment in the Ashanti Region
of Ghana, the following tests were done:
Pinhole: the VA was retested with pinhole for all participants who read 6/12 or
worse Refraction (Test 2): An objective refraction was assessed using Welch Allyn
retinoscope with the patient fixating on the 6/60 optotype of the Snellen chat.
The retinoscopy was followed by a subjective refraction using Shin Nippon trail
frame and trail lens set. Jackson’s cross cylinder was used to refine the
cylinders. Refraction was done monocularly with the right eye tested first.
3.7 Research Team and Pilot Study
The research team included one enumerator, two research assistants and a fully
registered Optometrist as principal investigator (researcher). Prior to the survey, a five-
day rigorous training of the research team was conducted.
A pilot study was conducted in the Kwabere District of Ashanti Region, in a community
which was not part of the study area. The sample size for the pilot study was 200, with
the procedure for enumeration, recruitment (process of taking informed consent from
participants) and field examinations being done as per the main study protocol, with the
data obtained was not included in the main study result. Any challenges encountered,
as well as inter-observer variability in visual acuity measurement taken by the research
assistants and the principal investigator (PI) were noted. A kappa static of at least 0.7
was considered appropriate for the study. Only the researcher performed the main
examination as described in Fig 2 during the pilot study.
3.8 Data Collection Process
The study took place from 15th November, 2013 to 24th December, 2013. Households
were randomly selected by spinning a bottle at one end of the village to choose which
side of the village to begin enumeration. The households were then selected
consecutively. All eligible (18 years and above) people living in a selected households
were enumerated by the enumerator of the team. Age eligibility was confirmed by
participants showing their voters identity card. Each enumerated individual was taken
through the information sheet and all concerns addressed before eventual enrollment as
30
a study participant by the principal investigator. The consenting participants were
examined in their homes. The best illuminated area of the house was identified. Pre
formed six meter rope was used in determining the distance of the participants from the
chart. Those who chose not to consent to participation in the study but wanted to have
the free eye examination were examined free of charge. But such data was not included
in the study.
The research protocol is similar to the one implemented by Marmamula et al. (2011b)
and Oye et al. (2006). Once their personal details had been taken, each participant was
examined by the principal investigator using a modified Rapid Assessment of Vision
impairment (RAVI) protocol to correct the inherent drawback of the RAVI protocol
described earlier. The modification included performing ophthalmoscopy for all
participants and including young participants. This protocol involved taking informed
consent; demographic data; Unaided monocular VA using a Tumbling “E” Snellen chart
at a distance of 6 meters; near binocular visual acuity (the near acuity chart was placed
40cm from the participant) by the research assistants, pen torch examination and direct
ophthalmoscopy for all participants by the researcher. The VA was repeated using a
pinhole for participants with VA 6/12 or worse and a non-cycloplegic refraction was
done for those whose pinhole VA improved. Near vision refraction was performed for
each participant whose near vision was less than N8. The primary cause of vision
impairment was assigned for each participant with uncorrected visual acuity of 6/12 or
worse by the researcher. Moreover, the primary cause of vision impairment for each
participant was based on the World Health Organization (WHO) recommendation that
the primary cause should be the ocular condition that is most amenable to treatment
(WHO, 1988). Each form was checked for completeness by the researcher before the
participant left.

31
Figure 3. 2 Flow Chart of examination process
3.9 Data Management
Once the forms had been completed, they were collected and stored in locked briefcase
by the principal investigator and only the principal investigator had access to it. At the
Cluster and selection of the individuals
Procedure explained and informed
consent (appendix 1) taken from
participants
Personal and demographic information taken
Test 1: Distance visual acuity (DVA)
Unaided DVA worse or equal to
6/12 either eye. Vision impairment
Test 2: DVA assessment with pinhole/glasses if available
Unaided DVA better than 6/12
worse eyes. No Vision Impairment
No Improvement with pinhole
Test 4: Near vision assessment (Binocular)
Improvement with pinhole
Test 3: Refraction
Near vision of N8≥ (without glasses) Near vision of < N8 (without glasses)
Test 6: Pen torch examination and Ophthalmoscopy
Test 5: Near refraction
Assignment of primary cause of visual impairment /Referral

32
end of each day, the data was entered using Microsoft Access by the principal
investigator and the digital data stored on a password protected laptop of which only the
principal investigator had access to. Once the data was entered, the hard copy of the
forms where locked in the cabinet of Department of Optometry and Visual Science. The
hard copies will be locked for five years after which they will be machine shredded.
3.10 Data Analysis
The data was entered using Microsoft Access version 2013 by the principal investigator
and the file was converted into Microsoft Excel version 2013 which was to clean the
data. The completed and clean data was exported to STATA version 11 software which
was used to analyze the data.
The criteria identified in Chapter 1 were used to determine whether or not the
participants had distance, near vision impairments, cataract and/or refractive error.
Simple proportions were used to analyze the prevalence of vision impairment and
refractive error in the studied population. Fisher's exact test was used to compare the
prevalence of vision impairment due to refractive errors with the demographic
characteristics of respondents. Microsoft Excel version 2013 software was used to draw
the graphs and charts. Prevalence rates were calculated using simple proportion as
done by others (Kumah et al., 2013, Naidoo et al., 2003)
3.11 Reliability and Validity
The co-supervisor of the project visited the field to monitor and ensure reliability and
validity of the data. Data was entered in duplicate and accuracy of data was checked
using the append tool of STATA version 11.
3.12 Ethical Consideration
The following ethical considerations were observed:
Ethical clearance (BE 331/13) was obtained from the University of KwaZulu Natal’s
Biomedical Research Ethics Committee (BREC) (Appendix B), and Ghana Health
Service Ethics Review Committee (GHS-ERC 14/09/13) (Appendix C).
Permission was sought from the health directorates of the districts that were
involved in the research (Appendices D, E and G).
The political heads of a specific study area were informed and involved.

33
Members of the household were properly educated on the detailed examination
procedures that were to be carried out. Informed consent was then obtained from
each participant before enrollment. Thereafter, the details on the consent form
was also read to consenting participants in the language they understood best. For
every participant, the information sheet was read in the language (mostly in
English or the local language in Ashanti Region, “twi”) he/she best understood.
Once informed, the participants were allowed to voluntarily sign or thumb print the
consent form. A copy of the information sheet was given to each participant.
During consent process, it was made known to the participants that they could
voluntarily withdraw from the study at any time.
In gathering the data, none of the participants were identified by name and all data
gathered was kept under lock and key at Department of Optometry and Visual
Science (DOVS), Kwame Nkrumah University of Science and Technology
(KNUST), where they would be kept for five years after which they would be
machine shredded.
All participants with eye conditions were referred to the nearest eye clinic.

34
CHAPTER 4. RESULTS
4.1 Introduction
This chapter describes the results obtained after the various procedure described above
were carried out. The results are presented with respect to the four objectives after the
demographic details: demographic parameters of participants, prevalence of distance
vision impairment, prevalence of near vision impairment, causes of vision impairment
and refractive error in visually impaired. Most of the results were cross tabulated with
the participants’ demographic parameters of age, gender and occupation.
4.2 Demographic Characteristics
Of the 1,420 people who were enumerated, 1,300 were examined, providing a 91.5%
response rate. The mean age of participants was 46.29 (95% CI 45.29 - 47.29,
Standard Deviation (SD) ± 0.51). The minimum age was 18 years and the maximum
was 99 years. Completed data for all 1300 participants was available for analyses.
4.2.1 Age Distribution
In figure 4.1 below most of the participants were in the 18-39 year age group of (n=486,
37.38%) with slightly fewer (n=485, 37.31%) in the 40-59 age group and 20.85%
(n=271) in the 60-79 group with. The least represented group was the 80–99 group
(n=58).
Figure 4. 1 Age distribution of participants
37.38 37.31
20.85
4.46
0
5
10
15
20
25
30
35
40
18-39 40-59 60-79 80-99
PER
CEN
TAG
E O
F P
AR
TIC
IPA
NTS
, %
AGE GROUP, YEARS

35
4.2.2 Sex Distribution of Participants
There were more female participants as compared to males in all age range (Fisher’s
exact value, p = 0.026). The females accounted for 61.4% of the respondents while the
males made up 31.46% of the total number of participants (Figure 4.2).
Figure 4. 2 Sex distribution of participants.
4.2.3 Occupational Distribution of Participants
Almost half of the participants were farmers (46.62%) and less than 10% indicated that
they were unemployed (6.93%) (Figure 4.3). Of the 1300 people who participated, only
16.15% had any visual impairment.
Figure 4. 3 Occupational distribution of the respondents.
286 294
175
45
200 191
96
13
0
50
100
150
200
250
300
350
18-39 40-59 60-79 80-99
NU
MB
ER O
F P
AR
TIC
IPA
NT
AGE GROUP (YEARS)
Female Male
46.62%
9.15% 5.54% 6%
19.23%
6.93% 6.54%
0%
5%
10%
15%
20%
25%
30%
35%
40%
45%
50%
Farmers Artisans Publicservants
Students Traders Unemployed Others
PER
CEN
TAG
E O
F P
AR
TIC
IPA
NTS
OCCUPATIONS OF PARTICIPANTS
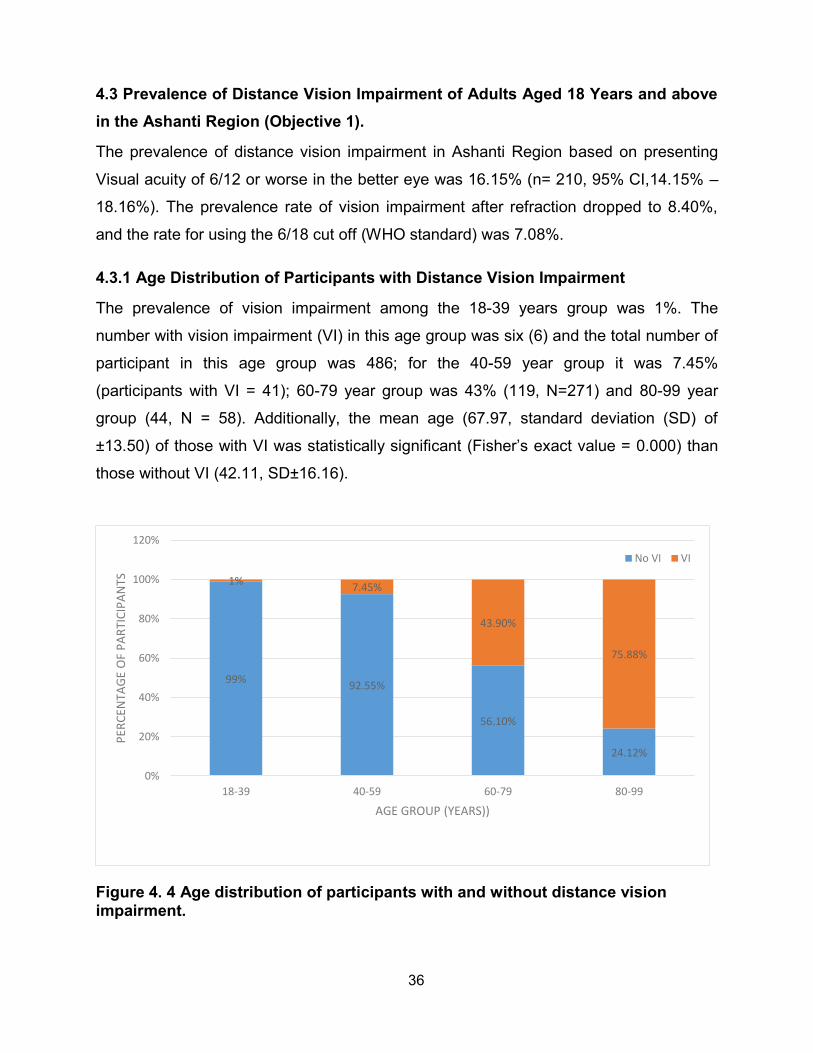
36
4.3 Prevalence of Distance Vision Impairment of Adults Aged 18 Years and above in the Ashanti Region (Objective 1).
The prevalence of distance vision impairment in Ashanti Region based on presenting
Visual acuity of 6/12 or worse in the better eye was 16.15% (n= 210, 95% CI,14.15% –
18.16%). The prevalence rate of vision impairment after refraction dropped to 8.40%,
and the rate for using the 6/18 cut off (WHO standard) was 7.08%.
4.3.1 Age Distribution of Participants with Distance Vision Impairment
The prevalence of vision impairment among the 18-39 years group was 1%. The
number with vision impairment (VI) in this age group was six (6) and the total number of
participant in this age group was 486; for the 40-59 year group it was 7.45%
(participants with VI = 41); 60-79 year group was 43% (119, N=271) and 80-99 year
group (44, N = 58). Additionally, the mean age (67.97, standard deviation (SD) of
±13.50) of those with VI was statistically significant (Fisher’s exact value = 0.000) than
those without VI (42.11, SD±16.16).
Figure 4. 4 Age distribution of participants with and without distance vision impairment.
99% 92.55%
56.10%
24.12%
1% 7.45%
43.90%
75.88%
0%
20%
40%
60%
80%
100%
120%
18-39 40-59 60-79 80-99
PER
CEN
TAG
E O
F P
AR
TIC
IPA
NTS
AGE GROUP (YEARS))
No VI VI

37
4.3.2 Sex Distribution of Participants with Vision Impairment
The total number of participants with vision impairment was 210 of which majority, 137
(65.2%), were females (Table 4. 1).
Table 4. 1 Sex distribution of participants with vision impairment.
Gender Prevalence in population
with vision impairment,%
Prevalence in
population,% (n)
Odd ratio (95% CI) P value
Male 34.8 5.61 (73) Reference
0.089 Female 65.2 10.54 (137) 0.8273 (0.60 -1.13)
4.3.3 Occupational Distribution of Participants with Vision Impairment
Of all occupations of the respondents the unemployed had higher proportion (42.22%) of visually impaired individuals (Figure 4.5).
Figure 4. 5 Occupation of participants with and without vision impairment.
95.8
80
94.44 89.2
57.78
100
70
4.2
20
5.56 10.8
42.22
0
15
0
20
40
60
80
100
120
Artisans Farmers Public Servants Traders Unemployed Students Others
PER
CEN
TAG
E O
F P
AR
TIC
IPA
NTS
, %
OCCUPATION
No VI VI
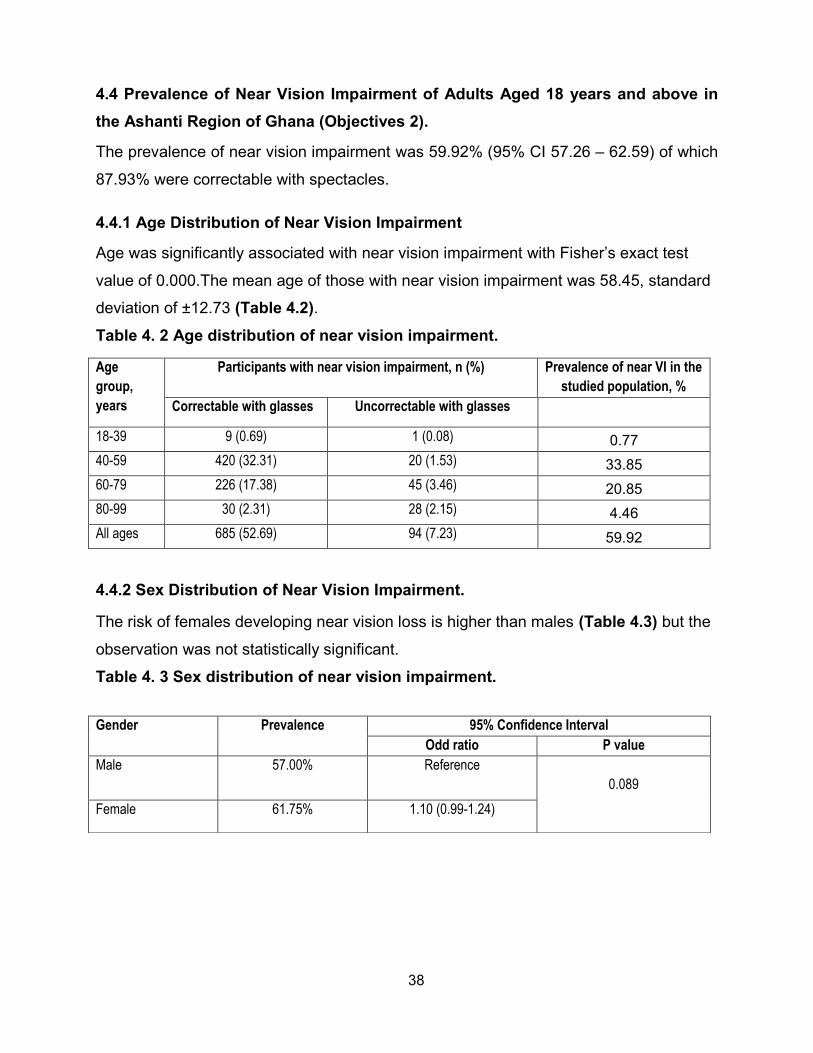
38
4.4 Prevalence of Near Vision Impairment of Adults Aged 18 years and above in the Ashanti Region of Ghana (Objectives 2).
The prevalence of near vision impairment was 59.92% (95% CI 57.26 – 62.59) of which
87.93% were correctable with spectacles.
4.4.1 Age Distribution of Near Vision Impairment
Age was significantly associated with near vision impairment with Fisher’s exact test
value of 0.000.The mean age of those with near vision impairment was 58.45, standard
deviation of ±12.73 (Table 4.2). Table 4. 2 Age distribution of near vision impairment.
Age
group,
years
Participants with near vision impairment, n (%) Prevalence of near VI in the
studied population, %
Correctable with glasses Uncorrectable with glasses
18-39 9 (0.69) 1 (0.08) 0.77
40-59 420 (32.31) 20 (1.53) 33.85
60-79 226 (17.38) 45 (3.46) 20.85
80-99 30 (2.31) 28 (2.15) 4.46
All ages 685 (52.69) 94 (7.23) 59.92
4.4.2 Sex Distribution of Near Vision Impairment.
The risk of females developing near vision loss is higher than males (Table 4.3) but the
observation was not statistically significant.
Table 4. 3 Sex distribution of near vision impairment.
Gender Prevalence 95% Confidence Interval
Odd ratio P value
Male 57.00% Reference
0.089
Female 61.75% 1.10 (0.99-1.24)

39
4.5 Causes of Vision Impairment in the Ashanti Region (Objective 3)
Refractive error was the leading cause of vision impairment with 47.14% (n = 99, 95%
CI of 40.33 - 53.9). Cataract was the second leading cause of vision impairment with
42.86% (n = 90, 95% CI of 36.10 - 49.61). Other causes of vision impairment
prevalence was 10.00% (n= 21, 95% CI of 5.90 – 14.09) (Figure 4.6).
Figure 4. 6 Distribution of causes of vision impairment.
4.5.1 Age and Causes of Vision Impairment
There was a strong (Fisher’s exact, p = 0.000) link between the cause of vision
impairment and the age group of the participants (Table 4.4).
Table 4. 4 Age distribution of causes of vision impairment
Age group, years Causes of Vision impairment, n (%) Prevalence of
vision impairment
in the studied
population, %
Cataract Refractive
error
Other
causes
All causes
18-39 0 (0) 2 (0.95) 4 (1.90) 6 (2.86) 0.46
40-59 6 (2.86) 31 (14.76) 4 (1.90) 41 (19.52) 3.15
60-79 56 (26.67) 55 (26.19) 8 (3.81) 119 (56.67) 9.15
80-99 28 (13.33) 11 (5.54) 5 (2.38) 44 (20.95) 3.38
All ages 90 (42.86) 99 (47.14) 21 (10) 210 (100.00) 16.15
42.86
47.14
10.00
0
5
10
15
20
25
30
35
40
45
50
Cataract Refractive Error Other causes
PER
CEN
TAG
E O
F P
AR
TIC
IPA
NTS
, %
CAUSES OF VISION IMPAIRMENT
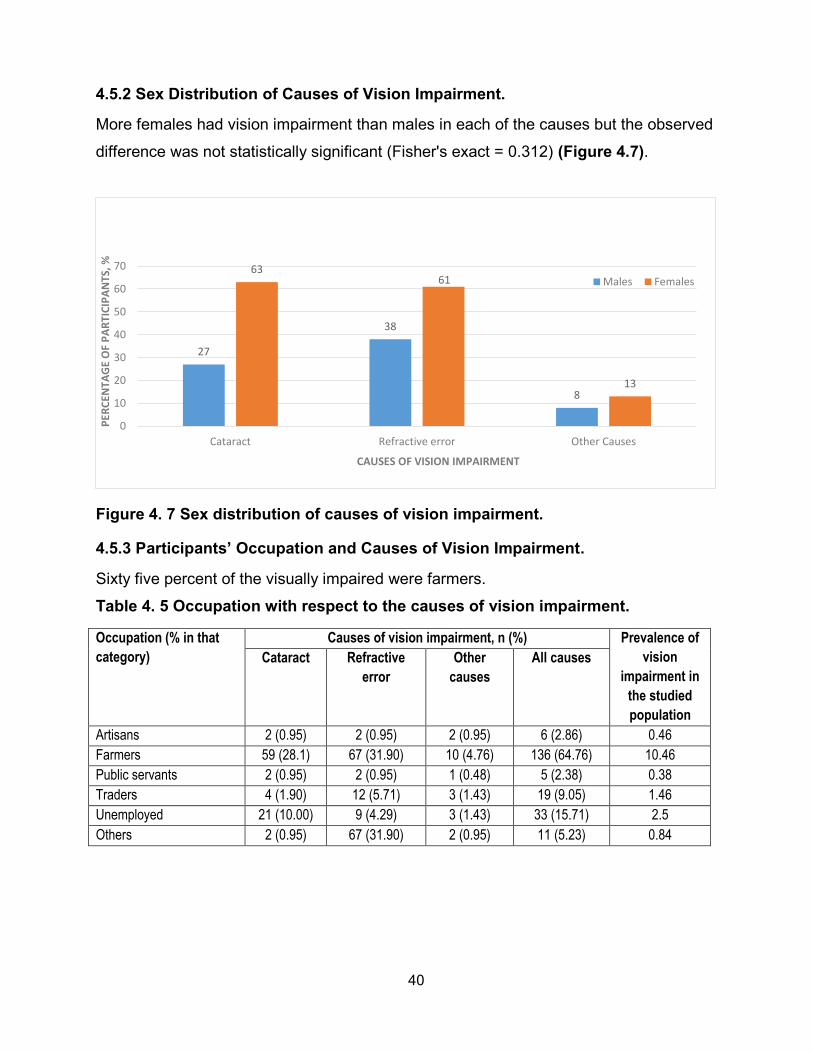
40
4.5.2 Sex Distribution of Causes of Vision Impairment.
More females had vision impairment than males in each of the causes but the observed
difference was not statistically significant (Fisher's exact = 0.312) (Figure 4.7).
Figure 4. 7 Sex distribution of causes of vision impairment.
4.5.3 Participants’ Occupation and Causes of Vision Impairment.
Sixty five percent of the visually impaired were farmers.
Table 4. 5 Occupation with respect to the causes of vision impairment.
Occupation (% in that
category)
Causes of vision impairment, n (%) Prevalence of
vision
impairment in
the studied
population
Cataract
Refractive
error
Other
causes
All causes
Artisans 2 (0.95) 2 (0.95) 2 (0.95) 6 (2.86) 0.46
Farmers 59 (28.1) 67 (31.90) 10 (4.76) 136 (64.76) 10.46
Public servants 2 (0.95) 2 (0.95) 1 (0.48) 5 (2.38) 0.38
Traders 4 (1.90) 12 (5.71) 3 (1.43) 19 (9.05) 1.46
Unemployed 21 (10.00) 9 (4.29) 3 (1.43) 33 (15.71) 2.5
Others 2 (0.95) 67 (31.90) 2 (0.95) 11 (5.23) 0.84
27
38
8
63 61
13
0
10
20
30
40
50
60
70
Cataract Refractive error Other Causes
PER
CEN
TAG
E O
F P
AR
TIC
IPA
NTS
, %
CAUSES OF VISION IMPAIRMENT
Males Females
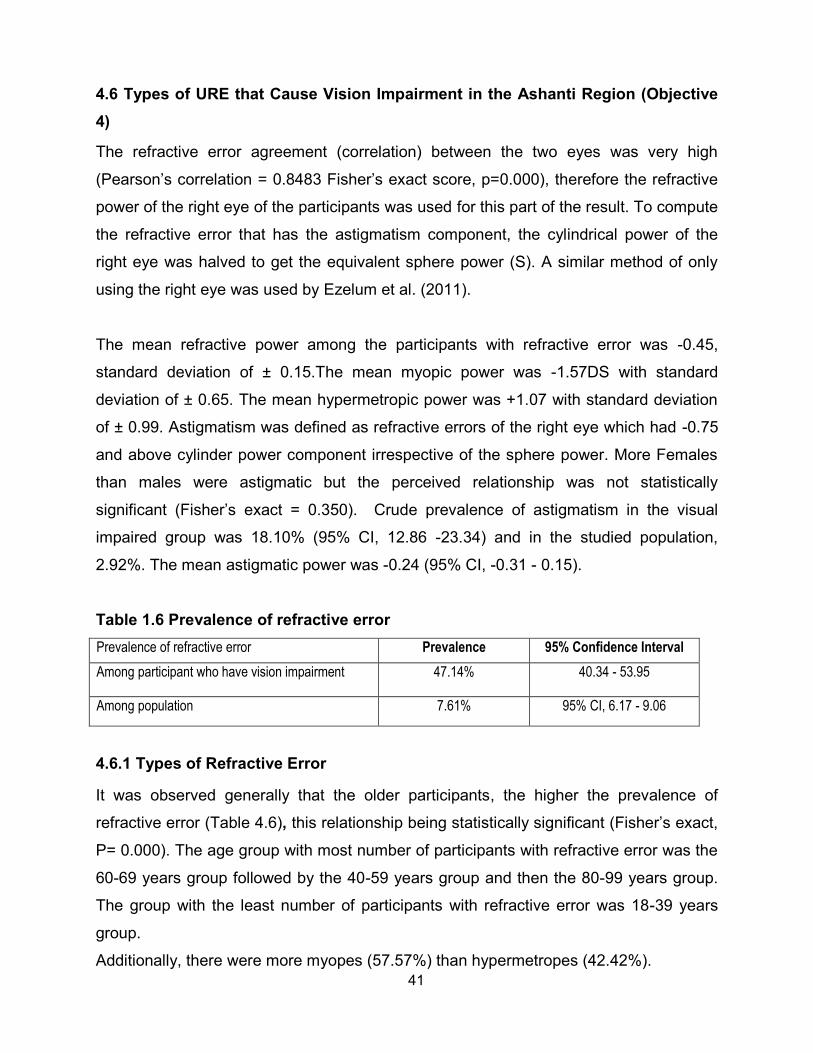
41
4.6 Types of URE that Cause Vision Impairment in the Ashanti Region (Objective 4)
The refractive error agreement (correlation) between the two eyes was very high
(Pearson’s correlation = 0.8483 Fisher’s exact score, p=0.000), therefore the refractive
power of the right eye of the participants was used for this part of the result. To compute
the refractive error that has the astigmatism component, the cylindrical power of the
right eye was halved to get the equivalent sphere power (S). A similar method of only
using the right eye was used by Ezelum et al. (2011).
The mean refractive power among the participants with refractive error was -0.45,
standard deviation of ± 0.15.The mean myopic power was -1.57DS with standard
deviation of ± 0.65. The mean hypermetropic power was +1.07 with standard deviation
of ± 0.99. Astigmatism was defined as refractive errors of the right eye which had -0.75
and above cylinder power component irrespective of the sphere power. More Females
than males were astigmatic but the perceived relationship was not statistically
significant (Fisher’s exact = 0.350). Crude prevalence of astigmatism in the visual
impaired group was 18.10% (95% CI, 12.86 -23.34) and in the studied population,
2.92%. The mean astigmatic power was -0.24 (95% CI, -0.31 - 0.15).
Table 1.6 Prevalence of refractive error Prevalence of refractive error Prevalence 95% Confidence Interval
Among participant who have vision impairment 47.14% 40.34 - 53.95
Among population 7.61% 95% CI, 6.17 - 9.06
4.6.1 Types of Refractive Error
It was observed generally that the older participants, the higher the prevalence of
refractive error (Table 4.6), this relationship being statistically significant (Fisher’s exact,
P= 0.000). The age group with most number of participants with refractive error was the
60-69 years group followed by the 40-59 years group and then the 80-99 years group.
The group with the least number of participants with refractive error was 18-39 years
group.
Additionally, there were more myopes (57.57%) than hypermetropes (42.42%).

42

43
Table 4. 6 Age group distribution of refractive error.
Age Range, years No. in age
range
Types of vision impairment, n (%) Percentage of
refractive error in
age group Myopes Hypermetropes Total
18-39 486 2 (2.02) 0 (0.0) 2 (2.02) 0.4
40-59 485 16 (1.6.16) 15 (15.15) 31 (31.31) 6.39
60-79 271 32 (32.32) 23 (23.23) 55 (55.55) 20.3
80-99 58 7 (7.07) 4 (4.04) 11 (11.11) 18.97
All age 1300 57 (57.57) 42 (42.42) 99 (100) 7.6
4.6.2 Gender Distribution of Participants with Refractive Errors
The odds ratio of female having refractive error was 1.19 (95% CI, 0.62 – 2.29) with males being the reference but the OR observed was not statistically significant (p value of 0.596).
Table 4. 7 Gender distribution of participants with refractive errors
Type of refractive error Gender Distribution, n (%)
Males, Females,
Myopia 22 (22.22) 35 (35.35)
Hyperopia 16 (16.16) 26 (26.26)
All refractive error types 38 (38.38) 61 (61.61)
4.6.3 Occupational Distribution of Participants with Refractive Errors
Farmers were most (67.67%) affected by refractive error followed by the traders
(12.12%).
Table 4. 8 Occupational distribution of refractive error among visually impaired.
Types of refractive
error
Occupation of participants with vision impairment, n (%)
Artisan Farmer Other Public
Servant
Trader Unemployed
Myopes 2 (2.02) 38 (38.38) 4 (4.04) 2 (2.02) 6 (6.06) 5 (5.05)
Hypermetropes 0 (0.00) 29 ( 29.29) 3 (1.43) 0 (0.00) 6 (6.06) 4 (4.04)
All refractive error types 6 (2.86) 67 (67.67) 7 (7.07) 2 (2.02) 12 (12.12) 9 (9.09)

44
4.6.4 Distribution of Visually Impaired Participants Who had Refractive Error.
Only two (2) individuals had severe to blind vision impairment caused by refractive error
and forty seven percent (47%) of the visually impaired, could have their vision restored
to normal by wearing the appropriate glasses.
Table 4. 9 Distribution of visually impaired participants who had refractive error.
Types of refractive
error
Categories of Vision impairment, n (%)
Mild Moderate Severe Blind
Myopia 38 (38.38) 17 (17.17) 1 (1.01) 1 (1.01)
Hypermetropia 30 (30.30) 12 (10.10) 0(0) 0 (0)
All refractive error types 68 (68.38) 29 (29.29) 1 (1.01) 1 (1.01)

45
CHAPTER 5. DISCUSSIONS
5.1 Introduction
This cross-sectional study has provided data on vision impairment prevalence and
causes as well as the statistical relationship between age, gender, occupation and
vision impairment. The results are discussed with respect to the demographic
characteristics and the four objectives of the study.
5.2 Demographic characteristics
There were more female participants as compared to males in all age range (Figure 4.
2).The females made up 61.4% of the respondents whilst the males were 31.46% of the
total number of participants (Fisher’s exact value = 0.026). The female to male ratio for
this study was similar to the age adjusted national census female to male ratio for
Ashanti region (Ghana Statistical Service, 2012) which also reported higher female
population. This trend is consistent with population based vision impairment studies in
Ghana (Kumah et al., 2013, Guzek et al., 2005, Budenz et al., 2012). The sampled
population is therefore an appropriate representation of the Ashanti region.
5.3 Prevalence of distance vision impairment of adults aged 18 years and above in the Ashanti Region (Objective 1).
The prevalence of distance vision impairment in the Ashanti region based on presenting
Visual acuity of 6/12 or worse in the better is 16.15% (n= 210, 95% CI,14.15% –
18.16%). This result is much lower than similar studies from the India subcontinent
where rates varied between 30% to17.1% (Marmamula et al., 2011b, Nangia et al.,
2013). But the rate is higher in studies from the developed world such North America by
Robinson et al. (2013); Chou et al. (2013) and also in Europe (Rius et al., 2013, Reidy
et al., 1998, Gunnlaugsdottir et al., 2013). It is very similar to studies from Africa by Oye
et al. (2006) (16.7%) as well as in Ghana (17%) - Budenz et al. (2012).
The number of people with vision impairment was significantly higher in older age
groups (Figure 4. 1). This trend is generally seen in all global estimates of vision
impairment (Resnikoff et al., 2004, Pascolini and Mariotti, 2012, Freeman et al., 2013)
and studies conducted in Ghana (Ntim-Amponsah, 2007, Guzek et al., 2005, Budenz et

46
al., 2012). Studies from the developed world had similar results (Buch et al., 2004,
Gunnlaugsdottir et al., 2013).
The reason for the observed relationship may be due to the fact that most eye diseases
such cataract glaucoma, hypertensive and diabetic retinopathy tend to be higher in
prevalence in later years. Therefore with advanced age, the prevalence rate is expected
to increase.
This study shows that females were more vision impaired than males (Table 4. 1).The
observed trend of more women being vision impaired than men may be because in
developing country like Ghana, women are less likely to seek eye care services
because they are economically disadvantaged than their male counter parts (Lewallen
and Courtright, 2002). Other cultural barrier, such as asking permission from a male
counterpart before accessing eye care services (as reported especially in rural Ghana)
may have played a role in the observed disparity (Asenso-Okyere et al., 1998).
Moreover the result is not surprising as it corroborates other studies conducted in
almost every continent (Zhu et al., 2013, Marmamula et al., 2013c, Hashemi et al.,
2012, Freeman et al., 2013, Abdull et al., 2009). The gap may widen if no initiatives are
rolled out to narrow or eliminate this disparity because women are more than men and
have higher life expectancy than men in the region (Ghana Statistical Service, 2012).
5.4 Prevalence of near vision impairment of adults aged 18 years and above in the Ashanti Region (Objective 2).
Near vision problem is known to occur in old age. This study shows prevalence of 59.92
(95% CI 57.26 – 62.59) which is low compared to other studies possibly because this
study included young adults (18 – 35 years) whilst others from Prakasam District, India;
reported 61.8% (Marmamula et al., 2013b) and Durban, South Africa, reported 77%
(Naidoo et al., 2013).

47
5.5 Causes of vision impairment of adults aged 18 years and above in the Ashanti Region (Objective 3).
The current study showed that refractive error is the major cause of vision impairment
accounting for 47.14% of the visually impaired but 7.62% of the total participants. This is
slightly higher than the global picture (43.3%) (Bakar et al., 2012, WHO, 2013c) but
similar to findings from various studies around the continent: Asia; (Marmamula et al.,
2012b, Marmamula et al., 2013c, Nangia et al., 2013, Nangia et al., 2012, Nangia et al.,
2010) and Africa (Abdull et al., 2009, Sherwin et al., 2012).
Even in Ghana, the situation is no different, judging from the existing adult population
based study - Budenz et al. (2012) reported 60%. This result does not compare
however, with results from various studies in the developed world (Kocur and Resnikoff,
2002, Bakar et al., 2012, Gunnlaugsdottir et al., 2013); a finding already established by
the WHO (WHO 2013b). In the developed countries, there is a shift of the major cause
of vision impairment from URE to age related macular degeneration (Kocur and
Resnikoff, 2002) possibly due to the availability of optometrists and refraction services.
5.5.1 Refractive error
Despite the slight shift in the developed world, the major (43%) cause of vision
impairment in the world still remains uncorrected/ under corrected refractive error
(Pascolini and Mariotti, 2012). The observed high rate of refractive error in this study
underscore the need for revamping the refractive components of eye care programmes
in the region and the provision of basic spectacles under the national health insurance
scheme.
5.5.2 Cataract
Cataract was the second highest (42.86%) condition causing vision impairment (Error!
Reference source not found.). This is similar to the global causes of vision impairment
(Pascolini and Mariotti, 2012) as well as findings from other studies (Wang et al., 2013,
Marmamula et al., 2011b, Edussuriya et al., 2009, Pascolini and Mariotti, 2012). This
result demonstrates the need for upscaling of cataract surgical services if the goal of
VISION 2020 are to be met in the region.

48
5.5.3 Other causes
Other causes of vision impairment such as diabetic retinopathy and other retinal
disoders, age related macular degeneration etc. may exist but due to the limited scope
of the protocol used in this study, differentiation of such conditions were not made.
There is a need for future research with sufficient funding to quantify this. Other ocular
diseases grouped under other causes includes two corneal scars and 1 phtisis bulbi.
Nonetheless, during the house to house data collection 10 (4.76%) visual impaired
individuals self-reported being glaucoma patients. They substantiated this by showing
prescribed anti–glaucoma medication.
The proportion of glaucoma may be underestimated in this study since gonioscopy,
visual field assessment and tonometry were not done.
5.6 Types of uncorrected refractive errors that cause vision impairment in the Ashanti Region (Objective 4).
Most of the visually impaired participants with refractive error were myopes (57%) (4.6.1
Types of Refractive Error
It was observed generally that the older participants, the higher the prevalence of
refractive error (Table 4.6), this relationship being statistically significant (Fisher’s exact,
P= 0.000). The age group with most number of participants with refractive error was the
60-69 years group followed by the 40-59 years group and then the 80-99 years group.
The group with the least number of participants with refractive error was 18-39 years
group.
Additionally, there were more myopes (57.57%) than hypermetropes (42.42%).
4.6.1 Types of Refractive Error
It was observed generally that the older participants, the higher the prevalence of
refractive error (Table 4.6), this relationship being statistically significant (Fisher’s exact,
P= 0.000). The age group with most number of participants with refractive error was the
60-69 years group followed by the 40-59 years group and then the 80-99 years group.
The group with the least number of participants with refractive error was 18-39 years
group.
Additionally, there were more myopes (57.57%) than hypermetropes (42.42%).

49
). This result is not surprising because majority (64%) of the visually impaired were
farmers. This result corroborates national and regional statistics that most workers in
Ghana are agricultural workers (Ghana-Statistical-Service, 2012). It was observed that
although not statistically significant, farmers had more refractive errors than other
workers. Because farming in Ashanti region is largely an outdoor activity, perhaps, the
relatively higher exposure to ultra violet (UV) light might explain the high rate. A review
of articles done on the effect climate change on eye health concluded that worldwide
climate variation is not only an important risk of presbyopia but also cataract and
refractive error (Jaggernath et al., 2013). Work by Saari and Aine (1984) also reported a
high prevalence of refractive error in agricultural workers in a Scandinavian population.
Ultra violet radiation from the sun may denature the delicate crystalline lens proteins,
resulting in lens nuclear sclerosis which consequently may lead to myopia (Jaggernath
et al., 2013, Truscott and Zhu, 2010). The observed lower rate of hypermetropia was
because most of participants with refractive error were more than sixty years old. It is a
well-known fact, that hyperopia prevalence rate seems to increase with age till 50-59
years (Haegerstrom-Portnoy et al., 2014, Vincent and Read, 2014). After age sixty,
nuclear sclerosis of the crystalline lens, causes the crystalline lens power to become
more negative and thereby decreasing the net hyperopic power of the eye.
5.6.1 Refractive Error in Visually Impaired Participants
Prevalence of refractive error in the general population was 7.6%.
Chan et al. (2013b), conducted a population based study in Eritrea with 3200
participants 15 to 50 years and found the prevalence rate of refractive error in the
population to be 6.4%.The work used the same 6/12 threshold but found lower rate.
This is probably due to the differences in population demographic characteristics and
the lower age of their respondents. Ntim-Amponsah (2007), did hospital based work in
Greater Accra, Ghana in subjects 6 years and older and found vision impairment
prevalence due to URE to be 4.8%. The lower rate found by (Ntim-Amponsah, 2007)
may be due to the hospital based nature of the study. Hospital based studies cannot be
reflective of the trend in the general population.
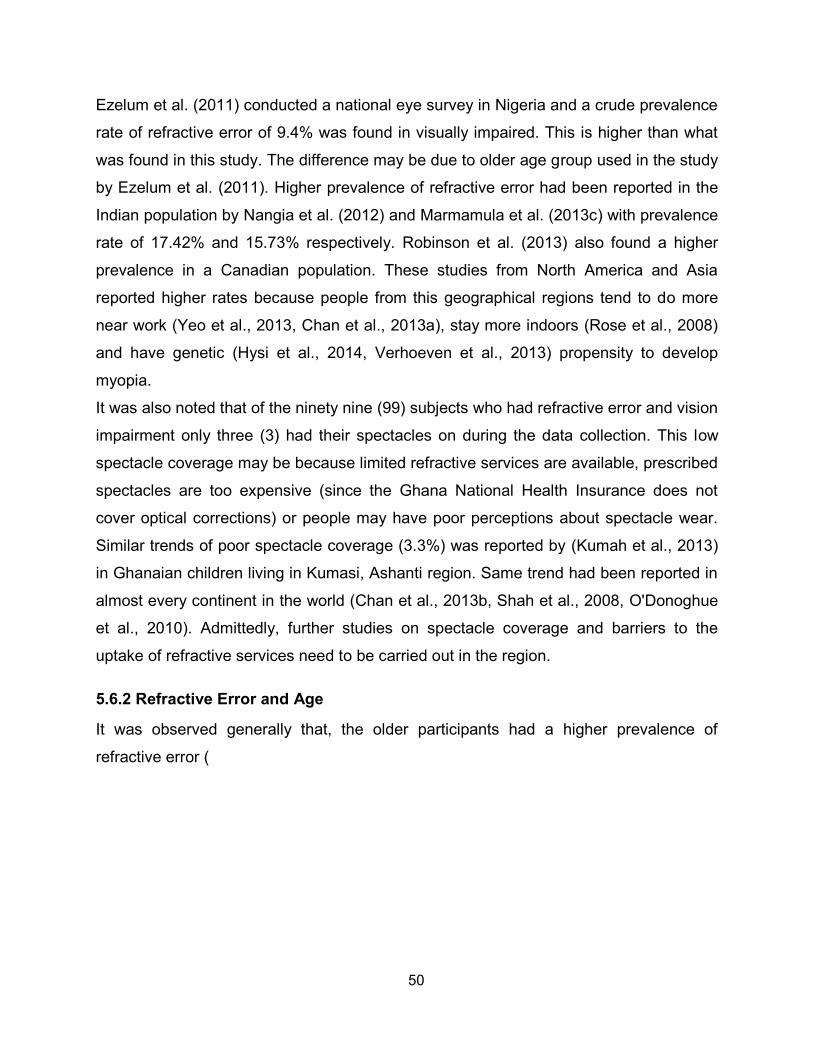
50
Ezelum et al. (2011) conducted a national eye survey in Nigeria and a crude prevalence
rate of refractive error of 9.4% was found in visually impaired. This is higher than what
was found in this study. The difference may be due to older age group used in the study
by Ezelum et al. (2011). Higher prevalence of refractive error had been reported in the
Indian population by Nangia et al. (2012) and Marmamula et al. (2013c) with prevalence
rate of 17.42% and 15.73% respectively. Robinson et al. (2013) also found a higher
prevalence in a Canadian population. These studies from North America and Asia
reported higher rates because people from this geographical regions tend to do more
near work (Yeo et al., 2013, Chan et al., 2013a), stay more indoors (Rose et al., 2008)
and have genetic (Hysi et al., 2014, Verhoeven et al., 2013) propensity to develop
myopia.
It was also noted that of the ninety nine (99) subjects who had refractive error and vision
impairment only three (3) had their spectacles on during the data collection. This low
spectacle coverage may be because limited refractive services are available, prescribed
spectacles are too expensive (since the Ghana National Health Insurance does not
cover optical corrections) or people may have poor perceptions about spectacle wear.
Similar trends of poor spectacle coverage (3.3%) was reported by (Kumah et al., 2013)
in Ghanaian children living in Kumasi, Ashanti region. Same trend had been reported in
almost every continent in the world (Chan et al., 2013b, Shah et al., 2008, O'Donoghue
et al., 2010). Admittedly, further studies on spectacle coverage and barriers to the
uptake of refractive services need to be carried out in the region.
5.6.2 Refractive Error and Age
It was observed generally that, the older participants had a higher prevalence of
refractive error (

51
Table 4. 6). This relation was statistically significant (Fisher’s exact, P= 0.000). This
finding is consistent with other studies conducted by (Robinson et al., 2013, Ezelum et
al., 2011, Marmamula et al., 2013c) that found a positive relation with age and refractive
error. More people in the age group of 60-79 years had myopia than the other age
groups probably because of nuclear cataracts. The observed relationship between
myopia and age had also been described in other studies in West Africa (Bekibele et al.,
2007, Ezelum et al., 2011), Asia (Dandona et al., 1999), Americas (Wu et al., 2005) and
in Ghana (Kumah et al., 2013). It was also noted that prevalence of hypermetropia
increased with age up to age group 60-79. This trend is consistent with studies done in
Asia (Saw et al., 2008, Shah et al., 2008); in Black Americans (Wu et al., 1999) and in
West Africa (Ezelum et al., 2011).
5.6.3 Refractive Error and Categories of Vision impairment
Only two (2) individuals had severe to blind vision impairment caused by refractive error
(Table 4. 9). However, 47.14% of the visually impaired could have their vision restored
to normal by wearing the appropriate glasses. This result corroborates the findings in
other studies done in Ghana (Ovenseri-Ogomo and Adofo, 2011, Ntim-Amponsah,
2007, Kumah et al., 2013, Budenz et al., 2012) that concluded that refractive error is the
leading cause of vision impairment in Ghana. The authors suggested that more
Optometrists were needed to be deployed in the public health system to prevent this
avoidable visual loss.

52
CHAPTER 6. CONCLUSION
6.1 Introduction
This study sought to assess the contribution of URE to Vision impairment in Ashanti
Region, Ghana. The study specifically determined the prevalence of distance and near
vision impairment of adults aged 18 years and above in the Ashanti region of Ghana;
the causes of vision impairment in the Ashanti region of Ghana; types of uncorrected
refractive errors that causes vision impairment in the Ashanti region of Ghana as well as
the relationship between age, gender and vision impairment. The following limitations,
conclusions and recommendations were made.
The prevalence of distance vision impairment in Ashanti region based on presenting
visual acuity of 6/12 or worse in the better is 16.15% (n= 210, 95% CI,14.15% –
18.16%). The number of people with vision impairment was significantly higher in older
age groups. This study shows that females were more vision impaired than males and
most of the visually impaired were farmers.
The prevalence of near vision impairment was 59.92% (95% CI 57.26 – 62.59) of which
87.93% were correctable with spectacles. Age was significantly associated with near
vision impairment with Fisher’s exact test value of 0.000 and the mean age of those with
near vision impairment was 58.45, standard deviation of ±12.73. The risk of females
developing near vision loss was higher than males but the observation was not
statistically significant.
Refractive error was the leading cause of vision impairment with 47.14% (n = 99, 95%
CI of 40.33 - 53.9). Cataract was the second leading cause of vision impairment with
42.86% (n = 90, 95% CI of 36.10 - 49.61) and other causes of vision impairment
prevalence was 10.00% (n= 21, 95% CI of 5.90 – 14.09). More females had vision
impairment than males in each of the causes but the observed difference was not
statistically significant (Fisher's exact, p = 0.312).
This study showed that refractive error is the major cause of vision impairment
accounting for 47.14% of the visually impaired but 7.62% of the total participants.

53
Majority of participants with refractive error were myopes (58%). Forty two percent
(42%) were hyperopes and 18% had astigmatism. The mean myopic power was -
1.57DS with standard deviation of ± 0.65 and the mean hypermetropic power was +1.07
with standard deviation of ± 0.99. It was observed generally that the older participants,
the higher the prevalence of refractive error (Fisher’s exact, P= 0.000) and most
participants with refractive errors were farmers. The age group with most refractive
errors was the 60-69 years group followed by the 40-59 years group. The odds ratio of
female having refractive error was 1.19 (95% CI, 0.62 – 2.29) with males being the
reference but the odd ratio observed was not statistically significant (p value of 0.596).
Only two (2) individuals had severe to blind vision impairment caused by refractive error
and forty seven percent (47%) of the visually impaired, could have their vision restored
to normal by wearing the appropriate glasses.
6.2 Limitations
A number of limitations may have affected the study results. The eye examination was
limited to visual acuity, pen torch exam, pinhole examination, near and distance
refraction and undilated fundus examination. Therefore posterior segment diseases,
such as age-related macular degeneration, retinal problems, etc. were not objectively
captured and was classified as ‘others causes’. Additionally, due to financial constraints,
visual field test, gonioscopy, tonometry and dilated fundus examination, which would
have increased the accuracy of diagnosing glaucoma, were not done. As the objective
diagnoses of glaucoma was not done, any suspicion of the condition was also reported
as ‘other causes’ of vision impairment. However, the RAVI protocol used in this study
had been fully validated and many studies reported the causes of vision impairment as
was done in this study (Marmamula et. al., 2010, Marmamula et. al., 2013).
The uncorrected refractive error that causes vision impairment results in the 18 to 39
year group may not be a true representative as cycloplegic refraction was not done for
the participants of age 18-25 years as suggested by some studies such as Sanfilippo et
al., (2014). However, their representation in the whole study was minimal and the
standard refraction protocol employed in this study may minimize the overall effect of
not doing cyclo-refraction on this group

54
6.3 Recommendations
As a result of the study, the following recommendations are made:
1. More Optometrist need to be trained and deployed in public health system to prevent
avoidable visual loss from uncorrected vision impairment correctable with spectacle
usage. 2. There should be further studies into the barriers to the use spectacles and spectacle
coverage among individuals with refractive error in Ashanti region of Ghana. This is
to obtain specific proportions of individual with uncorrected refractive error who
could benefit from spectacle usage as well as the factors that prevent spectacle
wear so that this can inform refractive error programs.
3. There should be the inclusion of spectacle provision in the National Health Insurance
Scheme.
4. Access to affordable spectacles should be increased in both the private and public
sector.
6.4 Significance of Study
The results of the study can contribute to a number of issues, including the following:
add to the few vision impairment studies in Ghana,
provide baseline data for other studies of vision impairment in the Ashanti
Region,
planning eye care programmes,
developing policies and strategies to reduce vision impairment in the Ashanti
Region and possibly other areas of Ghana.

55

56
REFERENCES
ABDULL, M. M., SIVASUBRAMANIAM, S., MURTHY, G. V., GILBERT, C.,
ABUBAKAR, T., EZELUM, C., RABIU, M. M., NIGERIA NATIONAL, B. & VISUAL
IMPAIRMENT STUDY, G. 2009. Causes of blindness and visual impairment in
Nigeria: the Nigeria national blindness and visual impairment survey. Invest
Ophthalmol Vis Sci, 50, 4114-20.
AKUAMOAH-BOATENG, H. 2013. Self-reported vision health status among older
people in the Kassena-Nankana District, Ghana. Glob Health Action, 6, 19012.
AL GHAMDI, A. H., RABIU, M., HAJAR, S., YORSTON, D., KUPER, H. & POLACK, S.
2012. Rapid assessment of avoidable blindness and diabetic retinopathy in Taif,
Saudi Arabia. Br J Ophthalmol, 96, 1168-72.
AMEDO, A. O. 2014. Survey of eye care services in Ghana, IAPB Africa Newsletter, 3,
7
ASENSO-OKYERE, W., ANUM, A., OSEI-AKOTO, I. & ADUKONU, A. 1998. Cost
recovery in Ghana: are there any changes in health care seeking behaviour?
Health Policy and Planning, 13, 181-188.
BAKAR, N. F., CHEN, A. H., NOOR, A. R. & GOH, P. P. 2012. Comparison of refractive
error and visual impairment between Native Iban and Malay in a formal
government school vision loss prevention programme. Malays J Med Sci, 19, 48-
55.
BEKIBELE, C. O., FAWOLE, O. I., BAMGBOYE, A. E., ADEKUNLE, L. V., AJAYI, R. &
BAIYEROJU, A. M. 2007. Prevalence of refractive error and attitude to spectacle
use among drivers of public institutions in Ibadan, Nigeria. Ann Afr Med, 6, 26-30.
57
BOADI-KUSI, S. B., KYEI, S., MASHIGE, K. P., ABU, E. K., ANTWI-BOASIAKO, D. &
CARL HALLADAY, A. 2014. Demographic characteristics of Ghanaian optometry
students and factors influencing their career choice and institution of learning.
Adv Health Sci Educ Theory Pract.
BONGAARTS, J. 2009. Human population growth and the demographic transition.
Philos Trans R Soc Lond B Biol Sci, 364, 2985-90.
BOURNE, R., PRICE, H., STEVENS, G. & GROUP, G. B. D. V. L. E. 2012. Global
burden of visual impairment and blindness. Arch Ophthalmol, 130, 645-7.
BOURNE, R. R. A., STEVENS, G. A., WHITE, R. A., SMITH, J. L., FLAXMAN, S. R.,
PRICE, H., JONAS, J. B., KEEFFE, J., LEASHER, J., NAIDOO, K., PESUDOVS,
K., RESNIKOFF, S. & TAYLOR, H. R. 2013. Causes of vision loss worldwide,
1990–2010: a systematic analysis. The Lancet Global Health, 1, e339-e349.
BRIAN, G., PEARCE, M. G. & RAMKE, J. 2011. Refractive error and presbyopia among
adults in Fiji. Ophthalmic Epidemiol, 18, 75-82.
BUCH, H., VINDING, T., LA COUR, M., APPLEYARD, M., JENSEN, G. B. & NIELSEN,
N. V. 2004. Prevalence and causes of visual impairment and blindness among
9980 Scandinavian adults: the Copenhagen City Eye Study. Ophthalmology,
111, 53-61.
BUDENZ, D. L., BANDI, J. R., BARTON, K., NOLAN, W., HERNDON, L., WHITESIDE-
DE VOS, J., HAY-SMITH, G., KIM, H., TIELSCH, J. & TEMA EYE SURVEY
STUDY, G. 2012. Blindness and visual impairment in an urban West African
population: the Tema Eye Survey. Ophthalmology, 119, 1744-53.
BUDENZ, D. L., BARTON, K., WHITESIDE-DE VOS, J., SCHIFFMAN, J., BANDI, J.,
NOLAN, W., HERNDON, L., KIM, H., HAY-SMITH, G., TIELSCH, J. M. & TEMA

58
EYE SURVEY STUDY, G. 2013. Prevalence of glaucoma in an urban West
African population: the Tema Eye Survey. JAMA Ophthalmol, 131, 651-8.
BUHRMANN, R. R., QUIGLEY, H. A., BARRON, Y., WEST, S. K., OLIVA, M. S. &
MMBAGA, B. B. 2000. Prevalence of glaucoma in a rural East African population.
Investigative ophthalmology & visual science, 41, 40-48.
CHAN, D. K.-C., FUNG, Y.-K., XING, S. & HAGGER, M. S. 2013a. Myopia prevention,
near work, and visual acuity of college students: integrating the theory of planned
behavior and self-determination theory. Journal of behavioral medicine, 1-12.
CHAN, V. F., MEBRAHTU, G., RAMSON, P., WEPO, M. & NAIDOO, K. S. 2013b.
Prevalence of Refractive Error and Spectacle Coverage in Zoba Ma'ekel Eritrea:
A Rapid Assessment of Refractive Error. Ophthalmic Epidemiol, 20, 131-7.
CHENG, J. W., CHENG, S. W., CAI, J. P., LI, Y. & WEI, R. L. 2013. The prevalence of
visual impairment in older adults in mainland China: a systematic review and
meta-analysis. Ophthalmic Res, 49, 1-10.
CHOU, C. F., COTCH, M. F., VITALE, S., ZHANG, X., KLEIN, R., FRIEDMAN, D. S.,
KLEIN, B. E. & SAADDINE, J. B. 2013. Age-related eye diseases and visual
impairment among U.S. adults. Am J Prev Med, 45, 29-35.
DANDONA, R., DANDONA, L., NADUVILATH, T. J., SRINIVAS, M., MCCARTY, C. A.
& RAO, G. N. 1999. Refractive errors in an urban population in Southern India:
the Andhra Pradesh Eye Disease Study. Invest Ophthalmol Vis Sci, 40, 2810-8.
DINEEN, B., BOURNE, R. R., JADOON, Z., SHAH, S. P., KHAN, M. A., FOSTER, A.,
GILBERT, C. E., KHAN, M. D. & PAKISTAN NATIONAL EYE SURVEY STUDY,
G. 2007. Causes of blindness and visual impairment in Pakistan. The Pakistan
national blindness and visual impairment survey. Br J Ophthalmol, 91, 1005-10.
59
DINEEN, B., FOSTER, A. & FAAL, H. 2006. A proposed rapid methodology to assess
the prevalence and causes of blindness and visual impairment. Ophthalmic
Epidemiol, 13, 31-4.
DINEEN, B. P., BOURNE, R. R., ALI, S. M., HUQ, D. M. & JOHNSON, G. J. 2003.
Prevalence and causes of blindness and visual impairment in Bangladeshi
adults: results of the National Blindness and Low Vision Survey of Bangladesh.
Br J Ophthalmol, 87, 820-8.
DUARTE, W. R., BARROS, A. J., DIAS-DA-COSTA, J. S. & CATTAN, J. M. 2003.
[Prevalence of near vision deficiency and related factors: a population-based
study]. Cad Saude Publica, 19, 551-9.
EDUSSURIYA, K., SENNANAYAKE, S., SENARATNE, T., MARSHALL, D., SULLIVAN,
T., SELVA, D. & CASSON, R. J. 2009. The prevalence and causes of visual
impairment in central Sri Lanka the Kandy Eye study. Ophthalmology, 116, 52-6.
EZELUM, C., RAZAVI, H., SIVASUBRAMANIAM, S., GILBERT, C. E., MURTHY, G. V.,
ENTEKUME, G., ABUBAKAR, T., NIGERIA NATIONAL, B. & VISUAL
IMPAIRMENT STUDY, G. 2011. Refractive error in Nigerian adults: prevalence,
type, and spectacle coverage. Invest Ophthalmol Vis Sci, 52, 5449-56.
FOTOUHI, A., HASHEMI, H., MOHAMMAD, K., JALALI, K. H. & TEHRAN EYE, S.
2004. The prevalence and causes of visual impairment in Tehran: the Tehran
Eye Study. Br J Ophthalmol, 88, 740-5.
FREEMAN, E. E., ROY-GAGNON, M. H., SAMSON, E., HADDAD, S., AUBIN, M. J.,
VELA, C. & ZUNZUNEGUI, M. V. 2013. The global burden of visual difficulty in
low, middle, and high income countries. PLoS One, 8, e63315.

60
FREEMAN, E. E., ZUNZUNEGUI, M. V., KOUANDA, S., AUBIN, M. J., POPESCU, M.
L., MISZKURKA, M., COJOCARU, D. & HADDAD, S. 2010. Prevalence and risk
factors for near and far visual difficulty in Burkina Faso. Ophthalmic Epidemiol,
17, 301-6.
FRICK, K. D. 2012. What the comprehensive economics of blindness and visual
impairment can help us understand. Indian J Ophthalmol, 60, 406-10.
FRICKE, T. R., HOLDEN, B. A., WILSON, D. A., SCHLENTHER, G., NAIDOO, K. S.,
RESNIKOFF, S. & FRICK, K. D. 2012. Global cost of correcting vision
impairment from uncorrected refractive error. Bull World Health Organ, 90, 728-
38.
FRIEDMAN, D. S., JAMPEL, H. D., MUNOZ, B. & WEST, S. K. 2006. The prevalence of
open-angle glaucoma among blacks and whites 73 years and older: the
Salisbury Eye Evaluation Glaucoma Study. Arch Ophthalmol, 124, 1625-30.
GHANA-DISTRICTS 2013a. District of Ghana- Bosomtwe [online]. Government of
Ghana, Accra Ghana. AVAILABLE: http://bosomtwe.ghanadistricts.gov.gh/
[Accessed on 30th December, 2013].
GHANA-DISTRICTS 2013b. District of Ghana- Ejura Sekyedumasi Municipal [online].
Government of Ghana, Accra Ghana. AVAILABLE:
http://ejurasekyedumase.ghanadistricts.gov.gh/ [Accessed on 30th December,
2013].
GHANA-DISTRICTS 2013c. Districts of Ghana- Ejisu Juaben Municipality [online]
Government of Ghana, Accra, Ghana. Available:
http://ejisujuaben.ghanadistricts.gov.gh/ [Accessed on 30th December, 2013].

61
GHANA-STATISTICAL-SERVICE 2012. 2010 Population and Housing Census Final
Results [online]. Ghana Statistical Service , Accra Ghana. AVAILABLE:
http://www.statsghana.gov.gh/docfiles/2010phc/Census2010_Summary_report_o
f_final_results.pdf [Accessed from 20th December, 2013]. .
GUNNLAUGSDOTTIR, E., ARNARSSON, A. M. & JONASSON, F. 2013. [Visual
impairment and blindness in Icelanders aged 50 years and older - the Reykjavik
Eye Study]. Laeknabladid, 99, 123-7.
GUPTA, N., TANDON, R., GUPTA, S. K., SREENIVAS, V. & VASHIST, P. 2013.
Burden of corneal blindness in India. Indian J Community Med, 38, 198-206.
GUZEK, J. P., ANYOMI, F. K., FIADOYOR, S. & NYONATOR, F. 2005. Prevalence of
blindness in people over 40 years in the volta region of ghana. Ghana Med J, 39,
55-62.
GYASI, M. E. 2006. Setting the pace for VISION 2020 in Ghana: the case of Bawku Eye
Care Programme. Community Eye Health, 19, 46-7.
HAEGERSTROM-PORTNOY, G., SCHNECK, M. E., LOTT, L. A., HEWLETT, S. E. &
BRABYN, J. A. 2014. Longitudinal Increase in Anisometropia in Older Adults.
Optometry & Vision Science, 91, 60-67.
HASHEMI, H., KHABAZKHOOB, M., JAFARZADEHPUR, E., MEHRAVARAN, S.,
EMAMIAN, M. H., YEKTA, A., SHARIATI, M. & FOTOUHI, A. 2012. Population-
based study of presbyopia in Shahroud, Iran. Clin Experiment Ophthalmol, 40,
863-8.
HE, M., ABDOU, A., ELLWEIN, L. B., NAIDOO, K. S., SAPKOTA, Y. D., THULASIRAJ,
R. D., VARMA, R., ZHAO, J., KOCUR, I. & CONGDON, N. G. 2014. Age-related

62
Prevalence and Met Need for Correctable and Uncorrectable Near Vision
Impairment in a Multi-country Study. Ophthalmology, 121, 417-22.
HE, M., ABDOU, A., NAIDOO, K. S., SAPKOTA, Y. D., THULASIRAJ, R. D., VARMA,
R., ZHAO, J. & ELLWEIN, L. B. 2012. Prevalence and correction of near vision
impairment at seven sites in China, India, Nepal, Niger, South Africa, and the
United States. Am J Ophthalmol, 154, 107-116 e1.
HEIJTHUIJSEN, A. A., BEUNDERS, V. A., JIAWAN, D., DE MESQUITA-VOIGT, A. M.,
PAWIROREDJO, J., MOURITS, M., TANCK, M., VERHOEFF, J. & SAEED, P.
2013. Causes of severe visual impairment and blindness in children in the
Republic of Suriname. Br J Ophthalmol, 97, 812-5.
HOLDEN, B. A., FRICKE, T. R., HO, S. M., WONG, R., SCHLENTHER, G., CRONJE,
S., BURNETT, A., PAPAS, E., NAIDOO, K. S. & FRICK, K. D. 2008. Global
vision impairment due to uncorrected presbyopia. Arch Ophthalmol, 126, 1731-9.
HYSI, P. G., MAHROO, O. A., CUMBERLAND, P., WOJCIECHOWSKI, R., WILLIAMS,
K. M., YOUNG, T. L., MACKEY, D. A., RAHI, J. S. & HAMMOND, C. J. 2014.
Common mechanisms underlying refractive error identified in functional analysis
of gene lists from genome-wide association study results in 2 European british
cohorts. JAMA Ophthalmol, 132, 50-6.
IKONNE, E. U., AMAECHI, O. U. & UZODIKE, E. B. 2010. Presbyopic Content of a
Community Based Etecare Programme in Imo State, Nigeria. Journal of the
Nigerian Optometric Association, 13, 20-22.
ILIFFE, S., KHARICHA, K., HARARI, D., SWIFT, C., GILLMANN, G. & STUCK, A. E.
2013. Health risk appraisal in older people 6: factors associated with self-

63
reported poor vision and uptake of eye tests in older people. BMC Fam Pract, 14,
130.
IP, J. M., HUYNH, S. C., ROBAEI, D., ROSE, K. A., MORGAN, I. G., SMITH, W.,
KIFLEY, A. & MITCHELL, P. 2007. Ethnic differences in the impact of parental
myopia: findings from a population-based study of 12-year-old Australian
children. Invest Ophthalmol Vis Sci, 48, 2520-8.
JAGGERNATH, J., HASLAM, D. & NAIDOO, K. S. 2013. Climate change: Impact of
increased ultraviolet radiation and water changes on eye health. Health, 05, 921-
930.
KEMPEN, J., MITCHELL, P., LEE, K., TIELSCH, J., BROMAN, A., TAYLOR, H.,
IKRAM, M., CONGDON, N. & O'COLMAIN, B. 2004. The prevalence of refractive
errors among adults in the United States, Western Europe, and Australia.
Archives of ophthalmology, 122, 495.
KOBERLEIN, J., BEIFUS, K., SCHAFFERT, C. & FINGER, R. P. 2013. The economic
burden of visual impairment and blindness: a systematic review. BMJ Open, 3,
e003471.
KOCUR, I. & RESNIKOFF, S. 2002. Visual impairment and blindness in Europe and
their prevention. Br J Ophthalmol, 86, 716-22.
KUMAH, B. D., EBRI, A., ABDUL-KABIR, M., AHMED, A. S., KOOMSON, N. Y.,
AIKINS, S., AIKINS, A., AMEDO, A., LARTEY, S. & NAIDOO, K. 2013.
Refractive error and visual impairment in private school children in ghana. Optom
Vis Sci, 90, 1456-61.
KUMAH, D. B., LARTEY, S. Y. & AMOAH-DUAH, K. 2011. Presbyopia Among Public
Senior High School Teachers In Kumasi. Ghana Medical Journal, 45, 27-30.

64
LEWALLEN, S. & COURTRIGHT, P. 2002. Gender and use of cataract surgical
services in developing countries. Bulletin of the World Health Organization, 80,
300-303.
LU, Q., HE, W., MURTHY, G. V., HE, X., CONGDON, N., ZHANG, L., LI, L. & YANG, J.
2011. Presbyopia and near-vision impairment in rural northern China. Invest
Ophthalmol Vis Sci, 52, 2300-5.
MARMAMULA, S., KEEFFE, J. E., RAMAN, U. & RAO, G. N. 2011a. Population-based
cross-sectional study of barriers to utilisation of refraction services in South India:
Rapid Assessment of Refractive Errors (RARE) Study. BMJ Open, 1, e000172.
MARMAMULA, S., KEEFFE, J. E. & RAO, G. N. 2012a. Rapid assessment methods in
eye care: an overview. Indian J Ophthalmol, 60, 416-22.
MARMAMULA, S., KHANNA, R. C., NARSAIAH, S., SHEKHAR, K. & RAO, G. N.
2013a. Prevalence of spectacle use in Andhra Pradesh, India: Rapid
Assessment of Visual Impairment (RAVI) project. Clin Experiment Ophthalmol.
MARMAMULA, S., MADALA, S. R. & RAO, G. N. 2011b. Rapid assessment of visual
impairment (RAVI) in marine fishing communities in South India--study protocol
and main findings. BMC Ophthalmol, 11, 26.
MARMAMULA, S., MADALA, S. R. & RAO, G. N. 2012b. Prevalence of uncorrected
refractive errors, presbyopia and spectacle coverage in marine fishing
communities in South India: Rapid Assessment of Visual Impairment (RAVI)
project. Ophthalmic Physiol Opt, 32, 149-55.
MARMAMULA, S., NARSAIAH, S., SHEKHAR, K. & KHANNA, R. C. 2013b.
Presbyopia, spectacles use and spectacle correction coverage for near vision

65
among cloth weaving communities in Prakasam district in South India.
Ophthalmic Physiol Opt, 33, 597-603.
MARMAMULA, S., NARSAIAH, S., SHEKHAR, K. & KHANNA, R. C. 2013c. Visual
impairment among weaving communities in Prakasam district in South India.
PLoS One, 8, e55924.
MCINTYRE, L., CONNOR, S. K. & WARREN, J. 2000. Child hunger in Canada: results
of the 1994 National Longitudinal Survey of Children and Youth. CMAJ, 163,
961-5.
MINASSIAN, D. C. 1997. Sample size calculation for eye surveys: a simple method.
Comm Eye Health, 10, 42-44.
MINISTRY-OF-HEALTH 2014. Ministry of Health, press release [online], Accra, Ghana.
AVAILABLE: www.moh-ghana.org/news_content.aspx?id=52.
MOLL, A. C., VAN DER LINDEN, A. J., HOGEWEG, M., SCHADER, W. E., HERMANS,
J. & DE KEIZER, R. J. 1994. Prevalence of blindness and low vision of people
over 30 years in the Wenchi district, Ghana, in relation to eye care programmes.
Br J Ophthalmol, 78, 275-9.
MORNY, F. K. 1995. Correlation between presbyopia, age and number of births of
mothers in the Kumasi area of Ghana. Ophthalmic Physiol Opt, 15, 463-6.
NAIDOO, K., STEPHEN GICHUHI, MARÍA-GLORIA BASÁÑEZ, SETH R FLAXMAN,
JOST B JONAS, JILL KEEFFE, JANET L LEASHER, KONRAD PESUDOVS,
HOLLY PRICE, JENNIFER L SMITH, HUGO C TURNER, RICHARD A WHITE,
TIEN Y WONG, SERGE RESNIKOFF, HUGH R TAYLOR & RUPERT R A
BOURNE 2014. Prevalence and causes of vision loss in sub-Saharan Africa:
1990–2010. Br J Ophthalmol Submitted: 2013 (under proof reading).
66
NAIDOO, K. S., JAGGERNATH, J., MARTIN, C., GOVENDER, P., CHINANAYI, F. S.,
CHAN, V. F. & RAMSON, P. 2013. Prevalence of presbyopia and spectacle
coverage in an african population in durban, South Africa. Optom Vis Sci, 90,
1424-9.
NAIDOO, K. S., RAGHUNANDAN, A., MASHIGE, K. P., GOVENDER, P., HOLDEN, B.
A., POKHAREL, G. P. & ELLWEIN, L. B. 2003. Refractive error and visual
impairment in African children in South Africa. Invest Ophthalmol Vis Sci, 44,
3764-70.
NAIDOO, K. S., WALLACE, D. B., HOLDEN, B. A., MINTO, H., FAAL, H. B. & DUBE, P.
2010. The challenge of uncorrected refractive error: driving the agenda of the
Durban Declaration on refractive error and service development. Clin Exp
Optom, 93, 131-6.
NANGIA, V., JONAS, J. B., GUPTA, R., KHARE, A. & SINHA, A. 2013. Visual
impairment and blindness in rural central India: the Central India Eye and
Medical Study. Acta Ophthalmol, 91, 483-6.
NANGIA, V., JONAS, J. B., SINHA, A., GUPTA, R. & BHOJWANI, K. 2012. Prevalence
of undercorrection of refractive error in rural Central India. The Central India eye
and medical study. Acta Ophthalmol, 90, e166-167.
NANGIA, V., JONAS, J. B., SINHA, A., MATIN, A. & KULKARNI, M. 2010. Refractive
error in central India: the Central India Eye and Medical Study. Ophthalmology,
117, 693-9.
NANO, M. E., NANO, H. D., MUGICA, J. M., SILVA, J. C., MONTANA, G. & LIMBURG,
H. 2006. Rapid assessment of visual impairment due to cataract and cataract
surgical services in urban Argentina. Ophthalmic Epidemiol, 13, 191-7.

67
NATIONAL-EYE-CARE-UNIT 2013. Prevention of aviodable blindness activities in
Ghana, report on strategy to prevent aviodable blindness in Ghana, National Eye
Care Unit, 13th December, 2013.
.
NATIONAL-HEALTH-INSURANCE-AUTHORITY 2014. National Health Insurance
Coverage of Eyecare [Online]. Available: http://www.nhis.gov.gh/Default.aspx
Assessed on 12/04/2014
NTIM-AMPONSAH, C. 2007. Contribution of refractive errors to visual impairment in
patients at korle-bu teaching hospital. Ghana Med J, 41, 68-71.
O'DONOGHUE, L., MCCLELLAND, J. F., LOGAN, N. S., RUDNICKA, A. R., OWEN, C.
G. & SAUNDERS, K. J. 2010. Refractive error and visual impairment in school
children in Northern Ireland. Br J Ophthalmol, 94, 1155-9.
ONG, S. Y., CHEUNG, C. Y., LI, X., LAMOUREUX, E. L., IKRAM, M. K., DING, J.,
CHENG, C. Y., HAALAND, B. A., SAW, S. M., VENKETASUBRAMANIAN, N.,
CHEN, C. P. & WONG, T. Y. 2012. Visual impairment, age-related eye diseases,
and cognitive function: the Singapore Malay Eye study. Arch Ophthalmol, 130,
895-900.
ORTNER C., M. O. 2002. Causes and correction of presbyopia; A review. Acta Clin
Croat, 41, 39-43.
OTULANA, T. O. 2012. Blindness and visual impairment in Remo, Ogun State, Nigeria:
a hospital-based study. Niger Postgrad Med J, 19, 153-6.
OVENSERI-OGBOMO, G. O. & ASSIEN, R. 2010. Refractive error in School Children in
Agona Swedru, Ghana. S Afr Optom, 69, 86 - 92.

68
OVENSERI-OGOMO, G. & ADOFO, M. 2011. Poor vision, refractive errors and barriers
to treatment among commercial vehicle drivers in the Cape Coast municipality.
Afr Health Sci, 11, 97-102.
OYE, J. E., KUPER, H., DINEEN, B., BEFIDI-MENGUE, R. & FOSTER, A. 2006.
Prevalence and causes of blindness and visual impairment in Muyuka: a rural
health district in South West Province, Cameroon. Br J Ophthalmol, 90, 538-42.
PAN, C. W., RAMAMURTHY, D. & SAW, S. M. 2012. Worldwide prevalence and risk
factors for myopia. Ophthalmic Physiol Opt, 32, 3-16.
PASCOLINI, D. & MARIOTTI, S. P. 2012. Global estimates of visual impairment: 2010.
Br J Ophthalmol, 96, 614-8.
PATEL, I. & WEST, S. K. 2007. Presbyopia: prevalence, impact, and interventions.
Community Eye Health, 20, 40-1.
RACETTE, L., WILSON, M. R., ZANGWILL, L. M., WEINREB, R. N. & SAMPLE, P. A.
2003. Primary open-angle glaucoma in blacks: a review. Surv Ophthalmol, 48,
295-313.
REIDY, A., MINASSIAN, D. C., VAFIDIS, G., JOSEPH, J., FARROW, S., WU, J.,
DESAI, P. & CONNOLLY, A. 1998. Prevalence of serious eye disease and visual
impairment in a north London population: population based, cross sectional
study. BMJ, 316, 1643-6.
REMINGTON, A. 2005. Clinical_Anatomy_of_the_Visual_System.
REMINGTON, L. A. & REMINGTON, L. A. 2012. Clinical anatomy and physiology of the
visual system, St. Louis, Mo., Elsevier/Butterworth Heinemann.
RESNIKOFF, B. A. H. A. S. 2002. The role of optometry in vision 2020. Community Eye
Health, 15, 33-6.
69
RESNIKOFF, S., PASCOLINI, D., ETYA'ALE, D., KOCUR, I., PARARAJASEGARAM,
R., POKHAREL, G. P. & MARIOTTI, S. P. 2004. Global data on visual
impairment in the year 2002. Bull World Health Organ, 82, 844-51.
RIUS, A., ARTAZCOZ, L., GUISASOLA, L. & BENACH, J. 2013. Visual Impairment and
Blindness in Spanish Adults: Geographic Inequalities Are Not Explained by Age
or Education. Ophthalmology.
ROBINSON, B., FENG, Y., WOODS, C. A., FONN, D., GOLD, D. & GORDON, K. 2013.
Prevalence of visual impairment and uncorrected refractive error - report from a
Canadian urban population-based study. Ophthalmic Epidemiol, 20, 123-30.
ROTCHFORD, A. P., KIRWAN, J. F., MULLER, M. A., JOHNSON, G. J. & ROUX, P.
2003. Temba glaucoma study: a population-based cross-sectional survey in
urban South Africa. Ophthalmology, 110, 376-82.
SAARI, K. M. & AINE, E. 1984. Eye injuries in agriculture. Acta Ophthalmol Suppl, 161,
42-51.
SANFILIPPO, P. G., CHU, B. S., BIGAULT, O., KEARNS, L. S., BOON, M. Y., YOUNG,
T. L., HAMMOND, C. J., HEWITT, A. W. & MACKEY, D. A. 2014. What is the
appropriate age cut‐off for cycloplegia in refraction? Acta ophthalmologica.
SAW, S. M., CHAN, Y. H., WONG, W. L., SHANKAR, A., SANDAR, M., AUNG, T.,
TAN, D. T., MITCHELL, P. & WONG, T. Y. 2008. Prevalence and risk factors for
refractive errors in the Singapore Malay Eye Survey. Ophthalmology, 115, 1713-
9.
SAW, S. M., GAZZARD, G., SHIH-YEN, E. C. & CHUA, W. H. 2005. Myopia and
associated pathological complications. Ophthalmic Physiol Opt, 25, 381-91.

70
SCHULZE SCHWERING, M., NYRENDA, M., SPITZER, M. S. & KALUA, K. 2013.
[Visual impairment and blindness in children in a Malawian school for the blind].
Klin Monbl Augenheilkd, 230, 820-4.
SHAH, S. P., JADOON, M. Z., DINEEN, B., BOURNE, R. R., JOHNSON, G. J.,
GILBERT, C. E. & KHAN, M. D. 2008. Refractive errors in the adult pakistani
population: the national blindness and visual impairment survey. Ophthalmic
Epidemiol, 15, 183-90.
SHERWIN, J. C., LEWALLEN, S. & COURTRIGHT, P. 2012. Blindness and visual
impairment due to uncorrected refractive error in sub-Saharan Africa: review of
recent population-based studies. Br J Ophthalmol, 96, 927-30.
SINGH, K., JAIN, D. & TELI, K. 2013. Rehabilitation of vision disabling corneal
opacities: is there hope without corneal transplant? Cont Lens Anterior Eye, 36,
74-9.
SMITH, E. L., RAMAMIRTHAM, R., QIAO-GRIDER, Y., HUNG, L.-F., HUANG, J., KEE,
C.-S., COATS, D. & PAYSSE, E. 2007. Effects of foveal ablation on
emmetropization and form-deprivation myopia. Investigative ophthalmology &
visual science, 48, 3914-3922.
SMITH, T. S., FRICK, K. D., HOLDEN, B. A., FRICKE, T. R. & NAIDOO, K. S. 2009.
Potential lost productivity resulting from the global burden of uncorrected
refractive error. Bull World Health Organ, 87, 431-7.
SOLEBO, A. L. & RAHI, J. 2013. Epidemiology, aetiology and management of visual
impairment in children. Arch Dis Child.
STEVENS, G. A., WHITE, R. A., FLAXMAN, S. R., PRICE, H., JONAS, J. B., KEEFFE,
J., LEASHER, J., NAIDOO, K., PESUDOVS, K. & RESNIKOFF, S. 2013a. Global
71
prevalence of vision impairment and blindness: Magnitude and temporal trends,
1990–2010. Ophthalmology, 120, 2377-2384.
STEVENS, G. A., WHITE, R. A., FLAXMAN, S. R., PRICE, H., JONAS, J. B., KEEFFE,
J., LEASHER, J., NAIDOO, K., PESUDOVS, K., RESNIKOFF, S., TAYLOR, H.,
BOURNE, R. R. & VISION LOSS EXPERT, G. 2013b. Global prevalence of
vision impairment and blindness: magnitude and temporal trends, 1990-2010.
Ophthalmology, 120, 2377-84.
TAHHAN, N., PAPAS, E., FRICKE, T. R., FRICK, K. D. & HOLDEN, B. A. 2013. Utility
and uncorrected refractive error. Ophthalmology, 120, 1736-44.
TARCZY-HORNOCH, K., COTTER, S. A., BORCHERT, M., MCKEAN-COWDIN, R.,
LIN, J., WEN, G., KIM, J., VARMA, R. & MULTI-ETHNIC PEDIATRIC EYE
DISEASE STUDY, G. 2013. Prevalence and causes of visual impairment in
Asian and non-Hispanic white preschool children: Multi-ethnic Pediatric Eye
Disease Study. Ophthalmology, 120, 1220-6.
THYLEFORS, B. & NEGREL, A. D. 1994. The global impact of glaucoma. Bull World
Health Organ, 72, 323-6.
TRUSCOTT, R. J. 2005. Age-related nuclear cataract-oxidation is the key. Exp Eye
Res, 80, 709-25.
TRUSCOTT, R. J. & ZHU, X. 2010. Presbyopia and cataract: a question of heat and
time. Prog Retin Eye Res, 29, 487-99.
VERHOEVEN, V. J., BUITENDIJK, G. H., CONSORTIUM FOR REFRACTIVE, E.,
MYOPIA, RIVADENEIRA, F., UITTERLINDEN, A. G., VINGERLING, J. R.,
HOFMAN, A. & KLAVER, C. C. 2013. Education influences the role of genetics in
myopia. Eur J Epidemiol, 28, 973-80.

72
VINCENT, S. J. & READ, S. A. 2014. Progressive adult antimetropia. Clinical and
Experimental Optometry.
WANG, L., HUANG, W., HE, M., ZHENG, Y., HUANG, S., LIU, B., JIN, L., CONGDON,
N. G. & HE, M. 2013. Causes and five-year incidence of blindness and visual
impairment in urban Southern China: the Liwan Eye Study. Invest Ophthalmol
Vis Sci, 54, 4117-21.
WEALE, R. A. 2003. Epidemiology of refractive errors and presbyopia. Survey of
ophthalmology, 48, 515-543.
WHITCHER, J. P., SRINIVASAN, M. & UPADHYAY, M. P. 2001. Corneal blindness: a
global perspective. Bull World Health Organ, 79, 214-21.
WHO 1988. Coding instructions for the WHO/PBL eye examination record (Version III)
[online]. Geneva, Switzerland. AVAILABLE: http://whqlibdoc.who.int/hq/pre-
wholis/WHO_PBL_82.6.pdf [Accessed on 31th December, 2013].
WHO 2013a. Change the Definition of Blindness [Online]. World Health Organization,
Geneva, Switzerland. AVAILABLE:
http://www.who.int/blindness/Change%20the%20Definition%20of%20Blindness.p
df [Accessed on 31st December, 2013].
WHO 2013b. Ghana Health Statistical Factsheet [Online]. World Health Organization,
Geneva, Switzerland. AVAILABLE: http://www.who.int/Ghana-Health-Statistical-
Factsheet [Accessed on 31st December, 2013].
.
WHO 2013c. Visual impairment and blindness, WHO fact Sheet [online]. World Health
Organization, Geneva, Switzerland. AVAILABLE:

73
http://www.who.int/mediacentre/factsheets/fs282/en [Accessed on 31st
December, 2013].
WIKIPEDIA 2013. Ghana Districts [online]. Wikimedia Foundation Inc, Califonia, United
State of America. AVAILABLE:
http://en.wikipedia.org/wiki/File:Ashanti_districts.png [Accessed on 31st
December, 2013].
WITTENBORN, J. S., ZHANG, X., FEAGAN, C. W., CROUSE, W. L., SHRESTHA, S.,
KEMPER, A. R., HOERGER, T. J., SAADDINE, J. B. & VISION COST-
EFFECTIVENESS STUDY, G. 2013. The economic burden of vision loss and
eye disorders among the United States population younger than 40 years.
Ophthalmology, 120, 1728-35.
WONG, T. Y., ZHENG, Y., JONAS, J. B., FLAXMAN, S. R., KEEFFE, J., LEASHER, J.,
NAIDOO, K., PESUDOVS, K., PRICE, H. & WHITE, R. A. 2014a. Prevalence
and causes of vision loss in East Asia: 1990–2010. British Journal of
Ophthalmology, bjophthalmol-2013-304047.
WONG, T. Y., ZHENG, Y., JONAS, J. B., FLAXMAN, S. R., KEEFFE, J., LEASHER, J.,
NAIDOO, K., PESUDOVS, K., PRICE, H., WHITE, R. A., RESNIKOFF, S.,
TAYLOR, H. R., BOURNE, R. R. & ON BEHALF OF THE VISION LOSS
EXPERT GROUP OF THE GLOBAL BURDEN OF DISEASE, S. 2014b.
Prevalence and causes of vision loss in East Asia: 1990-2010. Br J Ophthalmol.
WOODHOUSE, J. M., DAVIES, N., MCAVINCHEY, A. & RYAN, B. 2013. Ocular and
visual status among children in special schools in Wales: the burden of
unrecognised visual impairment. Arch Dis Child.

74
WU, S. Y., NEMESURE, B. & LESKE, M. C. 1999. Refractive errors in a black adult
population: the Barbados Eye Study. Invest Ophthalmol Vis Sci, 40, 2179-84.
WU, S. Y., YOO, Y. J., NEMESURE, B., HENNIS, A., LESKE, M. C. & BARBADOS
EYE STUDIES, G. 2005. Nine-year refractive changes in the Barbados Eye
Studies. Invest Ophthalmol Vis Sci, 46, 4032-9.
YEO, A. C., ATCHISON, D. A. & SCHMID, K. L. 2013. Effect of Text Type on Near
Work–Induced Contrast Adaptation in Myopic and Emmetropic Young Adults.
Investigative ophthalmology & visual science, 54, 1478-1483.
ZHU, M., TONG, X., ZHAO, R., HE, X., ZHAO, H., LIU, M. & ZHU, J. 2013. Visual
impairment and spectacle coverage rate in Baoshan district, China: population-
based study. BMC Public Health, 13, 311.

75
APPENDIX
APPENDIX A
University of KwaZulu-Natal
Africa Vision Research Institute/ Brien Holden Vision Institute
Contribution of Refractive Errors to Visual Impairment in Ashanti Region, Ghana
Data forms
Cluster No:…………… Case No: ……………………..
Date: …………..... 20…
Age: ….………yrs
Gender: M / F
Add/Location: ……………………………………………. Occupation: ………………………………..
History:
VA Pd: ……/……..mm
WoRx WRx PH NVA
OD
OS

76
For VA < 6/12: Do you wear spectacles? Y/ N
Examination
RIGHT EYE LEFT EYE
…………………………………………………….Lids/Lashes ………………………………………………….
……………………………………………………Cornea/Conj. ………………………………………………...
………………………………………………………...A/C …………………………………………………………...
………………………………………………………..Pupils ………………………………………………………...
………………………………………………………Vitreous ……………………………………………………...
……………………………………………………. Disc Margins ……………………………………………….
.......................................................................................C/D …………………………………………………………...
………………………………………………..Neuroretinal Rim……………………………………………
……………………………………………… Peripappilary Region………………………………………
……………………………………………… Nerve Fibre Layer …………………………………………
………………………………………………..Peripheral Retina……………………………………………
…………………………………………………Arteries/Veins ……………………………………………….
…………………………………………………Macular Area …………………………………………………
OU

77
Diagnosis:…………………………………………………………………………………..
Primary cause of visual impairment: Right eye:……………………………………….……………………….
Left eye:…………………………………………………………………
Refraction results
Plan
Comments
Signature………………………………………..
(Clement Afari, OD)
Sphere Cyl Axis DXVA ADD NXVA
OD
OS

78
APPENDIX B

79
APPENDIX C

80
APPENDIX D

81
APPENDIX E

82
APPENDIX F