contribution of fluids and electrolyte management to lung
TRANSCRIPT
Contribution of fluids and electrolyte management to
lung injury
------------------------------------------------------------------------------------
This thesis is submitted in fulfilment of the requirements of:
Doctor of Philosophy
Shailesh Bihari, MBBS, MD, FCICM
December 2014
Critical Care Medicine,
School of Medicine, Faculty of Health Sciences,
Flinders University

Contents
2
CONTENTS
LIST OF FIGURES 10
LIST OF TABLES 14
SUMMARY 17
DECLARATION 20
ACKNOWLEDGEMENTS 21
ABBREVIATIONS AND SYMBOLS 24
PREFACE 30
Chapter 1 Introduction 36 1.1 Intravenous fluid administration, and fluid boluses, are
common practice 36
1.2 Acute lung injury 37
1.3 Is intravenous fluid administration safe? 38
1.4 Electrolyte abnormality in ICU 39
1.5 Fluids and their component- electrolytes and resultant
osmolality 39
1.6 Why is a sodium important - physiologic consideration 40
1.7 Control of sodium and its applications to intensive care 42
1.7.1 RENAL HANDLING OF SODIUM 42
1.7.2 CRITICALLY ILL PATIENTS HANDLING OF SODIUM 45
1.7.3 CURRENT NHMRC RECOMMENDATIONS 49
1.8 Distribution and control of water 49
1.9 Fluid and lung injury 51
1.10 Role of TRPV4 channels 52
1.11 Effects of osmolality and its relationship with sodium 55
1.12 Effects of high serum sodium (high serum osmolality) 56
Chapter 2 Primary research outline 59
2.1 Primary research question and plan 59

Contents
3
Chapter 3 Sodium administration in ICU patients 60
3.1 Sodium administration in a single centre tertiary level ICU
60
3.1.1 METHODS 61
3.1.2 STATISTICAL ANALYSES 63
3.1.3 RESULTS 64
3.1.3.1 Patient Characteristics 64
3.1.3.2 Sodium and fluid 64
3.1.4 DISCUSSION 67
3.1.5 STUDY LIMITATIONS 69
3.1.6 SUMMARY 70
3.2 Sodium administration in critically ill patients in Australia
and New Zealand: a multi-centre point prevalence study 71
3.2.1 METHODS 72
3.2.2 STATISTICAL ANALYSIS 74
3.2.3 RESULTS 75
3.2.3.1 Patient characteristics 75
3.2.3.2 Serum sodium 77
3.2.3.3 Sodium and fluid administration 77
3.2.4 DISCUSSION 82
3.2.5 LIMITATIONS AND FUTURE DIRECTIONS 85
3.2.6 SUMMARY 86
3.3. Sodium administration in critically ill paediatric patients
in Australia and New Zealand: a multi-centre point prevalence
study 87
3.3.1 METHODS 88
3.2.2 STATISTICAL ANALYSIS 91
3.3.3 RESULTS 92
3.3.3.1 Patient Characteristics 92
3.3.3.2 Administered sodium and fluid balance 92
3.3.3.3 Sources of administered sodium 97
3.3.4 DISCUSSION 99
Contents
4
3.3.5 STUDY LIMITATIONS AND FUTURE DIRECTIONS 103
3.3.6 SUMMARY 104
3.4 Inadvertent sodium loading with renal replacement therapy
in critically ill patients 105
3.4.1 METHODS 106
3.4.1.1 EDD 106
3.4.1.2 CRRT 107
3.4.2 STATISTICAL ANALYSIS 108
3.4.3 RESULTS 109
3.4.3.1 Demographics 109
3.4.3.2 EDD 110
3.4.3.3 CRRT 112
3.4.4 DISCUSSION 114
3.4.5 LIMITATIONS 120
3.4.6 SUMMARY 121
Chapter 4 Sodium balance in ICU patients 122
4.1 Sodium balance is different from fluid balance in critically
ill mechanically ventilated patients 122
4.1.1 METHODS 124
4.1.1.1 Estimated sodium and fluid balance 125
4.1.1.2 Respiratory function 126
4.1.1.3 Body composition 127
4.1.1.4 Clinical parameters 128
4.1.1.5 Statistical analysis 128
4.1.2 RESULTS 129
4.1.3 DISCUSSION 138
4.1.4 STUDY LIMITATIONS 142
4.1.5 SUMMARY 143

Contents
5
4.2 Sodium balance, not fluid balance, is associated with
respiratory dysfunction in mechanically ventilated patients:
a prospective, multi-centre study 145
4.2.1 METHODS 146
4.2.2 STATISTICAL ANALYSIS 149
4.2.3 RESULTS 149
4.2.3.1 Demographics 149
4.2.3.2 Fluid balance 152
4.2.3.3 Sodium balance 153
4.2.3.4 Contributions to fluid and sodium 155
4.2.3.5 Oxygenation and length of mechanical
ventilation 156
4.2.3 DISCUSSION 157
4.2.4 LIMITATIONS 162
4.2.5 SUMMARY 162
Chapter 5: Fluid bolus 163
5.1 Efficacy and prevalence of fluid boluses in resuscitated
septic patients 163
5.1.1 METHODS 165
5.1.2 STATISTICAL ANALYSIS 169
5.1.3 RESULTS 170
5.1.3.1 Demographics 170
5.1.3.2 Fluid boluses prevalence 171
5.1.3.3 Fluid bolus indications & perceived efficacy 172
5.1.3.4 Fluid bolus efficacy 1 hour after its
administration 173
5.1.4 DISCUSSION 176
5.1.5 STUDY LIMITATION 182
5.1.6 SUMMARY 183
5.2 Effect of fluid boluses on serum electrolytes and acid-base
status 184
Contents
6
5.3 Bolus administration of intravenous fluids leads to
permeability lung oedema via activation of TRPV4 channels
in a rat model 187
5.3.1 METHODS 190
5.3.1.1 Ethics approval 190
5.3.1.2 Animals 190
5.3.1.3 Fluids utilised 190
5.3.1.4 Controls 190
5.3.1.5 Study protocol 190
5.3.1.6 Monitoring 192
5.3.1.7 Dose finding experiment 193
5.3.1.8 Measurement of respiratory mechanics 193
5.3.1.9 Assessment of lung injury 194
5.3.1.10 Surfactant analysis 194
5.3.1.11 Cytokine determination 195
5.3.1.12 Histological analysis 195
5.3.1.13 Electrolyte and haematocrit measurement 195
5.3.1.14 Administration of ruthenium red 196
5.3.1.15 Statistical analysis 196
5.3.2 RESULTS 196
5.3.2.1 Experiment: dose determination 196
5.3.2.2 Experiment: Effect of fluid boluses 197
5.3.2.3 Experiment: Use of TRPV4 blocker- ruthenium
red 203
5.3.3 DISCUSSION 204
5.3.3.1 Fluid induced permeability oedema – lung injury
(FILI) 204
5.3.3.2 Role of TRPV4 channels 206
5.3.3.3 Dose of fluids 208
5.3.3.4 Effect of fluid on surfactant and lung mechanics
209
5.3.3.5 Limitations and future directions 210
5.3.4 SUMMARY 211
Contents
7
5.4 Bolus administration of 0.9% saline leads to interstitial
pulmonary edema despite normal echocardiographic indices
in healthy subjects when compared with 4% albumin and 5%
glucose 212
5.4.1 METHODS 213
5.4.1.1 Respiratory measurement 215
5.4.1.2 Cardiac and lung ultrasound 217
5.4.1.3 Blood samples 218
5.4.1.4 Statistical analysis 219
5.4.2 RESULTS 220
5.4.2.1 Changes in the haemodynamic parameters 220
5.4.2.2 Changes in lung function 221
5.4.2.3 Changes in lung ultrasonography 222
5.4.2.4 Changes in cardiac ultrasound 222
5.4.2.5 Changes in blood parameters 222
5.4.3 DISCUSSION 226
5.4.4 LIMITATIONS 234
5.4.5 SUMMARY 235
Chapter 6: Effect of serum sodium and osmolality on lung
injury 236
6.1 Admission high serum sodium is not associated with
increased ICU mortality risk in respiratory patients 236
6.1.1 METHODS 237
6.1.1.1 Study design 237
6.1.1.2 Patients 237
6.1.1.3 Database 237
6.1.1.4 Data extraction and categorisation 238
6.1.1.5 Outcome 238
6.1.1.6 Statistical Analysis 239
6.1.2 RESULTS 241

Contents
8
6.1.3 DISCUSSION 252
6.1.4 STRENGTHS AND LIMITATIONS 257
6.1.5 SUMMARY 259
6.2 Admission high serum osmolarity is not associated with
increased ICU mortality risk in respiratory patients 261
6.3 Induced hypernatremia reduces acute lung injury,
independent of fluid or sodium load 263
6.3.1 METHODS 265
6.3.1.1 Ethics approval 265
6.3.1.2 Animals 265
6.3.1.3 Induction of Acute Lung Injury 266
6.3.1.4 Monitoring 267
6.3.1.5 Fluids utilised 268
6.3.1.6 Measurement of respiratory mechanics 269
6.3.1.7 Assessment of lung injury 270
6.3.1.8 Histological analysis 271
6.3.1.9 Surfactant analysis 271
6.3.1.10 Cytokine determination 271
6.3.1.11 Electrolyte and haematocrit measurement 272
6.3.1.12 Statistical analysis 272
6.3.2 RESULTS 272
6.3.3 DISCUSSION 281
6.3.4 STUDY LIMITATION AND FUTURE DIRECTIONS 286
6.3.5 SUMMARY 287
Chapter 7 Summary and recommendations 288
7.1 Sodium administration and balance in ICU 288
7.2 Fluid boluses 292
7.3 Hyperosmolality and lung injury 294

Contents
9
Appendices 295 APPENDIX 1 SODIUM CONTENT IN COMMONLY USED FLUIDS
AND DRUGS 295
APPENDIX 2 LIST OF PARTICIPATING SITES AND INVESTIGATORS
IN THE ADULT POINT PREVALENCE STUDY 300
APPENDIX 3 LIST OF PARTICIPATING SITES AND INVESTIGATORS
IN THE PAEDIATRIC POINT PREVALENCE STUDY 303
APPENDIX 4 DOCUMENTATION OF ETHICAL APPROVALS 304
APPENDIX 5 LIST OF PUBLICATIONS AND PRESENTATIONS ARISING FROM CANDIDATURE 306
Bibliography 308

Contents
10
LIST OF FIGURES
Figure 1.1 Schematic suggesting pathways involved in fluid
induced lung injury.
Figure 3.1 Daily sodium intake (mmol) in the single centre study.
Data are expressed as median and interquartile range
Figure 3.2: Correlation of daily administered sodium and daily fluid
balance in the single centre study
Figure 3.3: Sodium and fluid balance on the point prevalence study
day according to day of stay in ICU post-ICU admission
Figure 3.4: Sodium administration on the point prevalence study
day at different sites
Figure 4.1: Cumulative fluid balance (A) and estimated cumulative
sodium balance (B) during ICU stay in 10 mechanically
ventilated patients.
Figure 4.2: Correlation between cumulative sodium balance and
next day’s chest x-ray score (A) and next day’s lowest
PaO2/FiO2 ratio (B) in 10 mechanically ventilated
patients
Figure 4.3: Delta body weight (A), total body water (B) and
extracellular fluid (% of total body water) (C), as
compared with study day 1 in 10 mechanically
ventilated patients
Figure 4.4: Flow diagram of subjects examined in the multicentre
sodium balance study
Figure 4.5: Correlation between cumulative sodium balance and
next day PaO2/FiO2 ratio in the multicentre sodium
balance study

Contents
11
Figure 5.1: Flow diagram showing the total number of patients
screened and included in the fluid bolus study based
on the inclusion and the exclusion criteria during the
study period
Figure 5.2: Data collection form which was filled in by the treating
clinician every time a fluid bolus was administered
highlighting the indication of the fluid boluses and
whether it was perceived to be successful
Figure 5.3: Data collection form which was filled in by the bed side
nurse noting down the exact haemodynamic and other
parameters immediately before and 1 hour after the
administration of fluid boluses
Figure 5.4: Correlation between daily cumulative fluid balance and
lowest PaO2/FIO2 ratio in the fluid bolus study
Figure 5.5: Correlation between daily cumulative fluid balance and
delta (at 48 hours and 72 hours compared with
baseline) SOFA (sequential organ failure assessment
score) scores
Figure 5.6: Study protocol used in the animal study
Figure 5.7: Effect of administration of 0.9% saline and 4% albumin
on the left ventricular end diastolic pressure (LVEDP).
Figure 5.8: Effect of fluid administration on the left ventricular end
diastolic pressure (LVEDP) and the central venous
pressure (CVP) at the volume of 60 ml/kg administered
over 30 minutes
Figure 5.9: The effect of fluid boluses on lung oedema (wet to dry
ratio) and lavage protein levels
Figure 5.10: The effect of fluid boluses on PaO2 and PaCO2 levels.
Figure 5.11: The effect of fluid boluses on lung mechanics

Contents
12
Figure 5.12: The effect of fluid boluses on the ratio of small and
large lung lavage phospholipid aggregate and lung
histology (cell infiltrate and wall thickness score) score
Figure 5.13: Hematoxylin and eosin staining in the lung paraffin-
embedded sections in rats (negative controls, 0.9%
saline and 0.9% saline with ruthenium red)
Figure 5.14: Study protocol used in administrating fluid boluses in
healthy subjects
Figure 5.15: Change in cardiac output with increase in blood
volume in the healthy volunteers
Figure 6.1: Consort diagram of subjects examined in ANZICS–APD
database study
Figure 6.2: Adjusted odds ratio (shaded lines are 95% confidence
intervals) of ICU mortality relative to 135 -144.9
mmol/l for different categories of highest serum
sodium in the first 24 hours in all patients
Figure 6.3: Adjusted odds ratio (shaded lines are 95% confidence
intervals) of ICU mortality relative to 135 -144.9
mmol/l for different categories of highest serum
sodium (left) and lowest serum sodium (right) in the
first 24 hours in patients with respiratory (dotted) or
without respiratory diseases (solid)
Figure 6.4: Adjusted odds ratio (shaded lines are 95% confidence
intervals) of ICU mortality relative to 135 -144.9
mmol/l for different categories of highest serum
sodium in the first 24 hours in all patients (left) and
mechanically ventilated patients (right) with PaO2/FiO2
ratio < 200 (dotted) or ≥ 200 (solid)
Figure 6.5: Adjusted odds ratio (shaded lines are 95% confidence
intervals) of ICU mortality relative to 135 -144.9
mmol/l for different categories of highest serum
sodium in the first 24 hours in all mechanically

Contents
13
ventilated patients with PaO2/FiO2 ratio < 200 (dotted)
vs all other patients (solid)
Figure 6.6: The relationship between sodium and mortality when
the 129 hospitals in the study were categorised into
hospital level (26% rural, 22% metropolitan, 24%
tertiary and 28% private)
Figure 6.7: Adjusted odds ratio (shaded lines are 95% confidence
intervals) of ICU mortality relative to 135 -144.9
mmol/l for different categories of highest serum
osmolarity in the first 24 hours in patients with
respiratory (dotted) or without respiratory diseases
(solid)
Figure 6.8: The effect of fluid administration on the left ventricular
end diastolic pressure and the central venous pressure
Figure 6.9: Effect of study fluids on lung injury
Figure 6.10: Effect of the study fluids on blood gases
Figure 6.11: Effect of the study fluids on lung elastance
Figure 6.12: Effect of study fluids on lung lavage and serum TNF-α
level and IL-8 levels
Figure 6.13: Effect of study fluids on the ratio of small and large
lung lavage phospholipid aggregate
Figure 6.14: Hematoxylin and eosin staining in the lung paraffin-
embedded sections and lung histology (cell infiltrate
and wall thickness score) scores in animals who were
administered 20% saline compared with the positive
and negative control

Contents
14
LIST OF TABLES
Table 1.1: Hormonal controls of sodium and water in the kidney
Table 1.2 24 hour losses of sodium and water from extra renal
sites
Table 3.1: Contributions of each source to the total sodium
administered in the single centre study
Table 3.2: Patient characteristics in the adult ICUs on the point
prevalence study day
Table 3.3: Sodium administration according to diagnostic category
on the point prevalence study day
Table 3.4: Patient characteristics in the paediatric ICUs on the
point prevalence study day
Table 3.5: Daily administered sodium and fluid balance according
to the day in PICU
Table 3.6: Sodium administration according to diagnostic category
on study day in paediatric patients
Table 3.7: Contribution of sodium according to day of stay in PICU
Table 3.8: Types of maintenance / replacement fluid used on the
study day in paediatric patients
Table 3.9: Demographics, blood results of patients dialysed in the
study
Table 3.10: Total dialysate, sodium flux and fluid removed during
dialysis in ICU
Table 3.11: Correlations with sodium flux with dialysis
Table 4.1: Subject demographics and details at ICU admission in
the single centre sodium balance study
Table 4.2: Summary of fluid, sodium, respiratory, body composition
and clinical data on each study day in the single centre
sodium balance study

Contents
15
Table 4.3: Sources of sodium administered during study days 0-5
in 10 mechanically ventilated patients
Table 4.4: Patient demographics and outcomes in the multicentre
sodium balance study
Table 4.5: Daily physiological and laboratory data in the
multicentre sodium balance study
Table 4.6: Daily and cumulative sodium and fluid balance in the
multicentre sodium balance study
Table 4.7: The effect of diuretic, steroid and vasopressor
administration on daily urine output, urinary sodium
excretion, fluid balance and sodium balance in the
multicentre sodium balance study
Table 4.8: Contribution of various sources to the administered daily
fluid and sodium on different study days in the
multicentre sodium balance study
Table 5.1: Baseline characteristics of study patients in the fluid
bolus study
Table 5.2: Fluid boluses prevalence and contribution to the daily
fluid balance according to the days
Table 5.3: Indication and the success rate (as judged by the treating
clinician) for a fluid bolus in patients with severe
sepsis and septic shock after the initial 6 hours of
resuscitation
Table 5.4: Effect of measured variables before and 1 hour after fluid
boluses
Table 5.5: Effect on acid-base status and serum electrolytes before
and 1 hour after albumin boluses
Table 5.6: The effect of 0.9 % saline and 4% albumin infusion on
serum sodium, chloride and haematocrit.

Contents
16
Table 5.7: Parameters of lung injury 2 hours after initiation of
mechanical ventilation and administration of i.v. fluids
and ruthenium red
Table 5.8: The effect of fluid boluses on hemodynamic parameters
and lung ultrasound “B lines” before, halfway, end and
1 hour later
Table 5.9: Effect of fluid boluses on the respiratory parameters
Table 5.10: Effect of fluid boluses on the cardiac echocardiographic
parameters in healthy subjects
Table 5.11: Effect of fluid boluses on blood parameters.
Table 6.1: Characteristics and outcomes of patients classified as
ICU survivors and non-survivors
Table 6.2: ICU mortality and raw and adjusted OR (95% CI) for
various serum sodium categories with reference to
serum sodium of 135 -144.9 mmol for highest and
lowest serum sodium in the first 24 hours of ICU
admission
Table 6.3: Serum sodium (highest in first 24 hours during an ICU
admission) and adjusted ICU mortality for various
diagnostic categories
Table 6.4: Characteristics and outcomes of patients with non-
respiratory or respiratory admission diagnosis
Table 6.5: OR (95% CI) for the risk of being admitted to ICU with a
respiratory diagnosis
Table 6.6: The comparative amount to sodium, albumin and
volume of the different fluids used in the animal study
Table 6.7: Effect of administered fluids on serum sodium, chloride
and haematocrit
Table 7.1: Drugs which are incompatible with glucose
Table 7.2: Current contribution of sodium (mmol) from various
sources

Summary
17
Summary
Fluid administration and electrolyte management is perhaps the
most common intervention in hospital. Acute lung injury is common
in critically ill patients and is associated with increased morbidity
and mortality. The current literature suggests that administration of
fluids is not straightforward and there are concerns of potential
harm with fluid administration. Similarly electrolyte abnormalities
are known to have adverse effects in critically ill patients. This work
focuses on the effects of fluid and electrolyte management on lung
injury.
Effects of sodium, fluid boluses and osmolality on lung injury were
separately investigated. I utilised animal models, healthy human
volunteers, clinical and epidemiological studies to investigate the
effects of fluid and electrolyte management on lung injury
Sodium: Current levels of sodium administration are more than
three times the NHMRC recommendations in both adult and
paediatric patients, most of which is derived from inadvertent
sources such as drug infusions, drug boluses and flushes. Such
high levels of administration lead to positive sodium balance which

Summary
18
in turn causes an expansion of the extracellular fluid compartment
and is associated with respiratory dysfunction as evidenced by
decreased oxygen levels and prolong length of invasive mechanical
ventilation.
Fluid boluses: Utilising both basic sciences and clinical studies I
found that bolus administration of intravenous fluids had minimal
physiological benefit in the circumstances investigated and tended
to be harmful. In patients with severe sepsis there was a decrease in
oxygen levels after their administration, in healthy subjects after
administration of 0.9% saline there was evidence of interstitial
oedema, and in animal studies bolus i.v. fluids resulted in
permeability pulmonary oedema despite a “safe” (non-hydrostatic)
left heart pressure. Such lung injury after administration of fluid
boluses is possibly through activation of endothelial calcium ion
channels (transient receptor potential vanilloid 4 (TRPV4) channels.
This fluid induced lung injury was prevented by administration of a
relatively specific TRPV4 blocker (ruthenium red).
Hyperosmolality: Using animal studies I found that induced
hypernatremia was lung protective in acute lung injury,
independent of fluid or sodium load. Based on my animal work, I
hypothesised that lung-protective effects of hypernatremia would
reduce its general adverse effects, leading to amelioration of the
increase in mortality risk in patients with lung injury. To examine

Summary
19
this we utilised a large administrative database (from the Australia
New Zealand Intensive Care Society Centre for Outcome and
Resource Evaluation (ANZICS CORE)) and found that high
admission serum sodium was associated with an increased odds for
ICU death, except in respiratory patients.
In critically ill patients (i) inadvertent sodium administration is
common which leads to a large positive sodium balance which is
associated with adverse respiratory effects (ii) bolus administration
of fluid can induce lung injury, and (iii) induced hyperosmolarity
may be lung protective.
Declaration
20
DECLARATION
I certify that this thesis does not incorporate without acknowledgment any
material previously submitted for a degree or diploma in any university;
and that to the best of my knowledge and belief it does not contain any
material previously published or written by another person except where
due reference is made in the text.
Shailesh Bihari
Acknowledgement
21
ACKNOWLEDGEMENTS
Firstly, I would like to acknowledge the contribution that my
supervisors, Prof Andrew Bersten and Dr Dani Dixon, have made to
my development as a researcher and a professional. Most of all,
Andrew, you have selflessly given of your vast knowledge and
experience as a passionate and diligent clinician, researcher and
leader. Amongst many things, you have provided me with the
opportunity to learn from others, you have stretched me beyond my
discipline, and you have improved the clarity and breadth of my
thinking. I am truly grateful for the time you have dedicated to me
and for your persistent commitment to helping me become the best
that I can be. I thank you for culturing an environment where
science is discussed philosophically, where I was free to argue a
position or hypothesis, where I was given advice yet also free to
make my own mistakes. Thank you and I hope that I have made you
proud.
Sincere thanks goes to Dr Dani-Louise Dixon for her
expertise, patience in teaching and assistance with laboratory work.
Most of all for being there all the time during this work. Thanks to
all past and present members of the laboratory (Dr Alison Elder,
Kim Griggs, Dr Mark Lawrence) who have assisted in various
aspects of this work.
Thank you also to everyone within the Department of
Critical Care Medicine; including medical and nursing staff for
providing such a positive learning environment and supporting my
Acknowledgement
22
research around patient care. Special mentions to Dr Ubbo
Wiersema, Dr Shivesh Prakash, Dr Andrew Holt and Dr Claire
Baldwin for your invaluable discussions and help with various
stages of this work. I will like to thank the research nurses both
present (Elisha Matheson and Kate Schwartz) and past (Amy Waters
and Alana St John) for their support with the clinical aspect of the
PhD.
This research was also enabled by NHMRC post graduate
scholarship, Intensive Care foundation seeding grant, Flinders
Centre for Clinical Change & Health Care Research Top-up
Scholarship and Department of Critical Care Medicine Research
Funds. Other resources that were kindly utilised from Flinders
University/Medical Centre departments include: Department of
Cardiology (Dr Carmine Depasquale), Department of Respiratory
Medicine (David Schembri), Department of Emergency Medicine (Dr
David Teubner), Department of Biomedical engineering and staff at
the animal house.
I will also like to thank the Australian and New Zealand
Intensive Care Society (ANZICS) Clinical Trials Group (CTG) and the
George Institute for Global Health for providing me an opportunity
to conduct those multi-centre studies and the Australian and New
Zealand Intensive Care Society Adult Patient Database (ANZICS–
APD) for providing access to the data base. Special mention and
thanks to Dr Sandra Peake (The Queen Elizabeth Hospital, South

Acknowledgement
23
Australia) and Dr Michael Bailey (Monash University, Melbourne,
Australia) for their help and support in this project.
To the study participants, this contribution would not have
been possible without you.
Finally and importantly, this candidature would not have
been one of the most rewarding and enjoyable pursuits of my life,
and without the love, practical support, encouragement, patience
and prayers of my family and closest friends. Most of all to my wife
Himani, thank you, I love you. Finally I dedicate this work to my
dearest son Rayan, and daughter Umber.

Abbreviations and symbols
24
ABBREVIATIONS AND SYMBOLS
ACCP American College of Chest Physicians
AIDS Acquired immunodeficiency syndrome
AKI Acute kidney injury
ALI Acute lung injury
ANG2 Angiopoietin 2
ANOVA Analysis of variance
ANP Atrial naturitic peptide
ANZICS–APD Australian and New Zealand Intensive Care Society Adult
Patient Database
ANZPICR Australian and New Zealand Paediatric Intensive Care Registry;
APACHE Acute physiology and chronic health evaluation
ARDS Acute respiratory distress syndrome
ATS American thoracic society
BAL Broncho alveolar Lavage
BiPAP Bi-phasic positive airway pressure
BIVA Bioelectrical impedance vector analysis
BMI Body mass index
BP Blood pressure
Ca2+ Calcium
CCI Charlson co-morbidity index age adjusted score.
CHF Chronic heart failure
CI Confidence interval
COPD Chronic obstructive pulmonary disease
CRRT Continuous renal replacement technique

Abbreviations and symbols
25
CVP Central venous pressure
CVVH Continuous veno-venous haemofiltration
CVVHDF Continuous veno-venous haemodiafiltration
DLCO Diffusing capacity of the lung for carbon monoxide
dX/dV Delta reactance/delta lung volume
ECF Extracellular fluid
Echo Echocardiography
EDD Extended daily dialysis
EELV End expiratory lung volume
EET Epoxyeicosatrienoic acid
ERS European respiratory society
F female
FB Fluid boluses
FEV1 Forced expiratory volume in one second
FFP Fresh frozen plasma
FILI Fluid induced lung injury
FiO2 Fraction of inspired oxygen
FRC Functional residual capacity
FVC Forced vital capacity
GCS Glasgow coma scale
GFR Glomerular filtration rate
HDU High dependency unit
HR Heart rate
HTS Hypertonic saline

Abbreviations and symbols
26
i.v. Intravenous
IC Inspiratory capacity
ICF Intra-cellular fluid
ICU Intensive care unit
ID Subject identification number.
IFNγ Interferon gamma
IOS Impulse Oscillometry system
IQR Inter-quartile range
ITGV Intra thoracic gas volume
LIS Lung Injury score
LOS Length of stay
LPS Lipopolysaccharide
LVOT Left ventricular outflow tract
M Male
MAP Mean arterial pressure
MPO Myeloperoxidase
MV Mechanical ventilation.
NA Not applicable
NHMRC National Health and Medical Research Council
Na+ Sodium
NIBP non-invasive blood pressure
OR Odd’s ratio
OT Operation theatre
PaO2 Partial pressure of arterial oxygen

Abbreviations and symbols
27
PEEP Positive end expiratory pressure
PEFR Peak expiratory flow rate
PFT Pulmonary function test
PGI2 Prostacyclin
PICU Paediatric intensive care unit
PIM Paediatric Index of Mortality;
PLA2 Phospholipase A2
PLR Passive leg raising
PRC Packed red blood cells;
RAAS Renin angiotensin aldosterone system
ROC Receiver operating characteristic.
RR Respiratory rate
RRT renal replacement technique
RV Residual volume
SAPS Simplified acute physiology score
SBL supine body length.
SCCM Society of Critical Care Medicine Consensus Conference
SD standard deviation.
SD Standard deviation
SEM Standard error of the mean
SOFA Sequential organ failure assessment score.
TBW Total body water
TLC Total lung capacity
TNF-α Tumour necrosis factor alpha

Abbreviations and symbols
28
TPN Total parental nutrition
TRP Transient receptor potential
TRPV Transient receptor potential vanilloid
U Unit
USG Ultrasonography
VWF von Willebrand factor
VT Tidal volume
VTI Velocity time integral
WPBs Weibel–Palade bodies

Abbreviations and symbols
29
SYMBOLS
↑ Increased/elevated
↓ Decreased/reduced
< Less than
≤ Less than or equal to
> Greater than
≥ Greater than or equal to
# Number
ρ rho
° Degrees
Ω Ohm
~ Approximately/no substantial change

Preface
30
PREFACE
This preface is to certify that several chapters within this thesis
contain content that is substantially unchanged from the content of
multi-author papers which have either been published or are being
prepared for publication, (Appendix 5) which may lead to some
repetition of ideas. The following statements outline the contribution
of all authors to the content of manuscripts that have been included
in this thesis.
Chapter 1 Introduction
Book Chapter : Bihari S and Bersten AD. Sodium loading in critical
care - textbook “Diet and Nutrition in Critical Care” under “Specific
nutrients” published by Springer 2013
Bihari S: Proposed the design of the literature review, determined
the search terms and completed the search strategy, data
extraction, data synthesis and analysis and interpretation, before
preparation the initial draft and revisions of the manuscript
Bersten AD: Contributed to the literature review design,
interpretation of results and revisions of the manuscript
Chapter 3 Sodium administration in ICU patients
Bihari S, Ou J, Holt AW, Bersten AD. Inadvertent sodium loading in
critically ill patients. Crit Care Resusc. 2012;14:37.
Bihari S: Proposed the study design, and completed data collection,
analysis and interpretation, before preparation of the initial draft
and revisions of the manuscript
Ou J: Helped with data collection
Holt A: Modified the original idea and contributed to the manuscript
revision

Preface
31
Bersten AD: contributed to the study design, interpretation of
results and revisions of the manuscript
Bihari S, Peake SL, Seppelt IM, Williams P, Bersten AD. Sodium
administration in critically ill patients in Australia and New Zealand:
a multi-centre point prevalence study Crit Care Resusc 2013; 15: 294-
300.
Bihari S: Proposed the study design, analysis and interpretation,
before preparation of the initial draft and revisions of the
manuscript
Peake SL: Contributed to the study design and revisions of the
manuscript
Seppelt IM: Contributed to the conduct of the point prevalence
study
Williams P: Contributed to the study design
Bersten AD: Contributed to the study design, interpretation of
results and revisions of the manuscript
Bihari S, Taylor S, and Bersten AD. Inadvertent sodium loading with
renal replacement therapy in critically ill patients. J Nephrol. 2014
Feb 4. [Epub ahead of print]
Bihari S: Proposed the study design, and completed data collection,
analysis and interpretation, before preparation of the initial draft
and revisions of the manuscript
Taylor S: Contributed to the study design
Bersten AD: Contributed to the study design, interpretation of
results and revisions of the manuscript
Bihari S, Festa M, Peake SL, Seppelt IM, Williams P, Wilkins B and
Bersten AD. Sodium administration in critically ill paediatric patients
in Australia and New Zealand: a multi-centre point prevalence study.
Crit Care Resusc 2014; 16: 112-118.
Preface
32
Bihari S: Proposed the study design, analysis and interpretation,
before preparation of the initial draft and revisions of the
manuscript
Festa M: Contributed to the study design and revision of the
manuscript
Peake SL: Contributed to the study design and revisions of the
manuscript
Seppelt IM: Contributed to the conduct of the point prevalence
study
Williams P: Contributed to the study design
Wilkin B: Contributed to the data interpretation
Bersten AD: Contributed to the study design, interpretation of
results and revisions of the manuscript
Chapter 4 Sodium balance in ICU patients
Bihari S, Baldwin C and Bersten AD. Fluid balance does not predict
estimated sodium balance in critically ill mechanically ventilated
patients. Crit Care Resusc 2013; 15: 89-96
Bihari S: Proposed the study design, and completed data collection,
analysis and interpretation, before preparation of the initial draft
and revisions of the manuscript
Baldwin C: Contributed to the bioelectrical impedance spectroscopy
measurement and revision of the manuscript
Bersten AD: Contributed to the study design, interpretation of
results and revisions of the manuscript
Bihari S, Peake S, Prakash S, Saxena M, Campbell V, Bersten AD.
Sodium balance, not fluid balance, is associated with respiratory
dysfunction in mechanically ventilated patients: a prospective, multi-
centre study. Manuscript accepted in Crit Care Resusc 2015

Preface
33
Bihari S: Proposed the study design, analysis and interpretation,
before preparation of the initial draft and revisions of the
manuscript .
Peake SL: Contributed to conduct of study at her study centre – The
Queen Elizabeth Hospital (South Australia) and revisions of the
manuscript
Prakash S: Contributed to the data analysis
Saxena M: Contributed to conduct of study at his study centre – St.
George Public Hospital, Sydney NSW
Campbell V: Contributed to conduct of study at his study centre –
Nambour Hospital (QLD)
Bersten AD: Contributed to the study design, interpretation of
results and revisions of the manuscript
Chapter 5 Fluid bolus
Bihari S, Prakash S, Bersten AD. Post resuscitation fluid boluses in
patients with severe sepsis and septic shock (PRICE study). Shock
2013; 40: 28-34
Bihari S, Prakash S, Bersten AD. Early changes in serum electrolytes
and acid-base status with administration of 4% albumin. Intensive
Care Med. 2014; 40:1392-3.
Bihari S: Proposed the study design, and completed data collection,
analysis and interpretation, before preparation of the initial draft
and revisions of the manuscript
Prakash S: Contributed to the data collection
Bersten AD: Contributed to the study design, interpretation of
results and revisions of the manuscript
Bihari S, Wiersema U, Schembri D, Depasquale C, Dixon D, Lawrence M, Bowden J, Dixon D and Bersten AD. Interstitial pulmonary edema despite normal echocardiographic indices in healthy volunteers following 0.9% Saline bolus when compared with 4% albumin and 5% glucose. Manuscript under review

Preface
34
Bihari S: Proposed the study design, analysis and interpretation,
before preparation of the initial draft and revisions of the
manuscript
Wiersema U: Contributed to conduct of study with
echocardiographic measurements
Schembri D: Contributed to conduct of study with respiratory
measurements
Depasquale C: Contributed to conduct of study with
echocardiographic interpretations and revision of the manuscript
Dixon D: Contributed to the study with laboratory measurements
and revision of the manuscript
Lawrence M: Contributed to the study with laboratory
measurements
Bowden J: Contributed to conduct of study with respiratory
interpretations and revision of the manuscript
Bersten AD: Contributed to the study design, interpretation of
results and revisions of the manuscript
Bihari S, Dixon D, Lawrence M and Bersten AD. Ruthenium red
inhibits intravenous fluid induced permeability lung oedema
suggesting a TRPV4 mechanism. Manuscript under review
Bihari S: Proposed the study design, analysis and interpretation,
before preparation of the initial draft and revisions of the
manuscript
Dixon D: Contributed to the animal study design, data
interpretation and manuscript preparation
Lawrence M: Contributed to the study with PCR and ELISA
measurements (results not included in the PhD)
Bersten AD: Contributed to the study design, interpretation of
results and revisions of the manuscript

Preface
35
Chapter 6 Effect of serum sodium and osmolality on lung injury
Bihari S, Peake S, Bailey M, Pilcher D, Prakash S, Bersten AD.
Admission high serum sodium is not associated with increased ICU
mortality risk in respiratory patients. J Crit Care. 2014 [Epub ahead
of print].
Bihari S: Proposed the study design, analysis and interpretation,
before preparation of the initial draft and revisions of the
manuscript
Peake SL: Contributed to the study design and revisions of the
manuscript
Bailey M: Contributed to the statistical analysis and revision of the
manuscript
Pilcher D: Contributed to the study design
Prakash S: Contributed to the data analysis
Bersten AD: Contributed to the study design, interpretation of
results and revisions of the manuscript
Bihari S, Dixon D, Lawrence M and Bersten AD. Induced
hypernatremia reduces acute lung injury, independent of fluid or
sodium load. Manuscript under review
Bihari S: proposed the study design, analysis and interpretation,
before preparation of the initial draft and revisions of the
manuscript
Dixon D: Contributed to the animal study design, data
interpretation and manuscript preparation
Lawrence M: Contributed to the study with PCR and ELISA
measurements (results not included in the PhD)
Bersten AD: contributed to the study design, interpretation of
results and revisions of the manuscript.

Introduction
36
CHAPTER 1: INTRODUCTION
Fluid administration and electrolyte management is a common
intervention in hospital and disturbances in fluid and electrolytes
are among the most common clinical problems encountered in the
intensive care unit (ICU) (Bellomo 2014; Lee 2010; Sedlacek et al.
2006).
Acute lung injury is common in critically ill patients and is
associated with increased morbidity and mortality. The current
literature suggests that administration of fluids is not innocuous
and there are concerns of potential harm with fluid administration
(Bellomo 2014). Similarly electrolyte abnormalities are known to
have adverse effects in critically ill patients (Rosner et al. 2010;
Sedlacek et al. 2006).
1.1 Intravenous fluid administration, and fluid boluses,
are common practice
Administration of intravenous (i.v.) fluid for the purpose of either
fluid resuscitation or for maintenance fluid requirements is
ubiquitous in pre-hospital and hospital practice, particularly in
critically ill patients. 0.9% saline, the most commonly used i.v.
crystalloid, has annual sales of 10 million and 200 million litres in
the UK and USA, respectively (data from Baxter Healthcare) (Award
et al. 2008). During fluid resuscitation, fluid boluses, the rapid
administration of a set volume of i.v. fluid, are usually administered.
The speed, amount, timing, and physiological targets for such fluid
delivery are determined by clinicians on the basis of physiological

Introduction
37
reasoning, observational evidence, personal preference, local
culture, mentorship, marketing forces, heuristic bias, guidelines,
and expert opinion (Bellomo 2014).
Uncertainty regarding timely administration of an appropriate
volume and type of i.v. fluid underpins many significant studies of
fluid therapy over the last 10 years (Finfer et al. 2004; Myburgh et
al. 2012; Perner et al. 2012; Delaney et al. 2013), many supported
by the National Health and Medical Research Council (NHMRC),
where large volumes of fluid were administered. For example, in
patients receiving early goal direct therapy 3499±2438 ml of fluid
was administered, while patients in the control arm received
4981±2984 ml of fluids in the first 24 hours (Rivers et al. 2001), and
in the 6S study (Perner et al. 2012), based on a 72 kg person,
patients on day 1 in the hydroxyethyl starch group received a
median 5825 ml (trial plus other fluid).
1.2 Acute Lung injury
Acute lung injury and its more severe form acute respiratory
distress syndrome (ARDS) has a substantial impact on public health
(Rubenfeld et al. 2005). The incidence of ARDS varies considerably
across the world (Rubenfeld et al. 2005; Luhr et al. 1999; Bersten et
al. 2002), in part relating to availability of intensive care services
(Linde-Zwirble et al. 2004). Recent data suggest an incidence of
ARDS, ranging from 15.3–58.7 cases per 100,000 person-years
(Rubenfeld et al. 2005; Arroliga et al. 2002). Attributable mortality
also varies with reported ranges of 41–58% (Rubenfeld et al. 2005;

Introduction
38
The ANZIC Influenza Investigators 2009; Zilberberg et al. 1998).
The problem of ARDS has been highlighted by the recent H1N1
influenza pandemic where intensive care units (ICU) treated an
unprecedented number of cases of ARDS (The ANZIC Influenza
Investigators 2009). Since the original description of ARDS
(Ashbaugh et al. 1967), substantial progress has been made in
understanding the natural history and pathogenesis of this lethal
syndrome but it still remains a major cause of admission, morbidity
and mortality in ICU patients. At Flinders Medical Centre ICU more
than sixty percent of patients require mechanical ventilation during
their stay in the ICU and lung protective mechanical ventilation (The
Acute Respiratory Distress Syndrome Network 2000) remains the
only current treatment strategy for ARDS.
1.3 Is intravenous fluid administration safe?
A general adverse effect associated with i.v. fluids is positive fluid
balance which has been associated with poorer kidney function
(Bouchard et al. 2009), delayed return of gastrointestinal function
after surgery (Lobo et al. 2002), diminished lung function and longer
duration of mechanical ventilation (Wiedemann et al. 2006). In the
CHEST study, which compared fluid boluses with either
hydroxyethyl starch or 0.9% saline, 25.6% of patients developed
new onset respiratory failure (Myburgh et al. 2012). Positive fluid
balance, a common effect of fluid administration has also been
associated with increased mortality in both patients with lung injury
Introduction
39
(Sakr et al. 2005) and sepsis (Simmons et al. 1987; Murphy et al.
2009).
The FEAST randomized trial (Maitland et al. 2011) compared no
fluid resuscitation with 0.9% saline (crystalloid) or 5% albumin
(colloid) resuscitation in African children (n=3170) with severe
infection. Unexpectedly the control group, no fluid boluses, had the
least mortality at both 48 hours and at four weeks when compared
with groups receiving fluid boluses of either 0.9% saline or 5%
albumin. While there may be have been specific issues related to the
study population and associated management, this well conducted
trial challenges current concepts regarding fluid resuscitation for
patients with severe infection. However, possible mechanisms for
the increase in mortality remain speculative.
1. 4 Electrolyte abnormality in ICU
Electrolyte abnormalities are known to have adverse effects in
critically ill patients (Rosner et al. 2010; Sedlacek et al. 2006).
Hypernatremia, which generally reflects inadequate total body water
and can be exacerbated by sodium overloading, contributes to high
serum osmolality and is associated with increased mortality risk in
critically ill patients, independent of age and severity of disease
(Linder et al. 2007; Hoorn et al. 2008).
1. 5 Fluids and their component- electrolytes and
resultant osmolality
Commonly administered fluids have different constituents in terms
of their electrolytes and the resultant osmolality. For example 0.9%
Introduction
40
saline contains sodium 150 mmol/l, chloride 150 mmol/l with an
osmolality of 300 mOsm/l (Baxter Sodium Chloride 0.9%) where as
4% albumin contains sodium 140 mmo/l, chloride 128 mmol/l and
albumin 40 g/l with an resultant osmolality 270 mOsm/l (CSL
Biotherapies).
1.6 Why is sodium important - physiologic
considerations
Sodium (Na+) is a major extracellular ion and can affect the
distribution of water in intra- and extracellular spaces, and their
balance determines the serum osmolality. Multiple studies have
shown that fluid (water and sodium) overload may contribute to
poor outcomes. Sodium administration in ICU can lead to Na+
repletion (in the presence of ongoing losses) or loading.
Total body sodium is about 60 mmol/kg; about 4000 to 4200 mmol
in an adult male. Sodium distributes into the extracellular fluid
(50%), bone (45%) and intracellular fluid (5%). Exchangeable Na+ is
70% of the total Na+ (measured using sodium24). The non-
exchangeable Na+ is mostly in bone crystal.
Intracellular sodium is low - about 12 mmol/l for muscle cells and
20 mmol/l for red blood cells. Intracellular levels are kept low by
both Na+-K+ ATPase pumps which exchange intracellular sodium for
extracellular potassium and the low sodium permeability of the
membrane. Interstitial and intravascular compartments have

Introduction
41
similar, sodium levels, close to 140 mmol/l. There are two factors
responsible for this phenomenon
1) Gibbs-Donnan effect- this causes the sodium concentration
[Na+] in plasma to be higher than [Na+] in interstitial fluid by
about 6 or 7 mmol/l due to the presence of plasma proteins
leading to non-diffusible Na+ in plasma which results in an
increase in [Na+] by 6 or 7 mmol/l.
2) Plasma solid effects: plasma consists of plasma water (93%)
and plasma solids (7%). Plasma solids are mostly plasma
proteins. Although Na+ is present only in the plasma water
component, it is measured as though it was present in whole
plasma. This is a problem in the common laboratory methods
for measuring [Na+] such as flame emission
spectrophotometry, and the indirect ion-selective electrode.
The decrease in measured plasma [Na+] due to the plasma solids
effect is about the same magnitude as the increase in [Na+] in
plasma water due to the Gibbs-Donnan effect. The result is that the
measured [Na+] is about same as the [Na+] in interstitial fluid.
It is noteworthy that not only does the Gibbs- Donnan equilibrium
result in an increase in the [Na+] in the plasma; it also contributes
to the actual oncotic pressure which is higher than predicted by the
Van’t Hoff equation for the actual protein concentration (0.9
mOsm/l) that is present. Hence, the Gibbs- Donnan equilibrium
contributes to the fluid equilibrium dynamics between the

Introduction
42
intravascular and interstitial spaces, although it is measured
equally in both spaces.
1.7 Control of sodium and its applications to intensive
care
The extracellular volume is primarily regulated through control of
Na+ balance, which is, in turn, regulated through control of effective
plasma volume and its composition. Although the standard Western
diet contains approximately 150 mmol of Na+ per 24 hours, this
varies widely and urinary Na+ excretion varies between 0.2 and 242
mmol per 24 hours, (Intersalt, 1988) reflecting a balance between
Na+ input and output.
1.7.1 RENAL HANDLING OF SODIUM
99.4% of the filtered Na+ is reabsorbed by the kidney. Sodium
crosses the luminal membrane to enter the proximal tubule. About
65% of the filtered load of Na+ is reabsorbed in the proximal tubule.
This is about 16,400 mmol/day (0.65 x 140mmol/l x 180 l/day) and
occurs via:
- diffusion through sodium channels
- carrier mediated facilitated diffusion through the luminal
membrane
- co-transport (with glucose and amino acids)
- counter transport (against H+ secretion)
The rest of the Na+ is reabsorbed through the Na+K+Cl- ATPase
pump (a metabolically active pump) in the thick ascending limb of
the loop of Henle and the Na+Cl− symporter in the distal convoluted
Introduction
43
tubules in the kidneys (site of action of loop and thiazide diuretics
respectively).
The daily solute loss in a healthy kidney is about 700 mOsmol/day.
As the maximum urinary osmolality under extreme condition is
1400 mOsmol/kg, to excrete the solute load, the obligatory or
minimum water loss as urine is about 500 ml/day (i.e. 1400/700).
Solutes that contribute to the majority of the daily solute load are :
Na+ : 100-150 mmol/day, K+ : 70-100 mmol/day, Cl- : 150
mmol/day, urea : 400 mmol/day and creatinine : 12 mmol/day
If the daily intake of Na+ of a healthy individual is decreased to low
amounts (say 10 mmol/day) then the kidney, over a few days is able
to decrease the Na+ excretion to comparable low levels which forms
the rationale of decreasing the Na+ load in patients with chronic
kidney disease.
Hormones that act on the kidney to regulate salt and water together
with their site of action are shown in Table 1.1. Other source of
water and Na+ loss from the body are summarized in Table 1.2.

Introduction
44
Table 1.1: Hormonal control of sodium and water in the kidney
Table 1.2: 24 hour losses of sodium and water from extra renal
sites
Site Volume (ml) Na + (mmol/l) losses
Salivary 500 to 1000 50
Gastric 1500 60 to 100
Pancreatic 400 to 1000 140
Bile 400 to 1000 140
Small Intestine
1000 to 3000
140
Large Intestine 60
Hormones Site of action Effect
Aldosterone Collecting duct Increase sodium
reabsorption
Increase water
reabsorption
Angiotensin II Proximal tubule, thick
ascending loop of Henle/
distal tubule, collecting
tubule
Increase sodium
reabsorption
Increase water
reabsorption
Antidiuretic hormone Distal tubule, collecting
tubule
Increase water
reabsorption
Atrial natriuretic
peptide
Distal tubule, collecting
tubule
Increase sodium
reabsorption

Introduction
45
1.7.2 CRITICALLY ILL PATIENTS HANDLING OF SODIUM
Critically ill patients are different from the healthy population in
multiple ways and are at risk of sodium retention
Most of them cannot control their own dietary salt intake
Serum albumin levels are low hence affects the Gibbs-
Donnan equilibrium thereby altering the distribution of water.
Fluid overload is commonly present and a positive fluid
balance is associated with poor lung (Wiedemann et al. 2006)
and kidney function (Bouchard et al. 2009), delayed return of
gastrointestinal function after surgery (Lobo et al. 2002) and
an increased risk of mortality (Boyd et al. 2011).
Stress and the resultant effect on the plasma volume leads to
the activation of the renin angiotensin aldosterone axis
causing Na+ retention.
Acute kidney injury is common in critically ill patients and
many of them require renal support (5% of patients admitted
to the ICU).
Although a moderate range of total body sodium content is well
tolerated, once effective plasma volume is significantly affected,
short-term and longer-term homeostatic responses are initiated. A
fall in effective plasma volume leads to activation of baroreceptors
with augmentation of myocardial performance and peripheral
vascular tone, and maintenance of plasma volume through shift of
fluid from the interstitium. Longer term responses include reduced
Na+ loss by the kidney and sweat glands, through a direct effect of

Introduction
46
aldosterone. When the baroreceptors are stimulated the increase in
sympathetic tone reduces Na+ loss through reduced glomerular
filtration rate, and through increased tubular Na+ reabsorption,
both through a direct effect and through the actions of increased
renin, angiotensin II, and aldosterone. Dopamine is produced in the
kidney following conversion from l-dopa under the action of the
cytosolic enzyme l-amino acid decarboxylase present in the proximal
tubules (Seri et al. 1988). This is upregulated following a high-salt
administration, leading to increased urinary sodium loss as
dopamine acts to inhibit sodium reabsorption in the proximal
tubule, (Seri et al. 1990) and contributes to the increase in urine
output sometimes seen following administration of low-dose
dopamine. The renal synthesis of prostaglandins, such as
prostaglandin E2 and prostacyclin (PGI2), tends to maintain renal
blood flow and glomerular filtration rate through vasodilation, and
directly increase water and sodium excretion. In critical illness,
decreased glomerular filtration rate and impaired activity of
dopamine in the proximal tubule of the kidney (Seri et al. 1988),
where dopamine normally inhibits Na+ reabsorption (Seri et al.
1990), lead to Na+ retention. As dopaminergic renal vasodilation in
part acts through release of PGI2, critically ill patients already have
a prostaglandin-driven kidney rendering it ineffective. Moreover,
baroreflex activation which is mediated by several systems (renin
angiotensin aldosterone system (RAAS), sympathetic activity,
aldosterone, endothelin and vasopressin) have hydro-saline
Introduction
47
retention activity. Vasopressin mediates its effects via
adenylcyclase-dependent signalling in the renal collecting ducts and
is accomplished by upregulation of the aquaporin-2 water channels
(Goldsmith 2006). This up regulation results in increased movement
of water from the collecting ducts back into the plasma, increasing
free water reabsorption, which leads to a further increase in water
retention. Furthermore reduction in intrarenal perfusion and the
consequent fall in GFR creates a viscous cycle leading to further
reflex activation of RAAS with tubular reclamation of salt and water.
Positive-pressure ventilation and positive end-expiratory pressure
(PEEP) raise intrathoracic pressure, resulting in reduced venous
return and transmural pressure, with consequent complex
neurohumoral responses leading to Na+ and water retention
(Bersten 2006). Because assisted, supported, and spontaneous
modes of ventilation progressively ameliorate the elevation of
intrathoracic pressure and its consequences, different ventilator
modes variably reduce venous return. Reductions in stroke volume,
cardiac output, and BP then lead to stimulation of high-pressure
baroreceptors, and altered regional blood flow. Both low and high-
pressure baroreceptor stimulation lead to increased sympathetic
outflow, and release of renin, aldosterone, and ANP. Renal
denervation does not prevent sodium and water retention (Boemke
et al. 1998). Angiotensin-converting enzyme inhibitors (Kaczmarczyk
et al. 1992) and deliberate hypervolemia, (Boemke et al. 1998)

Introduction
48
however, reduce sodium and water retention during positive-
pressure ventilation.
TABLE 65-1: FACTORS THAT INFLUENCE
Right atrial transmural pressure and stretch are also reduced by
PEEP and positive-pressure ventilation, and this leads to reduced
secretion of ANP, (Wilkins et al. 1995; Andrivet et al. 1988) with
consequent reduction in water and sodium excretion reversed by
restoration of venous return with lower body positive pressure.
PEEP levels above 10 cm H2O may lead to an increase in central
venous pressure (CVP), and regional venous pressures, which in the
kidney contribute to reduced sodium and water excretion,
independent of neurohumoral effects (Rossaint et al. 1993). In
summary, various neurohumoral responses to positive pressure
ventilation lead to retention of sodium and water, as a homeostatic
response to raised intrathoracic pressure. A major consequence of
this response is expanded plasma volume, and a tendency toward
systemic and pulmonary oedema.
Although Kotchen and coworkers (Kotchen et al. 2013) have
summarised the problems of high chronic salt intake. Chronic high
salt intake is associated with high blood pressure and increased
rates of cardiovascular disease. Recent clinical trials have shown
that reduced chronic salt intake is associated with decreased risks
of cardiovascular events and death (Kotchen et al. 2013). From a

Introduction
49
more acute medical perspective problems of high salt administration
have not received much attention.
1.7.3 CURRENT NHMRC RECOMMENDATIONS
Recommended dietary daily intake of sodium in a healthy person
according to age and sex has been published by the Australian
National Health and Medical Research Council (NHMRC) and the
New Zealand Ministry of Health (MoH) (Nutrient Reference Values
for Australia and New Zealand including Recommended Dietary
Intakes, 2013) but there are no such recommendations for critically
ill patients.
1.8 Distribution and control of water
In the normal adult male, total body water accounts for
approximately 60% of body weight. In turn, approximately 40% of
body weight is intracellular water and approximately 20% is
distributed into the extracellular fluid volume, made up of
interstitial fluid (approximately 16%), plasma volume (approximately
4%), and usually negligible volumes of lymph and transcellular fluid
(cerebrospinal fluid and pericardial, intrapleural, and peritoneal
fluid). The extracellular volume is distributed in interstitial fluid and
plasma volume, and consists of two compartments. Seventy percent
of the volume is rapidly equilibrating (approximately 20 minutes),
and the remainder slowly equilibrates (approximately 24 hours) in
dense connective tissue and bone. Sodium balance regulates the

Introduction
50
extracellular volume, whereas water balance regulates the
intracellular volume (Bersten 2006).
Water balance is primarily determined by thirst and the renal action
of arginine vasopressin, also termed antidiuretic hormone, which is
secreted from the posterior pituitary following synthesis in the
hypothalamus, in response to a wide variety of stimuli, particularly
plasma osmolality.
Vasopressin activates V 2 receptors on the basolateral surface of the
distal renal tubule and collecting duct, leading to an increase in
water permeability, and reabsorption of filtrate, through fusion of
aquaporin-2 with the luminal membrane (Table 1.1). Vasopressin
also reduces water clearance by decreasing renal medullary blood
flow, and independently increases the renal medullary concentration
gradient by stimulating a urea transporter (Holmes et al. 2001).
Under normal circumstances, a plasma osmolality of 280 mOsm/kg
suppresses vasopressin secretion allowing maximal urinary dilution.
As osmolality progressively rises to 295 mOsm/kg, so does the
secretion of vasopressin, with an associated reduction in free water
clearance. The kidney can normally concentrate filtrate up to 1200
mOsm/kg under the influence of vasopressin, although this tends
to deteriorate with age and renal dysfunction. High-pressure stretch
receptors in the aortic arch and carotid sinus sense a significant
(>10%) fall in blood pressure (BP), leading to an increase in
vasopressin release. As vasopressin also causes vasoconstriction
through stimulation of V1 receptors, this is an important
Introduction
51
homeostatic response in shock, but appears to be reset within 32
hours of sustained hypovolemia (Iwasaki et al. 1995). Stimulation of
low pressure stretch receptors in the atria primarily results in an
increase in both sympathetic tone and renin, and a decrease in
atrial natriuretic peptide (ANP), with vasopressin release unaffected
until the systemic BP falls. Hence from an evolutionary point of view
the human body, when under stress, is designed to conserve water
and sodium.
Administration of fluids together with the propensity to conserve
water and sodium can lead to the development of both systemic and
pulmonary oedema.
1.9 Fluid and lung injury
Radiologic evidence of left ventricular failure is found when the
pulmonary artery occlusion pressure exceeds 17 mmHg (Forrester et
al. 1976). Initially this is seen as upper lobe venous engorgement;
higher hydrostatic pressures are progressively associated with
interstitial and then alveolar oedema (hydrostatic lung injury)
(Forrester et al. 1976). In comparison acute lung injury
(permeability lung injury) is traditionally characterised by protein
rich pulmonary oedema occurring at lower hydrostatic pressures
together with a complex inflammatory infiltrate. However, over the
last 20 years or so concepts regarding the development and
clearance of pulmonary oedema have changed dramatically (Londino
Introduction
52
et al. 2013). For example Kaestle and co-workers (Kaestle et al.
2007) estimated that only 30% of alveolar fluid influx at an elevated
pulmonary capillary pressure was due to direct hydrostatic effects
with the remaining 70% due to active changes in bidirectional fluid
flux. This fundamental conceptual change is consistent with clinical
and chest radiographic improvement in critically ill patients
following negative fluid balance despite the absence of an elevated
hydrostatic pressure (Bersten 2006).
Fluid boluses are often administered with the aim of improving
tissue perfusion (Hollenberg et al. 2001; Zanotti-Cavazzoni et al.
2009), are a common practice in medical and surgical ICUs (Axler et
al. 1997) and are a key component in the effective management of
such patients. However, it is also becoming increasingly evident that
excessive volume administration can worsen outcome (Durairaj et
al. 2008; Vincent et al. 2006; Wiedemann et al. 2006). Recent
evidence from the Feast study (Maitland et al. 2011) which showed
an increase in mortality in children with severe infection with fluid
boluses, raises further questions about the safety of these fluid
boluses.
1.10 Role of TRPV4 channels
The transient receptor potential (TRP) ion channel superfamily is
involved in sensing and transmission of a broad variety of external
or internal stimuli, including mechanical stress (Yin et al. 2010).
TRP vanilloid (TRPV) 4 has mechanotransductive properties and is

Introduction
53
abundantly expressed in pulmonary blood vessels (Yin et al. 2010).
Activation of these channels by shear forces (Troidl et al. 2009),
stretch (Mochizuki et a 2009), over-inflation (Hamanaka et al. 2007;
Jurek et al. 2014), hypothermia (Hamanaka et al. 2007), increased
hydrostatic pressure (Yin et al. 2008) and hypotonicity (Liedtke et al.
2006) leads to the rapid intracellular influx of calcium ions. Calcium
influx is doubled after activation of TRPV4 channels in less than 40
seconds and lasts up to 8 minutes (Parker et al. 2013). In vitro
activation of TRPV4 requires hydrolysis of membrane phospholipids
via phospholipase A2 (PLA2) (Figure 1.1) and subsequent arachidonic
acid metabolism by cytochrome P450 epoxygenases to form
epoxyeicosatrienoic acids (EET) (Jian et al. 2008). EET activation of
TRPV4 channels and the resultant Ca2+ influx leads to increased
permeability of the alveolocapillary barrier, and reduction in alveolar
fluid clearance via down regulation of fluid channels, including
aquaporin (AQP)5 (Sidhaye et al. 2008), manifesting as lung injury
(Alvarez et al. 2006). In addition, TRPV4 activation and elevated
cytosolic Ca2+ concentration may further contribute to acute lung
injury due to effects on endothelial permeability and function via the
exocytosis of Weibel–Palade bodies (endothelial storage vesicles)
(Lowenstein et al. 2005) containing stored proteins including P-
selectin and angiopoietin-2 (Ang-2) (Romani et al. 2003; Fiedler et al.
2004). High pulmonary vascular pressures lead to de-granulation of
Weibel-Palade bodies and increased expression of P-selectin in lung
capillaries which can be blocked with gadolinium, a non-specific

Introduction
54
physiological blocker of TRPV induced calcium influx (Kuebler et al.
1999). P-selectin expression on the endothelium in the presence of
chemotactic mediators including IL-8, is integral to neutrophil
recruitment at sites of tissue inflammation and has been associated
with various forms of acute lung injury in animal models (Mulligan
et al. 1993) and clinically in ARDS (Sakamaki et al. 1995). Ang-2, a
biomarker of lung injury (Terpstra et al. 2013), is low with
conservative fluid therapy which in turn is associated with better
outcomes in acute lung injury (Agrawal et al. 2013; Calfee et al.
2012).
It can therefore be hypothesised that administration of bolus
intravenous fluids leads to a transient rise in the shear forces
across the pulmonary endothelium leading to activation of the
TRPV4 channels and which manifests via secondary processes as
lung injury (Figure 1.1), and may explain the increase in mortality
in the FEAST study (Maitland et al. 2011).
Figure 1.1: Schematic suggesting pathways involved in fluid
induced lung injury

Introduction
55
1.11 Effects of osmolality and its relationship with
sodium
Serum osmolality is one of the chief determinants of movement of
water between the extracellular and intracellular spaces. It is
determined mainly by serum [Na+]. Serum [urea] and [glucose] also
make a small contribution to the serum osmolarity, but the effective
osmolality (tonicity) is largely the result of serum sodium as both
urea and glucose can move freely to intracellular spaces.
Serum osmolarity is expressed per litre (calculated) while osmolality
is per kg (measured). Of the multiple methods available to calculate
the serum osmolarity, probably the simplest formula is the best
(Worthley et al., 1987): 2 X serum sodium (135-140mmol/l) + serum
glucose (4 to 6 mmol/L) + serum urea (3 to 4 mmol/l) = 280 to 290
mOsmol/L. Serum osmolality is measured by utilizing the colligative
property of a solution – freezing point depression; others being
vapour pressure elevation, boiling point elevation and osmotic
pressure.
There is a small difference between the calculated and measured
values accounting for the unmeasured osmotic active ions and
molecules dissolved in the plasma which can lead to spurious low
[Na+] (due the plasma solid effects) and unexplained water
movement.
Since the measured and calculated are reported units of osmolality
and osmolarity respectively there is often confusion as how to

Introduction
56
address the difference between the calculated and measured values
(osmol gap). While it is possible to convert between osmolality and
osmolarity, thereby deriving a more mathematically correct osmol
gap calculation, in actual clinical practice this is not done. This is
because the difference in absolute value of these two measurements
that can be attributed to the difference in units will be negligible in
a clinical setting. For this reason, the terms are often used
interchangeably. A normal osmol gap is < 10 mOsm/kg.
1.12 Effects of high serum sodium (high serum
osmolality)
Hypernatremia is associated with increased mortality risk in
critically ill patients (Linder et al., 2007; Hoorn et al. 2008).
Avoidance of such a state has therefore been considered important.
There have been reports of increased mortality risk with high serum
[Na+] (Darmon et al. 2013) within the first 24 hours of ICU
admission. In addition to causing intracellular dehydration, high
serum osmolarity aggravates peripheral insulin resistance
(Bratusch-Marrain, DeFronzo 1983), leading to hyperglycemia. It
also impairs hepatic gluconeogenesis and lactate clearance and is
associated with neurological impairment that might lead to
prolonged duration of mechanical ventilation and delayed weaning
(Adrogué, Madias 2000; Druml et al. 1986). It can impair cardiac
function, decrease left ventricular contractility (Lenz et al. 1986;
Kozeny et al. 1985) and cause rhabdomyolysis (Acquarone et al.
1989; Opas et al. 1977).
Introduction
57
On the contrary, hyperosmolality (effectively hypertonicity), has
been shown to rescue T cells from suppression by trauma-induced
anti-inflammatory mediators (Loomis et al. 2001), suppresses
neutrophil activation (Angle et al., 1998; Junger et al. 2012; Deith et
al. 2003) and affects macrophage migration (Kim et al. 2013); all of
which can mitigate lung injury (Angle et al. 1998).
Serum tonicity can up- or down-regulate the transient receptor
potential (TRP)4 ion channel which plays a critical role in lung
vascular mechanotransduction (Yin et al. 2010). Specifically,
hypotonicity can activate these channels (Chen et al. 2009a; Chen et
al. 2009b; Becker et al., 2009; Garcia-Elias et al., 2008; Wegiersk et
al. 2009; Mizuno et al., 2003; Liedtke et al. 2003) leading to
endothelial calcium influx, and a rise in pulmonary vascular
permeability (Yin et al. 2010). Alternatively, hypertonicity can
suppress these channels leading to a decrease in pulmonary
vascular permeability, which may be beneficial in patients with lung
injury.
Hyperosmolarity increases type 1 alveolar epithelial cell repair
(Wang et al., 2011) and augments actin filament formation and E-
cadherin expression at the endothelial cell periphery (Safder et al.
2003). Moreover it blocks TNF-α–induced P-selectin expression in an
actin-dependent manner which helps in remodeling of the
endothelial barrier (Safder et al. 2003).
Hyperosmolar solutions have ameliorated pulmonary injury after
hemorrhagic shock in experimental models with improved
Introduction
58
splanchnic blood flow and reduced adhesion and cytotoxicity of
neutrophils compared with the use of isotonic solutions (Angle et al.,
1998; Shi et al., 2002). A 15-min infusion of hyperosmolar sucrose,
which increases vascular osmolarity by approximately 50 mOsm,
strengthens the lung endothelial barrier, and enhances actin
polymerization in the endothelial periphery (Safder et al., 2003;
Quadri et al. 2003). Similarly, a brief period of vascular
hyperosmolarity protects against acid-induced lung injury when the
infusion is administered shortly before, or shortly after, acid
instillation in the airway (Safder et al. 2005).
In summary although high serum sodium (high serum osmolality)
has been associated with deleterious systemic effects, induced high
serum sodium leading to high serum osmolality may have lung
protective effects.

Primary research outline
59
CHAPTER 2: PRIMARY RESEARCH OUTLINE
2.1 What are the current levels of sodium administration and
sodium balance in ICU patients? Is there any relationship between
sodium balance and respiratory dysfunction? Clinical studies were
used to examine this question.
2.2 Why are fluid boluses utilised in ICU patients? Do they lead to
lung injury? If so, what are the mechanisms. Clinical studies,
studies involving healthy volunteers and animal models were used
to explore this question.
2.3 Does high serum osmolality ameliorates lung injury? Animal
and epidemiological studies were used to explore this question.
Sodium administration in ICU patients
60
CHAPTER 3: SODIUM ADMINISTRATION IN ICU PATIENTS
3.1 Sodium administration in a single centre tertiary
level ICU
Positive fluid balance is associated with worse outcomes in critically
ill patients (Boyd et al. 2011), probably due to extracellular fluid
expansion. Therefore, both water and sodium may be important
because water distributes to both intra- and extracellular spaces
and sodium distributes into the extracellular spaces and may
exacerbate interstitial oedema both in the lungs and the systemic
circulation.
This effect might be more relevant in mechanically ventilated
patients. Positive pressure ventilation and positive end expired
pressure (PEEP) both raise intra-thoracic pressure. This results in
reduced venous return, and consequent complex neurohumoral
responses in turn lead to sodium and water retention (Bersten
2006).
As potential sources of sodium in critically ill patients include
resuscitation fluids, maintenance fluids, enteral and parental feeds,
venous and arterial line flushes, transfusions, replacement fluid and
many medications, my hypothesis was that critically ill patients
inadvertently receive excess amounts of sodium during their stay in
intensive care.

Sodium administration in ICU patients
61
To examine this, a retrospective sodium administration audit was
performed on twenty consecutive patients receiving prolonged
mechanical ventilation during their stay in single centre tertiary
level Intensive Care Unit (ICU).
The primary objective was to estimate the amount of sodium
administered to patients who were invasively ventilated for more
than 5 days in the ICU, and secondary objectives were to investigate
whether sodium administration had any association with
oxygenation, length of stay in ICU and serum sodium level.
3.1.1 METHOD
A retrospective analysis of the amount of sodium administered per
day (in mmol) from all sources was performed on 20 consecutive
patients who required mechanical ventilation for more than five
days (120 hours) at the Flinders Medical Centre (South Australia)
ICU. This is a 32 bed, tertiary level adult general ICU.
Patients were excluded if they were aged ≤ 18 years, were pregnant,
required chronic haemodialysis, had an admission diagnosis of
traumatic brain injury, or had diabetic ketoacidosis or a
hyperosmolar hyperglycaemic state.
Patient case notes, data sheets, operation notes, and total parental
nutrition (TPN) data sheets were retrieved and reviewed. The

Sodium administration in ICU patients
62
following patient baseline data were recorded: demographics,
diagnosis, APACHE II score at admission, duration of invasive
mechanical ventilation, length of stay in ICU, ICU outcome,
requirement for diuretics, requirement for dialysis, daily
administered fluid and fluid balance (taking account of all recorded
sources including urine, drains, gastrointestinal) .
Total daily administered sodium (from all sources) was recorded in
the following categories:
1. Resuscitation sodium - total sodium administered as fluid
boluses during either initial management or ongoing care.
2. Maintenance sodium - sodium administered (including given
as a replacement for renal and/or gastrointestinal loss) as a
constant infusion.
3. Infusion sodium - sodium which was used a vehicle for other
drugs, such as sedatives, vasopressor agents, antimicrobials
and insulin.
4. Enteral feed sodium.
5. Total parentral nutrition sodium.
6. Transfusion sodium - sodium from packed red blood cells,
platelets, fresh frozen plasma and cryoprecipitate
administration.
7. Drugs sodium - sodium present in the administered drugs
themselves.
8. Flushes sodium - sodium given as flushes with each central
venous and arterial access. The flush used in the current

Sodium administration in ICU patients
63
study was heparinised (2 U/ml) 0.9% saline, administered at
a rate of 4mls per hour for every flush-based catheter present.
A master table (Appendix 1) was constructed with the sodium
content of all drugs/ fluids administered to these patients. The
sodium content of the blood products was estimated by taking the
average of sodium contained in ten samples of each of the different
blood products.
Also recorded from each patient’s daily data for the time period 8am
to 9am each day were: daily renal function, serum sodium, daily
PaO2/FiO2 ratio, PaCO2, minute ventilation, PEEP and central
venous pressure.
Data were recorded from 24 hours prior to intubation, or from the
time of admission to hospital (if less than 24 hours) until 24 hours
after extubation or death (if the patient remained intubated and
ventilated at the time of death).
3.1.2 STATISTICAL ANALYSES Data were analysed using SPSS (version 19.0, Chicago, IL, USA).
Data was not normally distributed and are reported as median and
range. The Pearson correlation was used to correlate the daily
administered sodium with: APACHE II score, total ICU stay,
PaO2/FiO2 ratio (on the following morning), net fluid balance and

Sodium administration in ICU patients
64
serum sodium. For all analyses, a p value of less than 0.05 was
considered significant.
3.1.3 RESULTS
3.1.3.1 Patient Characteristics
There were 13 male and 7 female patients with median age 71.9
(range 19.8 to 89.2) years. The median duration of mechanical
ventilation was 9 (6, 20) days, with a median ICU stay of 11.6 (6, 21)
days. Of the 20 patients studied, 12 died, 5 were discharged home,
2 were readmitted to ICU and 1 was transferred to another hospital.
The median APACHE II score at admission was 29 (18–41). Seven of
the 20 patients required dialysis. Twelve out of 20 patients had
diuretics administered at some stage during their course of ICU stay
3.1.3.2 Sodium and fluid
The median average daily sodium administration was 225.5 (151,
355) mmol (Figure 3.1). The median daily net fluid balance was
positive at 351 ml (-759 ml to +1125 ml) and median daily fluid
intake was 2352 ml (1437 ml to 3798 ml).

Sodium administration in ICU patients
65
Figure 3.1: Daily sodium intake (mmol) in the single centre study
Data are expressed as median and interquartile range
The median and range of contributions to the total sodium
administered, from each source were: Infusions: 22.2% (1.2 – 39.9);
Drugs 21.6% (0 – 35.5); Flushes 17.4% (9.3 – 24.5); Enteral feeds
17% (0- 39.5); Resuscitation 16% (2.5 – 36.9); Maintenance fluids
5.8% (0 – 24); Transfusions 3.9% (0 –9.5) and Total Parental
Nutrition 0.1% (0- 2.6) (Table 3.1).

Sodium administration in ICU patients
66
Table 3.1: Contributions of each source to the total sodium
administered in the single centre study
The mean daily serum sodium was 141 ± 5 mmol/l (mean±SD).
Fourteen of the twenty patients had serum sodium greater than 145
mmol/L and three of the twenty patients developed hypernatremia,
defined as levels greater than or equal to 150 mmol/L at some stage
during their stay in ICU.
Daily sodium administered was correlated with net daily fluid
balance (p<0.001, r = 0.35) (Figure 3.2).
Sodium source Median % (range)
Resuscitation 16% (2.5%–36.9%)
Maintenance fluids 5.8% (0–24.0%)
Infusions 22.2% (1.2%–39.9%)
Flushes 17.4% (9.3%–24.5%)
Medicines 21.6% (0–35.5%)
Transfusions 3.9% (0–9.5%)
Enteral feeds 17.0% (0–39.5%)
Total parental nutrition 0.1% (0–2.6%)

Sodium administration in ICU patients
67
Figure 3.2: Correlation of daily administered sodium and daily fluid
balance in the single centre study
However, there was no correlation between daily administered
sodium and: APACHE II score (p = 0.1); total ICU stay (p = 0.48);
PaO2/FiO2 ratio next morning (p=0.62); or daily plasma sodium
(p=0.67).
3.1.4 DISCUSSION
In this cohort of ICU patients receiving prolonged mechanical
ventilation more than 220 mmol of sodium was administered daily.
The average daily net fluid balance here was comparable to the
conservative group of the FACTT study (Wiedemann et al. 2006),
and the average daily fluid intake was less than the conservative
group of FACTT, suggesting we achieved good fluid balance in our
cohort of patients. However, the average daily sodium here was
>220 mmol daily, indicating that critically ill mechanically ventilated
patients inadvertently receive a high load of sodium, despite

Sodium administration in ICU patients
68
achieving neutral fluid balance. A similarly high level of non-dietary
sodium administration has also been recently reported in cardiac
patients [Tafreshi et al. 2011].
The cause of this high sodium administration unexpectedly was not
due to resuscitation as generally expected; but was from infusions,
flushes and drugs. The amount of sodium administered as infusions
is most surprising. Similarly, the amount of sodium administered
as flushes was also very high and may still be under-recorded. Some
of the drugs (especially antibiotics) contain significant amount of
sodium. It is noteworthy that the usual maintenance fluid in our
unit is 4% dextrose and 1/5 saline, which has a relatively low
sodium content. Many units around the world administer 0.9%
saline as the usual maintenance fluid, which can lead to a large
increase in sodium intake.
Fourteen of the twenty patients had serum sodium ≥ 145 mmol/L
and three patients reached level ≥ 150 mmol/L at some stage during
their ICU stay. Hypernatraemia is recognised to be a common and
important electrolyte disorder in critically ill patients and is an
independent predictor for mortality [Palevsky et al. 1996]. Most
cases of hypernatremia in the ICU developed after admission,
suggesting an iatrogenic component. The strategy of aiming to
achieve a negative fluid balance as evidenced by use of diuretics in
our study and combined with a high sodium load and balance,

Sodium administration in ICU patients
69
predisposes to hypernatremia, as has been previously described
(Hoorn et al. 2008; Lindner et al. 2009).
The high level of daily sodium administered to mechanically
ventilated patients was correlated with net positive fluid balance.
This has been associated with poorer lung function (Wiedemann et
al. 2006), poorer kidney function (Bouchard et al. 2009), delayed
return of gastrointestinal function after surgery (Lobo et al. 2002)
and an increased risk of mortality (Boyd et al. 2011). This
association with worse outcome is probably due to extracellular
fluid expansion, which can affect these organ systems.
3.1.5 STUDY LIMITATIONS
This was a small (n = 20) retrospective observational study with all
of the limitations inherent to this study design. This audit was not
powered to study the correlation of daily administered sodium and
APACHE II score, total ICU stay and oxygenation, therefore a larger
study is required to examine these variables.
Although these data are consistent with inadvertent sodium loading
in critically ill patients, it is from a single centre and sodium
balance was not estimated. It remains to be seen whether these
observations are applicable to other units.

Sodium administration in ICU patients
70
3.1.6 SUMMARY Sodium administration to critically ill patients requiring prolonged
mechanical ventilation at a single centre was high. This finding from
a single centre needs to be confirmed in other centres.

Sodium administration in ICU patients
71
3.2 Sodium administration in critically ill patients in
Australia and New Zealand: a multi -centre point
prevalence study
In a single-centre study, I demonstrated that the amount of sodium
administered to ICU patients receiving invasive mechanical
ventilation for more than 5 days was over twice (Section 3.1) the
recommended daily intake of 100 mmol (Nutrient Reference Values
for Australia and New Zealand including Recommended Dietary
Intakes, 2013). Moreover, the main sources of sodium
administration were intravenous (i.v.) maintenance fluids, flushes
and drugs (Section 3.1).
This is particularly important in ICU patients as they are at risk of
sodium retention due to activation of the renin-angiotensin-
aldosterone system (Jungmann et al. 1987) and impaired activity of
dopamine in the proximal tubule of the kidney (Seri et al. 1988)
where dopamine normally inhibits sodium reabsorption (Seri et al.
1990). Depending upon concomitant water balance, the
administration of large amounts of sodium, combined with the
propensity for sodium retention may have important clinical
implications such as hypernatremia (Palevsky et al. 1996), which
has been associated with poor outcomes (Hoorn et al. 2008; Lindner
et al. 2009), and changes in intra- and extracellular fluid volumes.
Sodium administration in ICU patients
72
However, the results of a single-centre study reflect local practice
and are not generalisable to other centres. To confirm these results,
a multi-centre, single-day point prevalence study was undertaken in
conjugation with the Australian and New Zealand Intensive Care
Society (ANZICS) Clinical Trials Group (CTG) and the George
Institute for Global Health.
The primary aim of the study was to determine the total amount of
sodium administered to critically ill patients in Australian and New
Zealand ICUs and to determine the most common sources of
administration.
3.2.1 METHODS
All Australian and New Zealand CTG-affiliated ICUs were invited to
participate. Approval was obtained, when required, from individual
participating site research ethics committees. The study was a
prospective, cross-sectional, observational audit and, as such, the
requirement for individual subject consent was waived at all sites.
All adult patients (≥ 16 years) present in participating ICUs at 10
a.m. on the study day were enrolled. Routine survey data for all
patients included age, sex, weight (estimated/measured), ICU
admission Acute Physiology and Chronic Health Evaluation
(APACHE) II score, Sequential Organ Failure Assessment (SOFA)
score within the preceding 24 hours of study day and ICU
admission source. Data regarding ICU admission diagnoses

Sodium administration in ICU patients
73
(operative vs. non-operative, burns, and trauma) and specific
diagnoses on study day (acute lung injury [ALI], acute respiratory
distress syndrome [ARDS], sepsis) were collected. Requirement for
renal replacement therapy (RRT) on the study day was also
collected. Vital status 28 days after study day was ascertained
using hospital administrative databases. Serum sodium (highest) on
the study day was also recorded and patients were defined as
having hyper- or hypo- natremia if; serum sodium ≥ 150 mmol/L
(Lindner et al. 2009) or < 130 mmol/L (Asadollahi et al. 2006)
respectively.
Patients receiving an oral diet where at least 50% of the dietary
requirements were met by oral intake and enteral and/or parenteral
nutrition was not being administered on the study day were
excluded for the purposes of ascertaining the sources of sodium
administration.
Data on all remaining patients included:
i) i.v. bolus fluids administered for volume expansion or “fluid
resuscitation” i.e. crystalloid infusion ≥ 5 ml/kg/hr or ≥ 400
ml/hr or any colloid bolus or infusion
ii) blood products i.e. red blood cells, platelets, fresh frozen
plasma
iii) i.v. maintenance or replacement fluids i.e. crystalloids given
by continuous infusion

Sodium administration in ICU patients
74
iv) i.v. drug infusions i.e. drugs administered by continuous
infusion together with its vehicle
v) i.v. drug boluses together with its vehicle
vi) i.v. flushes associated with haemodynamic monitoring e.g.
intra-arterial or central venous catheter
vii) enteral nutrition
viii) parenteral nutrition.
For all i.v. fluids and blood products, the type and volume
administered over the 24-hour study day was recorded and the
amount of sodium administered was calculated based on previously
described sodium concentrations (Appendix 1). For drug infusions
and boluses, sodium content was calculated from both the sodium
content of the drug and the type and volume of carrier fluid or
diluent. For enteral and parenteral nutrition, information on the
type and volume of feed was recorded and the sodium content
calculated accordingly. For custom parenteral nutrition, the sodium
content was recorded. No data on oral sodium intake was collected.
3.2.2 STATISTICAL ANALYSIS
Variables are reported as mean and standard deviation (SD) or
median and interquartile range (IQR) as appropriate. Sources of
sodium administration are reported as percentages with 95% CI.
Antimicrobials were analysed separately to other i.v. drugs due to
the high sodium load of some agents (Section 3.1; appendix 1).

Sodium administration in ICU patients
75
Pearson’s correlation was used to test for the association between
sodium administered (log transformed for normal distribution) and
the following factors: age, weight, APACHE II score and day of ICU
stay, SOFA score, serum sodium, fluid administered and 24 hour
fluid balance on study day. Predictor variables for sodium
administration (age, sex, APACHE II score, site, and variables
significant at α ≤0.10) were analysed using multiple linear
regression (SPSS version 2.0, Chicago, IL, USA). Day 1 data was not
included in the model as 24-hour data was incomplete (median[IQR]
ICU length of stay 14[11-18] hours). In addition, the amount of
sodium administered during routine care as opposed to the initial
resuscitation phase that occurs at ICU admission is potentially
different.
For all analyses, a P value of less than 0.05 was considered
significant.
3.2.3 RESULTS
3.2.3.1 Patient characteristics
Five hundred and eleven patients were enrolled into the point
prevalence survey from 46 tertiary referral, metropolitan and rural
hospital ICU’s (Appendix 2). One hundred and fifty-five patients
(30.3%) were excluded because of oral intake (n=148; 28.9%) or
missing data (n=7; 1.4%).

Sodium administration in ICU patients
76
Of the remaining 356 patients (40 sites), 64.3% (n=229) were male
and the mean(SD) age and estimated body weight (on study day)
were 58.5 (18.0) years and 81.6 (24.0) kg, respectively. Twenty-
eight day mortality was 12.6%. Other patient characteristics are
shown in Table 3.2.
Table 3.2: Patient characteristics in the adult ICUs on the point prevalence study day
Characteristic n=356
Age, years*
Male sex, n (%)
Weight, kg *#
APACHE II score *
ICU admission source, n (%)
Emergency department
Hospital ward
Operating theatre
Other
APACHE III diagnostic categories, n (%)
Cardiovascular
Respiratory
Gastrointestinal
Neurological
58.5 (18)
229 (64.3)
81.6 (24)
20 (8)
110 (30.8)
75 (21.1)
109 (30.6)
62 (17.4)
40/247 (16.2)
65/247 (26.3)
15/247 (6.0)
39/247 (15.8)
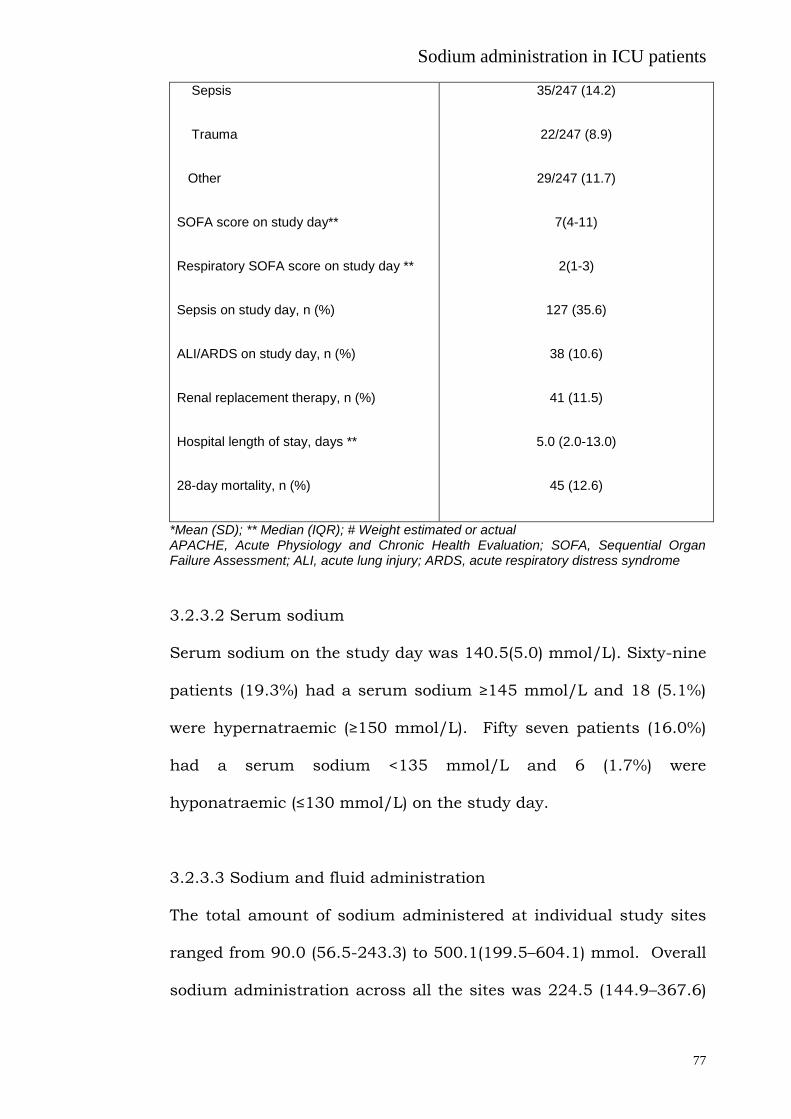
Sodium administration in ICU patients
77
Sepsis
Trauma
Other
SOFA score on study day**
Respiratory SOFA score on study day **
Sepsis on study day, n (%)
ALI/ARDS on study day, n (%)
Renal replacement therapy, n (%)
Hospital length of stay, days **
28-day mortality, n (%)
35/247 (14.2)
22/247 (8.9)
29/247 (11.7)
7(4-11)
2(1-3)
127 (35.6)
38 (10.6)
41 (11.5)
5.0 (2.0-13.0)
45 (12.6)
*Mean (SD); ** Median (IQR); # Weight estimated or actual APACHE, Acute Physiology and Chronic Health Evaluation; SOFA, Sequential Organ Failure Assessment; ALI, acute lung injury; ARDS, acute respiratory distress syndrome
3.2.3.2 Serum sodium
Serum sodium on the study day was 140.5(5.0) mmol/L). Sixty-nine
patients (19.3%) had a serum sodium ≥145 mmol/L and 18 (5.1%)
were hypernatraemic (≥150 mmol/L). Fifty seven patients (16.0%)
had a serum sodium <135 mmol/L and 6 (1.7%) were
hyponatraemic (≤130 mmol/L) on the study day.
3.2.3.3 Sodium and fluid administration
The total amount of sodium administered at individual study sites
ranged from 90.0 (56.5-243.3) to 500.1(199.5–604.1) mmol. Overall
sodium administration across all the sites was 224.5 (144.9–367.6)
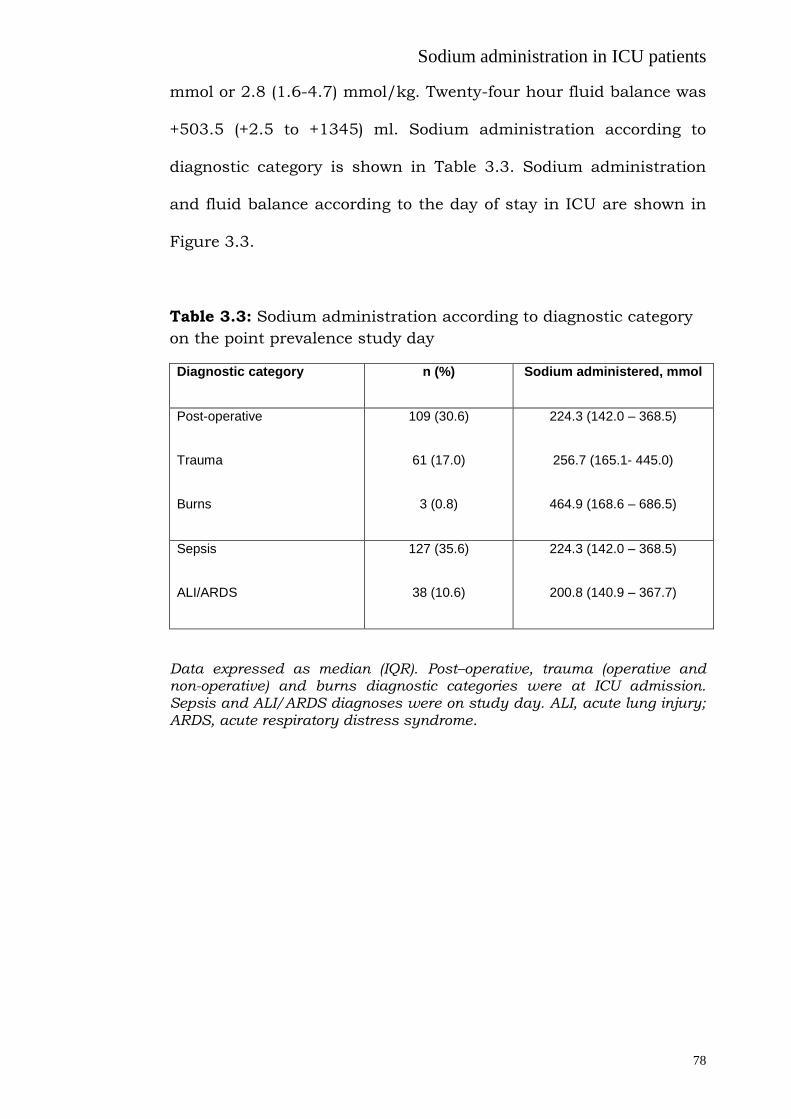
Sodium administration in ICU patients
78
mmol or 2.8 (1.6-4.7) mmol/kg. Twenty-four hour fluid balance was
+503.5 (+2.5 to +1345) ml. Sodium administration according to
diagnostic category is shown in Table 3.3. Sodium administration
and fluid balance according to the day of stay in ICU are shown in
Figure 3.3.
Table 3.3: Sodium administration according to diagnostic category
on the point prevalence study day
Diagnostic category n (%) Sodium administered, mmol
Post-operative
Trauma
Burns
109 (30.6)
61 (17.0)
3 (0.8)
224.3 (142.0 – 368.5)
256.7 (165.1- 445.0)
464.9 (168.6 – 686.5)
Sepsis
ALI/ARDS
127 (35.6)
38 (10.6)
224.3 (142.0 – 368.5)
200.8 (140.9 – 367.7)
Data expressed as median (IQR). Post–operative, trauma (operative and non-operative) and burns diagnostic categories were at ICU admission. Sepsis and ALI/ARDS diagnoses were on study day. ALI, acute lung injury; ARDS, acute respiratory distress syndrome.

Sodium administration in ICU patients
79
Figure 3.3: Sodium and fluid balance on the point prevalence study
day according to day of stay in ICU post-ICU admission
Data presented as box plot representing median, upper and lower quartile with the 10th
and 90th percentile either side, dots are 95
th and 5
th percentiles. Day 1 has 14 (11-18)
(median and IQR) hours of data. n represent the total number of patients according to the day of stay in ICU on the study day.
For those patients enrolled on day 1 (median [IQR] ICU length of
stay 14[11-18] hours) of ICU admission (48/356; 13.4%), 202.9
(101.5-352.9) mmol of sodium was administered on the study day.
The main sodium source was i.v. maintenance or replacement fluids
(77.5 mmol; 38.2% [95%CI 37.3-39.0] of all sodium administered).
Other sources included i.v. fluid boluses (44.4 mmol; 22.0% [95% CI
21.3-22.7]), i.v. drug boluses other than antimicrobials (22.9
mmol;11.3% [95% CI 10.7-11.8]), ]), i.v. drug infusions (19.1 mmol;

Sodium administration in ICU patients
80
9.4% [95% CI 8.9-9.9]), i.v. flushes (12.6 mmol; 6.2% [95% CI 5.8-
6.6]), blood products (12.4 mmol; 6.1% [95% CI 5.6-6.5]), i.v.
antimicrobial (7.2 mmol; 3.5% [95% CI 3.2-3.8]), enteral nutrition
(6.2 mmol;3.1% [95% CI 2.7-3.3]), and parenteral nutrition (0.3
mmol; 0.1% [95% CI 0.0-0.1]). The total amount of fluid
administered as a bolus on day 1 was 800 (467 -1048) ml (median
and IQR)
For patients present between day 2-10 of ICU admission (223/356;
62.6%), 255.1 (163.2–390.5) mmol of sodium was administered on
the study day. Twenty-four hour fluid balance was +550 ml (-126 to
+1515) ml (Figure 3.3). The main source of sodium administration
was i.v. maintenance or replacement fluids (69.3/224.5 mmol;
30.9% (95%CI 30.6-31.2) of all sodium administered). Of the 225
patients receiving i.v. maintenance or replacement fluids, 33.7%
(76/225) received 0.9% saline. Hartmann’s® solution (55/225;
24.4%), 5% dextrose (34/225; 15.1%) and 4% dextrose and 0.18%
saline (21/225; 9.3%) were the next most common fluids infused.
Other sodium sources included i.v. fluid boluses (36.5 mmol;
16.3% [95% CI 16.0-16.4]), i.v. drug boluses other than
antimicrobial (27.6 mmol;12.3% [95% CI 12.1-12.5]), enteral
nutrition (26.5 mmol;11.8% [95% CI 11.5-12.0]), i.v. drug infusions
(19.3 mmol; 8.6% [95% CI 8.4-8.8]), i.v. flushes (16.6 mmol; 7.4%
[95% CI 7.2-7.5]), blood products (13.5 mmol; 6% [95% CI 5.8-6.4]),
Sodium administration in ICU patients
81
i.v. antimicrobial (11.2 mmol; 5% [95% CI 4.8-5.1]) and parenteral
nutrition (4.3 mmol; 1.9% [95% CI 1.8-2.0]). 0.9% saline was the
most commonly used vehicle for i.v. drug boluses (177/234; 75.6%)
and i.v. drug infusions (152/236; 64.4%). Heparinised saline was
the most common i.v. flush fluid (214/ 218; 98.1%).
The highest proportion of sodium administered from i.v. fluid
boluses occurred on Days 2 and 3 of ICU admission. Seventy-four
patients (20.8%) received a fluid bolus on Day 2 (513 [332 -1637]
ml, median [IQR]) and sodium administration was 66.0 mmol
(22.3% [95% CI 21.8-22.8]) of all sodium administered). Patients
present on Day 3 (31/356; 20.8%), received 467 [257 -1971] ml,
median [IQR] as fluid bolus amounting to 55.2 mmol (18.8% [95%
CI 18.1-19.4]) of administered sodium. Overall albumin (4 % or 5%)
was the most commonly administered bolus fluid (46/125 fluid
boluses; 36.8%), followed by 0.9% saline (30/125; 24%) and
Hartmann’s® solution (16/125; 12.8%).
Sodium administration was weakly correlated with study day total
SOFA score (P=0.001, r=0.19), the respiratory component of the
SOFA score (P=0.032, r=0.14), 24-hour administered fluid (P=0.038,
r=0.11) and fluid balance (P<0.001, r=0.45). Using multiple linear
regression modelling (R2=0.115), factors associated with
administered sodium were site (standardized β coefficient 0.105, P
=0.044) (Figure 3.4), age (- 0.227, P<0.001), administered fluid on
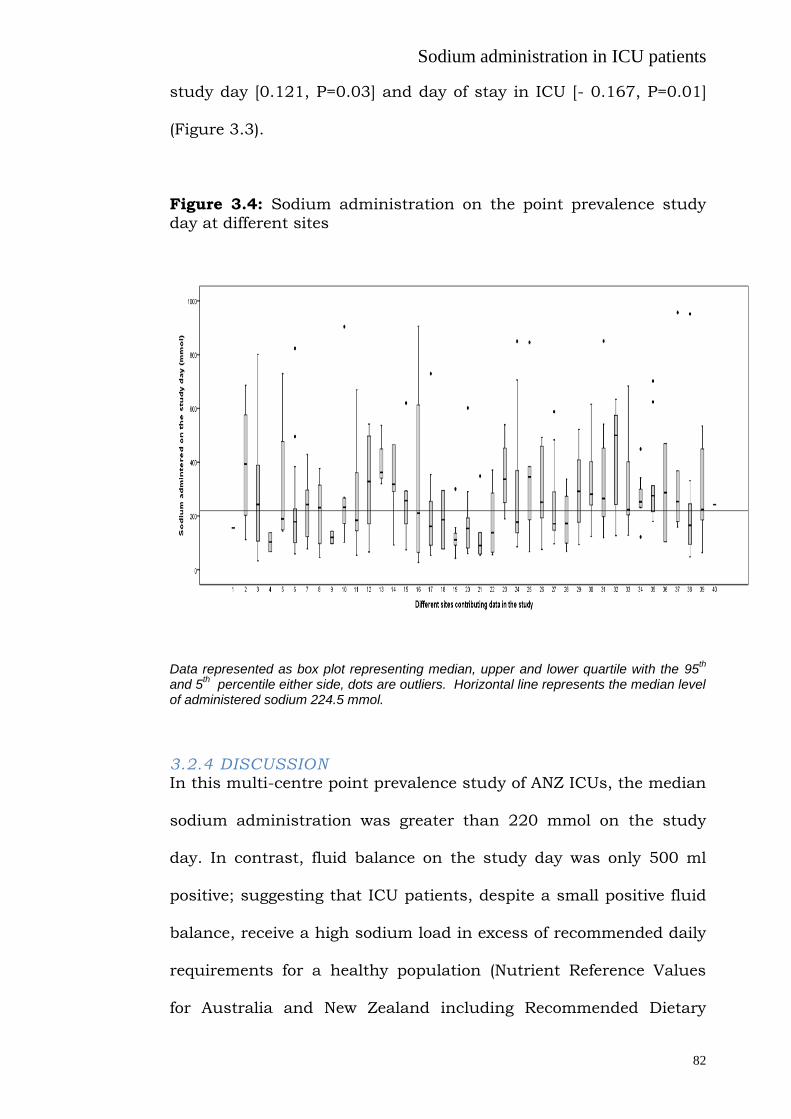
Sodium administration in ICU patients
82
study day [0.121, P=0.03] and day of stay in ICU [- 0.167, P=0.01]
(Figure 3.3).
Figure 3.4: Sodium administration on the point prevalence study
day at different sites
Data represented as box plot representing median, upper and lower quartile with the 95th
and 5th percentile either side, dots are outliers. Horizontal line represents the median level
of administered sodium 224.5 mmol.
3.2.4 DISCUSSION In this multi-centre point prevalence study of ANZ ICUs, the median
sodium administration was greater than 220 mmol on the study
day. In contrast, fluid balance on the study day was only 500 ml
positive; suggesting that ICU patients, despite a small positive fluid
balance, receive a high sodium load in excess of recommended daily
requirements for a healthy population (Nutrient Reference Values
for Australia and New Zealand including Recommended Dietary

Sodium administration in ICU patients
83
Intakes, 2013); albeit there is no recommended daily intake for
critically ill patients in ICU.
The principal source of sodium administration was not i.v. fluid
resuscitation as one may have pre-supposed, but instead was
primarily due to i.v. infusions, in particular maintenance fluids, as
well as i.v. drug infusions, boluses and flushes. These sources of
sodium are inadvertent and potentially modifiable, depending on
clinician choice for “routine” i.v. fluid administration. These
findings are also similar to the results of our single centre study
(Section 3.1). A high level of non-dietary sodium administration has
been similarly reported in cardiac patients (Tafreshi et al. 2011).
Furthermore, although the selection of fluid type varied between
participating sites, 0.9% saline was the most common i.v. fluid;
contributing to 59.2% of all sodium administered. Whilst the
reason(s) for choosing 0.9% saline cannot be ascertained from this
point prevalence survey, it was noteworthy that recent studies have
indicated that after a bolus of 0.9% saline, excretion of both water
and sodium is slower (Ried et al. 2003) and may result in
reductions in renal blood flow velocity and renal cortical tissue
perfusion (Chowdhury et al. 2012).
Sodium retention might be more relevant in critically ill patients due
to activation of the renin-angiotensin-aldosterone system . This is
especially so in mechanically ventilated patients, where positive

Sodium administration in ICU patients
84
pressure ventilation and positive end-expiratory pressure (PEEP)
both raise intrathoracic pressure, which results in reduced venous
return and a consequent complex neurohumoural response (Bersten
2006; Frazier 1999) leading to sodium and water retention. As seen
in this current study, sodium administration on the study day had a
weak correlation with the SOFA score and with a net positive fluid
balance. Importantly, a positive fluid balance is associated with
poor lung and kidney function (Wiedemann et al. 2006; Bouchard et
al. 2009), delayed return of gastrointestinal function after surgery
(Lobo et al. 2002) and an increased risk of mortality (Boyd et al.
2011). The adverse effects of positive fluid balance are probably due
to extracellular fluid expansion. Therefore, both water and sodium
may be important because water distributes to both intra- and
extra- cellular spaces. In contrast, sodium distributes into the
extracellular spaces leading to cellular dehydration and interstitial
oedema in both the lungs and the systemic circulation. Current
strategies using conservative fluid balance therapy without attention
to concomitant sodium balance could potentially lead to
intracellular dehydration and thereby may have been one of the
mechanisms contributing to abnormal neurocognitive effects in
patients with lung injury managed with conservative fluid balance
(Mikkelesen et al. 2012).
Sodium administration is often coupled with chloride, usually as a
1:1, ratio except for fluids such as Hartmanns solution where the

Sodium administration in ICU patients
85
ratio is 1.2:1. Although chloride administration was not directly
measured in the present study it can be hypothesised that high
sodium administration would have accompanying high chloride
administration which may have adverse effects. Effects of chloride
restriction on the acid base status of ICU patients has recently been
investigated (Yunos et al. 2011) and implementation of a chloride-
restrictive strategy in a tertiary ICU was associated with a
significant decrease in the incidence of kidney injury and
requirement for dialysis in ICU (Yonus et al. 2012).
Large amounts of administered sodium, together with the
propensity for sodium retention and a conservative fluid balance,
can lead to hypernatremia. Hypernatremia is not uncommon in the
critically ill (Palevsky et al. 1996) and, in the present study, 19.3%
of patients had a serum sodium ≥145 mmol/L and 5% had
hypernatremia (≥ 150 mmol/L). This rate of hypernatremia is
consistent with the literature (Lindner et al. 2009) and has
previously been associated with poor outcomes (Hoorn et al. 2008;
Lindner et al. 2009).
3.2.5 LIMITATIONS AND FUTURE DIRECTIONS
This single day point prevalence study conducted across multiple
ICUs in Australia and New Zealand represents a snapshot of current
practices for critically ill patients not receiving oral nutrition on a
study day. Despite our best efforts to record all i.v. and enteral

Sodium administration in ICU patients
86
fluids administered, it is possible that other sources of sodium were
not included. Formal sodium balance and the indications for the
prescription of high sodium containing fluids such as 0.9% saline
were also not collected. Finally, inferences regarding sodium
administration on day 1 are limited as data collection was less than
24 hours.
Inadvertent high levels of sodium administration are potentially
modifiable as i.v sodium sources are primarily maintenance fluids,
vehicles for infusions and drug boluses and flushes. Future studies
should include both prospective, observational studies examining
the relationship between sodium administration, sodium balance
and important clinical outcomes (e.g. mortality) and interventional
trials to assess whether it is desirable and/or safe to modify daily
sodium administration in critically ill patients, and can be coupled
with simultaneous measurement of chloride administration and
balance.
3.2.6 SUMMARY
Currently there are high levels of sodium administration in multiple
ICUs across Australia and New Zealand in a large cohort of patients.
The majority of administered sodium is from inadvertent sources.
However, there is wide variability in the use of infusions/vehicles for
drug infusions and boluses.
Sodium administration in ICU patients
87
3.3. Sodium administration in critically ill paediatric
patients in Australia and New Zealand: a multi -centre
point prevalence study
In the previous single-centre adult intensive care unit (ICU) study
the amount of administered sodium given to critically ill adults
receiving mechanical ventilation for greater than 5 days was more
than twice the recommended daily intake (Section 3.1). The main
sources of sodium were intravenous maintenance fluids, flushes
and drugs (Section 3.1). These findings were later confirmed in a
larger multi-centre, point prevalence study in adult ICU patients in
which the main source of administered sodium was intravenous
maintenance fluids, followed by fluid boluses and drug boluses
(Section 3.2).
In critically ill paediatric patients sodium and water balance are no
longer under the direct control of the individual’s response to thirst
or choice of dietary intake. Isotonic maintenance fluids are often
administered in children, in order to reduce the risk of
hyponatremia (Choong et al. 2011; Coulthard et al. 2012; Moritz et
al. 2011; Balasubramanian et al. 2012) and this may increase the
risk of sodium and fluid overload; especially in the critically ill
where a complex interplay of several homeostatic mechanisms
including activation of the renin-angiotensin-aldosterone system
(Jungmann et al. 1987) and impaired activity of dopamine in the
proximal tubule of the kidney (Seri et al. 1988) (dopamine normally
inhibits sodium reabsorption (Seri et al. 1990) promote increased

Sodium administration in ICU patients
88
sodium retention. Moreover, an increased level of arginine
vasopressin released by the posterior pituitary in acute illness also
promotes water reabsorption from the collecting ducts of the
kidneys (Holmes et al. 2001; Iwasaki et al. 1995).
Data from the Prospective Paediatric Continuous Renal Replacement
Therapy (ppCRRT) registry (Goldstein et al. 2004; Symons et al.
2007) and other observational studies (Goldstein et al. 2005;
Michael et al. 2004; Foland et al. 2004) have shown that positive
fluid balance is an independent predictor of mortality in children.
The mechanism of the detrimental effects of fluid overload is
probably multifactorial, but likely contributed to by the expansion of
extracellular fluid space (Jacob et al. 2009) and increased distance
for oxygen diffusion, as well as alterations in cell volume. Sodium is
an extracellular ion and can affect the intra- and extracellular fluid
distribution, with the potential to exacerbate interstitial edema in
both the lung and other organs.
The aim of this study was to determine the total administered
sodium and its sources and fluid balance over a single 24-hour
period in infants and children in ICU in Australia and New Zealand.
3.3.1 METHODS
A multi-centre, single day, point prevalence study was undertaken
in collaboration with the Paediatric Study Group (PSG) of the
Australian and New Zealand Intensive Care Society (ANZICS)
Sodium administration in ICU patients
89
Clinical Trials Group (CTG). Ten ICUs (8 dedicated paediatric and 2
mixed adult and paediatric) caring for the majority of critically ill or
injured infants and children in Australia and New Zealand
participated on the study day (Appendix 3). Neonatal ICUs, defined
as units caring solely for newborn infants, were excluded from this
study. Approval was obtained from individual participating site
research ethics committees, with the requirement for individual
subject consent waived at all sites. This ensured recruitment of all
patients <16 years present in the ICU at 10 am on the study day.
Demographic and descriptive data including age, sex, weight
(estimated and measured), admission paediatric index of mortality
(PIM II) score (Baghurst et al. 2008), admission diagnosis and
specific diagnoses on study day (acute lung injury [ALI], acute
respiratory distress syndrome [ARDS], sepsis) were documented.
Major treatment interventions (e.g. invasive mechanical ventilation,
renal replacement therapy) on the study day were also collected.
The respiratory component of the organ failure score as assessed by
the sequential organ failure assessment (SOFA) respiratory score
(Vincent et al. 1996) on the study day was also recorded. The
highest and lowest serum sodium on the study day was recorded
and patients categorised as having normal or hyper- or
hyponatremia; serum sodium ≥ 150 mmol/l (Lindner et al. 2009) or
< 130 mmol/l (Asadollahi et al. 2006) respectively.
Sodium administration in ICU patients
90
Patients receiving normal oral diet who did not receive prescribed
formula (enteral or parenteral) feed at any time during the study day
were described as having “free oral intake” and were excluded from
the study analysis. Data on all sources of administered sodium
(excluding any non-prescribed oral diet) were recorded for the
remaining patients. The absolute and relative contribution of the
following potential sources of administered sodium were categorised
as: (i) intravenous bolus, (ii) intravenous infusions -maintenance or
replacement fluids, (iii) blood products i.e. red blood cells, platelets,
fresh frozen plasma, (iv) intravenous drug boluses including fluid
given as a diluent or a vehicle for administration, (v) intravenous
drug infusions including fluid given as a diluent or a vehicle for
administration (vi) intravenous flushes associated with
haemodynamic monitoring of arterial or central venous catheter,
(vii) prescribed enteral nutrition, (viii) prescribed parenteral
nutrition.
Patients were categorised by the number of completed days in ICU
at the onset of the study day (< 24 hours completed vs. ≥ 24 hours
and <10 days, vs. 10 days). For patients in ICU < 24 hours at the
time of the study census, data for individual patients was cohorted
regardless of the exact number of hours spent in ICU. For all
parenteral fluids and blood products, the type and volume
administered over the previous 24-hour period was recorded and
the amount of sodium administered was calculated based on their

Sodium administration in ICU patients
91
sodium concentrations (Appendix 1). For drug infusions and
boluses, sodium content was calculated from both the sodium
content of the drug and the type and volume of carrier fluid or
diluent. Antibiotics are reported as a subgroup of all drug boluses or
infusions as it is known that they contribute a significant sodium
load in adults in intensive care (Section 3.1 and 3.2). For prescribed
enteral and parenteral nutrition, information on the type and
volume of feed was recorded and the sodium content calculated
accordingly. For custom parenteral nutrition, the sodium content
was recorded. No data on sodium intake from oral intake was
collected.
3.2.2 STATISTICAL ANALYSIS
Variables are reported as mean and standard deviation (SD) or
median and interquartile range (IQR) and compared with either the
Student t-test or Mann-Whitney U test, as appropriate. Sodium
administration from each source is reported as percentage of total
administered sodium with 95% CI.
Pearson’s correlation was used to describe the association between
administered sodium (log transformed for normal distribution) and
the following variables: age, weight, day of ICU stay, SOFA
respiratory score, serum sodium, fluid administered and 24 hour
fluid balance on study day. Predictor variables for sodium
administration were analysed using multiple linear regression

Sodium administration in ICU patients
92
(stepwise method) (SPSS version 2.0, Chicago, IL, USA. Day 1 data
was not included in the model as 24-hour data was incomplete
(median [IQR] ICU length of stay 14[11-18] hours).
Data for infants and older children were also analysed separately as
they may have different sources of fluid and sodium. Moreover
infant kidneys may be undergoing developmental changes (Quigley
2012).
For all analyses, a P value of less than 0.05 was considered
statistically significant.
3.3.3 RESULTS
3.3.3.1 Patient Characteristics
The study screened 65 subjects from 10 participating PICUs on a
single study day. Seventeen subjects (26.2%) were excluded from
the study because they had free oral feeds (n=15, 23.1%) or missing
data (n=2, 3.1%)
Of the remaining 48 patients (24 males and 24 females), the
contribution from each site was 4(1-9) children of which 21(44%)
were infants [age (median, IQR) 4.0 (1.0-7.0) months; body weight
5.0 (3.5-6.1) kg], and 27 (56%) were > 1 year [age 3.0 (1.5-13.0)
years; body weight 17.0 (9.5-47.5) kg]. The reason for PICU
admission and other characteristics are shown in Table 3.4; the

Sodium administration in ICU patients
93
profile was typical of PICU patients (Report of the Australian and
New Zealand Paediatric Intensive Care Registry 2013).
Table 3.4: Patient characteristics in the paediatric ICUs on the point prevalence study day Characteristic n=48
Infants, n (%)
Age, months$
Weight, kg $#
21 (43.7)
4.0 (1.0-7.0)
5.0 (3.5-6.1)
Age > 1 year, n (%)
Age, years$
Weight, kg $#
27 (56.3)
3.0(1.5-13.0)
17.0 (9.5-47.5)
Male sex, n (%)
ICU admission source, n (%)
Operating theatre
Elective surgery
Emergency surgery
Post cardiopulmonary bypass
Transfer from other ICU
Transfer from other hospital
Hospital ward
Emergency ward
ANZPICR diagnostic categories, n (%)
Injury
Respiratory
Cardiovascular
Neurological
PIM ROD (Risk of Death) $
PIM HI-RISK
PIM LO-RISK
SOFA Respiratory score
Trauma
Burns
Sepsis on study day, n (%)
24 (50.0)
21 (43.7)
20 (41.6)
1 (2.1)
9 (18.7)
10 (20.8)
7 (14.6)
6 (12.5)
4 (8.3)
5 (10.4)
13 (27.1)
7 (14.6)
1 (2.0)
0.02 (0.01-0.06)
7 (14.6)
5 (10.4)
2 (0-3)
3 (6.3)
1 (2.1)
7 (14.6)

Sodium administration in ICU patients
94
ALI/ARDS on study day, n (%)
Renal replacement therapy, n (%)
Mechanical ventilated in the first hour, n (%)
Discharged from ICU at 28-day (alive), n (%)
Discharged from hospital at 28-day (alive), n
(%)
28-day ICU mortality, n (%)
6 (12.5)
1 (2.1)
34 (70.8)
38 (79.2)
27 (56.3)
2 (4.2)
# Weight estimated or actual (38/48 [71.2%] measured) $ Median and Interquartile range
3.3.3.2 Administered sodium and 24-hour fluid balance
Overall, the median (IQR) administered sodium in all patients (n =
48) was 4.9 (3.2 – 8.0) mmol/kg/24 hours on study day. Median
administered fluid was 80.8 (49.8 - 111.4) ml/kg and median fluid
balance was 9.0 (-1.4 to 41.0) ml/kg. Median urine output was 44
(24-78) ml/kg on the study day.
Twenty-four hour administered sodium, fluid and fluid balance
according to day of stay in ICU are shown in Table 3.5. Total 24
hour administered sodium, administered fluid totals and fluid
balance on the study day were not significantly different between
patients in ICU for less than 10 days compared to patients in ICU
for 10 days or more (p=0.18, p=0.39 and p=0.67 respectively).

Sodium administration in ICU patients
95
Table 3.5: Daily administered sodium and fluid balance according to the day in PICU
*Median (IQR) hours 14 (11-18). Data expressed as median and IQR
The twenty-four hour administered sodium, fluid and fluid balance
in infants (n=21) and children >1year (n=27) was 6.0 (3.9–8.1)
mmol/kg, 102.6 (80.0–127.7) ml/kg, 20.8 (3.5–47.2) ml/kg and 3.5
(3.1–7.8) mmol/kg, 58.1 (35.7–85.7) ml/kg, 5.3 (-2.7–17.7) ml/kg
respectively. Although the total administered fluid volume recorded
on the study day was greater in infants (p<0.001), administered
sodium and 24-hour fluid balance were not statistically different
between infants and children > 1 year of age (p=0.53, p=0.08
respectively).
Twenty-four hour administered sodium, fluid and fluid balance
according to diagnostic category are shown in Table 3.6.
Administered sodium in children with sepsis and children admitted
with trauma were median (IQR) 6.8 (3.3- 16.1) and 8.9 (4.6-18.0)
mmol/kg respectively. Median sodium administration across the
ICU day n Daily administered sodium/kg
mmol/kg
Daily administered fluid
ml/kg
Daily fluid balance
ml/kg
<1* 5 3.3 (1.2-5.0) 33.0 (25.3-48.2) 9 (5.3-17.7)
2-10 29 4.6 (3.2–7.9) 81.6 (53.9-106.2) 18.5 (1.1-41.3)
>10 14 6.1 (3.5–10.7) 106.5 (66.7-126.4) 0.5 (-10.4 - 19.5)
TOTAL 48 4.9 (3.2–8.0) 80.8 (49.8 - 111.4) 9 (-1.4 – 41.0)

Sodium administration in ICU patients
96
various sites was 5.3 (3.2 - 6.9) mmol/kg and it was not different
between them.
Table 3.6: Sodium administration according to diagnostic category on study day in paediatric patients
Diagnostic category: n (%) Administered sodium
mmol /kg
Administered fluid
ml /kg
Fluid balance
ml/kg
Elective admission: 21 (43.8)
Trauma: 3 (6.3%)
Post bypass surgery: 9 (18.8%)
3.9 (2.9 -6.9)
8.9 (4.6-18.0)
3.4 (2.9 -6.2)
80.0 (43.4 -121.2)
56.0 (63.7 -115.1)
63.7 (43.4 - 94.9)
18.5 (-2.7 - 56.4)
19.5 (20.4 -84.1)
16.5 (-20.5-33.1)
Sepsis: 7 (14.6%)
Burns : 1 (2.1%)
ALI/ARDS: 6 (10.6%)
Other*: 22 (45.8%)
PIM HI-Risk: 7 (14.6%)
PIM LO-Risk: 5 (10.4%)
PIM ROD (Top 50%)
PIM ROD (Bottom 50%)
6.8 (3.3- 16.1)
18.0
5.4 (3.3 -12.4)
5.0 (3.1-7.8)
3.5 (3.2 - 7.9)
3.9 (1.6 - 6.3)
5.6 (3.5 -10.8) 3.9 (2.7 -7.2)
73.2 (46.4 -103.4)
115.1
60.9 (42.2 -101.2)
90.1(58.9-125.0)
67.6 (50.0 -73.6)
63.4 (33.9 -91.8)
87.7 (56.5 -117.3) 75.1 (41.4-103.2)
5.3 (-10.4 - 24.3)
84.1
-4.3 (-23.5 - 5.2)
9.0 (0.3 - 48.3)
17.7 (0.5 - 24.3)
17.7 (8.9 - 31.7)
7.0 (0.5 - 24.3)
13.4 (-5.9 - 43.5)
Data expressed as median (IQR). Post–operative, trauma (operative and non-operative) and burns diagnostic categories were at ICU admission. Sepsis and ALI/ARDS diagnoses were on study day. Abbreviations: PIM, Paediatric Index of Mortality; ALI, acute lung injury; ARDS, acute respiratory distress syndrome. * Other included patients without trauma, post bypass surgery, sepsis, burns or ALI/ARDS.
Sodium administration on the study day was correlated with day of
stay on ICU (p=0.003, r=0.47), age (p=0.005, r=-0.44), 24-hour
administered fluid/kg (p<0.001, r=0.68) and weight (p=0.013, r=-
0.38). Using multiple linear regression modelling (R2=0.46),
administered sodium was only associated with 24-hour
administered fluid/kg (unstandardized β coefficient (standard error)
0.08 (0.02), p < 0.001)

Sodium administration in ICU patients
97
A number of patients (14/48; 29.2%) had only one serum sodium
reading for the study day and hence we have reported the highest
available serum sodium on the study day. The highest recorded
serum sodium on the study day was (mean ±SD) 143.2 ± 6.6
mmol/L. Twelve patients (25%) had a serum sodium ≥145 mmol/L,
3 had hypernatremia and 1 had hyponatremia on the study day.
3.3.3.3 Sources of administered sodium
The contributions to the total sodium administered in all the
patients (n = 48) is shown in Table 3.7.
Table 3.7: Contribution of sodium according to day of stay in PICU
Data represented as percentage and 95% CI * Data excludes children whose stay in PICU was less than 24 hours
Source of Administered Sodium
(% total Na administered in 24
hours)
ICU stay on the study day <10 day* (n=29)
ICU stay on the study day
>10 day (n=14)
Total (n=48)
Bolus 27.4 (25.5-29.3) 7.8 (6.4-9.2) 17.9 (16.7–19.1)
Maintenance/replacement infusions
25.4 (23.5-27.2) 17.6 (15.6-19.5) 23.9 (22.5-25.2)
Blood Products 2.2 (1.6-2.8) 5.2 (4.0-6.3) 3.1 (2.5-3.6)
Drug boluses 13.9 (12.5-15.4) 9.4 (7.9-10.9) 14.9 (13.7–16.0)
Antibiotics 10.1 (8.8-11.3) 10.9 (9.2-12.5) 10.5 (9.5–11.4)
Drug infusion 4.2 (3.3-5.0) 15.3 (13.4-17.1) 7.9 (7.1–8.7)
Flushes 5.9 (4.9-6.9) 3.1 (2.1-3.9) 4.4 (3.8–5.0)
Enteral feeds 10.6 (9.3-11.9) 27.6 (25.3-29.9) 16.2 (15.1–17.3)
Parenteral nutrition 0 (0.0-0.0) 3.1 (2.1-3.9) 1.1 (0.8–1.4)

Sodium administration in ICU patients
98
Overall, fluid infusions, boluses and catheter flushes were the major
sources of administered sodium (46.2% total). Drugs, including
antibiotics administered by intravenous bolus or infusion, also
contribute substantially (33%) to administered sodium, with
antibiotics accounting for the majority of sodium administered as
drugs.
Table 3.7 shows subgroup analysis of patients by length of stay in
ICU. For infants and children in ICU > 1 and < 10 days (n= 29),
intravenous fluid administered as bolus or infusion contributed to
the majority of administered sodium, whereas in infants and
children who were in ICU > 10 days, the greatest proportion of
administered sodium was administered via enteral feeds.
Intravenous maintenance or replacement fluid was administered to
34 patients (71%) in the study cohort on the study day. The type of
fluid used for intravenous infusions (maintenance or replacement) is
shown in Table 3.8. As well as being the most commonly used
maintenance and replacement fluid, 0.9% sodium chloride was also
the fluid used most commonly as a vehicle for intravenous drug
boluses and infusions (65.8% and 68.2%, respectively). Heparinised
0.9% sodium chloride was the most common intravenous or intra-
arterial flush fluid (97.1%).
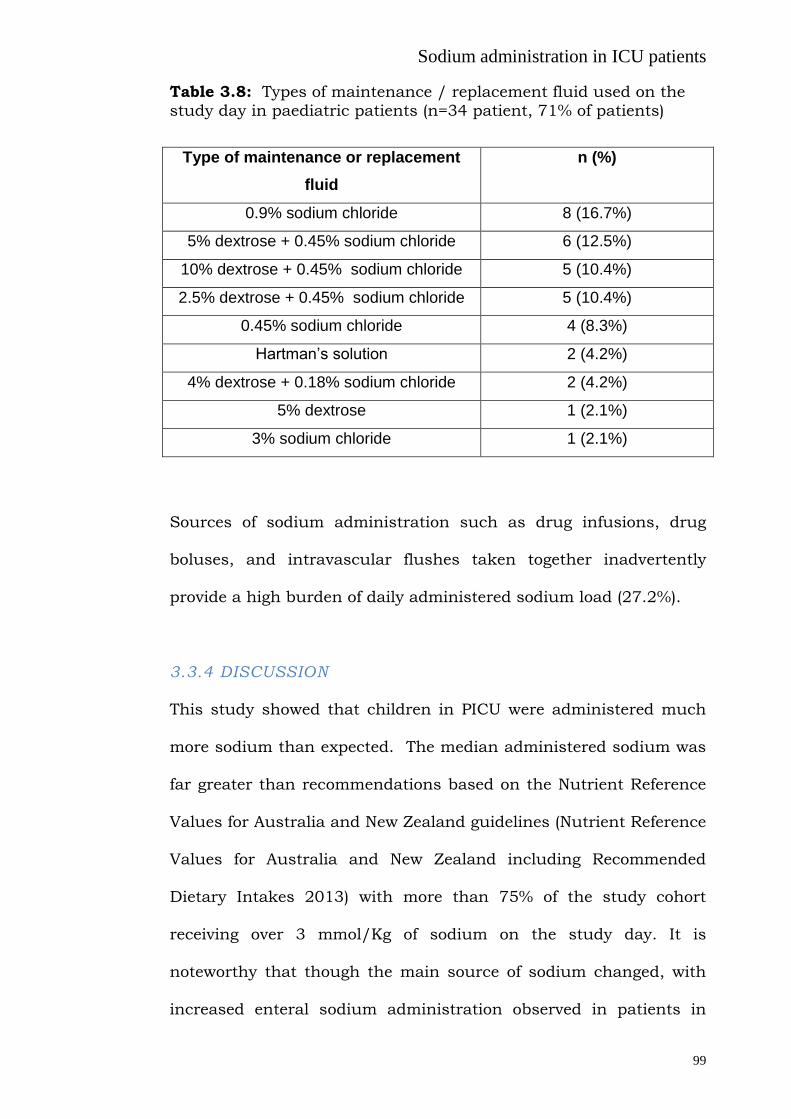
Sodium administration in ICU patients
99
Table 3.8: Types of maintenance / replacement fluid used on the
study day in paediatric patients (n=34 patient, 71% of patients)
Type of maintenance or replacement
fluid
n (%)
0.9% sodium chloride 8 (16.7%)
5% dextrose + 0.45% sodium chloride 6 (12.5%)
10% dextrose + 0.45% sodium chloride 5 (10.4%)
2.5% dextrose + 0.45% sodium chloride 5 (10.4%)
0.45% sodium chloride 4 (8.3%)
Hartman’s solution 2 (4.2%)
4% dextrose + 0.18% sodium chloride 2 (4.2%)
5% dextrose 1 (2.1%)
3% sodium chloride 1 (2.1%)
Sources of sodium administration such as drug infusions, drug
boluses, and intravascular flushes taken together inadvertently
provide a high burden of daily administered sodium load (27.2%).
3.3.4 DISCUSSION
This study showed that children in PICU were administered much
more sodium than expected. The median administered sodium was
far greater than recommendations based on the Nutrient Reference
Values for Australia and New Zealand guidelines (Nutrient Reference
Values for Australia and New Zealand including Recommended
Dietary Intakes 2013) with more than 75% of the study cohort
receiving over 3 mmol/Kg of sodium on the study day. It is
noteworthy that though the main source of sodium changed, with
increased enteral sodium administration observed in patients in

Sodium administration in ICU patients
100
PICU for more than 10 days, overall sodium intake remained high
throughout the PICU admission.
The major source of sodium administration was intravenous fluid,
mainly in the form of intravenous fluid infusions (for example
maintenance fluids, replacement fluids), as well as intravenous drug
infusions, boluses and flushes. This finding is similar to a single
centre study in an adult ICU (Section 3.1) and to a report in adult
cardiac patients (Tafreshi et al. 2011), but has not been previously
reported in the paediatric intensive care population. It is noteworthy
that 0.9% sodium chloride was the most common i.v. infusion fluid
used as a vehicle for administration of drugs both as infusions and
boluses and for flushing intra-vascular catheters, and contributed
substantially to the high levels of administered sodium in children
in this study. There is evidence to suggest that parenteral
maintenance solutions with a high sodium concentration may be
significantly safer than hypotonic solutions in protecting against
acute postoperative hyponatremia in children. However, in adults
recent studies have indicated that excretion of both water and
sodium is slower after a bolus of 0.9% sodium chloride compared to
balanced solutions (Reid et al. 2003), and may result in reductions
in renal blood flow velocity and renal cortical tissue perfusion
(Chowdhury et al. 2012).

Sodium administration in ICU patients
101
The most commonly used intravenous fluid in our study was 0.9%
sodium chloride. Chloride administration is a recognised cause of
normal anion gap acidosis in paediatric intensive care (Taylor et al.
2006) and implementation of a chloride-restrictive strategy may
have less deleterious effects, as manifested by kidney injury and
requirement of dialysis (Yunos et al. 2012).
Although a portion of the administered sodium is inevitably required
for the management of critically ill children, for example in bolus
and maintenance fluids, some of the administered sodium, such as
that present in the vehicle used for drug infusion, boluses and
intravascular flushes, inadvertently provide more than one quarter
of the administered sodium load, and are largely avoidable.
Attention to minimizing these inadvertent sources of sodium is a
possible target for a sodium restriction strategy.
Fluid balance was also positive in most patients, with 25% of
patients in the cohort recorded to be more than 40ml/kg positive
over the 24-hour study period. Compared to older children, infants
less than 1 year of age received more sodium per kg body weight
and had a more positive fluid balance, with 75% of the infants in the
cohort recorded to have received more than 80 ml/kg fluid on the
study day. Positive fluid balance in adults and children in ICU is
associated with poor lung and kidney function (Wiedemann et al.
2006; Arikan et al. 2012; Bouchard et al. 2009), delayed return of

Sodium administration in ICU patients
102
gastrointestinal function after surgery (Lobo et al. 2002) and an
increased risk of mortality (Goldstein et al. 2004; Symons et al.
2007; Goldstein et al. 2005; Michael et al. 2004; Foland et al. 2004;
Boyd et al. 2011). Valentine et al. have reported that a positive and
increasing fluid balance on day 3 of ICU stay in children with acute
lung injury in PICUs was independently associated with fewer
ventilator-free days (Valentine et al. 2012). The adverse effects of
positive fluid balance may be due to extracellular fluid expansion.
Moreover, a positive fluid balance coupled with a high sodium
administration, as seen in many of the patients in our study, can
potentially lead to cellular dehydration and interstitial oedema in
both the lungs and the systemic circulation, and it is postulated to
be a potential mechanism contributing to abnormal neurocognitive
effects in patients with lung injury managed with conservative fluid
balance (Mikkelsen et al. 2012).
The serum sodium observed in this study is similar to studies
performed in neonates (Balasubramanian et al. 2012). The
prevalence of observed hypernatremia is consistent with the
literature (Forman et al. 2012) and has been associated with poor
outcomes (Holliday et al. 2003).

Sodium administration in ICU patients
103
3.3.5 STUDY LIMITATIONS AND FUTURE DIRECTIONS
These data are from a single study day across multiple PICUs in
Australia and New Zealand and thus represent a snapshot of
current practice. Despite our best efforts (multiple pilot trials) to
record all intravenous and enteral fluids administered, as with the
adult study, errors in data collection cannot be excluded. Moreover,
we excluded patients who were taking free oral intake as it was
difficult to ascertain the sodium content of all oral feeds with the
current study design. Despite this, some of the included patients
were allowed oral feeds, hence the total administered sodium might
be an underestimate. Indications for the prescription of high sodium
containing fluids such as 0.9% sodium chloride were not recorded
and they may have been used as a therapeutic modality. Our
observations are based on calculated fluid balance in the study
cohort; we did not weigh the patients before and after the study day
as this was beyond the scope of our study. In addition, as sodium
intake, calculated as volume times concentration for both i.v. and
enteral fluids, was the main aim of the study, fluid balance has
some advantages over weighing as it is internally consistent.
There were high levels of sodium administration in this cohort of
PICU patients. This result should be confirmed in a longitudinal
study in a larger group of patients. Future studies should include
measurement of the estimated sodium balance from measured
urinary sodium and examine this effect on oxygenation, serum
Sodium administration in ICU patients
104
sodium and patient related outcomes (length of stay and mortality).
Similarly, serum chloride and total chloride administration should
also be measured and the effect on body pH should be examined.
Furthermore specific subgroups such as children with renal failure
and respiratory failure should be examined separately.
As the current level of administered sodium is high, future studies
should examine strategies to decrease the amount of sodium
administered via inadvertent sources, such vehicles for drug
infusions and drug boluses and flush for intravascular catheters,
and should examine the effect of such strategies on sodium balance
and clinical outcomes.
3.3.6 SUMMARY
This study demonstrates high levels of administered sodium and
positive fluid balance in the majority of patients across a cohort of
paediatric patients in PICUs across Australia and New Zealand. The
significant contributions of maintenance and bolus intravenous
fluids, most commonly 0.9% sodium chloride, drug infusions
including antibiotics, and enteral feeds, are noted. Future studies
should evaluate the effect of this practice on overall sodium balance
and patient outcomes.

Sodium administration in ICU patients
105
3.4 Inadvertent sodium loading with renal replacement
therapy in critically ill patients
Acute kidney injury (AKI) is a common finding among patients in the
intensive care unit (ICU) (Hoste et al. 2006) and is an independent
predictor of mortality (George et al. 2007; Uchino et al. 2005).
Severe AKI requiring the use of renal-replacement therapy affects
approximately 5% of patients admitted to the ICU and is associated
with a mortality rate of 60% (Uchino et al. 2005).
Fluid overload is common in critically ill patients and is associated
with poor lung and kidney function (Wiedemann et al. 2006;
Bouchad et al. 2009), delayed return of gastrointestinal function
after surgery (Lobo et al. 2002) and increased mortality (Boyd et al.
2011). In the previous section of this chapter it was shown that
critically ill patients inadvertently receive high amounts of sodium
during their stay in ICU (Section 3.1, 3.2) despite careful attention
to negative fluid balance. Although renal replacement therapy (RRT)
is often used to manage fluid overload, in addition to metabolic
control in AKI, it has been recently reported that in patients
requiring chronic haemodialysis, the dialysis procedure itself may
become a de facto source of sodium loading rather than a means for
sodium removal (Thijssen et al. 2011; Santos et al. 2010). This is
mainly because low patient serum sodium results in a positive
dialysate-to-serum sodium gradient (Keen et al. 2007). Such a
phenomenon is also possible in critically ill patients during RRT;
however, the effect on sodium balance is currently unknown.

Sodium administration in ICU patients
106
We hypothesised that RRT contributes to patient sodium load
independent of fluid balance, therefore we investigated the flux of
sodium during RRT.
3.4.1 METHODS
Sixty patients (20 patients in each of 3 modes of RRT – see below)
were recruited from September 2011 to December 2012 in a single
centre tertiary level ICU. This study protocol was approved by the
institutional human research ethics committee (#361/11) (Appendix
4). All ICU admissions underwent daily screening for eligible
patients from 0800 to 1100 Monday to Friday during the study
interval and patients who were initiated on dialysis during this time
frame were consecutively included. Patients with a history of
chronic haemodialysis, or peritoneal dialysis or those who were
receiving citrate as a form of anticoagulation were excluded.
Either an intermittent technique - extended daily dialysis (EDD)
(Fresenius 4008S; Bad Homburg, Germany) or a continuous
technique - continuous renal replacement technique (CRRT)
(Aquarius 6.01; Langenhagen, Germany) for RRT were studied.
Blood flow from the patient was constant at 200 ml/minute.
3.4.1.1 EDD - Patients dialysed with intermittent RRT underwent
extended haemodialysis (there were no patients with extended
haemofiltration or haemodiafiltration). The affluent fluid going in to
the dialysis was sampled; similarly the effluent fluid was sampled

Sodium administration in ICU patients
107
for the amount of sodium present every hour throughout the
duration of the dialysis. These samples were analysed for sodium
with a Radiometer ABL 700 Series (Brønshøj, Denmark). The
amount of sodium prescribed on the machine was noted.
3.4.1.2 CRRT - Patients undergoing continuous RRT were either
undergoing continuous veno-venous haemofiltration (pre-filter fluid
replacement) (CVVH) or continuous veno-venous haemodiafiltration
(post filter fluid replacement) (CVVHDF). The amount of sodium in
the dialysis bags (affluent) (5L Baxter Haemofiltration Replacement
fluid or 5 L Gambro Hemosol BO fluids) was 140 mmol/litre. Twenty
random samples were taken from these bags to check for the
accuracy of these bags. The waste bags (effluent) during dialysis
were weighed on a Conair weighing scale (model number-WW147A;
Guangzhou, China) before discarding them (1 to 2 bags at a time)
and a sample was taken from them for sodium analysis. These
samples were also analysed for sodium with the Radiometer ABL
700 Series. The weighing scales were calibrated against a known set
of weights ranging from 5 to 20 Kg (A&D Mercury Pty. Ltd.; NATA
Accredited Laboratory no. 3811; Ref No A/m/037; File No:
SA/M/027).
Sodium balance was calculated as the difference between the
affluent and the effluent fluid sodium content corrected for volume.

Sodium administration in ICU patients
108
The duration of study was either the duration of a single EDD
session (6 to 10 hours) or 24 hours of CRRT. Each patient who may
have received multiple sessions / days of RRT during their stay in
ICU was enrolled only once for the study.
Data regarding patient demographics, dialysis duration, day of
dialysis, total litres of dialysis/filtration, net fluid removal,
interruption during dialysis were also recorded, in addition to their
serum sodium (at initiation and end of study ), serum urea,
albumin, osmolality, serum glucose, requirement of invasive
mechanical ventilation and vasopressors and total fluid balance on
the study day was also recorded.
3.4.2 STATISTICAL ANALYSIS Data are reported as mean (standard deviation, SD) or median
(inter-quartile range, IQR) as appropriate for the distribution of each
variable. Analysis was performed with the SPSS software (version
19.0, Chicago, IL, USA). Data from EDD, CVVH (pre-filter) and
CVVHDF (post-filter) were analysed separately as it was
hypothesised that they may have differential effect on sodium flux.
Differences between the groups were analysed with Chi square test
or Kruskall-Wallis test or one way ANOVA, as appropriate, and
tukey’s test was used for post hoc analysis. Change in serum
sodium pre and post dialysis was tested with paired t test. Bland-
Altman analysis was used to study the calibration and is reported
as mean and SD of the difference. Pearson’s correlation was used to

Sodium administration in ICU patients
109
test for the association between the factors and the sodium flux
during dialysis in ICU. In univariate analysis, variables were
individually assessed as predictors of the sodium flux during
dialysis in ICU. Variables significant at alpha ≤ 0.10 level were then
assessed for possible inclusion in the multivariate model. A
conventional alpha level of < 0.05 was used for all significance
testing.
3.4.3 RESULTS
3.4.3.1 Demographics
Sixty suitable patients undergoing RRT were included in the study
with 20 in each EDD, CVVH, and CVVHDF groups. Their
demographics, serum sodium, albumin, urea, glucose and
osmolality are shown in Table 1. There was no difference between
the groups with respect to age, APACHE II score or serum sodium,
albumin, urea, glucose and osmolality at the start of RRT. Use of
invasive mechanical ventilation and vasopressors on the study day
is also shown in Table 3.9. Fewer patients on EDD required
vasopressors on the study day.

Sodium administration in ICU patients
110
Table 3.9: Demographics, blood results of patients dialysed in the
study
EDD (n=20) CRRT (n=20)
CVVH (pre filter)
CRRT (n=20)
CVVHDF (post-
filter)
Gender (M/F) 12/8 10/10 13/7
Age (years)* 66 (28 – 81) 64 (28 – 90) 62(33-85)
APACHE II * 28 (16 – 40) 29(17 – 44) 28(15-42)
Mechanical ventilation on the
study day n,(%) *
16 (80) 15 (75) 17 (85)
Vasopressor use on the study day
n,(%)$
12 (60) 18(90) 17(85)
Dialysis episode / day*
2.0±2.3 3.0±2.2 2.1±2.1
Serum Sodium at start (mmol/l) * 137 (135-138) 135 (133 -138) 135 (134 -138)
Serum Sodium at end (mmol/l)* 138 (136-141) 137 (135-140) 137 (134-139)
Serum Albumin at start (g/L) * 28±6 28±5 27±4
Serum Urea at start (mmol/L) * 21±11 16±9 18±8
Serum Glucose at start (mmol/L) * 8±3 8±2 7.5±4
Serum Osmolality at start* 305±13 296±13 298±15
Data represented as median (IQR) or mean ± SD as appropriate. * No statistically significant difference between groups was present for any of the listed parameters (Tested with ANOVA / Kruskall-Wallis test /Chi square as appropriate) $ There was a difference between the groups (p=0.048), tested with Chi square test
3.4.3.2 EDD:
Duration of dialysis was 8.2 ± 2.1 hours. Average sodium in the
affluent dialysate was 139 ± 3 mmol/l. The difference (mean and
SD) between the prescribed sodium in the Fresenius 4008S and
measured sodium in the affluent fluid was 0.05 ± 0.51 mmol/l.
Dialysis flow rate was 200 ± 31 ml/minute. Data regarding total
dialysate used for EDD, total fluid removed during the dialysis, total
flux of sodium in to the patient (total and per L of dialysate) and
fluid balance on the study day are shown in Table 3.10.

Sodium administration in ICU patients
111
Table 3.10: Total dialysate, sodium flux and fluid removed during
dialysis in ICU
EDD CVVH CVVHDF
Total dialysate used
(L)*
106.3±40.3 53.3±22.8 55.3±26.2
Sodium flux
(total mmol) *
186±155 305±196 355±180
Sodium flux
(mmol per 1L
exchange) *
2±2 5±3 6±2
Total fluid removed (L)
*
0.9±0.9 1.3±1.5 1.4±1.1
Fluid balance on study
day (ml) $
832 (121-1956) 746 (568-2544) 958 (429-2473)
* Data presented as mean ± standard deviation $ Data presented as median and IQR
Positive sodium flux in to the patient correlated with the gradient
between RRT sodium and serum sodium and had a negative
correlation with the total fluid removed. (Table 3.11).
Table 3.11: Correlations with sodium flux with dialysis
EDD
r p value
CRRT
CVVH
r p value
CVVHDF
r p value
Delta RRT sodium and
initial serum sodium
0.56 0.009 0.64 <0.001 .66 <0.001
Total fluid removed -0.53 0.01 -.34 .05
Total litre of exchange 0.73 <0.001 0.64 .001
Osmolality -0.4 0.01

Sodium administration in ICU patients
112
Multivariate regression modelling identified factors
[exp(b)(SE),Pvalue] which significantly affected sodium balance;
these were gradient between RRT sodium and serum sodium
[20.9(5.8),p<0.02] and total litres of exchange (dialysis)
[1.5(0.68),p<0.04] (R2=0.42).
There was no difference between serum sodium at the start (137
(135-138)mmol/l) and end (138 (136-141) mmol/l ) of EDD (p=0.7).
3.4.3.3 CRRT:
The difference (mean and SD) between the sodium in replacement
bags (affluent) (labelled as 140 mmol/l) and the sodium measured
by the Radiometer ABL 700 Series was 0.00 ± 0.55mmol/l. The
difference (mean and SD) between the weight of the replacement
bags: two at a time; labelled as 5 kg each and then weighed on the
weighing scale was 0.03 ± 0.18 kg. The difference (mean and SD)
between the known weights measured on a standard scale ranging
from 5 to 25 kg (total 30 measurements) and then measured on the
weighing scale used for the study was 0.008 ± 0.05 kg.
CVVH (pre-filter fluid replacement): Duration of dialysis was 23.0 ±
1.0 hours. Total dialysate used for CVVH was 53.3 ± 22.8 litres. The
replacement fluid flow rate was 2.6 ± 0.9 litre/hour. Data regarding
total dialysate used, total fluid removed during the dialysis, total
flux of sodium in to the patient (total and per L of dialysate) and
fluid balance on the study day are shown in Table 3.10.

Sodium administration in ICU patients
113
Positive sodium flux in to the patient correlated with gradient
between the RRT sodium and serum sodium, total litres of exchange
and had a negative correlation with serum osmolality. (Table 3.11).
Multivariate regression modelling identified factors
[exp(b)(SE),Pvalue] which significantly affected sodium balance.
These were gradient between the RRT sodium and serum sodium
[21.8(4.7),p<0.001] , dialysis day [-20.9(9.8), p<0.05] and total litres
of exchange (dialysis and filtration) [5.2(0.96),p<0.001] (R2=0.77).
There was no difference between serum sodium at the start (135
(133 -138)mmol/l) and end (137 (135-140) mmol/l) of CVVH (p=0.4).
CVVHDF (post-filter fluid replacement): Duration of dialysis was
22.2 ± 1.1 hours. Total dialysate used for CVVHDF was 55.3 ± 26.2
litres. The replacement fluid flow rate was 2.8 ± 0.6 litre/hour. Data
regarding total dialysate used, total fluid removed during the
dialysis, total flux of sodium in to the patient (total and per L of
dialysate) and fluid balance on the study day are shown in Table
3.10.
Positive sodium flux in to the patient correlated with gradient
between the RRT sodium and serum sodium, total litres of exchange
and had a negative correlation with total fluid removed. (Table 3.11)
Multivariate regression modelling identified factors
[exp(b)(SE),Pvalue] which significantly affected sodium balance were

Sodium administration in ICU patients
114
gradient between the RRT sodium and serum sodium
[23.8(3.7),p<0.001] and total fluid removal [-18.5(3.26),p<0.001],
(R2=0.73).There was no difference between serum sodium at the
start (135 (134 -138)mmol/l) and end (137 (134-141)) of CVVHDF
(p=0.5).
CVVH and CVVHDF resulted in similar sodium flux per litre
exchange in to the patient (p=0.9) but both were greater than EDD
(p<0.001 for both comparisons) despite greater fluid removal.
Though in each of the individual dialysis mode, there was no change
in serum sodium at the start and end of dialysis, when all the
serum sodium values were combined and examined as tertiles there
was a significant change in serum sodium at the start and end of
dialysis in the lowest (132.6 ± 3.0 to 136.4 ± 3.9 mmol/l, p<0.001)
and the highest tertile (141.3 ± 4.1 to 138.5 ± 2.9 mmol/l, p=0.001)
while there was no change in the middle one (136.0 ± 0.8 to 136.7 ±
2.4, p=0.21).
3.4.4 DISCUSSION
Critically ill patients undergoing RRT inadvertently receive a sodium
load despite net fluid removal. The major reason for this appears to
be the positive gradient between the dialysate/replacement fluid
sodium and the patient’s serum sodium at the start of the dialysis.
Sodium administration in ICU patients
115
Why sodium is important in ICU
The association of positive fluid balance with adverse outcomes
(Wiedemann et al. 2006; Bouchard et al. 2009; Lobo et al. 2002;
Boyd et al. 2011) is believed to be due to extracellular compartment
expansion, as water distributes to both intra and extracellular
spaces. However, sodium primarily distributes into the extracellular
space, which may have differential effects on extracellular volumes,
cause cellular dehydration and exacerbate interstitial oedema in
both the systemic and pulmonary circulations.
Furthermore, positive pressure ventilation, and positive end-
expiratory pressure result in elevated intra-thoracic pressure,
reduced venous return, and consequent complex neuro-humoral
responses (Frazier 1999; Jungmann et al. 1987) that potentiate
sodium retention in critically ill patients. Hence the additional
contribution of RRT to positive sodium balance may be significant
clinically.
Factors affecting the flux of sodium in to the patient
The gradient between the RRT sodium and patient’s serum sodium
appears to be the major factor driving the influx of sodium in to the
patient. This makes intuitive sense and has been recognized as an
important cause of sodium loading during chronic haemodialysis.
The default sodium selected on the Fresenius 4008S is 140 mmol/l,
(though there is an option to adjust the sodium from 127-

Sodium administration in ICU patients
116
150mmol/L in EDD), whereas the replacement bags used for a
typical CRRT device such as the Aquarius 6.01 are only available
with a sodium concentration of 140 mmol/l as no other option is
currently available. As most of the patients in this study had a
serum sodium less than 140 mmol/l, this created a positive
gradient between the two, resulting in net sodium flux in to the
patient. Keen et al. have reported a positive dialysate-to-serum
sodium gradient in approximately 98% of patients, and diffusive
gain of 75 mmol in body sodium content at the end of each chronic
haemodialysis session with a median dialysate-to-plasma sodium
gradient of 6 mmol/l (Keen et al. 2007). Similar findings have been
reported elsewhere (Peixoto et al. 2010). Lower predialysis serum
sodium concentration has been associated with an increased risk of
death in patients on chronic haemodialysis (Waikar et al. 2011)
indicating a higher gradient will lead to a positive sodium flux in
patients during a dialysis session. This may lead to extracellular
fluid expansion and a rise in blood pressure, and has been linked to
cardiovascular disease in patients with chronic kidney disease
(Thijssen et al. 2011). Similarly, a high gradient between the RRT
sodium and patient serum sodium can lead to extracellular fluid
expansion in patients in ICU. Also, a higher dose of dialysis also
adds an extra load of sodium to the patients, as seen in our study,
as sodium flux is proportional to the exchange volume.

Sodium administration in ICU patients
117
One of the other findings in this study was the negative correlation
between fluid removal and sodium flux in to the patient. This was
seen in patients with CVVHDF and indirectly in CVVH where
dialysis day had a negative correlation with net sodium flux. The net
fluid removal not only removes fluid but also sodium in patients on
RRT. As ICU patients placed on RRT often are initially
haemodynamically unstable they are treated with no net fluid
removal in the initial days. The fluid removal seen in our study was
less than that reported in the RENAL study (RENAL Replacement
Therapy Study Investigators 2009) and patients had a positive fluid
balance. Patients in the RENAL study were followed for an average
of 6 days compared with 2 days in the current study, therefore this
difference may have allowed time for recovery and greater fluid
removal.
The lack of change in serum sodium in the study in each mode of
dialysis was surprising as we expected it to rise with fluid removal
and sodium loading during dialysis sessions (even though there was
a rise in serum sodium in the combined lowest tertile of the data). A
possible reason for this finding is that patients were early during
their stay in ICU and were hemodynamically unstable; 78% of them
were on vasopressors on the study, and they all had a positive fluid
balance during the study day as they required additional fluids and
drugs to resuscitate and treat them, thereby effecting the
distribution of total body water and sodium. These results might
Sodium administration in ICU patients
118
therefore be different if these patients were dialysed later during
their stay when they would have been more stable and may have a
different sodium profile.
Difference between the EDD and CRRT
We found that CRRT contributed a higher load of sodium to the
patients when compared with EDD. A possible reason for this could
be that in EDD there is an option of selecting the sodium
prescription for the machine, hence, prescription of a better match
to the patient’s serum sodium can be achieved. However, as our
average affluent fluid sodium in patients with EDD was 139mmol/l,
which was very similar to patients on CRRT, this seems an unlikely
explanation.
Overall, sodium balance seems to be more complex than previously
considered. Current prescribing practices for dialysis for sodium
flux rely primarily on convective losses (~78%) and less on diffusive
losses (~22%) (Lambie et al. 2005). Thus sodium removal can be
increased both by applying higher ultrafiltration volumes and by
lowering dialysate sodium concentration. The principle of diffusive
sodium removal is, however, more complicated. In both blood and
dialysate, a significant, but differing, percentage of sodium is bound
to anions and unavailable for diffusion. In plasma water, it is
assumed that ±7 mmol/L of the total sodium concentration of ±150
mmol/L sodium is in a complexed form, versus ±4 mmol/L in

Sodium administration in ICU patients
119
dialysate (Locatelli et al. 1989; Locatelli et al. 1999). No net diffusive
sodium transport between blood and dialysate occurs when sodium
in the plasma, as measured by flame photometry, is ± 2mmol/L
lower than dialysate sodium concentration (Locatelli et al. 1984).
This may explain the lower flux of sodium with EDD. Diffusive influx
may occur with supraphysiologic dialysate sodium concentrations
and in patients with low predialytic plasma sodium concentrations
(Moret et al. 2002; Gelens et al. 2002). In ICU the serum albumin is
often subnormal, making these predictions even more unreliable.
Even less is known about sodium removal during haemofiltration.
Sodium removal was found to be less during both predilution
haemofiltration and postdilution haemodiafiltration compared with
haemodialysis using the same sodium concentration in the dialysate
and in the reinfusate (Locatelli et al. 2000), further supporting our
findings.
Suggestions to reduce sodium influx during dialysis in ICU
Two achievable major interventions in ICU to potentially decrease
the amount of sodium influx in patients are (i) use of better
individualization of dialysate sodium concentration and (ii) earlier
use of fluid removal. Several studies in which dialysate sodium
concentration was individualized or randomly reduced have reported
decreases in interdialytic weight gain and or blood pressure in
patients on chronic haemodialysis (De Paula et al. 2004; Sayarlioglu
et al. 2007; Thein et al. 2007). Individualisation of dialysate sodium

Sodium administration in ICU patients
120
concentration is not possible currently with CRRT as, to the best of
our knowledge, all available bags come with a fixed concentration of
140 mmol/l. Sodium profiling, decreasing the dialysate sodium
during a session is controversial (Zhou et al. 2006; Iselin et al. 2001;
Stiller et al. 2001) and probably can be counterproductive in ICU as
seen in patients with chronic haemodialysis (Zhou et al. 2006;
Stiller et al. 2001).
3.4.5 LIMITATIONS
These results are from a single centre and the sample size was
relatively small. We studied only 2 types of dialysis machines and in
total 3 modes of RRT. However, we believe this is the first study to
examine the effect of dialysis on sodium in ICU, the 2 most common
modes used in ICU – EDD and CRRT were studied. In addition,
despite the small sample size the data was both predictable and had
little variability.
Other short comings of the study are that most of the study data are
from early on in the dialysis course and the sodium profile might be
different later during a dialysis course and this should be a matter
of future investigation. However, the effect on sodium will be most
relevant early on in the stay of ICU patients when maximum stress
will tend to retain sodium. We also acknowledge a lack of change of
a body weight as study limitation for the present study, though it
would have been useful and often reported with studies with chronic
Sodium administration in ICU patients
121
dialysis, it was not practical to weigh high acuity ICU patients before
and after the dialysis, instead we report the total fluid removed by
the dialysis machines during the dialysis session and fluid balance
on the study day. While other patient related data such as
additional fluids administered, losses and sodium balance data are
not available, this does not influence the conclusion of the study.
However, in future studies these data would assist in defining the
potential clinical consequences.
3.4.6 SUMMARY
In conclusion, these are the first data examining sodium balance
during RRT in critically ill patients. Despite a net negative fluid
balance, RRT contributes to sodium loading. We suggest further
studies to examine the clinical relevance of this finding.

Sodium balance in ICU patients
122
CHAPTER 4: SODIUM BALANCE IN ICU PATIENTS
4.1 Sodium balance is different from fluid balance in
critically ill mechanically ventilated patients
The association of positive fluid balance with adverse outcomes is
believed to be due to extracellular compartment expansion, as water
distributes to both intra- and extracellular spaces. However, sodium
only distributes into the extracellular space, which may have
differential effects on extracellular volumes, cause cellular
dehydration and exacerbate interstitial oedema in both the systemic
and pulmonary circulations.
During current practice high amounts of sodium are administered;
however, the clinical impact is unknown. In a single centre study
critically ill patients were inadvertently administered more than
twice (Chapter 3) the recommended intake of 100 mmol per day
(Australian National Health and Medical Research Council, New
Zealand Ministry of Health. Nutrient Reference Values for Australia
and New Zealand including recommended dietary Intakes 2013)
despite achieving fluid balance consistent with the conservative arm
of the FACTT study (Wiedemann et al. 2006). This was confirmed in
a point prevalence study across 40 ICUs in Australia and New
Zealand (356 subjects), where total sodium administered on the
study day (median, inter-quartile range) was 225 (145 – 368) mmol
(Chapter 3). However, both studies only observed sodium

Sodium balance in ICU patients
123
administration, neither estimated sodium balance, and no clinical
correlates were made.
Both sodium and fluid need to be administered in balance and
proportionate to the dynamic clinical state. For example, inadequate
sodium and fluid administration may exacerbate haemodynamic
instability, particularly during stress such as sepsis and mechanical
ventilation, and an imbalance may result in hyper- or hypo-
osmolality. Furthermore, positive pressure ventilation, and positive
end-expiratory pressure result in elevated intra-thoracic pressure,
reduced venous return, and consequent complex neuro-humoral
responses (Bersten 2006; Frazier et al. 1999) that also lead
(Jungmann et al. 1987) to sodium and water retention. Although
conservative fluid administration may increase ventilator free days
(Wiedemann et al. 2006), suggesting a direct effect on respiratory
function, the contribution of sodium balance is unknown.
We hypothesised that the pattern of sodium balance in critically ill
patients over the first few days following commencement of
mechanical ventilation would differ from fluid balance, and that
high sodium balance may be associated with greater respiratory
dysfunction. Accordingly, this study aimed to prospectively estimate
sodium balance, fluid balance and respiratory function in patients
who were anticipated to require mechanical ventilation for ≥ 48
hours. We also aimed to qualify alterations in body composition.

Sodium balance in ICU patients
124
4.1.1 METHODS
This study protocol was approved by the institutional human
research ethics committee (#036/11). Patients admitted to a single
tertiary ICU were prospectively recruited. Patients who were
anticipated to require invasive mechanical ventilation for at least 48
hours (based on the treating consultant’s prediction), were eligible
for participation at the time of intubation, providing they did not
meet any of the following exclusion criteria: < 18 years of age;
history of a chronic haemodialysis requirement; admission diagnosis
of traumatic brain injury; diabetic ketoacidosis; hyperglycaemic
hyperosmolar syndrome; surgical ICU admission; pregnancy or
within 2 months post-partum; anticipated death within 24 hours or
designated as not for active treatment. Surgical patients were
excluded in an attempt to minimise other potential sources of
fluid/sodium loss. Demographic details were collected with ICU
admission diagnosis and measures of severity of illness APACHE
versions II and III, simplified acute physiology score (SAPS II), and
sequential organ failure assessment (SOFA) (Vincent et al. 1996).
Outcome data included hours of ventilation, ICU mortality and both
ICU and hospital lengths of stay. The presence of co-morbidity was
assessed by the Charlson Co-morbidity Index (McGregor et al. 2005;
Hall et al. 2004). The day that mechanical ventilation was
commenced was designated as Day 0. The following variables were

Sodium balance in ICU patients
125
then obtained daily for 5 days or until 24 hours after the day of
extubation, whichever occurred first.
4.1.1.1 Estimated sodium and fluid balance
Sodium and fluid input were calculated as follows. For all solutions,
the type and volume administered over each 24-hour study day was
recorded. Furthermore, intravenous fluid/sodium sources were
classified as (i) fluids administered by bolus or infusion for volume
expansion/resuscitation, including crystalloids and colloids, (ii)
transfusion of blood products including red blood cells, platelets,
fresh frozen plasma, (iii) infusions given as maintenance or
replacement fluids, (iv) antibiotics administered by a bolus together
with its vehicle, as antibiotics significantly contribute to sodium
load (Appendix 1), (v) other drugs administered by continuous
infusion together with their vehicle, (vi) other drugs administered by
a bolus together with their vehicle, and (vii) flushes of intra-vascular
lines associated with haemodynamic monitoring, including arterial
lines and central venous catheters. Fluid/sodium sources could also
be classified as from, (viii) feeding via enteral nutrition or (ix) total
parenteral nutrition (TPN). The amount of sodium administered was
then calculated based on the sodium concentration (Appendix 1).
Therefore, for drug infusions and boluses, sodium content was
calculated from both sodium content of the drug and the type and
volume of carrier fluid or diluent. For enteral nutrition, information
on the type and volume of feed was recorded and the sodium

Sodium balance in ICU patients
126
content calculated accordingly. No episodes of nasogastric
intolerance were recorded in the study cohort. Similarly for custom
TPN, the sodium content was recorded.
To estimate sodium output and therefore balance each day, urinary
sodium concentration was measured from a 24 hour urine save, by
the indirect ion selective electrode technique (Roche modular
analyser, Hitachi High-Technologies Corporation, Tokyo, Japan), In
addition, daily fluid balance, urine output, and serum sodium were
collated. Hypernatremia was defined as a serum sodium ≥ 150
mmol/L.
4.1.1.2 Respiratory function
The chest radiograph was evaluated for pulmonary oedema by a
blinded assessor and assigned a score from 0-390 using a scoring
system validated by Halperin et al. (Halperin et al. 1985), with 0
representing no oedema and high scores representing severe
oedema. More specifically, the chest x-ray score was calculated by
the summation of sub-scores from 0 (normal) to 65 (alveolar oedema
involving entire pulmonary region) assigned to each of 6 lung
regions. The highest and lowest PaO2/FiO2 ratios were also
calculated from routinely performed arterial blood gas analysis (ABL
700 Series, Radiometer Medical ApS, Bronshoj, Denmark)

Sodium balance in ICU patients
127
4.1.1.3 Body composition
Body weight was measured to the nearest 0.1 kg at the same time
each day using a Jordan frame attachment to a lifter with a weigh
scale (IPL 150-em patient lifter and weighting device, Invacare,
Cheltenham, VIC, AUS), which enabled patients to remain in a
stable supine position. Care was taken to ensure that there was no
additional weight of attachments or linen that had not been factored
into the calculations and procedure for this measurement. Supine
body length was also recorded to the nearest 0.1 cm using a tape
measure (W606PM Executive Thinline, Lukfin, TX, USA) as a proxy
measurement of height (Gray et al. 1985; Baldwin et al. 2012) on the
initial test day.
Body composition analysis was then performed with bioelectrical
impedance spectroscopy using a tetra-polar device (SFB7,
ImpediMed Ltd, Pinkenba, QLD, AUS) and a previously described
technique (Baldwin et al. 2012). Therefore, participants’ rested
supine, with the medial surfaces of the limbs abducted so as resting
away from, and not touching the body. Single use gel electrodes
(ImpediMed Limited, Pinkenba, Australia) were placed on the dorsal
hand and foot of one side of the body, to form the tetra-polar
electrode arrangement. Data were uploaded to the Bioimp Software
(v. 5.3.1.1, Impedimed Limited, Pinkenba, Australia) and inbuilt
prediction algorithms that used cole-cole modelling with details of
weight, height, age and gender were used to approximate the volume

Sodium balance in ICU patients
128
of the total body water (TBW), extracellular fluid (ECF) and intra
cellular fluid (ICF) compartments. The relative volume of ECF was
then expressed as a percentage of TBW.
4.1.1.4 Clinical parameters
Other clinical parameters that were recorded from routine
monitoring/investigations included serum creatinine, urea, and
albumin. The use of a priori selected therapies that were noted
included the administration of diuretics, steroids and renal
replacement therapy. Moreover, peripheral oedema was scored by a
blinded and independent assessor, by the summation of sub-scores
given to the pedal, lateral chest wall, hand and sacral regions
(individually from score of 0 to 4) to form a total oedema score from
0-16 with high scores representing greater oedema (Urden et al.
2006). A SOFA score was also calculated daily (Vincent et al. 1996).
4.1.1.5 Statistical analysis
Data are reported as mean (standard deviation, SD) or median
(inter-quartile range, IQR) as appropriate for the distribution of each
variable. Analysis was performed with the SPSS software (version
19.0, Chicago, IL, USA). Differences between variables over time
were analysed by a repeated measures analysis of variance (ANOVA)
and correlations by Pearson’s r. Cumulative fluid balance and
sodium balance were correlated with next day’s chest X-ray score

Sodium balance in ICU patients
129
and the lowest PO2/FiO2 ratios. A conventional alpha level of < 0.05
was used for all significance testing.
4.1.2 RESULTS
Ten subjects aged 60 (12) years participated for 4.5 (3.2-5.0) days,
with all subjects completing the study protocol. Other demographic
details and characteristics at ICU admission are outlined in Table
4.1. With regards to clinical care, none of the patients required renal
replacement therapy. All the patients were included in the study
within 24 hours of initiation of mechanical ventilation.

Sodium balance in ICU patients
130
Table 4.1: Subject demographics and details at ICU admission in
the single centre sodium balance study
ID Diagnosis Age
(years)
Gender SBL
(cm)
Weight
(kg)
APACH
E II
APACHE
III
SAPS
II
SOFA ICU
LOS
Hospita
l LOS
MV
hours
ICU
mortal
ity
CCI
1 Sepsis 68 F 149.8 68.2 19 79 46 10 7.4 57 56 Alive 10
2 Pneumonia 50 M 173.5 59.4 18 62 38 10 8.5 22 122 Alive 4
3
ARDS-
aspiration
49 M 174.8 82.2 19 32 60 13 11.5 16 131 Alive 3
4 Sepsis 74 M 171.5 113.8 22 65 46 9 7.0 13 69 Alive 18
5
Cardiogeni
c shock
61 M 166.8 58.8 14 37 31 2 4.8 8 88 Alive 3
6 Sepsis 39 F 158.5 80.6 20 70 32 14 7.5 7 93 Alive 0
7
Acute liver
failure
76 M 181.5 97.4 32 98 66 7 7.0 47 141 Alive 10
8 Pneumonia 63 M 179 98.8 29 113 72 9 26.8 52 138 Alive 4
9 Pneumonia 55 F 164.5 76.2 19 60 33 10 5.5 6 131 Dead 13
10
ARDS-
aspiration
60 M 184.8 98.4 25 98 69 12 20.1 26 460 Alive 3
Mean
(SD)
NA
60
(12)
NA
170.5
(10.8)
83.4
(18.4)
22 (6) 71 (26)
49
(16)
10 (3)
10.6
(7.2)
25.3
(19.6)
143
(115)
NA
7
(6)

Sodium balance in ICU patients
131
Results for sodium and fluid parameters, are listed according to
study day in Table 4.2 along with the respiratory function, body
composition and clinical variables. More specifically, patients only
ever achieved a relatively modest positive fluid balance, which was
negative by study day 3. However, it took until day 5 for cumulative
fluid balance to become negative -954 (3181) ml (Fig. 4.1A).
Conversely, sodium administration was considered high throughout
the study period, although it did progressively decrease each study
day (Table 4.2). Furthermore, on study day 0, resuscitation fluids
were the predominant source of sodium administration, with
fluctuations in the contribution of other sources shown in Table 4.3.
While 4 subjects met criteria for hypernatremia, the highest serum
sodium did steadily increase from days 0-5 (p = 0.046).
Furthermore, after 5 days of mechanical ventilation, patients had an
estimated cumulative sodium balance of 253 (346) mmol (Fig. 4.1B).
The increase in serum sodium was mirrored by an increase in
serum urea but a decrease in serum creatinine and albumin
between days 0-5 (Table 4.2).
Patients who received diuretics (total 15 diuretic days) during the
study period did achieve a better urine output (p = 0.04) but did not
achieve a higher or lower natriuresis when compared to subjects
who did not receive diuretics (p = 0.11). There was no difference in
the urine output or natriuresis with intravenous steroids (total 25
steroid days) (p = 0.44 and p = 0.54 respectively).

Sodium balance in ICU patients
132
Table 4.2: Summary of fluid, sodium, respiratory, body composition
and clinical data on each study day in the single centre sodium balance study
Parameter Day 0X
Day 1X
Day 2X
Day 3X
Day 4XX
Day 5XXX
n 10 10 10 10 7 5
Sodium and fluid balance
Total fluid administered (ml) 3563
(2109)
2843
(1089)
2563
(992)
2900
(1126)
2510
(793)
2380
(953)
Urine output (ml) 883
(477)
1796
(1074)
1589
(604)
2061
(603)
2018
(1087)
2098
(1137)
Fluid balance (ml) 1471
(542)
424
(1118)
336
(655)
-321
(1666)
-225
(1509)
-451
(1761)
Total sodium administered (mmol) 488 (399) 198 (86) 149 (46) 135 (66) 112 (46) 94 (34)
Urine sodium (mmol/24 hours) NA 64 (64) 56 (63) 56 (41) 128 (127) 95 (77)
Highest serum sodium (mmol/L) 140 (4) 141 (4) 142 (5) 145 (6) 146 (5) 147 (5)
Respiratory function
Lowest PaO2/FiO2 ratio 96
(24)
194
(109)
237
(64)
231
(47)
258
(95)
205
(100)
Chest x-ray score (*/390) 176
(141)
188
(97)
178
(110)
204
(118)
193
(121)
140
(109)
Body composition
Body weight (kg) NA 83 (18) 84 (18) 79 (17) 83 (17) 90 (12)
TBW volume (L) NA 43 (8) 42 (9) 39 (9) 40 (10) 44 (10)
TBW (% of body weight) NA 52 (3) 50 (5) 49 (6) 48 (4) 49 (6)
ECF volume (L) NA 21 (4) 21 (5) 20 (5) 20 (5) 22 (6)
ECF (% of TBW) NA 50 (4) 50 (4) 50 (4) 50 (5) 51 (3)
Other clinical parameters
Highest serum creatinine (umol/L) 89 (54) 95 (36) 87 (30) 84 (27) 62 (21) 69 (28)
Highest serum urea (mmol/L) 5 (4) 12 (6) 11 (5) 11 (5) 11 (5) 12 (7)

Sodium balance in ICU patients
133
Data are mean (SD). X: Data presented for 10 patients XX: Data presented for 7 patients XXX: Data presented for 5 patients
Figure 4.1: Cumulative fluid balance (A) and estimated cumulative
sodium balance (B) during ICU stay in 10 mechanically ventilated
patients
Data represented as mean (SEM)
Highest serum albumin (g/L) 28 (6) 27 (6) 26 (6) 26 (4) 26 (4) 23 (4)
Total oedema score (*/16) NA 2 (3) 2 (3) 5 (2) 4 (2) 5 (4)
SOFA 10 (5) 8 (4) 7 (4) 5 (3) 4 (2) 4 (2)

Sodium balance in ICU patients
134
Using the data at each measurement for each subject, cumulative
sodium balance was weakly correlated with: next day’s worsening
(higher) chest X-ray scores (r = 0.35, p = 0.004) (Fig. 4.2A); a next
day’s reduction in the lowest PaO2/FiO2 ratio (r = -0.52, p = 0.001)
(Fig. 4.2B); and lower urinary sodium (r = -0.24, p = 0.02). However,
there was not a significant association between cumulative fluid
balance and either next day’s chest X-ray scores (p = 0.24) or next
day’s PaO2/FiO2 ratios (p = 0.44). Neither was there an associating
between cumulative sodium balance and either total oedema (p =
0.28) or SOFA scores (p = 0.11).
Figure 4.2: Correlation between cumulative sodium balance and
next day’s chest x-ray score (A) and next day’s lowest PaO2/FiO2
ratio (B) in 10 mechanically ventilated patients

Sodium balance in ICU patients
135
With regards to changes in participants body composition (Table
4.2), between days 1-5 (as compared with study day 1) body weight
decreased (mean (SD), -2.7 (1.4) kg, p = 0.03) (Fig. 4.3A), and TBW
volume decreased (-3.4 (1.3) L, p = 0.05) (Fig. 4.3B). However, there
was a trend to an increase in the distribution of body water in the
ECF compartment (1.4 (0.9) % of TBW, p = 0.08) (Fig. 4.3C). Delta
ECF (as compared with study day 1) had a positive correlation with
total sodium administered (r = 0.47, p = 0.008) and cumulative
sodium balance (r = 0.42, p = 0.02), a negative correlation with
highest serum albumin (r = -0.56, p = 0.001) and no correlation
with either daily or cumulative fluid balance (p = 0.59 and p = 0.11
respectively).

Sodium balance in ICU patients
136
Figure 4.3: Delta body weight (A), total body water (B) and extracellular fluid (% of total body water) (C), as compared with
study day 1 in 10 mechanically ventilated patients
Data are mean (SEM).

Sodium balance in ICU patients
137
Table 4.3: Sources of sodium administered during study days 0-5
in 10 mechanically ventilated patients
Data are represented as mmol and % of the total administered sodium with 95% confidence interval [CI].
Day 0 Day 1 Day 2 Day 3 Day 4 Day 5
Resuscitation mmol; %
[95%CI]
305; 62.5
[58.7-65.1]
35;17.7
[15.9-19.1]
7; 4.8
[4.4-5.2]
9; 6.5
[5.9-7.1]
3;2.8
[2.3-3.2]
0; 0.0
[0-0]
Transfusion mmol; %
[95%CI]
40; 8.1
[7.8-9.4]
0; 0.0
[0-0]
3; 1.8
[1.6-2.1]
2; 1.4
[1.1-1.8]
3; 2.5
[2.2-3.0]
0; 0.0
[0-0]
Infusion mmol; %
[95%CI]
34; 7.0
[6.2-7.9]
18; 8.9
[8.1-9.9
3; 1.9
[1.6-2.2]
4; 2.6
[2.2-2.9]
3; 2.5
[2.2-3.0]
0; 0.0
[0-0]
Drug Infusion mmol; %
[95%CI]
17; 3.4
[3.1-3.8]
42; 21.1
[19.2-22.3]
15; 10.3
[9.2-11.0]
14; 10.5
[9.1-12.1]
1; 1.3
[0.9-1.5]
15; 15.5
[14.1-17.1]
Drug Bolus mmol; %
[95%CI]
0; 0.0
[0-0]
2; 1.0
[0.7-1.5]
8; 5.3
[4.9-5.8]
3; 2.0
[1.5-2.6]
23; 20.1
[18.8-22.3]
0; 0.0
[0-0]
Antibiotics mmol; %
[95%CI]
53;10.8
[9.4-11.9]
34; 17.0
[15.9-18.1]
32; 21.4
[20.0-23.2]
34; 24.9
[22.9-26.4]
23; 20.1
[18.9-22.3]
17; 17.8
[15.9-19.1]
Feeds mmol; %
[95%CI]
0; 0.0
[0-0]
26; 12.9
[11.5-14.1]
35; 23.7
[21.5-25.5]
28; 20.8
[19.7-22.5]
28; 25.4
[23.8-27.4]
22; 23.2
[21.3-25.1]
TPN mmol; %
[95%CI]
5; 1.1
[0.9-1.3]
5; 2.5
[1.9-3.3]
13; 8.4
[7.9-9.1]
2; 1.8
[1.2-2.4]
4; 3.2
[2.2-4.4]
7; 7.3
[5.9-8.8]
Flush mmol; %
[95%CI]
36; 7.3
[6.9-7.9]
37; 18.6
[17.1-19.9]
34; 22.5
[20.9-23.9]
40; 29.6
[27.6-32.1]
36; 31.8
[29.8-34.2]
34; 36.2
[33.7-39.9]

Sodium balance in ICU patients
138
4.1.3 DISCUSSION
This study sampled a small group of mechanically ventilated
subjects with a moderately high severity of illness at ICU admission
and reports that despite achieving a negative fluid balance over the
first 5 days of mechanical ventilation, estimated sodium balance
remained positive and trended to increase. Furthermore, a more
positive estimated sodium balance was weakly associated with both
lower oxygenation and more severe pulmonary oedema, measured
as the PaO2/FiO2 ratio and chest radiograph score, respectively.
There was also a rise in serum sodium, an increase in the relative
ECF volume, and losses in body weight and body water over the
study period.
Sodium balance has not previously been separated from fluid
balance in studies of critically ill patients who may be at high risk of
retention. It is noteworthy that following shock pulmonary
interstitial collagen may have an increased propensity for sodium
absorption that is associated with interstitial oedema, as suggested
by studies of primate lungs (Moss et al. 1972a; Moss et al. 1972b;
Moss et al. 1973). This can potentially lead to intracellular
dehydration; which may provide some explanation of recent reports
of association between conservative fluid balance strategy’s
association and cognitive impairment in patients with acute lung

Sodium balance in ICU patients
139
injury (Mikkelsen et al. 2012). Despite the pilot nature of this study,
we also found novel associations between estimated sodium balance
and clinically relevant parameters
Hypernatremia, (Palevsky et al. 1996) which has been associated
with poor outcomes in critically ill patients (Hoorn et al. 2008;
Lindner et al. 2009), may result from both sodium retention and
inadvertent sodium loading during conservative fluid management.
In the present study, with the exception of study day 0, sodium
administration was at the lower end of the practice spectrum
(Chapter 3) in our research locale, and the management of fluid
balance in our study patients would be classified as conservative.
Still, four patients met criteria for hypernatremia at some point
during the study, and serum sodium did steadily increase. While
the measured negative fluid balance only partly (approximately 3
mmol/L) accounts for the increase in serum sodium of 7 mmol/L,
this is fully accounted for when faecal and skin losses are
considered. We measured an average weight loss of around 3 kg
with a corresponding loss in TBW, consistent with the cumulative
negative fluid balance (-950 ml), plus an approximated (although
unmeasured) fluid loss from faeces (-200 ml/per day), skin (-500
ml/per day) and net metabolic water production (+350 ml/per day)
(Bersten 2006). This suggests that the positive sodium balance we
estimated was either not or incompletely accounted for by standard
measures of fluid balance and serum sodium.

Sodium balance in ICU patients
140
The association of estimated sodium balance with both a lower
PaO2/FiO2 ratio and a higher chest radiograph score may have been
due to the distribution of sodium to extracellular spaces and the
volume expansion of this compartment. At the whole body level, the
result of our body composition analysis suggests that there was an
increase in the relative volume of fluid distributed to the
extracellular compartment. This was despite a reduction in total
body water, which was reflected by changes in body weight. This
observation is consistent with both our previous work (Baldwin et
al. 2012), and other longitudinal observations of haemodynamically
stable and mechanically ventilated critically ill patients early in the
course of illness (Plank et al. 2000; Plank et al. 1998a; Finn et al.
1996). From these studies, fluctuations in body weight could mostly
be attributed to changes in body water, amidst progressive cellular
dehydration and fluctuations in extracellular overhydration at both
the whole body (Plank et al. 2000; Plank et al. 1998; Finn et al.
1996) and tissue level (Garmin et al. 1996).The rise in the
extracellular fluid compartment correlated with the cumulative
sodium balance but not cumulative fluid balance. In relation to the
lung, a small fractional rise in extracellular fluid compartment
volume appears insufficient to explain the measured deterioration in
PaO2/FiO2 ratio and chest radiograph score. Perhaps, both the
propensity of interstitial collagen to retain sodium during
mechanical ventilation and critical illness may lead to a ventilation
Sodium balance in ICU patients
141
perfusion mismatch, resulting in worsening of the PaO2/FiO2 ratio
and chest radiograph score, and act as a sink for sodium. While the
lack of association between fluid balance and these variables in our
study may be viewed as unexpected, it is consistent with the
physiological understanding that the primary determinant of
extracellular volume is sodium, in which case achieving negative
fluid balance without consideration of sodium balance may be of
little benefit.
The lack of effect of diuretics in producing natriuresis may seem
surprising, but critically ill patients are at risk of sodium retention
as a result of activation of the renin-angiotensin-aldosterone
system, (Jungmann et al. 1987) and have impaired activity of
dopamine in the proximal tubule of the kidney (Seri et al. 1988)
where dopamine normally inhibits sodium reabsorption (Seri et al.
1990). Similar findings have been reported in chronic heart failure
(Brater 1994).
With respect to the clinical implications of this study, we provide
support for the suggestion of Trubuhovich (Trubuhovich 2012) that
sodium balance should be considered daily as a part of routine
management of critically ill patients, especially as it cannot be
assumed that cumulative fluid balance reflects sodium balance.
Furthermore, as positive sodium balance may be affected by the
amount administered, it may be important for clinicians to

Sodium balance in ICU patients
142
recognise the variety of sources by which inadvertent sodium
loading can occur, and how this may change over the course of
illness and recovery.
4.1.4 STUDY LIMITATIONS
The findings of the present study need to be considered in light of
several limitations. Firstly, our sample was small and represents
medical ICU patients. Although the small sample size limits our
conclusions, we believe this is the first clinical study to correlate
sodium balance and measures of respiratory function. This provides
a basis to increase sample size and to examine sodium balance and
body composition parameters with more objective and technically
challenging measures that may include other measures of
oxygenation and lung function, extravascular lung water and
cognitive function. The recruitment of medical patients rather than
surgical cases was done in an attempt to minimise other potential
sources of fluid/sodium loss, particularly through the
gastrointestinal system. While we were able to be accurate in our
calculation of sodium administration, sodium balance was only
estimated from urine loss, and did not include other gastro-
intestinal or incidental losses. However, similar limitations apply to
estimates of water balance. The difference between the calculated
water balance and both body weight and TBW likely reflects
unmeasured losses from the gastrointestinal tract and skin. Also, as
subjects were only followed for up to 5 days, and there was some
attrition by day 4 and 5 due to extubation, the data were
Sodium balance in ICU patients
143
incomplete, and the pattern of sodium balance after 5 days remains
unknown.
With respect to body composition variables, we did not use gold
standard isotope dilution methods due to the technical expertise
and equipment required - particularly for application to the critically
ill. Alternatively, bioelectrical impedance spectroscopy may be used,
which has been reported to have good agreement for monitoring the
trend of changes over time in ICU patients despite under-estimating
volumes by approximately 2-4 L, mostly in patients with sepsis
(Plank et al. 2000, Plank et al. 1998b). Yet, only three of our
patients had sepsis, and the average fluid balance of all patients at
enrolment was (~1.5 L), being far less than in these previous studies
(~12.5 L) (Plank et al. 2000; Plank et al. 1998a). The greatest
inaccuracies of bioelectrical impedance analysis are evident in a
severely fluid overloaded state and in patients with sepsis,
supporting the reliability of assessment of changes over time, and
that inaccuracies would have been minimised in our sample.
Furthermore, the comparatively small magnitude of body water
fluctuations we observed over the study period may have reflected a
relatively modest initial fluid excess.
4.1.5 SUMMARY
This study related clinical squeal to estimated positive sodium
balance in mechanically ventilated critically ill subjects who had a
Sodium balance in ICU patients
144
conservative fluid balance. As there may be other clinically
important and differential effects of sodium balance, further
research is required to delineate the optimal balance of fluid and
sodium in ICU subjects.

Sodium balance in ICU patients
145
4.2 Sodium balance, not fluid balance, is associated
with respiratory dysfunction in mechanically ventilated
patients: a prospective, multi-centre study
Critically ill patients are at risk of a positive sodium balance due to
both inadvertent excess administration, which may be over twice the
recommended daily sodium intake for healthy individuals (Chapter
3) and decreased sodium clearance (Jungmann et al. 1987).
Previously my small, single centre study suggested that the
estimated positive sodium balance in ICU patients is high and that
there may be dissociation between estimated sodium balance and
fluid balance (Section 4.1). In mechanically ventilated patients, a
cumulative positive fluid balance is associated with worsening
oxygenation, prolonged mechanical ventilation and increased
morbidity and mortality (Simmons et al. 1987; Mitchell et al. 1992;
Sakr et al. 2005; Wiedemann et al. 2006; Boyd et al. 2011). The
distribution of water between intracellular and extracellular
compartments is strongly influenced by sodium concentration and
its relative restriction to the extracellular fluid space. The adverse
effects associated with a positive fluid balance, may, therefore, be
related partly to a positive sodium balance.
Unfortunately, however, there is limited evidence about the factors
contributing to sodium balance in critically ill patients and the
clinical implications of a positive sodium balance (Saxena 2013).

Sodium balance in ICU patients
146
The potential for excess sodium to exacerbate interstitial oedema in
the systemic and pulmonary circulations, independent of fluid
balance is supported by the recent single centre reports of adverse
association between estimated positive sodium balance and
PaO2/FiO2 ratio, radiological lung injury score and expanded
extracellular fluid volumes in critically ill patients (Section 4.1). The
aim of this study was to extend these initial single centre
observations by examining sodium balance and its relationship with
oxygenation (PaO2/FiO2 ratio) and length of mechanical ventilation
in critically ill mechanically ventilated patients at multiple centres.
4.2.1 METHODS
A prospective, observational, multicentre study was conducted in 4
mixed medical/surgical Australian ICUs between April 2012 and
September 2013. We included patients receiving invasive
mechanical ventilation for less than 48 hours and who were
anticipated to be ventilated for at least another 48 hours. Patients
were also required to have an indwelling urine catheter in situ and a
screening serum sodium concentration between 130 and 150
mmol/L. Exclusion criteria were age less than 18 years, traumatic
brain injury, ICU admission diagnosis of diabetic ketoacidosis or
hyperosmolar hyperglycaemic state, Child’s C liver cirrhosis,
pregnancy and anticipated survival less than 24 hours. Patients
receiving renal replacement therapy or expected to require dialysis
within the next 48 hours were also excluded due to the potential for

Sodium balance in ICU patients
147
inadvertent excess sodium loading (Chapter 3). Ethics approval was
obtained at all participating sites and the study was registered with
the Australian New Zealand Clinical Trials Registry
(ACTRN12612000046808).
Data was collected on Days 1, 2 and 3 post-recruitment, with Day 1
being defined as the day of enrolment based on the ICU chart time.
Data included: 1) demographics (age, sex, weight, height); 2) ICU
admission diagnosis and severity of illness APACHE score II and
III]; 3) daily highest and lowest PaO2/FiO2 ratio; 4) daily urine
output and fluid balance; 5) daily serum creatinine, urea and
albumin; 6) administration of diuretics, steroids, vasopressors and
renal replacement therapy; 7) intravascular devices; 8) presence of
shock (defined as the requirement for vasopressor infusion at any
dose for more than 6 hours) and; 9) duration of invasive ventilation,
ICU and hospital mortality, and ICU and hospital lengths of stay.
Sodium and fluid intake were calculated as follows: for all solutions,
the type and volume administered over each 24 hour study day was
recorded. Sodium and fluid sources were classified as (i) i.v. fluids
administered by bolus or infusion for volume
expansion/resuscitation, including crystalloids and colloids; (ii)
transfusion of blood products such as red blood cells, platelets, and
fresh frozen plasma; (iii) i.v. infusions given as maintenance or
replacement fluids; (iv) i.v. antibiotics administered by a bolus

Sodium balance in ICU patients
148
together with its vehicle; (v) other i.v. drugs administered by
continuous infusion together with their vehicle (drug infusions); (vi)
other i.v. drugs administered by a bolus together with their vehicle
(drug boluses); (vii) intravascular line flushes associated with
haemodynamic monitoring, including arterial lines and central
venous catheters; (viii) TPN; (ix) enteral nutrition. The amount of
sodium administered was then calculated based on sodium
concentrations of each solution (Appendix 1). Therefore, for drug
infusions and boluses, sodium content was calculated from both the
sodium content of the drug and the type and volume of carrier fluid
or diluent. For TPN and enteral nutrition, information on the type
and volume of feed was recorded and the sodium content calculated
accordingly. As the sodium and sodium content from sources such
as drug boluses, drug infusions, antibiotics and flushes are often
occult and may be considered unintentional, they were collated
together as a single group and labelled ‘inadvertent’.
Estimated sodium output was based on combined losses from urine,
nasogastric drainage, other gastrointestinal losses and drains. For
urinary sodium losses, sodium concentration was measured each
day from a 24 hour urine collection. For all other losses (for
pragmatic reasons), sodium concentration was estimated from
published values (Bersten 2006).
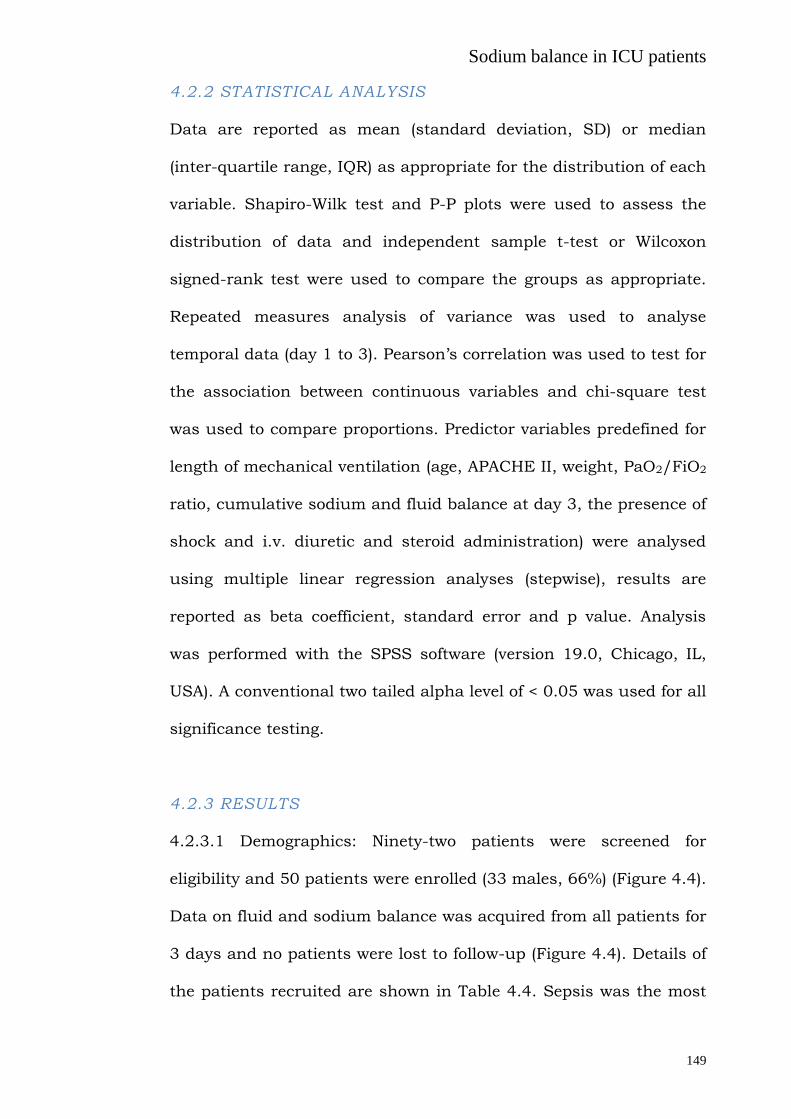
Sodium balance in ICU patients
149
4.2.2 STATISTICAL ANALYSIS
Data are reported as mean (standard deviation, SD) or median
(inter-quartile range, IQR) as appropriate for the distribution of each
variable. Shapiro-Wilk test and P-P plots were used to assess the
distribution of data and independent sample t-test or Wilcoxon
signed-rank test were used to compare the groups as appropriate.
Repeated measures analysis of variance was used to analyse
temporal data (day 1 to 3). Pearson’s correlation was used to test for
the association between continuous variables and chi-square test
was used to compare proportions. Predictor variables predefined for
length of mechanical ventilation (age, APACHE II, weight, PaO2/FiO2
ratio, cumulative sodium and fluid balance at day 3, the presence of
shock and i.v. diuretic and steroid administration) were analysed
using multiple linear regression analyses (stepwise), results are
reported as beta coefficient, standard error and p value. Analysis
was performed with the SPSS software (version 19.0, Chicago, IL,
USA). A conventional two tailed alpha level of < 0.05 was used for all
significance testing.
4.2.3 RESULTS
4.2.3.1 Demographics: Ninety-two patients were screened for
eligibility and 50 patients were enrolled (33 males, 66%) (Figure 4.4).
Data on fluid and sodium balance was acquired from all patients for
3 days and no patients were lost to follow-up (Figure 4.4). Details of
the patients recruited are shown in Table 4.4. Sepsis was the most

Sodium balance in ICU patients
150
common admission diagnosis (n=16, 32%), followed closely by
patients with a respiratory diagnosis. More than half of the patients
received vasopressors on any study day (Table 4.5). Daily
physiological and biochemical data are shown in Table 4.5. The time
between ICU admission and inclusion in the study; and intubation
and inclusion in the study were 8 (0-17) and 4 (0-14) hours,
respectively.
Figure 4.4: Flow diagram of subjects examined in the multicentre sodium balance study

Sodium balance in ICU patients
151
Table 4.4: Patient demographics and outcomes in the multicentre sodium balance study
Data are presented as mean (SD) or as a proportion unless indicated
#median (IQR)
Age (years) 62.8 (14.6)
Sex, male n (%) 33 (66)
Weight (kg) 79.4 (14.4)
Height (cm) 171.5 (8.9)
APACHE II# 25 (19-29)
APACHE III # 82 (61-99)
Length of mechanical ventilation (hours)# 120.0 (86.7-182.5)
Reason for ICU admission n (%) Sepsis Respiratory Cardiac Post-surgery Others
16 (32) 15 (30) 5 (10) 5 (10) 9 (18)
ICU length of stay (days) # 7.5 (6.0 -12.7)
Hospital length of stay (days) # 17.9 (7.8-32.3)
ICU mortality, n (%) 4 (8%)
Hospital mortality, n (%) 7 (14%)

Sodium balance in ICU patients
152
Table 4.5: Daily physiological and laboratory data in the multicentre sodium balance study
Day 1 Day 2 Day 3
Serum sodium (mmol/l) 140.2 (5.3) 141.1 (5.2) 141.4 (5.5)
Serum albumin (g/L) 27.6 (5.1) 26.4 (5.1) 25.4 (4.6)
Serum creatinine (umol/L)
103.9 (51.9) 103.4 (59.7) 90.6 (50.1)
Serum urea (mmol/L) 10.5 (5.6) 11.4 (5.8) 10.9 (5.6)
Lowest PaO2/FiO
2 ratio 171.3 (85.8) 192.8 (77.6) 204.4 (77.0)
Highest temperature (°C) 37.4 (1.1) 37.4 (0.7) 37.2 (0.7)
CVP (mm Hg) 14.5 (3.7) 14.6 (4) 13.3 (3.9)
Vasopressor requirement n (%)
32 (64) 31 (62) 26 (52)
All the reported laboratory and physiological values were the highest recorded on the study day, except PaO2/FiO2 which was the lowest recorded value. Data are presented as mean(SD)
4.2.3.2 Fluid balance
Fluid balance was positive each day leading to a cumulative balance
of +2668 (875-3507) ml by Day 3 (Table 4.6), but daily fluid balance
was less marked on day 3 (P=0.01), due to lower fluid input (P=0.04)
with an unchanged urine output (P=0.35). Examining patients on
each study day (50 patients and 3 study days), those who were
administered diuretics (n=39) had increased urine output and a
lower daily fluid balance, while patients who were shocked (n=89) or
were administered steroids (n=85) had no difference in their urine
output and daily fluid balance (Table 4.7).

Sodium balance in ICU patients
153
4.2.3.3 Sodium balance
Sodium balance was positive on all study days (Table 4.6), with a
cumulative balance of +717 (422-958) mmol at the end of day 3.
Daily sodium balance declined each day (P=0.03) due to both a
lower sodium input (P=0.01) and increased urinary sodium losses
(P=0.05), but remained positive on all 3 study days. Patients who
were shocked or were administered steroids on the study day had
reduced urinary sodium losses and a higher daily sodium balance;
administration of diuretics made no difference either to their urinary
sodium losses or daily sodium balance (Table 4.7).
Table 4.6: Daily and cumulative sodium and fluid balance in the multicentre sodium balance study
Data are presented as median and interquartile range * Data collection on days 1 and 3 were over 23.0(16-24) and 23.3(3.9) hours respectively #Sodium balance is estimated from all sources of sodium administration minus the combined losses from urine, nasogastric drainage, other gastrointestinal losses and drains.
Daily balance
Day 1* Day 2 Day 3*
Fluid administered (ml) 2874 (1992-3788)
2995 (2144-3551)
2443 (1887-2845)
Urine output (ml) 1325 (918-2270)
1500 (1130-2285)
1493 (923-2364)
Fluid balance (ml) +1054 (516-1650)
+1130 (-69–1788)
+619 (53-1388)
Sodium administered (mmol) 322 (213-504) 227(178-357) 199 (153-256)
Urine sodium losses (mmol) 16 (13-20) 43 (12-59) 54 (12-60)
Sodium balance (mmol)# +299 (212-464) +212 (116-319) +158 (94-227)
Cumulative balance over days 1 to 3
Sodium balance (mmol)* +299 (212-464) +565 (327-796)
+717 (422-958)
Fluid balance (ml) +1054 (516-1650)
+2091 (413-2918)
+2668 (875-3507)
Sodium balance in ICU patients
154
Table 4.7: The effect of diuretic, steroid and vasopressor administration on daily urine output, urinary sodium excretion, fluid balance and sodium balance in the multicentre sodium
balance study
Data are presented as median(IQR) *defined as vasopressor infusion at any dose administration for more than 6 hours on any particular study day
Diuretics No Yes
P value
urine output (ml) 1370 (920-2160) 1765 (726-3191) 0.03
urinary sodium (mmol) 48 (11-47) 54 (19-72) 0.45
fluid balance (ml) 1035 (405 – 1604) 232 ((-421) - 1474) 0.005
sodium balance (mmol) 229 (143-352) 178 (113 – 285) 0.25
Steroids No Yes
P value
urine output (ml) 1430 (1005-2352) 1487 (1050-2275) 0.38
urinary sodium (mmol) 43 (17-123) 19 (9-48) 0.004
fluid balance (ml) 1018 (25 – 1591) 831 (227 – 1600) 0.75
sodium balance (mmol) 208 (78 -310) 245 (158 – 352) 0.06
Shock No Yes
P value
urine output (ml) 1585(1685-2375) 1275(903-2210) 0.2
urinary sodium (mmol) 48(25-109) 15(9-42) 0.01
fluid balance (ml) 574 (2-1448) 1108 (332 – 1814) 0.10
sodium balance (mmol) 135 (66 – 240) 259 (184 -390) 0.001

Sodium balance in ICU patients
155
4.2.3.4 Contributions to fluid and sodium
The sources of administered fluid and sodium each day are shown
in Table 4.8. For both, the main source on day 1 was fluid boluses;
50.3% and 43.7% of total fluid and sodium intake, respectively. This
was followed by inadvertent sources (fluid 22.2% and sodium
29.9%). The contribution of fluid boluses to total daily fluid and
sodium intake declined significantly over the study period to 11.6%
and 9.9%, respectively on day 3. (P<0.001). Inadvertent sources of
fluid administration were unchanged over the three days (~23% for
days 1-3) (P=0.84); the total daily sodium administered attributed to
inadvertent sources increased significantly to approximately 50% of
total sodium intake (P=0.003).
Table 4.8: Contribution of various sources to the administered daily fluid and sodium on different study days in the multicentre sodium balance study
Fluid (%) Sodium (%)
Day 1 Day 2 Day 3 Day 1 Day 2 Day 3
Bolus 50.3 36.5 11.6 43.7 19.8 9.9
Infusions 14.8 27.2 32.5 13.8 13.6 9.5
Enteral 2.6 11.2 26.7 4.1 13.1 22.3
Blood Products
9.5 2.1 1.1 7.7 4.6 3.0
TPN 0.6 0.9 3.2 0.8 1.2 2.2
Inadvertent 22.2 22.1 24.8 29.9 47.6 52.8
Inadvertent is defined as the total amount of fluid and sodium from sources such as drug boluses, antibiotics, drug infusions and flushes.

Sodium balance in ICU patients
156
Contribution of infusions to total daily fluid administration doubled
between day 1 (14.8%) and day 3 (32.5%); in contrast, infusions
consistently contributed only ~10-13% to total daily sodium intake.
There was a consistent increase in the contribution of enteral
nutrition to total fluid and sodium intake over the three days (Table
4.8).
4.2.3.5 Oxygenation and length of mechanical ventilation
Cumulative estimated sodium balance had a negative correlation
with the next day PaO2/FiO2 ratio (r= -0.36, P=0.001) (Figure 4.5).
Factors (beta coefficient [standard error], p value) which related to
the length of mechanical ventilation (r2 = 0.56) were age (1.3 [2.3],
P<0.01), cumulative estimated sodium balance at day 3(0.91[0.06],
P <0.01), and steroid administration (0.44[3.0], P<0.001).
Cumulative fluid balance neither correlated with oxygenation
(r=0.10, P=0.23), nor was it a predictor for the length of mechanical
ventilation in the linear regression analysis.

Sodium balance in ICU patients
157
Figure 4.5: Correlation between cumulative sodium balance and
next day PaO2/FiO2 ratio in the multicentre sodium balance study
4.2.3 DISCUSSION
The main findings of this multicentre, observational study are that
sodium intake in the first 3 days of critical illness is ~200-300
mmol/ per day and inadvertent sources such as drug boluses and
intravascular flushes are the predominant contributors. The positive
cumulative estimated sodium balance (717 mmol) was associated
with a worse PaO2/FiO2 ratio and increased length of invasive
mechanical ventilation. These adverse respiratory outcomes were
not related to the cumulative fluid balance.
The recommended sodium intake for healthy individuals is 100
mmol/day (Australian Government National Health and Medical
Research Council, New Zealand Ministry of Health. Nutrient
reference values for Australia and New Zealand including
recommended dietary intakes 2014). Our mechanically ventilated

Sodium balance in ICU patients
158
patients received 2 to 3 times this recommended amount. These
results are consistent with those reported in our large, multi-centre
point prevalence study of ICU patients (Chapter 3), in which the
observed daily sodium intake was 224.5 (144.9–367.6) mmol.
This is the first multicentre study to report estimated sodium
balance in critically ill mechanically ventilated patients. Although
the daily estimated balance decreased from +309 mmol on day 1 to
+158 mmol on day 3, there was a large cumulative estimated
positive sodium balance (717 mmol). This amount is more than
double the amount we previously reported in our single centre study
of cumulative sodium and water balance in 10 mechanically
ventilated patients (~300 mmol over 3 days) (Section 4.1). However,
in the current study more patients were shocked (59%) or received
either intravenous steroids (57%); both of which were associated
with sodium retention.
The average daily fluid administered in our study population was
nearly 3L, resulting in a cumulative positive fluid balance of 2.7L.
Positive fluid balance is adversely associated with outcomes in
critically ill patients. Several studies have described the association
between a positive fluid balance and increased mortality and
morbidity (prolonged ventilation, poor gas exchange, renal failure,
prolonged ICU stay); presumed due to increased interstitial oedema,
reduced cellular oxygen delivery and delayed recovery of failed

Sodium balance in ICU patients
159
organs (D’Orio et al. 1987; D’Orio et al. 1991). In our study we did
not find a similar relationship between cumulative fluid balance and
either PaO2/FiO2 ratio or the duration of mechanical ventilation,
once estimated sodium balance was accounted for in the regression
model. In contrast, cumulative estimated sodium balance was
negatively correlated with the PaO2/FiO2 ratio and was an
independent predictor of duration of mechanical ventilation (along
with age and day 1 PaO2/FiO2 ratio). This finding confirms the
findings of the single centre study observation that sodium balance
is an important determinant of respiratory function (Section 4.1).
A possible explanation for our findings is that sodium is the major
contributor to extracellular tonicity and a driving force for fluid
shifts across the cellular membrane towards the interstitium.
Accordingly, a high sodium intake may exacerbate interstitial
oedema in the systemic and pulmonary circulations, independent of
fluid balance. We have previously reported that, whilst total body
water decreases over time in mechanically ventilated patients, there
is an increase in the relative volume of fluid distributed to the
extracellular compartment (Section 4.1). This rise in extracellular
fluid volume is also correlated with estimated positive sodium, but
not fluid balance. Similar results have been reported in longitudinal
observations of hemodynamically stable and mechanically ventilated
critically ill patients early in the course of their illness (Plank et al.
2000; Plank et al. 1998; Finn et al. 1996; Garmin et al. 1996);
Sodium balance in ICU patients
160
suggesting that fluctuations in body weight may be due to changes
in body water and extracellular over-hydration, amidst progressive
cellular dehydration (Plank et al. 2000; Plank et al. 1998; Finn et al.
1996).
Despite a large cumulative estimated sodium balance in our study,
serum sodium remained unchanged over the 3 days. Calculations
using distribution of free water across various compartments and
sodium concentration, reveal that ECF has potentially increased up
to 4.5 L during the study period. This increase is not explained by
cumulative fluid balance, suggesting transcellular shift of
approximately 2L to account for static serum sodium concentration.
In critically ill patients, activation of the renin–angiotensin–
aldosterone system predisposes to sodium retention (Jungmann et
al. 1987). This is particularly so in mechanically ventilated patients
where positive pressure ventilation and positive end-expiratory
pressure both raise intrathoracic pressure and reduce venous
return, leading to a complex neurohumoral responses (Bersten
2006; Frazier 1999) with sodium and water retention. Upadaya et al.
have reported that although a positive cumulative fluid balance can
predict weaning failure, achieving a negative fluid balance using
diuretics is not independently associated with weaning success
(Upadaya et al.. 2005). Our finding that administration of diuretics
increases urine output but not urinary sodium losses may, in part,

Sodium balance in ICU patients
161
explain their results. Moreover, half of our patients were shocked
which not only leads to sodium retention but also increases the
propensity of pulmonary interstitial collagen to adsorb sodium
(Moss et al. 1972a; Moss et al. 1972b; Moss et al. 1973) in primate
lungs. This may explain the adverse associations of positive sodium
balance with length of mechanical ventilation.
The main sodium source on day 1 was fluid boluses. On subsequent
days, inadvertent sources contributed more to the total
administered sodium. Over the 3 day study period 740 mmol of
sodium was administered, of which 43.4% was from inadvertent
sources. These inadvertent sources are potential target for sodium
restriction strategies, such as using 5% dextrose as vehicles for
drug boluses and infusion, whenever possible. Previous studies
have shown that 0.9% saline is the most commonly used vehicle for
i.v. drug boluses (75.6%) and infusions (64.4%) and heparinised
saline was the most commonly used i.v. flush fluid (98.1%) (Chapter
3). Furthermore, inadvertent sources and infusions (maintenance or
replacement fluids) were responsible for more than 50% of fluid
sources by day 3. All of these are potentially modifiable and should
be investigated in future studies.
4.2.4 LIMITATIONS
The findings of our study need to be considered in the light of
several limitations. Firstly, this was a convenience sample; it was

Sodium balance in ICU patients
162
small and represents mostly medical ICU patients. However, it
supports the findings of our pilot study describing the adverse
association between estimated sodium balance and respiratory
function. Secondly it should also be noted that sodium balance after
3 days is unknown. Finally, we did not study chloride
administration. Sodium administration is often coupled with
chloride and recent evidence suggests that chloride restriction may
impact positively on clinical outcomes, particularly the incidence of
acute kidney injury and need for dialysis (Yunos et al. 2011; Yonus
et al. 2012). Renal dysfunction was not evaluated in our study and
the potential effect of chloride on mechanical ventilation and
respiratory failure was not assessed.
4.2.5 SUMMARY
Sodium intake in mechanically ventilated patients is high and is
predominantly attributable to fluid boluses and inadvertent sources
such as drug infusion and boluses. A cumulative positive sodium
balance is associated with adverse effects on respiratory function.
Further research into the optimal sodium balance is warranted.
Sodium restriction strategies may represent a novel therapeutic
approach for mechanically ventilated patients in the future.

Fluid bolus
163
CHAPTER 5: FLUID BOLUS
5.1 Efficacy and prevalence of fluid boluses in
resuscitated septic patients
Septic shock is an important cause of death in critically ill patients
worldwide (Angus et al. 2001). It is characterised by a vasodilated
state, sometimes complicated by early myocardial depression. Fluid
boluses (FB) are often administered with the aim of improving tissue
perfusion (Hollenberg et al. 2001; Zanotti-Cavazzoni et al. 2009) and
are a key component in the effective management of such patients.
However, it is also becoming increasingly evident that excessive
volume administration can worsen outcome (Durairaj et al. 2008;
Vincent et al. 2006; Wiedemann et al. 2006).
During sepsis the activity of the inflammatory response is highest in
the initial hours after the insult, which has given rise to the concept
of early and late resuscitation as distinct therapeutic entities
(Dorresteijn et al. 2005). The role of early resuscitation (the first 6
hours) (Rivers et al. 2001; Jeon et al. 2012) has been well
established. Early titrated fluid administration modulates
inflammation, improves micro vascular perfusion, induces a shift
towards an anti-inflammatory cytokine pattern, and improves organ
function and outcome (Dorresteijn et al. 2005).
Use of FB after the initial resuscitation are a common practice in
medical and surgical ICUs (Axler et al. 1997). In the Saline versus
Albumin Fluid Evaluation (SAFE) (Safe study investigators 2004)

Fluid bolus
164
and CHEST (Myburgh et al. 2012) studies, 18.2% and 28.7% of
patients with severe sepsis respectively, received FB at least for the
first 4 days during their stay in ICU. In the recently conducted 6S
(Perner et al. 2012) trial patients with severe sepsis had a median
1.5 litres of resuscitation fluid administered on day 1 and 2 and 1
litre on day 3 in addition to other fluids and blood products. Despite
their frequent use in critically ill septic patients, little has been
reported regarding the reasons why these fluid boluses are
administered and whether they are efficacious.
Except for cases with obvious fluid loss, these FB can account for
some of the positive fluid balance in ICU patients, this in turn has
been associated with poor outcomes. Positive fluid balance has been
associated with poorer lung, kidney and gastrointestinal function
(Wiedemann et al. 2006; Bouchard et al. 2009; Lobo et al. 2002),
and an increased mortality risk (Boyd et al. 2011). Given the
growing evidence of disadvantages of positive fluid balance in ICU, it
is important to understand the current practice, indications and
effects (beneficial and adverse) of these FB in patients with severe
sepsis / septic shock after their initial resuscitation. This study
investigates the prevalence, efficacy and the possible harmful effects
of these FB in a prospective cohort of septic patients after the initial
fluid resuscitation phase. The hypothesis was that such FB are
common, have limited efficacy, and are potentially harmful.

Fluid bolus
165
5.1.1 METHODS
In a single centre prospective observational study, we screened
patients with severe sepsis or septic shock (ACCP/SCCM Consensus
Conference Committee: American College of Chest
Physicians/Society of Critical Care Medicine Consensus Conference
1992) in a tertiary level ICU. We included adult (age ≥ 18 years)
patients with severe sepsis/ septic shock (confirmed or presumed)
within 2 hours of completing the initial 6 hours of resuscitation. 6
hours as the time frame for initial resuscitation was chosen as it is
generally the most studied time point for initial resuscitation in
previous and on-going studies (Rivers et al. 2001; Peake et al. 2009).
Patients who were expected to die within the next 24 hours or who
were not for active treatment, patients with clinically obvious
ongoing gastrointestinal losses, haemorrhage (external and internal)
or other losses leading to hypovolaemia and dehydration, and
patients with suspected or confirmed pregnancy were excluded
Figure 5.1).
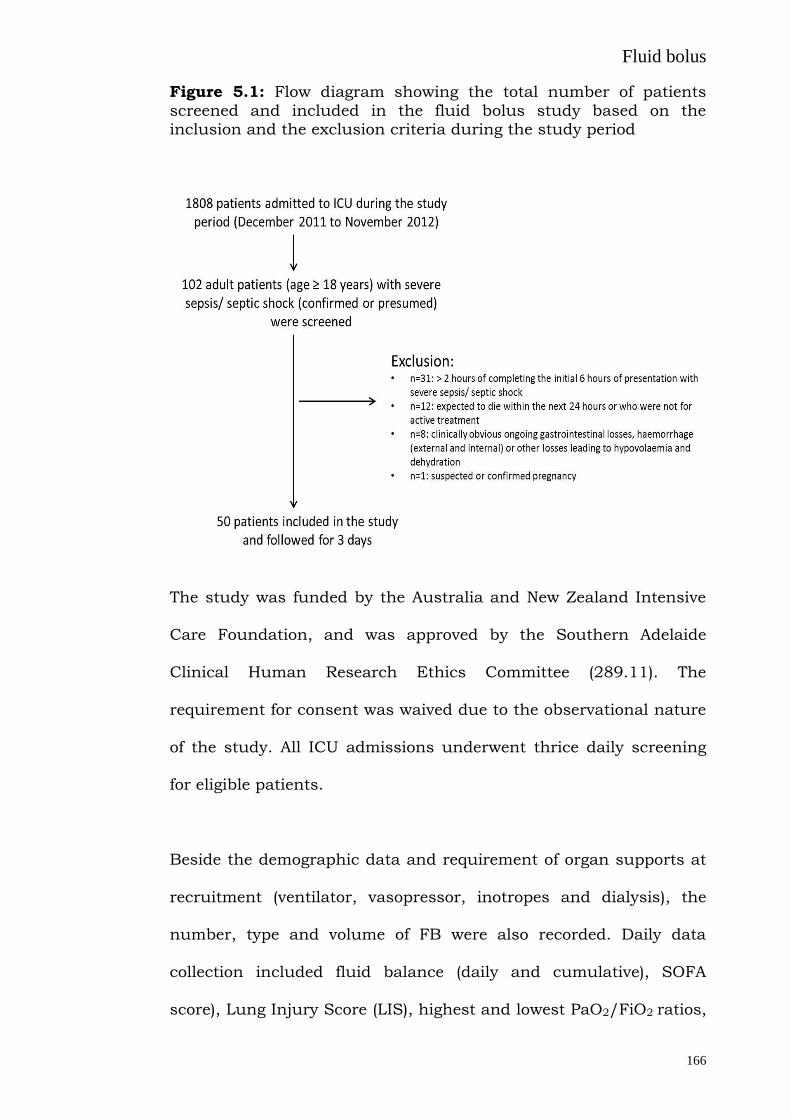
Fluid bolus
166
Figure 5.1: Flow diagram showing the total number of patients
screened and included in the fluid bolus study based on the inclusion and the exclusion criteria during the study period
The study was funded by the Australia and New Zealand Intensive
Care Foundation, and was approved by the Southern Adelaide
Clinical Human Research Ethics Committee (289.11). The
requirement for consent was waived due to the observational nature
of the study. All ICU admissions underwent thrice daily screening
for eligible patients.
Beside the demographic data and requirement of organ supports at
recruitment (ventilator, vasopressor, inotropes and dialysis), the
number, type and volume of FB were also recorded. Daily data
collection included fluid balance (daily and cumulative), SOFA
score), Lung Injury Score (LIS), highest and lowest PaO2/FiO2 ratios,

Fluid bolus
167
renal function (serum creatinine and urea), and requirement of
renal replacement therapy, diuretics and vasoactive medications.
LIS was calculated from PaO2/FiO2 ratio, chest x-ray score, PEEP
and static respiratory system compliance (if able to be measured).
Delta SOFA scores (48-0 h and 72-0 h) were also calculated. Data
was collected for 3 days or until ICU discharge or death which ever
occurred earlier.
The decision to administer FB, the volumes and the resuscitation
goals were made by the treating clinician. One fluid bolus was
defined as the sum of a single type of fluid administered in less than
half an hour. Each time a fluid bolus was administered, the
prescribing clinician was asked to fill in a form (Figure 5.2)
describing the indication for these FB and whether it was perceived
to be successful. Simultaneously the bedside nurse was asked to fill
in a form noting down the exact haemodynamic parameters
immediately before and 1 hour after the administration of these FB
(Figure 5.3). Data for serum lactate before and 1 hour after the FB
were also recorded.

Fluid bolus
168
Figure 5.2: Data collection form which was filled in by the treating
clinician every time a fluid bolus was administered describing the indication of the fluid boluses and whether it was perceived to be successful

Fluid bolus
169
Figure 5.3: Data collection form which was filled in by the bed side
nurse noting the exact haemodynamic and other parameters immediately before and 1 hour after the administration of fluid boluses
5.1.2 STATISTICAL ANALYSIS
Data is presented as median (IQR). Analysis was performed with
SPSS software (version 19.0, Chicago, IL, USA). Difference between
variables over time was analysed with paired sample T test or
Wilcoxon signed rank test, as appropriate, and correlations tested
using either a Pearson’s r or Spearman's rho. A conventional alpha
level of < 0.05 was used for all significance testing. Predictor
variables for increase in mean arterial pressure (MAP) before and 1
hour after the administration of FB were analysed using multiple
linear regression analyses.

Fluid bolus
170
5.1.3 RESULTS
5.1.3.1 Demographics
Fifty patients were recruited out of 102 patients admitted with
severe sepsis/septic shock during the study period (total ICU
admissions during this period were 1808) based on the inclusion
and the exclusion criteria (Figure 5.1). The demographic data, and
use of ventilation, inotropes, vasopressors and dialysis and the
hemodynamic profile at recruitment are shown in Table 5.1. Lung
infection was the most common source of sepsis. There were no
deaths during the study period of 3 days.
Table 5.1: Baseline characteristics of study patients in the fluid
bolus study
Age* 72.5 (61.0-82.8)
Male # 33 (66%)
Weight (Kg)* 80.0 (71.8-85.0)
Illness severity score
SOFA score at admission* 9 (6 -11)
APACHE III score* 80 (68 – 93)
Charlson co-morbidity index* 4 (2-6)
Ventilator # 13 (26.0%)
Inotropes # 16 (32.0%)
Vasopressors # 31 (62.0%)

Fluid bolus
171
Dialysis # 4 (8.0%)
Source of sepsis #
Lung 16 (32%)
Abdomen 10 (20%)
Urosepsis 12 (24%)
Others 12 (24%)
Haemodynamic parameters*
Mean Arterial pressure (mm Hg) 66 (62-75)
Heart rate 110 (92-130)
Central Venous Pressure (mm Hg) 11 (8-14)
PaO2/FiO2 ratio 273 (182-403)
Fluid Balance (ml) * 956 (655-2254)
Haemoglobin (g/L) * 126 (108-140)
Lactate (mmol/L) * 4.2 (3.1-6.2)
*Data presented as median (IQR) # Data presented as number (%)
5.1.3.2 Fluid bolus prevalence
During the study period 47 out of 50 patients (94%) received FB,
with a total of 184 FB [3(2-5) per patient], being administered over
72 hours after the initial resuscitation. The prevalence of these FB
prescribed on each study day is shown in Table 5.2. The most
common fluid used in the study was 4% albumin (80.9%) followed
by red blood cells (7.6%), 20% albumin (3.2%), fresh frozen plasma
(3.2%), Gelofusine® (3.2%), 0.9% saline (1%) and platelets (0.5%).
Cumulative fluid balance, daily urine output, daily fluid balance and

Fluid bolus
172
the contribution of these FB to the daily fluid balance are also
shown in Table 5.2.
Table 5.2: Fluid boluses (FB) prevalence and contribution to the daily fluid balance according to the days
Study
Day
Patients
receiving
FB
No.
of
FB*
Volume
of FB
(ml) *
Urine
output (ml)
*
Daily
Fluid
balance
(ml) *
Cumulative
Fluid
balance
(ml) *
Proportion of
daily fluid
balance received
as FB*
One 45 (90%) 2
(1-3)
750
(500-1720)
801
(288 – 1325)
1510
(561 –2727)
1510
(561–2727)
52.4%
(22.1–124.2)
Two 26 (52%) 2
(1-2)
500
(250-769)
1189
(540 – 1789)
897
(161 –1694)
2727
(874–3842)
30.8%
(15.0–90.7)
Three 8 (16%) 1
(1-3)
750
(250-1062)
2061
(1089 – 2612)
536
(-240–1191)
2820
(1337 –4689)
33.2%
(-44.6 –72.5%)
* The data is per patient and presented as median (IQR)
5.1.3.3 Fluid bolus indications and perceived efficacy
The initial indication and the efficacy as perceived by the
prescribing clinician are shown in Table 5.3. Low blood pressure
and increased vasopressor requirement were the two most common
indications, while low filling pressure and clinical signs were
perceived to be the most successful indications for FB.

Fluid bolus
173
Table 5.3: Indication and the success rate (as judged by the treating
clinician) for a fluid bolus in patients with severe sepsis and septic shock after the initial 6 hours of resuscitation
Indication Indication
prevalence #
Success rate of the bolus as perceived by treating clinician
#
Low blood pressure 76.0% (69.9-82.2) 37.1% (29.1-45.1)
Increasing vasopressor dose 60.3% (53.2-67.4) 29.7% (21.2-38.2)
Low filling pressure 30.9% (24.2-37.6) 70.9% (60.2-83.5)
Oliguria 26.1% (19.7-32.4) 31.2% (18.1-44.3)
Increased heart rate 20.1% (14.3-25.9) 54.1% (37.7-70.1)
Clinical signs 18.5% (12.8-24.1) 79.4% (65.8-93.0)
# Data represented as percentage and 95% confidence interval
5.1.3.4 Fluid bolus efficacy 1 hour after its administration
One hour after FB, there was a small but significant increase in
MAP (p<0.01) and CVP (p<0.01). However, there was also a
significant increase in noradrenaline administered. There was also a
significant decrease in PaO2/FiO2 ratio, haemoglobin and
temperature, while the urine output remained unchanged. There
was no difference in the central venous gas saturation and serum
lactate 1 hour after the FB (Table 5.4). The drop in haemoglobin was
more significant when FB with fresh red blood cells were removed
from the analysis (104 (95-118) to 92 (82-109); p<0.0001).
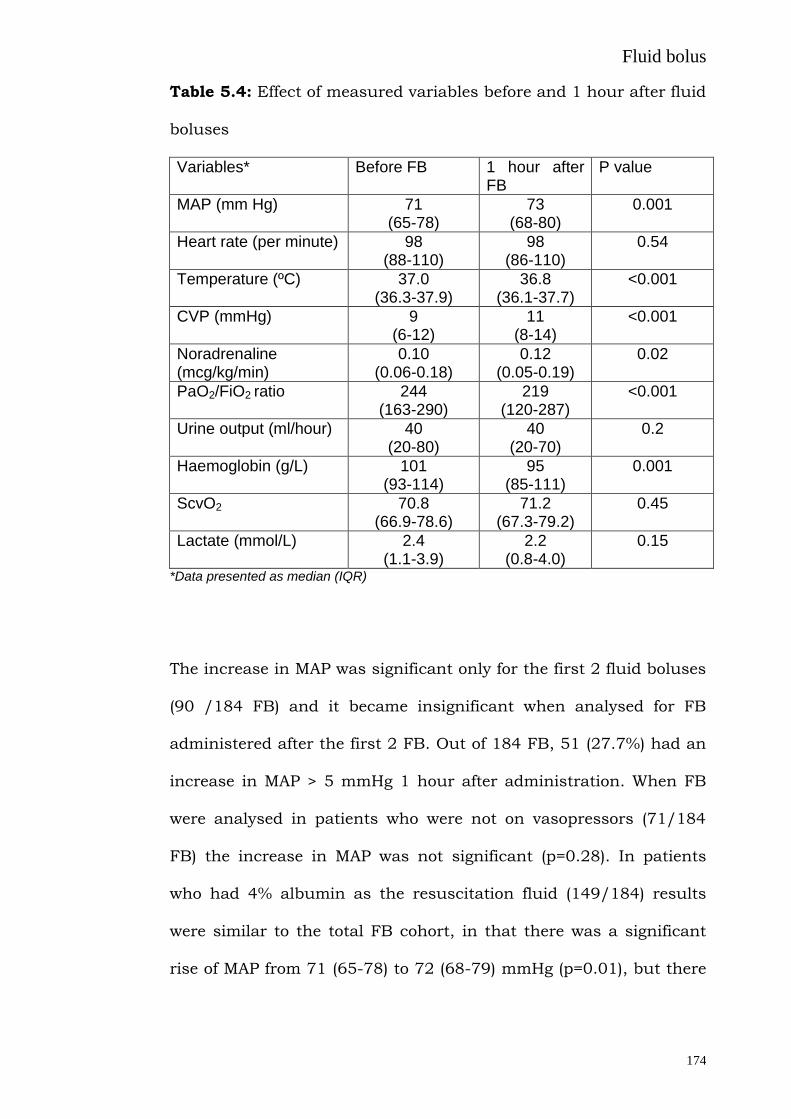
Fluid bolus
174
Table 5.4: Effect of measured variables before and 1 hour after fluid
boluses
Variables* Before FB 1 hour after FB
P value
MAP (mm Hg) 71 (65-78)
73 (68-80)
0.001
Heart rate (per minute) 98 (88-110)
98 (86-110)
0.54
Temperature (ºC) 37.0 (36.3-37.9)
36.8 (36.1-37.7)
<0.001
CVP (mmHg) 9 (6-12)
11 (8-14)
<0.001
Noradrenaline (mcg/kg/min)
0.10 (0.06-0.18)
0.12 (0.05-0.19)
0.02
PaO2/FiO2 ratio 244 (163-290)
219 (120-287)
<0.001
Urine output (ml/hour) 40 (20-80)
40 (20-70)
0.2
Haemoglobin (g/L) 101 (93-114)
95 (85-111)
0.001
ScvO2 70.8 (66.9-78.6)
71.2 (67.3-79.2)
0.45
Lactate (mmol/L) 2.4 (1.1-3.9)
2.2 (0.8-4.0)
0.15
*Data presented as median (IQR)
The increase in MAP was significant only for the first 2 fluid boluses
(90 /184 FB) and it became insignificant when analysed for FB
administered after the first 2 FB. Out of 184 FB, 51 (27.7%) had an
increase in MAP > 5 mmHg 1 hour after administration. When FB
were analysed in patients who were not on vasopressors (71/184
FB) the increase in MAP was not significant (p=0.28). In patients
who had 4% albumin as the resuscitation fluid (149/184) results
were similar to the total FB cohort, in that there was a significant
rise of MAP from 71 (65-78) to 72 (68-79) mmHg (p=0.01), but there
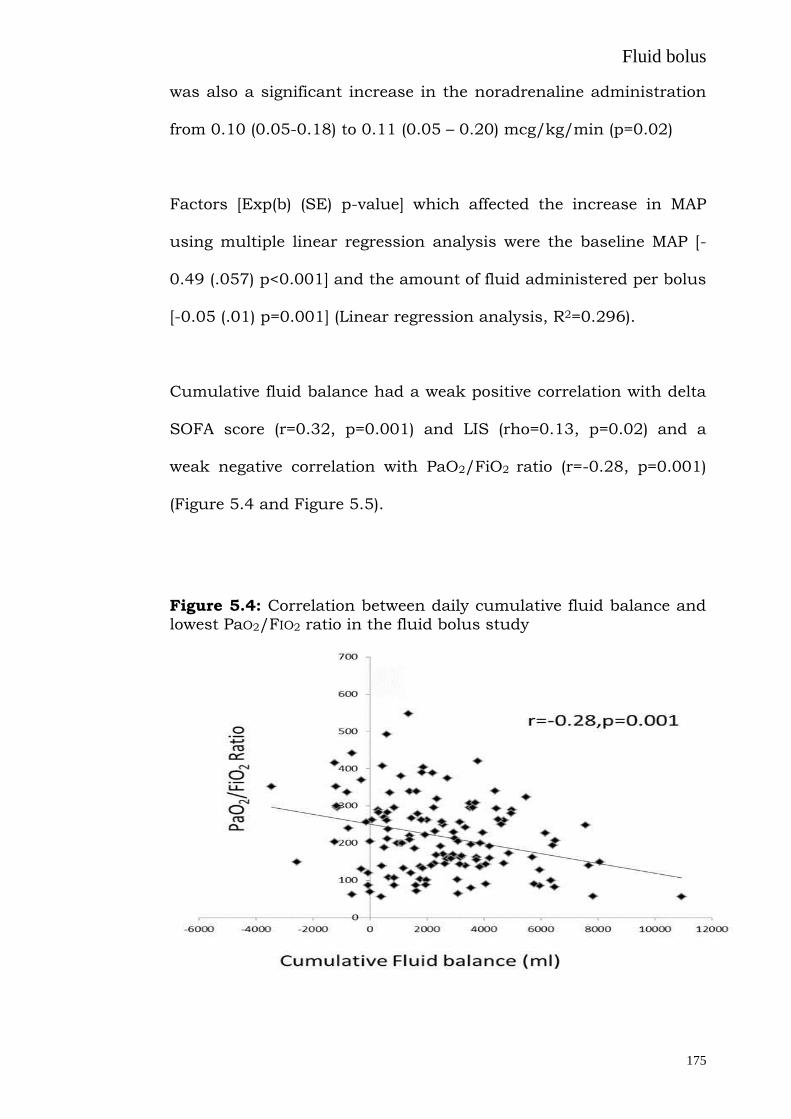
Fluid bolus
175
was also a significant increase in the noradrenaline administration
from 0.10 (0.05-0.18) to 0.11 (0.05 – 0.20) mcg/kg/min (p=0.02)
Factors [Exp(b) (SE) p-value] which affected the increase in MAP
using multiple linear regression analysis were the baseline MAP [-
0.49 (.057) p<0.001] and the amount of fluid administered per bolus
[-0.05 (.01) p=0.001] (Linear regression analysis, R2=0.296).
Cumulative fluid balance had a weak positive correlation with delta
SOFA score (r=0.32, p=0.001) and LIS (rho=0.13, p=0.02) and a
weak negative correlation with PaO2/FiO2 ratio (r=-0.28, p=0.001)
(Figure 5.4 and Figure 5.5).
Figure 5.4: Correlation between daily cumulative fluid balance and lowest PaO2/FIO2 ratio in the fluid bolus study

Fluid bolus
176
Figure 5.5: Correlation between daily cumulative fluid balance and delta (at 48 hours and 72 hours compared with baseline) SOFA
(sequential organ failure assessment score) scores
5.1.4 DISCUSSION
In this study, 94% of patients with severe sepsis or septic shock
received FB after the initial resuscitation period, these met with
limited success and contributed to the daily fluid balance. The
cumulative fluid balance negatively correlated with the oxygenation,
LIS and the SOFA scores. This study highlights the common
practice of fluid resuscitation after the initial 6 hours, suggests lack
of any sustained benefit (1 hour period) following the FB
resuscitation, and reports its possible adverse associations.
Patients with sepsis have higher volumes of extracellular water,
lower intrathoracic blood volume index, higher pulmonary
permeability ratios (extravascular lung water/pulmonary blood
Fluid bolus
177
volume) and higher systemic permeability ratios (interstitial/plasma
volume) as compared to patients without sepsis (S’anchez et al.
2011). Hence any fluid administered, if not appropriately targeted,
can lead to pulmonary and systemic oedema.
Axler et al (Axler et al. 1997) reported that rapid volume infusions
are common therapeutic interventions in ICU (159 rapid volume
infusions in 470 patient days) but the effect of a typical rapid
volume infusion on haemodynamics was small. In 13 patients with
sepsis, rapid volume infusion of an empiric 500 mL of saline did not
significantly increase MAP but increased the pulmonary artery
occlusion pressure immediately after the infusion. In our study FB
led to a small rise in MAP, although there was a simultaneous rise
in the dose of vasopressor administered, along with a rise in CVP.
We chose 1 hour to judge the effectiveness of these FB in order to
investigate the sustained effects (Ospina-Tascon et al. 2010) rather
than the immediate ones. An increase in MAP > 5 mm Hg 1 hour
later was present in only 27.7% of the FB and a difference in MAP
before and after the FB were only statistically different for the first 2
FB and became insignificant thereafter. Also, in patients not on
vasopressors (as a marker of patients in whom sepsis was under
control) there was no significant effect of these FB on MAP. It is also
noteworthy that even though we used larger amount of fluids, as
compared with Axler and colleagues (Axler et al. 1997), and mostly

Fluid bolus
178
colloid in our study, the volume was comparable to the 6S study
(Perner et al. 2012) and was administered for a clinical indication.
These FB administered in our study contributed significantly to the
daily fluid balance and the cumulative balance, which had a
negative correlation with the oxygenation, lung injury and the organ
failure scores. Multiple studies have correlated positive fluid balance
with reduced survival in ARDS (Humphrey et al. 1990; Simmons et
al. 1987) and sepsis (Alsous et al. 2000). It is also known that sepsis
impairs alveolar epithelial function by down regulating the epithelial
Na-K-ATPase pump, and that alveolar fluid clearance is reduced
when examined 24 and 48 hours after induction of sepsis (Berger et
al. 2011). Our prospective study also provides support to the large
retrospective study examining late fluid management of patients’
septic shock complicated with acute lung injury (Murphy et al.
2009).
It is of some interest that, in the trial of early goal directed therapy
(Rivers et al. 2001), those randomised to resuscitation guided by the
ScVO2 had improved survival and received significantly less fluid
between 6 h and 72 h, whereas they received more fluid between 0 h
and 6 h. Using a side stream dark field device, Ospina-Tascon et al
(Ospina-Tascon et al. 2010) have evaluated the effects of fluids on
the sublingual microcirculation in 60 patients with severe sepsis
and have shown that fluid administration improved microvascular

Fluid bolus
179
perfusion in the early but not late phase of sepsis. Measures of
commonly used resuscitation parameters (Kopterides et al. 2009)
ScvO2 and lactate did not change 1 hour after the FB in our study
providing further support to Ospina-Tascon et al findings. They
used a bolus of either 1,000 ml of a Ringer’s lactate solution or 400
ml of a 4% albumin solution over 30 min with a response rate of
55%, defined as an increase in MAP by 5 mm Hg. Our results are
consistent with this and with previous observations (Hauser et al.
1977; Calvin et al. 1981) and suggest that in many patients, large
volumes of fluid must be infused rapidly in order to alter
haemodynamics. After a 1-L infusion of lactated Ringer's solution
over 1 hour in critically ill patients, Hauser and colleagues (Hauser
et al. 1977) did not observe a significant increase in MAP or cardiac
index. Similarly, after a 250-mL infusion of 5% albumin over 30
mins in critically ill patients, Calvin and colleagues (Calvin et al.
1981) observed only a small increase in cardiac index from 3.25 +/-
1.08 to 3.47 +/- 1.23 L/min.
The increase in CVP with FB was predictable, but did not predict a
rise in MAP after these FB. CVP is probably the most used
parameter for judging whether fluids should be administered,
nevertheless, a large number of studies (Magder et al. 2007;
Michard et al. 2000; Kumar et al. 2004; Reuse et al. 1990; Wagner
et al. 1998) have shown that CVP fails to discriminate fluid
responders from non-responders when defined as an increase in
Fluid bolus
180
cardiac output or MAP. When CVP is significantly elevated (>10 mm
Hg), fluids are generally unlikely to increase perfusion, (Magder et
al. 2007) but there are occasional exceptions. Overall, the predictive
power of the CVP is poor. When CVP is greater than 12 mm Hg, the
positive predictive value is only 47% (Osman et al. 2007). Even
when CVP is much lower in patients receiving ventilation (about 5
mm Hg), the positive predictive value is still only 47%. FB
contributes to positive fluid balance which along with elevated CVP
(as seen in our study) is associated with increased mortality in
patients with septic shock (Boyd et al. 2011).
In the SAFE study (SAFE study investigators 2004) and the recently
conducted 6S (Perner et al. 2012) and CHEST (Myburgh et al. 2012)
trials, patients administered colloids required more blood
transfusion than their control groups, consistent with the drop in
haemoglobin we found in our study. Depending on the cardiac
output response, this may reduce oxygen delivery directly, and may
precipitate transfusion (Yu et al. 2011).]
Clinicians use various clinical signs such as “cold clammy skin”,
capillary refill time, skin turgor, dry tongue or mucosa for their
clinical judgement about the fluid requirement. When we were
designing the study we added this point in the data collection sheet
to capture these indications. What we found was that the indication
rate was low but a high percentage of them were perceived to be
successful, providing support for the recent review by Sevransky

Fluid bolus
181
(Sevransky 2009) that, despite limitations, the availability, low risk,
and ability to perform repetitive tests ensure that clinical
examination of the haemodynamically unstable patient will continue
to be a useful tool for the intensivist.
Urine output was one of the commonest and least successful
indications for these FB. The change in urine output 1 hour after
fluid administration was not statistically different. If these FB fail to
increase urine output it further adds to the positive fluid balance in
patients with potential renal failure. These FB contributed 30.8% -
52.4% of the daily fluid balance. The SOAP study (Payen et al.
2008), found that positive fluid balance was associated with a
worse outcome in patients with acute renal failure, a finding which
has been recently been supported by the PICARD (Bouchard et al.
2009) study.
A rise in MAP is a common resuscitation target in patients of sepsis
(Morelli et al. 2007). When analysed with regression analysis FB had
a negative correlation with MAP before fluid administration (i.e.
lower the MAP the greater was the response) and with the amount of
FB used (i.e. the greater the amount of fluid used for FB the lower
the response), hence for a low MAP, using a small amount of fluid
(mostly 4% albumin in our study) was the best model for a rise in
MAP.
Fluid bolus
182
5.1.5 Study Limitation
These findings are from a single centre, predominantly using 4%
albumin as the resuscitation fluid, in a prospective study,
examining the effect of post resuscitation FB, in a group of patients
with severe sepsis or septic shock. Moreover these patients were
heterogeneous with regards to their source, usage of vasopressors,
treatment with other medications (e.g. diuretics) and variable levels
of hypotension and shock. To study the effects of such unavoidable
heterogeneity a larger sample size would be required.
The predominant use of 4 % albumin also limits our results
especially with regards to the drop in haemoglobin. However, use of
4% albumin in sepsis is supported by a recent meta-analysis
(Delany et al. 2011) and the subgroup analysis of the SAFE study
(SAFE study investigators 2004). Moreover, improved microvascular
perfusion with fluids does not appear to be affected by the type of
fluid used (Ospina-Tascon et al. 2010).
One of the other short comings is the lack of use of dynamic
measures (Lanspa et al. 2013) to test for fluid responsiveness in our
unit. Although measures such as pulse pressure variation were
present in the data collection sheet, this technique was rarely used.
A possible reason for this could be lack of patients who were not
spontaneously breathing, a key requirement for valid dynamic
testing. Passive leg raising (Monnet et al. 2006) (PLR) has been used

Fluid bolus
183
in several studies as a surrogate for a volume challenge. A downside
of PLR is that it requires some measure of cardiac output (preferably
continuous). Measures of cardiac output were present in only 4 out
of the 50 patients we studied. Although it would be an invaluable
addition to our study, cardiac output has been shown to be
marginally increased (Calvin et al. 1981) or not affected 1 hour
(Hauser et al. 1977) after the fluid bolus. Though we found
correlations between fluid balance (a large contribution from the FB)
and PaO2/FiO2 it would be invaluable to examine similar
correlations with extravascular lung water, we suggest this be
considered in future studies.
Contribution of non-resuscitation fluids to the daily fluid balance
was highlighted in our study, which has been seen in other larger
fluid trials (SAFE study investigators 2004; Myburgh et al. 2012;
Perner et al. 2012). We believe future fluid trails should aim to
control this as they form a high percentage of the daily fluid balance
of these patients and may contribute to the adverse effects of
positive fluid balance.
5.1.6 SUMMARY
In patients with severe sepsis or septic shock, after the initial
resuscitation, caution must be used in administering FB, as they
are usually ineffective, especially after the first 2 boluses, and may
lead to positive fluid balance and concomitant adverse outcomes.

Fluid bolus
184
5.2 Effect of fluid boluses on serum electrolytes and
acid-base status
In addition to differences in their effectiveness as volume expanders,
different intravenous (i.v.) fluids have different and sometimes
unexpected adverse effects. As the absence of calcium and high
chloride levels in 4% albumin (CSL Biotherapies; which contains the
following - sodium 140 mmol/l, chloride 128 mmol/l , albumin 40 g/l
and octanoate 6.4 mmol/l) may lead to clinically significant effects,
we further analysed data from our recently conducted study
(Section 5.1), after 149 fluid boluses with 4% albumin
administration. The amount of 4% albumin administered was 500
(250-500) ml (median (IQR)) and acid-base status and serum
electrolytes were analysed with an ABL700 series (Radiometer
Medical ApS, Brønshøj, Denmark) before and 1 hour after fluid
administration. Fluid blouses with 4% albumin resulted in a
decrease in plasma ionized calcium (corrected for pH) and an
increase in serum chloride and an expected change in bicarbonate,
PaCO2 and ultimately pH (Table 5.5). There was also a decrease in
the PaO2/FiO2 ratio and a decrease in haemoglobin (Section 5.1,
Table 5.4) with no change in sodium, potassium or lactate levels.
The decrease in calcium is likely due to binding of free calcium with
the administered albumin which does not contain calcium. A
delayed decrease in calcium has been reported before in
hypovolemic trauma patients who also had multiple blood
transfusions with infusion of albumin (Kovalik et al. 1981), but the

Fluid bolus
185
immediate effect is not known. The rise in chloride levels seen in our
study is likely a reflection of the high amounts of chloride present in
4% albumin. This then results in a metabolic acidosis and a
compensatory decrease in PaCO2 levels. The drop in PaO2/FiO2 ratio
is consistent with lung oedema and a decrease in haemoglobin is
suggestive of haemodilution.
Even though 4% albumin has been postulated to decrease the risk
of death in patients with severe sepsis (SAFE study investigators
2011), we found a drop in PaO2/FiO2 ratio 1 hour after its
administration in septic patients (section 5.1). The change in
chloride and calcium levels may have a contradictory effect on the
development of lung oedema. Chloride transport-driven alveolar
fluid secretion is now considered a major contributor to lung
oedema (Solymosi et al. 2013), and a transient rise in serum
chloride after 4% albumin administration may expedite this process.
This may be counterbalanced by a transient drop in ionized calcium
levels. One of the major pathways of lung injury is entry of calcium
via endothelial channels and transient drop in calcium may impede
this process. Of note calcium free perfusate is often used in isolated
perfused lung injury models as a negative control (Kuebler et al.
1999). The interaction between the above two variables may
contribute to the development of lung oedema in patients with
sepsis. Future studies should focus on acute changes in these

Fluid bolus
186
electrolyte levels after interventions such as the administration of
4% albumin.
While the levels of calcium and chloride are not known after the first
1 hour, earlier but transient electrolyte effects might play a more
important physiologic role in the development of pulmonary oedema
than their daily levels.
Table 5.5: Effect on acid-base status and serum electrolytes before
and 1 hour after albumin boluses
Variables* Before After 1 hour P value#
iCa++
(mmol/L) (corrected for
pH)
1.06
(0.99-1.12)
1.01
(0.95-1.05)
<0.001
Na+
(mmol/L) 134 (133-135) 134 (133-135) 0.77
Cl- (mmol/L) 105 (102-108) 107 (104-110) <0.001
K+
(mmol/L) 3.7 (3.2-3.9) 3.8 (3.1-4.0) 0.46
HCO3- (mmol/L) 18 (15-21) 17 (14-19) 0.04
pH 7.37
(7.31-7.40)
7.34
(7.30-7.41)
<0.001
PaO2/FiO2 ratio 244 (163-293) 224 (117-292) <0.001
PaCO2 mm Hg 35 (30-38) 33 (29-36) 0.02
Haemoglobin (g/L) 105 (96-117) 97 (88-112) 0.001
Lactate 2.3 (1.1-3.8) 2.2 (0.9-4.0) 0.19
*Data presented as median (IQR) # analysed with Wilcoxon signed rank test

Fluid bolus
187
5.3 Bolus administration of intravenous fluids leads to
permeability lung oedema via activation of TRPV4 channels in
a rat model
Bolus administration of intravenous fluids is common in
resuscitation of critically ill patients as seen in the previous section
(Section 5.1) and other studies (Rivers et al. 2001; Perner et al.
2012). However, adverse effects of fluid resuscitation are
increasingly recognised. Generally, i.v. fluid is associated with
positive fluid balance and has been associated with increased
mortality in patients with both lung injury (Sakr et al. 2005) and
sepsis (Simmons et al. 1987; Murphy et al. 2009). In the CHEST
study which compared starch or saline for fluid resuscitation in ICU
patients (Myburgh et al. 2012), 25.6% of patients developed new
onset respiratory failure in both the groups following fluid
administration. Moreover, as seen in the previous section, fluid
boluses were associated with worsening oxygenation, before and 1
hour after fluid bolus (Section 5.1).
Furthermore, serious concerns have been raised with regards to the
safety of the fluids boluses since the publication of the FEAST study
(Maitland et al. 2011). FEAST was a randomized trial which
compared 0.9% saline (crystalloid) or 5% albumin (colloid)
resuscitation with no fluid resuscitation in African children with
severe infection. Unexpectedly the group receiving no fluid boluses
had the lowest mortality at both 48 hours and at four weeks when
compared with groups receiving either 0.9% saline or 5% albumin.

Fluid bolus
188
While there may be have been specific issues related to the study
population and associated management, this well conducted trial
challenges current concepts regarding fluid resuscitation for
patients with severe infection. However, possible mechanisms for
the increase in mortality remain speculative.
Over the last 20 years concepts regarding pulmonary fluid
regulation have undergone substantial refinement (Londino et al.
2013). It is now estimated that only 30% of alveolar oedema
following elevated pulmonary capillary pressure is due to direct
hydrostatic effects with the remaining 70% due to active changes in
bi-directional fluid flux (Kaestle et al. 2007). Recently the transient
receptor potential (TRP) ion channel superfamily have been
recognised as critical components of this active cellular process
through sensing and transmission of a broad variety of external or
internal stimuli, including mechanical stress (Yin et al. 2010). TRP
vanilloid (TRPV)4 has mechanotransductive properties and is
abundantly expressed in pulmonary blood vessels (Yin et al. 2010).
Activation of these channels by shear forces (Troidl et al. 2009),
stretch (Mochizuki et al. 2009), over-inflation (Hamanaka et al.
2007; Jurek et al. 2014), hypothermia (Hamanaka et al. 2007),
increased hydrostatic pressure (Yin et al. 2008) and hypotonicity
(Liedtke et al. 2003) leads to the rapid influx of calcium ions (Figure
1.1). The resultant increase in intracellular Ca2+ leads to increased
permeability of the alveolocapillary barrier, and reduction in alveolar
fluid clearance via down regulation of fluid channels, aquaporin
Fluid bolus
189
(AQP)5 (Sidhaye et al. 2008), and an increase in the proteolytic
disruption of cell-cell or cell-matrix adhesion by matrix
metalloproteinases (MMPs) (Villalta et al. 2014) leading to lung
endothelial permeability (Villalta et al. 2013) which manifests as
lung injury (Alvarez et al. 2006). Activation of TRPV4 channels has
been implicated in the causation of lung injury in heart failure,
ventilator induced and chemically induced lung injury (Hamanaka
et al. 2007; Jurek etal 2014; Balakrishna et al. 2014).
It was hypothesised that administration of bolus intravenous fluids
will lead to a transient rise in the shear forces across the pulmonary
endothelium leading to activation of TRPV4 channels, increased
lung endothelial permeability and disruption of the alveolar septal
barrier which will manifest as lung injury, “Fluid Induced Lung
Injury” (FILI). Further, that this disruption of the alveolar septal
barrier with fluid administration will occur despite maintenance of
safe hydrostatic pressure. Therefore, the aim of the current study
was to examine the effect on the lung of rapid administration of
intravenous fluids in a rat model. Following establishment of FILI in
this model we aimed to determine whether the observed increase in
permeability could be ameliorated by prophylactic administration of
a recognised TRPV4 antagonist, i.v. ruthenium red.

Fluid bolus
190
5.3.1 METHODS
5.3.1.1 Ethics approval
All experiments were approved by the Flinders University Animal
Welfare Committee and performed according to the National Health
and Medical Research Council of Australia Guidelines on Animal
Experimentation (application number 812.12).
5.3.1.2 Animals
Specific pathogen-free male Sprague-Dawley rats (250-280g) were
used in all experiments.
5.3.1.3 Fluids utilised
Animals were randomly assigned to administration of the following
fluids - 0.9% saline (n=6) and 4% albumin (n=6). All the fluids were
administered through the right femoral vein by utilizing a 3 way tap.
5.3.1.4 Controls
Negative control animals (n=6) did not received any i.v. fluids or
were administered intra-tracheal LPS. Positive control animals (n=6)
had induced acute lung injury using a previously established
method of intra-tracheal LPS endotoxin (Dixon et al. 2009).
5.3.1.5 Study protocol
Rats were anaesthetised with intraperitoneal thiopentone sodium
(60mg/kg; Abbott Australasia, Kurnell, Australia) and a right

Fluid bolus
191
femoral vein and artery catheterised for maintenance via continuous
intravenous infusion of thiopental (50mg/kg/hr; Abbott Australasia)
and for arterial blood sampling and pressure monitoring,
respectively. Rats were paralysed with a bolus injection of
pancuronium bromide (1mg/kg iv; Astra Zeneca, Bedfordshire, UK)
maintained by continuous infusion (0.2mg/kg/h iv) and kept at
37C with a temperature-controlled heat pad. A tracheotomy was
performed and the lungs ventilated via a computer controlled small
animal mechanical ventilator (flexiVent, SCIREQ Scientific
Respiratory Equipment, Montreal, Canada) with 100% oxygen for 15
minutes to stabilise at a tidal volume (VT) of 6ml/kg body weight,
breathing frequency (f) of 120min-1, and positive end expiratory
pressure (PEEP) of 2 cmH2O using a constant flow waveform where
Ti/Ttot = 0.3.
LPS (Escherichia coli O55:B5, 15 mg/kg in saline, Sigma-Aldrich, St
Louis, MO) (in positive control) or similar volume of saline was
instilled through the tracheal catheter in 3 separate 0.1ml volumes,
each volume followed by a 3ml air bolus and a respiratory
recruitment manoeuvre of 2.5 × VT and PEEP of 10cmH2O for 15
seconds. The rat was left to stabilise on normal ventilation as above
for 5 minutes after each instillation. Following LPS or saline
instillation, rats were ventilated for 2 h, as above, while blood
pressure was monitored continuously using a disposable pressure
transducer (Sorenson Trans Pac; Abbott Critical Care Systems,
Chicago, IL) connected to a MacLab system (AD Instruments,

Fluid bolus
192
Sydney, Australia). Study plan with description of various
measurements at various time intervals is shown in figure 5.6.
Figure 5.6: Study protocol used in the animal study
Rt carotid artery: LVEDP; Rt femoral artery: BP and blood sampling; Rt femoral vein: for administration of drugs and fluids; Lt femoral vein: CVP; Tracheostomy- lungs ventilated via a computer controlled small animal mechanical ventilator (flexiVent, SCIREQ) aslo capable of measuring lung mechanics
5.3.1.6 Monitoring
Continuous monitoring of right heart pressure (CVP) was done by
canulating the left femoral vein. Similarly continuous monitoring of
the left heart pressure was done by cannulating the right carotid
artery and advancing the cannula in to the left heart (left ventricular
end diastolic pressure) (LVEDP). Both were monitored using a
disposable pressure transducer (Sorenson Trans Pac; Abbott Critical
Care Systems, Chicago, IL) connected to a MacLab system (AD
Instruments, Sydney, Australia).

Fluid bolus
193
5.3.1.7 Dose finding experiment
In order to minimise development of hydrostatic oedema by rapid
infusion of i.v. fluid, we conducted a dose response study of
administration of 0.9% saline and 4% albumin administered as
boluses of 20 ml/kg i.v. at 10 min intervals via the right femoral
vein over 40 min. A clinically defined cut-off of an increase in
LVEDP less than 18 mm Hg was utilised as hydrostatic pulmonary
oedema has been described at higher levels (Forrester et al. 1976).
Based on these findings 0.9 % saline and 4% albumin were
administered in all subsequent experiments at 60 ml/kg over 30
min (Figure 5.6).
5.3.1.8 Measurement of respiratory mechanics
Respiratory mechanics (airway (Newtonian) resistance, Raw; tissue
resistance, Gtis; and tissue elastance, Htis) were measured before
instillation (baseline), 5 minutes after the last instillation of either
LPS or saline (start) and every 30 min thereafter for the duration of
the experiment (Figure 5.6), by measuring the lung’s impedance (Z)
using the computer-controlled ventilator, as described previously
(Davidson et al. 2002). Briefly, 2 min after a recruitment manoeuvre
(2.5 × VT), impedance of the respiratory system was measured
following a forced oscillation. The data were fitted to a constant
phase model (Bates et al. 1992) where Z = Raw + jI + (Gtis-
jHtis)/(2πf)α, where I is inertance, j is the imaginary unit, f is

Fluid bolus
194
frequency and α = (2/π)arc tan (Htis/Gtis). Inertance was
negligible and is therefore not reported.
5.3.1.9 Assessment of lung injury
Blood samples were taken hourly throughout ventilation for
measurement of arterial blood gas-pH (ABL 5, Radiometer,
Copenhagen, Denmark) and bi-hourly for plasma cytokines. The
lungs were removed and the right upper lobe resected for
determination of wet-to-dry lung weight ratio, as described
previously (Davidson et al. 2002). The remaining lung was degassed
at 0.5 atm for 60 seconds and lavaged at 2C with 3 separate
32ml/kg bodyweight volumes of 0.9% sodium chloride, each volume
instilled and withdrawn three times. Percent recovery of lavage fluid
was not different between the animals. The lung lavage fluid was
centrifuged at 150 g for 5 minutes at 2C. A sample was taken from
the supernatant, aliquoted and stored at -80C until analysis for
cytokines. A further aliquot was taken for determination of total
lung lavage protein with commercially available reagents (BioRad
DC Protein Assay; BioRad Laboratories, Hercules, CA).
5.3.1.10 Surfactant analysis
The remaining supernatant was centrifuged at 1000 g for 25
minutes at 2C to give a tubular myelin rich pellet (large aggregate)
and a tubular myelin poor supernatant (small aggregate). Lipids
were extracted from each fraction using the method of Bligh and

Fluid bolus
195
Dyer (Bligh et al. 1959) and total phospholipid content determined
by measuring the amount of inorganic phosphorus with the method
of Bartlett (Barlett et al. 1959). Measured surfactant was normalised
to gram of dry lung weight. Results are expressed as a ratio of small
and large aggregates.
5.3.1.11 Cytokine determination
Cytokine concentrations in lung lavage and plasma were analysed
using commercially available enzyme linked immunosorbant assay
(ELISA) kits for TNF-, IL-8 (CINC-1) and PLA2 (R&D Systems), as
per manufacturers instruction and described previously (Dixon et al.
2008).
5.3.1.12 Histological analysis
Following BAL, the right lung lobes were fixed at 20 cmH2O with
10% buffered formalin. Paraffin-embedded sections (4 µm) were
stained with hematoxylin and eosin for scoring of pulmonary
inflammatory cell infiltration and alveolar wall thickening using a
semi quantitative score (0-3) on blinded sections by two
independent investigators (Dixon et al. 2009).
5.3.1.13 Electrolyte and haematocrit measurement
Serum sodium and chloride are measured using Ion Selective
Electrodes (ISE). Haematocrit was measured with a haematocrit
reader.

Fluid bolus
196
5.3.1.14 Administration of ruthenium red
The experiments were repeated with the control group (n=9),
animals administered with i.v. 0.9% saline (n=8) or ruthenium red
(1 micro mol/l of blood) before the administration of 0.9% saline
(n=7)). There were also control rats who were administered
ruthenium red only (n=5). The protocol was similar to that used in
experiment (Figure 5.6)
5.3.1.15 Statistical analysis
Statistical analyses were performed using PASW 22.0 software
(SPSS Inc). All values are expressed as mean (SD). Two-way
analysis of variance (ANOVA) and repeated measures analysis of
variance with Tukey post-hoc tests were used to determine
significant differences (P ≤ 0.05).
5.3.2 RESULTS
5.3.2.1 Experiment : dose determination
The effect of administration of boluses of 0.9% saline and 4%
albumin on the LVEDP is shown in Figure 5.7. LVEDP increased to
more than 18 mm Hg after the fourth bolus of 20 ml/kg (total 80
ml/kg). Based on this we utilised 60 ml/kg administered over 30
minutes for both the fluids.
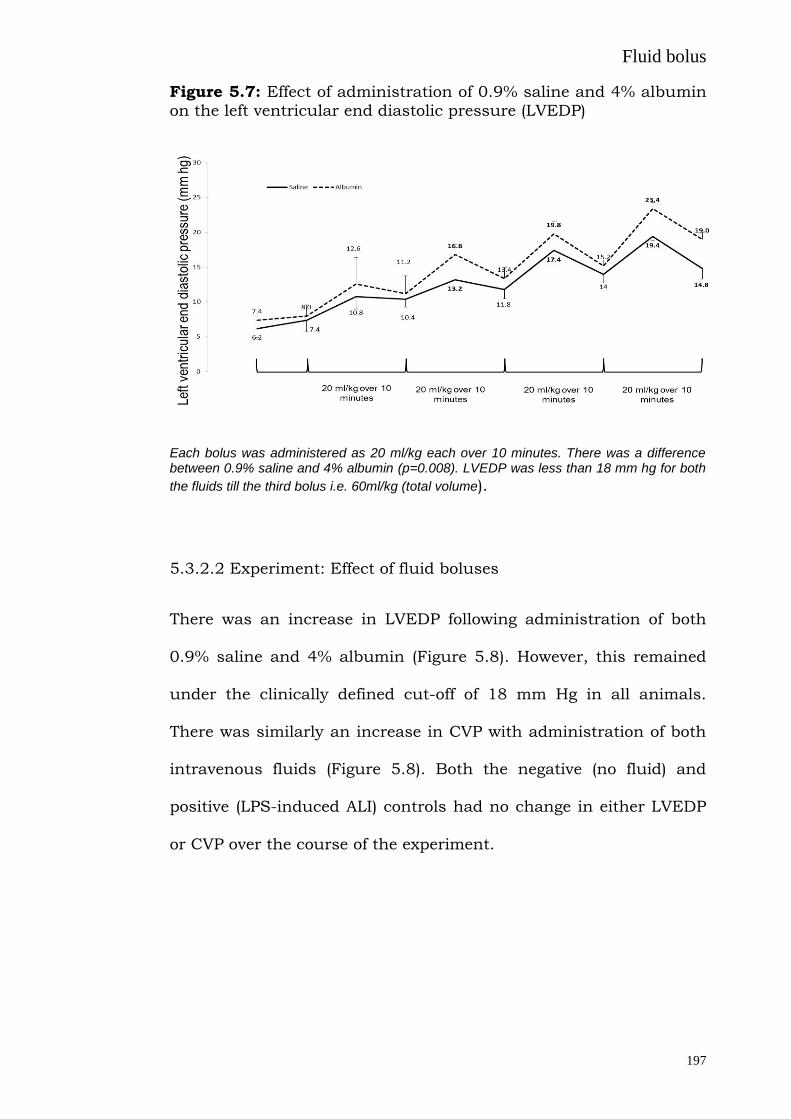
Fluid bolus
197
Figure 5.7: Effect of administration of 0.9% saline and 4% albumin
on the left ventricular end diastolic pressure (LVEDP)
Each bolus was administered as 20 ml/kg each over 10 minutes. There was a difference between 0.9% saline and 4% albumin (p=0.008). LVEDP was less than 18 mm hg for both
the fluids till the third bolus i.e. 60ml/kg (total volume).
5.3.2.2 Experiment: Effect of fluid boluses
There was an increase in LVEDP following administration of both
0.9% saline and 4% albumin (Figure 5.8). However, this remained
under the clinically defined cut-off of 18 mm Hg in all animals.
There was similarly an increase in CVP with administration of both
intravenous fluids (Figure 5.8). Both the negative (no fluid) and
positive (LPS-induced ALI) controls had no change in either LVEDP
or CVP over the course of the experiment.
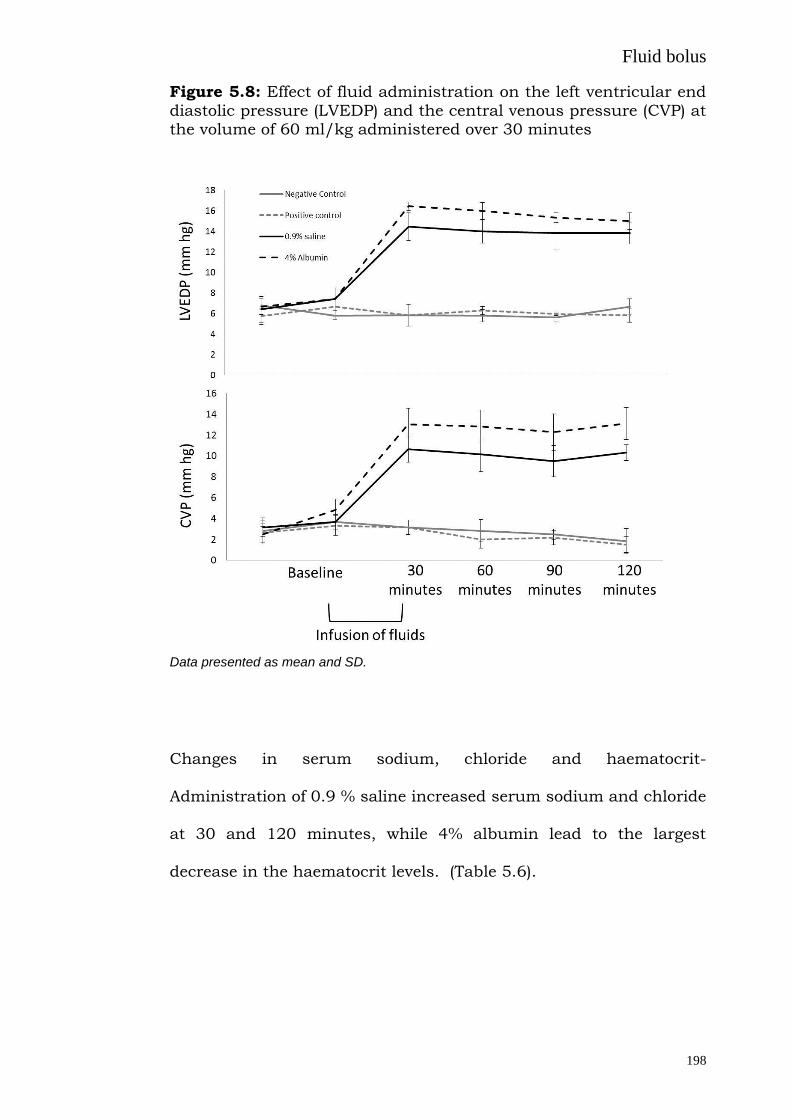
Fluid bolus
198
Figure 5.8: Effect of fluid administration on the left ventricular end
diastolic pressure (LVEDP) and the central venous pressure (CVP) at the volume of 60 ml/kg administered over 30 minutes
Data presented as mean and SD.
Changes in serum sodium, chloride and haematocrit-
Administration of 0.9 % saline increased serum sodium and chloride
at 30 and 120 minutes, while 4% albumin lead to the largest
decrease in the haematocrit levels. (Table 5.6).

Fluid bolus
199
Table 5.6: The effect of 0.9 % saline and 4% albumin infusion on
serum sodium, chloride and the haematocrit
Negative Control
0.9% Saline 4% Albumin Positive Control p
Baseline
30 min
120 min
Baseline
30 min
120 min
Baseline
30 min
120 min
Baseline
30 min
120 min
Haematocrit (%)
.45 (.02)
.47 (.05)
.48 (.03)
.46 (.01)
.41 (.03)
.44 (.04)
.45 (.04)
.33 (.02)
.36 (.03)
.44 (.05)
.44 (.02)
.46 (.02
)
0.001
Serum Sodium (mmol/l)
136 (1)
137 (1)
138 (2)
137 (2)
140 (2)
142 (2)
137 (1)
133 (2)
135 (3)
135 (1)
137 (2)
138 (1)
0.001
Serum Chloride (mmol/l)
102 (1)
102 (1)
103 (1)
101 (1)
115 (2)
111 (2)
102 (1)
106 (2)
102 (2)
101 (1)
102 (2)
102 (1)
0.001
Data presented as mean and SD.
Fluid induced lung injury
Administration of both 0.9% saline and 4% albumin lead to an
increase in the lung wet to dry weight ratio and lung lavage protein
when compared with the negative control (Figure 5.9).
Figure 5.9: The effect of fluid boluses on lung oedema (wet to dry ratio) and lavage protein levels
Data presented as mean and 2 SD.

Fluid bolus
200
Both fluids led to a decrease in the PaO2 levels when compared with
the negative controls but did not reach to levels seen in animals in
the positive control group. Both fluids and animals in the positive
control group, had an increase in PaCO2 levels over time. (Figure
5.10)
Both fluids, and animal in the positive control group had a rise in
the Htis and Gtis over time. Only animals in the positive control had
a rise in airway resistance over time (Figure 5.11).
Figure 5.10: The effect of fluid boluses on PaO2 and PaCO2 levels
Data presented as mean and SD.

Fluid bolus
201
Figure 5.11: The effect of fluid boluses on lung mechanics
Data presented as mean and SD.
There was no change in the total amount of phospholipids but there
was an increase in the ratio of small to large aggregates with both
the fluids and the positive control animals (Figure 5.12)
There was an increase both in the cellular infiltrate and wall
thickness oedema score with administration of fluids and animals in
the positive control group (Figure 5.12).

Fluid bolus
202
Administration of fluids had no effect on the lung lavage cell count,
neutrophil count, MPO activity assay, lung lavage and blood TNF-α
and IL-8 levels. All of these parameters increased in the positive
control animals.
Figure 5.12: The effect of fluid boluses on the ratio of small and large lung lavage phospholipid aggregate and lung histology (cell infiltrate and wall thickness score) score
Data presented as mean and 2 SD.

Fluid bolus
203
5.3.2.3 Experiment: Use of TRPV4 blocker- ruthenium red
Administration of ruthenium red had no effect on any measured
variable when compared to the negative control animals.
Administration of ruthenium red before 0.9% saline led to lower
lung oedema (p<0.001), lavage protein (p=0.01) and PaCO2 and
increased PaO2 (p>0.001) and lung elastance at 2 hours (p<0.001)
(Table 5.7). There was an increase in PLA2 levels in animals who
were administered 0.9% saline, but the group of animals who
received ruthenium red before the administration of fluids, had the
same levels as the control group. (Table 5.7)
Lung histology score (cellular infiltrate and oedema score) were less
in animals who were administered ruthenium red as compared with
animals who were administered 0.9% saline (Figure 5.13).
Table 5.7: Parameters of lung injury 2 hours after initiation of mechanical ventilation and administration of i.v. fluids and RR.
Data presented as mean (SD). RR: Ruthenium red. Lung histology scores 0-3 of H&E tissue sections
No fluid control
(n=6)
i.v. 0.9% saline
(n=6)
i.v. 0.9% saline + RR
(n=6)
p value
Lung wet to dry ratio 4.1 (0.3) 5.9 (0.8) 4.6 (0.8) 0.01
Whole lung lavage protein
(µgm/ml)
222.5 (15.2) 415.0 (76.9) 201.9 (52.1) 0.03
Whole lung lavage PLA2
(μm/min/ml)
0.16 (0.03) 1.63 (0.23) 0.89 (0.40) 0.04
Lung elastance cmH2O/ml -
2 hours
4.4 (0.3) 6.5 (0.8) 4.8(0.7) 0.05
PaO2 (mm Hg)- 2 hours 480 (17) 324 (77) 487 (18) 0.01
Lung histology score:
cellular infiltrate
0.7 (0.3) 2.0 (0.4 ) 1.0 (0.6) 0.01
Lung histology score: wall
thickness
0.6 (0.4) 1.5 (0.6) 1.1 (0.5) 0.01

Fluid bolus
204
Figure 5.13: Hematoxylin and eosin staining in the lung paraffin-
embedded sections (negative controls, 0.9% saline and 0.9% saline with ruthenium red)
Administration of ruthenium red led to a decrease in worsening of lung histology with 0.9% saline administration. RR; Ruthenium red
5.3.3 DISCUSSION
There are two main findings from this study. Firstly, it was shown
that 0.9% saline or 4% albumin at 60 ml/kg administered over half
an hour lead to permeability oedema in rats who are mechanically
ventilated, despite a ‘safe’ LVEDP. Secondly, development of oedema
with 0.9% saline is prevented by prophylactic administration of
ruthenium red, suggesting activation of TRPV4 channels as a
central event to the causation of the observed oedema.
5.3.3.1 Fluid induced permeability oedema – lung injury (FILI)
Multiple studies demonstrate lung oedema subsequent to a large
increase in lung capillary pressure (West et al. 1991; Pietra et al.

Fluid bolus
205
1969; Nicolaysen et al. 1979; Rippe et al. 1984; Maron et al. 1989;
Minnear et al. 1983). However, in the current study permeability
oedema occurred at pressures traditionally considered as within
clinically safe limits (Forrester et al. 1976). Previously, Wasserman
et al. showed that small infusions of saline-dextran lead to
increased lymph to protein concentration ratio for albumin and
dextran. They hypothesised that capillary pore size is variable and
can be increased by increasing the plasma volume (Wasserman et
al. 1955). Similarly in 1968, horseradish peroxidase (HSP) injected
in to mice was found by ultra structural cytochemistry to have
passed through end cell junctions in to the basement membrane,
however this has never been measured in the lung lavage protein
(Schneeberger-Keeley et al. 1968). Even though anecdotally
circulatory overload has been implicated as a cause for fluid
induced pulmonary oedema, as often discussed in the context of
transfusions (Andrzejewski et al. 2013), no direct relationship with
fluid induced permeability oedema has been described. Fluid
administration associated respiratory dysfunction is a common
clinical conundrum, evidenced by more than 25% of patients in the
CHEST study (in both the study arms) who developed new onset
respiratory failure (Myburgh et al. 2012) after fluid administration.

Fluid bolus
206
5.3.3.2 Role of TRPV4 channels
In the last decade activation of TRPV4 channels leading to influx of
calcium ions and increased endothelial permeability has been
implicated in the causation of lung injury in heart failure, ventilator
induced and chemical lung injury (Hamanaka et al. 2007; Jurek et
al 2014; Balakrishna et al. 2014). In vitro activation of TRPV4
requires hydrolysis of membrane phospholipids via PLA2 and
subsequent arachidonic acid metabolism by cytochrome P450
epoxygenases to form epoxyeicosatrienoic acids (EET) (Jian et al.
2008). In this study there was evidence of increased lung lavage
PLA2 with fluid administration. More importantly we found
decreased permeability oedema evidenced by a decrease in the lung
oedema (wet to dry ratio) and permeability (lung lavage protein)
when the rats were prophylactically administered systemic
ruthenium red. Ruthenium red (RR) is a well-studied, although non-
specific, TRPV4 antagonist examined both in isolated perfused lungs
and after nebulisation (Jurek et al. 2014; Yin et al. 2008; Jian et al.
2008). Systemic intravenous administration of ruthenium red per se
did not lead to any pulmonary effects in our studied time frame.
This suggests that administration of fluids though within “safe
pressures”, may lead to an increase in shear forces causing an
activation of these vanilloid channels and intracellular influx of
calcium. In vitro data suggests that TRPV4 can be activated within 5
minutes of stimulation by mechanical forces (Matthews et al. 2010),
and in our study, fluid was administered over 30 minutes providing

Fluid bolus
207
enough time for its activation. In 1999 Kuebler and colleagues
showed that an increase in pulmonary venular pressure lead to an
increased expression of P-selectin via influx of intracellular calcium
ions, while blockade of mechanogated Ca2+ channels with
gadolinium, (physiological blocker of TRPV induced calcium influx
(Kuebler et al. 1999), inhibited those responses. Gadolinium causes
loss of TRPV4 mediated currents and is an inhibitor of endothelial
stretch-activated channels (Lorenzo et al. 2008; Parker et al. 1985).
It prevents pressure-induced permeability increases in isolated rat
lungs (Parker et al. 1985), abolishes the pressure induced increase
in calcium in lung venular capillaries (Kuebler et al. 1999) and
blocks stretch-activated ion channels (Yang et al. 1989). This
supports the hypothesis that the increase in calcium seen in the
Kuebler study was due to activation of TRPV4 channels.
Weibel–Palade bodies (WPBs) are endothelial granules that store von
Willebrand factor (VWF), P-selectin, angiopoietin 2 and other
vascular modulators (Lowenstein et al. 2005). De-granulation of
Weibel Palade bodies following increased intracellular calcium ions
(via activation of TRPV4 channels) will release these pre-formed
inflammatory mediators. Ang-2, sensitizes the endothelial cell to the
inflammatory actions of TNF-α thus further perpetuating
inflammation and circulatory collapse (Fiedler et al. 2006), while P-
selectin facilitates cellular infiltration. In the FEAST trial (Maitland
et al. 2011), i.v. fluids led to an increase in early mortality in
children with severe infection, mostly due to cardiovascular

Fluid bolus
208
collapse. Using the TRPV agonist GSK1016790A Willette observed
endothelial failure and circulatory collapse with systemic activation
of the TRPV4 channel (Willette et al. 2008), thereby suggesting the
hypothesis that activation of TRPV4 with administration of fluids
may explain the FEAST result.
5.3.3.3 Dose of fluids
In the multi-centre (46 Intensive Care Units (ICU)) point prevalence
study, (Section 3.2) fluid boluses were administered to 35% of ICU
patients, and 42% of patients who were in the ICU for less than 3
days. In a more specific population, such as sepsis, 94% of patients
continue to receive fluid boluses after the initial resuscitation period
(Section 5.1). Moreover, the volume of these fluid boluses are often
large, for example, in patients receiving early goal direct therapy
3499±2438 ml of fluid was administered with 4981±2984 ml
administered to patients in the control arm in the first 6 hours
(Rivers et al. 2001), and in the 6S study (Perner et al. 2012),
patients on day 1 in the hydroxyethyl starch group received a
median of 1500 ml in addition to open label fluid, other fluid and
blood products (total 5825 ml (median) on day 1). As there are
multiple reports and evidence of lung oedema with high pulmonary
microvascular pressures (Forrester et al. 1976), we conducted initial
dose finding experiment. It is noteworthy that 60 ml/kg is the same
as the dose used in the FEAST study (60 ml per kilogram in stratum
B) (Maitland et al. 2011) after a protocol amendment in June 2010.
Fluid bolus
209
5.3.3.4 Effect of fluid on surfactant and lung mechanics
Previously in healthy subjects, rapid infusion of 0.9% saline has
been shown to reduce forced vital capacity, reduce forced expiratory
volume in 1 second, increase airway resistance, produce premature
airway closure and hypoxemia, reduce maximum oxygen
consumption and impair diffusion of oxygen (Muir et al. 1975;
Pellegrino et al. 2003; Farney et al. 1977). In the current study there
was worsening of lung elastance with fluid administration which
would be consistent with the findings from the healthy subjects.
Several authors have proposed that the initial increase in airway
resistance observed in experimentally induced pulmonary oedema is
secondary to distension of the pulmonary veins within
bronchovascular sheaths, with subsequent compression of the
smaller peripheral airways (Hogg et al. 1972; Staub et al. 1967)
which would explain the increase in the tissue resistance as seen in
our study. Moreover we found an increase the ratio of small to large
aggregates with fluid administration. One possible reason for this is
the increase in permeability and alveolar protein which would
increase the conversion from large to small aggregates (Davidson et
al. 2000). As all the animals in this experiment were mechanically
ventilated fluid-induced surfactant dysfunction could be a
contributory factor to the currently understood ventilator-induced
surfactant dysfunction, (Albert 2012; Greenfield et al. 1964) and
should be an area of future studies

Fluid bolus
210
5.3.3.5 Limitations and future directions
1. Fluid dose- even though the dose was carefully selected the
response of a different dose and a different rate of infusion
was not investigated.
2. Animals were ventilated for only 2 hours in this study
therefore longer term pulmonary effects of fluid boluses were
not investigated.
3. Even though we did measure the LVEDP, pulmonary artery
pressure and cardiac output were not directly measured.
4. We did not find any increase in lung lavage cells, even though
there was an increase in the cellular infiltrate score on the
lung histology. The ventilation period of 2 hours may not be
enough for this change to occur.
5. As ruthenium red is a non-specific TRP inhibitor, it can also
interact with many non-TRP proteins including Ca2+-ATPase,
mitochondrial Ca2+ uniporter, tubulin, myosin light-chain
phosphatase and Ca2+ binding proteins such as calmodulin
(Jurek et al. 2014), hence prevention of fluid induced lung
injury with RR is consistent with, but not specific for a TRPV4
mechanism. We used ruthenium red as it was well studied
and was readily available. Since, a more selective TRPV4
antagonist has become available and should be examined.
Similarly, the effect of fluid bolus on TRPV4 knock out mice
can also be examined in future studies to further define the
role of TRPV4 channels for fluid induced lung injury.

Fluid bolus
211
Future directions
Administration of i.v. fluids and fluid boluses is ubiquitous in pre-
hospital and hospital care and fluid resuscitation is frequently
required to restore adequate perfusion to vital organs in critically ill
patients. However, this may inadvertently contribute to morbidity
and mortality. Future studies should examine the pulmonary and
systemic effect of fluid resuscitation with the use if systemic TRPV4
blockers (under development with GSK) in both animal models and
healthy volunteers. This should lead to safer fluid resuscitation in
future.
5.3.4 SUMMARY
Bolus i.v. fluids can result in permeability pulmonary oedema
despite a safe (non-hydrostatic) LVEDP. Administration of
ruthenium red prevents such permeability oedema suggesting a
TRPV4 mechanism.
Fluid bolus
212
5.4 Bolus administration of 0.9% saline leads to interstitial
pulmonary oedema despite normal echocardiographic indices
in healthy subjects when compared with 4% albumin and 5%
glucose
After demonstrating fluid induced lung injury in an animal model,
the effect of bolus fluid administration in healthy subjects was
examined. Current clinical studies do not differentiate the effects of
crystalloid and colloid resuscitation (Finfer et al. 2004; Perel et al.
2013; Choi et al. 1999), apart from toxicity attributable to specific
synthetic colloids (Perner et al. 2012; Myburgh et al. 2012).
However, the ratio of crystalloid and colloid required for
resuscitation differs (Finfer et al. 2004; Brunkhorst et al. 2008;
James et al. 2011) from that originally suggested (Twigley and
Hillman 1985) and the central volume of distribution of crystalloid is
substantially smaller than the anatomic extracellular volume (Hahn
2010). Moreover, recent evidence wherein both of these fluids led to
unexpected increases in mortality in African children (Maitland et
al. 2011) with severe infection and to the revision of the standard
Starling equation (glycocalyx model) (Woodcock et al. 2012), has
underscored some of the current lacunas in our understanding of
the cardio- respiratory physiological effects of fluid boluses with
crystalloid and colloids.
Previously, rapid infusion of 0.9% saline in healthy subjects has
reduced forced vital capacity, forced expiratory volume in 1 second,
and maximum oxygen consumption, and produced premature

Fluid bolus
213
airway closure and hypoxemia, and impaired diffusion of oxygen
(Muir et al. 1975; Pellegrino et al. 2003; Farney et al. 1977).
However, no current comparison with colloids has been performed
in healthy subjects. In the current study, the effect of equivalent
volumes (30 ml/kg) of a colloid (4% albumin- CSL Biotherapies),
crystalloid (0.9% saline make - Baxter) and water (5% glucose-
Baxter IV) on cardio respiratory parameters in healthy human
volunteers was examined.
Based on the current convention, in which albumin will remain
intravascular, 0.9% saline will expand the extracellular space, and
5% dextrose will expand both intra and extracellular spaces, it was
hypothesised that 0.9% saline and 4% albumin would both lead to
interstitial oedema;
0.9% saline, due to its volume of distribution
4% Albumin due to cardiogenic (increase filtration) oedema.
5.4.1 METHODS
After approval from our ethics committee (Southern Adelaide
Clinical Human Research Ethics Committee- approval number
263.12) four healthy male adult volunteers were selected for the
study who had no history of cardiac, pulmonary or other chronic
diseases (hypertension, diabetes mellitus or kidney disease). All of
them were non-smokers, less than 40 years of age and body mass
index less than 30. Informed consent was obtained from all of them.
They were randomised in a double blind cross over study and
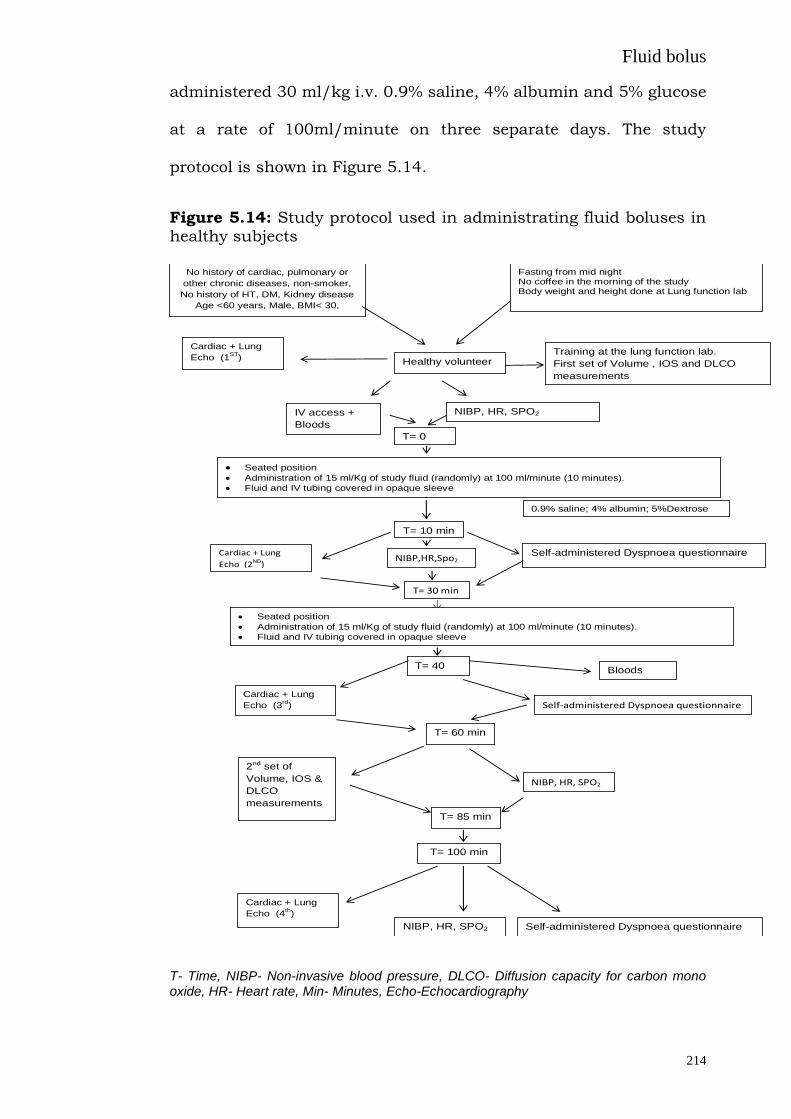
Fluid bolus
214
administered 30 ml/kg i.v. 0.9% saline, 4% albumin and 5% glucose
at a rate of 100ml/minute on three separate days. The study
protocol is shown in Figure 5.14.
Figure 5.14: Study protocol used in administrating fluid boluses in healthy subjects
T- Time, NIBP- Non-invasive blood pressure, DLCO- Diffusion capacity for carbon mono oxide, HR- Heart rate, Min- Minutes, Echo-Echocardiography
No history of cardiac, pulmonary or
other chronic diseases, non-smoker,
No history of HT, DM, Kidney disease
Age <60 years, Male, BMI< 30,
Fasting from mid night No coffee in the morning of the study Body weight and height done at Lung function lab
Healthy volunteer
T= 0
min
IV access +
Bloods
Cardiac + Lung
Echo (1ST
)
Training at the lung function lab.
First set of Volume , IOS and DLCO
measurements
Self-administered Dyspnoea questionnaire
Seated position Administration of 15 ml/Kg of study fluid (randomly) at 100 ml/minute (10 minutes).
Fluid and IV tubing covered in opaque sleeve
T= 10 min
T= 30 min
Cardiac + Lung
Echo (2ND
)
Self-administered Dyspnoea questionnaire
T= 40
min
2nd set of
Volume, IOS &
DLCO
measurements
T= 60 min
T= 85 min
Self-administered Dyspnoea questionnaire
T= 100 min
NIBP,HR,Spo2
NIBP, HR, SPO2
Cardiac + Lung
Echo (3rd
)
NIBP, HR, SPO2
NIBP, HR, SPO2
0.9% saline; 4% albumin; 5%Dextrose
Cardiac + Lung
Echo (4th)
Bloods
Seated position
Administration of 15 ml/Kg of study fluid (randomly) at 100 ml/minute (10 minutes).
Fluid and IV tubing covered in opaque sleeve

Fluid bolus
215
5.4.1.1 Respiratory measurement: Respiratory measurements were
made in a specific sequence with respiratory resistance followed by
slow and forced spirometry, single breath gas diffusing capacity and
body plethysmography lung volumes before and after fluid
administration. Respiratory resistance and reactance
measurements were made by the impulse oscillometry method
(CareFusion Jaeger Masterscreen IOS, CareFusion Germany 234
GmbH). Measurements were made during 30 seconds quiet tidal
breathing, with cheeks supported, to obtain approximately 100
impulses. Tidal breathing was free of artefact, such as swallowing
or glottic closure, and coherence was greater than 0.7 at 5 Hz and
0.9 at 20 Hz. Measurements were made in triplicate before and
after intervention. Respiratory resistance and reactance
measurements are the mean of the 3 measurements and represent
the average from over 300 pulses during the tidal breathing cycle.
Spirometry measurements were made on the same CareFusion
Jaeger Mastersreen system. Slow spirometry measurements were
made in duplicate with vital capacity (VC) repeatable within 150
mls. Forced spirometry measurements were made complying with
ATS/ERS guidelines for test acceptability and repeatability. The
best FEV1 and FVC measurements from each measurement session
are reported. Diffusing capacity was measured using the single
breath method (CareFusion Jaeger, Masterscreen PFT), corrected for
haemoglobin, and adhering to the ATS/ERS Guidelines for test
performance (Wanger et al. 2005; Macintyre et al. 2005; Miller et al.

Fluid bolus
216
2005). In all cases at least 2 measurements were made, repeatable
to within 1.0 ml/min/mmHg. Total lung capacity (TLC) was
measured by body plethysmography on the same system. Intra
thoracic gas volume (ITGV) was estimated with supported cheeks at
a breathing frequency of 15 to 20 breaths per minute. At least 3
measurements were obtained within 5% and TLC calculated from
ITGV plus inspiratory capacity (IC). Residual volume (RV) was
calculated as TLC – VC.
Oscillometry parameters dX/dV (Delta reactance/delta lung volume)
was derived from the average change in reactance at 5 Hz divided by
the average change in tidal volume during a 30 second period of
tidal breathing. Similarly, dX/dflow (Delta reactance/delta flow
rates) was derived from the average change in reactance at 5Hz
divided by average expiratory tidal flow during the same period of
tidal breathing.
All measurements of spirometry, diffusing capacity and total lung
capacity were made according to the ATS/ERS guidelines for the
individual measurements and were made by experience laboratory
scientific staff with in excess of 10 years’ experience and holding the
Certified Respiratory Function Scientist Credential from the
Australian and New Zealand Society of Respiratory Science. They
were blinded to the type of the administered fluid on the study day.
All the subjects underwent training in the respiratory function
laboratory before the study day.

Fluid bolus
217
5.4.1.2 Cardiac and lung ultrasound: A Sonosite M-Turbo®
ultrasound machine with phased array (1 to 5 MHz) transducer was
used for echocardiographic assessments. Subjects were assessed in
the supine position. Screening echocardiography was done before
the study to rule out any major cardiac abnormality, also left
ventricular out flow tract (LVOT) diameter was measured for
calculating cardiac outputs on the study day. A single experienced
person performed all the cardiac and lung ultrasound for the study
and he was blinded to the type of administered fluid.
Lung ultrasound: Lung ultrasonography was performed before, half
way, at the end of the infusion and 1 hour after the end of the
infusion (Figure 5.14). It was performed along the posterior, middle
and anterior axillary lines, and along the mid-clavicular and
parasternal lines at the 2nd to 5th intercostal spaces bilaterally,
specifically looking for B-lines. Performing echo scanning (right and
left hemithorax, from the second to fourth intercostal spaces, from
the parasternal to midaxillary lines), an individual patient comet
score was obtained by summing the number of comets in each
scanned space. A patient score was obtained by summing the
number of B lines from each of the scanning spaces in the anterior
right and left chest, from the second to fifth intercostal spaces.
Cardiac ultrasound measurement: Echocardiographic measurement
of left ventricular outflow tract (LVOT) velocity time integral (VTI),
inferior vena cava (IVC) size/variability, mitral inflow Doppler, and
left ventricular annular tissue Doppler (both septal and lateral wall)

Fluid bolus
218
were performed prior to, half way and at the end of the fluid bolus
administration and 1 hour after cessation. Each measurement was
made four times and an average was used for the study. A ratio of
mitral inflow Doppler E wave and A wave was calculated. Similarly
the ratio between the mitral E wave and tissue Doppler E’ wave was
also calculated. ICV variability was calculated as (IVC maximum
diameter – IVC minimum diameter) / IVC maximum diameter.
Cardiac output was calculated from the calculation from LVOT VTI
and LVOT diameter.
Non-invasive blood pressure (NIBP), heart rate and SpO2 were
measured prior to, half way and at the end of the fluid bolus
administration and 1 hour after cessation (CASMED 740.vital sign
monitor). Each measure was taken in triplicate and an average of
the three was used in the study. A modified Borg’s dyspnoea scale
(Kendrick et al. 2000) was use to assess breathlessness in the
volunteers. It was self-administered prior to, half way and at the end
of the fluid bolus administration and 1 hour after cessation.
5.4.1.3 Blood samples were also taken before and after fluid
administration. Serum electrolytes were measured with an indirect
ion selective electrode technique. Serum albumin was measured
with a colorimetric method (Bromocresol Purple). Haemoglobin was
measured spectrophotometrically using the Cyan-Met Haemoglobin
method and haematocrit was a calculated value from the red blood
cell count and the mean cell volume. Angiopoietin 2 was measured
using a commercially available kit, as per the manufactures

Fluid bolus
219
instructions (R&D Systems, MN). N-terminal pro B-type natriuretic
peptide (NT pro BNP) was measured with electrochemiluminescence
immunoassay (Cobas e immunoassay analysers). Blood volume at
time 0 was estimated according to the method described by Nadler
et al. (Nadler et al. 1962). Calculations for changes in blood volume
and extravascular fluid volume were based on changes in
haematocrit and body weight and were made using the formula
described previously (Lobo et al. 2010; Chowdhury et al. 2012).
Participants were permitted to pass urine as needed and, in all
cases, at the end of the study. The time of each micturition was
noted.
5.4.1.4 Statistical analysis: Data are reported as means with SD, or
median with IQR, as appropriate for the distribution of each
variable. Analysis was performed using SPSS version 22.0 (SPSS
Inc.). Differences between variables over time were analysed by a
repeated-measures analysis of variance (ANOVA) and the effect of
the fluid was analysed as an interaction effect. Correlations was
analysed using the Pearson correlation coefficient (r). The effect of
individual fluid in the subjects wan analysed with paired t test. A
conventional alpha level of < 0.05 was used for all significance
testing.
Fluid bolus
220
5.4.2 RESULTS
The median (IQR) age of the healthy volunteers (n=4) was 34 (25-37)
years, weight was 80 (67-84) kg and height was 180.4 (173.0-188.7)
cm, and all completed all arms of the study. None of the volunteers
reported dyspnoea (modified Borg scale score of 0) at half way (15
ml/kg) with any of the fluids. One of the 4 volunteers reported slight
breathlessness immediately after infusion of 0.9% saline (modified
Borg scale score of 2) but it returned to baseline (modified Borg
scale score of 0) after the recovery period.
5.4.2.1 Changes in the haemodynamic parameters
None of the administered fluids led to a change in the blood
pressure or SpO2. While the heart rate was unchanged with 4%
albumin and 5% glucose, there was a decrease in the heart rate
with 0.9% saline administration (Table 5.8).

Fluid bolus
221
Table 5.8: The effect of fluid boluses in hemodynamic parameters and lung ultrasound “ B lines” before, halfway, at the end and 1 hour after completion of the fluid bolus.
5.4.2.2 Changes in lung function
The administration of 4% albumin resulted in both a greater
increase in estimated blood volume and diffusion capacity (corrected
for alveolar volume), and a fall in FVC, FEV1 and FRC consistent
with an increase in pulmonary blood volume, whereas 0.9% saline
administration led to an increase in airway resistance at 5 Hz
(p=0.03). There was also a decrease in dX/dflow with administration
of 0.9% saline. There were no changes to lung function with
administration of 5% glucose. (Table 5.9 )
Before Half End Recovery
0.9% Saline P
Cardiac output (L/min)
5.03 ± 0.8
4.26(0.76) 4.7 ± 0.9 4.48(1.10) 0.12
MAP(mm Hg) 98(6) 101(6) 102(5) 97(7) 0.44
HR (beats /mt) 82(17) 65(8) 64(5) 65(7) 0.04
Lung USG “B” lines 0 ± 0 6.7(9) 12.5 ± 7
11(16) 0.01
5% Glucose P
Cardiac output (L/min)
4.71± 0.4
4.65(0.45) 4.55± 0.6 4.70(1.14) 0.52
MAP(mm Hg) 92(8) 95(8) 101(5) 99(1) 0.18
HR (beats/mt) 70(14) 66(8) 68(15) 74(7) 0.38
Lung USG “B” lines 0.07± 0.15
2(2) 4.7± 6.6 3(6) 0.28
4% Albumin P
Cardiac output (L/min)
4.75± 0.7
4.85(0.66) 5.31± 0.6
5.17(0.73) 0.39
MAP(mm Hg 98(9) 97(7) 95(9) 96(3) 0.79
HR (beats/mt) 78(19) 76(17) 76(19) 73(15) 0.44
Lung USG “B” lines 0 ± 0 0(0) 0.30 ± 0.5 0(0) 0.39

Fluid bolus
222
5.4.2.3 Changes in lung ultrasonography
Administration of 0.9% saline led to an increase in lung B-lines
(p=0.02) which persisted through to the recovery lung
ultrasonography. There was no statistically significant difference in
B lines with administration of 4% albumin or 5% glucose. (Table
5.9)
5.4.2.4 Changes in cardiac ultrasound
None of the fluids led to a change in cardiac output (measured with
LVOT VTI) or IVC parameters. Administration of 4% albumin led to
an increase in mitral inflow E, and E/E’ septal/lateral ratio
suggesting an increase in pulmonary venous pressure. (Table 5.10)
5.4.2.5 Changes in blood parameters
Administration of 4% albumin led to a rise in NTproBNP, as well as
the greatest observed decrease in haematocrit (greatest rise in
estimated blood volume), with a simultaneous rise in serum
albumin and a decrease in serum ionized calcium (corrected for pH).
Administration of 0.9% saline led to a decrease in haematocrit and
serum albumin, and an increase in serum chloride. Further, 0.9%
saline also led to a rise in plasma angiopoietin 2 (corrected for blood
volume) suggesting an inflammatory effect. Administration of 5%
glucose led to a decrease in serum albumin, sodium and chloride,
with no change in NTproBNP or Ang2. (Table 5.11 )

Fluid bolus
223
The estimated change in blood volume was greatest with 4%
albumin, followed by 0.9% saline then 5% glucose. There was a
positive correlation between delta blood volume and cardiac output
(r2=0.43, p<0.01). However, cardiac output was only increased when
the increase in delta volume exceeded 1 litre. (Figure 5.15)
Table 5.9: Effect of fluid boluses on the respiratory parameters.
0.9% Saline (30ml/Kg) 5% Glucose (30ml/Kg)
4% Albumin (30ml/Kg)
P value #
Before After P* Before After P* Before
After P*
Lung B-lines (ultrasound)
0 ± 0 12.5 ± 7
0.01
0.07± 0.15
4.7± 6.6
0.21
0 ± 0 0.30 ± 0.5 0.39
0.02
Airway resistance 5 Hz (kPa/(L/s))
0.3± 0.1
0.4 ± 0.1
0.05
0.3± 0.1
0.3± 0.1
0.7 0.3± 0.1
0.3± 0.2 0.09
0.03
DLCO (Alveolar volume) Ml/min/mmHg/L
4.8 ± 0.6
5.2 ± 0.4
0.06
4.9± 0.3
5.0± 0.6
0.38
4.8± 0.6
5.6± 0.6
0.01
0.04
FVC (L) 5.29± 1.5
5.17± 1.6
0.08
5.30± 1.6
5.28±
1.7
0.83
5.32± 1.6
5.01± 1.7
0.04
0.04
FRC (L) 3.9 ± 1.3
3.8 ± 1.4
0.38
3.8± 1.3
3.7± 1.2
0.07
3.7± 1.1
3.3± 0.9
0.05
0.03
FEV1(L) 4.06± 1.4
4.00± 1.4
0.43
4.05± 1.3
3.97±
1.3
0.11
4.13± 1.5
3.81± 1.6
0.04
0.03
PEFR (L/S) 10.05±2.2
9.29±2.5
0.02
10.2±2.4
10.2±2.3
0.99
10.4±2.3
9.4±2.9 0.11
0.07
dX/dFlow 5 Hz kPa/(l/s)
0.04± 0.02
-0.04 ±0.03
0.01
-.03± 0.06
0.00±
0.03
0.39
0.01±0.02
0.02± 0.03
0.82
0.01
0.9% saline lead to increase in lung ultrasound B lines and distal airway resistance and with a decrease in lung reactance (corrected for flow) while 4% albumin lead to decrease in FVC, FRC and FEV1 and increase in DLCO(corrected for alveolar volume).
Data presented as mean ± sd * Paired t test , # ANOVA with fluid interaction

Fluid bolus
224
Table 5.10: Effect of fluid boluses on the cardiac echocardiographic
parameters.
4% albumin leads to increase in mitral inflow Doppler E waves and E/E’ ratio. None of the
fluids lead to change in cardiac output, LVOT VTI or IVC parameters.
Data presented as mean ± sd * Paired t test , # ANOVA with fluid interaction
0.9% Saline (30ml/Kg) 5% Glucose (30ml/Kg)
4% Albumin (30ml/Kg)
P value
#
Before After P* Before After P* Before After P*
Cardiac output (L/min)
5.03 ± 0.8
4.7 ± 0.9
0.29
4.71± 0.4
4.55± 0.6
0.71
4.75± 0.7
5.31± 0.6
0.30 0.24
LVOT VTI (cm)
16.1± 2.2
18.5± 2.9
0.09
17.9± 2.6
17.7± 1.1
0.81
16.2± 1.8
19.2± 2.1
0.12 0.17
IVC max diameter (cm)
1.5 ± 0.4
1.5 ± 0.5
0.88
1.6± 0.4
1.8± 0.4
0.28
1.7± 0.5
2.0± 0.6
0.11 0.65
Mitral E (cm/s)
62.3± 10.8
71.6± 6.7
0.09
62.4± 11.6
68.8± 9.4
0.08
56.7± 8.4
89.1± 7.9
0.01 0.003
E/E’ (Lateral)
3.7 ± 1.3
4.3 ± 2.9
0.2 5.3± 0.9
5.6± 0.8
0.14
5.4± 0.7
8.2± 0.4
0.003
0.006
E/A 1.4± 0.1
1.7± 0.4
0.23
1.5± 0.1
2.0± 0.2
0.08
1.6± 0.2
2.4± 0.5
0.07 0.30
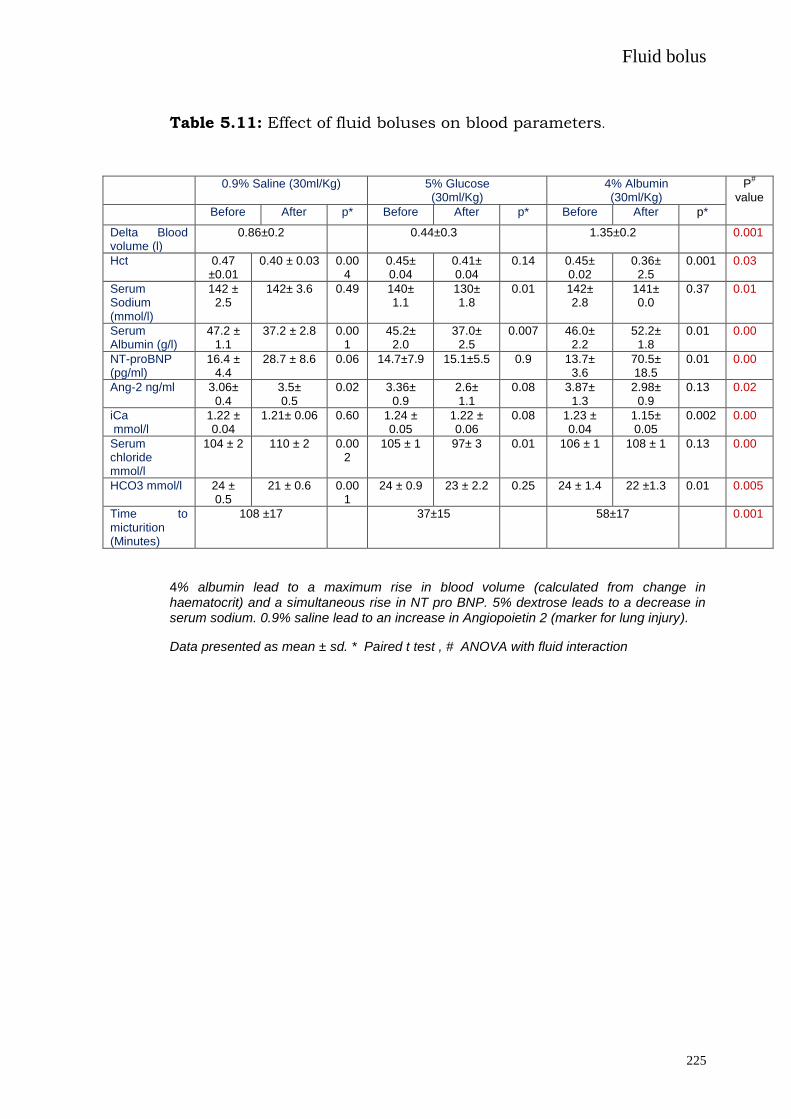
Fluid bolus
225
Table 5.11: Effect of fluid boluses on blood parameters.
0.9% Saline (30ml/Kg) 5% Glucose (30ml/Kg)
4% Albumin (30ml/Kg)
P#
value
Before After p* Before After p* Before After p*
Delta Blood volume (l)
0.86±0.2 0.44±0.3 1.35±0.2 0.001
Hct 0.47 ±0.01
0.40 ± 0.03 0.004
0.45± 0.04
0.41± 0.04
0.14 0.45± 0.02
0.36± 2.5
0.001 0.03
Serum Sodium (mmol/l)
142 ± 2.5
142± 3.6 0.49 140± 1.1
130± 1.8
0.01 142± 2.8
141± 0.0
0.37 0.01
Serum Albumin (g/l)
47.2 ± 1.1
37.2 ± 2.8 0.001
45.2± 2.0
37.0± 2.5
0.007 46.0± 2.2
52.2± 1.8
0.01 0.00
NT-proBNP (pg/ml)
16.4 ± 4.4
28.7 ± 8.6 0.06 14.7±7.9 15.1±5.5 0.9 13.7± 3.6
70.5± 18.5
0.01 0.00
Ang-2 ng/ml 3.06± 0.4
3.5± 0.5
0.02 3.36± 0.9
2.6± 1.1
0.08 3.87± 1.3
2.98± 0.9
0.13 0.02
iCa mmol/l
1.22 ± 0.04
1.21± 0.06 0.60 1.24 ± 0.05
1.22 ± 0.06
0.08 1.23 ± 0.04
1.15± 0.05
0.002 0.00
Serum chloride mmol/l
104 ± 2 110 ± 2 0.002
105 ± 1 97± 3 0.01 106 ± 1 108 ± 1 0.13 0.00
HCO3 mmol/l 24 ± 0.5
21 ± 0.6 0.001
24 ± 0.9 23 ± 2.2 0.25 24 ± 1.4 22 ±1.3 0.01 0.005
Time to micturition (Minutes)
108 ±17 37±15 58±17 0.001
4% albumin lead to a maximum rise in blood volume (calculated from change in haematocrit) and a simultaneous rise in NT pro BNP. 5% dextrose leads to a decrease in serum sodium. 0.9% saline lead to an increase in Angiopoietin 2 (marker for lung injury).
Data presented as mean ± sd. * Paired t test , # ANOVA with fluid interaction

Fluid bolus
226
Figure 5.15: Change in cardiac output with increase in blood
volume in the healthy volunteers
5.4.3 DISCUSSION
The major finding of our study is that in healthy subjects’
administration of 30ml/kg of 0.9% saline leads to interstitial lung
oedema, evidenced via lung B lines, and an increase in airway
resistance despite unchanged cardiac echocardiography. It also
leads to a rise in plasma angiopoietin 2 suggesting an inflammatory
effect of its administration. In comparison, administration of an
equivalent volume of 4% albumin resulted in a greater increase in
estimated blood volume, increase in diffusion capacity (corrected for
alveolar volume) and a fall in FVC and FRC consistent with an
increase in pulmonary blood volume. Lung ultrasound B-lines were
unchanged despite changes in the echocardiographic parameters
mitral inflow E, and E/E’ ratio suggesting an increase in pulmonary
venous pressure. Evidence of increased blood volume and increased

Fluid bolus
227
cardiac stretch is also evident from a rise in NTproBNP after
administration. Such differences may have direct clinical relevance
when these fluids are used as boluses in a patient population.
Dose of fluids used in the study:
Rapid intravenous infusion of 20 ml/kg saline does not impair
resting pulmonary gas exchange in the healthy human lung as
measured by the multiple inert gas elimination technique (Prisk et
al. 2009), nor is there any change in lung density when analysed
with magnetic resonance imaging (Henderson et al. 2012). We chose
30 ml/kg as previously 0.9% saline at this dose has altered lung
volumes measurement (Muir et al. 1975; Robertson et al. 2004) and
caused mild airflow obstruction and enhanced airway
responsiveness (Pellegrino et al. 2003).
Changes with 0.9% saline
Rapid intravenous infusion of an iso-smotic solution, such as 0.9%
saline, is expected to result in fluid filtration and leakage from both
pulmonary and bronchial vessels (Wagner 1997; Wagner et al.
1996). We found that administration of 0.9% saline led to interstitial
oedema as evidenced by an increase in lung ultrasound B lines, as
well as a decrease in lung impedance (corrected for flow). Similar
findings have been previously described on chest X-ray (Farney et
al. 1977) but although our finding of no changes in the diffusion
capacity has been reported before (Puri et al. 1999; Robertson et al.

Fluid bolus
228
2004), we did not find any dynamic changes in the measurement of
lung volumes as previously described. As our protocol involved
simultaneous echocardiographic measurement, there was a delay in
performing the post infusion lung volumes which may have different
if the test was performed earlier. We didhow ever find an increase in
airway resistance at 5 Hz (distal airway) which supports the
previous finding of an increase in airway wall oedema encroaching
on the bronchial lumen (Pellegrino et al. 2003). Resistance values
obtained by IOS at low frequency (R5rs) are reproducible and
correlate well with spirometry and plethysmographic values
(Olaguibel et al. 2005).
A 44% increase in the thickness of the airway wall, consistent with
peribronchiolar oedema formation has been reported before in
healthy subjects (King et al. 2002). Peripheral airways in the lung
parenchyma lie within bronchovascular sheaths that also contain
branches of the pulmonary vasculature and lymphatics. Several
authors have proposed that the initial increase in airway resistance
observed in experimentally induced pulmonary oedema is secondary
to distension of the pulmonary veins within bronchovascular
sheaths, with subsequent compression of the smaller peripheral
airways (Millic-Emili et al. 1971; Hogg et al. 1972; Staub et al. 1967)
but as the FEV1 and PEFR, are largely determined by the calibre of
the larger airways they were not affected by rapid infusion of 0.9%
saline in normal subjects. In addition, morphometric studies have
failed to show any reduction in the calibre of airways in

Fluid bolus
229
experimental pulmonary oedema (Michel et al. 1987). Moreover we
had evidence of lung B lines 1 hour after infusion of 0.9% saline
suggesting a slow reabsorption of the interstitial oedema again
confirming reports of slow clearance of 0.9% saline (Drummer et al.
1992). This is also corroborated by the fact that the time to
micturition was maximal with 0.9% saline, a finding similar to that
reported by Chowdhury et al. (Chowdhury et al. 2012).
Another important finding in our study is the rise of angiopoietin-2
with administration of 0.9% saline. This is not directly explained or
described before. Angiopoietin-2 is an endothelial marker of lung
injury and is lowered during conservative fluid therapy which in
turn is associated with better outcomes in acute lung injury
(Terpstra et al. 2013; Agrawal et al. 2013; Calfee 2012).
Angiopoietin-2 is stored in the Weibel–Palade bodies (endothelial
storage vesicles) (Romani et al. 2003) and its rise after
administration of 0.9% saline suggests active signalling pathways
leading to degranulation of Weibel–Palade bodies and a pro-
inflammatory nature of 0.9% saline when administered as a bolus.
It is noteworthy that angiopoietin-2 sensitizes the endothelial cell to
the inflammatory actions of TNF-α thus further perpetuating
inflammation (Fiedlet et al. 2006) and its regulation is flow
dependent (Goettsch et al. 2008). Moreover, 0.9% saline also led to
an increase in serum chloride levels which has been previously
reported in healthy volunteers (Chowdhury et al. 2012; Ried et al.
2009) and critically ill patients (Yonus et al. 2011). Chloride
Fluid bolus
230
transport-driven alveolar fluid secretion is now considered a major
contributor to lung oedema (Solymosi et al. 2013), and a transient
rise in serum chloride levels after 0.9% saline administration may
expedite this process.
Changes with 4% albumin
Administration of 4% albumin led to an anticipated increase in
blood volume. There was also a simultaneous increase in the mitral
inflow doppler and E/E’ ratio. Such an increase in E velocity and
E/E’ has been correlated with an increase in pulmonary capillary
wedge pressure. The levels reported by us have been correlated with
a PCWP (mm Hg) of 20 mm Hg (Firstenberg et al. 2000) though the
fluid used in that study was 0.9% saline instead of 4% albumin. As
far as we are aware there is no similar data addressing the effect of
administration of 4% albumin in healthy volunteers. Another
indicator of increased blood volume and dilation of the cardiac
chambers comes from the rise in NT proBNP with administration of
4% albumin. The decrease in lung volume with its administration
can be explained by the rise in intra-thoracic blood volume leading
to compression of the lungs and the resultant decrease in volumes.
This is also corroborated by the rise in diffusion capacity of carbon
monoxide (corrected for blood volume), which is well described in
other conditions with increased intra thoracic blood volume
(Addleman et al. 1985). Despite evidence of dilation of cardiac
chamber and a rise in pulmonary artery wedge pressure, there was

Fluid bolus
231
no evidence of interstitial oedema with 4% albumin with absence of
B lines.
There could be several counter-regulatory effects of administration
of 4% albumin on the development pulmonary oedema. Though it
did lead to an increase in pulmonary pressure and hence should
have increased the net filtration of fluid into the interstitium, it also
led to a simultaneous increase in serum albumin which in turn will
increase in the colloidal osmotic pressure in part negating the effect
of rise in pressure. The effect of the glycocalyx on fluid dynamics
has led to a revision of the Starling equation, and albumin plays an
important role in the modified Starling equation (Woodcock et al.
2012; Alphonsus et al. 2014). The rise of NT-proBNP with 4%
albumin may lead to disruption of the endothelial glycolcalyx and
enhanced vascular permeability (Bruegger et al. 2005; Jacob et al.
2013), even though this effect might be more systemic and not
pulmonary (Zimmerman et al. 1990). In addition, albumin is
protective to the glycocalyx structure, improves endothelial integrity
(Jacob et al. 2009; Stevens et al. 2007), is a specific inhibitor of
endothelial apoptosis (Zoellner et al. 1996) and also leads to release
of endothelial derived relaxation factor (Kaufmann et al. 1995)
leading to vasodilation and a decrease in shear force.
The adverse effects of an increase in pulmonary pressures is
mediated via entry of intra-cellular calcium ions (Kuebler et al.

Fluid bolus
232
1999; Ichimura et al. 2003), but as seen in this study, bolus 4%
albumin leads to a decrease in the ionized calcium levels. The
decrease in calcium level is likely due to binding of free calcium with
the administered albumin which does not contain any calcium.
This decrease in calcium has been seen in patients with septic
shock (Section 5.2) and in hypovolemic trauma patients who also
had multiple blood transfusions (Kovalik et al. 1981). One of the
major pathways of lung injury is entry of calcium via endothelial
channels and a transient drop in calcium may impede this process.
Of note, calcium free perfusate is often used in isolated perfused
lung injury models as a negative control (Kuebler et al. 1999).
Effect of 5% glucose
Administration of 5% glucose did not cause any major cardio-
respiratory changes, as anticipated, except for decrease in serum
sodium and chloride levels, as it would be distributed in all the
compartments of the body,
Change in cardiac echocardiographic variables
Previous studies have shown an increase in cardiac output with
infusion of 0.9% saline (Muir et al. 1975), but unexpectedly we did
not find any increase in cardiac output with any of the fluids. Our
measures of cardiac output were based on the echocardiography
measurement of the left ventricular outflow tract velocity time
integral (averaged over 4 measurements) and were not continuous.

Fluid bolus
233
Even though we found a positive correlation between the delta blood
volume and the cardiac output, the increase in cardiac output was
only present when the increase in blood volume was more than 1
litre. Similarly we did not find any changes in the IVC maximum
diameter or its variability. IVC variability has only been shown to
have a weak correlation with simulated hypovolemia in healthy
volunteers (Moore et al. 2010) and, despite its validation in
ventilated patients (Barbier et al. 2004; Feissel et al. 2004), it has
not been validated in healthy human volunteers with fluid
administration. However, we did find an increase in mitral E wave,
and E/E’ ratio, and levels seen in our study have been shown to
correlate with increased pulmonary artery wedge pressure
(Firstenberg et al. 2000 ). Doyle et al. (Doyle et al. 1951) also have
reported a similar finding of an increase in pulmonary arterial and
pulmonary capillary pressure with infusion of saline in healthy
subjects but with a variable response in the cardiac output to the
intravenous infusions.
Validation of lung ultrasonography B lines for interstitial pulmonary
oedema:
Lung ultrasound B-lines have been correlated with lung weight and
density determined by computerised tomography (Baldi et al. 2013)
and with wedge pressure and extravascular lung water (Agricola et
al. 2005). They have satisfactory intraobserver and interobserver
variability, around 5% and 7%, respectively (Jambrik et al. 2004). B-
line resolution appears to occur in real-time as fluid is removed

Fluid bolus
234
from the body. These data support lung ultrasound as a useful
method for evaluating real-time changes in extra-vascular lung
water and in assessing a patient's physiologic response to fluid
administration (Noble et al. 2009).
5.4.4 LIMITATIONS
This study should be viewed in light of several limitations
1. The number of subjects examined in our study was small
(n=4). But as each subject was studied with 3 different fluids,
they served as their own internal control providing validity to
our data
2. Measurement error: Even though a strict protocol was utilised
for the study and the measurements were made as per
international standards and the person making those cardiac
and lung measurement were blinded to the type of fluid
utilised, we cannot rule out obscure sources of measurement
errors
3. Long terms effects of these fluids on the cardiac respiratory
systems are not known as the last measurements were made
at the end of 1 hour after the fluid bolus. However, none of
the subjects reported any episodes of dyspnoea for the next
24 hours after the fluid bolus with any of the fluids.
4. The effect of such fluid boluses on other organs such as the
kidney are not known as it was not the focus of this study
5. This study did not examine the effect of a chloride balanced
fluid and this should be area of future research.

Fluid bolus
235
5.4.5 SUMMARY
In healthy volunteers 0.9% saline and 4% albumin solutions have
differential pulmonary effects not obviously attributable to passive
fluid filtration. Compared with other fluids 0.9% saline leads to
interstitial oedema whereas 4% albumin does not cause pulmonary
oedema even though there was evidence of hypervolemia. This may
reflect either differential effects of these fluids on active signalling in
the pulmonary circulation, or a protective effect of albumin. This
needs to be explored in future studies.

Effect of serum sodium and osmolality on lung injury
236
CHAPTER 6: EFFECT OF SERUM SODIUM AND OSMOLALITY ON
LUNG INJURY
6.1 Admission high serum sodium is not associated with
increased ICU mortality risk in respiratory patients
Hypernatremia is a serious electrolyte disturbance, which presents
an independent risk factor for mortality in critically ill patients
(Darmon et al. 2013; Palevsky et al. 1996; Lindner et al. 2007; Funk
et al. 2010; Stelfox et al. 2008; Vandergheynst et al. 2013). High
serum sodium leads to high serum osmolarity, which may alter the
distribution of water between the extracellular and intracellular
compartments, and cause intracellular dehydration potentially
leading to adverse outcomes. However, there is experimental data to
suggest that hyperosmolarity suppresses lung injury (Rabinovici et
al. 1996; Pascual et al. 2003; Rizoli et al. 1998). The postulated
mechanisms include expression of endothelial leukocyte adhesion
molecules (Rizoli et al. 1998; Ochi et al. 2002), blockade of
proinflammatory effects of lipopolysaccharide (Rabinovici et al.
1996; Ochi et al. 2002) and the effect of hyperosmolarity on
remodelling of both the endothelial barrier and the actin
cytoskeleton, to enhance barrier properties, and blockade of
proinflammatory P-selectin expression (Safdar et al. 2003).
It was hypothesised that lung protective effects of hypernatremia
would reduce its general adverse effects leading to amelioration of

Effect of serum sodium and osmolality on lung injury
237
the increase in mortality risk. As no clinical studies have examined
this question we interrogated a large administrative data base.
6.1.1 Methods
6.1.1.1 Study design
A retrospective cohort design to evaluate the association between
both the lowest and highest recorded serum sodium in the first 24 h
of ICU admission and ICU and hospital mortality among all adult
patients. Ethics approval was obtained from Southern Adelaide
Human Research Ethics Committee South Australia (#118.12).
6.1.1.2 Patients
All patients with valid sodium data admitted to an adult ICU at one
of 129 centres in Australia and New Zealand, and more than equal
to 16 years of age, were eligible for inclusion in this study. We
excluded patients with missing mortality data and data required to
calculate an illness-severity-adjusted risk of death, or if their length
of stay in ICU was less than 4 hours or if they were transferred to
another ICU. Where patients were admitted to ICU more than once
during a hospital admission, only the patient’s first admission was
included in the analysis.
6.1.1.3 Database
Data was extracted from the Australian and New Zealand Intensive
Care Society Adult Patient Database (ANZICS–APD) (Stow et al.
2006). Data are collected under the Quality Assurance Legislation of

Effect of serum sodium and osmolality on lung injury
238
the Commonwealth of Australia (Part VC Health Insurance Act
1973, Commonwealth of Australia) which allows use of data for
research purposes without individual patient consent or specific
ethical approval. In New Zealand, use of anonymous quality data for
research is classified as ‘low risk audit activity’ and is exempt from
requirements for formal ethics approval.
6.1.1.4 Data extraction and categorisation
Data from January 2000 to December 2010 was reviewed. The
following variables were extracted from the databases: age, sex,
chronic co-morbidities, physiological measures in the first 24 hours
including highest and lowest serum sodium, ICU admission
diagnosis, admission source for hospital and ICU, hospital level,
location and care type, year and month of admission, ICU and
hospital mortality and illness severity determined using the
APACHE III risk prediction model. Patients were further categorised
into respiratory, medical, surgical, cardiac, neurological, liver,
infection, ventilated (invasive) and non-ventilated categories using
APACHE III codes.
6.1.1.5 Outcome
The study was designed to investigate the effect of high admission
serum sodium on ICU mortality independent of illness severity in
patients with or without a respiratory diagnosis admitted to ICU. To
investigate severity of lung disease, respiratory patients were
Effect of serum sodium and osmolality on lung injury
239
stratified by a PaO2/FiO2 ratio less than or greater than 200.
Primary outcome was ICU mortality, with analysis adjusted for
illness severity (APACHE III risk of death with the serum sodium
component removed) and year of admission. Similar analysis on
hospital mortality was also done.
6.1.1.6 Statistical Analysis
All analyses were performed using SAS version 9.2 (SAS Institute
Inc.,Cary,NC,USA). Continuously normally distributed variables
were compared using student t-tests and presented as mean
(standard deviation) while non-normally distributed variables are
compared using Wilcoxon Rank Sum tests and presented as
medians (interquartile range). Categorical variables were compared
using chi-square tests for equal proportion and are reported as
counts and percentages. The nature of the relationship between ICU
mortality and serum sodium was determined using logistic
regression with sodium treated as a categorical variable divided into
increments of 5 mmol. Multivariate models were adjusted for centre,
year of admission, patient severity and each patient’s propensity to
be admitted with a respiratory diagnosis. To account for a measure
of illness severity that was independent of sodium, an APACHE III
risk of death score was generated with the serum sodium
component removed. To account for potential imbalances between
patient’s presenting with a respiratory diagnosis and those without,
each patient was assigned a propensity score (probability of having

Effect of serum sodium and osmolality on lung injury
240
a respiratory diagnosis) by fitting a logistic regression model with
respiratory diagnosis as the outcome. Model construction was made
using a stepwise selection procedure (inclusion criteria p<0.01) with
the following variables considered for inclusion: admission source
for hospital and ICU, hospital level, location and care type, year and
month of admission, age, gender and chronic comorbidities. Results
are presented as odds ratios (OR) (95% confidence intervals; CI)
referenced against an approximate normal range of 135 -144.99
mmol. To ascertain if the nature of the relationship between sodium
and ICU mortality statistically differed in patients with a respiratory
diagnosis compared to all others, an interaction term was fitted to
the logistic regression model between sodium and respiratory
diagnosis. Similar interaction variables were fitted among patients
with admission PaO2/FiO2 ratio < 200 and those with the admission
ratio ≥200 in (i) all patients; (ii) all respiratory patients; (iii) all
mechanically ventilated patients. Furthermore, interaction models
were studied among (i) respiratory patients who were mechanically
ventilated with PaO2/FiO2 ratio < 200 within the first 24 hours of
admission and other respiratory patients; (ii) all patients who were
mechanically ventilated with PaO2/FiO2 ratio <200 within the first
24 hours of admission and other patients. To study the influence of
different hospital levels (rural, metropolitan, tertiary and private) on
study outcomes, additional sensitivity analysis was performed
stratifying the data by hospital level. A two-sided p-value of ≤0.05
was considered to be statistically significant.

Effect of serum sodium and osmolality on lung injury
241
6.1.2 RESULTS
Admissions included in the ANZICS–APD database were drawn from
129 hospitals (26% rural, 22% metropolitan, 24% tertiary and 28%
private). The majority of hospitals (61%) had less than 300 beds,
with 24% of hospitals having between 300 and 500 beds and 15%
having more than 500 beds.
Initial search of the database for the period 2000 to 2010 identified
510,362 subjects with recorded sodium measurements. Of these,
436,209 patients met screening criteria and were included in the
study (Figure 6.1). Table 6.1 presents patient characteristics as ICU
survivors and non-survivors.
Figure 6.1: Consort diagram of subjects examined in ANZICS–APD database study

Effect of serum sodium and osmolality on lung injury
242
Table 6.1: Characteristics and outcomes of patients classified as
ICU survivors and non-survivors (n=436,209)
ICU* survivors ICU* non-survivors p-value
Number (%) 401938 (92) 34271 (8)
Age, mean (SD†) 61.0 (18.3) 65.8 (16.6) <0.001
Male gender, number (%) 234939 (54) 201270 (46) 0.02
APACHE‡ II score, mean(SD
†) 15.3 (6.9) 27.7 (8.3) <0.001
APACHE‡ III score, mean(SD
†) 49.5 (23.9) 97.5 (32.5) <0.001
SAPS|| II, mean (SD
†) 29.3 (14.2) 56.6 (18.0) <0.001
APACHE‡ III risk of death, median (IQR
§) 4.3 (1.4-13.8) 58.6 (30.4-80.5) <0.001
ICU length of stay (hours,) median (IQR§) 44.7 (23.0-90.3) 62.3 (26.0–149.3) <0.001
* Intensive care;
† Standard deviation;
‡ Acute physiology and Chronic health evaluation;
§
Interquartile range; || Simplified acute physiology score
The number of patients in each serum sodium category and the raw
mortality rate for ICU are shown in Table 6.2. The odds ratio (95%
confidence interval) for both raw and adjusted ICU mortality
(severity of illness) referenced against a range of 135 -144.9 mmol
for highest and lowest serum sodium recorded in the first 24 hours
of ICU admission are also shown in Table 6.2. Overall, mortality risk
was U shaped at the extreme levels of dysnatremia. The highest
adjusted OR’s (95%CI) for ICU mortality for highest serum sodium (≥
160 mmol/L) and lowest serum sodium (115 -120 mmol/L) over the
24 hours post ICU admission were 4.2 (3.6-4.9) and 1.6 (1.4-1.8)
respectively (Figure 6.2).

Effect of serum sodium and osmolality on lung injury
243
Table 6.2: ICU mortality and raw and adjusted OR (95% CI) for
various serum sodium categories with reference to serum sodium of
135 -144.9 mmol for highest and lowest serum sodium in the first
24 hours of ICU admission
* Intensive care; † Odd’s ratio; CI, Confidence intervals
‡Adjusted for patient severity (APACHE-III with serum sodium component removed),
attending hospital, year of admission and propensity to present with a respiratory diagnosis
Admission serum sodium
(mmol/l)
Number ICU* mortality
%
OR†
(95% CI)
Adjusted OR‡
(95% CI)
Highest
<125 2042 13.3 2.42 (2.13-2.76) 2.07 (1.77-2.43)
125 -129.9 5046 16.5 3.12 (2.89-3.37) 1.83 (1.66-2.01)
130 -134.9 30695 10.6 1.88 (1.80-1.96) 1.33 (1.27-1.40)
135-144.9 348121 6.3 1 1
145 -149.9 41041 13.2 2.39 (2.30-2.47) 1.51 (1.45-1.58)
150 -154.9 6488 26.3 5.64 (5.31-5.98) 2.58 (2.39-2.78)
155 -159.9 1620 32.8 7.71 (6.93-8.57) 3.40 (2.97-3.89)
≥160 1156 32.5 7.60 (6.71-8.61) 4.17 (3.55-4.89)
Lowest
<120 2663 9.5 1.63 (1.43-1.86) 1.44 (1.23-1.68)
120 – 124.9 4126 16.8 3.14 (2.89-3.42) 1.58 (1.42-1.76)
125 – 129.9 15589 14.2 2.59 (2.47-2.72) 1.40 (1.32-1.49)
130 -134.9 82230 8.6 1.47 (1.43-1.52) 1.16 (1.12-1.20)
135-144.9 317733 6.7 1 1
145 -149.9 11859 17.4 3.28 (3.12-3.45) 1.75 (1.64-1.86)
≥150 2009 26.8 5.70 (5.16-6.31) 2.23 (1.97-2.53)
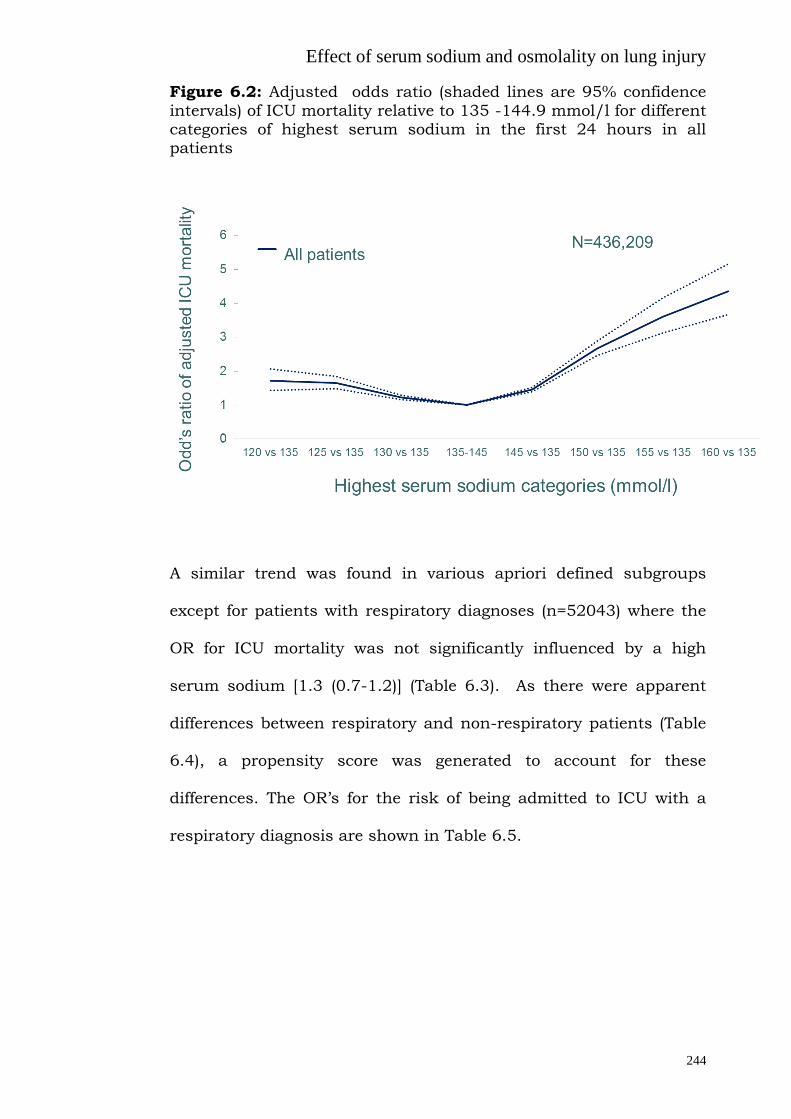
Effect of serum sodium and osmolality on lung injury
244
Figure 6.2: Adjusted odds ratio (shaded lines are 95% confidence
intervals) of ICU mortality relative to 135 -144.9 mmol/l for different categories of highest serum sodium in the first 24 hours in all patients
A similar trend was found in various apriori defined subgroups
except for patients with respiratory diagnoses (n=52043) where the
OR for ICU mortality was not significantly influenced by a high
serum sodium [1.3 (0.7-1.2)] (Table 6.3). As there were apparent
differences between respiratory and non-respiratory patients (Table
6.4), a propensity score was generated to account for these
differences. The OR’s for the risk of being admitted to ICU with a
respiratory diagnosis are shown in Table 6.5.
0
1
2
3
4
5
6
120 vs 135 125 vs 135 130 vs 135 135-145 145 vs 135 150 vs 135 155 vs 135 160 vs 135
A…All patients
Od
d’s
ratio o
f a
dju
ste
d I
CU
mo
rta
lity
Highest serum sodium categories (mmol/l)
N=436,209

Effect of serum sodium and osmolality on lung injury
245
Table 6.3: Serum sodium (highest in first 24 hours during an ICU admission) and adjusted ICU mortality for various diagnostic categories
Diagnostic category# Highest sodium
(mmol/L)
OR* (95%CI†)
Total
(n=436,209)
≥160 4.2 (3.6-4. 9)
Medical
(n=208,513)
Surgical
(n= 227,696)
≥160
≥160
2.7 (2.3-3.2)
14.7 (10.5-20.5)
Ventilated (Invasive)$
(n=194,503)
Non-ventilated $
(n=241,699)
≥160
≥160
5.8 (4.8-7.1)
2.1 (1.8-2.5)
Selected sub groups
Respiratory
(n=52043)
≥160 1.3 (0.7-2.2)
Cardiac
(n=25827)
≥160 2.3 (1.1-4.7)
Liver
(n=10115)
≥160 2.3 (1.2-4.2)
Neurological
(n=28663)
≥160 12. 8 (9.5-17.2)
Infection
(n=50211)
≥160 1.7 (1.1-2.5)
* Odd’s ratio;
†CI, Confidence intervals
$Total of ventilated and non-ventilated is 436,202 as there were small number of patients whose ventilation status was unknown # Based on APACHE III diagnostic codes

Effect of serum sodium and osmolality on lung injury
246
Table 6.4: Characteristics and outcomes of patients with non-
respiratory or respiratory admission diagnosis Non-
respiratory (n =384,166)
Respiratory (n=52043)
p-value
Age, mean (SD*) 61.4(18.2) 61.3 (17.8) 0.39
Male gender, number (%) 226,992 (59) 28193 (54) <0.001
APACHE† II score, mean (SD) 15.97 (7.73) 18.79 (7.87) <0.001
APACHE† III score, mean (SD) 55.48 (27.6) 61.41 (26.81) <0.001
SAPS ‡ II, mean (SD) 31.03 (16.3) 34.76 (15.6) <0.001
ICU§ LOS
|| (hrs), median (IQR
¶) 43.5 (22.5-86) 75.3 (38.7-160) <0.001
Physiological variables (first 24
hours)
Highest MAP**, mean (SD) 97 (87-108) 99 (90-110) <0.001
Highest heart rate, mean (SD) 100.1 (22.0) 113.4 (23.2) <0.001
Highest temperature (ºC), mean
(SD) 37.3 (0.8) 37.5 (0.9)
<0.001
Highest sodium (mmol/l), mean (SD) 139.9 (4.6) 139.8 (4.9) <0.001
Lowest sodium (mmol/l,) mean (SD) 136.9 (4.6) 136. 9 (5.1) 0.47
ICU mortality, number (%) 27623 (8.0) 6648 (13.0) <0.001
Chronic comorbidities at admission
Respiratory, number (%) 21025 (5.5) 14372 (27.6) <0.001
Cardiovascular disease, number (%) 47903 (12.5) 6032 (11.6) <0.001
Renal disease, number (%) 13968 (3.6) 1921 (3.7) 0.52
Immune suppressive disease,
number (%)
10802 (2.8) 3125 (6.0) <0.001
AIDS***, number (%) 88 (0.0) 60 (0.1) <0.001
Hepatic Failure, number (%) 1960 (0.5) 191 (0.4) <0.001
Lymphoma, number (%) 2961 (0.8) 606 (1.2) <0.001
Cirrhosis, number (%) 7312 (1.9) 768 (1.5) <0.001
* Standard deviation; † Acute physiology and chronic health evaluation;
‡ Simplified acute
physiology score; § Intensive care;
|| Length of stay;
¶ Interquartile range; **Mean arterial
pressure, ***Acquired immunodeficiency syndrome

Effect of serum sodium and osmolality on lung injury
247
Table 6.5: OR (95% CI) for the risk of being admitted to ICU with a respiratory diagnosis. The subsequent propensity score (predicted
risk of having a respiratory diagnosis) was then included as a covariate in the prediction of ICU mortality
ICU, Intensive care Unit; HDU, High dependency unit; ref, Reference; OT, operation theatre; ROC, Receiver operating characteristic.
Effect OR Effect OR
ICU source (ref= other Hospital) Month (ref=February)
Emergency 0.84(0.81-0.87) OT 0.02(0.02-0.02) Ward 1.31(1.26-1.37)
January 1.04(0.99-1.10) March 1.07(1.01-1.13) April 1.12(1.06-1.18) May 1.20(1.14-1.27) June 1.35(1.28-1.43) July 1.53(1.45-1.61) August 1.51(1.44-1.59) September 1.44(1.37-1.52) October 1.21(1.15-1.28) November 1.16(1.10-1.22) December 1.10(1.04-1.16)
Hospital Admission source (ref=Home)
Other Hospital 0.88(0.85-0.90) Chronic Care 1.25(1.16-1.35) Other ICU 1.10(1.01-1.20) Unknown 0.69(0.65-0.73)
State or Country (ref=Victoria)
Australia Capital Territory 1.32(1.24-1.41) New South Wales 1.04(1.01-1.07) Northern Territory 0.93(0.87-0.99) New Zealand 0.95(0.90-1.00) Queensland 0.90(0.87-0.93) South Australia 1.26(1.21-1.32) Tasmania 0.93(0.86-1.00) Western Australia 1.29(1.20-1.39)
Year of admission (ref=2000)
2001 0.90(0.83-0.98) 2002 0.92(0.85-1.00) 2003 0.91(0.84-0.98) 2004 0.89(0.82-0.96) 2005 0.91(0.84-0.97) 2006 0.83(0.78-0.89) 2007 0.89(0.83-0.95) 2008 0.87(0.81-0.93) 2009 0.92(0.86-0.99) 2010 0.89(0.84-0.95)
Gender (ref=male)
Female 1.10(1.07-1.12) Unknown 0.37(0.04-3.03)
Hospital Level (ref=Private)
Rural Hospitals 1.40(1.34-1.46) Metro Hospitals 1.38(1.32-1.44) Tertiary Hospitals 1.06(1.02-1.11)
Chronic comorbidities (yes vs no)
Respiratory 7.08(6.87-7.30) Cardiovascular disease 0.55(0.53-0.57) Renal disease 0.62(0.59-0.65) Immune suppressive disease 1.62(1.54-1.70) AIDS 3.61(2.51-5.19) Hepatic Failure 0.57(0.49-0.67) Lymphoma 0.88(0.80-0.97)
Cirrhosis 0.54(0.50-0.59)
Care Type (ref=HDU)
ICU 1.08(1.05-1.12) Unknown 0.31(0.11-0.84)
Age 1.01(1.00-1.01)
Area under ROC 0.852

Effect of serum sodium and osmolality on lung injury
248
The relationship between sodium and ICU mortality was
significantly different for those with a respiratory diagnosis
compared to all other patients for both the highest serum sodium
(p<0.0001) and lowest serum sodium (p<0.0001) in the first 24
hours of ICU admission (Figures 6.3). While examining the hospital
mortality, a similar trend was found. The relationship between
serum sodium and hospital mortality was significantly different for
those with a respiratory diagnosis compared to all others, both for
the highest serum sodium (p<0.0001) and the lowest serum sodium
(p<0.0001), in the first 24 hours of ICU admission.
Patients with respiratory diagnoses were further analysed as those
with admission PaO2/FiO2 ratio < 200 (n=26133) and ≥ 200
(n=17787). There was a significant interaction between PaO2/FiO2
ratio and highest serum sodium (p=0.0005), indicating that
hypernatremia associated mortality was ameliorated further in more
severe cases of respiratory failure (PaO2/FiO2 < 200). The interaction
between lowest sodium and PaO2/FiO2 ratio was not statistically
significant (p=0.09). Similarly, interaction was present with the
highest serum sodium between respiratory patients who were
mechanically ventilated with PaO2/FiO2 ratio < 200 (n=14474) in the
first 24 hours of admission and the rest of the respiratory patients
(n=29446) (p=0.02). The interaction for the lowest serum sodium
was not statistically significant (p=0.13).

Effect of serum sodium and osmolality on lung injury
249
When all patients were stratified by PaO2/FiO2 ratio, 33%
(n=114126) of patients fell below 200. There was significant
statistical evidence to suggest that the nature of the relationship
between serum sodium and ICU mortality differed according to
PaO2/FiO2 ratio with both highest and lowest serum sodium in the
first 24 hours of admission displaying significant interactions with
PaO2/FiO2 ratio (p<0.0001 for both) (Figure 6.4). This significant
interaction between serum sodium and PaO2/FiO2 ratio persisted
when considering only mechanically ventilated patients. Of the
189004 ventilated patients, 38% (n=72421) had PaO2/FiO2 ratio <
200 and the interaction with PaO2/FiO2 ratio was highly significant
for both highest and lowest serum sodium (p<0.0001 for both)
(Figure 6.4). Similar results were seen while examining hospital
mortality. When considering patients who were mechanically
ventilated with PaO2/FiO2 ratio < 200 (n=72421) against all other
patients (n=277778) there was again a significant interaction with
both highest and lowest admission serum sodium. (p<0.0001 and
p=0.0009 respectively) (Figure 6.5).

Effect of serum sodium and osmolality on lung injury
250
Figure 6.3: Adjusted odds ratio (shaded lines are 95% confidence
intervals) of ICU mortality relative to 135 -144.9 mmol/l for different categories of highest serum sodium (left) and lowest serum sodium (right) in the first 24 hours in patients with respiratory (dotted) or
without respiratory diseases (solid)
The relationship between sodium and ICU mortality was significantly different between respiratory and non-respiratory patients for the highest serum sodium (p<0.0001) and lowest serum sodium (p<0.0001) in the first 24 hours of ICU admission
Figure 6.4: Adjusted odds ratio (shaded lines are 95% confidence intervals) of ICU mortality relative to 135 -144.9 mmol/l for different
categories of highest serum sodium in the first 24 hours in all patients (left) and mechanically ventilated patients (right) with
PaO2/FiO2 ratio < 200 (dotted) or ≥ 200 (solid)
There was a significant interaction between PaO2/FiO2 ratio and highest serum sodium indicating the relationship between mortality and sodium is different in those with PaO2/FiO2 ratio < 200 compared to those with a PaO2/FiO2 ratio ≥ 200 (p<0.0001 for both)

Effect of serum sodium and osmolality on lung injury
251
Figure 6.5: Adjusted odds ratio (shaded lines are 95% confidence
intervals) of ICU mortality relative to 135 -144.9 mmol/l for different categories of highest serum sodium in the first 24 hours in all mechanically ventilated patients with PaO2/FiO2 ratio < 200 (dotted)
vs all other patients (solid)
There was a significant interaction between this group and highest serum sodium indicating the relationship between mortality and sodium is different in those patients who were mechanically ventilated with PaO2/FiO2 ratio < 200 in the first 24 hours compared to all others (p<0.0001).
Whilst there were slight differences between hospital levels, the
underlying difference between respiratory and non-respiratory
patients for the relationship between sodium and mortality
remained consistent throughout (Figure 6.6).

Effect of serum sodium and osmolality on lung injury
252
Figure 6.6: The relationship between sodium and mortality when
the 129 hospitals in the study were categorised into hospital level (26% rural, 22% metropolitan, 24% tertiary and 28% private)
The difference between respiratory and non-respiratory patients remained consistent throughout.
6.1.3 DISCUSSION
ICU mortality (adjusted), overall, was U shaped with increased
mortality at the extreme levels of dysnatremia. However, this pattern
was not observed amongst patients admitted with respiratory
diagnoses. While in patients without respiratory diagnoses, high
serum sodium in the first 24 hours of ICU admission was associated
with increased mortality. This difference was more evident when
patients with severe impairment in oxygenation (admission
PaO2/FiO2 ratio < 200) were analysed separately. To our knowledge

Effect of serum sodium and osmolality on lung injury
253
this study is the first to shown an association between
hyperosmolarity and amelioration of its adverse mortality effects in
patients with a respiratory diagnosis.
Possible reasons for differential effect
Hypernatremia is associated with increased mortality risk in
critically ill patients, independent of age and severity of disease
(Darmon et al. 2013; Palevsky et al. 1996; Lindner et al. 2007; Funk
et al. 2010; Stelfox et al. 2008; Vandergheynst et al. 2013). In
addition to causing intracellular dehydration, hypernatremia is
thought to aggravate peripheral insulin resistance, leading to
hyperglycaemia (Bratusch-Marrain et al. 1983). Hypernatremia also
impairs hepatic gluconeogenesis and lactate clearance and is
associated with neurological impairment that might lead to
prolonged duration of mechanical ventilation and delayed weaning
(Adrogue’ et al. 2000). Hypernatremia can impair cardiac function,
decrease left ventricular contractility (Kozeny et al. 1985), and cause
rhabdomyolysis (Acquarone et al. 1989). There was an increase in
mortality in all sub groups of patients, except respiratory. The rise
in mortality was higher in patients in the surgical sub group (Table
6.3) as compared to medical sub-group. This is in contrast to that
reported by Funk et al. (Funk et al. 2010) in a study sample, which
was one third the size when compared to ours. Patients classified
under “respiratory” in our study were also included under medical,
thereby decreasing the mortality of the medical subgroups.

Effect of serum sodium and osmolality on lung injury
254
Moreover, our study presents significant methodological differences,
which we believe are very important. Firstly, we have adjusted the
mortality as outlined under the methods section; secondly, we used
APACHE III risk of death with the serum sodium component
removed; thirdly, we have adjusted analysis for year of admission
and attending hospital to accommodate for significant changes in
practice over 10 years and potential changes between hospitals.
Finally, we have adjusted for each patient’s propensity to be
admitted with a respiratory diagnosis thus effectively controlling for
the imbalance that exists between respiratory and non-respiratory
patients. The odds ratio of mortality in the Funk (Funk et al. 2010)
study surgical group with dysnatremia was calculated with their
medical group as a reference. In our study, the odds were calculated
by comparing hypernatremic patients within each diagnostic group
to the patients with normal serum sodium in the same diagnostic
group. There may be several reasons why mortality increases more
rapidly in the surgical group as compared to the medical group with
rising sodium. The incidence of emergency surgery is likely to be
high in patients with dys-natremias, in contrast to patients with
normal serum sodium (more likely to represent elective post-
operative admissions). Patients undergoing emergency surgery are
also known to have increased morbidity and mortality as compared
to patients with elective surgeries (Ingraham et al. 2011).

Effect of serum sodium and osmolality on lung injury
255
However, hypernatremia may have some beneficial effects. High
serum sodium leads to hyperosmolarity (effectively hypertonicity)
which has been shown to rescue T-cells from suppression by
trauma-induced anti-inflammatory mediators (Loomis et al. 2001),
suppresses neutrophil activation (Angle et al. 1998; Junger et al.
2012; Deitch et al. 2003) and affects macrophage migration (Kim et
al. 2013); all of which can mitigate lung injury (Angle et al. 1998).
Serum sodium is reflected in tonicity which can up- or down-
regulate the TRPV4 ion channel which plays a critical role in lung
vascular mechanotransduction (Chapter 5) (Yin et al. 2010).
Specifically, hypotonicity can activate these channels (Chen et al.
2009a; Chen et al. 2009b; Becker et al. 2009; Garcia-Elias et al.
2008; Mizuno et al. 2003) leading to endothelial calcium influx, and
a rise in pulmonary vascular permeability (Yin et al. 2010). We
speculate that hypertonicity can suppress these channels leading to
a decrease in pulmonary vascular permeability, which may be
beneficial in patients with lung injury. In our study, patients with
PaO2/FiO2 ratio < 200 had the maximum benefit from high serum
sodium.
Hyperosmolarity increases type 1 alveolar epithelial cell repair
(Wang et al. 2011), and augments actin filament formation and E-
cadherin expression at the endothelial cell periphery (Safdar et al.
2003). Moreover it blocks TNF-α–induced P-selectin expression in an
Effect of serum sodium and osmolality on lung injury
256
actin-dependent manner which helps in remodelling of the
endothelial barrier (Safdar et al. 2003). These results may explain
the differential effects of high serum sodium in patients with and
without respiratory diagnoses and furthermore the differential
response of low admission PaO2/FiO2 ratio on ICU mortality in our
study.
Use of hyperosmolar solutions
Indirect evidence to support our findings comes from animal studies
which have studied the effect of hyperosmolar solutions.
Hyperosmolar solutions have limited pulmonary injury after
haemorrhagic shock in experimental models, improved splanchnic
blood flow and reduced both adhesion and cytotoxicity of
neutrophils compared with the use of isotonic solutions (Angle et al.
1998). Hyperosmolar sucrose strengthens the lung endothelial
barrier, and enhances actin polymerization in the endothelium
(Safdar et al. 2003; Quadri et al. 2003). Similarly, a brief period of
vascular hyperosmolarity protects against acid-induced lung injury
(Safdar et al. 2005). Though Bulger et al. (Bulger et al. 2008) using
hypertonic resuscitation, did not demonstrate any difference in
mortality, organ failure or in ARDS free survival, they did show
improved ARDS-free survival among patients at risk of ARDS with
massive transfusion (Zilberberg et al. 2007). In a randomised study
that included 422 patients, evolution toward acute lung injury was
less frequent when patients had received fluid loading with

Effect of serum sodium and osmolality on lung injury
257
hypertonic saline/dextran than with normal saline (Mattox et al.
1991). Similarly, previous meta-analysis has suggested survival
advantage to hospital discharge in traumatic hypotensive patients
when resuscitated with hypertonic saline dextran (Wade et al. 1997).
Recently, hypertonic solution treatment decreased the need for
ongoing fluid resuscitation in patients with septic shock (van Haren
et al. 2012), and modulated gene expression implicated in
leukocyte-endothelial interaction and capillary leakage (van Haren
et al. 2011).
6.1.4 STRENGTHS AND LIMITATIONS
We have used a large multinational database and included a large
cohort of patients (n=436,209). The data were independently
collected by multiple trained data collectors for the purpose of audit
and are unlikely to be subject to bias for the purpose of this study.
ANZICS CORE database undergoes automated internal validation
processes in addition to on-site audits by trained ANZICS auditors
which indicate that serum sodium values are generally of high
completeness, reliability and consistency. The outcome (ICU
mortality) is objective and easily verifiable and unlikely to be
affected by ascertainment error or bias. Collection of validated
markers for severity of illness allowed the adjusted ICU mortality
risk (OR) to be calculated by multivariate analysis. Finally, the
differential association of serum sodium with outcomes is
statistically strong and robust. While conventional multivariable
regression methods will never be able to address bias resulting from

Effect of serum sodium and osmolality on lung injury
258
unmeasured confounders; by developing a score for each patient’s
propensity to present with a respiratory diagnosis, we were able to
effectively control for all identifiable baseline imbalances that were
found to exist between respiratory and non-respiratory diagnosis.
This subsequently ensured that the observed results were
independent of known baseline imbalances and effectively provided
the equivalent of a matched analysis between respiratory and non-
respiratory patients.
Although this was a large retrospective study, there are several
limitations. Firstly, a number of patients with mortality and severity
of illness data were excluded because of missing data, however they
accounted for only 14% of the screened population. Secondly, whilst
we controlled for severity of illness using APACHE III risk of death
(with serum sodium component removed) year of admission,
hospital and propensity (to have a respiratory diagnosis) in our
adjusted model, there are multiple other factors contributing to ICU
mortality. We also used APACHE III diagnostic codes to classify the
patients and whilst this is a robust way to classify patients, we
cannot rule out misclassification bias.
Being a retrospective study, it was not possible to control for any
therapies administered to cause (for example- use of furosemide) or
treat dysnatraemia prior to ICU admission. Also there was no
information about the change in serum sodium during the ICU stay
(and its potential effect on outcomes) and this should be a subject of

Effect of serum sodium and osmolality on lung injury
259
future studies. Similarly, the effect of fluid balance and its possible
effect on serum sodium and hence outcome should also be the
subject of a future trial.
Furthermore, I acknowledge that respiratory diagnoses include a
wide variety of respiratory conditions, while hyperosmolarity may
only benefit patients with lung injury in particular. In an attempt to
examine the patients with ARDS (as these data are not routinely
collected), we did examine all patients and patients admitted with a
respiratory diagnosis with PaO2/FiO2 < 200 and those with
PaO2/FiO2 < 200 receiving invasive mechanical ventilation in the
first 24 hours using an interaction model, and found reduced risk of
mortality with hypernatremia in these subsets of patients. Moreover,
patients classified under a different diagnostic category may also
have lung injury. Hence, we examined all patients with PaO2/FiO2 <
200 in addition to those who were mechanically ventilated, and
found an interaction of serum sodium on ICU mortality between the
2 groups as well; high serum sodium also confirmed reduced risk of
mortality in those patients who were mechanically ventilated with
PaO2/FiO2 < 200 when compared with others. Examining the effect
of hypernatremia in patients with ARDS should be a subject of
future study.
6.1.5 SUMMARY
High levels of admission serum sodium did not lead to the expected
increase in mortality observed in ICU patients in those who are

Effect of serum sodium and osmolality on lung injury
260
admitted with respiratory diagnoses. The difference was more
pronounced in patients with more severely impaired oxygenation.
These data could form the basis of future studies examining
hyperosmolar therapies in patients with lung injury.

Effect of serum sodium and osmolality on lung injury
261
6.2 Admission high serum osmolarity is not associated
with increased ICU mortality risk in respiratory
patients
After examining the effect of serum sodium on mortality in
respiratory patients the effect of serum osmolarity was directly
investigated (serum osmolality is largely dependent on serum
sodium). As increased serum osmolarity is lung protective we
hypothesized that mortality associated with high admission serum
osmolarity would be ameliorated in critically ill patients with an
acute respiratory diagnosis.
To examine the effect of the highest calculated admission serum
osmolarity on ICU mortality in critically ill patients, data from
January 2000 to December 2012 was accessed using the ANZICS
CORE database. 509,180 patients were included. Serum osmolarity
was calculated from the highest serum sodium, glucose and urea
values in the first 24 hours of ICU admission. Predefined subgroups
(based upon APACHE III diagnostic codes), including patients with
acute respiratory diagnoses, were examined. The effect of serum
osmolarity on ICU mortality was assessed with analysis adjusted for
illness severity (serum sodium, glucose and urea component
removed) and year of admission. Results are presented as odds ratio
(OR) (95% CI) referenced against a serum osmolarity of 290 – 295
mmol/l.
Overall ICU mortality was increased at each extreme of calculated
serum osmolarity (U- shaped relationship). A similar trend was
found in various subgroups, with the exception of patients with
respiratory diagnoses in whom ICU mortality was not influenced by
high serum osmolarity and was different from other non-respiratory
sub-groups (P<0.01) (Figure 6.7). Any adverse associations with
high serum osmolarity in respiratory patients were confined to
patients with a PaO2/FiO2 ratio ≥200. Using goodness of fit criteria,

Effect of serum sodium and osmolality on lung injury
262
area under the curve and the significance of the interaction term,
serum osmolarity was a stronger predictor of ICU mortality than
serum sodium for the separation of respiratory and non-respiratory
patients.
High admission serum osmolarity was not associated with
increased odds for ICU death in respiratory patients (unlike other
subgroup of patients) and could be a potential area for a future
interventional therapy.
Figure 6.7: Adjusted odds ratio (shaded lines are 95% confidence
intervals) of ICU mortality relative to 135 -144.9 mmol/l for different categories of highest serum osmolarity in the first 24 hours in patients with respiratory (dotted) or without respiratory diseases
(solid)
The relationship between sodium and ICU mortality was significantly different between respiratory and non-respiratory patients for the highest serum osmolarity (p<0.0001) in the first 24 hours of ICU admission.

Effect of serum sodium and osmolality on lung injury
263
6.3 Induced hypernatremia reduces acute lung injury,
independent of fluid or sodium load
Based on the findings from the epidemiological studies (Section 6.1
and 6.2), administration of hypertonic saline (to induce
hypernatremia) as a therapeutic option was tested in an animal
model of lung injury. ARDS has a substantial impact on public
health (Rubenfeld et al. 2005). While the incidence of ARDS varies
considerably across the world (Rubenfeld et al. 2005; Luhr et al.
1999; Bersten et al. 2002), recent data suggest an incidence ranging
from 15.3–58.7 cases per 100,000 person-years (Rubenfeld et al.
2005; Arroliga et al. 2002). Mortality also varies with reported
ranges of 30–58% (Rubenfeld et al. 2005; The ANZIC influenza
investigators 2009; Zilerberg et al. 1998). The problem of ARDS has
been highlighted by the recent H1N1 influenza pandemic where
ICUs treated an unprecedented number of cases of ARDS (The
ANZIC influenza investigators 2009). Since the original description
of ARDS (Ashbaugh et al. 1967), substantial progress has been
made in understanding the natural history and pathogenesis of this
lethal syndrome. However, lung protective ventilation (The Acute
Respiratory Distress Syndrome Network 2000) remains the only
current treatment strategy for ARDS. Similarly, besides some recent
data suggesting role of neuro-muscular blockers (Papazian et al.
2010) no other therapeutic agent has been established as a
treatment for lung injury.

Effect of serum sodium and osmolality on lung injury
264
Use of hyperosmolar solution to increase serum osmolarity could be
utilised as a therapeutic option. As discussed in the section 6.1
hyperosmolarity increases type 1 alveolar epithelial cell repair (Wang
et al. 2011) and augments actin filament formation and E-cadherin
expression at the endothelial cell periphery (Safdar et al. 2003).
Moreover, it blocks TNF-α–induced P-selectin expression in an
actin-dependent manner which helps in remodelling of the
endothelial barrier (Safdar et al. 2003). Hyperosmolar solutions have
limited pulmonary injury after haemorrhagic shock in experimental
models with improved splanchnic blood flow and reduced adhesion
and cytotoxicity of neutrophils compared with the use of isotonic
solutions (Angle et a 1998; Shi et al. 2002). A 15-min infusion of
hyperosmolar sucrose, which increases vascular osmolarity by
approximately 50 mOsm, strengthens the lung endothelial barrier,
and enhances actin polymerization in the endothelial periphery
(Safdar et al. 2003; Quadri et al. 2003). Similarly, a brief period of
vascular hyperosmolarity (increase of 55 mOsm/kg) protects against
acid-induced lung injury when the infusion of hyperosmolar sucrose
is administered shortly before, or shortly after, acid instillation in
the airway (Safdar et al. 2005).
As the safety of systemic administration of sucrose in human is not
known and there are major concerns with use of synthetic colloids
(Perner et al. 2012; Myburgh et al. 2012), it was hypothesised that
induced hypernatremia (by the administration of hypertonic saline)
would lead to an increase in serum osmolality and could be used to

Effect of serum sodium and osmolality on lung injury
265
ameliorate lung injury. As administration of intravenous
resuscitation fluids is a common practise in patients with lung
injury (Rivers et al. 2001; Perner et al. 2012; Maitland et al. 2005)
we compared the hypertonic saline with other commonly utilised
fluids in the ICU.
The present study was aimed to investigate whether hypertonic
saline (HTS) can protect against LPS aspiration-induced lung micro-
vascular injury in a rat model. Other fluid controls were also
utilised. Lung injury was assessed during 2 h of mechanical
ventilation by monitoring left and right heart filling pressures, lung
compliance, and tissue oxygen tension, following which, lung
oedema, MPO activity, and bronchoalveolar lavage (BAL) fluid
protein concentration, leukocyte count, cytokines and surfactant
activity were determined. Systemic parameters such as plasma
TNF-α serum electrolytes and haematocrit were also evaluated.
6.3.1 METHODS
6.3.1.1 Ethics approval: All experiments were approved by the
Flinders University Animal Welfare Committee and performed
according to the National Health and Medical Research Council of
Australia Guidelines on Animal Experimentation (application
number 812.12).
6.3.1.2 Animals: Specific pathogen-free male Sprague-Dawley rats
(250-280g) were used in all experiments. The methods used is
similar to that described in section 5.3.

Effect of serum sodium and osmolality on lung injury
266
6.3.1.3 Induction of Acute Lung Injury
Controls: Negative control animals (n=6) did not received any
intravenous fluids nor were they administered intra-tracheal LPS.
Positive control animals (n=6) had induced acute lung injury using a
previously established method of intra-tracheal LPS endotoxin
(Dixon et al. 2009).
Briefly, rats were anaesthetized with 1% inhaled isoflurane
(Forthrane, Abbott Australasia) and the right femoral vein and
artery catheterized for maintenance via continuous intravenous
infusion of thiopental (60mg/kg/hr; Abbott Australasia) and for
arterial blood sampling and pressure monitoring, respectively. Rats
were paralysed with a bolus injection of pancuronium bromide
(1mg/kg iv; Astra Zeneca, Bedfordshire, UK) maintained by
continuous infusion (0.2mg/kg/h iv) and kept at 37ºC with a
temperature-controlled heat pad. A tracheotomy was performed and
the lungs ventilated via a computer controlled small animal
mechanical ventilator (flexiVent, SCIREQ Scientific Respiratory
Equipment, Montreal, Canada) with 100% oxygen for 15 minutes to
stabilize at a tidal volume (VT) of 6ml/kg body weight, breathing
frequency (f) of 120min-1, positive end expiratory pressure (PEEP) of
2 cmH2O using a constant flow waveform where Ti/Ttot = 0.3.
LPS (Escherichia coli O55:B5, 15 mg/kg in saline, Sigma-Aldrich, St
Louis, MO) or saline was instilled through the tracheal catheter in 3
separate 0.1ml volumes, each volume followed by a 3ml air bolus

Effect of serum sodium and osmolality on lung injury
267
and a respiratory recruitment manoeuvre of 2.5 × VT and PEEP of
10cmH2O for 15 seconds. The rat was left to stabilize on normal
ventilation as above for 5 minutes after each instillation. Following
LPS or saline instillation, rats were ventilated for 2 h, as above,
while blood pressure was monitored continuously using a
disposable pressure transducer (Sorenson Trans Pac; Abbott Critical
Care Systems, Chicago, IL) connected to a MacLab system (AD
Instruments, Sydney, Australia). The study plan with description of
various measurements at various time intervals is similar to the
previous experiment (Section 5.3) and the protocol is shown in
figure 5.6.
6.3.1.4 Monitoring
Continuous monitoring of the right heart pressure was achieved by
canulation of the left femoral vein. Similarly continuous monitoring
of the left heart pressure was done by cannulating the right carotid
artery and advancing the cannula through to the left heart (left
ventricular end diastolic pressure). Both were monitored using a
disposable pressure transducers (Sorenson Trans Pac; Abbott
Critical Care Systems, Chicago, IL) connected to a MacLab system
(AD Instruments, Sydney, Australia).
Effect of serum sodium and osmolality on lung injury
268
6.3.1.5 Fluids utilised
Animals who were administered intra-tracheal LPS were randomly
divided into various fluid groups. (No fluids-positive control, 20%
saline, 0.9% saline, 4% albumin, 5% glucose, 20% albumin and 5%
dextrose with 20% albumin). All the fluids were administered
through the right femoral vein by utilising a 3 way tap. The dose of
20% saline was 2.6 ml/kg. The dose of the other fluids used in the
study was 60 ml/kg for 0.9% saline, 4% albumin, and 5% glucose.
At this dose the sodium load in 0.9% saline and 4% albumin were
similar to 20% saline. 20% albumin had a similar amount of
albumin present as 4% albumin and albumin with 5% dextrose had
similar volume and albumin as 4% albumin but minimal amount of
sodium. The comparative amount of sodium, albumin and volume of
the different fluids used in the study is shown in Table 6.6.
Negative control animals did not receive any intravenous fluids or
were administered intra-tracheal LPS. All the fluids were
administered over half an hour (Figure 5.6).
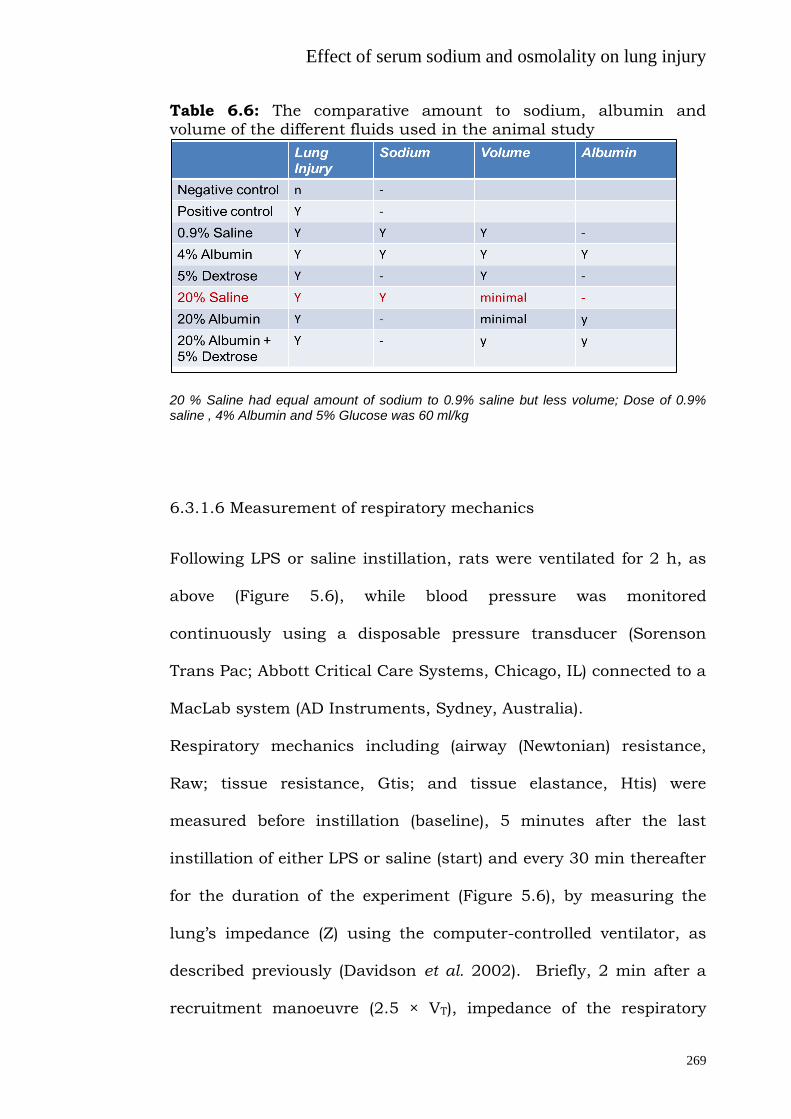
Effect of serum sodium and osmolality on lung injury
269
Table 6.6: The comparative amount to sodium, albumin and volume of the different fluids used in the animal study
20 % Saline had equal amount of sodium to 0.9% saline but less volume; Dose of 0.9% saline , 4% Albumin and 5% Glucose was 60 ml/kg
6.3.1.6 Measurement of respiratory mechanics
Following LPS or saline instillation, rats were ventilated for 2 h, as
above (Figure 5.6), while blood pressure was monitored
continuously using a disposable pressure transducer (Sorenson
Trans Pac; Abbott Critical Care Systems, Chicago, IL) connected to a
MacLab system (AD Instruments, Sydney, Australia).
Respiratory mechanics including (airway (Newtonian) resistance,
Raw; tissue resistance, Gtis; and tissue elastance, Htis) were
measured before instillation (baseline), 5 minutes after the last
instillation of either LPS or saline (start) and every 30 min thereafter
for the duration of the experiment (Figure 5.6), by measuring the
lung’s impedance (Z) using the computer-controlled ventilator, as
described previously (Davidson et al. 2002). Briefly, 2 min after a
recruitment manoeuvre (2.5 × VT), impedance of the respiratory

Effect of serum sodium and osmolality on lung injury
270
system was measured following a forced oscillation. The data were
fitted to a constant phase model (Bates et al. 1992) where Z = Raw +
jI + (Gtis-jHtis)/(2πf)α, where I is inertance, j is the imaginary unit, f
is frequency and α = (2/π)arc tan (Htis/Gtis). Inertance was
negligible and is therefore not reported.
6.3.1.7 Assessment of lung injury
Blood samples were taken hourly throughout ventilation for
measurement of arterial blood gas-pH analysis (ABL 5, Radiometer,
Copenhagen, Denmark) and bi-hourly for plasma cytokines. The
lungs were removed and the right upper lobe resected for
determination of wet-to-dry lung weight ratio, as described
previously (Davidson et al. 2002). The remaining lung was degassed
at 0.5 atm for 60 seconds and lavaged at 2C with 3 separate
32ml/kg bodyweight volumes of 0.9% sodium chloride, each volume
instilled and withdrawn three times. Percent recovery of lavage fluid
was not different between saline and LPS animals (80.6±7.8 v
79.6±7.5 % of total instilled lavage volume respectively; P=0.7). The
lung lavage fluid was centrifuged at 150 g for 5 minutes at 2C. A
sample was taken from the supernatant, aliquoted and stored at -
80C until analysis for cytokines. A further aliquot was taken for
determination of total lung lavage protein with commercially
available reagents (BioRad DC Protein Assay; BioRad Laboratories,
Hercules, CA).

Effect of serum sodium and osmolality on lung injury
271
Lung lobes were resected for determination of both wet-to-dry
weight ratio and MPO activity (Elder et al. 2013). Bronchoalveolar
lavage (BAL) was performed, following isolation of the top right two
lobes, for determination of alveolar cytokine, total protein and cells
(Elder et al. 2013).
6.3.1.8 Histological analysis
Following BAL, the right lung lobes were fixed at 20 cmH2O with
10% buffered formalin. Paraffin-embedded sections (4 µm) were
stained with hematoxylin and eosin for scoring of pulmonary
inflammatory cell infiltration and alveolar wall thickening using a
semi quantitative score (0-3) on blinded sections by two
independent investigators (dos Santos et al. 2011).
6.3.1.9 Surfactant analysis
The remaining supernatant was centrifuged at 40000 g for 15
minutes at 2C to separate the dense surface-active fraction, or
large aggregates (LA) and less surface-active, small aggregates (SA).
Lipids were extracted from each fraction using the method of Bligh
and Dyer (Bligh et al. 1959) and total phospholipid content
determined by measuring the amount of inorganic phosphorus with
the method of Bartlett (Barlett et al. 1959). Measured surfactant
was normalized to gram of dry lung weight
6.3.1.10 Cytokine determination

Effect of serum sodium and osmolality on lung injury
272
Cytokine concentrations in lung lavage and plasma were analysed
using commercially available enzyme linked immunosorbant assay
(ELISA) kits for TNF- and IL-8 (CINC-1) (R&D Systems), as
described previously (Dixon et al. 2008).
6.3.1.11 Electrolyte and haematocrit measurement
Serum sodium and chloride were measured using Ion Selective
Electrodes (ISE) (Roche/Hitachi Modular Analyser- Japan).
Haematocrit was measured with haematocrit reader.
6.3.1.12 Statistical analysis
All values are expressed as means (SD). Two-way analysis of
variance (ANOVA) and repeated measures analysis of variance
followed by a Tuckey post-test were used. Significant differences
were determined where P was less than 0.05.
6.3.2 Results
Changes in serum sodium, chloride and haematocrit
Serum sodium, chloride and haematocrit over the course of the
experiment is shown in Table 6.7. 20 % saline resulted in an
increase in serum sodium and chloride at 30 and 120 minutes while
glucose containing regimens led to a decrease in these electrolyte
levels. Administration of all fluids led to decreased haematocrit; the
greatest with albumin containing fluids. (Table 6.7)

Effect of serum sodium and osmolality on lung injury
273
Table 6.7: Effect of administered fluids on serum sodium, chloride and haematocrit.
Data presented as mean (sd). 20% saline led to an increase in serum sodium and chloride levels
LVEDP and CVP
There was an increase in LVEDP in all animals following
administration of i.v. fluids however this was maintained at less
than 18 mm Hg (Figure 6.8). Similarly there was increase in CVP
following administration of all i.v. fluids (Figure 6.8). The rise in
LVEDP and CVP with administration of 20 % saline was less when
compared to all other fluids.
Groups Serum Sodium (mmol/l) Serum Chloride (mmol/l) Haematocrit (delta)
Baseline 30 minutes
120 minutes
Baseline 30 minutes
120 minutes
30 minutes
120 minutes
Negative control (no
LPS (i.t.) and no i.v. fluids)
136 (2) 137 (1) 138 (1) 102 (2) 102 (2) 103(1) .03 (.03) .05 (.03)
Positive control LPS
(i.t.) with no i.v. fluids)
137 (2) 138 (2) 139 (1) 101 (3) 103 (2) 103 (4) .02 (.01) .04 (.01)
LPS (i.t.) with 20% saline
139 (2) 165 (3) 160 (1) 100 (2) 134 (3) 131 (2) .02 (.02) -.04 (.02)
LPS (i.t.) with 0.9% saline
138 (3) 140 (2) 142 (3) 101 (4) 115 (3) 111 (3) -.07 (.02) -.06 (.02)
LPS (i.t.) with i.v. 4%
albumin
139 (3) 128 (4) 131 (3) 103 (3) 106 (3) 101 (4) -.10 (.02) -.08 (.02)
LPS (i.t.) with i.v. 5%
glucose
139 (3) 128 (4) 131 (3) 103 (4) 100 (3) 99 (3) -.04 (.02) -.02 (.01)
LPS (i.t.) with i.v. 20% albumin
140 (3) 132 (3) 136 (4) 100 (2) 95 (3) 99 (3) -.20 (.06) -.08 (0.04)
LPS (i.t.) with i.v. 20%
albumin + 5% glucose
138 (3) 118 (5) 124 (5) 101 (2) 91 (3) 93 (4) -.16 (.06) -.11 (.05)

Effect of serum sodium and osmolality on lung injury
274
Figure 6.8: The effect of fluid administration on the left ventricular
end diastolic pressure and the central venous pressure
Administration of 20% saline lead to an increase in the left and right heart pressures but was less than the rest of the fluids (p<0.01). Result with 0.9% saline is shown here and it was not different from the rest of the administered fluid
Effect on Lung injury
Administration of 20% saline ameliorated the rise in lung wet to dry
weight ratio apparent following induction of LPS-induced lung injury
(p<0.01), as well as whole lung lavage protein (p<0.01), as compared
with the positive control and other fluid controls (Figure 6.9). There
were simultaneous decreases in total whole lung lavage cell(p<0.01),
neutrophil counts (p<0.01) and MPO levels (p<0.01) (Figures 6.9).
Other fluids had no effect on these parameters.
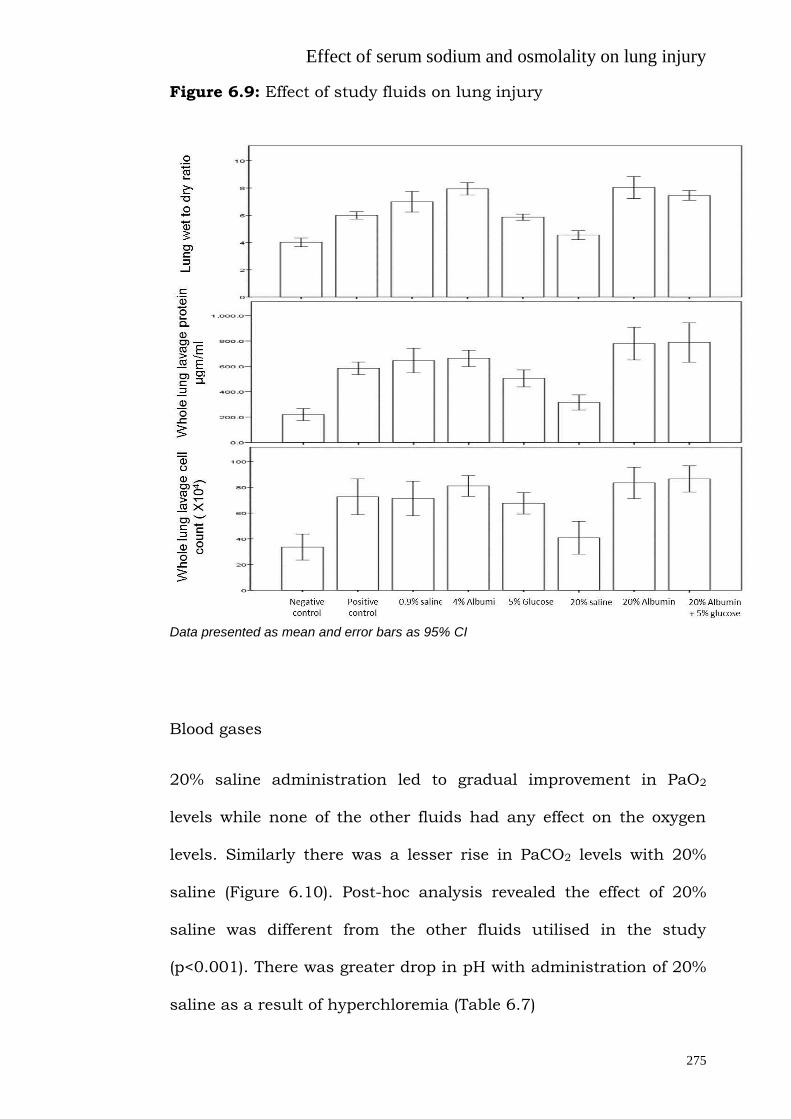
Effect of serum sodium and osmolality on lung injury
275
Figure 6.9: Effect of study fluids on lung injury
Data presented as mean and error bars as 95% CI
Blood gases
20% saline administration led to gradual improvement in PaO2
levels while none of the other fluids had any effect on the oxygen
levels. Similarly there was a lesser rise in PaCO2 levels with 20%
saline (Figure 6.10). Post-hoc analysis revealed the effect of 20%
saline was different from the other fluids utilised in the study
(p<0.001). There was greater drop in pH with administration of 20%
saline as a result of hyperchloremia (Table 6.7)

Effect of serum sodium and osmolality on lung injury
276
Figure 6.10: Effect of the study fluids on blood gases
Data presented as mean and SD. Result with 0.9% saline is shown here and it was not different from the rest of the administered fluid
Lung mechanics
Administration of 20 % saline administration led to lower Htis and
Gtis during the course of the experiments (p<0.001) (Figure 6.11).
Post-hoc analysis revealed significant differences between the
different kind of administered fluid and 20% saline (p=0.01).
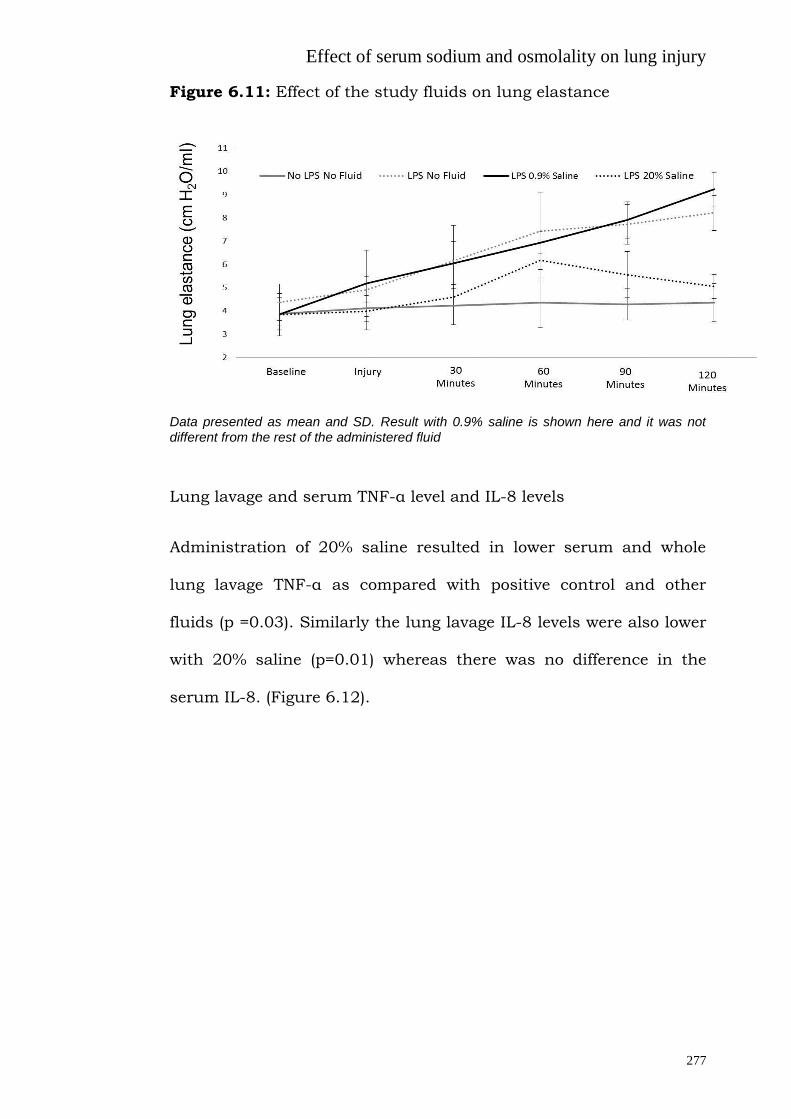
Effect of serum sodium and osmolality on lung injury
277
Figure 6.11: Effect of the study fluids on lung elastance
Data presented as mean and SD. Result with 0.9% saline is shown here and it was not different from the rest of the administered fluid
Lung lavage and serum TNF-α level and IL-8 levels
Administration of 20% saline resulted in lower serum and whole
lung lavage TNF-α as compared with positive control and other
fluids (p =0.03). Similarly the lung lavage IL-8 levels were also lower
with 20% saline (p=0.01) whereas there was no difference in the
serum IL-8. (Figure 6.12).

Effect of serum sodium and osmolality on lung injury
278
Figure 6.12: Effect of study fluids on lung lavage and serum TNF-α
level and IL-8 levels
Data presented as mean and error bars as 95% CI
Surfactant
Although the total amount of phospholipids did not change with
administration of 20% saline, the ratio of small to large aggregates
did not increase with the administration of 20% saline, as compared
to positive control or other fluids (p=0.02). (Figure 6.13)

Effect of serum sodium and osmolality on lung injury
279
Figure 6.13: Effect of study fluids on the ratio of small and large
lung lavage phospholipid aggregate
Data presented as mean and error bars as 95% CI
Lung histology
There was less cellular infiltrate (p=0.04) and wall thickness oedema
(p=0.01) with the use of hypertonic saline (Figure 6.14)

Effect of serum sodium and osmolality on lung injury
280
Figure 6.14: Hematoxylin and eosin staining in the lung paraffin-embedded sections and lung histology scores (cell infiltrate and wall
thickness score) in animals who were administered 20% saline compared with the positive and negative control
Data presented as mean and error bars as 95% CI 20% saline administration in animals with LPS induced lung injury led to less cellular infiltrate and wall thickness oedema
Effect of serum sodium and osmolality on lung injury
281
6.3.3 DISCUSSION
The main finding of this study was that in an epithelial model of
lung injury, induced hypernatremia is lung protective. The beneficial
effects of hypernatremia are likely due to the effect of increased
serum osmolarity as other fluids (controlled for sodium and volume)
had minimal/ worse effects on lung injury. This has clinical
relevance as increasing serum sodium by administration of
hypertonic sodium solution is an easy intervention with established
clinical experience as it often used to manage patients with raised
intracranial pressure.
Possible mechanisms for a lung protective effect of hypertonic
saline
Administration of hypertonic saline leads to hyperosmolarity
(effectively hypertonicity) which has been shown to rescue T-cells
from suppression by trauma-induced anti-inflammatory mediators
(Loomis et al. 2001), suppresses neutrophil activation (Angle et al.
1998; Junger et al. 2012; Deitch et al. 2003) and affects
macrophage migration (Kim et al. 2013); all of which can mitigate
lung injury (Angle et al. 1998). Pulmonary neutrophil sequestration,
which is central to the mechanism of injury in ALI, is attenuated by
hypertonic saline in diverse ALI models (Shields et al. 2003; Murao
et al. 2003; Shields et al. 2000; Vialet et al 2003), as demonstrated
here by a decrease in the lung lavage cells and cell infiltrate scores.

Effect of serum sodium and osmolality on lung injury
282
Hypertonic saline has been reported to exert protective
hemodynamic effects in animal models of controlled post-traumatic
hypotension (Rabinovici et al. 1991; Rabinovici et al. 1992) and in
diverse clinical trials with trauma patients (Holcroft et al. 1987;
Mattox et al. 1991). Also, HTS effectively resuscitated dogs (Horton
et al. 1991), pigs (Kreimeier et al. 1991), and horses (Bertone et al.
1990) subjected to endotoxin shock. The mechanisms of action of
hypertonic saline are increasingly well understood, and include
inhibition of neutrophil adhesion molecule CD11b (Rizoli et al.
1999), reduced TNF-α and IL- l production (Shields et al. 2003a),
and reduced activation of MAP kinase p38 and ERK-1 (Shields et al.
2003b). Similarly we found a decrease in lung lavage TNF-α and IL-8
level and serum TNF-α in our study. The therapeutic potential of
HTS is demonstrated by its efficacy when used following initiation of
the injury process, in both ischemia-reperfusion and pancreatitis
induced ALI (Shields et al. 2003a; Shields et al. 2000). Effectiveness
of HTS in other models of lung injury such as oleic acid injury and
acid aspiration-induced lung injury (0.1 N HCl) have previously been
shown through both reduction of inflammation and enhancing the
resolution of lung injury (Kennedy et al. 2008; Rabinovici et al.
1996). Intra-tracheal instillation of LPS is a validated model of lung
injury (Dixon et al. 2009). The effect of hypertonic saline in an LPS
(intra-tracheal) model of lung injury has not been investigated
before when controlled for the amount of sodium and fluid
administered and compared with other commonly administered

Effect of serum sodium and osmolality on lung injury
283
fluids in ICU, with monitoring of left ventricular end diastolic
pressure (in an attempt to control for hydrostatic oedema).
As discussed in section 6.1 serum sodium is reflected in tonicity
which can up- or down-regulate the TRPV4 ion channel which plays
a critical role in lung vascular mechanotransduction (Yin et al.
2010). Specifically, hypotonicity can activate these channels (Chen
et al. 2009a; Chen et al. 2009b; Becker et al 2009; Garcia-Elias et
al. 2008; Mizuno et al. 2003) leading to endothelial calcium influx,
and a rise in pulmonary vascular permeability (Yin et al. 2010). We
speculate that hypertonicity can suppress the TRPV4 channels
leading to a decrease in pulmonary vascular permeability, which will
ameliorate lung injury. We also found improved lung mechanics and
blood gases with administration of HTS. This is reflected by a
decrease in the ratio of small to large surfactant aggregates with
fluid administration, possibly due to the decrease in the lung lavage
protein concentration, as increased permeability and the presence of
protein in the alveolus will increase the conversion from large to
small aggregates (Davidson et al. 2000).
Clinical research
Hypernatremia is associated with increased mortality risk in
critically ill patients, independent of age and severity of disease
(Linder et al., 2007; Hoorn et al. 2008). However, hypernatremia
examined in these studies developed during the process of care for
those patients, therefore induced hypernatremia in lung injury has

Effect of serum sodium and osmolality on lung injury
284
not been examined before. This in-vivo data supports our previous
findings that high serum sodium was not associated with increased
ICU mortality risk in respiratory patients (Section 6.1 and 6.2), and
any adverse associations with hypernatremia in respiratory patients
were confined to those with PaO2/ Fio2 ratios of greater than 200,
indicating that lung protective effects of hypernatremia in patients
with lung injury would reduce its general adverse effects leading to
amelioration of the increase in mortality risk.
Administration of HTS in a patient population has been examined
previously. Bulger et al (Bulger et al. 2008) using hypertonic
resuscitation, did not demonstrate any difference in mortality, organ
failure or difference in ARDS free survival. However, they did show
improved ARDS-free survival among patients at risk of ARDS with
massive transfusion (Zilberberg et al. 2007). In a randomised study
that included 422 patients, evolution toward acute lung injury was
less frequent when patients had received fluid loading with
hypertonic saline/dextran than with normal saline (Mattox et al.
1991). Similarly, previous meta-analysis has suggested survival
advantage in traumatic hypotensive patients when resuscitated with
hypertonic saline dextran (Wade et al. 1997). Recently, hypertonic
solution treatment was found to decrease the need for ongoing fluid
resuscitation in patients with septic shock (van Haren et al. 2012),
and modulated gene expression implicated in leukocyte-endothelial
interaction and capillary leakage (van Haren et al. 2011).

Effect of serum sodium and osmolality on lung injury
285
Other fluids in lung injury
Besides 20% saline we also examined other commonly administered
fluids in our epithelial model of lung injury. The dose administered
was typically large but none of the administered fluids led to an
increase in LVEDP more than 18 mmhg, the traditional cut off for
hydrostatic pulmonary oedema. Moreover, recent studies have
indicated that a large amount of fluid administration is a common
practise in patients with lung injury. In a study investigating early
goal direct therapy 39% of patients had pneumonia (the most
common cause of ARDS) and they received 3499±2438 ml of fluid in
the study arm and 4981±2984 ml in the control arm (Rivers et al.
2001). Similarly the recently conducted 6S study (Perner et al. 2012)
where hydroxyethyl starch was compared with Ringer’s acetate in
patients with severe sepsis, 55% of patients with lung as the source
of sepsis had a median 5235 ml of fluid (trial plus other fluid)
administered on day 1 in the hydroxyethyl starch group. Similarly in
the Feast study (Maitland et al. 2011) which showed adverse
outcomes of either saline or albumin in children with severe
infection, 83% of them were admitted with respiratory distress.
Administration of such large volumes can contribute to a positive
fluid balance which has been associated with poorer lung function
(Wiedemann et al. 2006) though the effect of these fluid boluses per
se on lung injury is not known. However, it is noteworthy that 25.6
% patients in the CHEST study (which compared starch and 0.9%
saline) developed new onset respiratory failure during the study

Effect of serum sodium and osmolality on lung injury
286
(Myburgh et al. 2012). Hence the use of small volume resuscitation
fluids such as hypertonic saline is an attractive option in patients
with lung injury. Administration of 20% albumin also offers the
advantage of small volume resuscitation but it not only led to a
decrease in serum sodium it actually worsened, or had no effect on,
the measured parameters of lung injury. This is in line with the
recent findings by Caironi et al where in patients with severe sepsis,
albumin replacement did not improve the rate of survival (Caironi et
al. 2014). This is where HTS is different as it not only offers a
smaller volume, it also causes a rise in serum sodium and hence
serum osmolarity.
6.3.4 STUDY LIMITATION AND FUTURE DIRECTIONS
Our study has several limitations which should be addressed in
future studies
1. Targeting a more physiological range of serum sodium: The
current study was designed to simulate an increase in
osmolality of 50 mosmol/l but future studies should target a
more physiological range of serum sodium (145 to 150
mmol/l) as currently in practise for managing patients with
raised intracranial pressure.
2. Preventing lung injury by prophylactic administration of HTS
should be examined.
3. The time frame of lung injury was 2 hours in the current
study. In future a longer time frame should be examined.

Effect of serum sodium and osmolality on lung injury
287
4. Rapid change in serum sodium can have adverse neurological
effects and in the future a more physiological and a
physiological increase in serum sodium levels should be
examined.
6.3.5 SUMMARY
Induced hypernatremia leads to amelioration of lung injury and
could be used a therapeutic option in patients with lung injury.

Summary and recommendations
288
CHAPTER 7: SUMMARY AND RECOMMENDATIONS
7.1 Sodium administration and balance in ICU
Sodium administration is high in both adult and paediatric
patients which leads to a positive sodium balance
Most of the administered source of sodium in ICU is from
inadvertent sources. Sources such as vehicles for drugs,
flushes for intravascular catheters and maintenance fluids
inadvertently contribute a high proportion of the administered
sodium
Current dialysis practises in ICU remove water but lead to a
positive sodium flux
Frusemide leads to diuresis but not naturesis in ICU patients
Positive sodium balance is associated with lung dysfunction
Future directions
As the majority of the administered sodium is from inadvertent and
are from easily modifiable sources, a restrictive sodium strategy is
possible and should be examined in future studies. Most drugs are
soluble in 5 % glucose the use of which will lead to less sodium
administration (Table 7.1 shows the list of handful of drugs which
are incompatible with 5% glucose, the remainder can be
administered with 5% glucose). Based on the data presented in
section 3.2, sources of sodium can be divided into modifiable and

Summary and recommendations
289
non-modifiable sources (Table 7.2). Modifiable sources should be a
target of sodium restriction strategies. One such strategy could be
5% glucose as a vehicle for all drugs (infusion and
bolus) unless contraindicated for reasons of drug
solubility
5% glucose as maintenance fluid
Heparinised 0.45% saline as flush for all intravascular
catheters
Use of low sodium enteral feeds
Table 7.1: Drugs which are incompatible with glucose
Alteplase Enfuvirtide Parecoxib sodium
Amifostine Ertapenem sodium Phentolamine
Ampicillin sodium Erythromycin (IV) Phenytoin
Apomorphine Esomeprazole
sodium
Rasburicase
Caspofungin acetate Frusemide EDTA
Clonidine Hydralazine Tenecteplase
Dantrolene Infliximab All the anti-neoplastic
drug should be
administered as per
the manufacturers
guidelines
Desmopressin Interferon alfa
Digoxin immune FAB Iron polymaltose
complex
Dihydroergotamine Iron sucrose
Drotrecogin alfa
(Xigris)
Oxytocin
Efalizumab Paraldehyde

Summary and recommendations
290
Table 7.2: Current contribution of sodium (mmol) from
various sources
The feasibility of such an intervention should be investigated in
future studies. Furthermore current dialysis strategies in the ICU
have to be reviewed and modified to decrease sodium influx. Two
Source of sodium
(intravenous and enteral
nutrition)
Current data (mmol)
(Section 3.2)
Modifiable
Maintenance/replacement 69.3
Drug boluses 27.6
Enteral nutrition 26.5
Drug infusions 19.3
Flushes 16.6
Total Modifiable 159.3
Non-modifiable
Fluid boluses 36.5
Blood products 13.5
Antimicrobial 11.2
Parenteral nutrition 4.3
Total non-modifiable 65.5
Grand total (mmol) 224.8

Summary and recommendations
291
major interventions which can be easily done in ICU to potentially
decrease the amount of sodium influx in patients are (i) use of better
individualization of dialysate sodium concentration and (ii) earlier
use of fluid removal as soon as feasible. Moreover drugs such as
indapamide in combination with frusemide which have been shown
to increase naturesis in outpatients (Tanaka et al. 2005) should be
examined in ICU.

Summary and recommendations
292
7.2 Fluid boluses
Fluid boluses are common in septic patients, result in limited
success, and may be harmful
Fluids boluses can result in permeability pulmonary odema
despite a safe (non-hydrostatic) LVEDP
Administration of ruthenium red prevents such permeability
oedema suggesting a TRPV4 mechanism
In healthy volunteers 0.9% saline and 4% albumin solutions
have differential pulmonary effects not obviously attributable
to passive fluid filtration. Compared with other fluids 0.9%
saline leads to interstitial oedema whereas 4% albumin does
not cause pulmonary oedema even though there is evidence of
hypervolemia.
Future directions
Indications and physiological effects of fluids boluses in other
clinical areas such as the emergency department, post-surgery
patients, and pre-hospital admission should be examined.

Summary and recommendations
293
Fluid induced lung injury should be examined in other models,
such as mice, sheep and healthy volunteers. The role of TRPV
channels in such injury should be investigated by examining the
effects of fluid boluses in TRPV4 knock out mice. Similarly, a more
specific TRPV4 agonist (GSK1016790A) (Willette et al. 2008) and
antagonist (GSK2193874) (Thorneloe et al. 2012) which are
currently available should be used.

Summary and recommendations
294
7.3 Hyperosmolality and lung injury
Induced hypernatremia leading to an increase in serum
osmolality might be a treatment option for lung injury
Future directions
As the administration of hypertonic saline leads to hyperosmolarity,
hypernatremia and hyperchloremic acidosis, further studies should
examine the differential effects of its administration in an animal
model of lung injury.
Although I have reported a differential effect of high serum sodium
in respiratory patients compared with others, patients with lung
injury were not directly examined, future studies should examine
the effect of high serum sodium in a database of patients with lung
injury (such as DataMart Mayo Clinic, Rochester, Minnesota)
(Herasevich et al. 2010).
Results of these studies could lead to a pilot study of hypertonic
saline administration in patients with lung injury.

Appendix
295
Appendix 1:
SODIUM CONTENT IN COMMONLY USED FLUIDS AND DRUGS.
Medication Sodium Content (mmol)
FLUID
0.9% Saline 155 mmol/L
4% Dextrose & 0.18% Saline 31 mmol/L
20% Saline 3444 mmol/L
4% Albumin) 140 mmol/L
20% Albumin 74 mmol/L
Gelofusin 154 mmol/L
Hartmann (CSL) 131 mmol/L
TRANSFUSIONS
PRC 31.3 mmol/U
FFP
Platelet
44 mmol/U
30.5 mmol/U
Nasogastric FEEDS
Nutrison Concentrated 4.3 mmol/ 100 ml
Nutrison Energy 5.8 mmol/ 100 ml
Nutrison Energy multifibre 5.8 mmol/ 100 ml
Nutrison Low Sodium 1.1 mmol/ 100 ml
Nutrison Multifibre
4.3 mmol/100 ml
Abbotts Nepro 3.7 mmol/ 100 ml
Nutrison Standard 4.3 mmol/ 100 ml
FLUSH
Heparin sodium 155.2 mmol/L (0.9% saline)
Daily 2 lines (8ml/hr) 29. 8 mmol/day (0.9% saline)

Appendix
296
MEDICATIONS
Acetazolamide 500 mg 2.0 mmol/500 mg
Acetylcystein (NAC) 2g
0 mmol/2g
Aciclovir 250 mg 4.2 mmol/g
Adrenaline 1mg/1 ml 0.2 mmol/ml
Adrenaline 1: 10000 (0.1 mg/ml) 0.1 mmol/ml
Amiodarone 150mg/3 ml 0 mmol/ml
Aminophylline 250 mg/10 ml 0 mmol/ml
Amoxacillin 1g 3.3 mmol/g
Ampicillin 1g 2.7 mmol/g
Atropine 1mg/10ml 1.5 mmol/mg
Azithromycin 500mg 5.0 mmol/ 500 mg
Benztropine 2mg/2mL 0.310 mmol/2 mg
Benzylpenicillin 1.2g/vial 3.6 mmol/1.2 g
Betamethasone 5.7 mg/ml 0.1 mmol/ml
Bupivacaine 50 mg/ 20ml vial 0 mmol/vial
Cephazolin 1g 2.0 mmol/g
Cefepime 1g 0 mmol/vial
Cefotaxime 1g 2.2 mmol/g
Ceftriaxone 1g/vial 3.6 mmol/g
Chloramphenicol 1.2g 2.3 mmol/g
Chlorpromazine 50mg/2 ml 0.2 mmol/ 50 mg
Ciprofloxacin 200 mg/100 ml 15.4 mmol/200 mg
Clonazepam 1 mg 0 mmol
Clonidine 150 ug/1 ml 0.2 mmol/ 150ug
Desmopressin (DDAVP) 0 mmol/vial
Dexamethasone 8mg/2 ml 0 mmol/ 8 mg
Diazepam 10 mg/2 ml 0.7 mmol/ 10 mg

Appendix
297
Dicloxacillin 1g 2.2 mmol/g
Digoxin 500 ug/2 ml 0 mmol/ 500 ug
Dobutamine 250 mg 0 mmol/ 250 mg
Dopamine 200 mg/ 5 ml 0 mmol/ 200mg
Ephedine 30 mg/ml 0.1 mmol/ 30 mg
Erythromycin 1g 0 mmol
Esmolol 100 mg/10 ml 0.3 mmol/100 mg
Flucloxacillin 1g 2.2 mmol/g
Fluconazole 200mg/100ml (premix) 15 mmol/200 mg
Flumazenil 0.5 mg/ 5ml 0.8 mmol/0.5 mg
Frusemide 250mg/ 25 ml 0.8 mmol/250mg
Frusemide 20mg/ 2ml 0.3 mmol/ 20 mg
Gentamycin 80 mg/2ml 0.1 mmol/80 mg
Glucagon 1 mg 0 mmol
Glucose IV 50% (25g/50 ml) 0 mmol
Glyceryl 50 mg/10 ml 0 mmol
Haloperidol 5 mg/ml 0 mmol
Heparin Na 155.2 mmol/L (if 0.9% saline)
Hydralazine 20 mg/ampoule 0 mmol
Hydrocortisone 100 mg/2ml 0.3 mmol/100 mg
Imipenem-Cilastatin 500 mg 1.6 mmol/500 mg
Ketamine 10 mg/ml 0.2 mmol/10mg
Lignocaine 1% 5ml 0 mmol
Lincomycin 600mg/2 ml 0 mmol
Linezolid 2mg/ml 5 mmol/300 ml
Meropenem 1g 4.0 mmol/g
Metoclopramide 10 mg/2ml 0.3 mmol/10 mg
Metoprolol 5mg/5ml 0.8 mmol/5ml

Appendix
298
Metronidazole 500 mg/100 ml 13.5 mmol/500 mg
Methylprenisolone Na succinate
1g/16ml
2 mmol/g
MgSO4 2.47g/5 ml 0 mmol
Midazolam 5 mg/ ml 0.1 mmol/5mg
Milrinone 10 mg/10 ml 0 mmol
Morphine 0 mmol
Moxifloxacin 400 mg/250 ml 34 mmol/400 mg
Naloxone 400 mg/ml 0.2 mmol/ 400 mg
Nimodipine 100 mg 0 mmol
Noradrenaline 2mg/ 2 ml 0 mmol/ 2mg
Pantoprazole 40 mg 0.1 mmol/ 40 mg
Phenobarbitone sodium 200 mg/ml < 1 mmol
Phenytoin 250 mg/ 5ml 1.0 mmol/ 250 mg
Phytomenadine 10 mg 0 mmol
Piperacillin 2g 3.7 mmol/ 2g
Piperacillin 4g+ Tazobactam 500 mg 11.1 mmol/vial
Potassium 0 mmol
Propofol 0 mmol
Protamine 50mg/5 ml 0.8 mmol/50 mg
Ranitidine 50 mg/2 ml 0 mmol/ 50 mg
Rifampicin 600 mg 0.1 mmol/vial
Rocuronium < 1 mmol
Sodium bicarbonate 10ml 10 mmol/10 ml
Sodium Nitroprusside 50 mg/ vial 0.3 mmol/50 mg
Sotalol 40 mg/4ml < 1 mmol/100 mg
Suxamethonium 100 mg/2ml 0 mmol
Thiamine 100mg/ml 0 mmol/100 mg
Thiopentone 500 mg 2.5 mmol/ 500 mg

Appendix
299
Timentin 3.1g in 100 ml normal saline 31 mmol mmol/3.1g
Theophyllin 200 mg/50 ml 0 mmol
Trimethoprim 80 mg +
Sulfamethoxozole 400 mg/ 5 ml
0 mmol/5ml
Tropisetron 2 mg/ 2 ml < 1mmol
Vancomycin 0 mmol
Vasopressin 20 unit/ml 0.2 mmol/ml
Vecuronium 10mg/vial 0.1 mmol/10 ml
Verapamil 5 mg/2ml 0.3 mmol/ 5mg
Voriconazole 200 mg 10 mmol
PRC: Packed red blood cells; FFP: Fresh frozen plasma; U: Unit

Appendix
300
Appendix 2
LIST OF PARTICIPATING SITES AND INVESTIGATORS IN THE
ADULT POINT PREVALENCE STUDY
Albury Base Hospital, Albury, NSW, Australia: P Harrigan, C
Mashonganyika
Alfred Hospital, Melbourne, VIC, Australia: A Davies, S Vallance, V
Bennett
Auckland City Hospital, Auckland, New Zealand: S McGuiness, R
Parke, V Cocharne
Auckland DCCM Hospital, Auckland, New Zealand: C McArthur, L
Newby, C Simmonds
Austin Hospital, Melbourne, VIC, Australia: R Bellomo, G Eastwood
Box Hill Hospital, Melbourne, VIC, Australia
Calvary Mater Hospital, Newcastle, NSW Australia: Katrina Ellem
Canberra Hospital, Canberra, ACT, Australia: I Mitchell, E
Crawford, R Ashley
Central Gippsland Health Service, Gippsland, VIC Australia:Jenny
Dennett, Howard Connor
Christchurch Hospital, Christchurch, New Zealand: S Henderson,J
Mehrtens
Concord Hospital, Sydney, NSW, Australia: D Milliss, H Wong
Dandenong Hospital, Melbourne, VIC, Australia: S Vij, B O’Bree, K
Shepherd
Flinders Medical Centre, Adelaide, SA, Australia: S Verghese, E
Ryan, A Waters
Geelong Hospital, Geelong, VIC, Australia: C Carrington, M Fraser,T
Elderkin

Appendix
301
Gold Coast Hospital, Southport,QLD, Australia: B Richards, M
Tallot
Gosford Hospital, Central Coast, NSW, Australia: R Cameron, S
Hatter
Hawke’s Bay Hospital, Hastings, New Zealand: R Freebairn, L
Chadwick
John Hunter Hospital, Newcastle, NSW Australia: Peter Harrigan
Liverpool Hospital, Liverpool, NSW, Australia: M Parr, S Micallef
Macquarie Hospital, Sydney, NSW, Australia: M Parr, D Bhonagiri
Middlemore Hospital, Auckland, New Zealand: T Williams, J Tai, A
Tilsley
Maroondah Hospital, Ringwood East, VIC Australia: David
Charlesworth
Nambour General Hospital, Nambour, QLD Australia: Peter Garrett
Nepean Hospital, Sydney, NSW, Australia: I Seppelt, L Weisbrodt
North Shore Private Hospital, Sydney, NSW, Australia: A Delaney, S
Ash, DL Hogben
North Shore Hospital, Takapuna, New Zealand:Janet Liang
Princess Alexandra Hospital, Brisbane, QLD Australia: Chris Joyce
Royal Adelaide Hospital, Adelaide, SA, Australia: M Chapman, S
O'Connor
Royal Darwin Hospital, Darwin, NT, Australia: D Stephens, J
Thomas
Royal Hobart Hospital, Hobart, TAS, Australia: Andrew Turner &
David Cooper
Appendix
302
Royal Melbourne Hospital, Melbourne, VIC, Australia: C Macisaac, T
Caf
Royal Perth Hospital, Perth, WA, Australia: S Webb, G McEntaggart,
J Chamberlain
Royal Prince Alfred Hospital, Sydney, NSW, Australia: D Gattas, D
Rajbhandari, H Buhr
Sir Charles Gairdner Hospital, Perth, WA, Australia: S Baker, B
Roberts
St George Hospital, Sydney, NSW, Australia: J Myburgh, V Dhiacou
St Vincent’s Hospital, Melbourne, VIC, Australia: J Santamaria, R
Smith
St Vincent’s Hospital, Sydney, NSW, Australia: P Nair, C Burns, C
Reynolds
Tauranga Hospital, Tauranga, New Zealand: T Browne, J Goodson
The Queen Elizabeth Hospital, Adelaide, SA, Australia: S Peake, P
Williams, C Kurenda
Toowoomba Hospital, Toowoomba, QLD Australia: Indranil
Chatterjee
Townsville Hospital, Townsville, QLD, Australia: G Gordon, L Jones
Waikato Hospital, Hamilton, New Zealand: Mary La Pine
Wellington Regional Hospital, Wellington, New Zealand: D Dinsdale,
D Mackle, L Andrews
Western Health, Melbourne, VIC, Australia: Craig French
Westmead Hospital, Sydney, NSW, Australia: A Bannerjee, C Skelly
Wollongong Hospital, Sydney, NSW, Australia: M Sterba, B Johnson

Appendix
303
Appendix 3
LIST OF PARTICIPATING SITES AND INVESTIGATORS IN THE
PAEDIATRIC POINT PREVALENCE STUDY
Children's Hospital Westmead, NSW, Australia: M Festa
John Hunter Children’s Hospital, NSW, Australia: P Harrigan, M
Hardie
Mater Children’s Hospital, Brisbane, QLD, Australia:
Princess Margaret Hospital for Children, Perth, WA, Australia: S
Erickson , J Abe
Royal Children's Hospital, Brisbane, QLD, Australia: A Slater, D
Long, S Kendall
Royal Children's Hospital, Melbourne, VIC, Australia: W Butt, C
Delzoppo
Royal Hobart Hospital, Hobart, TAS, Australia: A Turner. D Cooper,
R McAllister
Starship Children's Hospital, Auckland, New Zealand: J Beca, L
Segedin, C Sherring, M Rea
Sydney Children’s Hospital, Sydney, NSW, Australia: ML Morritt, G
Williams, J Young
Women's and Children's Hospital, Adelaide, SA, Australia: M
Yung,G Letton

Appendix
304
Appendix 4: LIST OF ETHICS APPROVALS
Ethics
committee
Study name Relevant
section
Approval
number
Southern
Adelaide Human
Research Ethics
Committee
South Australia
A Pilot Study of Retrospective
Analysis of Sodium Administered
in
Patients with Prolonged
Mechanical Ventilation
Section 3.1 216.09
Southern
Adelaide Human
Research Ethics
Committee
South Australia
Dialysis : Does it contribute or
remove sodium in critically ill
patients
Section 3.4 361.11
Southern
Adelaide Human
Research Ethics
Committee
South Australia
A prospective study evaluating
the effects of daily sodium
administration and balance on
volume status, oxygenation and
ventilation parameters.
Section 4.1 036.11
Southern
Adelaide Human
Research Ethics
Committee
South Australia
A prospective, multicentre
observational study in patients
admitted to intensive care to
estimate daily sodium balance
Section 4.2 420.11
Southern
Adelaide Human
Research Ethics
Committee
South Australia
Post Resuscitation fluId
boluses in severe sepsis or
septic shoCk: prevalence and
Efficacy (PRICE study)
Section 5.1 289.11
Southern
Adelaide Human
Research Ethics
Committee
South Australia
Early serum sodium and
mortality in critically ill
patients
Section 6.1 118.12
Southern
Adelaide Human
Research Ethics
Committee
South Australia
Is high serum osmolality be
protective for critically ill
patients admitted with
respiratory diagnosis
Section 6.2 285.13
Southern Do the commonly Section 5.3 263.12

Appendix
305
Adelaide Human
Research Ethics
Committee
South Australia
administered fluids differ in
their propensity to affect
respiratory and cardiac
variables in healthy human
volunteers?
Animal Ethics
Review
Committee
Flinders
University
South Australia
Does the fluids and their
components affect lung
damage in an animal model
of lung injury
Section 5.4
and 6.3
812.12

Appendix
306
Appendix 5: LIST OF PUBLICATIONS AND PRESENTATIONS
ARISING FROM CANDIDATURE
PEER REVIEWED ARTICLES
Bihari S, Ou J, Holt AW, Bersten AD. Inadvertent sodium loading in critically
ill patients. Crit Care Resusc. 2012;14:33-37. 7 citations
Bihari S, Baldwin C and Bersten AD. Fluid balance does not predict estimated
sodium balance in critically ill mechanically ventilated patients. Crit Care
Resusc 2013; 15: 89-96. Study had an editorial with it.
Bihari S, Prakash S, Bersten AD. Post Resuscitation Fluid Boluses In Severe
Sepsis Or Septic Shock: Prevalence And Efficacy (PRICE Study). ajrccm-
conference.2013.187.1_MeetingAbstracts.A3952.
Bihari S, Prakash S, Bersten AD. Post resuscitation fluid boluses in patients
with severe sepsis and septic shock (PRICE study). Shock 2013; 40: 28-34. 10
citations. Study had an editorial with it.
Bihari S, Peake S, Bailey M, Pilcher D, Prakash S, Bersten AD High Admission
Serum Sodium Does Not Affect ICU Mortality In Patients With Acute
Respiratory Diseases. ajrccm conference. 2013.187.1_Meeting
Abstracts.A1591.
Bihari S, Peake SL, Seppelt IM, Williams P, Bersten AD. Sodium
administration in critically ill patients in Australia and New Zealand: a multi-
centre point prevalence study Crit Care Resusc 2013; 15: 294-300. Study had
an editorial with it.
Bihari S, Taylor S, and Bersten AD. Inadvertent sodium loading with renal
replacement therapy in critically ill patients. J Nephrol. 2014 Feb 4. [Epub
ahead of print]
Bihari S, Festa M, Peake SL, Seppelt IM, Williams P, Wilkins B and Bersten
AD. Sodium administration in critically ill paediatric patients in Australia and
New Zealand: a multi-centre point prevalence study. Crit Care Resusc 2014;
16: 112-118.
Bihari S, Peake S, Bailey M, Pilcher D, Prakash S, Bersten AD. Admission high
serum sodium is not associated with increased ICU mortality risk in
respiratory patients. J Crit Care. 2014 [Epub ahead of print].
Bihari S, Dixon D and Bersten AD. Ruthenium Red Inhibits Intravenous Fluid
Induced Permeability Lung Oedema Suggesting A TRPV4 Mechanism. ajrccm-
conference. Meeting Abstracts. 2014 .ID A3275.
Bihari S, Wiersema U, Schembri D, Depasquale C, Bowden J, Dixon D and
Bersten AD. Interstitial Pulmonary Edema Despite Normal Echocardiographic
Indices In Healthy Volunteers Following Bolus I.V. 0.9% Saline. ajrccm-
conference Meeting Abstracts. 2014 .ID A3276.
Bihari S, Dixon D and Bersten AD. Hypernatremia Reduces Acute Lung
Injury, Independent Of Fluid Or Sodium Load. ajrccm-conference Meeting
Abstracts. 2014 .ID A5001.
Bihari S, Prakash S, Bersten AD. Low-dose vasopressin in addition to
noradrenaline may lead to faster resolution of organ failure in patients with
severe sepsis/septic shock accepted in Anaesth Intensive Care 2014; 42:
Dixon D, Depasquale C, Bihari S and Bersten AD. Lung Mediators Of
Leukocyte Infiltration And Activation In Chronic Heart Failure Patients,
ajrccm-conference. Meeting Abstracts. 2014.ID A5853.

Appendix
307
Bihari S, Prakash S, Bersten AD. Early changes in serum electrolytes and
acid-base status with administration of 4% albumin. Intensive Care Med.
2014; 40:1392-3.
Bihari S, Peake S, Prakash S, Saxena M, Campbell V, Bersten AD. Sodium
balance, not fluid balance, is associated with respiratory dysfunction in
mechanically ventilated patients: a prospective, multi-centre study.
manuscript accepted in Crit Care Resusc 2015.
Bihari S, Dixon D, Lawrence M and Bersten AD. Induced hypernatremia
reduces acute lung injury, independent of fluid or sodium load. Manuscript
under review.
Bihari S, Wiersema U, Schembri D, Depasquale C, Dixon D, Lawrence M,
Bowden J, Dixon D and Bersten AD. Interstitial pulmonary edema despite
normal echocardiographic indices in healthy volunteers following 0.9% Saline bolus when compared with 4% albumin and 5% glucose. Manuscript under
review.
Bihari S, Dixon D, Lawrence M and Bersten AD. Ruthenium red inhibits
intravenous fluid induced permeability lung oedema suggesting a TRPV4
mechanism. Manuscript under review.
Book Chapter
Bihari S and Bersten AD. Sodium loading in critical care - textbook “Diet and
Nutrition in Critical Care” under “Specific nutrients” published by Springer
2013
Presentations (selected)
2014 National ANZICS Annual scientific meeting
2014 International American Thoracic society- San Diego USA
2014 National TSANZSRS Annual Scientific Meeting
2014 National ANZICS clinical trial group (CTG) annual meeting
2013 National Australian Society of medical research
2013 International American Thoracic society- Philadelphia USA
2012 International American Thoracic society – San Francisco USA
2012 National Australian Society of medical research
2012 National ANZICS Annual scientific meeting
2012 National ANZICS clinical trial group (CTG) annual meeting
References
308
References
Abotts, Nutritional Information Nepro, 2011, ‘Nephro with Carb Steady-
Therapeutic Nutrition for People on Dialysis’ [Online] http,//nepro.com.
(accessed October 2012).
ACCP/SCCM Consensus Conference Committee, American College of
Chest Physicians/Society of Critical Care Medicine Consensus Conference,
1992, ‘Definitions for sepsis and organ failure and guidelines for the use of
innovative therapies in sepsis’ Crit Care Med, 20, 864-874.
Acquarone N, Garibotto G, Pontremoli R, et al. 1989, ‘Hypernatremia
associated with severe rhabdomyolysis’ Nephron, 51,441-442.
Addleman M, Logan AS, Grossman RF. 1985, ‘Monitoring intrapulmonary
hemorrhage in Goodpasture's syndrome’ Chest, 87,119-20.
Adrogué HJ, Madias NE. 2000, ‘Hypernatremia’ N Engl J Med, 342,1493-
1499.
Agrawal A, Matthay MA, Kangelaris KN, et al. 2013, ‘Plasma angiopoietin-2
predicts the onset of acute lung injury in critically ill patients’ Am J Respir
Crit Care Med, 187,736-42.
Agricola E, Bove T, Oppizzi M, et al. 2005, ‘"Ultrasound comet-tail images",
a marker of pulmonary edema, a comparative study with wedge pressure
and extravascular lung water’ Chest, 127,1690-5.
Albert RK. 2012, ‘The role of ventilation-induced surfactant dysfunction
and atelectasis in causing acute respiratory distress syndrome’ Am J
Respir Crit Care Med, 185,702-8.
Alphonsus CS, Rodseth RN. 2014, ‘The endothelial glycocalyx, a review of
the vascular barrier’ Anaesthesia, 69, 777-84.
Alsous F, Khamiees M, DeGirolamo A, et al. 2000, ‘Negative fluid balance
predicts survival in patients with septic shock, a retrospective pilot study’
Chest, 117, 1749-1754.
Alvarez DF, King A, Weber D, et al, 2006,‘Transient receptor potential
vanilloid 4-mediated disruption of alveolar septal barrier, novel
mechanism of acute lung injury’ Circ Res,99,988-95.
Andrivet P, Adnot S, Brun-Buisson C, et al. 1988, ‘Involvement of ANF in
the acute antidiuresis during PEEP ventilation’ J Appl Physiol,65,1967–
1974.
Andrzejewski C Jr, Casey MA, Popovsky MA. 2013, ‘How we view and
approach transfusion-associated circulatory overload, pathogenesis,
diagnosis, management, mitigation, and prevention’ Transfusion, 53,3037-
47.
References
309
Angle N, Hoyt DB, Coimbra R, et al. 1998, ‘Hypertonic saline resuscitation
diminishes lung injury by suppressing neutrophil activation after
hemorrhagic shock’ Shock, 1998, 9,164-70.
Angus DC, Linde-Zwirble WT, Lidicker J, et al. 2001, ‘Epidemiology of
severe sepsis in the United States, analysis of incidence, outcome, and
associated costs of care’ Crit Care Med, 29,1303–1310.
Arikan AA, Zappitelli M, Goldstein SL, et al. 2012, ‘Fluid overload is
associated with impaired oxygenation and morbidity in critically ill
children’ Pediatr Crit Care Med, 2012,13,253-8.
Arroliga AC, Ghamra ZW, Perez Trepichio A, et al. 2002, ‘Incidence of
ARDS in an adult population of northeast Ohio’ Chest,121,1972–1976.
Asadollahi K, Beeching N, Gill G. 2006, ‘Hyponatraemia as a risk factor for
hospital mortality’ QJM, 99, 877–80.
Ashbaugh DG, Bigelow DB, Petty TL, Levine BE. 1967, ‘Acute respiratory
distress in adults’ Lancet, 1967,2,319–323.
Australian Government National Health and Medical Research Council,
New Zealand Ministry of Health. Sodium. 2014, ‘Nutrient reference values
for Australia and New Zealand including recommended dietary intakes’
http,//www.nrv.gov.au/nutrients/sodium.htm (accessed Apr 2014).
Awad S, Allison SP, Lobo DN 2008, ‘The history of 0.9% saline’ Clin
Nutr,27,179–188.
Axler O, Tousignant C, Thompson CR, et al. 1997, ‘Small hemodynamic
effect of typical rapid volume infusions in critically ill patients’ Crit Care
Med, 25, 965-970.
Baghurst PA, Norton L, Slater A 2008, ‘ANZICS Paediatric Study Group.
The application of risk-adjusted control charts using the Paediatric Index
of Mortality 2 for monitoring paediatric intensive care performance in
Australia and New Zealand’ Intensive Care Med,34,1281-8.
Balakrishna S, Song W, Achanta S, et al. 2014, ‘TRPV4 inhibition
counteracts edema and inflammation and improves pulmonary function
and oxygen saturation in chemically induced acute lung injury’ Am J
Physiol Lung Cell Mol Physiol, 15, 307, L158-72.
Balasubramanian K, Kumar P, Saini SS, et al. 2012, ‘Isotonic versus
hypotonic fluid supplementation in term neonates with severe
hyperbilirubinemia – a double blind, randomized controlled trial’ Acta
Paediatr,101, 236–41.
Baldi G, Gargani L, Abramo A, et al. 2013, ‘Lung water assessment by
lung ultrasonography in intensive care, a pilot study’ Intensive Care Med,
39, 74-84.

References
310
Baldwin CE, Paratz JD, Bersten AD. 2012, ‘Body composition analysis in
critically ill survivors, a comparison of bioelectrical impedance
spectroscopy devices’ J Parenter Enteral Nutr, 35, 306-15.
Barbier C, Loubières Y, Schmit C, et al. 2004, ‘Respiratory changes in
inferior vena cava diameter are helpful in predicting fluid responsiveness
in ventilated septic patients’ Intensive Care Med, 30, 1740-6.
Bartlett, G.R., 1959, ‘Phosphorus assay in column chromatography’ J.
Biol. Chem, 234,466-468.
Bates JH, Daróczy B, Hantos Z. 1992, ‘A comparison of interrupter and
forced oscillation measurements of respiratory resistance in the dog’ J
Appl Physiol (1985), 72, 46-52.
Becker D, Bereiter-Hahn J, Jendrach M. 2009, ‘Functional interaction of
the cation channel transient receptor potential vanilloid 4 (TRPV4) and
actin in volume regulation’ European Journal of Cell Biology, 88, 141–152.
Bellomo R. 2014, ‘Issue and challenges of fluid removal in the critically ill’
Br J Anaesth, epub May 31.
Berger G, Guetta J, Klorin G, et al. 2011, ‘Sepsis impairs alveolar
epithelial function by downregulating Na-K-ATPase pump’ Am J Physiol
Lung Cell Mol Physiol, 301,L23-30.
Bersten AD, Edibam C, Hunt T, Moran J. 2002, ‘Incidence and mortality of
acute lung injury and the acute respiratory distress syndrome in three
Australian states’ Am J Respir Crit Care Med, 165, 443–448.
Bersten AD. 2006, ‘Fluid management in the ventilated patient’ Tobin MJ,
editor, ‘Principles and Practice of Mechanical Ventilation’ McGraw-Hill
Professional Publishing, 1323-1333.
Bertone JJ, Gossett KA, Shoemaker KE, et al. 1990, ‘Effect of hypertonic
vs isotonic saline solution on responses to sublethal Escherichia coli
endotoxemia in horses’ Am J Vet Med, 51, 999.
Bligh EG, Dyer WJ 1959, ‘A rapid method of total lipid extraction and
purification’ Can J Biochem Physiol, 37,911-917.
Boemke W, Krebs M, Djalali K, et al. 1998, ‘Renal nerves are not involved
in sodium and water retention during mechanical ventilation in dogs’
Anesthesiology, 89, 942–953.
Bouchard J, Soroko SB, Chertow GM, et al 2009, ‘Fluid accumulation,
survival and recovery of kidney function in critically ill patients with acute
kidney injury’ Kidney Int, 76,422–427.
Boyd JH, Forbes J, Nakada TA, et al. 2011, ‘Fluid resuscitation in septic
shock, a positive fluid balance and elevated central venous pressure are
associated with increased mortality’ Crit Care Med, 39, 259-65.

References
311
Brater DC. 1994, Pharmacokinetics of loop diuretics in congestive heart
failure, Br Heart J, 72,S40-3.
Bratusch-Marrain PR, DeFronzo RA. 1983, ‘Impairment of insulin-
mediated glucose metabolism by hyperosmolality in man’ Diabetes’
32,1028-1034.
Bruegger D, Jacob M, Rehm M, et al. 2005, ‘Atrial natriuretic peptide
induces shedding of endothelial glycocalyx in coronary vascular bed of
guinea pig hearts’ Am J Physiol Heart Circ Physiol, 289, H1993-9.
Brunkhorst FM, Engel C, Bloos F, et al. 2008, ‘Intensive insulin therapy
and pentastarch resuscitation in severe sepsis’ N Engl J Med, 358, 125–
39.
Bulger EM, Jurkovich GJ, Nathens AB, et al. 2008, ‘Hypertonic
resuscitation of hypovolemic shock after blunt trauma, a randomized
controlled trial’ Arch Surg, 143,139-48.
Burridge N. 2008, ‘Australian Injectable Drugs Handbook’ Collingwood,
The Society of Hospital Pharmacists of Australia.
Caironi P, Tognoni G, Masson S, et al. 2014, ‘Albumin replacement in
patients with severe sepsis or septic shock’ N Engl J Med, 370,1412-21.
Calfee CS, Gallagher D, Abbott J, et al. 2012, ‘Plasma angiopoietin-2 in
clinical acute lung injury, prognostic and pathogenetic significance’ Crit
Care Med, 40,1731-7.
Calvin JE, Driedger AA, Sibbald WJ. 1981, ‘The hemodynamic effect of
rapid fluid infusion in critically ill patients’ Surgery, 90,61-75,.
Chen L, Liu C, & Liu L. 2009, ‘Osmolality-induced tuning of action
potentials in trigeminal ganglion neurons’ Neuroscience Letters, 452, 79–
83.
Chen L, Liu C, Liu L, Cao X. 2009, ‘Changes in osmolality modulate
voltage-gated sodium channels in trigeminal ganglion neurons’
Neuroscience Research’ 64, 199–207.
Choi PT, Yip G, Quinonez LG, Cook DJ. 1999, ‘Crystalloids vs. colloids in
fluid resuscitation, a systematic review’ Crit Care Med, 27 ,200-10.
Choong K, Arora S, Cheng J et al. 2011, ‘Hypotonic versus isotonic
maintenance fluids after surgery for children, a randomized controlled
trial’ Pediatrics, 128, 857-66.
Chowdhury AH, Cox EF, Francis ST, Lobo DN. 2012, ‘A Randomized,
Controlled, Double-Blind Crossover Study on the Effects of 2-L Infusions
of 0.9% Saline and Plasma-Lyte 148 on Renal Blood Flow Velocity and
Renal Cortical Tissue Perfusion in Healthy Volunteers’ Ann Surg, 256,
18-24.

References
312
Corcoran T, Rhodes JE, Clarke S, et al. 2012, ‘Perioperative fluid
management strategies in major surgery, a stratified meta-analysis’
Anesth Analg, 114,640-51
Coulthard MG, Long DA, Ullman AJ, et al 2012, ‘A randomised controlled
trial of Hartmann's solution versus half normal saline in postoperative
paediatric spinal instrumentation and craniotomy patients’ Arch Dis
Child, 97, 491-6.
D’Orio V, Mendes P, Carlier P, et al, 1991, ‘Lung fluid dynamics and
supply dependency of oxygen uptake during experimental endotoxic shock
and volume resuscitation’ Crit Care Med, 19,955–962.
D’Orio V, Wahlen C, Rodriguez LM, et al, 1987, ‘Effects of intravascular
volume expansion on lung fluid balance in a canine model of septic shock’
Crit Care Med, 15, 863–868.
Darmon M, Diconne E, Souweine B, et al. 2013, ‘Prognostic consequences
of borderline dysnatremia, pay attention to minimal serum sodium
change’ Critical Care, 17, R12.
Davidson KG, Bersten AD, Barr HA, et al. 2002, ‘Endotoxin induces
respiratory failure and increases surfactant turnover and respiration
independent of alveolocapillary injury in rats’ Am J Respir Crit Care Med,
165, 1516-25.
Davidson KG, Bersten AD, Barr HA, et al. 2000, ‘Lung function,
permeability, and surfactant composition in oleic acid-induced acute lung
injury in rats’ Am J Physiol Lung Cell Mol Physiol, 279, L1091-102.
de Paula FM, Peixoto AJ, Pinto LV, et al. 2004, ‘Clinical consequences of
an individualized dialysate sodium prescription in hemodialysis patients’
Kidney Int 2004, 66,1232–1238.
Deitch EA, Shi HP, Feketeova E, et al. 2003, ‘Hypertonic saline
resuscitation limits neutrophil activation after trauma-hemorrhagic shock’
Shock, 19,328-33.
Delaney A, Peake SL, Bellomo R, et al. 2013, ‘The Australasian
Resuscitation in Sepsis Evaluation (ARISE) trial statistical analysis plan’
Crit Care Resusc, 15,162-71.
Delaney AP, Dan A, McCaffrey J, Finfer S. 2011, ‘The role of albumin as a
resuscitation fluid for patients with sepsis, a systematic review and meta-
analysis’ Crit Care Med 39,386-91.
Dixon D-L, Barr H, Bersten AD, Doyle IR. 2008, ‘Intracellular storage of
surfactant and proinflammatory cytokines in co-cultured alveolar
epithelium and macrophages in response to increasing CO2 and cyclic cell
stretch’ Exp Lung Res, 34, 37-47.

References
313
Dixon DL, De Pasquale CG, De Smet HR, et al. 2009, ‘Reduced Surface
Tension Normalizes Static Lung Mechanics in a Rodent Chronic Heart
Failure Model’ Am J Respir Crit Care Med, 180,181-7.
Dixon DL, De Smet HR, Bersten AD. 2009, ‘Lung mechanics are both dose
and tidal volume dependant in LPS-induced lung injury’ Respir Physiol
Neurobiol, 167, 333-40.
Dorresteijn MJ, van Eijk LT, Netea MG, et al. 2005, ‘Iso-osmolar
prehydration shifts the cytokine response towards a more anti-
inflammatory balance in human endotoxemia’ J Endotoxin Res, 11, 287–
293.
dos Santos CC, Shan Y, Akram A, et al. 2011, ‘Neuroimmune regulation of
ventilator-induced lung injury’ Am J Respir Crit Care Med, 183,471-82.
Doyle JT, Wilson JS, Estes EH, et al. 1951, ‘The effect of intravenous
infusions of physiologic saline solution on the pulmonary arterial and
pulmonary capillary pressure in man’. J. Clin. Invest. 30, 345–352.
Druml W, Kleinberger G, Lenz K, et al. 1986, ‘Fructose-induced
hyperlactemia in hyperosmolar syndromes’ KlinWochenschr, 64 ,615-618.
Drummer C1, Gerzer R, Heer M, et al. 1992, ‘Effects of an acute saline
infusion on fluid and electrolyte metabolism in humans’ Am J Physiol,
262, F744-54.
Durairaj L, Schmidt GA. 2008, ‘Fluid therapy in resuscitated sepsis, less
is more’ Chest 133, 252–263.
Elder ASF, Bersten AD, Saccone GTP, Dixon DL. 2013, ‘Tripeptide feG
prevents and ameliorates acute pancreatitis-associated acute lung injury
in a rodent model’ Chest, 143,371-8.
Farney RJ, Morris AH, Gardner RM, and Armstrong JD Jr. 1977,
‘Rebreathing pulmonary capillary and tissue volume in normals after
saline infusion’ J Appl Physiol, 43, 246–253.
Feissel M, Michard F, Faller JP, Teboul JL 2004, ‘The respiratory variation
in inferior vena cava diameter as a guide to fluid therapy’ Intensive Care
Med, 30,1834-7.
Fiedler U, Reiss Y, Scharpfenecker M, et al. 2006, ‘Angiopoietin-2
sensitizes endothelial cells to TNF-alpha and has a crucial role in the
induction of inflammation’ Nat Med, 12, 235-9.
Fiedler U, Scharpfenecker M, Koidl S, et al. 2004, ‘The Tie-2 ligand
angiopoietin-2 is stored in and rapidly released upon stimulation from
endothelial cell Weibel-Palade bodies’ Blood, 103,4150-6.

References
314
Finfer S, Bellomo R, Boyce N et al. 2004, ‘A comparison of albumin and
saline for fluid resuscitation in the intensive care unit’ N Engl J Med,
350,2247-56.
Finn PJ, Plank LD, Clark MA, et al. 1996, ‘Progressive cellular dehydration
and proteolysis in critically ill patients’ Lancet, 347, 654-6.
Firstenberg MS, Levine BD, Garcia MJ, et al. 2000, ‘Relationship of
echocardiographic indices to pulmonary capillary wedge pressures in
healthy volunteers’ J Am Coll Cardiol, 36,1664-9.
Foland JA, Fortenberry JD, Warshaw BL, et al. 2004, ‘Fluid overload
before continuous hemofiltration and survival in critically ill children, a
retrospective analysis’ Crit Care Med, 32,1771–1776.
Forman S, Crofton P, Huang H et al. 2012, ‘The epidemiology of
hypernatraemia in hospitalised children in Lothian, a 10-year study
showing differences between dehydration, osmoregulatory dysfunction and
salt poisoning’ Arch Dis Child, 97, 502-7.
Forrester JS, Diamond G, Chatterjee K et al 1976, ‘Medical therapy of
acute myocardial infarction by application of hemodynamic subsets’, N
Engl J Med, 295,1356-62.
Frazier SK. 1999, ‘Neurohormonal responses during positive pressure
mechanical ventilation’ heart & lung, 28, 149-165.
Funk GC, Lindner G, Druml W, et al. 2010, ‘Incidence and prognosis of
dysnatremias present on ICU admission’ Intensive Care Med, 36, 304-11.
Gamrin L, Essen P, Forsberg AM, et al. 1996, ‘A descriptive study of
skeletal muscle metabolism in critically ill patients, free amino acids,
energy-rich phosphates, protein, nucleic acids, fat, water, and electrolytes’
Crit Care Med, 24, 575-83.
Gao J, Zhou L, Ge Y, et al. 2013, ‘Effects of different resuscitation fluids
on pulmonary expression of aquaporin1 and aquaporin5 in a rat model of
uncontrolled hemorrhagic shock and infection’ PLoS One, 8, e64390.
Garcia-Elias A, Lorenzo IM, Vicente R, et.al. 2008, ‘IP3 receptor binds to
and sensitizes TRPV4 channel to osmotic stimuli via a calmodulin-binding
site’ Journal of Biological Chemistry, 283, 31284–31288.
Gelens M, Luik AJ, Kleffens M, et al. 2002, ‘A dialysate sodium
concentration of 140 mmol/l may lead to net diffusive sodium gain’ Blood
Purif, 20,190.
George C, Bellomo R. 2007, ‘Changes in the incidence and outcome for
early acute kidney injury in a cohort of Australian intensive care units’
Crit Care, 11,R68.
References
315
Goettsch W, Gryczka C, Korff T, et al. 2008, ‘Flow-dependent regulation of
angiopoietin-2’ J Cell Physiol, 214, 491-503.
Goldsmith SR, 2006, ‘The role of vasopressin in congestive heart failure’
Cleve Clin J Med 2006, 3, S19–S23.
Goldstein SL, Somers MJ, Baum MA, et al. 2005, ‘Pediatric patients with
multi-organ dysfunction syndrome receiving continuous renal replacement
therapy’ Kidney Int, 67, 653–658.
Goldstein SL, Somers MJ, Brophy PD, et al. 2004, ‘The Prospective
Pediatric Continuous Renal Replacement Therapy (ppCRRT) Registry,
design, development and data assessed’ Int J Artif Organs, 27,9–14.
Gray DS, Crider JB, Kelley C, Dickinson LC. 1985, ‘Accuracy of recumbent
height measurement’ J Parenter Enteral Nutr, 9, 712-5.
Greenfield LJ, Ebert PA, Benson DW. 1964, ‘Effect of positive pressure
ventilation on surface tension proterties of lung extracts’ Anesthesiology,
25,312–316.
Hahn RG. 2010, ‘Volume kinetics for infusion fluids’ Anesthesiology, 113,
470-81.
Hall WH, Ramachandran R, Narayan S, et al. 2004, ‘An electronic
application for rapidly calculating Charlson comorbidity score’ BMC
Cancer, 4, 94.
Halperin BD, Feeley TW, Chiles C, et al. 1985, ‘Evaluation of the portable
chest roentgenogram for quantitating extravascular lung water in critically
ill adults’ Chest, 88, 649-52.
Hamanaka K, Jian MY, Weber DS, et al. 2007, ‘TRPV4 initiates the acute
calcium-dependent permeability increase during ventilator-induced lung
injury in isolated mouse lungs’ Am J Physiol Lung Cell Mol Physiol, 293,
L923–L932.
Hauser CJ, Shoemaker WC, Turpin I, Goldberg SJ. 1977, ‘Oxygen
transport response to colloids and crystalloids in critically ill surgical
patients’ Surg Gynecol Obstet, 150, 811-816.
Henderson AC, Sá RC, Barash IA, et al. 2012, ‘Rapid intravenous infusion
of 20 mL/kg saline alters the distribution of perfusion in healthy supine
humans’ Respir Physiol Neurobiol, 180,331-41.
Herasevich V, Pickering BW, Dong Y, et al. 2010, ‘Informatics
infrastructure for syndrome surveillance, decision support, reporting, and
modeling of critical illness’ Mayo Clin Proc, 85, 247-54.
Hogg JC, Agarawal JB, Gardiner AJS, et al. 1972, ‘Distribution of airways
resistance with developing pulmonary oedema in dogs’ J Appl Physiol,
32,20 –24.

References
316
Holcroft JW, Vassar MJ, Turner J E, et al. 1987, ‘3% NaCl and 7.5%
NaCl/dextran 70 in the resuscitation of severely injured patients’ Ann
Surg, 206, 279-88.
Hollenberg SM, Dumasius A, Easington C, et al. 2001, ‘Characterization
of a hyperdynamic murine model of resuscitated sepsis using
echocardiography’ Am J Respir Crit Care Med, 164,891–895.
Holliday MA, Segar WE, Friedman A. 2003, ‘Reducing errors in fluid
therapy’ Pediatrics, 111, 424–5.
Holmes CL, Patel BM, Russell JA, et al. 2001, ‘Physiology of vasopressin
relevant to management of septic shock’ Chest, 120, 989–1002.
Hoorn EJ, Betjes MG, Weigel J, et al. 2008, ‘Hypernatremia in critically ill
patients, too little water and too much salt’ Nephrol Dial Transplant, 2008,
23, 1562-8.
Horton JW, and Walker PB. 1991, ‘Small-volume hypertonic saline
dextran resuscitation from canine endotoxin shock’ Ann. Surg, 214, 64.
Hoste EA, Clermont G, Kersten A, et al, 2006, ‘RIFLE criteria for acute
kidney injury are associated with hospital mortality in critically ill
patients, a cohort analysis. Crit Care, 10, R73.
Humphrey H, Hall J, Sznajder I, et al. 1990, ‘Improved survival in ARDS
patients associated with a reduction in pulmonary capillary wedge
pressure’ Chest, 97,1176-1180.
Ichimura H, Parthasarathi K, Quadri S, et al. 2003, ‘Mechano-oxidative
coupling by mitochondria induces proinflammatory responses in lung
venular capillaries’ J Clin Invest, 111, 691-9.
Ingraham AM, Cohen ME, Raval MV, et al. 2011, ‘Comparison of hospital
performance in emergency versus elective general surgery operations at
198 hospitals’ J Am Coll Surg, 212, 20-28.
Intersalt. 1988, ‘An international study of electrolyte excretion and blood
pressure. Results for 24 hour urinary sodium and potassium excretion’
Intersalt Cooperative Research Group, BMJ, 297, 319–328.
Iselin H, Tsinalis D, Brunner FP, 2001, ‘Sodium balance-neutral sodium
profiling does not improve dialysis tolerance’ Swiss Med Wkly, 131,635-9.
Iwasaki Y, Gaskill MB, Robertson GL. 1995, ‘Adaptive resetting of the
volume control of vasopressin secretion during sustained hypovolemia’ Am
J Physiol, 268, R349–R357.
Jacob M, Chappell D, Rehm M. 2009, ‘The ‘third space’ – fact or fiction?’
Best Pract Res Clin Anaesthesiol, 23, 145–157.

References
317
Jacob M, Paul O, Mehringer L, et al. 2009, ‘Albumin augmentation
improves condition of guinea pig hearts after 4 hr of cold ischemia’
Transplantation, 87,956-65.
Jacob M, Saller T, Chappell D, et al. 2013, Physiological levels of A-, B-
and C-type natriuretic peptide shed the endothelial glycocalyx and
enhance vascular permeability, Basic Res Cardiol, 108, 347.
Jambrik Z, Monti S, Coppola V, et al. 2004, ‘Usefulness of ultrasound lung
comets as a nonradiologic sign of extravascular lung water’ Am J Cardiol,
93, 1265-70.
James MF, Michell WL, Joubert IA et al. 2011, ‘Resuscitation with
hydroxyethyl starch improves renal function and lactate clearance in
penetrating trauma in a randomized controlled study, the FIRST trial
(Fluids in Resuscitation of Severe Trauma)’ Br J Anaesth, 107, 693–702.
Jeon K, Shin TG, Sim MS, et al. 2012, ‘Improvements in compliance with
resuscitation bundles and achievement of end points after an educational
program on the management of severe sepsis and septic shock’ Shock,
37,463-7.
Jian Y, King A, Al-Mehdi AB, et al. 2008, ‘High vascular pressure-induced
lung injury requires P450 epoxygenase-dependent activation of TRPV4’ Am
J Resp Cell Mol Biol, 38, 386-92.
Junger WG, Rhind SG, Rizoli SB, et al. 2012, ‘Resuscitation of Traumatic
Hemorrhagic Shock Patients With Hypertonic Saline-Without Dextran-
Inhibits Neutrophil and Endothelial Cell Activation, Shock, 38, 341-350.
Jungmann E, Schifferdecker E, Rümelin A, et al. 1987, ‘Plasma renin
activity and aldosterone behavior in critically ill patients’ Klin Wochenschr,
65, 87-91.
Jurek SC, Hirano-Kobayashi M, Chiang H, et al. 2014, ‘Prevention of
Ventilator-Induced Lung Edema by Inhalation of Nanoparticles Releasing
Ruthenium Red’ Am J Resp Cell Mol Biol, (epub).
Kaczmarczyk G, Rossaint R, Altmann C, et al. 1992, ‘ACE inhibition
facilitates sodium and water excretion during PEEP in conscious volume
expanded dogs’ J Appl Physiol, 73, 962–967.
Kaestle SM, Reich CA, Yin N, et al 2007, ‘Nitric oxide-dependent inhibition
of alveolar fluid clearance in hydrostatic lung edema’ Am J Physiol Lung
Cell Mol Physiol, 293,L859-69.
Kaufmann MA1, Castelli I, Pargger H, Drop LJ. 1995, ‘Nitric oxide dose-
response study in the isolated perfused rat kidney after inhibition of
endothelium-derived relaxing factor synthesis, the role of serum albumin’
J Pharmacol Exp Ther, 273,855-62.
References
318
Keen ML, Gotch FA, 2007, ‘The association of the sodium ‘‘setpoint’’ to
interdialytic weight gain and blood pressure in hemodialysis patients’ Int
J Artif Organs, 30,971–979.
Kendrick KR1, Baxi SC, Smith RM. 2000, ‘Usefulness of the modified 0-10
Borg scale in assessing the degree of dyspnea in patients with COPD and
asthma’ J Emerg Nurs, 26,216-22.
Kennedy MT, Higgins BD, Costello JF, et al. 2008, ‘Hypertonic saline
reduces inflammation and enhances the resolution of oleic acid induced
acute lung injury’ BMC Pulm Med, 8,9.
Kim JY, Choi SH, Yoon YH, et.al. 2013, ‘Effects of hypertonic saline on
macrophage migration inhibitory factor in traumatic conditions’ Exp Ther
Med, 5, 362-366.
King LS, Nielsen S, Agre P, Brown RH. 2002, ‘Decreased pulmonary
vascular permeability in aquaporin-1-null humans’ Proc Natl Acad Sci U S
A, 99,1059-63.
Kopterides P, Bonovas S, Mavrou I, et al. 2009, ‘Venous oxygen saturation
and lactate gradient from superior vena cava to pulmonary artery in
patients with septic shock’ Shock, 31,561-7.
Kotchen TA, Cowley AW Jr, Frohlich ED. 2013, ‘Salt in health and
disease--a delicate balance’ N Engl J Med, 368, 1229-37.
Kovalik SG, Ledgerwood AM, Lucas CE, Higgins RF. 1981, ‘The cardiac
effect of altered calcium homeostasis after albumin resuscitation’ J
Trauma, 21, 275-9.
Kozeny GA, Murdock DK, Euler DE, et al. 1985, ‘In vivo effects of acute
changes in osmolality and sodium concentration on myocardial
contractility’ Am Heart J, 109, 290-296.
Kreimeier U, Frey L, Dentz J, et al. 1991, ‘Hypertonic saline dextran
resuscitation during the initial phase of acute endotoxemia, Effect on
regional blood flow’ Crit. Care Med, 19, 801-11.
Kuebler WM, Ying X, Singh B, et al. 1999, ‘Pressure is proinflammatory in
lung venular capillaries’ J Clin Invest,104,495-502.
Kumar A, Anel R, Bunnell E, et al. 2004, ‘Pulmonary artery occlusion
pressure and central venous pressure fail to predict ventricular filling
volume, cardiac performance, or the response to volume infusion in
normal subjects’ Crit Care Med, 32,691–699.
Lambie SH, Taal MW, Fluck RJ, et al. 2005, ‘Online conductivity
monitoring, validation and usefulness in a clinical trial of reduced
dialysate conductivity’ ASAIO J, 51,70–76.

References
319
Lanspa MJ, Grissom CK, Hirshberg EL, et al. 2013, ‘Applying dynamic
parameters to predict hemodynamic response to volume expansion in
spontaneously breathing patients with septic shock’ Shock, 39,155-60.
Lee JW. 2010, ‘Fluid and electrolyte disturbances in critically ill patients’
Electrolyte Blood Press, 8, 72-81.
Lenz K, Gossinger H, Laggner A, et al. 1986, ‘Influence of hypernatremic-
hyperosmolar state on hemodynamics of patients with normal and
depressed myocardial function’ Crit Care Med, 14, 913-914.
Levinson R, Epstein M, Sackner MA, et al 1977, ‘Comparison of the effects
ofwater immersion and saline infusion on central haemodynamics in man’
Clin. Sci. Mol. Med. 52, 343–350.
Liedtke W, & Friedman JM. 2003, ‘Abnormal osmoticregulation in trpv4-/-
mice’ Proceedings of the National Academy of Sciences of the United States
of America, 100, 13698–13703.
Linde-Zwirble WT, Angus DC. 2004, ‘Severe sepsis epidemiology,
sampling, selection, and society’ Crit Care 2004, 8, 222–226.
Lindner G, Funk GC, Schwarz C et al. 2007, ‘Hypernatremia in the
critically ill is an independent risk factor for mortality’ Am J Kidney Dis,
50, 952-957.
Lindner G, Kneidinger N, Holzinger U et al. 2009, ‘Tonicity balance in
patients with hypernatremia acquired in the intensive care unit’ Am J
Kidney Dis, 54, 674-679.
Lobo DN, Bostock KA, Neal KR, et al. 2002, ‘Effect of salt and water
balance on recovery of gastrointestinal function after elective colonic
resection’ Lancet, 359, 1812-8.
Lobo DN, Stanga Z, Aloysius MM, et al. 2010, ‘Effect of volume loading
with 1 liter intravenous infusions of 0.9% saline, 4% succinylated gelatine
(Gelofusine) and 6% hydroxyethyl starch (Voluven) on blood volume and
endocrine responses, a randomized, three-way crossover study in healthy
volunteers’ Crit Care Med, 38, 464–470.
Locatelli F, Di Filippo S, Manzoni C, et al. 2000, ‘Removal of small and
middle molecules by convective techniques, Nephrol Dial Transplant,
15,37–44.
Locatelli F, di Filippo S, Manzoni C, 1999, ‘Sodium kinetics during
dialysis’ Semin Dial, 12, S41–S44.
Locatelli F, Ponti R, Pedrini L, et al, 1989, ‘Sodium and dialysis, a deeper
insight’ Int J Artif Organs, 12, 71–74.
Locatelli F, Ponti R, Pedrini L, et al. 1984, ‘Sodium kinetics across dialysis
membranes’ Nephron, 38, 174–177.

References
320
Londino JD, Matalon S 2013, ‘Chloride secretion across adult alveolar
epithelial cells contributes to cardiogenic edema’, Proc Natl Acad Sci
USA,110,10055-6.
Loomis WH, Namiki S, Hoyt DB, et.al. 2001, ‘Hypertonicity rescues T cells
from suppression by trauma-induced anti-inflammatory mediators’ Am J
Physiol Cell Physiol, 281, C840-8.
Lorenzo IM, Liedtke W, Sanderson MJ, et al, 2008, ‘TRPV4 channel
participates in receptor-operated calcium entry and ciliary beat frequency
regulation in mouse airway epithelial cells’ Proc Natl Acad Sci USA,
105,12611-6.
Lowenstein CJ, Morrell CN, Yamakuchi M. 2005, ‘Regulation of Weibel-
Palade body exocytosis’ Trends Cardiovasc Med, 15,302-8.
Luhr OR, Antonsen K, Karlsson M, et al. 1999, ‘Incidence and mortality
after acute respiratory failure and acute respiratory distress syndrome in
Sweden, Denmark, and Iceland’ Am J Respir Crit Care Med, 159,1849–
1861.
Macintyre N, Crapo RO, Viegi G, et al. 2005, ‘Standardisation of the single-
breath determination of carbon monoxide uptake in the lung’ Eur Respir
J, 26,720-35.
Magder S, Bafaqeeh F. 2007, ‘The clinical role of central venous pressure
measurements’ J Intensive Care Med, 22, 44–51.
Maitland K, Kiguli S, Opoka RO, et al. 2011, ‘Mortality after fluid bolus in
African children with severe infection’ N Engl J Med, 364,2483-95.
Maitland K, Pamba A, English M, et al. 2005, ‘Randomized trial of volume
expansion with albumin or saline in children with severe malaria,
preliminary evidence of albumin benefit’ Clin Infect Dis, 40, 538-45.
Maron MB. 1989, ‘Effect of elevated vascular pressure transients on
protein permeability in the lung’ J Appl Physiol, 67, 305-10.
Matthews BD, Thodeti CK, Tytell JD, et al. 2010, ‘Ultrarapid activation of
trpv4 ion channels by mechanical forces applied to cell surface beta1
integrins’ Integr Biol (Camb), 2, 435-442.
Mattox KL, Maningas PA, Moore EE, et al. 1991, ‘Prehospital hypertonic
saline/dextran infusion for posttraumatic hypotension. The U.S.A.
Multicenter Trial’ Ann Surg, 213, 482-491.
McGregor JC, Kim PW, Perencevich EN, et al. 2005, ‘Utility of the Chronic
Disease Score and Charlson Comorbidity Index as comorbidity measures
for use in epidemiologic studies of antibiotic-resistant organisms’ Am J
Epidemiol, 161, 483-93.
References
321
Michael M, Kuehnle I, Goldstein SL, 2004, ‘Fluid overload and acute renal
failure in pediatric stem cell transplant patients’ Pediatr Nephrol, 19, 91–
95.
Michard F, Boussat S, Chemla D, et al. 2000, ‘Relation between
respiratory changes in arterial pulse pressure and fluid responsiveness in
septic patients with acute circulatory failure’ Am J Respir Crit Care Med,
162, 134–138.
Michel RP, Zocchi L, Rossi A. 1987, ‘Does interstitial lung edema compress
airways and arteries? A morphometric study’ J Appl Physiol, 62, 108–115.
Mikkelsen ME, Christie JD, Lanken PN, et al. 2012, ‘The adult respiratory
distress syndrome cognitive outcomes study long-term neuropsychological
function in survivors of acute lung injury’ Am J Respir Crit Care Med,
185, 1307–1315.
Miller MR, Hankinson J, Brusasco V, et al. 2005, ‘Standardisation of
spirometry’ Eur Respir J, 26,319-38.
Millic-Emili J, Ruff F. 1971, ‘Effects of pulmonary congestion and edema
on the small airways’ Bull Physiopathol Respir Nancy, 7, 1181–1196.
Minnear FL, Barie PS, Malik AB. 1983, ‘Effects of transient pulmonary
hypertension on pulmonary vascular permeability’ J Appl Physiol Respir
Environ Exerc Physiol, 55,983-9.
Mitchell JP, Schuller D, Calandrino FS, et al. 1992 ‘Improved outcome
based on fluid management in critically ill patients requiring pulmonary
artery catheterization, Am Rev Respir Dis, 145,990–998.
Mizuno A, Matsumoto N, Imai M, Suzuki M. 2003, ‘Impaired osmotic
sensation in mice lacking TRPV4’ American Journal of Physiology Cell
Physiology, 285, C96–C101.
MochizukiT, Sokabe T, Araki I, et al 2009, ‘The TRPV4 cation channel
mediates stretch-evoked Ca2+ influx and ATP release in primary urothelial
cell cultures’ J Biol Chem,284,21257–64.
Monnet X, Rienzo M, Osman D, et al. 2006, ‘Passive leg raising predicts
fluid responsiveness in the critically ill’ Crit Care Med, 34,1402–1407.
Moore CL, Tham ET, Samuels KJ, et al. 2010, ‘Tissue Doppler of early
mitral filling correlates with simulated volume loss in healthy subjects’
Acad Emerg Med, 17,1162-8.
Morelli A, Lange M, Ertmer C, et al. 2007, ‘Glibenclamide dose response in
patients with septic shock, effects on norepinephrine requirements,
cardiopulmonary performance, and global oxygen transport’ Shock, 28,
530-5.

References
322
Moret K, Hassell D, Kooman JP, et al. 2002, ‘Ionic mass balance and blood
Volume preservation during a high, standard, and individualized dialysate
sodium concentration’ Nephrol Dial Transplant, 17,1463–1469.
Moritz ML, Ayus JC. 2011, ‘Intravenous fluid management for the acutely
ill child’ Curr Opin Pediatr, 23, 186-93.
Moss GS, das Gupta TK, Newson B, Nyhus LM. 1972, ‘Morphologic
changes in the primate lung after hemorrhagic shock’ Surg Gynecol
Obstet, 134, 3-9.
Moss GS, das Gupta TK, Newson B, Nyhus LM. 1973, ‘The effect of saline
solution resuscitation on pulmonary sodium and water distribution’ Surg
Gynecol Obstet, 136, 934-40.
Moss GS. 1972, ‘Pulmonary involvement in hypovolemic shock’ Annu Rev
Med, 23, 201-28.
Muir, AL, Flenley DC, Kirby BJ, et al. 1975, ‘Cardiorespiratory effects of
rapid saline infusion in normal man’ J. Appl. Physiol, 38, 786–793.
Mulligan MS, Paulson JC, De Frees S, et al. 1993, ‘Protective effects of
oligosaccharides in P-selectin-dependent lung injury’ Nature, 364, 149-51.
Murao Y, Loomis W, Wolf P, Hoyt DB, Junger WG. 2003, ‘Effect of dose of
hypertonic saline on its potential to prevent lung tissue damage in a
mouse model of hemorrhagic shock’ Shock, 20,29-34.
Murphy CV, Schramm GE, Doherty JA, et al. 2009, ‘The importance of
fluid management in acute lung injury secondary to septic shock’ Chest,
136,102-109.
Myburgh JA, Finfer S, Bellomo R, et al 2012, ‘Hydroxyethyl starch or
saline for fluid resuscitation in intensive care’ N Engl J Med, 367,1901-
1911.
Nadler SB, Hidalgo JU, Bloch T. 1962, ‘Prediction of blood volume in
normal human adults’ Surgery, 51,224–232.
Nicolaysen G, Waaler BA, Aarseth P. 1979, ‘On the existence of stretchable
pores in the exchange vessels of the isolated rabbit lung preparation’
Lymphology, 12, 201-7.
Noble VE, Murray AF, Capp R, et al. ‘Ultrasound assessment for
extravascular lung water in patients undergoing hemodialysis. Time
course for resolution’ Chest, 135, 1433-9.
Nutricia. 2011, ‘Product Information. Nutricia Advanced Medical Nutrition’
[Online] http,//uk.nutricia.com. (accessed October 2012).
Nutrient Reference Values for Australia and New Zealand including
Recommended Dietary Intakes.
References
323
http,//www.nrv.gov.au/resources/_files/n35-sodium.pdf (accessed
October 2013).
Ochi H, Masuda J, Gimbrone MA. 2002, ‘Hyperosmotic stimuli inhibit
VCAM-1 expression in cultured endothelial cells via effects on interferon
regulatory factor-1 expression and activity’ Eur J Immunol, 32, 1821–
1831.
O'Grady NP, Preas HL, Pugin J et al, 2001, ‘Local inflammatory responses
following bronchial endotoxin instillation in humans’ Am J Respir Crit
Care Med. 163,1591-8.
Olaguíbel JM, Alvarez-Puebla MJ, Anda M, 2005, ‘Comparative analysis of
the bronchodilator response measured by impulse oscillometry (IOS),
spirometry and body plethysmography in asthmatic children’ J Investig
Allergol Clin Immunol, 15,102-6.
Opas LM, Adler R, Robinson R, et al. 1977, ‘Rhabdomyolysis with severe
hypernatremia’ J Pediatr, 90, 713-716.
Osman D, Ridel C, Ray P, et al. 2007, ‘Cardiac filling pressures are not
appropriate to predict hemodynamic response to volume challenge’ Crit
Care Med, 35,64–68.
Ospina-Tascon G, Neves AP, Occhipinti G, et al. 2010, ‘Effects of fluids on
microvascular perfusion in patients with severe sepsis’ Intensive Care
Med, 36, 949-55.
Palevsky PM, Bhagrath R and Greenberg A. 1996, ‘Hypernatremia in
hospitalized patients’ Ann Intern Med, 124, 197–203.
Papazian L, Forel JM, Gacouin A, et al. 2010, ‘Neuromuscular blockers in
early acute respiratory distress syndrome’ N Engl J Med, ,363,1107-16.
Parker JC, Hashizumi M, Kelly SV, et al. 2013, ‘TRPV4 calcium entry and
surface expression attenuated by inhibition of myosin light chain kinase in
rat pulmonary microvascular endothelial cells’. Physiol Rep.1,e00121.
Parker JC, Ivey CL, Tucker JA.1985, ‘Gadolinium prevents high airway
pressure-induced permeability increases in isolated rat lungs’ J Appl
Physiol, 84,1113-8.
Pascual JL, Khwaja KA, Ferri LE, et al. 2003, ‘Hypertonic saline
resuscitation attenuates neutrophil lung sequestration and transmigration
by diminishing leukocyte-endothelial interactions in a two-hit model of
hemorrhagic shock and infection’ J Trauma, 54,121–130.
Payen D, de Pont AC, Sakr Y, et al. 2008, ‘A positive fluid balance is
associated with a worse outcome in patients with acute renal failure’ Crit
Care. 12, R74.

References
324
Peake SL, Bailey M, Bellomo R, et al. 2009, ‘Australasian resuscitation of
sepsis evaluation (ARISE), a multi-centre, prospective, inception cohort
study’ Resuscitation, 80, 811 - 818.
Peixoto AJ, Gowda N, Parikh CR, et al, 2010, ‘Long-term stability of serum
sodium in hemodialysis patients’ Blood Purif, 29, 264–267.
Pellegrino R, Dellaca R, Macklem PT, et al. 2003, ‘Effects of rapid saline
infusion on lung mechanics and airway responsiveness in humans’ J Appl
Physiol, 95, 728–734.
Perel P, Roberts I, Ker K. 2013, ‘Colloids versus crystalloids for fluid
resuscitation in critically ill patients’ Cochrane Database Syst Rev, 2,
CD000567.
Perner A, Haase N, Guttormsen AB, et al 2012, ‘Hydroxyethyl starch
130/0.42 versus Ringer’s acetate in severe sepsis’ N Engl J Med, 367,124-
134.
Pietra GG, Szidon JP, Leventhal MM, Fishman AP. 1969, ‘Hemoglobin as a
tracer in hemodynamic pulmonary edema’ Science, 166,1643-6.
Plank LD, Connolly AB, Hill GL. 1998, ‘Sequential changes in the
metabolic response in severely septic patients during the first 23 days
after the onset of peritonitis’ Ann Surg, 228, 146-58.
Plank LD, Hill GL. 2000, ‘Similarity of changes in body composition in
intensive care patients following severe sepsis or major blunt injury’ Ann N
Y Acad Sci, 904, 592-602.
Plank LD, Monk DN, Woollard GA, Hill GL. 1998, ‘Evaluation of
multifrequency bioimpedance spectroscopy for measurement of the
extracellular water space in critically ill patients’ Appl Radiat Isot, 49, 481-
3.
Prisk GK, Olfert IM, Arai TJ, et al. 2010, ‘Rapid intravenous infusion of 20
ml/kg saline does not impair resting pulmonary gas exchange in the
healthy human lung’ J Appl Physiol, 108, 53-9.
Puri S, Dutka DP, Baker BL, et al. 1999, ‘Acute saline infusion reduces
alveolar-capillary membrane conductance and increases airflow
obstruction in patients with left ventricular dysfunction’ Circulation, 99,
1190-6.
Quadri SK, Bhattacharjee M, Parthasarathi K, et al. 2003, ‘Endothelial
barrier strengthening by activation of focal adhesion kinase’ J Biol Chem,
278, 13342–13349.
Quigley R. 2012, ‘Developmental changes in renal function’ Curr Opin
Pediatr, 24, 184-90.

References
325
Rabinovici R, Vernick J, Hillegas L, Neville LF. 1996, ‘ Hypertonic saline
treatment of acid aspiration-induced lung injury’ J Surg Res, 60, 176-80.
Rabinovici R, Krausz MM, and Feuerstein G. 1991, ‘Control of bleeding is
essential for a successful treatment of hemorrhagic shock with 7.5% NaCl
solution’ Surg Gynecol Obstet, 173, 98-106.
Rabinovici R, Yue T-L, Krausz MM, et al. 1992, ‘Hemodynamic,
hematologic and eicosanoid-mediated mechanisms in 7.5% NaCl
treatment of uncontrolled hemorrhagic shock’ Surg Gynecol Obstet, 175,
341-54.
Reid F, Lobo DN, Williams RN, et al. 2003, ‘(Ab)normal saline and
physiological Hartmann's solution, a randomized double-blind crossover
study’ Clin Sci (Lond), 104, 17-24.
RENAL Replacement Therapy Study Investigators, Bellomo R, Cass A, Cole
L, et al. 2009, ‘Intensity of continuous renal-replacement therapy in
critically ill patients’ N Engl J Med, 361,1627-38.
Report of the Australian and New Zealand Paediatric Intensive Care
Registry. http,//www.anzics.com.au/downloads/doc_download/567-
2010-anzpic-registry-annual-report. (accessed Sep 2013).
Reuse C, Vincent JL, Pinsky MR. 1990, ‘Measurements of right ventricular
volumes during fluid challenge’ Chest 98,1450–1454.
Rippe B, Townsley M, Thigpen J, et al. 1984, ‘Effects of vascular pressure
on the pulmonary microvasculature in isolated dog lungs’ J Appl Physiol
Respir Environ Exerc Physiol, 57, 233-9.
Rivers E, Nguyen B, Havstad S, et al 2001, ‘Early goal-directed therapy in
the treatment of severe sepsis and septic shock’ N Engl J Med, 345,1368-
1377.
Rizoli SB, Kapus A, Fan J, et al. 1998, ‘Immunomodulatory effects of
hypertonic resuscitation on the development of lung inflammation
following hemorrhagic shock’ J Immunol, 161, 6288–6296.
Rizoli SB, Kapus A, Parodo J, Rotstein OD, 1999, ‘Hypertonicity prevents
lipopolysaccharide-stimulated CD11b/CD18 expression in human
neutrophils in vitro, role for p38 inhibition’ The Journal of trauma, 46,
794-8.
Robertson HT, Pellegrino R, Pini D, et al. 2004, ‘Exercise response after
rapid intravenous infusion of saline in healthy humans’ J Appl Physiol,
97, 697-703.
Romani T, Rondaij MG, Hordijk PL, et al. 2003, ‘Real-time imaging of the
dynamics and secretory behavior of Weibel-Palade bodies’ Arterioscler
Thromb Vasc Biol. 23,755–761.

References
326
Rosner MH, Ronco C. 2010, ‘Dysnatremias in the intensive care unit’
Contrib Nephrol, 165, 292-8.
Rossaint R, Krebs M, Forther J, et al. 1993, ‘Inferior vena caval pressure
increase contributes to sodium and water retention during PEEP in awake
dogs’ J Appl Physiol, 75, 2484–2492.
Rubenfeld GD, Caldwell E, Peabody E, et al. 2005, ‘Incidence and
outcomes of acute lung injury’ N Engl J Med, 353, 1685–1693.
Rudski LG, Lai WW, Afilalo J, et al. 2010, ‘Guidelines for the
echocardiographic assessment of the right heart in adults, a report from
the American Society of Echocardiography endorsed by the European
Association of Echocardiography, a registered branch of the European
Society of Cardiology, and the Canadian Society of Echocardiography’ J
Am Soc Echocardiogr, 23,685-713.
Safdar Z, Wang P, Ichimura H, et al. 2003, ‘Hyperosmolarity enhances the
lung capillary barrier’ J Clin Invest, 112,1541-9.
Safdar Z, Yiming M, Grunig G, Bhattacharya J. 2005, ‘Inhibition of acid-
induced lung injury by hyperosmolar sucrose in rats’ Am J Respir Crit
Care Med, 172, 1002-7.
SAFE Study Investigators, Finfer S, McEvoy S, Bellomo R, et al. 2011,
‘Impact of albumin compared to saline on organ function and mortality of
patients with severe sepsis’ Intensive Care Med, 37, 86-96.
Sakamaki F, Ishizaka A, Handa M, et al. 1995, ‘Soluble form of P-selectin
in plasma is elevated in acute lung injury’ Am J Respir Crit Care Med,
151,1821-6.
Sakr Y, Vincent J-L, Reinhardt K, et al. 2005, ‘High tidal volume and
positive fluid balance are associated with worse outcome in acute lung
injury’ Chest, 128,3098–3108.
Sakr Y, Vincent J-L, Reinhardt K, et al. 2005, ‘High tidal volume and
positive fluid balance are associated with worse outcome in acute lung
injury’ Chest, 128,3098–3108.
Sánchez M, Jiménez-Lendínez M, Cidoncha M, et al. 2011, ‘Comparison of
fluid compartments and fluid responsiveness in septic and non-septic
patients’ Anaesth Intensive Care, 39,1022-1029.
Santos SF, Peixoto AJ, 2010, ‘Sodium balance in maintenance
hemodialysis’ Semin Dial, 23,549-55.
Saxena MK. 2013, ‘Should sodium be the real target of fluid restriction?’
Critical Care and Resuscitation, 15, 75-6.

References
327
Sayarlioglu H, Erkoc R, Tuncer M, et al. 2007’ ‘Effects of low sodium
dialysate in chronic hemodialysis patients, an echocardiographic study’
Ren Fail, 29, 143–146.
Schneeberger-Keeley EE, Karnovsky MJ. 1968, ‘The ultrastructural basis
of alveolar-capillary membrane permeability to peroxidase used as a
tracer’ J Cell Biol, 37,781-93.
Sedlacek M, Schoolwerth AC, Remillard BD. 2006, ‘Electrolyte
disturbances in the intensive care unit’ Semin Dial, 19, 496-501.
Seri I, Kone BC, Gullans SR, et al. 1990, ‘Influence of Na + intake on
dopamine- induced inhibition of renal cortical Na(+)-K(+)-ATPase’ Am J
Physiol, 258, F52–F60.
Seri I, Kone BC, Gullans SR, et al. 1988, ‘Locally formed dopamine
inhibits Na + -K + -ATPase activity in rat renal cortical tubule cells’ Am J
Physiol, 255, F666–F673.
Sevransky J. 2009, ‘Clinical assessment of hemodynamically unstable
patients’ Curr Opin Crit Care, 15, 234-8.
Shi HP, Deitch EA, Da Xu Z, et al. 2002, ‘Hypertonic saline improves
intestinal mucosa barrier function and lung injury after trauma
hemorrhagic shock’ Shock 17, 496-501.
Shields CJ, O'Sullivan AW, Wang JH, et al. 2003, ‘Hypertonic saline
enhances host response to bacterial challenge by augmenting receptor-
independent neutrophil intracellular superoxide formation’ Ann Surg,
238,249-257.
Shields CJ, Winter DC, Manning BJ, et al. 2003, ‘Hypertonic saline
infusion for pulmonary injury due to ischemia-reperfusion’ Arch Surg,
138, 9-14.
Shields CJ, Winter DC, Sookhai S, et al. 2000, ‘Hypertonic saline
attenuates end-organ damage in an experimental model of acute
pancreatitis’ Br J Surg, 87,1336-1340.
Sidhaye VK, Schweitzer KS, Caterina MJ, et al, 2008, ‘Shear stress
regulates aquaporin-5 and airway epithelial barrier function’ Proc Natl
Acad Sci USA, 105,3345-50.
Simmons RS, Berdine GG, Seidenfeld JJ et al. 1987, ‘Fluid balance and
the adult respiratory distress syndrome’ Am Rev Respir Dis, 135,924-929.
Solymosi EA, Kaestle-Gembardt SM, Vadász I, et al. 2013, ‘Chloride
transport-driven alveolar fluid secretion is a major contributor to
cardiogenic lung edema’ Proc Natl Acad Sci U S A, 110, E2308-16.

References
328
Staub NC, Nagano H, Pearce ML.1967, ‘Pulmonary edema in dogs,
especially the sequence of fluid accumulation in lungs’ J Appl Physiol, 22,
227–240.
Stelfox HT, Ahmed SB, Khandwala F, et al. 2008, ‘The epidemiology of
intensive care unit-acquired hyponatraemia and hypernatraemia in
medical-surgical intensive care units’ Crit Care, 12,R162.
Stevens AP, Hlady V, Dull RO. 2007, ‘Fluorescence correlation
spectroscopy can probe albumin dynamics inside lung endothelial
glycocalyx’ Am J Physiol Lung Cell Mol Physiol, 293, L328-35.
Stiller S, Bonnie-Schorn E, Grassmann A, et al. 2001, ‘A critical review of
sodium profiling for hemodialysis’ Semin Dial, 14, 337–347.
Stow P, Hart G, Higlett T, et al. 2006, ‘Development and implementation of
a high-quality clinical database, the Australian and New Zealand Intensive
Care Society Adult Patient Database’ J Crit Care, 21, 133-41.
Symons JM, Chua AN, Somers MJ, et al. 2007, ‘Demographic
characteristics of pediatric continuous renal replacement therapy, a report
of the prospective pediatric continuous renal replacement therapy
registry’ Clin J Am Soc Nephrol, 2, 732–738.
Tafreshi J, Hoang TH, Grigorian T et al. 2011, ‘Impact of Iatrogenic,
Excessive, Nondietary Sodium Administration in Patients with Acute Heart
Failure Exacerbation on Hospital Length of Stay’ Pharmacotherapy, 31,
58–61.
Tanaka M, Oida E, Nomura K, et al. 2005, ‘The Na+-excreting efficacy of
indapamide in combination with furosemide in massive edema’ Clin Exp
Nephrol,9,122-6.
Taylor D, Durward A, Tibby SM, et al. 2006, ‘The influence of
hyperchloraemia on acid base interpretation in diabetic ketoacidosis’
Intensive Care Med, 32, 295-301.
Terpstra ML, Aman J, et al. 2014, ‘Plasma Biomarkers for Acute
Respiratory Distress Syndrome, A Systematic Review and Meta-Analysis’
Crit Care Med, 42, 691-700
The Acute Respiratory Distress Syndrome Network. 2000, ‘Ventilation with
Lower Tidal Volumes as Compared with Traditional Tidal Volumes for
Acute Lung Injury and the Acute Respiratory Distress Syndrome’ N Engl J
Med, 342,1301-1308.
The ANZIC Influenza Investigators. 2009, ‘Critical care services and 2009
H1N1 influenza in Australia and New Zealand’ N Engl J Med, 361, 1925-
34.
References
329
Thein H, Haloob I, Marshall MR. 2007, ‘Associations of a facility level
decrease in dialysate sodium concentration with blood pressure and
interdialytic weight gain’ Nephrol Dial Transplant, 22, 2630–2639.
Thijssen S, Raimann JG, Usvyat LA, et al. 2011, ‘The evils of intradialytic
sodium loading’ Contrib Nephrol, 171, 84-91.
Thorneloe KS, Cheung M, Bao W et al 2012, ‘An orally active TRPV4
channel blocker prevents and resolves pulmonary edema induced by heart
failure’ Sci Transl Med, 4,159ra148.
Trissel. 2001, Handbook on Injectable Drugs. Bethesda, American Society
of Health System Pharmacists.
Troidl C, Troidl K, Schierling W, et al 2009, ‘Trpv4 induces collateral vessel
growth during regeneration of the arterial circulation’ J Cell Mol Med,
13,2613-21.
Trubuhovich RV. 2012, ‘Inadvertent sodium loading in critically ill
patients — plus some pedantry’ Crit Care Resusc, 14, 163-4.
Twigley AJ, Hillman KM. 1985, ‘The end of the crystalloid era? A new
approach to peri-operative fluid administration’ Anaesthesia, 40, 860–71.
UBM Medica Australia. eMIMS. [Software] St Leonard , UBM Medica
Australia Pty Ltd, 2010. (accessed October 2012)
Uchino S, Bellomo R, Goldsmith D, et al. 2006, ‘An assessment of the
RIFLE criteria for acute renal failure in hospitalized patients’ Crit Care
Med, 34,1913-7.
Uchino S, Kellum JA, Bellomo R, et al, 2005, ‘Acute renal failure in
critically ill patients, a multinational, multicenter study’ JAMA, 294, 813-
8.
Upadya A, Tilluckdharry L, Muralidharan V, et al. 2005, ‘Fluid balance
and weaning outcomes’ Intensive Care Med, 31,1643–1647.
Urden LD, Lough ME, Stacy KM. 2006, ‘Thelan's critical care nursing,
diagnosis and management’ St Louis, Mosby Elsevier.
Valentine SL, Sapru A, Higgerson RA, et al, 2012, ‘Fluid balance in
critically ill children with acute lung injury’ Crit Care Med, 40, 2883-9.
van Haren FM, Sleigh J, Boerma EC, et al. 2012, ‘Hypertonic fluid
administration in patients with septic shock, a prospective randomized
controlled pilot study’ Shock, 37, 268-75.
van Haren FM, Sleigh J, Cursons R, et al. 2011, ‘The effects of hypertonic
fluid administration on the gene expression of inflammatory mediators in
circulating leucocytes in patients with septic shock, a preliminary study’
Ann Intensive Care, 1, 44.
References
330
Vandergheynst F, Sakr Y, Felleiter P, et al. 2013, ‘Incidence and prognosis
of dysnatraemia in critically ill patients, analysis of a large prevalence
study’ Eur J Clin Invest, 43, 933-48.
Vialet R, Albanese J, Thomachot L, et al. 2003, ‘Isovolume hypertonic
solutes (sodium chloride or mannitol) in the treatment of refractory
posttraumatic intracranial hypertension, 2 mL/kg 7.5% saline is more
effective than 2 mL/kg 20% mannitol’ Crit Care Med, 31,1683-1687.
Villalta PC, Rocic P, Townsley MI. 2014, ‘The role of MMP2 and MMP9 in
TRPV4-induced lung injury’ Am J Physiol Lung Cell Mol Physiol, epub.
Villalta PC, Townsley MI. 2013, ‘Transient receptor potential channels and
regulation of lung endothelial permeability’ Pulm Circ, 3,802-15.
Vincent JL, Moreno R, Takala J, et al. 1996, ‘The SOFA (Sepsis-related
Organ Failure Assessment) score to describe organ dysfunction/failure’
Intensive Care Med, 22, 707-710.
Vincent JL, Sakr Y, Sprung CL, et al. 2006, ‘Sepsis in European intensive
care units, results of the SOAP study’ Crit Care Med, 34, 344–3536.
Wade C, Grady J, Kramer G. 1997, ‘Efficacy of hypertonic saline dextran
(HSD) in patients with traumatic hypotension, meta-analysis of individual
patient data’ Acta Anaesthesiol Scand Suppl, 110, 77-79.
Wagner EM and Mitzner W. 1996, ‘Effects of bronchial vascular
engorgement of airway dimensions’ J Appl Physiol, 81, 293–301.
Wagner EM. 1997, ‘Effects of edema on small airway narrowing’ J Appl
Physiol 83, 784–791.
Wagner JG, Leatherman JW, 1998 ‘Right ventricular end-diastolic volume
as a predictor of the hemodynamic response to a fluid challenge’ Chest
113,1048–1054.
Waikar SS, Curhan GC and Brunelli SM. 2011 ‘Mortality Associated with
Low Serum Sodium Concentration in Maintenance Hemodialysis’ Am J
Med, 124, 77–84
Wang S, Singh RD, Godin L, et al. 2011, ‘Endocytic response of type I
alveolar epithelial cells to hypertonic stress, Am J Physiol Lung Cell Mol
Physiol, 300, L560-8.
Wanger J, Clausen JL, Coates A, et al. 2005, ‘Standardisation of the
measurement of lung volumes’ Eur Respir J, 26, 511-22.
Wasserman K, Loeb L, Mayerson HS. 1955, ‘Capillary permeability to
macromolecules’ Circ Res, 3, 594-603.

References
331
Wegiersk T, Lewandrowski U, Muller B, et al. 2009, ‘Tyrosine
phosphorylation modulates the activity of TRPV4 in response to defined
stimuli’ Journal of Biological Chemistry, 284, 2923–2933.
West JB, Tsukimoto K, Mathieu-Costello O, Prediletto R. 1991, ‘Stress
failure in pulmonary capillaries’ J Appl Physiol 4,1731-42.
Wetzel RC, Herold CJ, Zerhouni EA, and Robotham JL. 1993,
‘Intravascular volume loading reversibly decreases airway cross sectional
area’ Chest 103, 865–87.
Wiedemann HP, Wheeler AP, Bernard GR, et al 2006, ‘Comparison of two
fluid management strategies in acute lung injury’ N Engl J Med,
354,2564-2575.
Wilkins MA, Su X-L, Palayew MD, et al. 1995, ‘The effects of posture
change and continuous positive airway pressure on cardiac natriuretic
peptides in congestive heart failure’ Chest, 107, 909–915.
Willette RN, Bao W, Nerurkar S, et al. 2008, ‘Systemic activation of the
transient receptor potential vanilloid subtype 4 channel causes endothelial
failure and circulatory collapse, Part 2’ J Pharmacol Exp Ther, 326, 443-
52.
Woodcock TE, Woodcock TM. 2012, ‘Revised Starling equation and the
glycocalyx model of transvascular fluid exchange, an improved paradigm
for prescribing intravenous fluid therapy’ Br J Anaesth, 108,384-94.
Worthley LI, Guerin M, Pain RW. 1987, ‘For calculating osmolality, the
simplest formula is the best’ Anaesth Intensive Care, 15, 199-202.
Yang XC, Sachs F. 1989, ‘Block of stretch-activated ion channels in
Xenopus oocytes by gadolinium and calcium ions’ Science, 243,1068-71.
Yin J, Hoffmann J, Kaestle SM, et al. 2008, ‘Negative-feedback loop
attenuates hydrostatic lung edema via a cGMP-dependent regulation of
TRPV4’ Circ Res, 102, 966–974.
Yin J, Kuebler WM. 2010, ‘Mechanotransduction by TRP channels, general
concepts and specific role in the vasculature’ Cell Biochem Biophys, 56,1-
18.
Yu M, Pei K, Moran S, et al. 2011, ‘A prospective randomized trial using
blood volume analysis in addition to pulmonary artery catheter, compared
with pulmonary artery catheter alone, to guide shock resuscitation in
critically ill surgical patients’ Shock, 35, 220-8.
Yunos NM, Bellomo R, Hegarty C, et al. 2012, ‘Association between a
chloride-liberal vs chloride-restrictive intravenous fluid administration
strategy and kidney injury in critically ill adults’ JAMA, 308, 1566-72.
References
332
Yunos NM, Kim IB, Bellomo R, et al. 2011, ‘The biochemical effects of
restricting chloride-rich fluids in intensive care’ Crit Care Med, 39, 2419-
24.
Zanotti-Cavazzoni SL, Guglielmi M, Parrillo JE, 2009, ‘Fluid resuscitation
influences cardiovascular performance and mortality in a murine model of
sepsis’ Intensive Care Med, 35,748–754.
Zhou YL, Liu HL, Duan XF et al, 2006, ‘Impact of sodium and
ultrafiltration profiling on haemodialysis-related hypotension’ Nephrol Dial
Transplant, 21, 3231–3237
Zilberberg MD, Carter C, Lefebvre P, et al. 2007, ‘Red blood cell
transfusions and the risk of acute respiratory distress syndrome among
the critically ill, a cohort study’ Crit Care, 2007, 11, R63
Zilberberg MD, Epstein SK. 1998, ‘Acute lung injury in the medical
ICU,comorbid conditions, age, etiology, and hospital outcome’ Am J Respir
Crit Care Med, 157, 1159–116.
Zimmerman RS, Trippodo NC, MacPhee AA, et al. 1990, ‘High-dose atrial
natriuretic factor enhances albumin escape from the systemic but not the
pulmonary circulation’ Circ Res, 67, 461-8.
Zoellner H, Höfler M, Beckmann R, et al. 1996, ‘Serum albumin is a
specific inhibitor of apoptosis in human endothelial cells’ J Cell Sci, 109,
2571-80.