contribution of earthworms to carbon and nitrogen cycling in agro-ecosystems
TRANSCRIPT

Agriculture, Ecosystems and Environment, 47 ( 1993 ) 59-74 59 Elsevier Science Publishers B.V., Amsterdam
Contribution of earthworms to carbon and nitrogen cycling in agro-ecosystems*
J.C.Y. Marinissen a'**, P.C. de Ruiter b • Wageningen Agricultural University, Department of Soil Science and Geology, P.O. Box 37,
6700.4.4 Wageningen, Netherlands bDLO-Institute for Soil Fertility Research, P.O. Box 30003, 9750 RA Haren, Netherlands
(Accepted 15 January 1993 )
Abstract
Earthworms contribute to N mineralisation directly, through consumption, digestion, respiration/ excretion and indirectly, by influencing population dynamics of other soil biota through predation or through affecting their environmental conditions. A comparison between a high-input conventional farming system with a reduced-input integrated system showed that earthworms had not colonized the conventional fields. Two methods were used to estimate the contribution of earthworms to N mineralisation in the integrated field. In the first method, the direct contribution of earthworms to N mineralisation is derived from feeding rates based on energy conversion efficiencies, life-history pa- rameters and C:N ratios. This method also allowed the estimation of the indirect contribution, by assuming that the feeding of earthworms on their prey stimulates the growth rates of their prey. The second method calculated the amounts of mineral N derived from two sources: dead biomass and excretion products. Application of these two methods on several agro-ecosystems showed that earth- worms may make a considerable contribution to N mineralisation. A sensitivity analysis, however, showed that the outcome of both methods depends on parameter estimates that are frequently uncer- tain. This implies that more detailed investigations on these parameters are required before the role of earthworms in energy and nutrient cycling can be established more reliably.
In t roduc t ion
E a r t h w o r m s h a v e f requen t ly been cons ide red as one o f the m o s t i m p o r t a n t faunal g roups in agro-ecosys tems because o f the i r effects on soil s t ruc ture for- m a t i o n and on nu t r i en t cycling. E a r t h w o r m s m a y con t r ibu te to decompos i - t ion o f o rgan ic m a t t e r a n d N mine ra l i s a t ion directly, t h rough c o n s u m p t i o n , d iges t ion a n d r e sp i r a t i on / exc re t i on , a n d indirect ly , by (1 ) affect ing the g rowth rates o f o the r p o p u l a t i o n s o f soil o rgan i sms t h rough grazing, e.g. neg- at ively th rough reduc t ion o f the prey number s or posi t ively by reducing growth l imi t ing fac tors for the prey, ( 2 ) by inf luencing soil mo i s tu re and ae ra t ion
*Communication No. 37 of the Dutch Programm on Soil ecology of Arable Farming Systems. **Corresponding author.
© 1993 Elsevier Science Publishers B.V. All rights reserved 0167-8809/93/$06.00
60 z c. Y. Marinissen, P.C. de Ruiter/Agriculture, Ecosystems and Environment 47 (1993) 59- 74
through soil structure, or ( 3 ) by fragmenting and redistribution of plant ma- terial and excreting nutrient rich faeces. The indirect contributions are diffi- cult to separate. For example, stimulating microbial growth by excreting nu- trient-rich faeces might be identical to reducing growth limiting factors.
Adverse effects of modern agricultural practices on soil fertility and the environment, such as pollution of groundwater and surface water and in- creased soil erosion, have stimulated the development of alternative manage- ment practices in which tillage and the use of pesticides and fertilizers can be reduced (see Edwards, 1990). In the Dutch Program on Soil Ecology of Ara- ble Farming Systems, two different farming systems (called integrated and conventional farming) at the Lovinkhoeve Experimental Farm (Noordoost- polder, NL) are compared with emphasis on soil organic matter dynamics and N mineralisation (Brussaard et al., 1988; Kooistra et al., 1989). The in- tegrated practice differs from the conventional practice in ( 1 ) reduced rates of nutrient inputs with an increased use of organic fertilizers, (2) reduced soil tillage depth, and (3) reduced use of biocides and absence of soil fumi- gation (Kooistra et al., 1989 ). It was hypothesized that the influence of soil microbes and soil fauna on nutrient cycling and decomposition was relatively more important in the integrated practice because of the increased use of or- ganic manure. It was also expected that the reduced use of tillage and pesti- cides might create better conditions for population growth of several faunal groups, especially nematodes, arthropods and annelids. Analysis at the Lov- inkhoeve site revealed that earthworms had not been able to establish viable populations in the conventional fields, probably as a result of the intensive tillage, accompanied by the low input of decomposable organic material (Marinissen and Van den Bosch, 1992 ). This result is in agreement with the outcome of a comparison between a conventional tillage and a no-tillage sys- tem showing that tillage reduced the densities of earthworms considerably (Hendrix et al., 1987).
Soil respiration and N mineralisation were higher in the integrated field than in the conventional field (Van Faassen and Lebbink, 1990). In order to relate this higher N mineralisation to the differences in presence of earth- worms, the contribution of earthworms to carbon and nitrogen cycling has to be established. Earlier estimates of the contribution of earthworms to decom- position and N mineralisation have been based on two methods. Hendrix et al. (1987) and Andr6n et al. (1990) quantified carbon and nitrogen flows through earthworm populations using energy conversion efficiencies and life- history parameters. Christensen ( 1987 ), following recommendations by Lee ( 1985 ), measured the amount of N excreted in casts and urine and N released from dead tissue to estimate the contribution of earthworms to N mineralisation.
For the analysis presented in this paper, modifications of these two meth- ods were used. The first method estimated the contribution of earthworms to

J. C. Y. Marinissen, P.C. de Ruiter/Agriculture, Ecosystems and Environment 47 (1993) 59- 74 61
N mineralisation based on ( 1 ) abundance (biomass), (2) life history param- eters (turnover rate), ( 3 ) energy conversion efficiencies, i.e. assimilation and production efficiency, (4) C: N ratios of earthworms and their energy sources, and (5) food choice. Earthworms have been assumed in some studies to feed only on detritus (BostrSm, 1988 ), but in other papers microbes, protozoa or even nematodes are mentioned as (part of ) the diet (Lee, 1985). Separate calculations for different diets were made, i.e. consumption consisted of (a) 100% detritus and (b) 50% detritus and 50% microbes. For cases in which microbes were eaten, the effect of earthworms on microbial activity was esti- mated. The calculation of this indirect contribution was based on the steady- state assumption that microbes will respond to grazing by increasing their production rate equal to the rate at which they are consumed by earthworms. The biological reasoning behind this assumption was that grazing reduces mi- crobial numbers, which subsequently might increase the availability (per mi- crobial cell) of nutrients required for growth, enabling the microbes to grow up to carrying capacity. Experimental findings have indicated that the pres- ence of grazers and predators may indeed stimulate microbial activity (Cole- man et al., 1978; Woods et al., 1982; Coleman et al., 1983 ). The assumption of regrowth of the microbial population in response to grazing was also based on the fact that earthworms will supply nutrient-rich faeces in the direct neighbourhood of the microbes and will redistribute plant residues ade- quately and create a sufficient oxygen supply through their burrow system (Monestier and Kretzschmar, 1992).
For the second method two flows of N from earthworms were considered: ( 1 ) death rate (amount of dead biomass per year) and (2) production rate of casts, urine and mucus. Dead tissue consists of organic nitrogen, mainly amino acids, and these are easily degradable: according to Satchdl (1967) 70% of dead worm tissue can be transformed to mineral N within 2 weeks.
Similarly, Christensen ( 1987 ) found that 75% of the N in dead worm tissue could be recovered in the form of both NH + and NO~- in the first 14 days after death. Therefore, the death rate was considered to be part of the N mi- neralisation rate. Casts, urine and mucus consist of both organic and mineral N, but the values used here are based on measurements that separated NH~- and urea from other organic bound N in casts, such as undigested plant re- mains and humus. It is assumed that, similar to dead tissue, urea is trans- formed to mineral N soon after excretion. This method implicitly includes the enhancement of microbial activity but does not explicitly separate direct and indirect contributions.
At first, both methods were used to estimate the contribution of earth- worms to carbon and nitrogen mineralisation in the integrated plot of the Lovinkhoeve. Because both methods are based on parameters of which the values are sometimes uncertain, the sensitivity of both estimates to these pa- rameter values was analysed. Finally, the N mineralisation by earthworms in

62 y. c. Y. Marinissen, P. C de Ruit er /Agriculture, Ecosystems and Environment 47 (1993) 59- 74
other agro-ecosystems was estimated by applying the same two methods to data from these sites. These other agro-ecosystems were, ( 1 ) Horseshoe Bend Research Site, Athens, GA, USA (Hendrix et al., 1987); two management practices: conventional tillage and no-tillage, and (2) Kjettslinge Experimen- tal Field, Uppsala, Sweden (Andren et al., 1990); four management prac- tices: BO: barley with no nitrogen fertilizer for 6 years and B 120: barley with 120 kg ha-1 year-~ of nitrogen for 6 years; GL: grass ley (undersown in bar- ley ); LL: lucerne ley (undersown in barley ).
Materials and methods
Site description
The test site is located at the Lovinkhoeve Experimental Farm in the Noor- doostpolder (Marknesse, Netherlands), reclaimed from the freshwater Lake IJssel in 1942. The soil is a calcareous silt loam with pH-KCI 7.5. Annual precipitation at the site is usually between 600 and 950 mm. At the test site, two different management systems were practised since the foundation of the farm, one block being organically managed, the other inorganically. Since 1985, these management systems were adapted to modern forms of integrated and conventional agriculture. Details of past and present management are provided by Kooistra et al. ( 1989 ). Integrated differs from the conventional practice in a reduction in N fertilizer application to 50-65% of the recom- mended rates in the conventional practice (from 130-285 kg ha - ~ year- ~ to 65-170 kg ha - 1 year- ~, depending on the crop), and most of the N fertilizer is provided in an organic form. Further, reduction is made in pesticide appli- cation and soil tillage intensity (20-25 cm deep ploughing in conventional, 12-15 cm deep cultivator tillage in integrated for the winter wheat crop in 1986). The organic matter content of the upper 20 cm of the conventional plot is 2.1%; on the integrated plot it is 2.7%. The C: N ratio of the soil organic matter is approximately ten in both plots (Van Faassen and Lebbink, 1990). Since 1985, the 4-year crop rotation on both plots has been the same: winter wheat, sugar beet, barley and potato. The data presented here are for the 1986 winter wheat crop, which followed sugar beet on both plots in 1985.
Sampling procedure
Soil samples were taken at five dates in 1986:18 April, 20 June, 30 July, 19 August and 18 November. Earthworms were collected from 25cm × 25cm X 25 cm soil samples with layers 5 cm deep. The soil was washed over a sieve (0.2 mm mesh). In this way, earthworms, including small juveniles and cocoons, were recovered and counted. Wet weight was measured on individual live worms after keeping them in water for at least 2 h. The most abundant species
J.C Y. Marinissen, P.C de Ruiter/Agriculture, Ecosystems and Environment 47 (1993) 59-74 63
was Aporrectodea caliginosa, which represented 92% of the total wet biomass. The other species present were Lumbricus rubellus (6%) and Aporrectodea rosea (2%) (Mafinissen, 1993). According to BostrSm (1988), 12.4% of the wet weight of worms is soil material, 20% of the wet worm tissue is dry mat- ter, and carbon and nitrogen represent 50% and 10% of the dry tissue, respec- tively. For the present analysis the average value of the five sampling dates was used.
For the estimation of microbial biomass, samples of the top 0-10 cm and 10-25 cm were taken from three subplots within each management practice. Bacteria were counted in europium-chelate-stained soil; fungal hyphal length was measured in agar films, stained with fluorescent brightener (Anderson and Westmoreland, 1971 ). From the numbers of microbes their biomass was calculated according to the method of Van Veen and Paul (1979).
Description of the methods
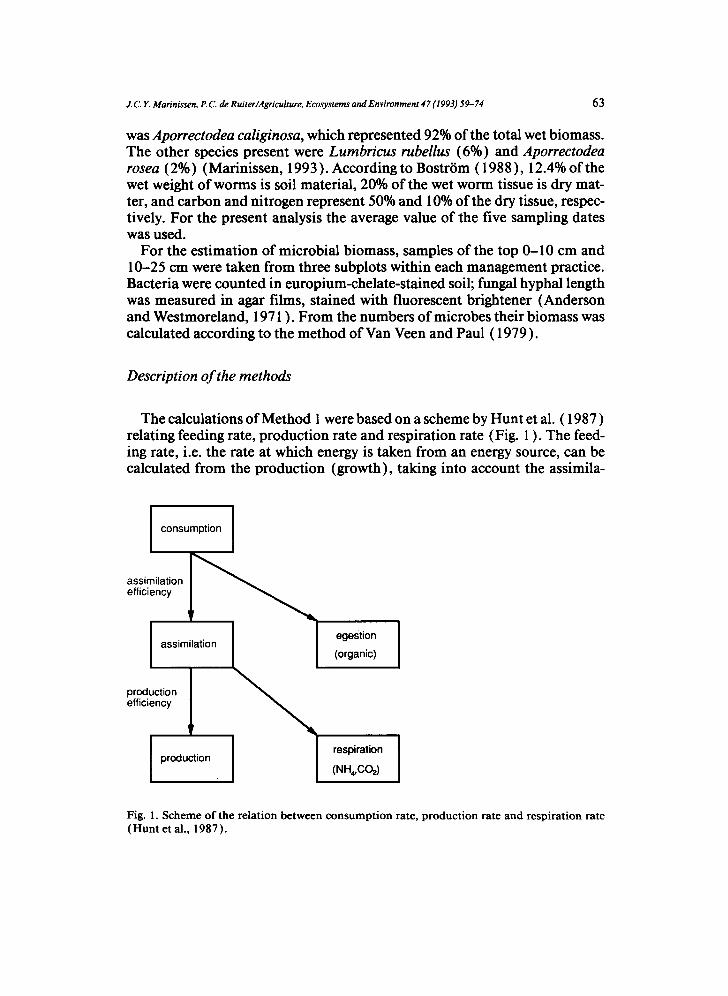
The calculations of Method 1 were based on a scheme by Hunt et al. ( 1987 ) relating feeding rate, production rate and respiration rate (Fig. 1 ). The feed- ing rate, i.e. the rate at which energy is taken from an energy source, can be calculated from the production (growth), taking into account the assimila-
I consumption I
assimilation ~ efficiency
I assimilation
production efficiency
I production
egestion I (organic)
respiration ] (NH.C02)
Fig. 1. Scheme of the relation between consumption rate, production rate and respiration rate (Hunt et al., 1987).
64 J.c.Y. Marinissen, P. C. de Ruiter /Agriculture, Ecosystems and Environment 47 (1993) 59-74
tion efficiency and the production efficiency. The feeding rate of earthworms was calculated by assuming a steady-state (Hunt et al., 1987 ):
F~ deBe = a ~ e (1)
where subscript e refers to earthworms, F is the feeding rate (C, kg ha - year- 1 ), d is the specific death rate (per year ), B is the biomass ( C, kg ha - 1 ), a is the assimilation efficiency and p is the production efficiency. In case of a mixed diet, the feeding rate on detritus (Fe,d) was equal to the feeding rate on microbes (Fe,m). The feeding rate on bacteria (Fe,b) and on fungi (Fe,f) were relative to their respective abundances.
The microbes were assumed to respond to earthworm grazing by increasing their growth rate to balance their losses, hence the increase of the 'feeding' rate of bacteria (AFb) and fungi (AFf) from grazing was calculated:
zfFb- F~,b (2) a b P b
zIFf-- F~,f (3) afpf
where subscript b refers to bacteria and f to fungi. The respiration rate of earthworms was calculated as:
Pe d B Re =ae( 1 - P e ) F e = 1 - P c ~ e (4)
and the increase in the respiration rates of bacteria (ARb) and fungi (ARf) as:
ARb =ab( 1 - P b )AFb ( 5 )
zJRf = af( 1 - -p f )dFf (6)
The N mineralisation rate was calculated per trophic interaction:
• \r~ rc ] (1-Pc ,s ) (7)
where N¢,s is the N mineralisation rate (N, kg ha - ~ year- ~ ) resuRing from the trophic interaction between consumer (c) and energy source (s), r~ is the C :N ratio of energy source, r~ is the C :N ratio of the consumer. To calculate the contribution of microbes to N mineralisation as influenced by earth- worms, only the increase in microbial respiration (ztRf and ARb) is included.
The calculations of Method 1 required estimates for biomass, specific death rates, assimilation efficiencies, production efficiencies and C:N ratios (for values see Table 1 ). Parameter values used for the analysis of the Lovink- hoeve populations were based on present measurements for biomass and on

J. C. Y. Marinissen, P. C. de Ruiter /Agriculture, Ecosystems and Environment 47 (1993.) 59- 74 65
Table 1 Values for specific death rate, assimilation efficiency, production efficiency, C :N ratio, production rate of casts, urine, and mucus, and biomass for earthworms, bacteria, fungi as used in the calcula- tions. For the Lovinkhoeve site also the values of the sensitivity analysis are listed, the values used for the normal calculations are in bold type
r ~ d 2 a 3 p4 B 5
M e t h o d 1 Lovinkhoeve
Earthworms 5 l, 2, 3 0.2, 0.4 0.2, 0.4 13.6 Bacteria 5 1.0 0.3 830 Fungi l0 1.0 0.3 47 Detritus l 0
Horseshoe Bend CT 6 NT 6 Earthworms 5 2.0 0.3 0.2 20 100 Bacteria 5 1.0 0.3 690 440 Fungi 10 1.0 0.3 150 160 Detritus 10
Kjettslinge B07 B 1207 Earthworms 5 1.0 0.3 0.4 13 13 Bacteria 5 1.0 0.3 740 900 Fungi 10 1.0 0.3 1500 2300 Detritus 10
GL 8 LL 9 24 55
930 900 1600 1800
M e t h o d 2 d 2 c 9
All fields l, 2, 3 0. l, 0.25, 0.5
~r, C :N ratio. 2d, specific death rate (year- ~ ). 3a, assimilation efficiency on microbial tissue. 4p, production efficiency. 5B, biomass (kg C ha - I ). 6CT; NT, conventional tillage; no tillage. 7B0; B 120, barley, no fertilizer; barley, with fertilizer. SGL; LL, grass iey; lucerne ley. 9c, production rate of casts, urine, and mucus (kg N kg- ~ C year - ~ ).
literature data for other variables. The specific death rate of the earthworms of 2.0 year- ~ was chosen intermediate between the death rate of 1.0 (Andr6n et al., 1990) and the death rate of 3.3 (Parmelee and Crossley, 1988). The assimilation efficiency of earthworms for microbial tissue of 0.2 was chosen after Heal and MacLean ( 1975 ). The production efficiency of 0.40 was based on calculations of Byzova (1965 ) and Bostr6m (1988). The yield (product of assimilation and production efficiency) of microbes of 0.30 was within the range reported by Elliott et al. (1983) and Findlay et al. (1986). The C:N ratio of detritus (10) was chosen to equal the mean value of the soil organic matter in Lovinkhoeve soil, because the main species present, A. caliginosa, is considered an endogenic species. The C:N ratio of bacteria was chosen to be five (from the ranges reported by Van Veen and Paul (1979) and Tezuka

66 :. c. Y. Marinissen, P. C. de Ruiter /Agriculture, Ecosystems and Environment 47 (199 3.) 59- 74
(1990) ), and that of the fungi was chosen to be ten from the range reported by Van Veen and Paul ( 1979 ). The C: N ratio of earthworms was chosen to be five (Bostr6m, 1988).
According to Method 2 N mineralisation was calculated from the death rate and from the product ion rate of casts, urine, and mucus. The rate at which nitrogen is released through the death rate (D (n ) ) was calculated:
D ( n ) =0.75 deBe (8) re
The rate at which nitrogen is released through the production of casts, ur- ine, and mucus was chosen to be 0.25 kg N year-~ per kg C of earthworm biomass, according to measurements of Christensen ( 1987 ) under compara- ble conditions, thereby assuming that earthworms are active for 185 days per year (Bostr~m, 1988).
In the sensitivity analysis of Method 1, values for specific death rates and conversion efficiencies were varied between ranges reported in the literature (Table 1; Hendrix et al., 1987; Bostr/~m, 1988; Andr6n et al., 1990; Parmelee et al., 1990). Although the C :N ratios of the different trophic levels will no- tably influence the outcome of the calculations they were not included in the sensitivity analysis, because for these variables no clear ranges were reported in the literature. In the sensitivity analysis for Method 2, the specific death rate varied similarly to Method 1 from one to three year- ~ and the production coefficient of casts, urine, and mucus between 0.1, 0.25 and 0.5 (Table 1 ).
For the application of Method 1 on the data from the Horseshoe Bend and Kjettslinge sites, values for specific death rate and conversion efficiencies for earthworms were derived from Hendrix et al. (1987) and Andr6n et al. (1990), respectively, with the same parameter values for detritus and mi- crobes being used as in the analysis of the Lovinldaoeve data (Table 1 ). For the application of Method 2 the same parameter values as for the Lovink- hoeve data were used.
Results
Analysis of the Lovinkhoeve populations
The direct contribution of the earthworms to soil respiration amounted to 41 kg C ha - ~ year - ~ in the top 25 cm of soil (Table 2 ), and the indirect effect (i.e. increased microbial respiration) was estimated to be 401 kg C h a - year -~. Per kg C biomass (Table 1 ), the specific direct contribution to CO2 evolution was three per year, whereas the specific indirect contribution was approximately 30 year- 1.
Using Method 1, earthworms had a direct contribution to N mineralisation of 1.4 kg N h a - i year-1 when feeding only on detritus, and 4.6 kg N ha -
J. c Y. Marinissen, P.C. de Ruiter/Agriculture, Ecosystems and Environment 47 (1993) 59- 74 6 7
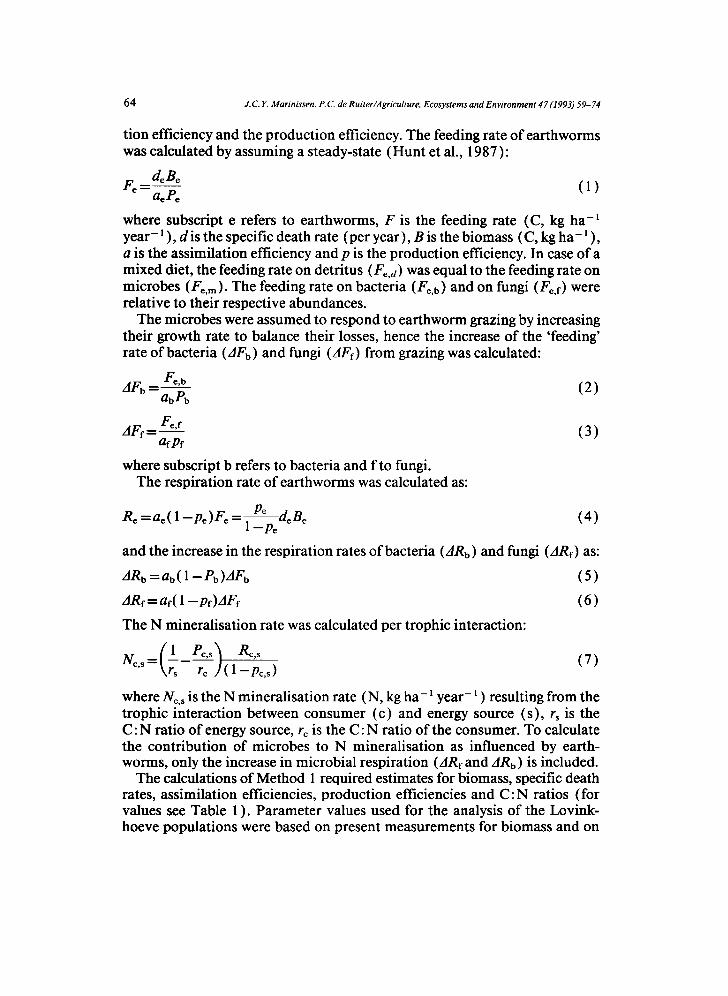
Table 2 Values for the contribution of earthworms to respiration (kg C h a - ~ year- i ) and N-mineralisation (kg N ha-~ year - t ) in the integrated practice of the Lovinkhoeve experimental farm, using the two different methods (see text)
Diet
100% detritus direct 50% detritus and 50% microbes
Direct Indirect Total
Method 1 Respiration 41 41 401 442 N-mineralisation 1.4 4.6 23.8 28.4
N-source
Casts + urine + mucus Dead tissue Total
Method 2 N-mineralisation 3.4 4.1 7.5
year- ~ when feeding on detritus and microbes. The difference between these two direct contributions was the result of the relatively high nitrogen content of the bacteria. The indirect contribution was estimated to be approximately 23.8 kg N ha - i year- ~, hence, a total contribution of approximately 28.4 kg N ha-~ year-1. The mineralisation coefficient (i.e. N mineralisation per bio- mass C) for the direct contribution of earthworms to N mineralisation was approximately 0.1 kg N kg-1 C year-! for earthworms feeding on detritus, 0.3 when feeding on detritus and microbes, and 2.0 also taking indirect effects into account.
Method 2 yielded a total contribution to N mineralisation of approxi- mately 7.5 kg N ha-~ year -~. For Method 2, the mineralisation coefficient was approximately 0.6.
The sensitivity analysis of Method 1 showed that the estimated direct con- tribution to N mineralisation depended strongly on the production efficiency of the earthworms, more than on the assimilation efficiency (Fig. 2a). Esti- mates of the indirect contribution depended on both assimilation and pro- duction efficiency. Changes in the death rate led to proportional changes in both direct and indirect contribution to N mineralisation. By using the range of published parameter values only, the calculated direct contribution of earthworms to N mineralisation ranged from negligible to more than 20 kg ha - ~ year- !. Taking into account indirect effects as well, the calculated con- tribution of earthworms to N mineralisation at the Lovinkhoeve integrated field may range up to 100 kg N ha- ~ year- 1.

68 J. c . Y. Marinissen, P. C. de Ruiter /Agriculture, Ecosystems and Environment 47 (1993) 59-74
(a) Method 1
~...1 O0 '~...
~ ' 80 "7
¢-
~ 60
C 0 "~ 4o
. ~ 20
E
0
p: 0.2 0.4 0.2 0.4 a: 0.2 0.4 D: 1.0
[ ] direct [ ] indirect fungi [ ] indirect bacteria
0.2 0.4 0.2 0.4 0.2 0.4
2.0
(b) Method 2
14
t._ 12
T-- 10
t -
03 8
c- O --- 6
C
E Z
0
c: d:
[ ] death tissue [ ] casts,urine,mucus
0.1 0.25 0.5 0.1 1
0.25 2
0.5
\ \ ' , , . \ ' , , \ \ \
Y / A \ ' " \ x \
\ \ \ \ \ \
0.2 0.4 0.2
0.1
\ \ \ \ \ ",,\,'1 \ \ \ ' 1 >'~'t
0.2 0.4 0.4
3.0
0.25 0.5 3
Fig. 2. Sensitivity analysis o f the estimated contribution of earthworms to N mineralisation at the Lovinkhoeve Experimental Farm. (a ) Method 1: p = production efficiency; a = assimilation efficiency; D = natural death rate (b) Method 2: c = production coefficient o f casts; d = specific death rate.

J. C. Y. Marinissen, P. C. de Ruiter /Agriculture, Ecosystems and Environment 47 (1993) 59- 74 69
The sensitivity analysis of Method 2 showed that the estimated contribu- tion to N mineralisation was directly related to the specific death rate and the production coefficient of casts, urine and mucus (Fig. 2b). Within the range of values used in the present sensitivity analysis, mineralisation by earth- worms ranged from 3.4 to 12.9 kg N ha-1 year-~.
Comparison with other agro-ecosystems
The analysis of the data of the Kjettslinge and Horseshoe Bend sites was restricted to the case of earthworms feeding on detritus and microbes. The biomass of earthworms at the four Kjettslinge sites ranged from 13 kg C ha- i
Table 3 Calculated values for the contribution of earthworms to N mineralisation (kg N ha - ' year- t ), using the two different methods (see text)
Diet (50% detritus and 50% microbes)
N-source
Direct Indirect Total
Method 1 Kjettslinge B01 1.2 10.8 12.0 B1202 1.1 11.3 12.4 GL 3 2.3 19.7 22.0 LL 4 5.1 47.6 52.7 Horseshoe Bend CT s 20.2 50.8 71.0 NT 6 96.7 266.7 363.4
N-source
Casts + urine + mucus Dead tissue Total
Method 2 Kjettslinge B01 3.1 3.9 7.0 B 1202 3.1 3.9 7.0 GL 3 5.8 7.2 13.0 LL 4 13.2 16.5 29.7 Horseshoe Bend CT s 4.8 6.0 10.8 NT 6 24.1 30.0 54.1
IB0, barley, no-fertilizer. 2B 120, barley, with fertilizer. 3GL, grass icy. 4LL, lucerne Icy. 5CT, conventional tillage. aNT, no-tillage.

70 J.c.Y. Marinissen, P.C. de Ruiter/Agrwulture, Ecosystems and Environment 47 (1993) 59-74
(B0, B120) to 55 kg C ha -~ (LL) (Table 1). According to Method 1, the direct contribution to N mineralisation ranged from 1.2 kg N ha-1 year- (B0, B120) to 5.1 kg N ha -~ year - l (LL) (Table 2), corresponding to a N mineralisation coefficient of approximately 0.1 kg N kg- 1 C year- 1. Taking indirect effects into account, the contribution to N mineralisation ranged from approximately 12 kg N ha -1 year -~ to 53 kg N ha -1 year -1, corresponding with a N mineralisation coefficient of 1 kg N kg-~ C year -~. According to Method 2, the contribution to N mineralisation ranged from 7.0 to 29.7 kg N ha - 1 year- 1
Biomass of earthworms in the Horseshoe Bend sites was high (Table 1 ). According to Method 1, the direct contribution to N mineralisation was esti- mated to be 20 kg ha-1 year- t under conventional tillage and 97 kg ha-1 year- 1 under no-tillage (Table 3). The direct contribution corresponded to a mineralisation coefficient of 1 kg N kg- ' C year-1, which is ten times the coefficient estimated for the Kjettslinge plots. This large difference arises from the lower value of production efficiency (Kjettslinge: 0.4; Horseshoe Bend: 0.2), the higher death rate and the relatively high nitrogen content of the food (many bacteria instead of fungi) at Horseshoe Bend in comparison with Kjettslinge. Total (direct and indirect) contribution of earthworms to N mi- neralisation was approximately 71 kg ha - 1 year- 1 (conventional tillage) and 363 kg ha - 1 year-1 (no-tillage), corresponding to nitrogen mineralisation coefficients of 3.6 kg N kg- i C year- 1. According to Method 2, N mineralis- ation by earthworms amounted to 10.8 kg N ha- ~ year- ~ and 54.1 kg N ha - 1 year- 1 for conventional tillage and no-tillage, respectively
Discussion
Based on their biomass, earthworms can be expected to contribute consid- erably to carbon and nitrogen cycling in soil ecosystems. The present analysis of the earthworm population at the Lovinkhoeve site confirmed this expec- tation: the direct contribution of earthworms to N mineralisation in the inte- grated plot was about 5-7.5 kg ha-~ year-1, and including indirect effects it was 28 kg ha - l year -1. This amounted to 3-17% of the estimated total N mineralisation in the integrated plot. The total N mineralisation in the inte- grated plot ( 163 kg ha - 1 year- 1 ) was higher than the mineralisation in the conventional plot (98 kg ha -~ year -1 ) (Van Faassen and Lebbink, 1990). Present results, therefore, indicated that about 40% of the difference in N mineralisation between the two management practices might be caused by earthworm activity.
The relationship between biomass of earthworms and their effects on N mineralisation was not straightforward. The mineralisation coefficient for contribution to N mineralisation varied between 0.1 (Kjettslinge) and 1 (Horseshoe Bend). The sensitivity analysis of the Lovinkhoeve data showed
J. C. Y. Marinissen, P. C. de Ruiter /Agriculture, Ecosystems and Environment 47 (1993) 59-74 71
an even wider range of values. The combination of parameter values, espe- cially those for production efficiency and the C: N ratios of energy source and consumer, had dominant effects on the N mineralisation coefficient, i.e. the rate at which nitrogen is mineralised per amount ofbiomass-C. For example, changing the production efficiency of the earthworms from 0.4 to 0.2 gave a three-fold increase of the N mineralisation coefficient. The sensitivity analy- sis did not include the C: N ratio of the earthworms. From eqn. (7) it can be seen that the sensitivity to this C: N ratio depends on other properties of the earthworms (i.e. production efficiency) and of the environment (i.e. C :N ratio of the substrate). For example, an increase in the C :N ratio from five to six leads to an increase in N mineralisation of approximately 65% when the production efficiency is 0.4 and of approximately 12% when the produc- tion efficiency is 0.2. Moreover, decreasing the C :N ratio from five to four leads to a decrease in the N mineralization of approximately 17%, but when the production efficiency is 0.4, the earthworms will utilize all assimilated N for biomass production, so there will be no N mineralisation. De Ruiter et al. (1993 ) showed in a sensitivity analysis of the total foodweb of the Lovink- hoeve that the model was more sensitive to the C:N ratio of prey than of predators. This implied that the model was most sensitive to C: N ratio of soil organic matter. The sensitivity analysis in this study was restricted to param- eter values actually measured in the field or reported in the literature, but it is possible that values occur outside these ranges. For example, the C: N ratio of detritus was chosen to be ten, equal to the mean C: N ratio of the soil or- ganic matter, but it is uncertain whether this C :N ratio applies to the sub- strate on which earthworms and microbes actually feed.
Paustian et al. (1990) constructed a nitrogen budget of the B 120 plots of the Kjettslinge farm and indicated that the nitrogen flow through the earth- worm population amounted to approximately 10 kg ha - l year-1. This is comparable to the total estimate using Method 1: 12 kg N ha- ~ year- i. Par- melee and Crossley ( 1988 ) estimated a nitrogen flow through the earthworm population in the no-tillage practice of the Horseshoe Bend site to be 92 kg ha-~ year - l , whereas the present estimate using Method 1 indicated a total contribution to N mineralisation by earthworms of 364 kg ha - l year- l. This estimate was based on a production efficiency of 0.2 and a death rate of two per year (Hendrix et al., 1987 ). When parameter values were used similar to those used for the Kjettslinge sites (production efficiency of 0.4 and a death rate of one per year), the calculated N mineralisation rate by earthworms amounted to 82 kg ha - ~ year- i.
Both methods aim to estimate N mineralisation by earthworms. However, Method 1 distinguishes a direct and indirect component, whereas Method 2 distinguishes components related to two sources of mineral N (dead tissue and excretion products). Both these sources consist of organic and mineral nitrogen, but the organic fraction is assumed to be easily decomposable to
72 J. c. Y. Marinissen, P. C. de Ruiter /Agriculture, Ecosystems and Environment 47 (1993) 59- 74
mineral N. Therefore, the estimates of Method 2 include also some indirect effects, i.e. the decomposition of organic N by microbes. However, the indi- rect effects of Method 1 are of a different order, because they refer to the stimulation of microbial growth through increasing the availability of nu- trients, fragmentation of organic matter, and improved soil structure. Present estimates for the Lovinkhoeve of the direct contribution were 1.4 (feeding on detritus) and 4.6 (feeding on detritus and microbes), with the estimate using Method 2 being 7.5 kg N ha - i year- t . For the Kjettslinge sites Method 2 estimates the N mineralisation rate to be five times the estimated direct con- tribution using Method 1. Contrary to this, for the Horseshoe Bend site Method 1 gave much higher estimates for the direct contribution of earth- worms. However, when Lovinkhoeve values for the parameters are used for the other two situations, Method 2 is always a factor 2 higher than the esti- mated direct contribution using Method 1. This is probably because Method 2 also includes some indirect effects.
Both methods have advantages and disadvantages. Method 1 has the ad- vantage of providing an estimate of the stimulating effect of earthworms on microbes. Although stimulation of microbial growth from grazing has been shown in experiments (e.g. Coleman et al., 1978; Woods et al., 1982) it re- mains very uncertain to what extent this method of calculation reflects the actual situation. The advantage of Method 2 is that it is independent of the diet of the earthworms, although the assumption of fixed excretion rates in- dependent of the environment may be unrealistic. The choice of the method to be used must depend on which parameter values are available, taking into account that parameter values might vary according to circumstances. For example, the death rate will depend on climate, and the energy conversion efficiencies, C :N ratios and excretion rates may depend on the substrate available. Present calculations were based on the data available in the litera- ture. Future research should focus on energy and nutrient budgets for earth- worms under different (food) conditions; only then will it be possible to give more reliable estimates of the contribution of earthworms to N mineralisation.
Acknowledgements
The authors thank R. de Fluiter, and the staff of the Lovinkhoeve experi- mental farm for technical assistance. N. van Breemen made valuable com- ments on a draft of the manuscript. H. Terburg, anonymous referees and an Editor-in-Cheif corrected the English. This work was supported by the Neth- erlands Integrated Soil Research Program.
References
Anderson, J.R. and Westmoreland, D., 1971. Direct counts of soil organisms using a fluorescent brightener and a europium chelate. Soil Biol. Biochem., 3: 85-87.
J. C. Y. Marinissen, P. C. de Ruiter /Agriculture, Ecosystems and Environment 47 (1993) 59- 74 7 3
Andr6n, O., Lindberg, T., Bostr6m, U., Clarholm, M., Hansson, A.C., Johansson, G., Lagerlof, J., Paustian, K., Persson, J., Petterson, R., Schnurer, J., Sohlenius, B. and Wivstad, M., 1990. Organic carbon and nitrogen flows. Ecol. Bull., 40:85-125.
Bostr6m, U., 1988. Ecology of earthworms in arable land: Population dynamics and activity in four cropping systems. Department of Ecology and Environmental Research, Report 34, Swedish University of Agricultural Sciences, Uppsala.
Brussaard, L., van Vcen, J.A., Kooistra, M.J. and Lebbink, G., 1988. The Dutch programme on soil ecology of arable farming systems. I. Objectives, approach and preliminary results. Ecol. Bull., 39: 35-40.
Byzova, J.B., 1965. Comparative rate of respiration in some earthworms. Rev. d'Ecol. Biol. du Sol, 2:207-216.
Christensen, O., 1987. The effect of earthworms on nitrogen cycling in arable soils. In: B.R. Striganova (Editor), Soil Fauna and Soil Fertility. Proc. 9th Int. Colloquium, Soil Zoology, Moscow, pp. 106-118.
Coleman, D.C., Anderson, R.V., Cole, C.V., Elliott, E.T., Woods, L. and Campion, M.K., 1978. Trophic interactions in soils as they affect energy and nutrient dynamics. IV. Flows of met- abolic and biomass carbon. Microbial Ecol., 4: 373-380.
Coleman, D.C., Reid, C.P.P. and Cole, C.V., 1983. Biological strategies of nutrient cycling in soil ecosystems. Advances Ecol. Res., 13: 1-55.
Edwards, C.A., 1990. The importance of integration in sustainable agricultural systems. In: C.A. Edwards, R. Lal, P. Madden, R.H. Miller and G. House (Editors), Sustainable Agricultural Systems. Soil and Water Conservation Soc., Ankeny, IA.
Elliott, E.T., Cole, C.V., Fairbanks, B.C., Woods, L.E., Bryant, R.J. and Coleman, D.C., 1983. Short term bacterial growth, nutrient uptake and ATP turnover in sterilized, inoculated and C-amended soil: the influence of N availability. Soil Biol. Biochem., 15:85-91.
Findlay, S., Carlough, L., Crocker, M.T., Gill, H.K., Meyer, J.L. and Smith, P.J., 1986. Bacterial growth on macrophyte leachate and fate of bacterial production. Limnol. Oceanogr., 3 l: 1335-1341.
Heal, O.W. and MacLean, S.F., 1975. Comparative productivity in ecosystems secondary pro- ductivity. In: W.H. van Dobben and R.H. Lowe-McConnell (Editors), Unifying Concepts in Ecology. Junk, Wageningen, pp. 89-108.
Hendrix, P.F., Crossley, Jr., D.A., Coleman, D.C., Parmelee, R.W. and Beare, M.H., 1987. Car- bon dynamics in soil microbes and fauna in conventional and no-tillage agro-ecosystems. INTECOL Bull., 15: 59-63.
Hunt, H.W., Coleman, D.C., Ingham, E.R., Ingham, R.E., Elliott, E.T., Moore, J.C., Rose, S.L., Reid, C.P.P. and Morley, C.R., 1987. The detrital food web in a shortgrass prairie. Biol. Fertil. Soils, 3: 57-68.
Kooistra, M.J., Lebbink, G. and Brnssaard, L., 1989. The Dutch programme on soil ecology of arable farming systems. 2. Geogenesis, agricultural history, field site characteristics and pres- ent farming systems at the Lovinkhoeve experimental farm. Agric. Ecosystems Environ., 27: 361-387.
Lee, K.E., 1985. Earthworms, their ecology and relationships with soils and land use. Academic Press, Sydney, N.S.W., 411 pp.
Marinissen, J.C.Y., 1993. Population dynamics of earthworms in a silt loam soil under conven- tional and 'integrated' arable farming during two years with different weather patterns. Soil Biol. Biochem., 24( 12): 1647-1654.
Marinissen, J.C.Y. and Van den Bosch, F., 1992. Colonization of new habitats by earthworms: a model approach. Oecoiogia, 91: 371-376.
Monestier, P. and Kxetzschmar, A., 1992. Estimation of the relationship between structural parameters of simulated burrow systems and their partitioning effects. Soil Biol. Biochem., 24(12): 1549-1554.

74 J.c.Y. Marinissen, P.C. de Ruiter/Agriculture, Ecosystems and Environment 47 (1993) 59-74
Parmelee, R.W. and Crossley, Jr., D.A., 1988. Earthworm production and role in the nitrogen cycle of a no-tillage ago-ecosystem on the Georgia Piedmont. Pedobiologia, 32:353-361.
Parmelee, R.W., Beare, M.H., Cheng, W., Hendrix, P.F., Rider, S.J., Crossley Jr, D.A. and Cole- man, D.C., 1990. Earthworms and enchytracids in conventional and no-tillage agroecosys- terns: a biocide approach to assess their role in organic matter breakdown. Biol. Fertil. Soils, 10: 1-10.
Paustian, K., Andr6n, O., Clarholm, M., Hansson, A.-C., Johansson, (3., Lagerl6f, J., Lindberg, T., Pettersson, R. and Sohlenius, B., 1990. Carbon and nitrogen budgets of four agro-ecosys- terns with annual and perennial crops with and without N-fertilization. J. Appl. Ecol., 27: 60-84.
Ruiter, P.C., Moore, J.C., Zwart, K.B., Bouwman, L.A., Hassink, J., Bloem, J., De Vos, J.A., Marinissen, J.C.Y., Didden, W.A.M., Lebbink, (3. and Brussaard, L., 1993. Simulation of nitrogen mineralisation in belowground food webs of two winter wheat fields. J. Appl. Ecol., 30: 95-106.
Satchell, J.E., 1967. Lumbricidae. In: A. Burges and F. Raw (Editor), Soil Biology. Academic Press, London, pp. 259-352.
Tezuka, Y., 1990. Bacterial regeneration of ammonium and phosphate as affected by the car- bon: nitrogen: phosphorus ratio of organic substrates. Microbial Ecol., 19: 227-238.
Van Faassen, H.(3. and Lebbink, (3., 1990. Nitrogen cycling in high-input versus reduced-input arable farming. Netherlands J. Agric. Sci., 38: 265-282.
Van Veen, J.A. and Paul, E.A., 1979. Conversion of biovolume measurements of soil organisms, grown under various moisture tensions, to biomass and their nutrient content. Appl. Envi- ron. Microbiol., 37: 686-692.
Woods L.E., Cole C.V., Elliott, E.T., Anderson, R.V. and Coleman, D.C., 1982. Nitrogen trans- formations in soil as affected by bacterial-microfaunal interactions. Soil Biol. Biochem., 14: 93-98.