contribution of dissolved organic nitrogen from rivers to ... · pdf filevol. 159: 1-12, 1997...
TRANSCRIPT

Vol. 159: 1-12, 1997 l MARINE ECOLOGY PROGRESS SERIES Mar Ecol Prog Ser Published November 29
Contribution of dissolved organic nitrogen from rivers to estuarine eutrophication
S. P. Seitzinger*, R. W. Sanders*'
Academy of Natural Sciences, Division of Environmental Research. 1900 Benjamin Franklin Parkway, Philadelphia, Pennsylvania 19103, USA
ABSTRACT: The bioavailibility of dissolved organic nitrogen (DON) in river water entering estuaries was examined for the Delaware and Hudson Rivers, USA. Water collected from above the salinity intru- sion zone of each river was filtered, brought to a salinity of 15 ppt, and inoculated with estuarine bac- teria. Bacterial production rates (8 to 26 X 105 cells ml-' d-') during the initial 2 d in these experiments were within the range measured in these and other estuaries, indicating that riverine dissolved organic matter can contribute to production of estuarine bacteria. Average DON concentrations decreased by 40 to 72 % within the 10 to 15 d time course of the experiments; the decreases in DON were accounted for by increases in microbial biomass plus remineral~zation to inorganic nitrogen. The time scale over which DON was utilized suggests that in estuaries with residence times on the order of weeks to months, such as Delaware Bay, river inputs of the biologically available portion of DON are first utilized within the estuary. In contrast, in estuaries with residences times of less than a week, such as New York Bay, a portion of the biologically available DON may be utilized first within the estuary, with the rema~nder exported and utilized In continental shelf waters The large proportion of the DON that was biolog~cally available in these experiments, coupled with the knowledge that inputs of organic nitrogen can account for 20 to 90% of the total nitrogen loading to estuaries, suggests that organic nitrogen inputs may contribute more to estuarine and shelf eutrophication than was previously suspected. These experiments demonstrate that dissolved inorganic nitrogen (DIN) inputs underestimate, and total nitro- gen lnputs likely overestimate, the inputs of biologically available N to estuaries. In order to develop a 'biolog~cally available nitrogen budget' for an ecosystem, DIN inputs, plus that portion of the organlc N that is biologically available must be quantified.
KEY WORDS: Dissolved organic nitrogen . Nitrogen . Estuaries . Rivers Microbial processes Eutro- phication
INTRODUCTION
If the current and future eutrophication of estuaries and near shore marine waters is to be ameliorated, a clear understanding of the external sources of nutri- ents, their effect on the ecosystem, and their removal
Present addresses: 'Rutgers University, Institute of Marine and Coastal Scl- ences, RutgersINOAA CMER Program, 71 Dudley Road, New Brunswick. New Jersey 08901-8521. USA. E-mail: [email protected]
"Temple University, Department of Biology, Philadelphia, Pennsylvania 19122, USA
from the ecosystem is essential. Decreasing nitrogen (N) inputs is especially important because N is the nutrient that is most limiting to primary production in many estuarine and coastal waters (Ryther & Dunstan 1971, Oviatt, et al. 1995). Most studies of nutrient inputs to estuaries have examined the response to dis- solved inorganic N (DIN = ammonia, nitrate, nitrite), because these forms of nitrogen are known to be incor- porated rapidly by phytoplankton and to contribute to eutrophication (Ryther & Dunstan 1971, Boynton et al. 1982, D'Elia et al. 1986, Howarth 1988). However, DIN accounts for only a portion of the nitrogen inputs. The effect of organic N, which comprises the remainder of the loading, has been largely ignored.
O Inter-Research 1997 Resale of fuU article not permitted

2 Mar Ecol Prog Ser 159: 1-12, 1997
Both particulate and dissolved forms of organic nitrogen contribute to estuarine N loading, but the dis- solved forms are most likely to be immediately avail- able to planktonic microorganisms. Bacteria and some phytoplankton rapidly assimilate very low molecular weight compounds, such as amino acids and urea (e.g. Wheeler & Kirchman 1986, Fuhrman 1990, Antia et al. 1991, Glibert et al. 1991, Keil & Kirchman 1991, Cotner & Gardner 1993, Jorgensen et al. 1993, Tranvik 1993). These low molecular weight compounds are generally considered to comprise 20% or less of the dissolved organic nitrogen (DON) transported by rivers to estu- aries, with the bulk of the DON consisting primarily of uncharacterized, complex, high molecular weight (HMW, > l kDa) compounds (Thurmann 1985).
Traditionally, most dissolved organic matter (DOM) inputs to estuaries have been considered refractory and of limited biological availability based on the pre- dominance of HMW compounds, and on findings that DOM mixing curves in some estuaries showed conser- vative behavior with respect to salinity (e.g. Mantoura & Woodward 1983). However, the utilization of nitro- gen contained in the HMW compounds that make up the bulk of DON has not been substantially addressed by experimental measurements; studies have primarily focussed on the fate of C in DOM. Recent studies in the Amazon River and in a river entering the Gulf of Mex- ico support previous conclusions that 70% or more of the dissolved organic carbon (DOC) in rivers is con- tained in HMW compounds (Arnon & Benner 1994, Santschi et al. 1995). In contrast to previous conclu- sions about the bioavailability of HMW DOC, recent studies demonstrate that a considerable portion of HMW DOC in rivers is readily used by bacteria (Meyer et al. 1987, Amon & Benner 1994). While studies such as these are changing our concepts about the fate of C in DOM, little is known about utilization of N in river inputs of DOM to estuaries. The fate of N in DOM can differ considerably from that of C depending on a num- ber of factors, including the C:N ratio of the com- pounds utilized relative to the C:N ratio of bacterial consumers of DOM (Goldman et al. 1987, Gardner et al. 1996).
In order to fully understand the contribution of rivers to estuarine eutrophication, we need to know whether the influx of river transported organic N is biologically available. Organic N can be incorporated into the bio- logical cycle in estuaries when microbial populations assimilate the N into bacterial biomass and/or regener- ate the organic N as ammonia (Goldman et al. 1987, Caron & Goldman 1990). DON may also become bio- logically available due to the release of ammonia fol- lowing photochemical oxidation of DON (Bushaw et al. 1996), degradation of DON by phytoplankton exoen- zymes (Palenik & More1 1990, Pantoja & Lee 1994) and
Fig. 1 Location of the Delaware and Hudson h v e r sampling sites and the Barnegat Bay estuary in the northeastern U.S. All experiments used bacterial innocula from the Barnegat Bay estuary. Samples of river water for dissolved organic nitrogen (DON) experiments were collected just above the salinity intrusion zones of each estuary (Philadelphia, Penn-
sylvania, and Newburgh, New York)
by direct phytoplankton uptake (Antia et al. 1991, Paerl 1991). The present study examined how much of the DON in 2 rivers was readily utilized by natural assemblages of heterotrophic estuarine microbes, and the degree to which the DON was incorporated into cell biomass or regenerated as ammonia.
METHODS
Study sites. Utilization of riverine DON by estuarine microorganisms was studied using water from the Delaware and Hudson Rivers, USA. River water was collected just above the salinity intrusion zone of each estuary to represent DON actually reaching the estu- ary (Fig. 1). The Delaware was chosen because there are numerous point sources of organic matter (e.g. sewage treatment plants in the metropolitan Philadel- phia area) that discharge just upstream of the salinity intrusion zone. This contrasts with the Hudson River where there are not major point sources in the region

Seitzinger & Sanders: Contribution of DON to eutrophication 3
near the salinity intrusion area (the New York City inputs enter within the saline portion of the estuary), but significant runoff from agricultural and forested areas along the length of the Hudson (Howarth et al. 1991, Clark et al. 1992).
Experimental setup. Two experiments were con- ducted to examine utilization of riverine DON by estu- arine bacteria: an initial experiment in April 1992 with Delaware River water, and a second experiment in June 1992 with Delaware and Hudson River water to compare utilization of DON from the 2 rivers. Here- after, the April and June experiments will be referred to as Expts I and 11, respectively. The overall design of the experiments was to add concentrated natural assemblages of estuarine bacteria to sterile-filtered river water (after increasing the salinity to 15 ppt). This left DOM from the rivers as the primary organic com- pounds available for growth. Changes in microbial abundances and inorganic and organic N concentra- tions were then measured over time.
River water was collected in acid-cleaned and propanol-rinsed carboys. Carboys were rinsed with river water from the respective sites at the time of sam- ple collection. During transport and processing the water was kept at 4°C. In the laboratory, river water was immediately filtered, first through 24 pm and then through 0.2 pm spiral-wound glass fiber filters to remove microorganisms and other particles. Based on repeated checks, there were no measureable changes in DOC or DON concentrations in river water as a result of this filtering procedure. A combination of pre- combusted salts (Kester et al. 1967) was added to establish an estuarine salinity of 15 ppt (MgCl? was not precombusted). Control water (Barnstead Nanopure water) was filtered and salts were added, using the same procedures employed for the river water.
Concentrates of estuarine bacteria were obtained using water (15 ppt) from a small estuary, Barnegat Bay, New Jersey, which is equidistant from the mouths of the 2 rivers (Fig. 1). We chose to use bacteria from Barnegat Bay, in contrast to bacteria from each river's estuary, so that differences in DOM utilization would reflect differences in organic matter among the sites, and not differences in bacterial populations. Barnegat Bay water was filtered through a 35 pm mesh plankton net and a 1 pm Nuclepore polycarbonate filter to remove larger organisms and particulates. Bacteria in the filtrate were then concentrated using either a 0.2 pm Nuclepore membrane filter (Expt I) or a 1 MDa polysulphone filter (tangential flow ultrafiltration; Fil- tron Technologies) (Expt 11).
In Expt I1 a sonication step was introduced which eliminated remaining protists without significantly affecting bacterial growth (data not shown). The bacte- rial concentrate was prepared as above (including pre-
filtration) and then pulse sonicated using a Branson Cell Disruptor I1 with a microtip probe. Three batches of 33 m1 each were sonicated over ice at the microtip power limit and a 50 % duty cycle for 2 5 min. Prelimi- nary experiments indicated that this step eliminated protists without significantly affecting bacterial growth at 24 and 48 h. Protists were observed after 24 h when shorter sonication steps were used, while longer steps appeared to inhibit bacterial growth.
Incubations. Bacterial concentrates (-18 ml) from Barnegat Bay were added to 10 1 of river and control water to give an initial abundance in the treatment water of 8 to l 1 X 10⁵ cells ml-' (Expt I ) and 2 to 4 X 10⁵ cells n~ l - ' (Expt 11). Initial samples for nutrients and bacteria were taken from the river and control waters and then 4 1 of each treatment water were poured into duplicate 4 1 Erlenmeyer flasks (i.e. 2 control flasks and 2 flasks for each river with 4 1 per flask). The flasks were capped with aluminum foil and incubated in the dark at 2OoC; the water was stirred gently with Teflon coated stir bars.
Measurements. Time series samples of water were taken over a 23 d period during Expt I and over a 10 d period during Expt I1 (see results for exact sampling frequency). Water samples for DIN (NH,', NO2-+NO3-) (Parsons et al. 1984, Alpkem 1991), dissolved reactive phosphate (DIP; Parsons et al. 1984), total dissolved N (TDN; Walsh 1989), and particulate N (PN; Expt I1 only) (Carlo Erba Elemental Analyzer) analysis were filtered through (dissolved) or collected on (particu- late) pre-combusted (500°C) glass fiber filters (What- man GF/F). DON was determined by the difference between TDN and DIN. TDN samples were analyzed by high temperature combustion followed by chemilu- minescent detection of nitric oxide (Walsh 1989) using an Antek Model 7000 Total N Analyzer (Antek, Inc.) equipped with a quartz combustion tube (1000 -t 10°C) and a ceramic insert. TDN samples were preserved in capped autosampler vials with 3 N HCl (7.5 p1 acid per 1.5 m1 sample). Blanks consisted of deionized distilled water. Both inorganic (ammonia and nitrate plus nitrite) and organic (urea) standards for TDN analysis were prepared in deionized distilled water.
Samples were analyzed for bacterial abundance (Francisco et al. 1973, Hobble et al. 1977) and biovol- ume [Lee & Furhman 1987). Heterotrophic flagellate (HNAN) abundance and biovolume were determined using epifluorescent microscopy. The abundance and size of bactena on glass cover slips suspended in the incubation flasks were examined to estimate growth on the flask walls (Hagstrom et al. 1984). Specific growth rates and doubling tlmes of bacteria were cal- culated from changes in abundance during the first 2 d of the experiments. This was possible because preda- tlon-related mortality was eliminated in Expt 11, and
Mar Ecol Prog Ser 159: 1-12, 1997
flagellates had not yet reached abundances that would significantly impact bacterial populations in Expt I. Bacterial biovolumes were converted to C and N bio- mass using a conversion factor of 220 fg C and a C:N ratio of 4.29:l by weight (Bratbak 1985, Goldman et al. 1987). Flagellate biovolume was converted to bio- mass assuming 350 fg C pm-3 and a C:N ratio of 5 .61 by weight (Sanders et al. 1996).
RESULTS
Experiment I
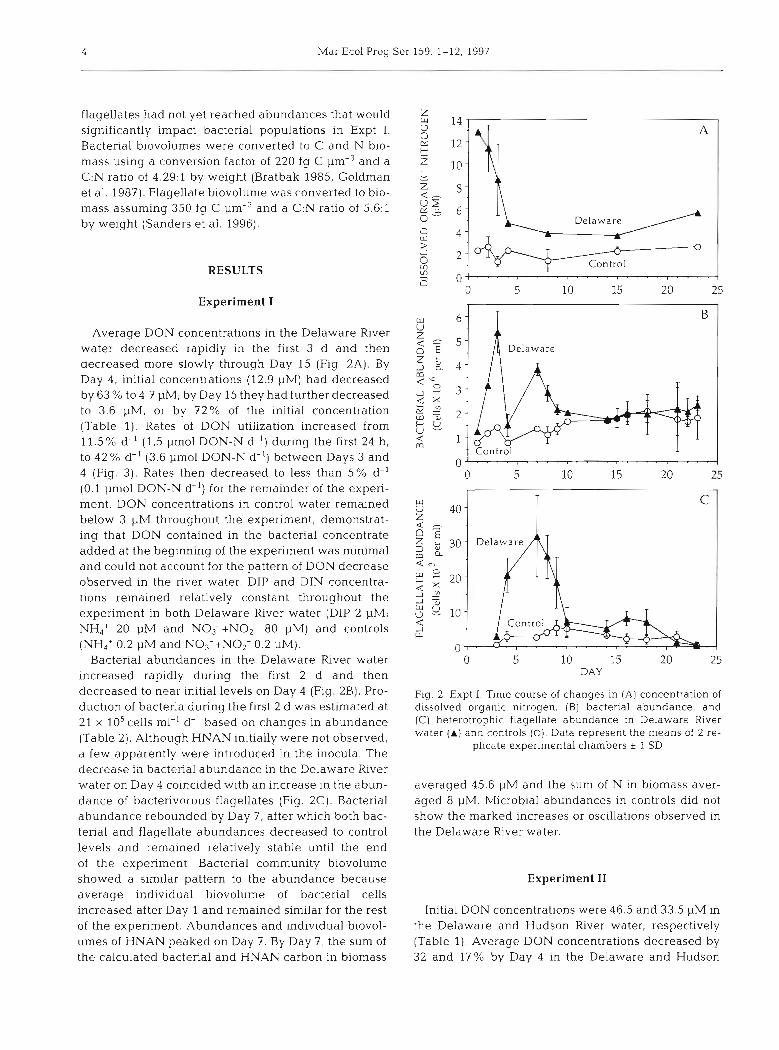
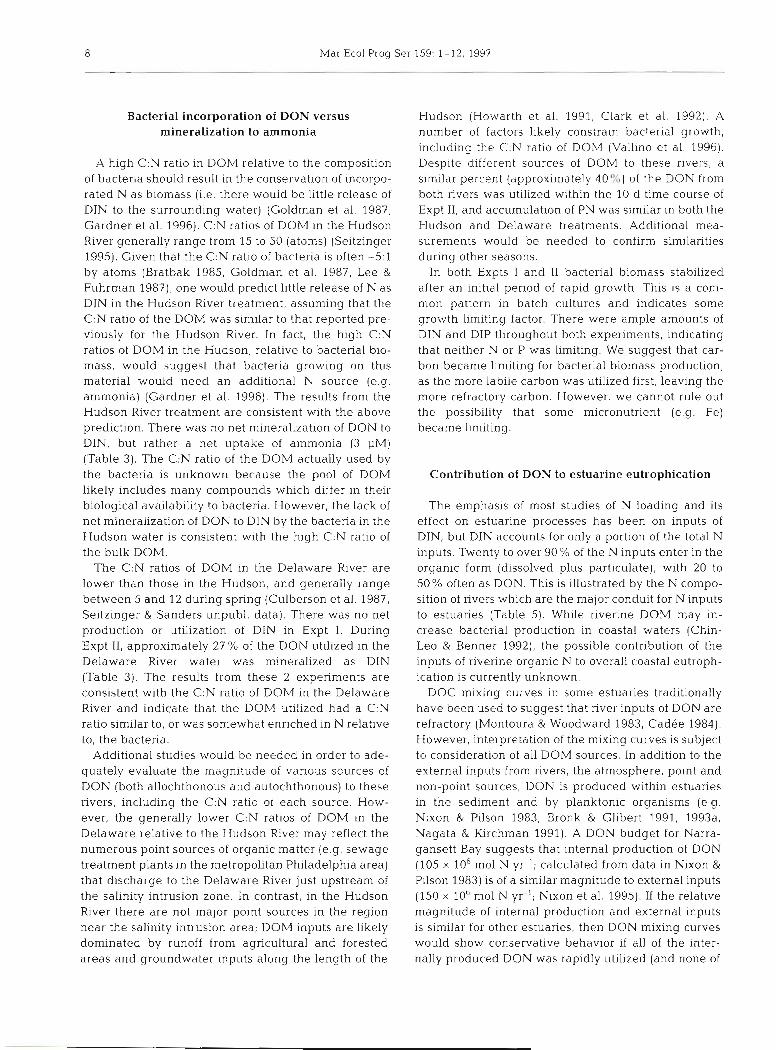
Average DON concentrations in the Delaware River water decreased rapidly in the first 3 d and then decreased more slowly through Day 15 (Fig 2A). By Day 4, initial concentrations (12.9 PM) had decreased by 63 % to 4.7 pM; by Day 15 they had further decreased to 3.6 PM, or by 72% of the initial concentration (Table 1) . Rates of DON utilization increased from 11.5 % d-' (1.5 pm01 DON-N d-') during the first 24 h, to 42 % d-' (3.6 pm01 DON-N d-l) between Days 3 and 4 (Fig. 3). Rates then decreased to less than 5% d-' (0.1 pm01 DON-N d-l) for the remainder of the experi- ment. DON concentrations in control water remained below 3 yM throughout the experiment, demonstrat- ing that DON contained in the bacterial concentrate added at the beginning of the experiment was minimal and could not account for the pattern of DON decrease observed in the river water. DIP and DIN concentra- tions remained relatively constant throughout the experiment in both Delaware River water (DIP 2 pM; NH4+ 20 pM and NO3-+NO2- 80 PM) and controls (NH4+ 0.2 pM and NO3-+NO2- 0.2 PM).
Bacterial abundances in the Delaware River water increased rapidly during the first 2 d and then decreased to near initial levels on Day 4 (Fig. 2B). Pro- duction of bacteria during the first 2 d was estimated at 21 X 105 cells ml-' d-' based on changes in abundance (Table 2). Although HNAN initially were not observed, a few apparently were introduced in the inocula. The decrease in bacterial abundance in the Delaware River water on Day 4 coincided with an increase in the abun- dance of bacterivorous flagellates (Fig. 2C). Bacterial abundance rebounded by Day 7, after which both bac- terial and flagellate abundances decreased to control levels and remained relatively stable until the end of the experiment. Bacterial community biovolume showed a similar pattern to the abundance because average individual biovolume of bacterial cells increased after Day 1 and remained similar for the rest of the experiment. Abundances and individual biovol- umes of HNAN peaked on Day 7. By Day 7, the sum of the calculated bacterial and HNAN carbon in biomass
il Delaware
0 5 10 15 20 25 DAY
Fig. 2. Expt I. Time course of changes in (A) concentration of dissolved organic nitrogen, (B) bacterial abundance, and (C) heterotrophic flagellate abundance in Delaware River water (A) and controls (0 ) . Data represent the means of 2 re-
plicate experimental chambers * 1 SD
averaged 45.6 pM and the sum of N in biomass aver- aged 8 pM. Microbial abundances in controls did not show the marked increases or oscillations observed in the Delaware River water.
Experiment I1
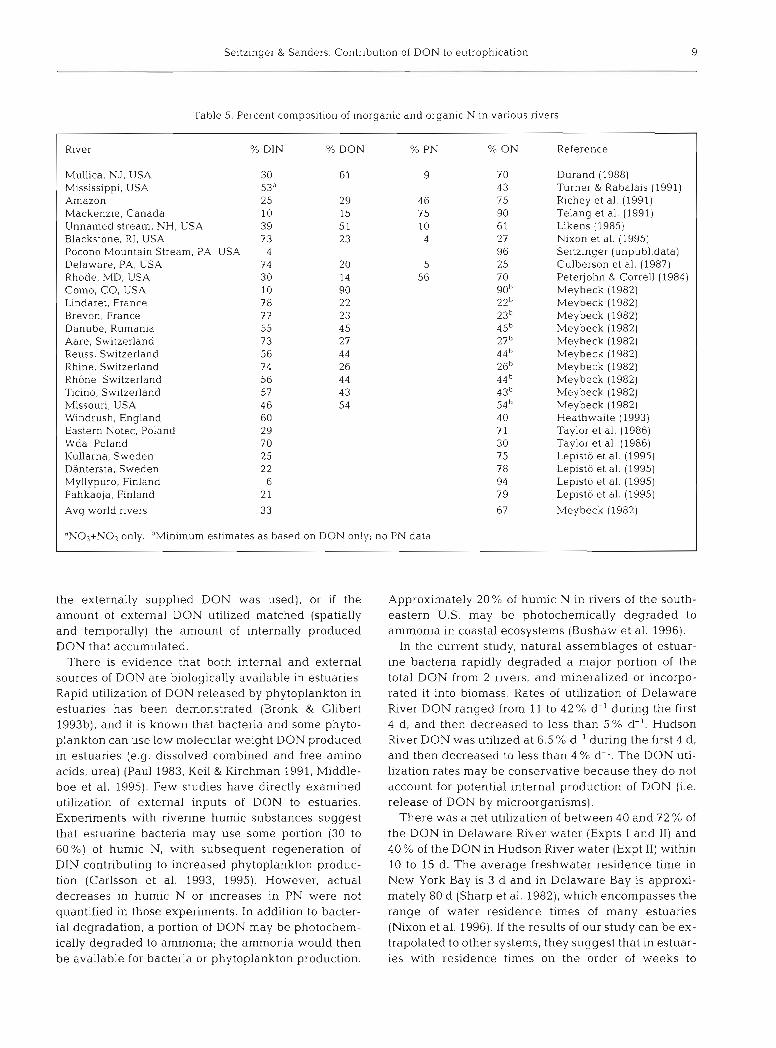
Initial DON concentrations were 46.5 and 33.5 pM in the Delaware and Hudson River water, respectively (Table 1). Average DON concentrations decreased by 32 and 17% by Day 4 in the Delaware and Hudson

Seitzlnger & Sanders: Contribution of DON to eutrophicatlon 5
Table 1. Rates of degradation of Delaware and Hudson River DON by e s tua r~ne Hudson treatments (Table 3). PN con- microorganisms centrations increased by 11.1 pM,
from 0.5 to 11.6 pM PN, in the Dela- DON source Expt Incubation Aog initlal Fractlon Avg rateb ware treatment (particulate fllters
perlod DON consumed" of util~zation from A and B flasks analyzed to- (d) (PM) (%) (!-lmo1 d- ') gether) (Table 3) . In the Hudson treat-
Delaware River 1 1-4 12 9 63 2.7 ment, PN increased from 0.9 pM to 4-15 4 7 72 0.1 14.4 (A replicate) and 8.8 pM (B repli-
I I 1-4 46.5 3 2 4.9 cate), or by 13.5 pM and 7.9 pM, 4-8 31 6 4 0 0.9 respectively. DIP concentrations re-
Hudson River I1 1-4 33.5 17 1.9 mained constant (Delaware 1 pM; 4-10 27.8 40 1 .3 Hudson 0.4 pM) throughout the ex-
perlment (data not shown). DON con- "Fract~on of Day 1 concentration consumed centratlons in control water remained "Rate of u t ~ l ~ z a t ~ o n durlng ind~cated incubation penod
constant (-4 pM) throughout the ex- periment, demonstrating, as for Expt I , that DON contained in the bacterial
Table 2 Production of estuarine bactena In waters onglnating from the concentrate added at the beginning of Delaware and Hudson R~vers. Rates were calculated during the inltial 2 d perlod of loaanthmlc arowth. Water fl-om the Hudson Rlver was collected from a n area the was and - where the anthropogenlc Input was prlmar~ly due to agricultural runoff whde could not account for the Pattern of that from the Delaware was collected downs t~eam from wastewatel treatment DON decrease observed in the rlver facihtles Control was delonlzed water All water was filtered and brought to a water
sallnlty of 15 ppt pnor to addl t~on of bacterla (see 'Methods ) There was a rapid Increase in the
I I abundance and biomass of the estuar-
Control 0 5 0.1 5 8
Gross production Speclflc Population (cells X 105 product~on doubllng ml-l d- ' ) Id-') tlme (d)
Delaware Rlver Expt l 20.7 0.74 0 9 Expt 11 8.4 1.07 0 6
Hudson River Expt I1 26.3 1 85 0.4
ine bacteria growing on dissolved organics from the Delaware and Hud- son Rivers (Fig. 4B, Table 2). The bac-
River water, respectively, with a maximum decrease of 40% of the initial concentration over the course of the experiment for both treatments (Fig. 4A; Table 1). Rates of DON utilization in the Delaware treatment were higher during the first 4 d (15% d- ' or 4.9 pm01 DON-N d-l) compared to Days 4-8 (0.9 pm01 DON-N d-') (Table 1). However, changes in DON utilization rates over the tlme course of the experiment were not as evident for the Hudson treatment (6.5% d-' or 1.9 pm01 DON-N d-I during Days 1 to 4 and 1.3 pm01 DON-N d-' during Days 4 to 10). The fraction of b ~ o - logically available DON in the Hudson River water may have been greater than 40% given that DON uti- lization continued at a relatively constant rate through- out the 10 d experiment. DIN concentrations in the Delaware and Hudson River water were 18 and 6.5 pM for ammonia, respect~vely, and 90 and 32 FM for nitrate plus nitrite, respectively. Throughout the exper- iments the DIN concentration increased by an average of 5 pM in the Delaware and decreased by 3 pM in the
terial growth rate during the first 2 d on Delaware River DOM was 8.4 X 10⁵ cells ml-' d-' and on Hudson River DOM was 26.3 X 10"ells ml-' d-' (Table 2). The n~aximum bacterial abundances reached in this experi- ment were similar to the maximum
DAY
Flg. 3. Expt I. Rates of utlllzation of DON in Delaware River water, expressed as percent of DON utilized per day and
pmol DON-N utilized per day

Mar Ecol Prog Ser 159: 1-12, 1997
DISCUSSION
densities in Expt I. However, average bacterial biovol- ume increased over time in Expt 11, which resulted in 50 - an average community biomass that was 5 times that determined at the end of Expt I . Heterotrophic flagel- W * lates were not observed in Expt 11, indicating that U 40- '2 efforts to eliminate these predators were successful. At the end of the experiment, bacterial C calculated from biovolume was 62.5 and 66.1 pM in the Delaware and 30 '
Hudson, respectively. The corresponding bacterial N ,
averaged 12.5 pM in the Delaware and 13.3 pM in the g - 20 - Hudson River water (Table 3). 2 >
Mass balance of biomass production and dissolved nitrogen
A
Hudson
In this study, concentrated assemblages of natural estuarine bacteria were added to sterile-filtered river water, which left riverine DOM as the only organic compounds for growth. A rapid increase in bacterial abundances in waters originating from both the Delaware and Hudson Rivers was mirrored by a decrease in DON concentrations. As detailed below, the DON concentrations decreased by 40 to 72% dur- ing the 10 to 15 d time course of the experiments, and were accounted for by increased microbial biomass plus mineralized DIN.
The bacterial production estimates calculated from increases in abundances during the first 2 d of these ex- periments (Table 2) are in general agreement with measurements of production in several estuarine sys- tems (Table 4). The changes in microbial abundance during Expt I (Fig. 2), where the initial large increase in bacterial numbers was followed by a rapid increase in HNAN, also reflect the well-known ability of protists to reduce bacterial population levels (e.g. Sanders et al. 1992). The HNAN bacterivory reduced the abundance of bacteria and a series of damped predator-prey oscil- lations followed. While our estimates are not intended to precisely predict the actual population dynamics in the Delaware and Hudson estuaries, the bacterial growth rates on DOM and the predation by HNAN in these experiments fell within the range of previous ob- servations and were ecologically reasonable.
The mass balances calculated below for changes in dissolved and particulate nitrogen in the water ignored any wall growth during the experiment. This was justi- fied because growth of bacteria on the walls of the ves- sels was minor during the first 10 d of both experi- ments. Numbers of bacteria per cm2 that were attached to the flasks were estimated from the bacteria attached to suspended glass cover slips. Using maximum observed densities of attached bacteria, which overes-
DAY
Fig. 4 . Expt 11. Changes in (A] concentrahon of dissolved organic nitrogen and [B) bacterial abundance in water originating from the Delaware and Hudson IZlvers (A and A , respectively) and in
controls (0). Means of 2 replicate chambers * 1 SD
timates their relative importance early in the experi- ments, only 1.3% of the bacteria were attached in Expt I, and 4 to 6'' in Expt IJ. The insignificant bacter- ial wall growth during the initial 10 d in our experi- ments agreed with the findings of Hagstrom et al. (1984). Biovolume estimates were made in Expt I1 for attached bacteria, and showed that they were smaller than the bacteria suspended in the water. Thus, attached bacterial biomass in these experiments did not exceed 4 % of the total bacterial biomass during the period of rapid DON disappearance. Attached HNAN and large spinlla were observed on suspended cover- slips after Day 10 in Expt I. This may account for a pro- portion of the observed, although small, decrease in DON between Days 10 and 15.

Seitzinger & Sanders: Contribution of DON to eutrophication 7
Table 3. Net utilization of dissolved organic nitrogen (DON), net production or utilization of dissolved inorganic nitrogen (DIN), and net production of particulate N (PN) in Delaware and Hudson River water (salinity 15 ppt) by estuarine bacteria during Expt 11. Negative DIN numbers reflect decreases in DIN concentration, indicating bacterial utilization of DIN. Calculated DON utilization is the sum of increases in PN (estimated from either CHN analyses or bacterial biovolume) plus net change in DIN.
Units: pM of N
Delaware River Hudson River Replicate. A B Avg (*SD) A B Avg (*SD)
Bacterial biornass production Particulate N analysis l l . l d l l . la 11.16 13.5 7.9 10.7 (3.9) Calculated bacterial biomass 11.6 13.4 12.5 (1.3) 14.1 12.4 13.3 (1.2)
DIN mineralization or utilization 6 4 5 (1.4) -2.9 -3.7 -3.3 (0.6)
DON utilization PN + DIN changes (range) 17.1-17 6 15.1-17.4 16.1-17.5 10.6- 11.2 4.2-8.7 7.4-10 Measured DON decrease 17 2 0 18.5 (2.1) 13.2 13.9 13 5 (0.5)
"Average of A and B flasks Water from the replicate flasks was combined for CHN analysis
Microbial utilization of DON during Expt I was esti- mated by 2 independent methods: (1) decreases in DON concentrations, and (2) calculations of N in bac- teria and HNAN from biovolumes and abundances, plus changes in DIN concentrations. Maximum N bio- mass accumulation in bacteria plus HNAN was ap- proximately 8 pM N and occurred on Day 7. There were no net changes in DIN concentration in Expt I. The increase in estimated microbial biomass is consis- tent with measured decreases in DON concentration (9.3 pM).
In Expt 11, microbial utilization of DON was estimated by 3 independent methods: (1) decreases in DON con- centrations, (2) chemical analysis of PN on filters, and (3) calculation of N in bacterial biomass based on bacte- rial biovolumes and abundances. Net changes in DIN were added to bacterial biomass accumulation to calcu-
late total DON utilization rates for approaches 2 and 3. The 3 independent methods produced remarkably sim- ilar results (Table 3). In the Delaware River treatment, there was a 17 to 20 pM decrease in DON concentration during the course of the experiment (Table 3) . The de- crease in DON was matched by a n increase of between 11.1 and 13.4 pM in particulate N (range of both meth- ods) plus a n increase of 4 to 6 pM DIN, for a n average increase in PN plus DIN of 16.1 to 17.5 1iM. The close agreement between the DON decrease (18.5 + 2.1 pM) and the increase in PN plus DIN (16.1 to 17.5 pM) strongly suggests that most of the DON was incorpo- rated into bacterial biomass, with a smaller amount of N mineralized a s DIN. In the Hudson River treatment the decrease in DON (by 13.2 and 13.9 PM) was similar, al- though somewhat less than, the increase in particulate N minus utilization of -3 pM DIN.
Table 4. Bacterial production estimates from several estuarine and riverine systems
Site
Danube River Delaware estuary, USA
Essex estuary, MA, USA Hudson k v e r , USA
Hudson estuary plume, USA Meuse River, Belgium RhBne River plume, France Seine River, France York estuary, VA, USA
Gross production Specific production Reference (cells X 10' m l ' d-') W')
Berger et al. (1995) Coffin & Sharp (1987) Hoch & Kirchman (1993) Wright & Coffin (1984) Findlay e t al. (1991) Vaque et al. (1992) Ducklow & Kirchman (1983) Servais et al. (1985) h r c h m a n et al. (1989) Servais & Garnier (1993) Ducklow (1982)
aAssumes 10-l4 g C cell-' out of 36 seasonal samples approached a gross productivity of 110 X 105 cells ml-' d-'
Mar Ecol Prog Ser 159: 1-12, 1997
Bacterial incorporation of DON versus mineralization to ammonia
A high C:N ratio in DOM relative to the composition of bacteria should result in the conservation of incorpo- rated N as biomass (i.e. there would be little release of DIN to the surrounding water) (Goldrnan et al. 1987, Gardner et al. 1996). C:N ratios of DOM in the Hudson River generally range from 15 to 50 (atoms) (Seitzj.nger 1995). Given that the C:N ratio of bacteria is often -5:l by atoms (Bratbak 1985, Goldman et al. 1987, Lee & Fuhrman 19871, one would predict little release of N as DIN in the Hudson River treatment, assuming that the C:N ratio of the DOM was similar to that reported pre- viously for the Hudson River. In fact, the high C:N ratios of DOM in the Hudson, relative to bacterial bio- mass, would suggest that bacteria growing on this material would need an additional N source (e.g. ammonia) (Gardner et al. 1996). The results from the Hudson River treatment are consistent with the above prediction. There was no net mineralization of DON to DIN, but rather a net uptake of ammonia (3 PM) (Table 3). The C:N ratio of the DOM actually used by the bacteria is unknown because the pool of DOM likely includes many compounds which differ in their biological availability to bacteria. However, the lack of net mineralization of DON to DIN by the bacteria in the Hudson water is consistent with the high C:N ratio of the bulk DOM.
The C:N ratios of DOM in the Delaware River are lower than those in the Hudson, and generally range between 5 and 12 during spring (Culberson e t al. 1987, Seitzinger & Sanders unpubl. data). Th.ere was no net production or utilization of DIN in Expt I. During Expt 11, approximately 27 % of the DON utilized in the Delaware River water was mineralized as DIN (Table 3). The results from these 2 experiments are consistent with the C:N ratio of DOM in the Delaware River and indicate that the DOM utilized had a C:N ratio similar to, or was somewhat enriched in N relative to, the bacteria.
Additional studies would be needed in order to ade- quately evaludte the rnagnitude of various sou.rces of DON (both allochthonous and autochthonous) to these rivers, including the C:N ratio of each source. How- ever, the generally lower C:N ratios of DOM in the Delaware relative to the Hudson River may reflect the numerous point sources of organic matter (e.g. sewage treatment plants in the metropolitan Philadelphia area) that discharge to the Delaware River just upstream of the salinity intrusion zone. In contrast, in the Hudson River there are not major point sources in the region near the salinity intrusion area; DOM inputs are likely dominated by runoff from agricultural and forested areas and groundwater inputs along the length of the
Hudson (Howarth et al. 1991, Clark et al. 1992). A number of factors likely constrain bacterial growth, including the C:N ratio of DOM (Vallino et al. 1996). Despite different sources of DOM to these rivers, a similar percent (approximately 40%) of the DON from both rivers was utilized within the 10 d time course of Expt 11, and accumulation of PN was similar in both the Hudson and Delaware treatments. Additional mea- surements would be needed to confirm similarities during other seasons.
In both Expts I and I1 bacterial biomass stabilized after an initlal period of rapid growth. This is a com- mon pattern in batch cultures and indicates some growth limiting factor. There were ample amounts of DIN and DIP throughout both experiments, indicating that neither N or P was limiting. We suggest that car- bon became limiting for bacterial biomass production, as the more labile carbon was utilized first, leaving the more refractory carbon. However, we cannot rule out the possibility that some micronutrient (e.g. Fe) became limiting.
Contribution of DON to estuarine eutrophication
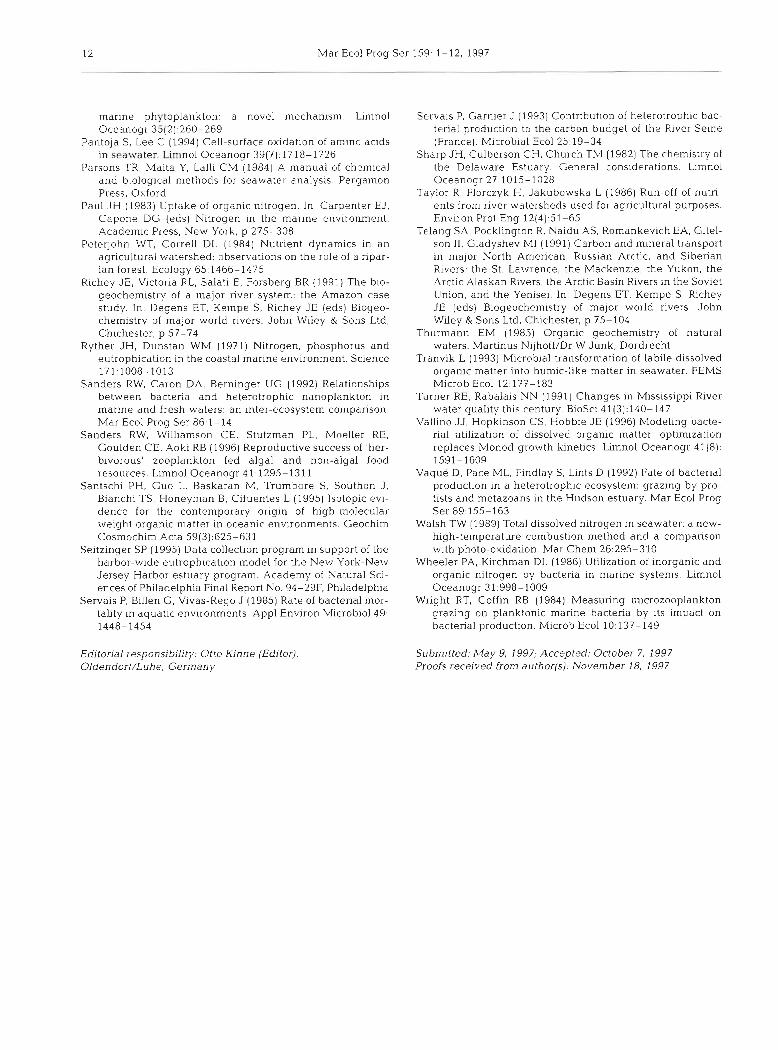
The emphasis of most studies of N loading and its effect on estuarine processes has been on inputs of DIN, but DIN accounts for only a portion of the total N inputs. Twenty to over 90% of the N inputs enter in the organic form (dissolved plus particulate), with 20 to 50% often as DON. This is illustrated by the N compo- sition of rivers which are the major conduit for N inputs to estuaries (Table 5). While riverine DOM may in- crease bacterial production in coastal waters (Chin- Leo & Benner 1992), the possible contribution of the inputs of riverine organic N to overall coastal eutroph- ication is currently unknown.
DOC mixing curves in some estuanes traditionally have been used to suggest that nver inputs of DON are refractory (Montoura & Woodward 1983, Cadee 1984). However, interpretation of the rnjxing curves is subject to consideration of all DOM sources. In addition to the external inputs from rivers, the atmosphere, point and non-point sources, DON is produced within estuanes in the sediment and by planktonic organisms (e.g. Nixon & Pllson 1983, Bronk & Glibert 1991, 1993a, Nagata & Kirchman 1991). A DON budget for Narra- gansett Bay suggests that internal production of DON (105 X 106 m01 N yr l ; calculated from data in Nixon & Pilson 1983) is of a similar magnitude to external inputs (150 X 106 m01 N yr-l; N~xon et al. 1995). If the relative magnitude of internal production and external inputs is similar for other estuaries, then DON mixing curves would show conservative behavior if all of the inter- nally produced DON was rapidly utilized (and none of
Seitzinger & Sanders: Contribution of DON to eutrophication 9
-p
Table 5. Percent composition of inorganic and organic N in various rivers
River ?G DIN % DON % PN % ON Reference
Mullica, NJ, USA 3 0 61 9 7 0 Durand (1988) Mississippi, USA 53d 4 3 Turner & Rabalais (1991) Amazon 25 29 4 6 75 Richey et al. (1991) Mackenzie, Canada 10 15 75 90 Telang e t al. (1991) Unnamed stream, NH, USA 39 51 10 6 1 Likens (1985) Blackstone, RI, USA 73 23 4 27 Nixon et al. (1995) Pocono Mountain Stream, PA, USA 4 96 Seltzinger (unpubl.data) Delaware, PA, USA 7 4 2 0 5 25 Culberson et al. (1987) Rhode, MD, USA 30 14 56 70 Peterjohn R Correll (1984) Como, CO, USA 10 90 90b Meybeck (1982) Lindaret, France 7 8 22 22b Meybeck (1982) Brevon, France 77 2 3 23' Meybeck (1982) Danube, Rumania 55 4 5 45b Meybeck (1982) Aare, Switzerland 73 27 27b Meybeck (1982) Reuss. Switzerland 56 44 44h Meybeck (1982) Rhine, Switzerland 74 26 2tjb Meybeck (1982) RhBne, Switzerland 56 44 44b Meybeck (1982) Ticino, Switzerland 57 4 3 43b Meybeck (1982) Missouri, USA 46 54 54 Meybeck (1982) Windrush, England 60 40 Heathwaite (1993) Eastern Notec, Poland 29 7 1 Taylor e t al. (1986) Wda. Poland 70 30 Taylor e t al. (1986) Kullarna. Sweden 25 75 Lepisto e t al. (1995) Dantersta, Sweden 22 7 8 Lepisto et al. (1995) Myllypuro, Finland 6 94 Lepisto et al. (1995) Pahkaoja, Finland 2 1 79 Lepisto et al. (1995)
Avg world rivers 33 67 Meybeck (1982)
'NO3+No2 only. bMinimum estimates a s based on DON only; no PN data
the externally supplied DON was used), or if the amount of external DON utilized matched (spatially and temporally) the amount of internally produced DON that accumulated.
There is evidence that both internal and external sources of DON are biologically available in estuaries. Rapid utilization of DON released by phytoplankton in estuaries has been demonstrated (Bronk & Glibert 1993b), and it is known that bacteria and some phyto- plankton can use low molecular weight DON produced in estuaries (e.g. dissolved combined and free amino acids, urea) (Paul 1983, Keil & Kirchman 1991, Middle- boe et al. 1995). Few studies have directly examined utilization of external inputs of DON to estuaries. Experiments with riverine hurnic substances suggest that estuarine bacteria may use some portion (30 to 60%) of humic N, with subsequent regeneration of DIN contributing to increased phytoplankton produc- tion (Carlsson et al. 1993, 1995). However, actual decreases in humic N or increases in PN were not quantified in those experiments. In addition to bacter- ial degradation, a portion of DON may be photochem- ically degraded to ammonia; the ammonia would then be available for bacteria or phytoplankton production.
Approximately 20% of humic N in rivers of the south- eastern U.S. may be photochemically degraded to ammonia in coastal ecosystems (Bushaw et al. 1996).
In the current study, natural assemblages of estuar- ine bacteria rapidly degraded a major portion of the total DON from 2 rivers, and mineralized or incorpo- rated it into biomass. Rates of utilization of Delaware River DON ranged from 11 to 42 % d-' during the first 4 d , and then decreased to less than 5 % d-'. Hudson River DON was utilized a t 6.5 % d-' during the first 4 d , and then decreased to less than 4 % d-'. The DON uti- lization rates may be conservative because they do not account for potential internal production of DON (i.e. release of DON by microorganisms).
There was a net utilization of between 4 0 and 72 % of the DON in Delaware River water (Expts I and 11) and 4 0 % of the DON in Hudson River water (Expt 11) within 10 to 15 d. The average freshwater residence time in New York Bay is 3 d and in Delaware Bay is approxi- mately 80 d (Sharp et al. 1982). which encompasses the range of water residence times of many estuaries (Nixon e t al. 1996). If the results of our study can be ex- trapolated to other systems, they suggest that in estuar- ies with residence times on the order of weeks to

10 Mar Ecol Prog Ser 159: 1-12, 1997
months, such as Delaware Bay, river inputs of DON are first utilized primarily within the estuary. In contrast, in estuaries with residence times of less than a week, such as New York Bay, approximately half of the biologically available DON may be utilized within the estuary, wlth the remainder exported and utilized in continental shelf waters, such as in the Hudson River plume and New York Bight. River DON-N inputs that a re incorporated into the biological cycle in estuaries, and that do not be- come subsequently denitrified or buried in the sedi- ments, are also exported to shelf ecosystems.
The fraction of DON utilized in the Delaware and Hudson river experiments is similar to the fraction of DOC utilized (23 to 42 %) in a phytoplankton bloom in the North Atlantic (Kirchman et al. 1991). However, both the rates of utilization and the fraction of the total DON utilized were greater for the Hudson and Delaware rivers than has been reported for DOC uti- lization in relatively unpolluted humic-rich blackwater rivers. For example, in a blackwater river in the south- eastern USA, 14 % of the total DOC was utilized during 3 d incubations (calculations based on data in Meyer et al. 1987). Three to 6 % of the total DOC in 2 Amazon basin rivers was utilized during 3 to 4 d incubations (calculations based on data in Amon & Benner 1994). While relative rates of utilization of N and C on DOM may differ, it is likely that the differences in the portion of DON utilized in the Hudson and Delaware Rivers rel- ative to the DOC utilized in the unpolluted blackwater rivers represent differences in overall DOM lability.
Nitrogen budgets for ecosystems are generally based on either DIN inputs (Nixon & Pilson 1983, Kempe e t al. 1991, Alexander et a1 1996) or total N inputs (Turner & Rabalais 1991, Boynton et al. 1995, Nixon et al. 1995, Michaels et al. 1996). The results of experiments presented in the current study demon- strate that DIN inputs underestimate, and TN inputs likely overestimate, the inputs of biologically available N inputs to estuaries. In order to develop a biolog~cally available N budget for an ecosystem, DIN inputs, plus that portion of the organic N (both particulate and dis- solved) that is biologically available, must be quanti- fied. The cieyree to which organic N is available, and contributes to production and eutrophication may depend on the source of the organic matter. Clearly, development of such a budget for any ecosystem will require considerably more data on the biological avail- ability of organic N sources than is currently available.
Acknowledgements. We thank the following people for assis- tance with laboratory measurements and field work- Rick Jahn, Rika Aoki-Goldsmith, Robert DeKorsey. Paul Kiry, and Gordon Lee. This work is the result of research sponsored by NOAA, Office of Sea Grant, Department of Commerce, under Grant No. NA89AA-D-SG057 (Project Nos. R/E-20 and R/E- 40); publication # NJSG-97-366.
LITERATURE CITED
Alexander RB, Murdoch PS, Smith RA (1996) Stredmflow- induced variations in nitrate flux in tnbutarles to the Atlantic coastal zone. Biogeoch~mistry 33:149-177
Alpkem (1991) 1989 RFA Methods No. A303-S1701 Rev. April 1990 for analys~s of nitnte and nitrate in seawater. Perstorp Analytical, Silver Spring, MD
Amon RMW, Benner R (1994) Rapid cycling of high-molecu- lar-weight dissolved organic matter in the ocean. Nature 369:549-552
Antia NJ, Harrison PJ, Oliveira L (1991) The role of dissolved organic nitrogen in phytoplankton nutrition, cell biology, and ecology. Phycologia 30-1-89
Berger B, Hoch B, Kavka G, Herndl GJ (1995) Bactenal metabolism in the River Danube: parameters influencing bacterial production. Freshwat Biol 34:601-616
Boynton WR, Garber JH, Summers R, Kemp WM (1995) Inputs, transformations, and transport of nitrogen and phosphorus in Chesapeake Bay and selected tributaries. Estuaries 18(1B):285-3 14
Boynton LVR, Kemp WM, Keefe CW (1982) A comparative analysis of nutrients and other factors influencing estuar- ine phytoplankton production. In Kennedy VS (ed) Estu- anne comparisons. Academlc Press, New York, p 69-90
Bratbak G (1985) Bacterial biovolume and biomass estima- tions. Appl Environ M1crobiol49.1488-1493
Bronk DA. Glibert PM (1991) A "N tracer method for the measurement of dissolved organic nitrogen release by phytoplankton. Mar Ecol Prog Ser 77:17 1-182
Bronk DA, Glibert PM (1993a) Contrasting patterns of dis- solved organic nitrogen release by two size fractions of estuarine plankton during a period of rapid NH,' con- sumption and NO; production. Mar Ecol Prog Ser 96: 291-299
Bronk DA, Glibert PM (1993b) Application of a nitrogen-15 tracer method to the study of dissolved organic nitrogen uptake during spring and summer in Chesapeake Bay. Mar Biol 115(3):501-508
Bushaw KL, Zepp RG, Tarr MA, Schulz-Jander D, Boubon- niere RA, Hodson RE, Miller WL, Bronk DA, Moran MA (1996) Photochemical release of biologically available n~trogen from aquatic dissolved organic matter Nature 381:404-401
Cadee GC (1984) Partlculate and d~ssolved organic carbon and chlorophyll A in the Zaire River, estuary and plume. Neth J Sea Res 17(2-4):426-440
Carlsson P, Graneli E, Tester P, Boni L (1995) Influences of riverine humic substances on bacteria, protozoa, phyto- plankton, and copepods in a coastal plankton community. Mar Ecol Prog Ser 127:213-221
Carlsson P, Segatto AZ, Graneli E (1993) Nitrogen bound to humic matter of terrestnal origln-a nitrogen pool for coastal phytoplankton? Mar Ecol Prog Ser 97:105-116
Caron DA, Goldman JC (1990) Protozoan nutrient regenera- tion. In: Capnulo GM (ed) Ecology of marine protozoa. Oxford University Press, New York, p 283-306
Chln-Leo G, Benner R (1992) Enhanced bact.erioplan.kton pro- duction and respiration at intermediate salinities in the Misslss~ppi h v e r plume. Mar Ecol Prog Ser 87.87-3 03
Clark JF, Simpson HJ, Bopp RF, Deck B (1992) Geochernistry and loading history of phosphate and silicate in the Hud- son estuary Estuar Coast Shelf Sci 34:213-233
Coffin RB, Sharp JH (1987) Microbial trophodynamics in the Delaware estuary. Mar EcoI Prog Ser 41.253-266
Cotner JB Jr, Gardner WS (1993) Heterotrophlc bacterial mediation of ammonium and dissolved free amino acid

Seitzinger & Sanders: Contri bution of DON to eutrophicat~on 11
fluxes ~n the Mis s i s s~pp~ River plume Mar Ecol Prog Sel 93 75-87
Culberson CH Pennock JR Lee BM1 Biggs RB Church TM Sharp J H (1987) Data from the YABLED C r u ~ s e s Septem- ber 1981-July 1984 U n ~ v Delaware Oceanographic Data Report (4) Delaware Sea Grant College Program. Newark
D E l ~ a CF Sanders JG , Boynton WR (1986) Nutnent enrich- ment studies in a coastal plaln estuary phytoplankton groivth in large-scale, continuous cultures Can J Flsh Aquat Sci 43 397-406
Ducklow HW (1982) Chesapeake Bay nutnent and plankton dynamics 1 Bactenal bloinass and production during sprlng tidal destratificatlon in the York Rivel Virginla estuary Llmnol Oceanogr 27 651-659
Ducklow HW Klrchman DL (1983) Bacterial dynamlcs and dlstnbut~on d u r ~ n g a sprlng diatom bloom In the Hudson river plume USA J Plankton Res 5 333-355
Durand JB (1988) F ~ e l d s t u d ~ e s in the Mullica River-Great Bay Estuarine system Vol 1 Data report, Rutgers University lnstitute of Manne and Coastal Sciences, New Brunswick
Findlay S, Pace hlL Lints D, Coles J J Caraco NF Pe~er ls B (1991) Weak coupling of bactenal and algal production in a heterotrophic ecosystem the Hudson R ~ v e r estuary Lim- no1 Oceanogr 36 268-278
Francisco DE Mah RA, Rabin AC (1973) Acndlne orange epi- fluorescence t echn~que for countlng bacteria Trans Am Microsc Soc 92 416-421
Fuhrman J (1990) Dissolved free amlno acid cycling in an estuanne outflo\v plume Mar Ecol Prog Ser 66 197-203
Gardner WS, Benner R, Amon RMW, Cotner JB Jr, Cavaletto J F Johnson JR (1996) Effects of high-molecular-we~ght dissolved organlc matter on nitrogen dynamics in the Mis- siss~ppi River plume Mar Ecol Prog Ser 133 287-297
Glibert PM, Garside C Fuhrman JA, Roman hlR (1991) T ~ m e - dependent coupling of inorganic and organlc nitrogen uptake and regenera t~on in the plume of the Chesapeake Bay estuary and ~ t s regulation by large heterotrophs Limnol Oceanogl 36 895-909
Goldman JC, Caron DA, Dennett MR (1987) Regulat~on of gross growth eff~ciency and ammonlum regeneration in bactena by substrate C N ratio L~mnol Oceanogr 32 1239-1252
Hagstrom A, Ammerman JW, Henrichs S, Azam F (1984) Bac- ter~oplankton growth In seawater I1 Organic matter utl- lizatlon dunng steady-state growth In seawater cultures Mar Ecol Prog Ser 18 41-48
Heathwaite AL (1993) The impact of agriculture on dissolved nitrogen and phosphorus cycling in temperate ecosys- tems Chem Ecol 8 217-231
Hobble JE Daley RJ Jaspar S (1977) Use of Nuclepore filters for countlng bacter~a by fluorescence microscopy Appl Environ Mlclob~ol 33 1225-1228
Hoch MP, h r c h m a n D (1993) Seasonal and ~nter -annual vari- abihty in bactenal product~on and biomass Mar Ecol Prog Ser 98 283-295
Howarth R (1988) Nutr~ent l~mitation of net prlinary produc- tlon in manne ecosystems Annu Rev Ecol Syst 19 89-110
Horvarth RW Fruci JR, Sherman D (1991) Inputs of sediment and carbon to an estuarine ecosystem: influence of land use. Ecol Appl 1:27-39
J ~ r g e n s e n NOG, Kroer N, Coffin RB, Yang XH, Lee C (1993) Dissolved free amino acids, combined amino acids, and DNA as sources of carbon and nitrogen to marine bacteria. Mar Ecol Prog Ser 98:135-148
Keil RG, Klrchman DL (1991) Contribution of dissolved free amlno acids and ammonlum to the n~ t rogen requirements of heterotrophic bacterioplankton. Mar Ecol Prog Ser
73(1):1-10 Kempe S, Pettine M, Cauwet G (1991) Biogeochemistry of
European rivers. In Degens ET, Kempe S, Richey JE (eds) Blogeochem~stry of major world rivers. John Wiley & Sons Ltd, Chichestel-, p 169-211
Kester DR, Duedall IW. Connors DN, Pytkowlcz RM (1967) Preparation of art~ficlal seawater. Limnol Oceanogr 12. 176-178
Klrchman D, Soto Y, Van Wambeck F, Bianchi M (1989) Bac- terial production in the Rhone River plume: effect of mix- lng on relationsh~ps among microbial assemblages. Mar Ecol Prog Ser 53 267-275
Kirchman DL, Suzuki Y, Garslde C , Ducklow HW (1991) High turnover rates of dissolved organic carbon dunng a spring phytoplankton bloom Nature 352.612-614
Lee S , Fuhrman JA (1987) Relationships between biovolume and b~omass of naturally denved marine bacterioplank- ton. Appl Env~ron Microb~ol 53.1298-1303
Lep~sto A, Andersson L, Arheimer B, Sundblad K (1995) Influ- ence of catchment character~stics, forestry activities and deposition on nitrogen export from small forested catch- ments. Water Air Soil Pollut 84.81-102
Likens GE (1985) An ecosystem approach to aquatic ecology. Springer-Verlag, New York
Mantoura RFC, Woodward EMS (1983) Conservative behav- ior of nverine dissolved organic carbon in the Severn estu- ary: chemical and geochemlcal implications. Geochim Cosmochim Acta 47.1293-1309
Meybeck M (1982) Carbon, nitrogen, and phosphorus trans- port by world rivers. Am J Sci 282:401-450
Meyer JL, Edlvards RT, Risley R (1987) Bacterial growth on dissolved organic carbon from a blackwater river Micro- b ~ a l Ecol 13:13-29
Michaels AF, Olson D, Sa rm~en to JL, Ammerman JW, Fan- nlng K, Jahnke R, Knap AH, L~pschultz F, Prospero J M (1996) Inputs, losses and transformations of nitrogen and phosphorus in the pelagic North Atlantic Ocean. B~ogeo- chemistry 35.181-226
Middelboe M, Borch NH, l r c h m a n DL (1995) Bacterial uti- lizabon of dissolved free amino a c ~ d s , dissolved comblned amlno acids and animonium in the Delaware Bay estuary: effects of carbon and nitrogen limitation Mar Ecol Prog Ser 128:109-120
Nagata T, l r c h m a n DL (1991) Release of dissolved free and combined amino acids by bacterivorous marine flagel- lates. Limnol Oceanogr 36:433-443
Nixon SW, Ammerlnan J , Atkinson L, Berounsky V, Billen G, Bo~court W, Boynton W, Church T, DiToro D, Elmgren R, Garber J , Giblin A, J ahnke R, Owens N, Pilson MEQ, Se~tz lnger S (1996) The fate of nitrogen and phosphorus at the land-sea margln of the North Atlantic Ocean. Biogeo- chemistry 35:141-180
Nixon SW, Granger SL, Nowicki BL (1995) An assessment of the annual mass balance of carbon, nitrogen, and phos- phorus in Narragansett Bay. Biogeochemistry 31:15-61
N ~ x o n SW, Pllson MEQ (1983) Nitrogen in estuarine and coastal marine ecosystems. In. Carpenter EJ, Capone DG (eds) Nitrogen in the manne env~ronnlent . Academic Press, New York, p 565-648
Oviatt C , Doenng P, Noivick~ B, Reed L, Cole J , Fnthsen J (1995) An ecosystem level experiment on nutrient llnuta- tion in temperate coastal marine environments. Mar Ecol Prog Ser 116.171-179
Paerl HW (1991) Ecophysiological and trophic ~mplications of Light-st~mulated amlno a c ~ d utilization in manne pico- plankton. Appl Environ Microb10157:473-479
Palenik B, More1 FMM (1990) Amino acid utilization by
12 Mar Ecol Prog Ser 159: 1-12, 1997
manne phytoplankton: a novel mechanjsm. Limnol Oceanogr 35(2).260-269
Pantoja S, Lee C (1994) Cell-surface oxidation of amlno a c ~ d s in sedwater. Limnol Oceanogr 39(7):1718-1726
Parsons TR, Maita Y, Lalli CM (1984) A manual of chemical and biological methods for seawater analysis. Pergamon Press, Oxford
Paul JH (1983) Uptake of organlc nitrogen. In. Carpenter EJ, Capone DG (eds) Nitrogen in the marine environment. Academic Press, New York, p 275-308
Petejohn WT, Correll DL (1984) Nutrient dynamics in a n agricultural watershed: observations on the role of a ripar- ian forest. Ecology 65:1466-1475
Richey JE, Victoria RL, Salati E, Forsberg BR (1991) The blo- geochemistry of a major river system: the Amazon case study. In: Degens ET, Kempe S, Richey JE (eds) Biogeo- chemistry of major world rivers. John Wiley & Sons Ltd, Chichester, p 57-74
Ryther JH, Dunstan WM (1971) Nitrogen, phosphorus and eutrophication in the coastal marine environment. Science 171:1008-1013
Sanders RW, Caron DA, Berninger UG (1992) Relationships between bactena and heterotrophic nanoplankton in marine and fresh waters: an ~nter-ecosystem companson Mar Ecol Prog Ser 86: 1- 14
Sanders RW, Williamson CE. Stutzman PL, Moeller RE. Goulden CE. Aoki RB (1996) Reproductive success of 'her- bivorous' zooplankton fed algal and non-algal food resources. L~mnol Oceanogr 4 1:1295-1311
Santschi PH, Guo L, Baskaran M, Trumbore S, Southon J , Bianchi TS, Honeyman B, Cifuentes L (1995) Isotopic evi- dence for the contemporary origin of high-molecular weight organic matter in oceanic environments. Geochim Cosmochim Acta 59(3):625-631
Seltzinger SP (1995) Data collection program In support of the harbor-wide eutrophication model for the New York-New Jersey Harbor estuary program. Academy of Natural Sci- ences of Philadelphia Final Report No. 94-29F, Philadelphia
Servais P, Billen G , Vivas-Rego J (1985) Rate of bacterial mor- tality in aquatic environments Appl Environ Microb~ol 49 1448-1454
Editorial ~.esponsibility: Otto Kinne (Editor), Oldendorf/Luhe. Germany
Servais P. Garnier J (1993) Contribution of heterotrophic bac- terial production to the carbon budget of the River Seine (France). Microbial Ecol 25:19-34
Sharp JH, Culberson CH, Church TM (1982) The chemistry of the Delaware Estuary. General considerations. Limnol Oceanogr 27: 1015-1028
Taylor R, Florczyk H, Jakubowska L (1986) Run-off of nutri- ents from river watersheds used for agricultural purposes. Env~ron Prot Eng 12(4):51-65
Telang SA, Pocklington R, Naidu AS. Romankevich EA, Gitel- son 11. Gladyshev M1 (1991) Carbon and mineral transport in major North American, Russian Arctic, and Siberian Rivers: the St Lawrence, the Mackenzie, the Yukon, the Arctic Alaskan Rlvers, the Arctlc Basin Rivers In the Soviet Unlon, and the Yenisei. In: Degens ET, Kempe S, Richey JE (eds) Biogeochemistry of major world rivers. John Wiley & Sons Ltd. Chichester, p 75-104
Thurmann EM (1985) Organlc geochemistry of naturaI waters. Martinus N~jhoff/Dr W Junk, Dordrecht
Tranvik L (1993) Microbial transformation of lablle dissolved organic matter into humic-like matter in seawater. FEMS Microb Ecol 12:177-183
Turner RE, Rabalais NN (1991) Changes in Mississippi River water quality this century. BioScl 41(3):140-147
Vall~no JJ, Hopkinson CS, Hobble JE (1996) Modeling bacte- rial utilization of dissolved organic matter: optimization replaces Monod growth kinetics. Limnol Oceanogr 41(8): 1591-1609
Vaque D , Pace ML, Findlay S, Lints D (1992) Fate of bactenal production in a heterotrophic ecosystem, grazing by pro- tists and metazoans in the Hudson estuary. Mar Ecol Prog Ser 89:155-163
Walsh TW (1989) Total dissolved nitrogen in seawater: a new- hlgh-temperature combustion method and a companson with photo-oxidation. Mar Chem 26:295-310
Wheeler PA, Kirchman DL (1986) Utilization of inorganic and organic nitrogen by bacteria in marine systems. Limnol Oceanogr 3 1:998-1009
Wright RT, Coffin RB (1984) Measuring microzooplankton grazing on planktonic marine bacteria by its impact on bacterial production. Microb Ecol 10:137- 149
Submitted: May 9, 1997; Accepted: October 7, 1997 Proofs received from author(s): November 18, 1997