contributing to poverty alleviation through regional ... · 2 abstract the present report is a...
TRANSCRIPT

Contributing to poverty Alleviation through Regional Energy Planning
in Indonesia CAREPI
PROJECT SUMMARY
January 2010

2
Abstract
The present report is a summary of the activities undertaken by the COOPENER project ‘Con-tributing to poverty Alleviation through Regional Energy Planning in Indonesia (CAREPI)’. The CAREPI project was implemented in Indonesia and ran from 1 January 2007 to 1 Novem-ber 2009. The CAREPI project has been implemented by the Energy research Centre of the Netherlands (ECN) together with Deutsche Gesellschaft fur Technische Zusammenarbeit (GTZ) GmbH, Germany, Entec Consultancy & Engineering, Switzerland, and five organisations from Indonesia: Data and Information Centre of the Ministry of Energy and Mineral Resources (DICEMR), Institute for Research and Community Empowerment of the Institute of Technology of Bandung (ITB), Center for Regional Energy Management (PUSPER) of the Muhammadiyah University of Yogyakarta, Electric Engineering Department, University of Sumatra Utara and the University of Mataram. The project is registered under ECN project number 77804. The main objectives of CAREPI were to develop and strengthen institutional and human capac-ity in the regions North Sumatra, Yogyakarta, Central Java and West Nusa Tenggara for con-ducting energy policy analysis and providing improved energy services. The CAREPI project was supported by the Intelligent Energy Europe programme of the Euro-pean Commission and received co-funding from NL Agency.
Disclaimer
The sole responsibility for the content of this report lies with the authors. It does not necessarily reflect the opinion of the European Communities. The European Commission is not responsible for any use that may be made of the information contained therein.

3
Contents Abstract 2 Disclaimer 2 List of tables 4 List of figures 4 1. Introduction 5
1.1 Background 5 1.2 Objectives 6 1.3 Project Methodology 6 1.4 Target regions 9 1.5 Project Partners 11 1.6 Project Achievements 11
2. Development of regional energy profile 12 2.1 Introduction 12 2.2 Macro-economic background 12 2.3 Final energy consumption 13 2.4 Electricity supply 15
3. Regional energy outlook H 16 3.1 The National Energy Policy 16 3.2 Results 19
3.2.1 North Sumatra 19 3.2.2 Central Java 20 3.2.3 Yogyakarta 22
3.3 West Nusa Tenggara 23 4. Pro-poor energy strategies 26
4.1 Introduction 26 4.2 Approach 26 4.3 Selected target locations 26 4.4 Identified energy-related problems 27 4.5 Proposed pro-poor energy strategy 27
5. Development of micro-hydro scheme 29 5.1 Introduction 29 5.2 Selection of the sites 29
5.2.1 North Sumatera 30 5.2.2 Yogyakarta 31 5.2.3 Central Java 32 5.2.4 West Nusa Tenggara 32
5.3 Training 33 5.3.1 North Sumatra / Universitas Sumatra Utara 33 5.3.2 Yogyakarta / Universitas Muhammadiyah 34 5.3.3 Central Java / Universitas Diponegoro 34 5.3.4 West Nusa Tenggara / Universitas Mataram 34
5.4 Preparation of feasibility studies 34 5.5 Follow-up/Development of the sites 35
5.5.1 North Sumatera 35 5.5.2 Yogyakarta 35 5.5.3 Central Java 36 5.5.4 West Nusa Tenggara 36
6. Conclusions 38

4
List of tables
Table 2.1 Marco-economic indicators CAREPI regions 12 Table 2.2 Transport intensities 15 Table 2.3 Electric power indicators 15 Table 3.1 Percentage of Bio-diesel target 17 Table 3.2 Percentage of Bio-ethanol target 17 Table 3.3 Percentage of Crude Vegetable Oil target 17 Table 3.4 Overview of assumptions per region 18 Table 5.1 Site proposal for MPH development in North Sumatera 30 Table 5.2 Main characteristics of the Borus mini hydro site in Tanjung Merawa village 30 Table 5.3 Promising MHP sites in Yogyakarta 31 Table 5.4 Characteristics of the Banjarnegara site in Java 32 Table 5.5 Characteristics of two more locations in Central Java 32 Table 5.6 Characteristics of four locations in West Nusa Tenggara 32 Table 5.7 The main findings of the feasibility studies for the four selected sites 35
List of figures
Figure 1.1 Schematic representation of the CAREPI methodology 7 Figure 1.2 Target regions of the CAREPI project in Indonesia 9 Figure 2.1 Poverty and energy indicators 13 Figure 2.2 GRDP distribution across sectors 13 Figure 2.3 Final energy across sectors 14 Figure 2.4 Final energy across fuels 14 Figure 3.1 National energy mix target 16 Figure 3.2 Example of fuel intensity change sin KEN (SumUt) 18 Figure 3.3 Final energy consumption for North Sumatra 19 Figure 3.4 Primary energy mix 20 Figure 3.5 Final energy consumption for Central Java 21 Figure 3.6 Primary energy mix 21 Figure 3.7 Final energy consumption for Yogyakarta 22 Figure 3.8 Primary energy mix 23 Figure 3.9 Final energy consumption for Yogyakarta 24 Figure 3.10 Primary energy mix 25 Figure 5.1 Left: The front view of MHP site of Banjar Arum. Right: The back/top view of
MHP site of Banjar Arum 31 Figure 5.2 Left: The previous MHP scheme was integrated into the Teres Genit irrigation
system, which was constructed in 1994. Right: The majority of the civil structure was still in good condition and could be put back into operation for the MHP relatively easily 33

5
1. Introduction
1.1 Background During the period 1987-1997 Indonesia experienced high economic growth rates of on average almost 7 per cent per annum. However, the East Asian economic and financial crises that started at the end of 1997 severely affected Indonesia and resulted in a drop of the value of the rupiah by some 80 per cent and a decrease of Indonesia’s GDP by more than 13 per cent in 1998. The steeply rising prices for food triggered a mass popular uprising in Jakarta and other regions in Indonesia that eventually led to the resignation of President Suharto in mid 1998. Since then In-donesia has embarked on a process of social, political and economic reforms that are still ongo-ing and that are meant to bring about economic growth and a transition to democracy. During the early 2000s the Indonesian economy started to slowly recover from the recession: GDP grew by, on average, 4.8 per cent per annum during the period 2000-2006. A key component of the political reforms is the decentralisation and regional autonomy that were implemented in 2001 based on the new Law no.22, which was amended in 2004: Law no.32. This law has devolved almost all powers and responsibilities from the central govern-ment to the local government (except for sectors such as defence, foreign policies, justice and monetary policy), including responsibilities for energy sector development. This means that re-gional governments are now responsible for formulating their energy policy and, consequently, must reform their institutional structure and strengthen their human capacity to be able to carry out this new responsibility. The new energy-related responsibilities for the regional government are also clearly expressed in the new Energy Law (Law no. 30/2007) that came into effect in August 2007. The new law stipulates that the local government will formulate their regional energy master plan, based on the national energy master plan, and develop regional regulation for the implementation of the plan. The new Energy Law also stipulates the establishment of the National Energy Council, which will be responsible for the development of the national energy master plan, involving the participation of regional and local governments. The new Electricity Law (Law No. 30 2009) states that the regional government is responsible for formulating electricity planning, including determining the regional electricity tariff in line with guidelines set by the national government, and issuing of permits to private investors. The decentralisation process, however, appears to be a difficult and time-consuming process. The regional political institutions are weak and poorly organised, because they have been left out of the political decision-making process for the last three decades. Many regions also lack sufficient technical and analytical capacity to conduct energy policy analysis and develop en-ergy supply projects. This is seriously hampering the regional energy sector development and is further compounded by the current energy crises in Indonesia caused by the high world crude oil prices, insufficient investments in expansion of supply capacity over the past 10 years and regulated energy prices. As a result, regions are now experiencing power interruptions and load shedding and find it increasingly difficult to meet the growing energy demand. Regions are very well aware of the importance of a sufficient and reliable energy supply for re-gional economic development in general and the alleviation of poverty in particular. Therefore, regions have requested the central government for assistance in formulating and implementing their energy policies. The Contributing to poverty Alleviation through Regional Energy Plan-ning in Indonesia (CAREPI) project aimed to provide this assistance through developing institu-tional and human capacity that will enable the regions to develop sound energy policies and im-plement sustainable energy projects.
6
1.2 Objectives The overall goal of the CAREPI project was to develop institutional and technical capacity in three selected regions in Indonesia (West Nusa Tenggara, Central Java/Yogyakarta and North Sumatra) for conducting energy policy analysis and providing improved energy services to poor communities, in order to alleviate poverty and contribute to sustainable development. This re-quired the establishment and strengthening of an institutional framework in the regions for en-ergy policy formulation and building capacity in the regions to conduct regional energy plan-ning analysis. It required a good understanding of the regional energy situation and of the needs and priorities of poor communities and the identification of best practice solutions that address these needs, so that people in low income areas gain access to an improved choice of affordable, efficient and acceptable energy services. The short-term goals of the CAREPI project were to: • Support the establishment and strengthening of the regional energy forums and regional
technical teams in the selected regions. • Understand the regional energy situation and needs and energy priorities within the poorer
communities in the selected regions . • Identify best practices for energy service provision that address the energy needs. • Build institutional and technical capacity in the regions for energy policy formulation and
analysis. • Strengthen the communication between the network of regional stakeholders. • Facilitate the private sector in developing projects for energy service provision. • Disseminate the CAREPI results to other regions in Indonesia and to other countries in South
East Asia. In order to achieve the above goals substantial capacity has been developed in the regions and extensive consultation with all stakeholders in the region has been taken place. The expected longer-term goals of CAREPI are: • An effective regional technical and institutional set up for energy policy formulation. • The effective integration of energy and poverty aspects into the regional energy planning
framework. • Increased availability and affordability of energy services, especially for rural and where
suitable also urban poor communities. • Business development in these poorer communities using secure energy supplies. • Widespread introduction of best energy practices (technology and/or institutional arrange-
ments) to address the needs of poor communities in Indonesia.
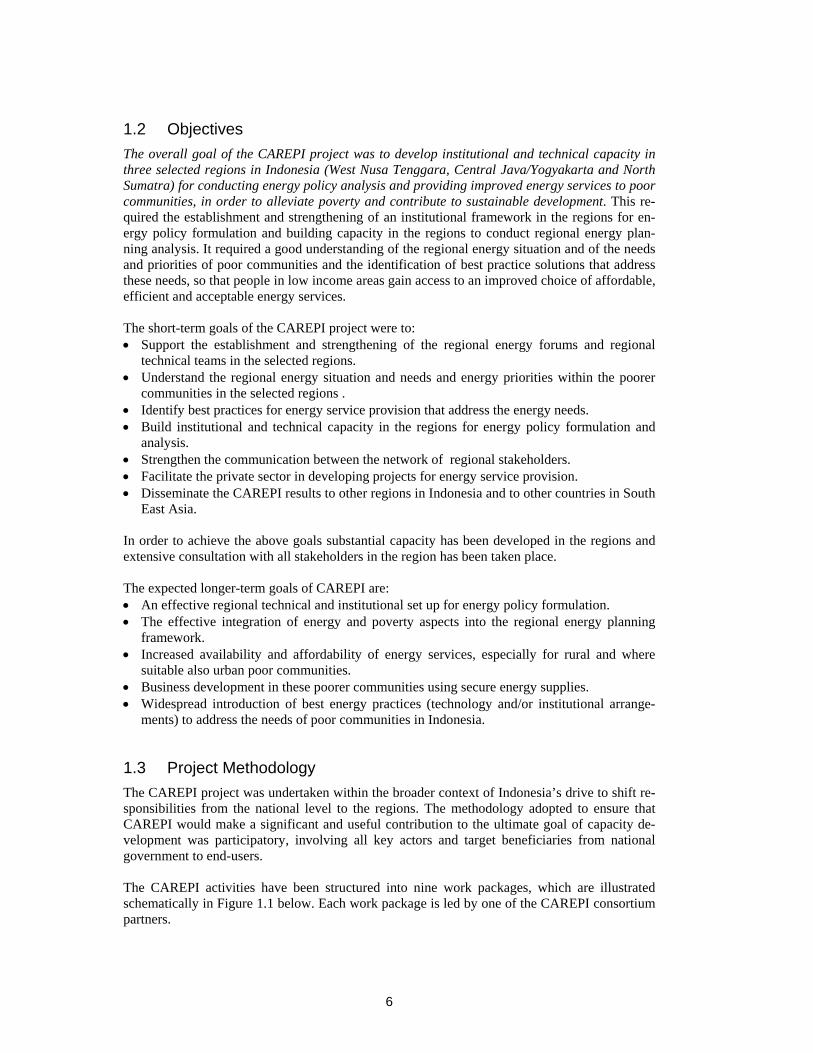
1.3 Project Methodology The CAREPI project was undertaken within the broader context of Indonesia’s drive to shift re-sponsibilities from the national level to the regions. The methodology adopted to ensure that CAREPI would make a significant and useful contribution to the ultimate goal of capacity de-velopment was participatory, involving all key actors and target beneficiaries from national government to end-users. The CAREPI activities have been structured into nine work packages, which are illustrated schematically in Figure 1.1 below. Each work package is led by one of the CAREPI consortium partners.

7
Establishment and Trainingof Regional Technical Team
Institutional strengthening Regional Energy Forum
Identification of energy-related needs and
priorities of poor communities
Regional Energy Outlook
Facilitation ofAccess to
Energy Services
CAPACITY
DEVELOPMENT
General Project Management
Communication & Dissemination
Common Dissemination Activities
WP 1
WP 5
WP 6
WP 4
WP 3
WP 2
WP 7
WP 8
WP 9
Figure 1.1 Schematic representation of the CAREPI methodology
WP1: General Project Management: to accomplish efficient management and implementation of the project in a timely and efficient manner, including financial planning, human resources management within the project team, guidance to the other project partners, communications with the COOPENER programme and liaison with the Advisory Committee. WP 2: Identification of energy-related needs and priorities of poor communities aims to under-stand the energy needs and energy priorities of poor communities in the targeted regions. This is important for enabling the project team to respond to real demands and formulate concrete ac-tivities that improve the access to affordable, clean and reliable forms of energy for the poor. The concept of energy-related needs will be interpreted broadly in the project. The work in this WP will attempt to address both the qualitative aspects of the actual and potential fuel uses, the need for advise on energy efficiency and savings and the potential productive uses of energy, as well as the more quantitative aspects of energy demand related purchasing power and willing-ness to pay for energy services. The energy-related needs will be assessed in a variety of ways: • existing knowledge of local partners, • existing statistical surveys, • specific community surveys conducted by CAREPI, • participatory workshops with local stakeholders and communities, • targeted information collection. The regionally prioritised energy problems are likely to fall within the broad area of affordable, safer, more efficient and cleaner energy use. This WP also aims to identify a range of best prac-tices for energy service provision in order to achieve a better match between energy-related de-mand in the poor communities and possible solutions (VKA11). The best practices will be tar-geted where there are significant opportunities to improve on present practices. The results of WP2 serve to be able to better incorporate energy services-poverty issues into the regional en-

8
ergy plan (blueprint). The results also directly feed into WP 7 and are used for identifying and developing concrete projects that can meet the needs of the poor communities. WP 3: Development of regional technical team involves the identification, establishment, train-ing and institutionalisation of a team in the region that is able to maintain an energy database, to conduct integrated energy planning analysis and to provide the energy forum with quantitative information required for formulating a sound regional strategy for the whole energy sector and a detailed action plan for improving the access to energy services for reduction of poverty. The technical teams have not yet been established formally but during the visits of DICEMR and ECN to the regions in January 2006, first discussions have been held with potential mem-bers for these teams and it is expected that during the inception phase of the project the techni-cal teams in the selected regions can be formally established. Training activities to build capacity on all aspects of energy planning are required for the newly established teams. This includes aspects related to energy data collection, development of an energy-economy modelling tool, design of reference and alternative energy scenarios, analysis of the scenario results, and formulating energy strategies for the region. Particular emphasis will lie on integrating energy-poverty issues into the broader energy planning framework. To ensure the sustainability of the institutional set up for regional energy planning, a special ac-tivity is foreseen as part of the project that aims to institutionalise the technical team. This means that the regional government (in particular the regional Mines and Energy office) recog-nizes that the team is part of the energy policy formulation process and ensures the inclusion of the financing of the team in the regular budget lines of the regional government. WP 4: Institutional Strengthening of the regional energy forum is aimed at the establishment, if needed, and strengthening of the regional energy forums. This requires the identification of relevant stakeholders in the region, facilitating the communication and information exchange between these stakeholders, creating awareness of the current energy problems, formulating the medium term and long term objectives of the energy sector and developing a regional energy strategy that meets these objectives. The strengthening of the forum is achieved by bringing together the identified stakeholders, pre-senting the current energy situation in the region and discussing the objectives for the regional energy plans and options for addressing the energy problems. Input from the technical team at this stage is of particular importance and therefore WP 4 will begin only after the technical team has been duly established and trained. It is envisaged that several workshops on specific topics will be held for the energy forums to train the members on energy sector development and implementation aspects. WP 5: Capacity Development incorporates the needs that arise in several work packages for ca-pacity building, skills development and knowledge transfer. The outcome of this WP includes strengthened capacity among end-users, energy forums, technical teams, local entrepreneurs and decision makers. However, the focus of the work will be to support and enable WP 3, the estab-lishment of the regional technical teams. WP 6: Regional Energy Outlook and Pro-poor Energy Strategy aims to present the regional ob-jectives for energy plan development, the identified problems and the strategies for addressing these problems. In WP 6 several scenarios for future development of the regional energy sector - as outcomes of WP 3 - will be discussed by the forum members and evaluated based on social, economic, and environmental aspects. Based on these discussions and scenario revisions, which will lead to an iterative and interactive process between the regional technical team and the re-gional energy forum, a regional energy outlook for 2025 will be developed. The outlook for the

9
energy sector as a whole will provide the general framework for developing a regional pro-poor energy strategy. WP 7: Facilitation of Access to Energy Services: will continue from the regional energy outlook and the needs and priorities of poor communities and energy best practices identified in WP 2. This WP aims to realise improved access to affordable, clean and reliable energy services by facilitating local energy businesses to develop energy supply/efficiency projects that are attrac-tive for private investors and funding agencies such as KfW, the World Bank, the Asian Devel-opment Bank or the ‘Energising Development’ programme as Dutch-German partnership on ac-cess to energy. WP 8 Communication & Dissemination addresses the need for ongoing dissemination of results throughout the duration of the project, as well as the need for effective communication between all key market actors involved or associated with the work. The work involves the creation of a project website and the organisation and implementation of an international workshop on the integration of energy & poverty issue into regional energy planning which will be organised in Jakarta with the aim to bring together stakeholders from Indonesia as well as other countries in the South East Asian region to discuss the experiences and to explore the dissemination of the results to other countries. To further enhance the dissemination of the results, all project reports, except the 6-monthly project progress reports, will be produced in both languages Bahasa Indo-nesia and in English. WP 9 Common Dissemination Activities aims to contribute, upon request by the European Commission, to common dissemination activities in order to increase synergies amongst the COOPENER projects and visibility of the project results.
1.4 Target regions The CAREPI project focused on four regions: North Sumatra, Yogyakarta, Central Java and West Nusa Tenggara. These regions were selected by the Ministry of Energy and Mineral Re-sources based on the identified need for assistance in the region. A brief profile of each region is presented below.
North Sumatra
West Nusa TenggaraYogyakarta /Central Java
Figure 1.2 Target regions of the CAREPI project in Indonesia
West Nusa Tenggara Province comprises the islands of Lombok and Sumbawa and is a rural region with approximately 4.2 million inhabitants of whom some 17% have an income below the poverty line. Total primary energy supply in 2005 amounted to some 6 million BOE, of which approximately 95% was imported. Coal constituted the largest share (36%), followed by diesel oil (26%) and petrol (18%). More than 2 million people do not have access to electricity despite the fact that there are large local (renewable) energy resources. The energy forum was

10
established following an electricity crisis and consists of representatives from the government, industry and public society. The technical team has also been established and is led by the Uni-versity of Mataram. The Central Java Province consists of 35 regencies/cities with approximately 33 million inhabi-tants, of whom some 21% have an income below the poverty line. The total energy supply in 2005 amounted to 57 million BOE, made up of crude oil (82%), coal (5%), wood (7%), hydro-power and geothermal energy. The region is a net exporter of refined oil products. This region has an electrification ratio of only 61% despite the fact that there are large local (renewable) en-ergy resources. The energy forum and technical team have been established and have met sev-eral times during the past years. Diponegoro University in Semarang is coordinating the techni-cal team in this province. There are roughly 12.3 million people in the North Sumatra Province, which is mainly a rural area, except for the city of Medan (population approx. 5 million). Some 500,000 people live un-der the poverty line and do not have access to electricity. Approximately 86% of the villages are connected to the grid; the household electrification ratio is 72.7%. Sumatera Utara has an impor-tant role in the development of oil palm (15.7% or 1,023,350 ha). With its contribution in area equal to 15.7%, the contribution of crude palm oil (CPO) is 21.3%. Private plantation amounts to 377,336.70 ha, and community plantation equals 367,741.02 ha; 278,272.28 ha is the prop-erty of PT. Perkebunan Nusantara. The production of biodiesel at this moment is 10 tons per day, with 8 tons/day coming from PT. Pertamina Energy & PT. Perkebunan Nusantara 4, and 2 tons/day coming from private companies. The other renewable energy sources in North Sumatra are geothermal, mini hydro and large-scale hydropower. Total primary energy supply in 2005 was 33 million BOE. Fuel oil constitutes some 11%, diesel oil 39% and petrol 17%. During the past years several initiatives have been taken to formally establish the regional energy forum, but so far the regional government has been reluctant to give its approval. The regional technical team was established in 2007 and is led by the Univer-sity of Sumatera Utara. The Special Region of Yogyakarta (Daerah Istimewa Yogyakarta; DIY) Province (which is also known as Yogyakarta) is located in south-central Java. It is surrounded by the province of Cen-tral Java (Jawa Tengah) and bordered by the Indian Ocean to the south. The estimated popula-tion of DIY in 2005 was 3,281,800 people and 1,018,061 households. The province of Yogya-karta has a total area of 3,186 km2. Administratively, Yogyakarta is divided into four regencies (kabupaten) and one municipality (kotamadya), namely Kulon Progo, Bantul, Gunung Kidul and Sleman regency and Yogyakarta municipality. Yogyakarta has a per capita gross regional domestic product (GRDP) of about 7.7 million IDR (Indonesian rupiah). The economic growth of Yogyakarta is mainly a result of the growth of the commercial services (e.g. tourism) sector (23.2%), agriculture (18.8%) and manufacturing (14.6%). The energy consumption of Yogya-karta consists dominantly of oil fuel (3.8 million BOE); the electricity and the LPG consump-tion are estimated at about 0.90 and 0.4 million BOE, respectively. Referring to energy con-sumption by sector, the transportation sector (2.7 million BOE) is still the main consumer; it is followed by households (1.6 million BOE), the commercial sector (0.3 million BOE), industry (0.3 million BOE) and other sectors (0.1 million BOE). The elasticity of energy use of Yogya-karta for 2005 is estimated at 1.5, with the intensity of energy approximately 0.28 BOE per mil-lion IDR and final energy consumption per capita of around 1.5 BOE/capita/year. Average elec-tricity use per capita per year is estimated at about 408.4 kWh. The number of villages con-nected to the utility grid (PLN) is high (electrified village ratio of 100%), while the household electrification ratio is around 74.8%. Yogyakarta has large potential sources of renewable en-ergy, namely biomass and biofuel. The energy forum of Yogyakarta was established in 2007 and consists of representatives from the government, industry and society. The technical team has been established and is led by PUSPER, the Muhammadiyah University of Yogyakarta.

11
1.5 Project Partners The project consortium consisted of two EU members and five Indonesian partners experts allo-cated to the CAREPI project who were very familiar to each other, having widespread and com-plementary experience in developing countries. Together, the members of this consortium had a good understanding of the needs of all stakeholders in this project. The CAREPI project team comprised: ECN Policy Studies - Netherlands Energy research Centre of the
Netherlands, www.ecn.nl Deutsche Gesellschaft fur Technische Zusammnearbeit(GTZ) - Germany
www.gtz.de
Data and Information Centre for Energy and Mineral Resources of the Ministry of Energy and Mineral Resources, DICEMR
http://www.esdm.go.id/index.html
Institute Technology Bandung ITB http://www.itb.ac.id/en/ Center for Regional Energy Management (PUSPER) of the Muhammadiyah University of Yogyakarta
http://www2.umy.ac.id/
Electric Engineering department, University of Sumatra Utara (EED-USU)
http://www.usu.ac.id/index.php?lang=en
University of Mataram http://unram.ac.id/web3/
1.6 Project Achievements The main achievements of the CAREPI project were: • The institutional set up, comprising the regional technical team and the regional energy fo-
rum, was established in all regions except in North Sumatra. This is an important achieve-ment, because it means that the regional teams have become part of the annual regional planning and budgeting cycles and thus gradually become less dependent on donor funding.
• A regional energy profile for the year 2005 has been produced for all regions and was pre-sented at the national seminar on regional energy planning held in August 2008 in Jakarta. Based on this profile the regional teams have produced a regional energy outlook for the year 2025 comprising a national (KEN) and a regional (KED) energy policy scenario.
• A micro-hydro scheme, which provides electricity to some 250 households in the nearby vil-lages, has been developed in West Nusa Tenggara and is now up-and-running. In Central Java and Yogyakarta feasibility studies have been completed and investors for the construc-tion identified and it is expected that construction can start in 2010.
• The teams have each selected a poor community in their region and have developed an en-ergy strategy that addresses the energy-related needs and priorities of this community. Al-though the limited budget only allowed for the analysis of one community, this exercise has contributed considerably to a better understanding of the specific needs of energy-poor communities and thus improved the ability to formulate pro poor energy policies.

12
2. Development of regional energy profile
2.1 Introduction One of the first activities of the regional teams, once the regional technical teams were set up, was to investigate and determine the region’s current energy situation. This energy situation of course does not stand by itself; it is a consequence of the regions’ economic and social structure and activity. The combined socio-economic and energy information has been compiled in the regional energy profile of each region. These profiles are described in more detail in the re-gional report, produced as deliverable D8.
2.2 Macro-economic background From these profiles, it became clear that within Indonesia’s province, large difference do exist. The four regions covered by CAREPI show this in their own particular situation. The table be-low shows the major parameters to start any profile with, namely population and Gross Re-gional Domestic Product GRDP. Out of Indonesia’s 230 million inhabitants, CAREPI’s regions combined cover about 23%; their GRDP amounts to 14% of the national GDP.
Table 2.1 Marco-economic indicators CAREPI regions Population GRDP GRDP area Population
density Household
size [capita] [mln Rpa] [mln €] [km2] [person/km2] [persons] Central Java 32,910,000 133,631,138 9216 32544 1011 3.85 North Sumatra 12,326,678 87,897,791 6062 71681 172 4.54 Yogyakarta 3,281,800 16,910,877 1166 3186 1030 3.22 West Nusa Tenggara 3,755,425 15,328,935 1057 17100 244 3.70 As can be noticed from Table 2.1, CAREPI covers a heterogeneous set of regions: Central Java being the largest, followed by North Sumatra, but the population density is quite different; Cen-tral Java is on the densely populated Java Island. Yogyakarta is a special province, being more a city state, surrounded by Central Java and without any own resources or energy production. Yogyakarta is also known as the University City with more than 50 universities, both public and private. West Nusa Tenggara is one of the poorest provinces in Indonesia with a low density and rural population. As for household size; all provinces are seeing numbers above 3 persons, North Sumatra even 4.5 on average. CAREPI’s focus on energy and poverty alleviation is illustrated in the figure below, showing the share of people living under 1.5 times the regional poverty line (in the order of € 15 per cap-ita per month) as well as those actually living below that line. Compared to the Indonesian aver-age of 16% poor people, Yogya is the only one of all 4 regions that stays below. The share of people living below 1.5 times the poverty line has been added to illustrate that a modest increase of the income division line doubles the amount of people affected by poverty, roughly living be-low 1 to 1,5 US$ per day.

13
0%
10%
20%
30%
40%
50%
60%
70%
80%
90%
100%
1.5 poverty poverty urbanisation GRDP/capita FE/capita
%
0
1
2
3
4
5
6
7
Mill
ion
Rpa
/cap
ita
B
OE/
capi
ta
Central JavaNorth SumatraYogyakartaWest Nusa Tenggara
Figure 2.1 Poverty and energy indicators
North Sumatra has the highest economic activity per capita (expressed in GRDP/capita) as well as the highest energy consumption per person; WNT, in turn, has the lowest activity in both. Looking at the distribution of GRDP per sector, there is no clear explanation why North Suma-tra has the highest specific GRDP; WNT, which has a very large mining company (Newmont - coal) on Sumbawa island, shows different shares than the other regions.
0%
10%
20%
30%
40%
50%
60%
70%
80%
90%
100%
Central Java North Sumatra Yogyakarta West Nusa Tenggara
constructionminingagriculturecommercial and servicesindustry
Figure 2.2 GRDP distribution across sectors
2.3 Final energy consumption For all four regions, the transportation is the largest energy consumer, leading to the high oil consumption share (mainly gasoline, followed by diesel). The second place sector varies in the regions: in Central Java, WNT and Yogya, it is the household sector, in North Sumatra it is in-dustry.

14
0%
10%
20%
30%
40%
50%
60%
70%
80%
90%
100%
Central Java North Sumatra Yogyakarta West Nusa Tenggara
householdstransportothercommercial and servicesindustry
Figure 2.3 Final energy across sectors
Looking at the fuels consumed, as mentioned above, oil fuel dominates the energy use for well over 50%. In the figure below, kerosene has been singled out of the other oil fuels because it is mainly used in the built environment (for cooking and lighting mainly, but also for small do-mestic productive use (mini gen-sets to power tools). On average its end use share is 15 to 20%, in view of the national government’s programme to reduce the use of (subsidized) kerosene and replace it by LPG, which is quite a significant amount. North Sumatra is the only region so far to have natural gas in end use, although there are plans for Central Java and Yogya to be linked to a gas pipe network in the (near) future. Central Java is the only region with significant coal use, exclusively in industry. The electricity share is between 10 and 20%. In WNT most elec-tricity (2/3 of total consumption) is consumed by the mining company; apart from this, electric-ity only has an 8% share, which is the lowest of all, highlighting WNT’s poor position.
0%
10%
20%
30%
40%
50%
60%
70%
80%
90%
100%
Central Java North Sumatra Yogyakarta West Nusa Tenggara
electrictygaskeroseneoilbiomasscoal and sloids
Figure 2.4 Final energy across fuels
Looking at mobility per region – transport being the largest energy consumer – clear differences can be seen: motorcycles appear in one order of magnitude more than cars and buses are the densest in Yogya, which is a very urbanized region. For the other regions, buses are mainly minibuses running short lines in cities. WNT has the lowest numbers for all types of passenger transport. Truck transport has an intensity of about 2 per billion Rpa GRDP, except for WNT where it is about half that number. Other freight transport modes are not reported in the same

15
unit across the regions (hours versus added value), so no comparison is possible. Their energy consumption is lower than in road transport.
Table 2.2 Transport intensities Cars per
1000 persons Motorcycles per
1000 persons Buses per
1000 persons Trucks per
bln Rpa GRDP Central Java 10 133 1.3 2.1 North Sumatra 18 151 2.3 1.9 Yogyakarta 25 257 44.7 2.1 West Nusa Tenggara 6 79 0.4 1.1
2.4 Electricity supply Regarding supply, only electricity is presented here in detail. Each region, except Yogya, has its own power plants, which are mainly owned by the state electricity producer PLN. Captive power is the capacity installed at or directly for (industrial) end users, i.e. not connected to the PLN grid, the end use balance does not show the amount of electricity but the fossil fuel input in these plants. The “other” power plants in North Sumatra are mostly mixed oil-gas fired plants. No distinction in capacity between these fuels can be made, so in general electricity production is dominated by diesel or oil-fired units. It has to be added that in Central Java in 2006 two new large coal-fired power plants have entered into operation, but they are not included in this 2005 energy profile.
Table 2.3 Electric power indicators Installed power [MW] Electrification ratio Diesel Hydro Other Captive Households Village Central Java 1246 286 60 1123 66.69% 99.79% North Sumatra 33 213 1025 213 72.72% 86.08% Yogyakarta 70 71.57% 100.00% West Nusa Tenggara 129 1 204 47.81% 98.05% The table illustrates that although village electrification is almost 100% (i.e. at least one connec-tion is a village), the ratio per households differs considerably among the CAREPI regions. WNT is once more the least developed region.

16
3. Regional energy outlook H
3.1 The National Energy Policy In 2006, the Government of Indonesia issued Presidential Decree Presidential Regulation No. 5 of 2006 on National Energy Policy. The realisation in accordance with the Presidential Decree No. 5 in 2006, leads to the following percentage of the national energy mix: • Crude oil is less than 20%. • Natural gas to more than 30%. • Coal to more than 33%. • Plant-based biofuels more than 5%. • Geothermal more than 5%. • Biomass, Nuclear, Micro Hydro, Solar, and Wind Energy to be more than 5%. • Coal gasification to more than 2%. Compared to the current situation (2005) and a national Business as Usual scenario for 2025, this leads to the following representation. As can be noticed, the biggest challenge lies in the re-duction of oil dependency (transport, power generation and stationary use), in maintaining the coal share (power), in developing natural gas use (power and stationary use) and in a broad mix of alternative fuel development (including renewables and nuclear). A number of these objectives are clearly in an early stage of development, it is e.g. nuclear when the planned nuclear power plant (in Muria, central Java) would become inline. Also the coal gasification is yet not applied and also the natural gas pipe lines need to be constructed for most of the country.
Gas, 28.57%
Coal, 15.34%
Oil, 51.66%
Geothermal, 1.32%
Hydro Power, 3.11%
Gas, 20.6%
Coal, 34.6%
Oil, 41.7%
Geothermal, 1.1%
Hydro Power, 1.9%
Mini/micro hydro, 0.1%
Coal, 33%
Gas, 30%
Oil, 20%
Biofuel, 5%
Geothermal, 5%Biomass, Nuclear, Hydro Power, Solar
Energy, Wind Power, 5%
Coal Liquefaction, 2%
Renewable Energy, 17%
1
OPTIMIZING
ENERGY
MANAGEMENT
National (Primary) Energy Mix
National (Primary) Energy Mix of 2025
(BaU Scenario)National Energy Mix of 2025
(Presidential Decree Scenario)
Figure 3.1 National energy mix target

17
For the regions, the most important realisable targets are the biofuel, the geothermal and micro hydro ones (depending on regional resources). Biofuel is the farest developed and target per-centages of biofuel blending into their fossil equivalent is given in the next tables. As can be seen form the tables, it is not only transport which has targets, also stationary combustion and use is obliged to use biofuels. Bio-diesel and bio-ethanol are replacements for fossil diesel and gasoline, crude vegetable oil is meant to replace fuel oil and other heavier oils.
Table 3.1 Percentage of Bio-diesel target Sector 2009
[%] 2010 [%]
2015 [%]
2020 [%]
2025 [%]
Transportation PSO*) 1 2.50 5 10 20 Transportation Non PSO 1 3 7 10 20 Industrial and Commercial 2.50 5 10 15 20 Power Plant 0.25 1 10 15 20 *) PSO: Public Service Obligation
Table 3.2 Percentage of Bio-ethanol target Sector 2009
[%] 2010 [%]
2015 [%]
2020 [%]
2025 [%]
Transportation PSO 1 3.00 5 10 15 Transportation Non PSO 5 7 10 12 15 Industrial and Commercial 5 7 10 12 15
Table 3.3 Percentage of Crude Vegetable Oil target Sector 2009
[%] 2010 [%]
2015 [%]
2020 [%]
2025 [%]
Industrial 0 1 3 5 10 Sea Transportation 0 1 3 5 10 Power Plant 0.25 1 5 7 10 Next to the energy mix targets, the national government has also set other goals: one is to in-crease the electrification ratio (village) to 100% by 2020.The other which is already occurring now is the conversion from subsidised kerosene to LPG, which should be concluded in the year 2011 for urban households and for rural in 2012. However during 2009 the target year has been changed to 2010. Also planned power plant capacity additions as foreseen in the two 10 000 MW crash programmes were included. Another element which was included in the national policy, was the electricity demand forecast form the national power company PLN. They made forecasts up to 2016 for each region or group of regions. Based on these numbers, forecast up to 2025 were also determined by the re-gions. All teams incorporated these national targets in their KEN scenario. Regarding the regional en-ergy policy case (KED), the teams held stakeholder meetings in order to determine which altera-tions to the national policy were appropriate for the region. The major changes occurred in the biofuel deployment and in forecasted electricity demand growth.

18
Table 3.4 Overview of assumptions per region North Sumatra Central Java Yogya West Nusa Teng-
gara Biofuel Yes Yes Yes Yes Kerosene to LPG housholds
Yes By 2010 Yes By 2015 (Lom-bok)or 2020
Kerosene to LPG other sec-tors
By 2015 Yes Yes By 2015 (Lombok) or 2020
Electricification ratio
Yes Yes Yes Yes
Electricity growth
Yes Yes Yes Yes
Power plant ad-ditions
Yes Yes Yes Yes
Domestic Bio-fuel production
Only biodiesel Biodiesel, bio-ethanol and bio-
crude
Only bio-crude Biodiesel, bio-ethanol and bio-
crude Other Regional GRDP
and population growth rates; in-creased urbanisa-tion; decrease of
poor income class; sector shares in GRDP; reduced losses electricity
grid
Regional GRDP and population
growth rates; in-creased urbanisa-tion; decrease of
poor income class; slightly reduced losses electricity
grid
Regional GRDP and population
growth rates; in-creased urbanisa-tion; decrease of
poor income class; waste incineration, wind energy and
micro hydr
Regional GRDP and population
growth rates; in-creased urbanisa-tion; decrease of
poor income class; reduced losses electricity grid; three subregions
The figure below illustrates how the fuel intensity – the other changing factor besides the macro-economic drivers – changes over time, both due to fuel substitution as well as increasing usage.
Food industry
0
0.01
0.02
0.03
0.04
0.05
0.06
0.07
0.08
0.09
2005 2010 2015 2020 2025
BOE/
mill
ion
Rpa
KeroseneADOIDOFOElectricityLPGNatural GasCoalBiodieselNabati Oil
Figure 3.2 Example of fuel intensity change sin KEN (SumUt)

19
3.2 Results
3.2.1 North Sumatra The main changes besides the demand drivers and fuel switches is the closing of the own oil re-finery in 2006 and the maintaining of the export of electricity to the Aceh province. The latter continues even if North Sumatra is confronted with increasing power shortages itself, especially after 2017. Regarding final energy consumption, both KEN and KED show a considerable in-crease: 7.0 % per annum for KEN and even 7.4% for KED, compared to a 7.3% average growth of GRDP. Only KEN succeeds in having an elasticity slightly lower than one. Fossil oils for mobile use remains the major end use, although its importance reduces from 55% in 2005 to 50% in KEN and 45% in KED by 2025. Electricity grows from 10% in 2005 to 20% in KEN and even 25% in KED. Sectorwise, households reduce form 20% to 10-12% in favour of com-mercial (KEN) and industry (KED)
0
20
40
60
80
100
120
2005 2025 KEN 2025 KED
mill
ion
BOE
otherstransportindustrycommercialhouseholdselectrictygasbiomasssolidsbio fuelsstat oilsmobile oilskeroseneLPG
0%
10%
20%
30%
40%
50%
60%
70%
80%
90%
100%
2005 2025 KEN 2025 KED
otherstransportindustrycommercialhouseholdselectrictygasbiomasssolidsbio fuelsstat oilsmobile oilskeroseneLPG
Figure 3.3 Final energy consumption for North Sumatra
Regarding the primary energy mix, only the biofuel target is met, 10% compared to the national target of 5%, geothermal reaches 2% (in stead of 5%) and the others (biomass and hydro) only 2% (in stead of 5%). Coal increases from almost nothing to 8%, due to the added coal power plants. All these effects, together with the increase in natural gas use, reduce oil dependency

20
from 93 to 69% in both scenarios by 2025. It should be noticed that the percentages are based on the primary energy mix excluding electricity export and import, since also the national tar-gets are set as such. 2005
3%0%
93%
4%
0%biomasssolids
oilgashydro
2025 KEN
1% 8%
69%
9%
1%
2%10%
biomasssolids
oilgashydro
geothermalbiofuels
2025 KED
1% 8%
69%
9%
1%
2%10%
biomasssolids
oilgashydro
geothermalbiofuels
Figure 3.4 Primary energy mix
Regarding effect on poverty alleviation and access to energy, both scenarios show an increase of energy consumption in households increasing from 0.45 BOE per capita to 0.84 BOE per capita, excluding transport and services.
3.2.2 Central Java Central Java’s main changes are the coming in operation of a number of large coal fired power plants and the block Cepu oil well development at which a small refinery is attached. It position in the JAMALI electricity grid also plays a role, together with the capacity development, mak-ing it a net electricity exporter after 2006. Biofuel production and natural gas pipelines are sup-posed to be load following : capacity is added when needed. Final energy consumption triples over the time period, reaching a growth rate of 5.3% in KEN and 5.7% in KED which is slightly lower than the GRDP growth of 5.7% and 6.0% respec-tively. Fossil mobile oil reduces from 55% tot 40-45% by 2025 in both KEN and KED, being replaced with 10% biofuels. Electricity increases slightly from 15% to about 20%. Industry grows at the expense of households and becomes the second largest energy consuming sector after transportation.

21
0
20
40
60
80
100
120
140
2005 2025 KEN 2025 KED
mill
ion
BOE
otherstransportindustrycommercialhouseholdselectrictygasbiomasssolidsbio fuelsstat oilsmobile oilskeroseneLPG
0%
10%
20%
30%
40%
50%
60%
70%
80%
90%
100%
2005 2025 KEN 2025 KED
otherstransportindustrycommercialhouseholdselectrictygasbiomasssolidsbio fuelsstat oilsmobile oilskeroseneLPG
Figure 3.5 Final energy consumption for Central Java
The primary energy mix, excluding electricity trade, shows considerable changes induced by the scenarios: coal becomes a prominent energy source as fuel for new large power plants reaching well over the 33% of the national target, also natural gas appears as such a fuel. Biofuels reach 13% to 14% achieving the national target. Renewables such as hydro and geothermal remain underused, reaching only a few % of the energy mix.
2005
2%
4%
92%
0%
1%
0% 0%
biomasssolidsoilgashydrogeothermalbiofuels
2025 KEN
1%
35%
46%
5%
0%
1% 13%
biomasssolidsoilgashydrogeothermalbiofuels
2025 KED
1%
33%
46%
4%
0%
1% 14%
biomasssolidsoilgashydrogeothermalbiofuels
Figure 3.6 Primary energy mix

22
As for increased energy access for households, it increases from 0.31 BOE per capita to 0.47 to 0.50 BOE per capita, excluding transport and service energy consumption.
3.2.3 Yogyakarta Yogyakarta holds a particular position among the CAREPI regions since it is entirely dependent on import of its energy from outside the region, mainly from Central Java that is enveloping the Yogya region. Transportation and hence oil consumption is dominating its energy profile, now as well as in both KEN and KED scenarios. Transportation share does not drop below 50%, in-dustry remains small and household is somewhat less in KED than in KEN in favour of com-mercial – but it remains the second sector regarding energy use. The final energy grows with 3.8% and 4.1 % for KED and KEN, while GRDP grows with 4.9%.
0
2
4
6
8
10
12
2005 2025 KEN 2025 KED
mill
ion
BOE
otherstransportindustrycommercialhouseholdselectrictygasbiomasssolidsbio fuelsstat oilsmobile oilskeroseneLPG
0%
10%
20%
30%
40%
50%
60%
70%
80%
90%
100%
2005 2025 KEN 2025 KED
otherstransportindustrycommercialhouseholdselectrictygasbiomasssolidsbio fuelsstat oilsmobile oilskeroseneLPG
Figure 3.7 Final energy consumption for Yogyakarta
Yogya’s primary energy mix is completely dominated by (imported) oil products, besides ex-cluded electricity import. In the KEN scenario however, natural gas and biofuels appear, with only the latter achieving the national target. In the KED scenario, much attention was given to the few own resources Yogya could deploy, namely, some (mini )hydro, some wind in the south coastal region and on the use of waste streams inside the region (accounted for as biomass). However since the technologies converting these biomass streams into electricity are supposed

23
to be less efficient, the primary energy balance increases, resulting in having bio fuel a lower share (9%) although the absolute amount consumed remains the same. KED also includes a higher consumption of coal briquettes in households, replacing kerosene. 2005
0%0%
100%
0%0%0%0%
biomasssolidsoilgashydrowindbiofuels
2025 KEN
0%
0%
85%
4%
0%
0%12%
biomasssolidsoilgashydrowindbiofuels
2025 KED
20%
2%
68%
0%
0%
0%
9%
biomasss olids
o ilgashydrowind
biofuels
Figure 3.8 Primary energy mix
As for increased energy access for households, it increases from 0.50 BOE per capita in 2005 to 0.61 BOE per capita in KED and 0.83 BOE per capita in KEN by 2025, excluding transport and service energy consumption.
3.3 West Nusa Tenggara West Nusa Tenggara (WNT) has a more complex representation of its energy system, the three separate electricity grids are used to identify three subregions: Lombok and two on Sumbawa island: Sumbawa and Bima-Dompu. The results presented here are the aggregate for the whole province, taking into account that large differences may exists in the subregions. So has Sum-bawa a very large single mining company on its territory (Newmont) – also producing its own electricity - that accounts for the majority (56%) of the subregion’s energy consumption, there-fore it has been excluded form the results. In WNT, transportation remains the largest energy consuming sector, followed by commercial and households. Industry is not significant. This is valid for both scenarios, even if in KED there are considerable differences compared to the KEN scenario. So has the switch from kerosene to LPG not even complete and the biofuel target is not followed although there is substantial potential for biofuel energy crops in WNT. Fuel wise, apart from some renewables, all other fuels are imported from other regions in Indonesia. Also biofuels are imported beside domestic production. The final energy consumption grows with 4.8% for KED and 5.1% for KEN, which is somewhat lower than the GRDP growth of 4.5% in both scenarios.

24
0
1
2
3
4
5
6
7
8
9
10
2005 2025 KEN 2025 KED
mill
ion
BO
E
otherstransportindustrycommercialhouseholdselectrictygasbiomasssolidsbio fuelsstat oilsmobile oilskeroseneLPG
0%
10%
20%
30%
40%
50%
60%
70%
80%
90%
100%
2005 2025 KEN 2025 KED
otherstransportindustrycommercialhouseholdselectrictygasbiomasssolidsbio fuelsstat oilsmobile oilskeroseneLPG
Figure 3.9 Final energy consumption for Yogyakarta
WNT’s primary energy mix shows a rather simple structure in 2005, apart from oan biomass supply, only oil products appear, and all of them are imported. For 2025, biomass retains a 10% but is now partly imported since domestic resources are not sufficient. In KEN a 9% biofuels share is reached, in KED no biofuels are envisaged. In both scenarios 20% coal enters the pri-mary energy mix as some coal fired power plants are planned to be operated in Lombok, Sum-bawa and Bima Dompu.

25
2005
15%
0%
85%
0%0%0%0%
biomasssolidsoilgashydrogeothermalbiofuels
2025 KEN
10%
20%
60%
0%
0%
0%
9%
biomasssolidsoilgashydrogeothermalbiofuels
2025 KED
10%
20%
70%
0%0%0%0%
biomasssolids
oil
gas
hydro
geothermalbiofuels
Figure 3.10 Primary energy mix
Regarding increased energy consumption in households, it increases for WNT as a whole from 0.22 BOE per capita to 0.30 and 0.33 BOE per capita in KED and KEB respectively.

26
4. Pro-poor energy strategies
4.1 Introduction The regional energy outlook presented in the previous chapter covers the whole energy sector and presents the most appropriate regional energy strategy for meeting projected future energy demand. In the CAREPI project, special attention was paid to energy-poor communities in the region who have no access to grid electricity or other forms of modern energy and still rely to a large extent on traditional biomass for meeting their energy needs. Work Package 2 of the CAREPI project aimed to assess the energy-related needs and priorities of those poor communities and to identify measures for addressing these problems. A report de-scribing in detail the methodology and results of WP2 has been produced by the teams in the four target regions and can be downloaded from the CAREPI website. This chapter presents a brief summary of the work carried out by the regional teams in Work Package 2 and the results achieved.
4.2 Approach The general approach adopted by the regional teams to develop pro-poor energy strategies con-sisted of the following steps: 1. Selection of a suitable target location based on a list of criteria such as income level, repre-
sentative for the whole region, current energy consumption, accessibility of the community, demand for energy services and local authority commitment. Ideally, a number of different locations with different characteristics should have been included in the analysis, but due to budget constraints this was not feasible.
2. Develop a questionnaire and conduct workshops/interviews with community members. Two levels of intervention with the selected community were planned in advance: community meetings to present the CAREPI project, and workshops with community representatives and other stakeholders, including local government, to determine the needs and priorities.
3. Assess the current and future energy problems of the community; a participatory needs as-sessment process was applied, which basically involved asking people within the community and other stakeholders what they want in terms of energy services.
4. Identify potential measures that could address these problems. Through in-depth interviews with local government, local energy providers, local NGOs and based on the knowledge of the CAREPI team of the local situation, various options have been identified and analysed in detail for addressing the identified energy problems.
5. Develop the most appropriate strategy that addresses the energy needs of the poor people 6. Present and discuss proposed energy strategy with all stakeholders and incorporate the com-
ments received in the final strategy.
4.3 Selected target locations Based on a set of criteria the following villages/communities have been selected in the regions for conducting a needs assessment: • West Nusa Tenggara: Teres Genit village was selected, because it is not connected to the
grid and is classified as a ’poor’ community. Teres Genit is located in the northern part of the Lombok island and can be reached by four wheel vehicle or motorcycle. Teres Genit consists of three sub-villages with in total 510 households. The average income is approximately
27
Rp 350 000 per month ( € 25) which is below the poverty line. Most community members work in the agricultural sector.
• North Sumatra: Sitardas village was selected, because it is a less developed area that is diffi-cult to reach during times of heavy rainfall, because the road then becomes inaccessible and the village becomes isolated. The village consists of 121 households with an average of 5 household members. Most villagers are fisherman or work at palm oil and coconut planta-tions. Their monthly income is in the range of Rp 500,000 to Rp 3,000,000 ( € 36-214).
• Yogyakarta: Karangmojo sub-district was chosen because of the low income, the current en-ergy consumption, the available potential of renewable energy sources and the social back-ground of the community. Karangmojo sub-district is divided into 9 villages, which are all characterized as a traditional village because of the low education level, agricultural produc-tion mainly for own use and the limited level of communication with other villages. In total some 52,000 people live in these nine villages. Medical and educational facilities are limited.
• Central Java: Sokawera village was selected because of the low average income and the local potential of renewable energy sources. Sokawera village comprises some 1770 households with an average income of around Rp 25,000 (€1.7) per day. Agriculture is the main eco-nomic sector (44% of GDP), followed by trade (16%), service (13%) and industry (8%).
4.4 Identified energy-related problems Through a participatory needs assessment process, the CAREPI team was able to identify the main energy-related problems of the target communities, which are summarised below: • West Nusa Tenggara: key problems identified include:
1. No access to electricity for consumptive and productive uses such as wood working, manufacturing of agricultural products and rice milling.
2. No access to gas for cooking. 3. Insufficient access to petroleum products needed for transportation.
• North Sumatra: main problems identified are: 1. Non-availability of electricity; in the district three new power plants are planned to be
built that could provide electricity to Sitardas village, but it is very unclear if and when these plants will be built and if the grid will be extended to Sitardas.
2. Unreliable and insufficient supply of kerosene and petrol. • Yogyakarta:
1. Reduction of subsidy on kerosene and other oil products has had a significant impact on energy expenditures. Due to higher energy prices people were forced to reduce the use of kerosene and shift to firewood for cooking. It also affected irrigation, which was done by a hydraulic pump operated by a generator. However, due to the higher diesel price, irrigation is no longer possible at all times, leading to reduced agricultural yield and income for the farmer.
• Central Java: 1. Parts of the Sokawera village do not have access to electricity. 2. Termination of subsidies on fuels has increased energy prices, which in turn resulted in
lower income and higher energy expenses.
4.5 Proposed pro-poor energy strategy The strategies developed for improving the energy provision to the selected communities are based on the energy needs assessment, the stakeholder analysis, interviews with local policy makers and energy suppliers and on the local availability of energy resources. The specific pro-gramme developed for each target community is summarised below: 1. Sokawera village, Central Java: The programme consists of three components:

28
a. Biogas energy package for cooking purposes; this programme involves the installation of a small biogas digester based on animal waste of 2-4 cows for those families who own cows.
b. Biodiesel energy package for those households who do not own cows to replace kerosene for cooking and lighting;
c. Development of micro-hydro power plant for the production of electricity A detailed financial analysis of these programmes is presented in the report on WP2
2. Teres Genit village, Lombok: because of the availability of local rivers, the construction of a micro-hydro plant for the provision of electricity for lighting and for productive uses such as rice, coffee and corn processing, knitting and woodworking was proposed to address the identified energy needs in this village. The pro-poor energy strategy also includes the instal-lation of biogas digesters at household level to replace kerosene for cooking.
3. Sitardas village, North Sumatra: the energy strategy is based on the local energy resources and includes the installation of solar home systems (75 Wp) to provide electricity for lighting and to replace kerosene by LPG (national programme currently implemented in Indonesia).
4. Karangmojo village, Yogyakarta: proposed pro-poor energy programme comprises: a. The installation of biogas digesters for cooking purposes for those households who own
cattle. b. Larger biogas digesters based on animal waste of some 5-10 cattle for small industry. c. Small-scale production of biodiesel from jatropha to replace diesel for water pumping and
kerosene for cooking.

29
5. Development of micro-hydro scheme
5.1 Introduction The CAREPI project’s main objective is to develop capacity in a number of selected regions for formulating sound regional energy policies, with a clear emphasis on strategies that address the energy needs of poor people. However, it was considered very important to not only develop capacity for formulating strategies and plans on paper, but to also train local people on how to develop concrete energy projects by which these plans can be realised and which improve the energy provision to the poor. This is especially important in the light of Indonesia’s energy cri-ses, which result in frequent blackouts in many regions. One of the main activities was therefore aimed at the support for implementation of concrete energy supply schemes in the selected CAREPI regions by training the local teams in identify-ing and assisting the development of small scale renewable energy projects that are intended to serve as examples of how improved access to energy services can contribute to poverty allevia-tion. Due to the limited resources available for this activity, it was decided during the inception phase to focus solely on the development of micro-hydro schemes. Over the past 15 years, GTZ, to-gether with its sub-contractor Entec, has supported the development of a large number of micro-hydropower (MHP) schemes in Indonesia within the scope of the Mini-HydroPower Project (MHPP). Given this experience, combined with the local knowledge of the regional teams, the develop-ment of a micro-hydro scheme in each of the four target regions was considered to be possible – even with very limited budget and time. GTZ/Entec, as the coordinator of WP 7, has conducted the training courses in the target regions and has supported the regional teams in conducting the feasibility studies (FS). MHPP provided the necessary co-funding for the capacity development activities related to this activity of CAREPI. This chapter presents an overview of the process from site identification to implementation of a scheme as well as related capacity building activities. The approach applied to develop a micro-hydro scheme involved the identification of a suitable location, conducting a feasibility study, and securing the necessary investments as well as the construction of the scheme. This activity therefore comprised of data and information collection, analysis and evaluation related to the micro-hydropower (MHP) sites proposed by the four regional teams.
5.2 Selection of the sites This section provides an overview of the information collected by the four regional teams dur-ing the process of preliminary site identification for MHP in North Sumatera, Central Java, Yogyakarta and West Nusa Tenggara. These data also served as ‘real life examples’ in the sub-sequent trainings for feasibility study elaboration (‘FS-training’), which were implemented in each of the four regions in April-May 2007 (see next chapter). A number of initial meetings between the GTZ/Entec-Team and the regional teams were held during the first quarter of 2007: • Visit to three potential locations for MHP Pre/FS in Yogyakarta. • Meeting with the regional team of West Nusa Tenggara at Mataram University (UNRAM).

30
• Participation in the seminar on Regional Energy Planning in Mataram. • Meeting with the regional team of Yogyakarta at Muhammadiyah University of Yogyakarta
(UMY). • Participation in the seminar on Regional Energy Planning in Yogyakarta. • Discussion with Mr. Joko (member of regional team of Central Java) of Diponegoro Univer-
sity (UNDIP). Discussions with the regional teams were mainly held to learn more about the site identification progress and selection criteria applied by the regional teams. Selection criteria for suitable sites such as accessibility of the sites, quality of current electricity and energy services, estimation of energy supply and demand as well as potential for utilizing MHP for productive or income gen-erating purposes were emphasized and further elaborated. In the following sub-chapters, the data on preliminary identified sites are presented according to CAREPI’s four geographic areas of intervention.
5.2.1 North Sumatera The GTZ/Entec-Team received the site proposal for MHP development from the Regional Team of North Sumatera, as follows:
Table 5.1 Site proposal for MPH development in North Sumatera
No Name Flow rate [l/s]
Gross Head[m]
Hydraulic Pot.[kW]
No. of Houses
1 Aek Bontar, Tapanuli Tengah 1000 20 196 55 2 Mburidi, Tanah Karo 280 10 27 130 Subsequently, the Regional Team of North Sumatera was requested to describe in more detail the logistics of the sites (e.g. means of transportation, time required to reach the site, and on-site accommodation) as a consideration in the final selection of the site as location for the FS-training and intended follow-up. In order to optimize the time and outputs of the MHP training as well as the demonstration effects of the site, the GTZ/Entec-Team advised the Regional Team to propose a more accessible site. The Regional Team therefore decided to select a more accessible location and chose the Borus mini-hydro site in Tanjung Merawa village. The main characteristics of this location are pre-sented in the following table:
Table 5.2 Main characteristics of the Borus mini hydro site in Tanjung Merawa village No Name Flow rate
[l/s] Gross Head
[m] Hydraulic Pot.
[kW] No. of Houses
1 Borus, Tanjung Merawai 1130 25 184 not applicable Since this proposed site is in the vicinity of an already existing grid-line of the national electric-ity utility PLN, the least-cost approach for developing the site consists of interconnecting it to PLN’s existing network instead of setting-up a stand-alone village mini-grid. By doing so, the load factor of a MHP-scheme typically gets significantly higher than in stand-alone village grids in which electricity is in demand often almost exclusively during evenings and night time. Al-though the village population can strongly benefit from harnessing their available hydro re-sources via the implementation of a respective on-grid scheme, no specific number of house-holds can be mentioned as direct beneficiaries since the electricity generated from the MHP-scheme would be mixed with power from other sources feeding into the national utility’s grid-network. Therefore the number of households is mentioned as being “not applicable”.

31
In comparison to off-grid sites, grid-interconnected schemes are more likely to be commercially viable. In these cases, the GTZ/Entec-Team’s approach typically rather consists of supporting the identification of a professional investor and advising a business set-up that turns the villag-ers into co-beneficiaries instead of training selected villagers for setting-up, managing and oper-ating their stand-alone village utility by themselves as is the case for off-grid applications.
5.2.2 Yogyakarta A total of 27 sites were identified by the Regional Team Yogyakarta. Together with the regional team, the GTZ/Entec-Team visited the most promising of these sites, namely: Banjar Arum, So-rotanan 1 and Sorotanan 2. A brief profile of these sites looks as follows:
Table 5.3 Promising MHP sites in Yogyakarta
No Name Flow rate [l/s]
Gross Head [m]
Hydraulic Pot. [kW]
No. of Houses
1 Banjar Arum 4000 10 392 not applicable2 Semawung 1 3000 6 176 not applicable3 Semawung 2 3000 7 206 not applicable All the above proposed sites would exploit drops in existing irrigation channels and, therefore, the water flow remains relatively stable throughout the year. Moreover, all the sites can easily be accessed from Yogyakarta within approximately 1 hour. Based on discussions with the re-gional team of Yogyakarta and the findings of the sites visited it became apparent that all the proposed locations already had access to the electricity grid of the national utility PLN. Therefore, it has been deemed that the most appropriate approach to sustainably harness the re-gion’s water resources for income generating purposes is through the development of grid con-nected (on-grid) MHP’s. Based on this, it was decided that the development of the Banjar Arum site was the most attractive option as it possesses the highest hydraulic potential and its devel-opment would most likely be financially viable.
Figure 5.1 Left: The front view of MHP site of Banjar Arum. Right: The back/top view of MHP site of Banjar Arum

32
5.2.3 Central Java The Regional Team Central Java initially indicated only one potential site, which is located at a short drive from Banjarnegara in the district of Banjarnegara. The District Banjarnegara can be reached within approximately 3-4 hours drive from Semarang. The proposed site, which would be incorporated into an existing irrigation scheme, has the following basic characteristics:
Table 5.4 Characteristics of the Banjarnegara site in Java No Name Flow rate
[l/s] Gross Head
[m] Hydraulic Pot.
[kW] No. of Houses
1 Banjarnegara 11,000 4 264 xyz These basic characteristics (4 m head and 11 m3/s flow) appear problematic, as this type of ”large-flow / low-head” schemes usually involve large and complicated components, which are relatively costly in terms of cost per installed capacity. Nevertheless, with regard to the short time period between the belated submission of site-data and the already scheduled training it was recommended to the Regional Team Central Java to conduct the field-component of the FS-training at this site first and then – based on what they learned during the training – to continue their efforts for identifying (a) more suitable site(s) after the training. Following the training (see Chapter 3.3) the Regional Team Central Java identified and exam-ined two more locations with higher probability of implementation. Location no. 2 for develop-ing a MHP-scheme was in the hamlet of Pakuluran in the Sidoharjo village. After the feasibility study was completed it turned out that no budget was available with the regional government for the construction of the proposed scheme, because they already decided to rehabilitate an already existing but broken down micro-hydro scheme in its vicinity. Next, the Regional Team Central Java selected location no. 3 in the Brukah Telaga village of the Banjarnegara district. The key information for both locations is presented in the following table:
Table 5.5 Characteristics of two more locations in Central Java No Name Flow rate
[l/s] Gross Head
[m] Hydraulic Pot.
[kW] No. of Houses
2 Pakuluran / Sidoharjo 80 25 12 69 3 Brukah Telaga 5,094 11.2 27.4 220
5.2.4 West Nusa Tenggara Four sites were visited by the Regional Team West Nusa Tenggara, with the following profiles presented:
Table 5.6 Characteristics of four locations in West Nusa Tenggara No Name Flow rate
[l/s] Gross Head
[m] Hydraulic Pot.
[kW] No. of Houses
1 Teres Genit 190 22 41 200 2 Air Berik 348 7 24 510 3 Tepal 200 20 39 350 4 Kawidatoi 1290 14 175 985 From the discussion with the Regional Team West Nusa Tenggara, the Teres Genit site was proposed as the site for a feasibility study and the related training activities. This decision was based on the following reasons: • The three hamlets that would benefit from the proposed MHP had no access to electricity.

33
• The site is located in North Lombok and is relatively well-accessible (it takes approximately 2 hours by car from Mataram plus 30 minutes walk).
• The local community showed a high level of commitment to the development of the scheme. Formerly, an MHP scheme was constructed in Teres Genit in 1997 to supply approximately 200 households within the four hamlets of the village. The relatively simple scheme exploited a drop structure of approximately 22 m in height in an irrigation network. Its construction formed a sub-component of the Teres Genit irrigation system, constructed in 1994 and financed by the Ministry of Public Works. With no capacity building for establishing a suitable institutional and management set-up, the scheme operated for only 3 years before it went into disrepair. Only some of the civil structures remained, which could be re-used. All electro-mechanical equip-ment and distribution lines were removed.
Figure 5.2 Left: The previous MHP scheme was integrated into the Teres Genit irrigation system, which was constructed in 1994. Right: The majority of the civil structure was still in good condition and could be put back into operation for the MHP relatively easily
5.3 Training As presented in the previous chapter, preliminary identification of the sites was carried out by the regional teams. A more detailed collection of site data was conducted as “on-the-job” train-ing together with the regional teams during the FS-trainings in April-May 2007. The training conducted under WP 7, aimed to develop and enhance capacity of local experts for site identifi-cation, assessment and preparation of concrete energy supply projects in the field of MHP. For data analysis and evaluation, detailed training modules were prepared and presented to the teams during classroom sessions at the beginning and the end of the field training. The training approach and basic contents was identical in all four provinces. Training was conducted in the classroom as theoretical lessons (presentations and analyses), complemented with a field session where practical application of the survey and data collection techniques was practiced. This was carried out at the pre-selected site locations. Whilst the training in the field usually took one full day, two days were allocated for the field training in North Sumatra and in Lombok due to the length of travel required to reach the sites. The summary of the training activities is presented in the following sub-chapters. For more details including the training topics, a list of participants as well as a photo documentation, please refer to deliverable no. 12.
5.3.1 North Sumatra / Universitas Sumatra Utara The class room sessions of the training were conducted at the Universitas Sumatra Utara. The training was attended by 18 people from the university and other institutions. The site where the field-training took place was planned to be incorporated in an unused irrigation system (not

34
used due to severe landslides downstream of proposed MHP location). The gross head was ap-proximately 28 m, the approximate design flow possible up to 1 m3/s. The site was proposed for grid-interconnection (approximately 1.2 km to the nearest medium voltage interconnection point). An intake was present; repairs of headrace channels would have been required and a new forebay, penstock and powerhouse needed.
5.3.2 Yogyakarta / Universitas Muhammadiyah The class room sessions of the training were conducted at the Universitas Muhammadiyah. The training was attended by 20 people from the university and other institutions. The site where the field-training took place shall utilize an existing drop of approximately 10 m within the Ban-jarharjo irrigation system. During the field visit, a flow of approximately 6 m3/s was measured, which would make the site suitable to supply electricity to the national grid. Additionally to the site visit an existing MHP was visited in the vicinity of Yogyakarta. Despite being much smaller in size (10 kW, utilizing a drop of approximately 5 m in an irrigation system) interesting techni-cal and non-technical aspects could be studied at this plant.
5.3.3 Central Java / Universitas Diponegoro The class room sessions of the training were conducted at the Universitas Diponegoro. The training was attended by 12 people from the university and other institutions. As mentioned in Section 2.3, the Banjarnegara site where the field-training took place was rather problematic in terms of cost per installed capacity. Nevertheless, keeping the training purpose of the mission in mind, relevant measurements could be conducted at this site. After the field training, a visit was made to the local office of Indonesia Power, who at that time put high priority on developing the relatively large hydraulic potential in the area for energy generation. After an interesting presentation held by the local management, a visit to one of their sites currently under construc-tion was carried out. The site of Siteki is located in Kec. Rakit and was scheduled for commis-sioning by the end of 2007. Finally, an MHP-scheme close to Wonosobo, the Wangan Aji MHP, was visited for study purposes.
5.3.4 West Nusa Tenggara / Universitas Mataram The class room sessions of the training were conducted at the Universitas Mataram. The training was attended by 15 people from the university and other institutions. The site where the field-training took place is located close to Teres Genit Village in North Lombok. The proposed MHP plant was meant to provide 126 households and public and productive uses in four ham-lets with electricity. The scheme was planned to be incorporated into an existing irrigation scheme and utilizes a drop (gross head) of approximately 23 m. Flow measurements revealed a utilizable flow of approximately 200 l/s. Funding for the implementation of the scheme had al-ready been allocated by the local government department responsible for rural electrification (Dinas Pertambangan) in their annual budget for the fiscal year 2007.
5.4 Preparation of feasibility studies Following the completion of the training courses at the 4 universities, efforts during late 2007 and early 2008 were focused on preparing the subsequent feasibility studies for the locations se-lected by the respective technical teams. Of the 4 locations, 2 off-grid or stand-alone schemes were selected (Central Java and West Nusa Tenggara) and 2 grid-connected (Yogyakarta and North Sumatra). Whilst the intention from the outset was to select locations where development of the scheme was deemed viable, due to the specific site conditions of each site the subsequent steps involved in this process have had to be staggered accordingly. Specifically for the off-grid schemes, before going ahead with the feasibility studies, discussions were held with representa-

35
tives from the local Government to establish whether they would be willing to make the neces-sary funds available for the subsequent construction of the prepared sites. In the case of Central Java, this was also one of the reasons for conducting the feasibility study for the Pakuluran site instead of the Banjarnegara site where the training had been conducted, but no budget was made available in due course for any subsequent implementation. Although the training courses were very comprehensive in the material they provided, in order for the technical teams to prepare a fully fledged feasibility study that could be used as the basis for the actual implementation of the schemes, further technical assistance and backstopping was essential. Consequently, be-tween June-December 2007, the GTZ Team conducted the first follow-up site visits to all 4 lo-cations together with representatives from the technical teams. Detailed site surveys were car-ried out during these visits. During early 2008 further site visits were made where appropriate. After completion of the site visits work on the actual preparation of the studies was initiated. Selected members of each technical team were invited to attend an additional 1 week “on-the-job” training at the office premises of GTZ in Indonesia’s ‘MHP-capital’ the city of Bandung, where they worked together with the GTZ/Entec staff on the processing of the respective site data and on the detailed preparation of the studies including detailed designs. The following ta-ble presents some of the main findings of the feasibility studies for the four sites. For more de-tails please refer to the feasibility study reports presented in separate reports.
Table 5.7 The main findings of the feasibility studies for the four selected sites Site Design Flow
[l/s]
Gross Head/Net Head
[m]
Electrical Capacity
[kW]
Estimated Investment
[US$]
No. of Houses
Tanjung Merawai/ North Sumatra
1,130 25.05 / 24.40
184 378,498 not applicable
Banjar Arum/ Yogyakarta
6,500 12.34 / 12.20
614 584,898 not applicable
Pakuluran/ Central Java
80 25.42 / 22.20
12 72,091 69
Teres Genit/ West Nusa Tenggara
200 24.00 / 23.32
26 140,000 350
5.5 Follow-up/Development of the sites
5.5.1 North Sumatera In North Sumatra, the feasibility study was conducted and the report was submitted to the Dinas Energi. However, this was not followed up; firstly, because the energy forum in this region has not yet been formally established, which has hampered effective cooperation with the Dinas and, secondly, the feasibility study showed that given the Indonesian regulatory framework with its high level of uncertainty the identified site (approx. 180 kW) was not sufficiently attractive with its payback period of some 8 years.
5.5.2 Yogyakarta In the Yogyakarta province, the feasibility study clearly showed that the scheme can be operated in a commercially viable way, i.e. by a private investor who is selling the electricity to the pub-lic utility company. An interested private investor has been identified and first discussions were very encouraging. With the new Electricity Law dated 23 Sept. 2009 and a Ministerial Regula-tion defining the purchase price for renewable energy based electricity (to be released in No-vember 2009), it is expected that the scheme becomes sufficiently attractive for the investment to actually take place in 2010.

36
5.5.3 Central Java In Central Java, the feasibility study of the selected Pakuluran/Sidoharjo-site revealed that it would be better to construct a new system next to the existing system rather than to rehabilitate the existing system where an open channel micro-hydro scheme was severely damaged due to landslides. Rehabilitation of the existing open channel system would only be a short-term solu-tion, since given the high probability that another landslide would occur and again damage the system. The GTZ/Entec-Team visited the location and recommended to not rehabilitate the ex-isting system, but to build a new closed pipe system some 20 meters next to the existing system to avoid any future damage from landslides. After conducting the feasibility study for the new scheme (approx. 12 kW), the CAREPI team found out that the Dinas Energi already had allo-cated funds for the rehabilitation of the existing system. Several meetings were held with the Dinas to try to shift these funds to the construction of the new scheme. Despite the arguments of the CAREPI team this decision could not be reversed. Therefore, the CAREPI team has identi-fied another site in Central Java for developing a micro-hydro scheme, in close cooperation with the local energy office. The local government has already indicated its willingness to provide (part of) the funding for the construction of this site in the Brukah Telaga village if the feasibil-ity study will show that this is a suitable location.
5.5.4 West Nusa Tenggara Following the completion of the feasibility study (see Chapter 4), the rehabilitation of the 32 kW MHP-scheme in West Nusa Tenggara province proved to be highly successful. After seeing their scheme out of operation for more than one decade, the core actors in the village of Teres Genit stated an unusually high desire for capacity building related to operation, mainte-nance and management. Upon the first visit, the CAREPI team was told by the village chief: “When the scheme was built the first time, nobody told us how to take care of it. It is better to not rehabilitate the scheme at all and spare our village from another round of disappointed hopes if you are not committed to teaching us the skills we need.” Based on such fertile ground, only relatively small technical assistance input was required by the CAREPI-team to bring the scheme back to sustainable operations. After more than a dozen years, the village literally came out of the dark again when the scheme came back into operation in June 2008. With approximately 140,000 USD, the majority of investment costs were provided by its owner, the Government of West Nusa Tenggara. By employing a Lombok-based community develop-ment NGO, which worked sporadically together with CAREPI’s West Nusa Tengarra Team on this task, MHPP supported the setting up of a village-based organisation for operation, mainte-nance and management of the MHP-scheme with approx. 4,000 USD. The village based organi-sation employs (in part time arrangements) 2 operators, 1 head of management, 1 secretary and 1 bookkeeper. The tariff is collected based on metered monthly consumption, whereby typically 3-4 households are connected to one meter and pay their monthly bill collectively (‘clustered metering’). After overcoming a number of technical problems, in the 3rd quarter of 2009 the scheme finally became fully operational and now supplies electricity to more than 380 households in the four hamlets of the Teres Genit village. As revealed during a site monitoring visit, the households’ monthly energy expenses have decreased from approx. 100,000 IDR to approx. 10,000 IDR due to substitution of kerosene by electricity for lighting purposes. Also transportation expenses for motorbike taxis have significantly decreased since a lot of communication is now conducted by mobile phone instead of by driving to the neighbouring settlements. However, interviewees stated that their expenses for prepaid mobile phone cards have increased. By now, 10 local families have replaced their petrol gen-sets by hydroelectricity to run their woodworking home industry. Other income generating uses of the hydro electricity comprise hand phone charging for the neighbours as well as the electricity supply to a lodge adjacent to the village. Due to mo-bile phone availability, farmers’ cattle transactions have reportedly become quicker and better

37
informed with regard to respective price levels. Whilst the MHP-scheme’s capacity is already well used during the nights, there is still spare capacity left for day time use of energy. How-ever, substantial investments into respective productive machinery typically only occur after more than at least one year of smooth MHP-operation when the local entrepreneurs have be-come assured that the electricity which their new equipment requires will be reliably available. To summarise the developments in Teres Genit it is safe to state that, even with only a relatively minor contribution in the form of technical assistance, the EC through the COOPENER project CAREPI had a big leverage effect with regard to the sustainable implementation of a concrete energy supply system. With CAREPI’s good reputation and high visibility, the development of the Teres Genit scheme enjoys high attention by a large number of sector stakeholders allowing the scheme to serve as a good practice example for replication throughout Indonesia. In Teres Genit, electricity supply has become even better than in neighbouring settlements, which are connected to the national power grid where the utility PLN is conducting rotating blackouts to overcome the shortage of power from fossil fuels.

38
6. Conclusions
The expected results of the CAREPI project when it commenced in January 2007 were: • Strengthening institutional and technical capacity in the selected regions • Developing a regional energy profile and regional energy outlook for the selected regions • Identifying energy priorities and best practices for energy services provision • Facilitating the development of concrete energy supply/efficiency projects It was envisaged to achieve the above results in four target regions, the provinces of North Su-matra, Yogyakarta, Central Java and West Nusa Tenggara. In the inception phase these four tar-get regions have been identified and subsequently a team responsible for the implementation of CAREPI in the region was established and an energy forum comprising representatives from local government, local private sector and local NGOs has been set up in each target province. Three main conclusions from the CAREPI project are: 1. In 2001 the Government of Indonesia started to implement a process of decentralisation that
aimed to shift responsibilities from the national level to the regional level. Regional govern-ments (provincial as well as regencies) are now responsible for their own development, in-cluding energy sector development. This was further elaborated in 2007 when the new en-ergy law was approved by parliament, which stipulates that regions must develop a regional energy plan. Another step towards regional autonomy was taken in 2009 when the new elec-tricity law was approved, which says that regions can now determine the tariffs in their own region and can issue permits to independent power producers. This clearly shows that re-gions now have the responsibility for their own energy policy formulation and the CAREPI project has greatly contributed to enable the provinces of Yogyakarta, Central Java, West Nusa Tenggara and to a lesser extent North Sumatra to duly carry out this new responsibility. Technical teams have been established and trained on energy policy formulation issues and over the past three years these teams have developed excellent working relationships with the regional government and other stakeholders in their region. It is expected that these teams will continue to support the regional government in the formulation and implementa-tion of energy policies.
2. The CAREPI team has not only delivered reports and energy models, but has also developed a concrete energy supply plant that produces electricity for poor households who previously did not have access to electricity. Co-ordinated by GTZ, each regional team has identified a suitable site for such a system, has conducted a feasibility study, has identified investors willing to invest in the construction of the system and, finally, has constructed the system. This activity has been completed in Lombok, West Nusa Tenggara, where a 32 kW micro-hydro system is now producing electricity for some 380 households. In Yogya and Central Java it is expected that the system will be operational in the course of 2010.
3. Recently, the 2008 national energy balance for Indonesia as a whole was published. This na-tional energy balance is based on national statistics, but it takes regional data into account only to a very limited extent. The regional energy balances developed as part of the CAREPI project therefore provide very useful additional information and also triggered a different bottom-up approach to develop the national energy balance.