contrasting querying data in a tabular format within power bi excel 2016 and ssrs 2016
TRANSCRIPT

Different Methods Of Querying Data In A Tabular Format Within Power BI
Kieran Patrick Wood MCTS BI, MCC, PGD SoftDev (Open), MBCS, Microsoft Partner
The chart visualisation features of Power BI are having a hugely positive impact on the Business Intelligence community. This presentation compares and contrasts the tools available to firmly establish confidence in the analysers of these charts by empowering them to drill down into the detail of the numbers behind these charts using familiar tabular style reports.
Version 1.3
Get on board the Power BI data revolution
Get to Know the Presenter
• An experienced MS Power BI Consultant .
• Over 20 years experience in database development including finance, insurance, health, retail, construction, housing, local government, supporting people, Gas and Electric, and facilities services.
• A number of my skill endorsements have been given by some of the most respected experts in the MS BI Stack in the world.
• This includes many MVPs Microsoft (Most Valued Professionals) who gained their MVP status from their contribution to the SQL Server community.
• Post Graduate Diploma in Software Development
• Microsoft Certified Technical Specialist in SQL Server Business Intelligence.

StructureThis presentation is split into sections as follows; -• 1. Target Audience of this Presentation • 2. Why Tabular Reporting is Important• 3. Introduction to the Different Tabular Querying Methods• 4. Criteria for Assessing Different Tabular Querying Methods• 5. Tabular Reporting Components within Power BI• 6. Pivot Table Excel Query Method• 7. DAX Excel Query Method• 8. Cube Values / Members• 9. Tabular Reporting within SSRS 2016• 10. Comparing the different Tabular Querying Methods• 11. Conclusions• 12. Finish

1. Target Audience of this Presentation
• Get quick head count of attendees with experience of; -• Advanced Excel Users (Pivot Tables, etc.)
• Developing Excel Power BI (PowerPivot, PowerQuery, PowerView) solutions
• Developing Power BI solutions
• N.B. You will be given an opportunity to ask any questions at the end of this presentation to allow this series of demonstrations to be structured.

2. Why Tabular Reporting is Important
• Business Stakeholders need to drill into a table and dice / slice this data to prove that the data behind a given graph / chart is correct.
• Excel Online Tabular reporting is important because; -• The table and matrix components within PowerBI have less dice and slice
capabilities, although this is changing with new feature releases every month.
• Using existing Excel content within a PowerBI portal can very quickly add value to the reporting experience.
• Excel Online can also help organisations maintain existing investments with existing Excel tabular reports.

Example Table / Matrix Report within PowerBI

Comparing Power BI Tables within Excel Pivot Tables
• You cannot easily perform drill down analyse within Power BI tables.
• Within Excel Pivot Tables drill down analyse is a default feature.
• This Pivot Table drill down analyse is a highly interactive user friendly feature which instils trust in the data from a user perspective.

Example of Excel Pivot Table within Power BI via Excel Online Services

Example of Excel Pivot Table Pinned within Power BI Dashboard
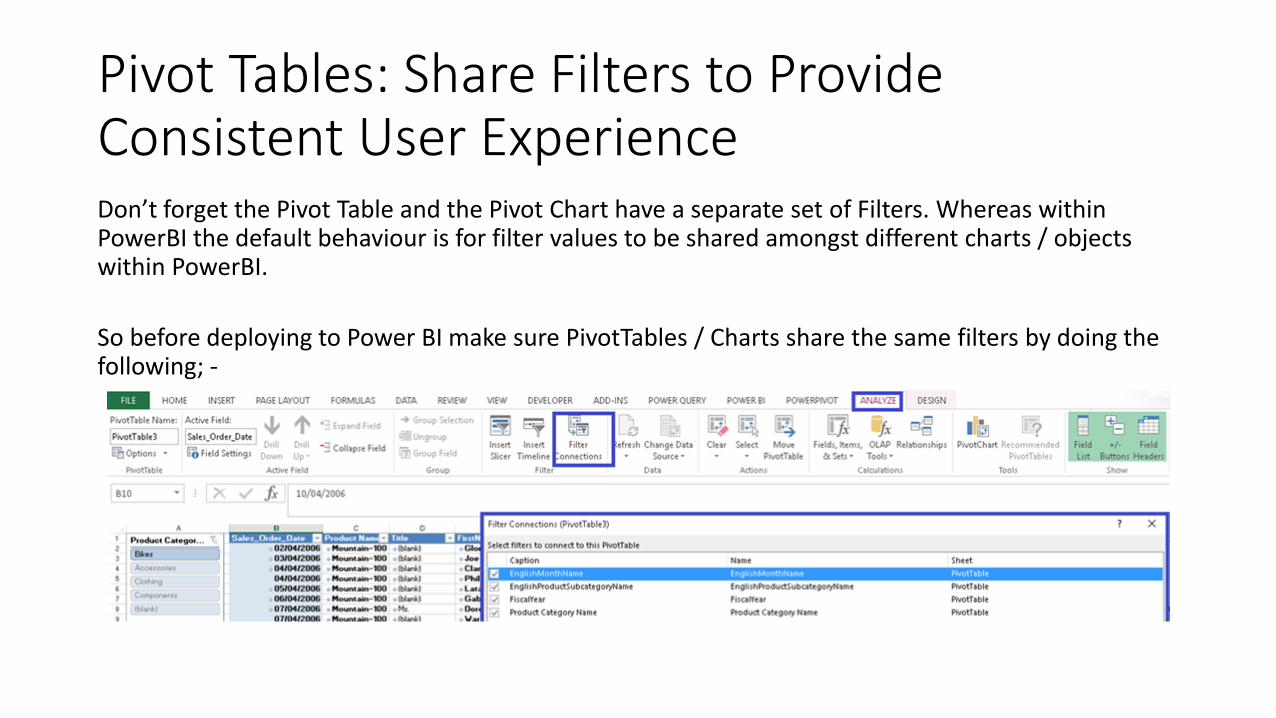
Pivot Tables: Share Filters to Provide Consistent User ExperienceDon’t forget the Pivot Table and the Pivot Chart have a separate set of Filters. Whereas within PowerBI the default behaviour is for filter values to be shared amongst different charts / objects within PowerBI.
So before deploying to Power BI make sure PivotTables / Charts share the same filters by doing the following; -

End of Section 2: Why Tabular Reporting is ImportantFurther Reading / Resources
• Basic tasks in Excel Online
• Bring whole Excel files into Power BI
• Drill down in a visualization in Power BI
3. Introduction to the Different Tabular Querying Methods• Different methods of querying I intended to cover are; -
• Custom and Built in Tabular Reporting Components within Power BI• Pivot Tables• DAX Queries• Cube Members• Tabular Reporting within SSRS 2016
• Consider this presentation a ‘shallow dive’ for existing Business Intelligence developers. As an advanced Excel user you may need to refer to this content multiple times to get the most benefit from it.
N.B; - Don’t worry if you don’t understand everything first time round. This presentation and supporting documentation will be made generally available shortly.

4. Criteria for Assessing Different Tabular Querying Methods• Advantages / Disadvantages of the different query methods will be
discussed in terms of; -• Performance
• Skills required
• Maintainability
• Readability and Stability
• AdventureWorks PowerPivot / Tabular Model will be used as a source example.

• Performance• Why is performance a big deal?• If the user loses patience with the speed of response of the
solution, the solution will not be used.• In practice unresolved performance issues result in loss of stability
and loss of data.
• Skills Required• What are the skills required to create a table using this method of
querying data.

• Readability• How easy it is to extend an existing table using this method of
querying data.• Maintainability
• How readable is the design / code which uses this method of querying data.
• Stability• How likely is this method of querying data to return unreliable
results or even cause a crash.

7. Tabular Reporting Components within Power BI
In summary the Power BI Table and Matrix controls are highly interactive but do not have the same degree of user based dicing and slicing capabilities of Pivot Tables

You can roll up / drill down within a chart and tabular data provided that there is a pre-defined hierarchy to drill through with such as Year / Month / Date.
• Performance• Fast
• Skills Required• Simple intuitive interface
• Readability• No issues
• Maintainability• Does not have the same user focused dice and slice facilities of Pivot Tables.
• Stability• Good
• Keep an eye on Custom Visuals which may include mays of improving the tabular model experience, e.g. Hierarchy Slicer

End of Section 5. Tabular Reporting Components within Power BIFurther Resources• Drill down in a visualization in Power BI
• Creating a Hierarchy within Power BI

6: Pivot Table Excel Query Method• Most advanced Excel users know how to create Pivot Tables.
• The Pivot Table exposes all the data into a single Excel work sheet where work sheets are within the comfort zone of Excel users.
• PowerPivot models require training and experience to digest.
• It is difficult to persuade business users to interpret PowerPivot models when they are under pressure with BAU.
• There may be a statutory business requirement to create an extract of a PowerPivot model which contains many rows and many columns.
• The short term problem of user demands of very large Pivot Tables is based on psychology. Too much change can create resistance.
• The longer term solution is persuading customers to phase out usage of very large usage of Pivot Tables.

Pivot Table Excel Example Data Source Model• The following is a screen shot a fuller Adventure Works solution which
incidentally is more simple than many commercial solutions.

Pivot Table Example

Pivot Table; Performance
• Was un-useably slow on 60K rows * more than 15 columns with Excel 2013
• Therefore for example it was not possible to deliver the worksheet output requirements for a real world client because the number of columns required was in excess of 100 columns.
• Now initial tests show Pivot Tables compete with DAX queries with Excel 2016
Performance Issue Resolution Explanation
• Excel 2013 generates un-necessary sub totals.
• Excel 2016 no longer has these un-necessary sub totals.

Pivot Table Results
• Skills Required• Basic Excel, drag and drop.
• Maintainability• Easy maintenance via drag and drop.
• Readability• Intuitive interface.
• Stability• Excel 2013; - Can cause Excel to crash on a large Pivot table of 60K rows *
more than 15 columns.• Excel 2016; - Impressive spread on a large Pivot table of 60K rows * more than
15 columns.

End of Section 6: Pivot Table Excel Query MethodFurther Reading
• Excel subtotals when querying Multidimensional and Tabular models
• Excel Pivot Tables Creates Inefficient MDX
• OLAP PivotTable Extensions
• GETPIVOTDATA function

7: DAX Query Excel Query MethodDAX: Data Analysis Expression is the querying language of Power BI.
Brief introduction in DAX studio
• Is widely recognised as an essential tool even though it is open source. Future products e.g. Power BI Desktop may subsume some of the functionality of DAX studio.
• SSMS 2016 does not yet incorporate a DAX studio experience. This underpins the fact the DAX studio is an essential tool for Power BI and Analysis Services Tabular Model developers.
• PowerPivot is single user Analysis Services Tabular Model, e.g. they both have the same engine.

DAX Query within Excel Worksheet and DAX Studio
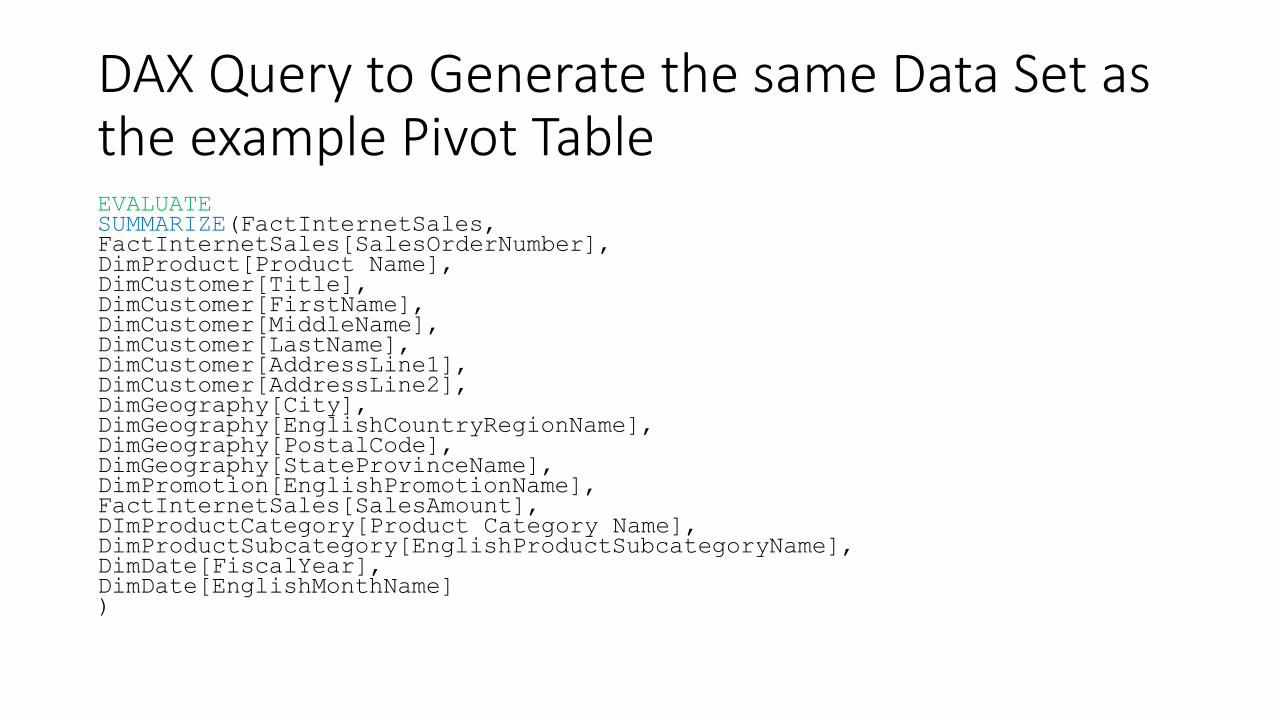
DAX Query to Generate the same Data Set as the example Pivot TableEVALUATESUMMARIZE(FactInternetSales,FactInternetSales[SalesOrderNumber],DimProduct[Product Name],DimCustomer[Title],DimCustomer[FirstName],DimCustomer[MiddleName],DimCustomer[LastName],DimCustomer[AddressLine1],DimCustomer[AddressLine2],DimGeography[City],DimGeography[EnglishCountryRegionName],DimGeography[PostalCode],DimGeography[StateProvinceName],DimPromotion[EnglishPromotionName],FactInternetSales[SalesAmount],DImProductCategory[Product Category Name],DimProductSubcategory[EnglishProductSubcategoryName],DimDate[FiscalYear],DimDate[EnglishMonthName])

DAX Query Results• Performance
• The DAX query runs in 3 seconds.• Optimisation techniques.• Storage Engine / Formula Engine.
• Skills Required• Depends on the business rules which define the worksheet. However a very
basic knowledge of DAX can deliver effective work sheets.
• Maintainability• Fairly easy to maintain with a basic knowledge of DAX.
• Readability• DAX as a technical language is un-usually easy to read.
• Stability• The very efficient performances leads to greater stability, just remember to
test the query within DAX studio first.

End of Section 7: DAX Query Excel Query MethodFurther Reading / Resources
• DAX Studio
• DAX Function Reference
• Data Analysis Expressions (DAX) Reference
• Data Analysis Expressions (DAX) Overview

8: Cube Values / Members
• You can generate a worksheet based on Cube Values as follows; -

Resulting in; -

Cube Values / Members with Slicers and Conditional Formatting

Cube Values / Members• Performance
• OK for worksheets with a small number of aggregated cells since MDX is understood by Excel PowerPivot. Generally the MDX generated is very simple and efficient. However the Cube members functions are essentially separate queries for each individual cell. So performance will depreciate running a worksheet which populates a thousand plus cells with the Cube Members / Cube Values function.
• Skills Required• Add further logic such has slicers to the report can require more advanced MDX
syntax which is certainly beyond the scope of a typical advanced Excel user.
• Maintainability• However the over-riding disadvantage of cubemembers / cubevalues is that
maintenance / maintaining formula can become very time consuming since these functions are cell bases as opposed to table based.
• Readability• OK for simple worksheets.
• Stability• OK for simple worksheets.

End of Section 8: Cube Values / Members
Further Reading / Resources
• Using Excel CUBE Functions with PowerPivot
• CUBEVALUE function

9. Tabular Reporting within SSRS 2016


• Performance• Good although with large data sets limited by page based rendering.
• Skills Required• Ad hoc drill down navigation can only be defined by the developer not the
user.
• Maintainability• As above since drill down navigation cannot be defined by the user focusing
solely on SSRS for tabular reporting will result in the development of more reports.
• Readability• Good but within the limitations mentioned above.
• Stability• Good

End Of Section 9. Tabular Reporting within SSRS 2016
• Resources• Pin Reporting Services items to Power BI Dashboards• 3 ways Reporting Services and Power BI work together• Branding the web portal• What’s new for KPIs and mobile reports in SQL Server 2016 RC1• SSRS - Sun Burst Chart Step By Step Instructions• SSRS - Tree Map Chart Step By Step Instructions• SSRS - Create Multi Group Drilldown report with Group Totals and Grand Total Step
By Step Instructions
• Please vote for the following ..https://ideas.powerbi.com/forums/265200-power-bi-ideas/suggestions/11686899-ssrs-tables-matrix-into-powerbi
• N.B. Also don’t forget SSRS is essentially a free reporting tool! Once you purchase SQL Server, SSRS is included.

10. Comparing the different Tabular Querying Methods• Power BI / PowerPivot Migration to Tabular Model
• Further analysis can be made of your model using SQL Server Profiler, etc.
• Since PowerPivot and Tabular Model share the same look and feel and share the same language both factors create huge opportunities.
• These opportunities include allowing developers and advanced Excel users to work in synergy like never before.
• This increased synergy includes a much more efficient requirements elicitation, efficient prototyping iteration, design reuse and code re-use from analysis to an enterprise production environment.

Comparing the different Tabular Querying Methods Findings are as follows; -
Key; 5 = Most powerful and efficient, 1 = Weakest*Pivot Table performance and stability scores the weakest in Excel 2013 (1) . However Pivot Table performances and stability are greatly improved within Excel 2016 which scores (4).**Currently only SSRS charts can be deployed to Power BI dashboards not SSRS table / matrix reports.
Power BI Table /
MatrixExcel
Pivot Tables
Excel
DAX Queries
Excel
Cube Values
SSRS Table /
Matrix**
Ad hoc analysis 3 5 4 2 2
Performance 3 5* 5 2 3
Skills Required 3 5 3 2 4
Maintainability 3 4 4 1 3
Readability 3 5 4 4 4
Stability 4 4* 5 3 5
Repeatable 2 2 5 3 4
11: Conclusions• The use of Pivot Tables within Excel Online via Excel 2016 empowers
self service report writers to maintain their existing highly interactive tabular reporting within their Power BI web portal.
• When relating to Power Excel users where at all possible Excel users must be encouraged to learn basic DAX.
• The user learning curve can be very significantly reduced by exposing parts of the data model using perspectives and a little training on a sub section of the DAX command set.
• So when training Advanced Excel users on DAX focus on the commands which have a syntax very similar to Excel, e.g. SUMX, AVG, MIN, MAX, etc.
• So teaching basic DAX to Business Analyst (BA) will facilitate fewer iterations and higher quality iterations within a Business Intelligence project development life cycle.
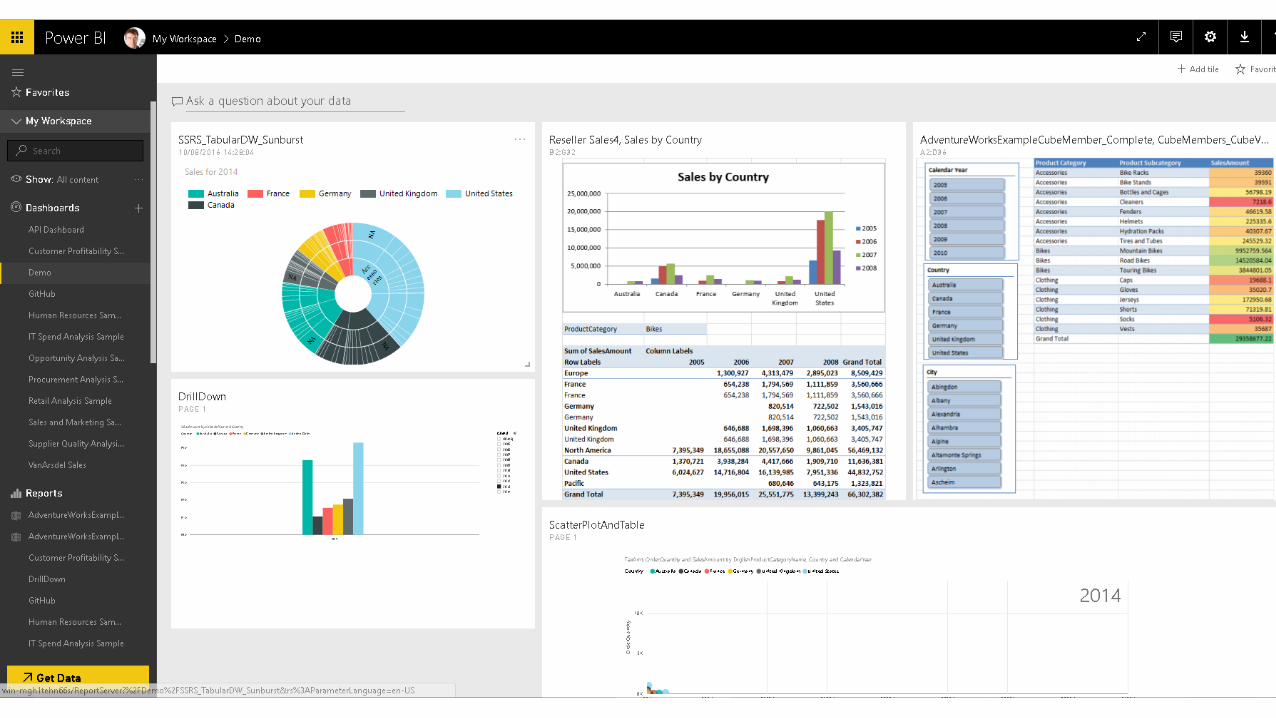

As indicated within the previous screen shot within the same Power BI Dashboard you can have..
• Power BI Reports, .e.g. Drill Down Chart and Scatter Plot with Play button,
• SSRS Sunburst Chart,
• Excel online chart,
• Excel online Pivot Table,
• Excel online Cube Members / Values
N.B. All the above can share the same data source and can have an automated refresh interval.

12. Finish
• It is a privilege to have the opportunity to be able to serve customers using Microsoft Business Intelligence related technologies.
• Any questions?
• E-mail - [email protected]
• LinkedIn – http://www.linkedin.com/in/kieranpatrickwood
• Twitter - https://twitter.com/KieranIBI
• Thank you