continuous surveys: statistical challenges and opportunities carl schmertmann center for demography...
Post on 21-Dec-2015
218 views
TRANSCRIPT
Continuous Surveys: Statistical Challenges and Opportunities
Carl SchmertmannCenter for Demography & Population HealthFlorida State University

Outline
CHALLENGES (long)
Increased Temporal Complexity Increased Sampling Error New Weighting Problems
OPPORTUNITIES (brief, but important)

Sample Size Comparison US CENSUS LONG FORM:
--- 17% / decade
ACS ROLLING SURVEY: 2 per 1000 Households / month 24 per 1000 Households / year 240 per 1000 Households / decade--- 24% / decade

Sampling Differences over Decade
Long Form ACS
Sample Size ≈ 17% ≈ 24%
Taken on… 1 day 3650 days
Released as… 1 dataset 10+ datasets
Simultaneous100% count? YES NO

1. Temporal Complexity
Long Form ACS
Sample Size ≈ 17% ≈ 24%
Taken on… 1 day 3650 days
Released as… 1 dataset 10+ datasets
Simultaneous100% count? YES NO
1. Temporal Complexity

What is the Population? 1-Day Census
Population membership is binary: {0,1}
Each individual is IN or OUT
Continuous Survey Population membership is fuzzy:
0 --------------- + ---------------1
Individuals can be MORE IN (more person-days of residence) or MORE OUT (fewer)
1. Temporal Complexity
1. Temporal Complexity
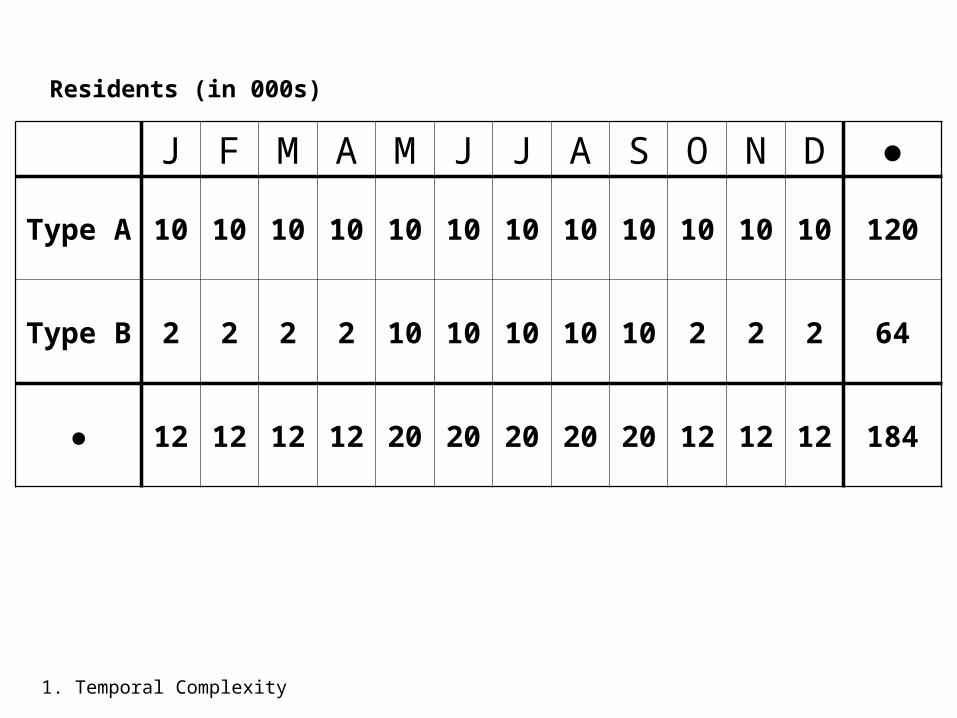
J F M A M J J A S O N D ●
Type A 10 10 10 10 10 10 10 10 10 10 10 10 120
Type B 2 2 2 2 10 10 10 10 10 2 2 2 64
● 12 12 12 12 20 20 20 20 20 12 12 12 184
Residents (in 000s)

1. Temporal Complexity
J F M A M J J A S O N D ●
Type A 10 10 10 10 10 10 10 10 10 10 10 10 120
Type B 2 2 2 2 10 10 10 10 10 2 2 2 64
● 12 12 12 12 20 20 20 20 20 12 12 12 184
Residents (in 000s)
Census Population = 12 000 (83% Type A)

1. Temporal Complexity
J F M A M J J A S O N D ●
Type A 10 10 10 10 10 10 10 10 10 10 10 10 120
Type B 2 2 2 2 10 10 10 10 10 2 2 2 64
● 12 12 12 12 20 20 20 20 20 12 12 12 184
Residents (in 000s)
An ACS ‘Data Sandwich’ includes samples from all months

1. Temporal Complexity
J F M A M J J A S O N D ●
Type A 10 10 10 10 10 10 10 10 10 10 10 10 120
Type B 2 2 2 2 10 10 10 10 10 2 2 2 64
● 12 12 12 12 20 20 20 20 20 12 12 12 184
Residents (in 000s)
ACS samples from 184 000 person-months Avg Population: 15 333 (65% Type A)

Characteristics change over the Sampling Period
Persons Age Marital Status Employment Education
Housing Units Vacancy Number of Occupants $ Value
1. Temporal Complexity

Rolling ‘Population’
Population formed by sandwiching monthly samples is the average frame of a film, not a snapshot
Individuals and housing units with changing characteristics are sampled and caught ‘in motion’.
1. Temporal Complexity

Reference Period Problems
Many ‘long-form’ questions refer to retrospective periods:
Income in last 12 months Place of residence 1 year ago Child born in last 12 months? Etc.
1. Temporal Complexity

Time Reference Example
‘2004’ data from 12 monthly samples taken in Jan04…Dec04
Question on fertility in the 12 months prior to the survey, so there are 12 overlapping periods in ‘2004’ data ‘Jan04’ question covers Jan03-Jan04 ‘Feb04’ question covers Feb03-Feb04 etc.
1. Temporal Complexity

Jan 2004 x x x x x x x x x x x x ● . . . . . . . . . . .Jan 03
Jan 04
Feb 2004 . x x x x x x x x x x x x ● . . . . . . . . . .Mar 2004 . . x x x x x x x x x x x x ● . . . . . . . . . Apr 2004 . . . x x x x x x x x x x x x ● . . . . . . . . May 2004 . . . . x x x x x x x x x x x x ● . . . . . . . Jun 2004 . . . . . x x x x x x x x x x x x ● . . . . . . Jul 2004 . . . . . . x x x x x x x x x x x x ● . . . . . Aug 2004 . . . . . . . x x x x x x x x x x x x ● . . . . Sep 2004 . . . . . . . . x x x x x x x x x x x x ● . . . Oct 2004 . . . . . . . . . x x x x x x x x x x x x ● . . Nov 2004 . . . . . . . . . . x x x x x x x x x x x x ● . Dec 2004 . . . . . . . . . . . x x x x x x x x x x x x ●
1
2
3
4
5
6
7
8
9 10 11 12 11 10 9 8 7 6 5 4 3 2 1
Jan 05
1. Temporal Complexity

1. Temporal Complexity
Reference Periods for ‘Last 12 Month’ Questions in 1-year ACS Datasets

Temporal Issues Summarized
‘Data Sandwiches’ contain: New meaning of ‘population’
Units that change over sampling period (moving targets)
Multiple reference periods for retrospective questions
1. Temporal Complexity

2. Sampling Error
Long Form ACS
Sample Size ≈ 17% ≈ 24%
Taken on… 1 day 3650 days
Released as… 1 dataset 10+ datasets
Simultaneous100% count? YES NO
2. Sampling Error
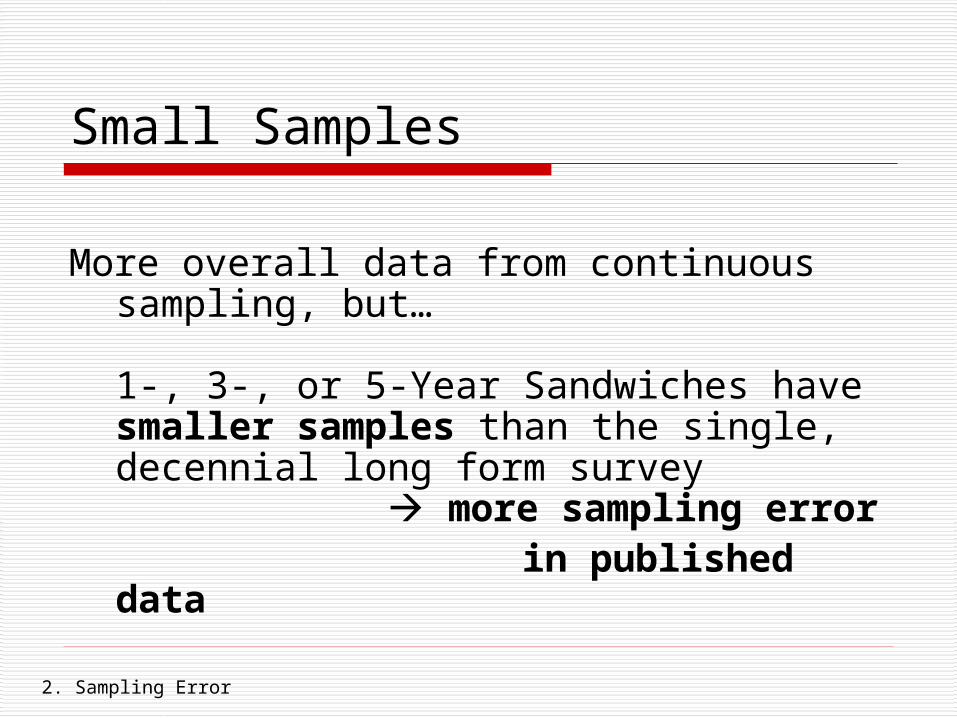
Small Samples
More overall data from continuous sampling, but…
1-, 3-, or 5-Year Sandwiches have smaller samples than the single, decennial long form survey more sampling error
in published data
2. Sampling Error

Small Samples
The problem is especially acute for small areas narrow age groups rare subpopulations
e.g., How many unmarried teen births per year in Sevier County, Tennessee?
ACS 2006-2008 says 0 ± 161
2. Sampling Error
2. Sampling Error
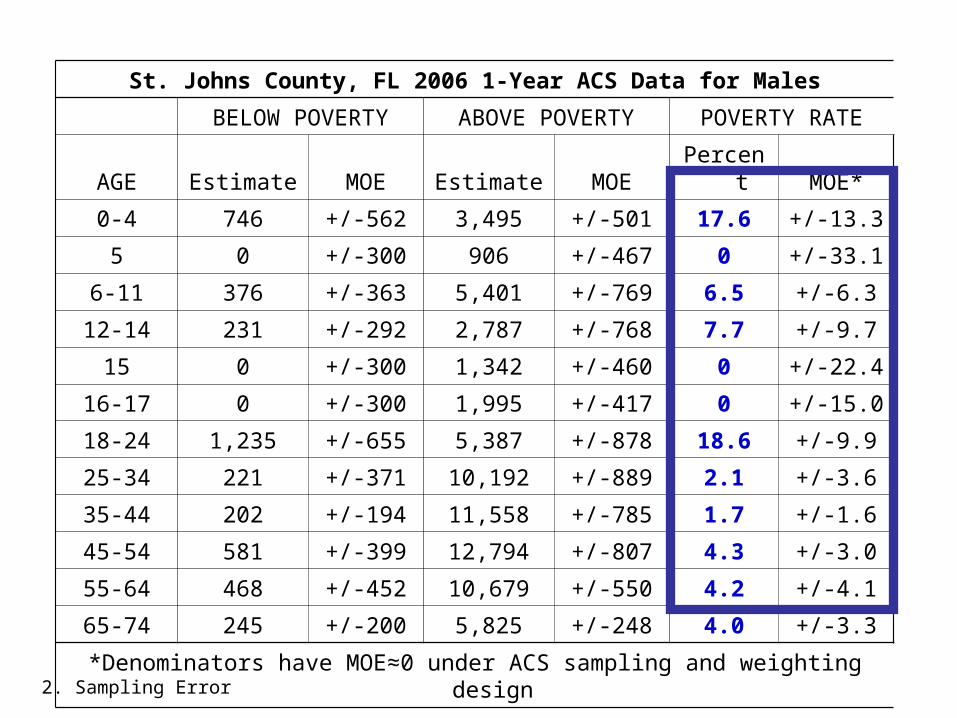
St. Johns County, FL 2006 1-Year ACS Data for Males
BELOW POVERTY ABOVE POVERTY POVERTY RATE
AGE Estimate MOE Estimate MOE Percent MOE*
0-4 746 +/-562 3,495 +/-501 17.6 +/-13.3
5 0 +/-300 906 +/-467 0 +/-33.1
6-11 376 +/-363 5,401 +/-769 6.5 +/-6.3
12-14 231 +/-292 2,787 +/-768 7.7 +/-9.7
15 0 +/-300 1,342 +/-460 0 +/-22.4
16-17 0 +/-300 1,995 +/-417 0 +/-15.0
18-24 1,235 +/-655 5,387 +/-878 18.6 +/-9.9
25-34 221 +/-371 10,192 +/-889 2.1 +/-3.6
35-44 202 +/-194 11,558 +/-785 1.7 +/-1.6
45-54 581 +/-399 12,794 +/-807 4.3 +/-3.0
55-64 468 +/-452 10,679 +/-550 4.2 +/-4.1
65-74 245 +/-200 5,825 +/-248 4.0 +/-3.3
*Denominators have MOE≈0 under ACS sampling and weighting design

2. Sampling Error
C24020. SEX BY OCCUPATION – Key West, Florida Data Set: 2006-2008 American Community Survey 3-Year Estimates (http://tinyurl.com/acs-alap)
…etc

Temporal Instability
Teenage Birth Rate in a County

Unfortunate Result
Aggregating over 1+ years of surveys produces datasets that are often
Unfamiliar and difficult to understand
Still too noisy to be useful for planners and researchers
2. Sampling Error

3. Weighting for Non-Response
Long Form ACS
Sample Size ≈ 17% ≈ 24%
Taken on… 1 day 3650 days
Released as… 1 dataset 10+ datasets
Simultaneous100% count? YES NO
3. Weighting Problems
Weighting
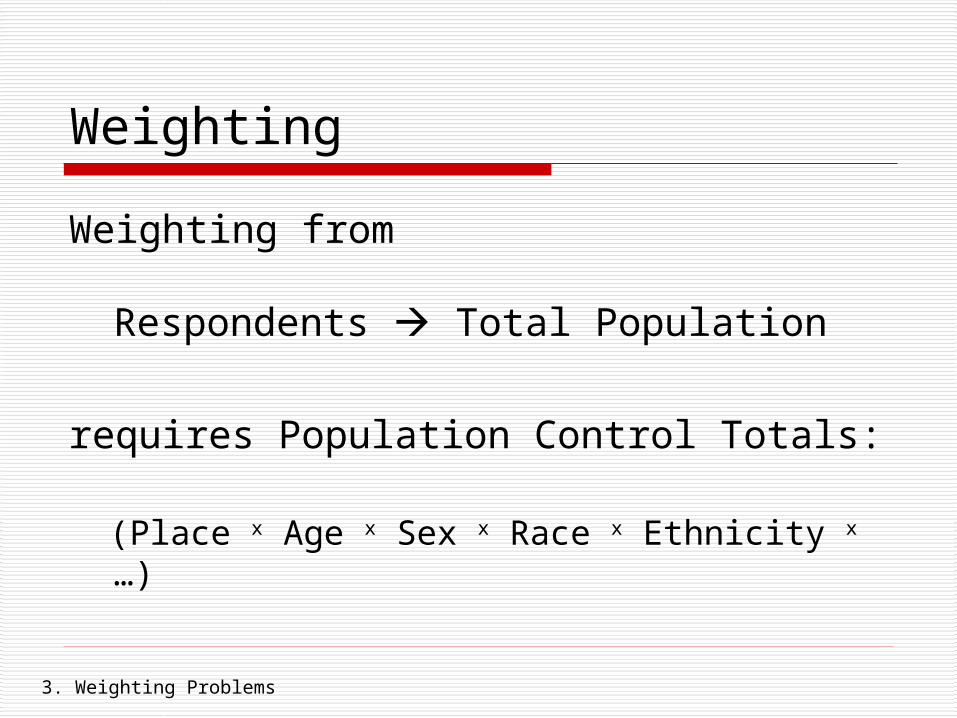
Weighting from
Respondents Total Population
requires Population Control Totals:
(Place x Age x Sex x Race x Ethnicity x …)
3. Weighting Problems

Decennial Long Form Sample Control Totals
Measured from a simultaneous
enumeration of the population(Sample & Census on same day)
Only 1 set needed
Sample and Population defined identically (resid. on Census Day)
3. Weighting Problems
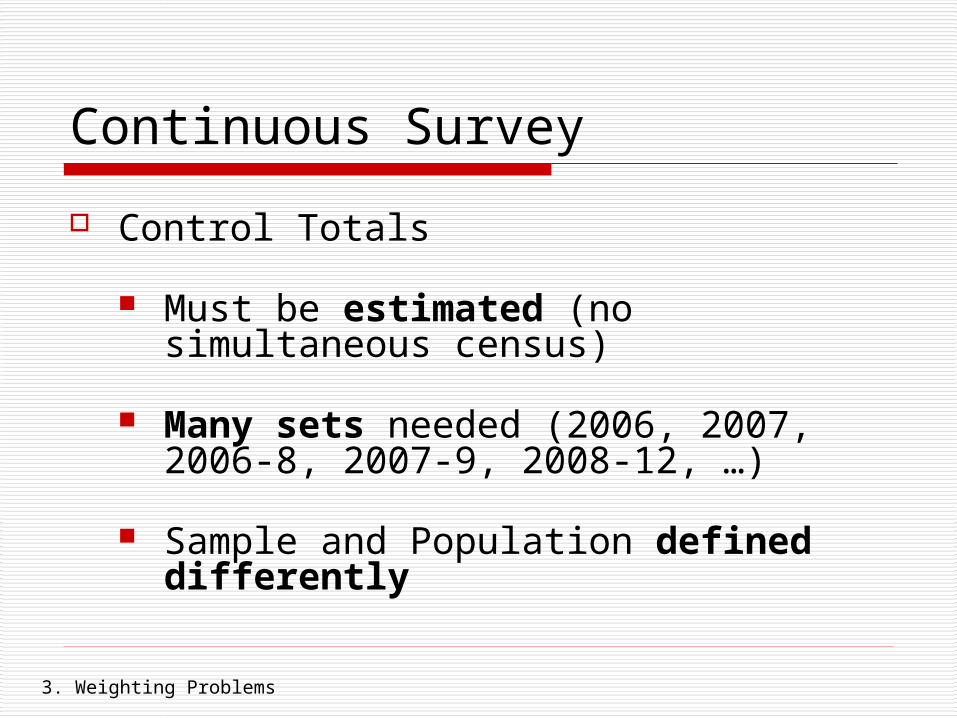
Continuous Survey
Control Totals Must be estimated (no simultaneous
census)
Many sets needed (2006, 2007, 2006-8, 2007-9, 2008-12, …)
Sample and Population defined differently
3. Weighting Problems

ACS Control Totals (Persons)
3. Weighting Problems
ACS responses are weighted to match official intercensal estimates by
• Year (1 July midpoint snapshot) • County (sometimes city)• Age• Race• Sex • Hispanic Origin (yes/no)

ACS Control Totals (Persons)
3. Weighting Problems
Potential Errors Estimates are Wrong:
Unanticipated internal migration Unanticipated international migration etc
Population Definition don’t match Seasonal fluctuations Different race/ethnic categories
3. Weighting Problems
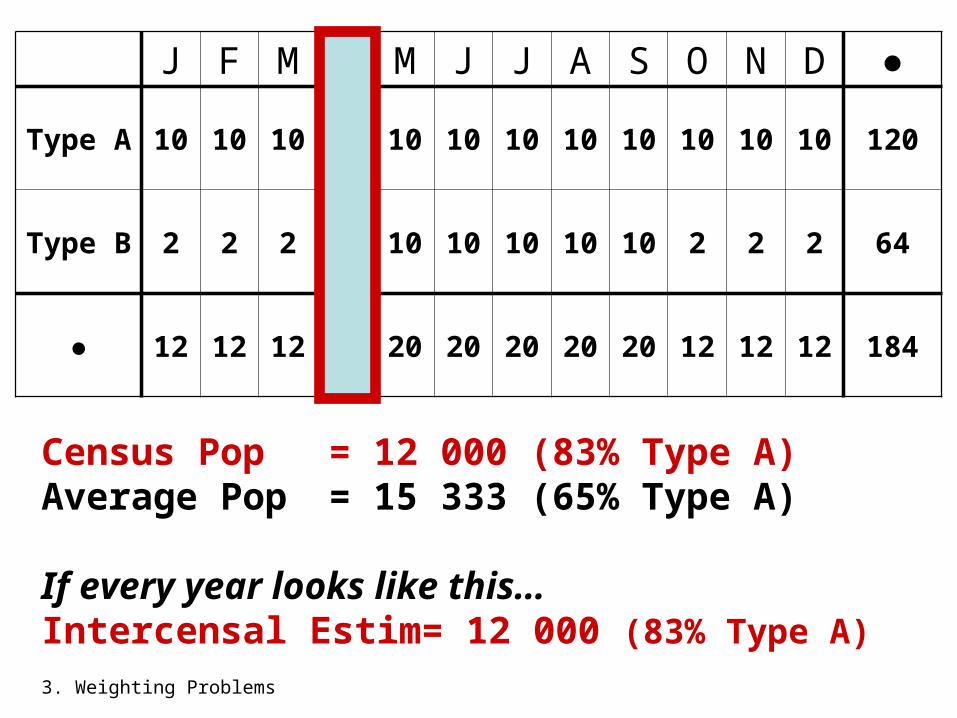
J F M A M J J A S O N D ●
Type A 10 10 10 10 10 10 10 10 10 10 10 10 120
Type B 2 2 2 2 10 10 10 10 10 2 2 2 64
● 12 12 12 12 20 20 20 20 20 12 12 12 184
Census Pop = 12 000 (83% Type A)Average Pop = 15 333 (65% Type A)
If every year looks like this…Intercensal Estim= 12 000 (83% Type A)
Weighting Error Example
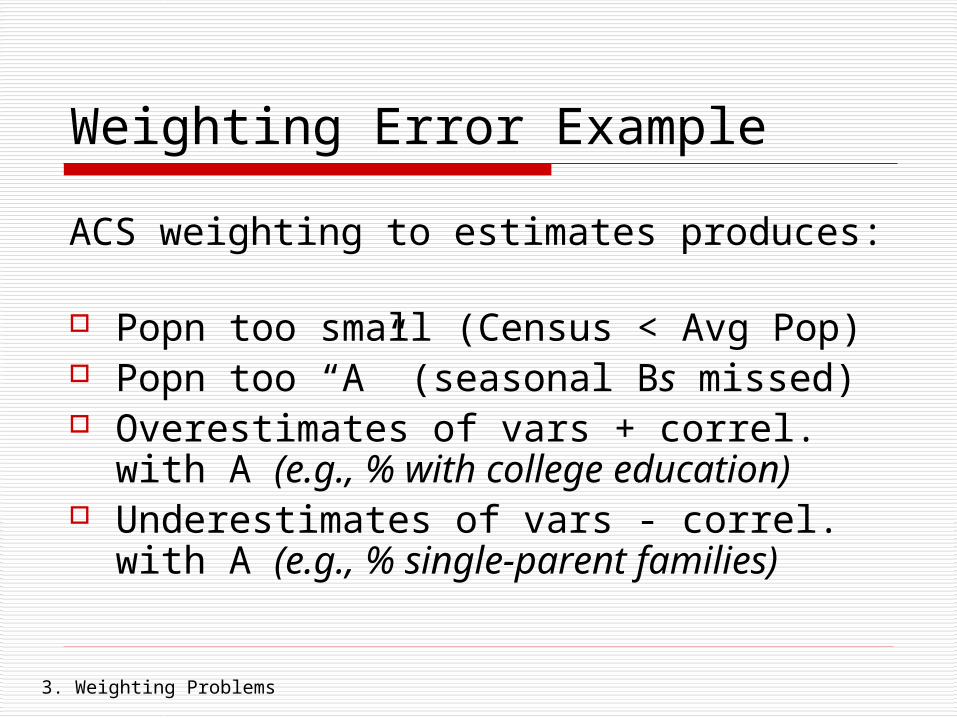
ACS weighting to estimates produces:
Popn too small (Census < Avg Pop) Popn too “A” (seasonal Bs missed) Overestimates of vars + correl. with A
(e.g., % with college education) Underestimates of vars - correl. with
A (e.g., % single-parent families)
3. Weighting Problems

Opportunities
CensusSurvey
ContinuousSurvey
Frequency
Recency
Sample Error
Familiarity
4. Opportunities

Statistical models that exploit likely cell relationships (over times, ages, sexes, places, variables …) could, in principle
Opportunities
ACS table cells = millions of “seemingly unrelated” maximum likelihood estimates
4. Opportunities
Retain frequency & recency Reduce variance of estimates Recover familiar measures
Conclusion
5. Conclusion
CONTINUOUS SURVEYS like ACS create
Big Problems for producers and users Unfamiliar, temporally complex data Potentially high sample error Technical problems with weighting
Big Opportunities, IF we can develop appropriate statistical models and practices

5. Conclusion
Thanks!
¡Gracias!
Obrigado!