continuous resistance welding of thermoplastic composites ... · submitted to composites part a:...
TRANSCRIPT

Submitted to Composites Part A: Applied Science and Manufacturing
1
Continuous resistance welding of thermoplastic composites: modelling
of heat generation and heat transfer
Huajie Shi1, Irene Fernandez Villegas1*, Marc-André Octeau2, Harald E.N. Bersee1, Ali Yousefpour2
1Structural Integrity & Composites, Faculty of Aerospace Engineering, Delft University of Technology,
Kluyverweg 1, 2629 HS Delft, the Netherlands
2Aerospace Portfolio, National Research Council Canada, 5145 Decelles Avenue, Montréal, Québec, H3T
2B2, Canada
* Corresponding author: Irene Fernandez Villegas ([email protected])
Tel: +31(0)15 278 9745; Fax: +31(0)15 278 1151
Email of other authors: H.Shi ([email protected]); Marc-André Octeau ([email protected]);
Harald E. N. Bersee ([email protected]); Ali Yousefpour ([email protected])
Abstract
A process model composed of electrical and heat transfer models was developed to simulate continuous
resistance welding of thermoplastic composites. Glass fabric reinforced polyphenylenesulfide welded in a
lap-shear configuration with a stainless steel mesh as the heating element was considered for modelling
and experimental validation of the numerical results. The welding temperatures predicted by the model
showed good agreement with the experimental results. Welding input power and welding speed were
found to be the two most important parameters influencing the welding temperature. The contact quality
between the electrical connectors and the heating element was found to influence the distribution of the
welding temperature transverse to the welding direction. Moreover, the size of the electrical connectors
was found to influence the achievable welding speed and required power input for a certain welding
temperature.
Keywords
A. Polymer-matrix composites (PMCs); A. Thermoplastic resin; E. Joints/joining
1. Introduction
Compared with thermoset composites, thermoplastic composite materials have several advantages such as
intrinsically higher toughness, better environmental resistance, and sustainability [1, 2]. Furthermore,
thermoplastic composites offer the possibility of cost-effective manufacturing and assembling through

Submitted to Composites Part A: Applied Science and Manufacturing
2
thermoforming and welding [3, 4]. Resistance welding has been identified as one of the most promising
welding techniques for joining thermoplastic composites [5-7]. It features short cycle times and
potentially inexpensive equipment requirements. Static resistance welding (RW), which entails one-shot
welding of the entire welding area, has been widely used for welding of coupons or small- to medium-
size components [8-12]. However, for larger applications, RW has some drawbacks such as significant
non-uniform temperature distribution at the weld interface, high force needs to be applied on the
adherends, difficulties to maintain uniform pressure at the weld area and a high power demand [5, 11].
Sequential resistance welding (SRW) was introduced to address these issues [13, 14]. SRW relies on the
use of multiple heating elements for a multiple-step welding process, and it successfully overcomes some
of the drawbacks of RW for the welding of large parts. However, it introduces some difficulties derived
from the handling of multiple heating elements [13, 14]. More recently, a continuous resistance welding
(CRW) process has been developed [15]. CRW simplifies the welding process as compared to SRW by
using a single-piece heating element and a rack of multiple adjacent copper block connectors, which are
parallel to the welding direction and located on both sides of the welding overlap, as depicted in Figure 1.
Two copper wheels, connected to the power supply unit, are rolled along the block connectors to generate
heat and to create a local molten zone, which moves along the entire welding overlap. Compared to RW,
both SRW and CRW introduce new parameters in the welding process and, hence increased complexity
but they make it possible to weld larger areas with minimum force and power requirements.
As shown in literature, process modelling combined with experimental validation allows for a better
understanding of welding processes and the influence of critical parameters [16-21]. Until now,
substantial effort has been devoted to the development of process models for the RW process but no
simulation model is available in the open literature for the SRW or the CRW processes. The bigger
complexity of both SRW and CRW however justifies the development of dedicated models to improve
our understanding of the processes and to fully profit from their advantages.
The objective of this study is to investigate the thermal behaviour of thermoplastic composites during the
CRW process as well as the influence of the key welding parameters on the welding temperature. To this
aim, a dedicated 3D process model was developed consisting of an electrical and a heat transfer model.
The electrical model provided the distribution of resistive heat generation in the heating element. The heat
transfer model used this distribution to simulate the welding temperature. Likewise, a parametric study

Submitted to Composites Part A: Applied Science and Manufacturing
3
was conducted to understand the effects of electrical clamping pressure, input power, welding speed and
size of the electrical connectors on the welding temperature.
2. Experimental
2.1. Materials
The thermoplastic composite material used in this study was 8HS woven E-glass fabric reinforced
polyphenylenesulfide (GF/PPS). GF/PPS laminates were manufactured out of eight layers of CETEX®
GF/PPS prepreg, supplied by Ten Cate Advanced Composites, The Netherlands, with a [(0°/90°)]4S
stacking sequence. The stack of prepreg was consolidated in a hot platen press at 320 °C and under 1.0
MPa pressure for 15 minutes to obtain 1.9 mm-thick laminates with 50% resin volume fraction.
A plain woven AISI 304L stainless steel mesh, with a wire diameter of 0.04 mm, a gap of 0.09 mm
between consecutive wires, and 0.08 mm thickness, was used as the heating element. Stainless steel mesh
sheets, dimensions 254 mm × 60 mm, were used at the welding interface. In order to fill the gaps of the
mesh and to provide a resin rich area at the welding interface, one layer of 90 µm-thick neat PPS film was
placed between the mesh and each adherend prior to welding.
2.2. Continuous resistance welding
The continuous resistance welding setup developed by the National Research Centre of Canada was used
in this study [15]. As shown in Figures 2 and 3, the welding setup consisted of a power supply, a
pneumatic system for welding compaction, a pneumatic system for electrical clamping, a linear actuator
system, block and wheel connectors and thermal insulators. An XDC 60-200 digital DC power supply,
Imax = 200 A and Umax = 60 V, was used to provide the welding input power. For thermal insulation,
12.7 mm-thick GPO3 fibre glass sheets, provided by K-Mac-Plastics (USA), were placed below and
above the adherends. As shown in Figure 3, single-lapped GF/PPS joints were welded with an
overlapping area of 254 mm × 25.4 mm. Two racks of electrical connectors, each one consisting of
twenty copper blocks were used to introduce the electrical power into the heating element. Each copper
block was 16 mm long, 12.7 mm wide and 6 mm high. One rack of these block connectors was placed on
top of one of the adherends and the other one was placed underneath the other adherend to weld a single
lap joint (see Figure 3). A 1 mm-long clamping distance [12] was left between the edges of the overlap
and the block connectors. A 55 N electrical clamping force, which equals to approximately 0.30 MPa
clamping pressure, was applied to the block connectors through two copper wheel connectors connected
to the power supply unit and to a pneumatic cylinder (see Figure 2). Likewise, 500 N welding compaction

Submitted to Composites Part A: Applied Science and Manufacturing
4
force was applied to the welding stack through a series of adjacent compaction rollers connected to a
second pneumatic cylinder. During the welding process, the platform on which the adherends, heating
element, insulator blocks and block connectors were located was horizontally displaced by a high torque
step motor. The connector wheels and the compaction rollers, the support of which remained stationary,
were consequently forced to roll at the same constant speed on top of the block connectors and the
uppermost insulation block, respectively. An in-house developed LabView program was used to control
and record the main welding parameters, namely input power and welding speed, as well as thermocouple
readings during the welding process. The welding process was carried out at a constant welding voltage
of 4.3 V.
3. Modelling
A flowchart for the CRW process model is presented in Figure 4. This process model is divided into an
electrical model and a thermal model. The electrical model was developed to simulate the resistive heat
generation rate, Q̇ (W/m3), at the welding interface. This heat generation rate was then entered in the
thermal model, which provided the welding temperature during the welding process.
3.1. Electrical model
An electrical model was developed to calculate the resistive heat generation rate, Q,̇ in the heating
element as a function of the position of the connector wheels and the input power. The input power
effectively used to generate heat at the heating element and the electrical properties of the heating element
had to be determined as preliminary steps for the building of the electrical model.
3.1.1. Effective input power
Owing to internal and contact resistance in the electrical circuit of the welding setup, not all the power
consumed during the welding process was effectively used to generate heat at the welding interface. The
contact resistance between the mesh heating element and the block connectors was considered to be the
major source of power not effectively used for heat generation at the welding interface in the CRW
process. The internal resistance of the connector wheels and the block connectors as well as the contact
resistance between them were neglected due to the low resistivity of copper and the smoothness of their
contact surfaces.
Clamping force and contact resistance

Submitted to Composites Part A: Applied Science and Manufacturing
5
As already known from literature, the clamping pressure applied between the connectors and the heating
element plays a major role in the contact resistance [11]. In order to determine the relationship between
clamping pressure and contact resistance in the CRW process, a separate experimental setup was built to
measure the resistance of the heating element between two connector blocks under various clamping
pressures (Figure 5). The experimental setup consisted of two 16 × 12.7 × 6 mm3 block connectors
located 27.4 mm apart in the middle of a 254 mm × 60 mm mesh sheet, as shown in Figure 5. The
dimensions of the blocks and mesh as well as the distance between blocks were chosen to mimic the
welding setup. A pneumatic cylinder was used to provide different levels of clamping pressure, ranging
from 0.01 MPa to 4.8 MPa, between the connector blocks and the mesh. A 1.92 A DC current was
applied between the block connectors. The voltage difference between the block connectors was
measured using a TTi1906 multimeter and the corresponding electrical resistance was calculated using
Ohm’s law.
As shown in Figure 5, the electrical resistance between the two block connectors was found to decrease
with increasing clamping pressure, as indicated in literature [11, 22]. The reduction in total resistance
with increasing clamping pressure was attributed to more effective contact between the heating element
and the electrical connectors. For clamping pressures below 0.2 MPa, relatively large deviations were
observed in the resistance values. This could be the result of too small contact surface between the
heating element and the electrical connectors. On the other hand, increasing the clamping pressure above
1 MPa showed no significant influence in the resistance values. Therefore the contact resistance was
considered to be negligible at clamping pressures above 1 MPa.
Contact resistance in the CRW setup
The contact resistance in the actual CRW setup, Rc, was experimentally determined through the following
steps:
i. The resistance of the welding circuit, Rtotal, was calculated by dividing the total welding voltage
by the current recorded during the welding process.
ii. The resistance of the mesh, Rmesh, was measured using the experimental setup in Figure 5 for
different positions of the connector blocks along the welding direction and a clamping pressure
of 4 MPa, at which Rc was considered to be negligible.
iii. The contact resistance, Rc, was calculated as Rc = Rtotal - Rmesh
Submitted to Composites Part A: Applied Science and Manufacturing
6
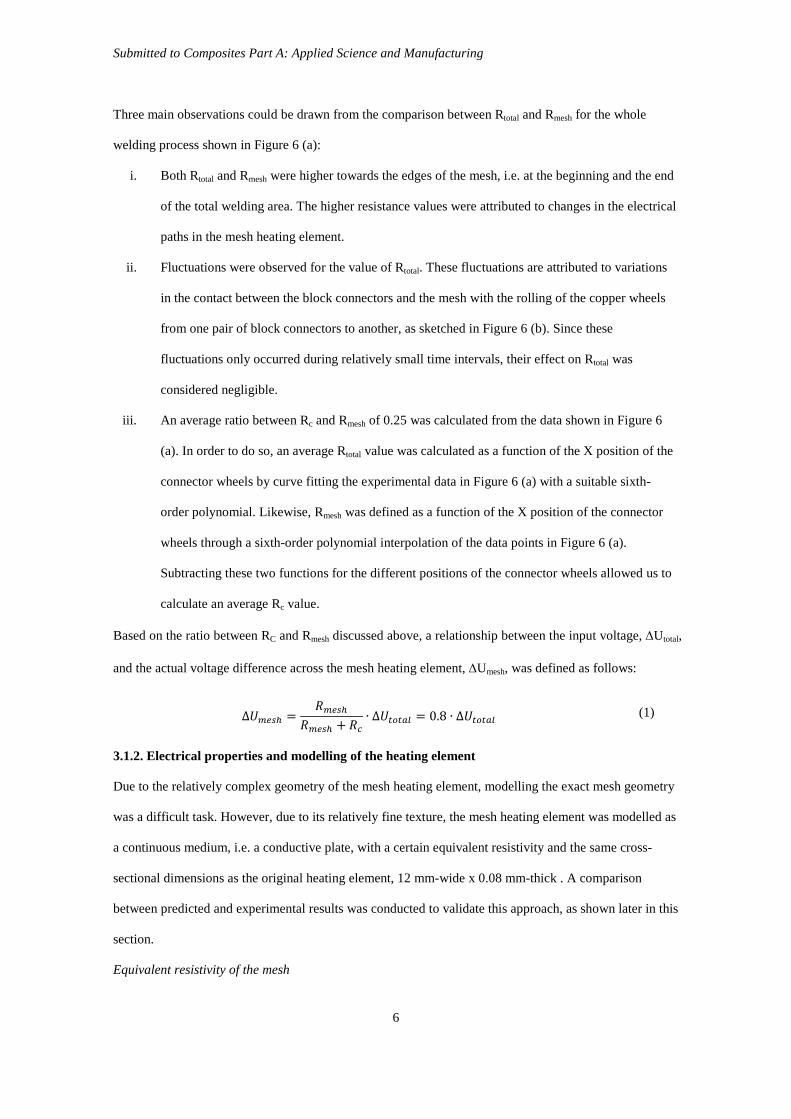
Three main observations could be drawn from the comparison between Rtotal and Rmesh for the whole
welding process shown in Figure 6 (a):
i. Both Rtotal and Rmesh were higher towards the edges of the mesh, i.e. at the beginning and the end
of the total welding area. The higher resistance values were attributed to changes in the electrical
paths in the mesh heating element.
ii. Fluctuations were observed for the value of Rtotal. These fluctuations are attributed to variations
in the contact between the block connectors and the mesh with the rolling of the copper wheels
from one pair of block connectors to another, as sketched in Figure 6 (b). Since these
fluctuations only occurred during relatively small time intervals, their effect on Rtotal was
considered negligible.
iii. An average ratio between Rc and Rmesh of 0.25 was calculated from the data shown in Figure 6
(a). In order to do so, an average Rtotal value was calculated as a function of the X position of the
connector wheels by curve fitting the experimental data in Figure 6 (a) with a suitable sixth-
order polynomial. Likewise, Rmesh was defined as a function of the X position of the connector
wheels through a sixth-order polynomial interpolation of the data points in Figure 6 (a).
Subtracting these two functions for the different positions of the connector wheels allowed us to
calculate an average Rc value.
Based on the ratio between RC and Rmesh discussed above, a relationship between the input voltage, ∆Utotal,
and the actual voltage difference across the mesh heating element, ∆Umesh, was defined as follows:
∆𝑈𝑈𝑚𝑚𝑚𝑚𝑚𝑚ℎ =𝑅𝑅𝑚𝑚𝑚𝑚𝑚𝑚ℎ
𝑅𝑅𝑚𝑚𝑚𝑚𝑚𝑚ℎ + 𝑅𝑅𝑐𝑐∙ ∆𝑈𝑈𝑡𝑡𝑡𝑡𝑡𝑡𝑡𝑡𝑡𝑡 = 0.8 ∙ ∆𝑈𝑈𝑡𝑡𝑡𝑡𝑡𝑡𝑡𝑡𝑡𝑡 (1)
3.1.2. Electrical properties and modelling of the heating element
Due to the relatively complex geometry of the mesh heating element, modelling the exact mesh geometry
was a difficult task. However, due to its relatively fine texture, the mesh heating element was modelled as
a continuous medium, i.e. a conductive plate, with a certain equivalent resistivity and the same cross-
sectional dimensions as the original heating element, 12 mm-wide x 0.08 mm-thick . A comparison
between predicted and experimental results was conducted to validate this approach, as shown later in this
section.
Equivalent resistivity of the mesh

Submitted to Composites Part A: Applied Science and Manufacturing
7
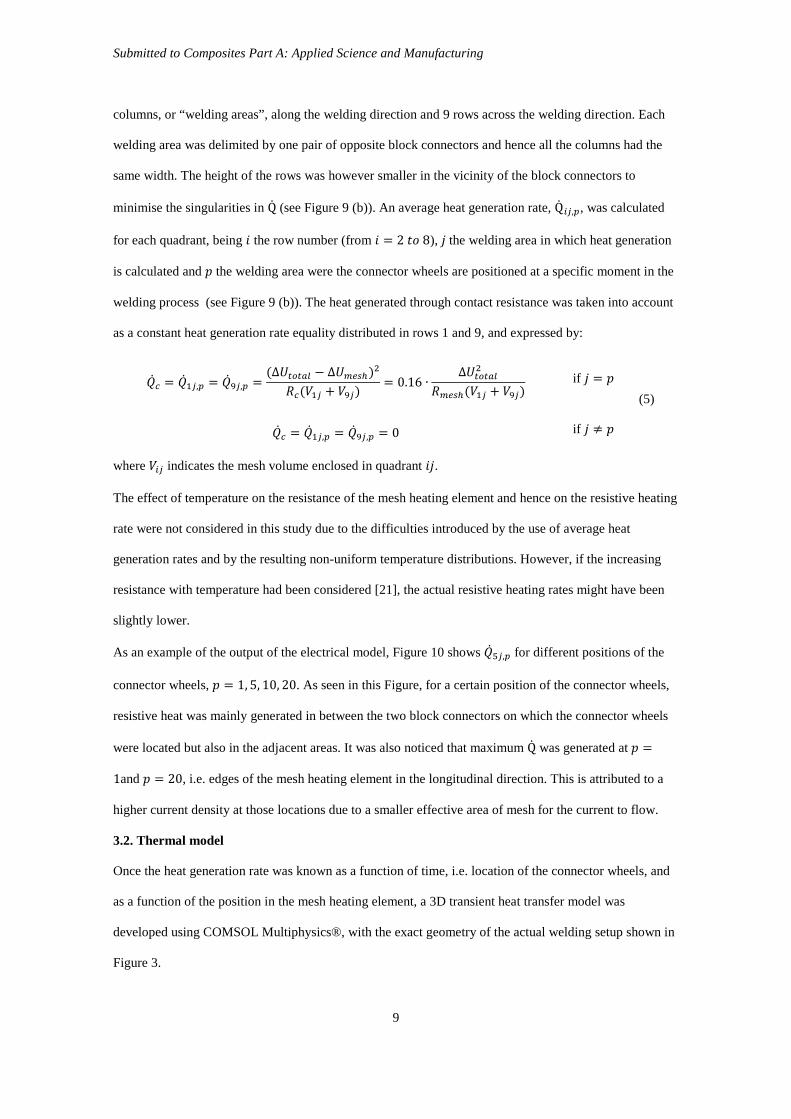
The equivalent resistivity of the mesh heating element was determined by measuring the resistance of a
mesh strip at various measurement lengths in the experimental setup depicted in Figure 7. In this setup a
12 mm-wide mesh strip and two 16 x 12.7 x 6 mm3 block connectors were used. A clamping pressure of
4 MPa was applied between the connectors and the mesh. A constant 1.92 A DC current was applied
between the connectors. The voltage difference between the connectors was measured using a TiT1906
multimeter and the resistance of the mesh was calculated using Ohm’s law.
The results of these measurements are displayed in Figure 7. An equivalent resistivity for the mesh
heating element amounting to ρ = 7.41e-6 Ω·m was calculated using curve fitting of the resistance
measurements and the following formula for the resistivity of a continuous medium:
𝜌𝜌 =∆𝑅𝑅
∆𝐿𝐿/(𝑤𝑤 ∙ ℎ) (2)
where, L is the length of the mesh strip, w is the width of the conductive plate (w = 12mm), and h is the
thickness of the conductive plate (h = 0.08 mm). ∆R, i.e. the resistance difference between two different
lengths of heating element, was used in this calculation to rule out the effect of any potential contact
resistance (although assumed to be negligible at 4 MPa clamping pressure).
It must be noted that he equivalent resistivity obtained for the heating element, 7.41e-6 Ω·m, was one
order of magnitude higher than the electrical resistivity reported in literature for AISI 304L stainless steel,
7.2e-7 Ω·m [22]. This resulted from considering the heating element as a conductive plate with the same
electrical resistance as the stainless steel mesh heating element. If the actual cross section of the mesh had
been considered for calculating the electrical resistivity from the results presented in Figure 7, the
experimental resistivity of the mesh would have amounted to 8.56e-7 Ω·m, assuming that only the wires
that are connected to both connectors at the same time conduct the electricity and, hence, that the current
flows in straight lines between the connectors . In that case, the value for the experimental resistivity of
the mesh is similar but somewhat higher than the electrical resistivity of AISI 304L. This difference could
be caused by the existence of some extra current flow paths additional to the ones considered to calculate
the resistivity of the mesh.
Validation of mesh heating element as an equivalent conductive plate
In order to validate the approach of modelling the heating element as a continuous medium, i.e. a
conductive plate, characterised by 7.41e-6 Ω·m equivalent resistivity and 12 mm-wide x 0.08 mm-thick
cross section the experiment depicted in Figure 5 was modelled using COMSOL Multiphysics®.

Submitted to Composites Part A: Applied Science and Manufacturing
8
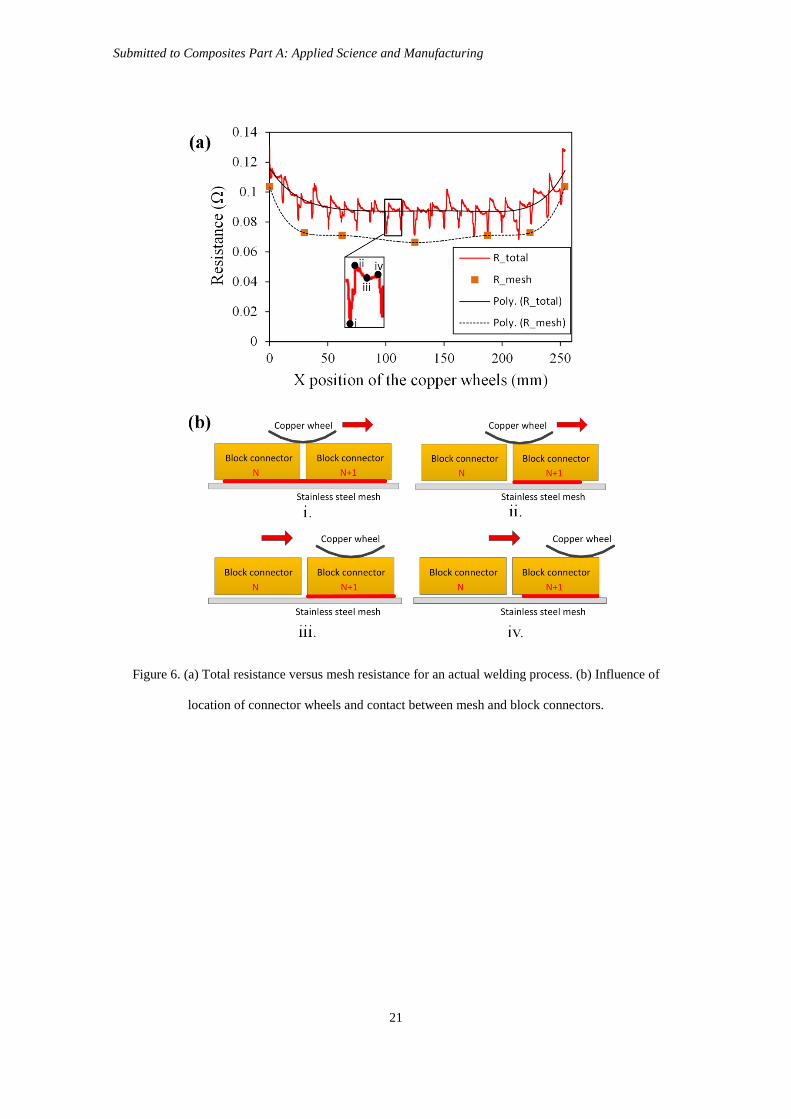
Applying a constant current of 1.92 A to the electrical connectors, the voltage distribution in the mesh
was predicted for various X-positions of the electrical connectors, see Figure 8 (a). Voltage differences,
ΔU, across the stainless steel mesh in the actual experiment were measured using a voltmeter with wire
probes in direct contact with the surface of the mesh and separated by 25.4 mm. A comparison of the
voltage predicted by the model with the experimental measurements is shown in Figure 8 (b). As a result
of the good agreement between the predicted and experimental results for ΔU, the approach of modelling
the stainless steel mesh as a conductive plate was validated. Other observations drawn by the results in
Figure 8 (b) are:
i. ΔU changes with the X position of the measurement points. A higher value of ΔU is obtained in
the vicinity of the block connectors, implying that, as expected, the welding energy is mainly
concentrated in the area between the two block connectors.
ii. ΔU is dependent on the X position of the block connectors. A higher ΔU, and hence a higher
resistance of the welding electrical circuit, is obtained when the block connectors are located
near the edges of the mesh. This result is in accordance with the results presented in Figure 6.
3.1.3. Resistive heat generation rate
A 3D COMSOL Multiphysics® electrical model (conductive media DC application mode) was created to
predict the rate at which heat is generated at every location of the mesh heating element for every position
of the copper wheel connectors. The model is based on the following equations:
𝛻𝛻 ∙ 𝑱𝑱 = −𝛻𝛻 ∙ �𝛻𝛻𝛻𝛻𝜌𝜌� = 0 (3)
�̇�𝑄 = 𝜌𝜌𝑱𝑱2 (4)
where J is the current density vector, V is the electric potential in the mesh heating element, 𝜌𝜌 is the
electrical resistivity, and Q̇ is the rate at which resistive heating is generated by the mesh. It must be noted
that, owing to the contact resistance, the electric potential at different locations in the mesh corresponded
to an actual input voltage of 0.8 times the total input voltage, as indicated in Eq. 1.
Modelling the resistive heat generation rate, Q̇, as a continuous function of the position in the mesh
heating element was found to cause singularities around the corners of the block connectors (see Figure 9
(a)). Such singularities, which are believed to mainly result from geometrical discontinuities, were
effectively smoothed by treating Q̇ as a discrete function of the position in the mesh heating element. As
shown in Figure 9 (b), the mesh heating element was hence discretized into a matrix consisting of 20
Submitted to Composites Part A: Applied Science and Manufacturing
9
columns, or “welding areas”, along the welding direction and 9 rows across the welding direction. Each
welding area was delimited by one pair of opposite block connectors and hence all the columns had the
same width. The height of the rows was however smaller in the vicinity of the block connectors to
minimise the singularities in Q̇ (see Figure 9 (b)). An average heat generation rate, Q̇𝑖𝑖𝑖𝑖,𝑝𝑝, was calculated
for each quadrant, being 𝑖𝑖 the row number (from 𝑖𝑖 = 2 𝑡𝑡𝑡𝑡 8), 𝑗𝑗 the welding area in which heat generation
is calculated and 𝑝𝑝 the welding area were the connector wheels are positioned at a specific moment in the
welding process (see Figure 9 (b)). The heat generated through contact resistance was taken into account
as a constant heat generation rate equality distributed in rows 1 and 9, and expressed by:
�̇�𝑄𝑐𝑐 = �̇�𝑄1𝑖𝑖,𝑝𝑝 = �̇�𝑄9𝑖𝑖,𝑝𝑝 =(∆𝑈𝑈𝑡𝑡𝑡𝑡𝑡𝑡𝑡𝑡𝑡𝑡 − ∆𝑈𝑈𝑚𝑚𝑚𝑚𝑚𝑚ℎ)2
𝑅𝑅𝑐𝑐(𝛻𝛻1𝑖𝑖 + 𝛻𝛻9𝑖𝑖)= 0.16 ∙
∆𝑈𝑈𝑡𝑡𝑡𝑡𝑡𝑡𝑡𝑡𝑡𝑡2
𝑅𝑅𝑚𝑚𝑚𝑚𝑚𝑚ℎ(𝛻𝛻1𝑖𝑖 + 𝛻𝛻9𝑖𝑖) if 𝑗𝑗 = 𝑝𝑝
(5)
�̇�𝑄𝑐𝑐 = �̇�𝑄1𝑖𝑖,𝑝𝑝 = �̇�𝑄9𝑖𝑖,𝑝𝑝 = 0 if 𝑗𝑗 ≠ 𝑝𝑝
where 𝛻𝛻𝑖𝑖𝑖𝑖 indicates the mesh volume enclosed in quadrant 𝑖𝑖𝑗𝑗.
The effect of temperature on the resistance of the mesh heating element and hence on the resistive heating
rate were not considered in this study due to the difficulties introduced by the use of average heat
generation rates and by the resulting non-uniform temperature distributions. However, if the increasing
resistance with temperature had been considered [21], the actual resistive heating rates might have been
slightly lower.
As an example of the output of the electrical model, Figure 10 shows �̇�𝑄5𝑖𝑖,𝑝𝑝 for different positions of the
connector wheels, 𝑝𝑝 = 1, 5, 10, 20. As seen in this Figure, for a certain position of the connector wheels,
resistive heat was mainly generated in between the two block connectors on which the connector wheels
were located but also in the adjacent areas. It was also noticed that maximum Q̇ was generated at 𝑝𝑝 =
1and 𝑝𝑝 = 20, i.e. edges of the mesh heating element in the longitudinal direction. This is attributed to a
higher current density at those locations due to a smaller effective area of mesh for the current to flow.
3.2. Thermal model
Once the heat generation rate was known as a function of time, i.e. location of the connector wheels, and
as a function of the position in the mesh heating element, a 3D transient heat transfer model was
developed using COMSOL Multiphysics®, with the exact geometry of the actual welding setup shown in
Figure 3.

Submitted to Composites Part A: Applied Science and Manufacturing
10
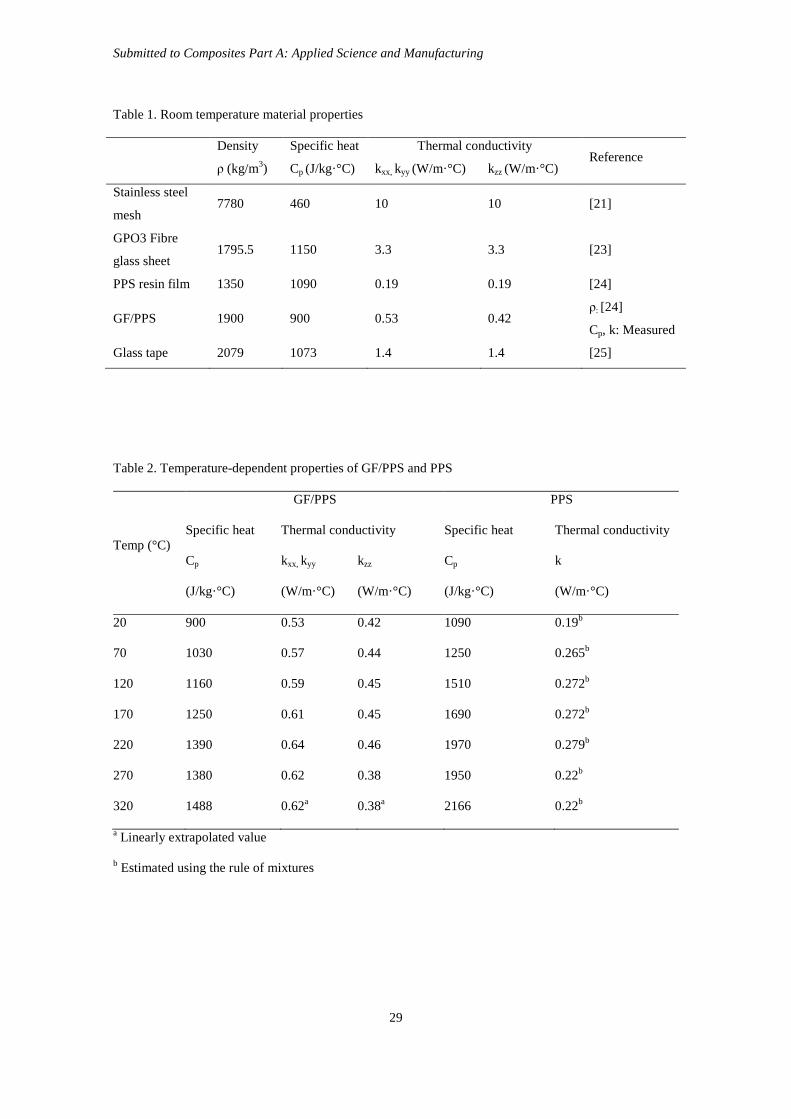
The material properties used by this model are summarized in Tables 1 and 2. The temperature-dependent
specific heat of the GF/PPS laminates and the PPS film, shown in Table 2, were measured through
differential scanning calorimetry (DSC) according to ASTME1269-11. The temperature-dependent
thermal conductivity of the GF/PPS laminates was measured in the laboratories of Koninklijke DSM N.V.,
the Netherlands, using the laser flash method. The temperature dependent thermal conductivity of the PPS
film was estimated using the rule of mixtures in Eq. 6.
𝑘𝑘𝑚𝑚 =(1 − 𝛻𝛻𝑓𝑓)𝑘𝑘𝑐𝑐𝑘𝑘𝑓𝑓𝑘𝑘𝑓𝑓 − 𝛻𝛻𝑓𝑓𝑘𝑘𝑐𝑐
(6)
The heat transfer model was based on the heat transfer equation:
𝜌𝜌𝐶𝐶𝑝𝑝𝜕𝜕𝜕𝜕𝜕𝜕𝑡𝑡
+ 𝛻𝛻 ∙ (−𝑘𝑘𝛻𝛻𝜕𝜕) = �̇�𝑄 (7)
where ρ is density, Cp is heat capacity, T is temperature, t is welding time, and k is thermal conductivity.
The effect of the latent heat during melting of the polymer on the heat transfer problem was found to be
negligible as in [12, 20, 26, 27], and therefore it was not taken into account in the model.
The boundary conditions were set as free convection and surface-ambient radiation, and described by the
following equation:
4 4- (- ) ( ) ( )amb ambn k T h T T T Tεσ⋅ ∇ = - + - (8)
where n is the normal vector of the boundary, h is the free convection coefficient to air (h = 5 W/m2K)
[28], Tamb is ambient temperature (Tamb = 20 ℃), ε is surface emissivity (ε = 0.95) [28] and σ is the
Stefan-Boltzmann constant (σ = 5.67 × 10⁻⁸ W/m2K).
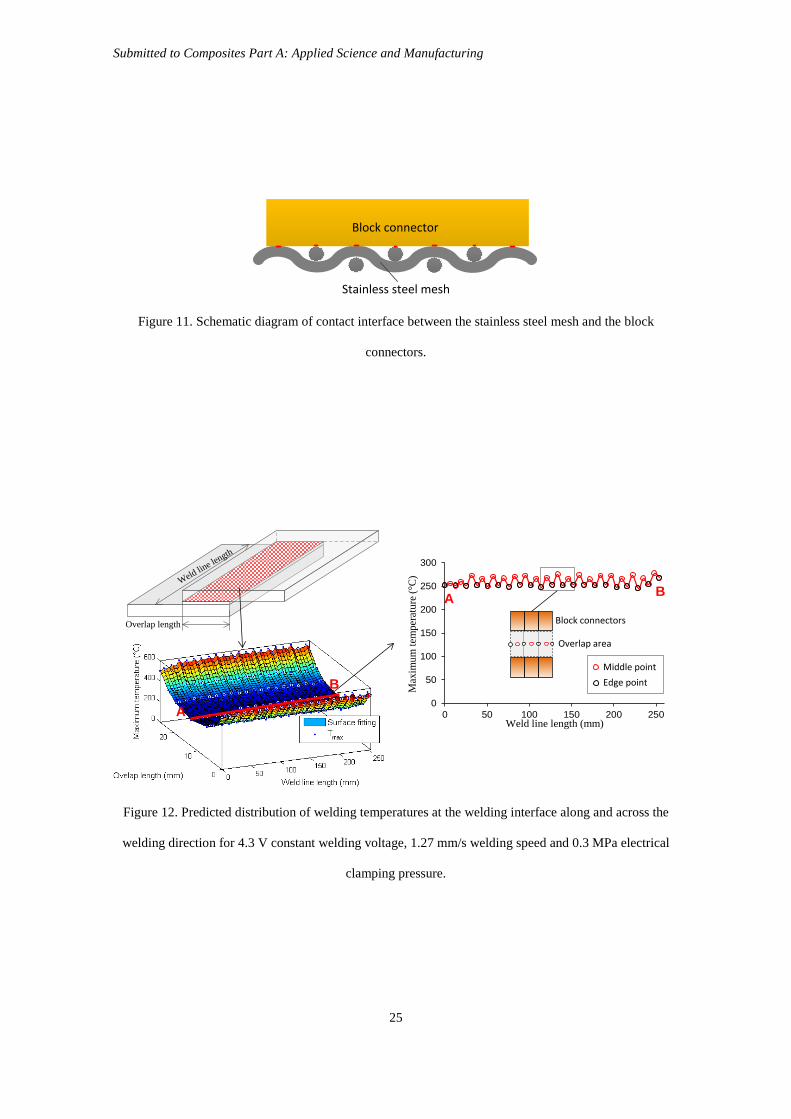
Concerning the heat transfer between the block connectors and the mesh heating element, the actual
contact area between both elements was much smaller than the total clamping area due to the open gaps
in the mesh and due to its woven nature, as sketched in Figure 11. Consequently, the model did not
consider conductive heat transfer between the block connectors and the mesh heating element. Instead a
more restrictive heat transfer scenario, described by a fixed heat flux from the mesh to the connectors (Eq.
9) with a heat flux coefficient h = 5W/m2K [28], was considered between the heating element and the
blocks connectors.
- (- ) ( )ambn k T h T T⋅ ∇ = - (9)
4. Results and discussion
4.1. Temperature distribution predicted by the model

Submitted to Composites Part A: Applied Science and Manufacturing
11
A typical distribution of maximum welding temperatures at the welding interface as predicted by the
process model is shown in Figure 12. Non-uniform temperature profiles were found both along and across
the welding direction.
Along the welding direction, a relatively small temperature oscillation could be observed as shown in
Figure 12. Higher temperatures could be found in the middle of each individual welding area (indicated
by a red circle in Figure 12 right) than at the edges (indicated by black circles, Figure 12 right), which
was attributed to faster heat transfer to the relatively colder adjacent material at the edges of each welding
area. Moreover, and despite a higher resistive heat generation rate at 𝑗𝑗 = 𝑝𝑝 = 1 (see Figure 10), i.e. the
first welding area at the beginning of the welding process, lower temperatures were observed there (see
point A in Figure 12), caused by the absence of any previously welded areas and hence absence of
preheating.
Across the welding direction, an “edge effect” was found consisting of a significant temperature
difference between the edges and the middle of the overlap. Whereas the edge effect in RW processes
usually entails lower temperatures at the edges of the overlap [21, 29], a higher edge temperature was
found in the CRW process. The higher temperature at the edges of the overlap was attributed to a
combination of the following factors: (i) heat radiated from the 1mm exposed heating element between
the edge of the overlap and the block connectors, similar to what is observed at the ends of the weld in
RW [29], (ii) concentration of resistive heating near the edges of the block connectors, and (iii) heat
dissipation at the interface between the mesh and the block connectors as a result of the contact resistance.
4.2. Model validation
To validate the process model, the temperatures at the weld interface were measured experimentally.
Eight K-type thermocouples, TC1-TC8, were placed between the neat resin layer and one of the
adherends (see Figure 13). Thermocouples TC1, TC3, TC5, TC7 and TC8 were placed in the middle of
welding areas 1, 3, 5, 7 and 8. Thermocouples TC2 and TC4 were placed at the edges of welding areas.
TC6 was placed in the middle of welding area 6 but only 3 mm away from the edge of the overlap (see
Figure 13).
A close agreement between predicted and measured temperature for two different welding speeds was
obtained, as shown in Figure 14. It should be noted that the temperature measured by TC6 was above the
prediction for both welding speeds, which could be a result of the discrete heat generation rates used in
the model and/or inaccurate modelling of the contact resistance or the heat transfer between the heating

Submitted to Composites Part A: Applied Science and Manufacturing
12
element and the block connectors, given the results in section 4.4 . It is also interesting to note how both
predicted and measured temperatures showed clear steps in the cooling phase of the welding process,
which are attributed to the superposition of the heat generated at different locations as the connecting
wheels travel along the welding direction.
4.3. Sensitivity study on welding voltage and speed
Figure 15 shows the predicted effect of the input voltage and the welding speed in the welding
temperature at the TC5 location, as defined in Figure 13. The welding temperature, i.e. the temperature at
the middle of the overlap (e.g. TC5), was found to increase with decreasing welding speed (as also shown
in Figure 14) and with increasing input voltage. The process model showed that a 100% increase in the
input voltage (from 3 to 6V) yielded a 275% increase in the welding temperature (from 160 to 600°C).
However, a 350% increase in the welding speed (from 0.28 to 1.27 mm/s) only yielded a 130% increase
in the welding temperature (from 260 to 600°C). Based on these results, the welding temperature can be
considered to be more sensitive to changes in the input voltage than changes in the welding speed.
Since both welding speed and input voltage influence the welding temperature, the selection of one
parameter is also dependent on the selection of the other. As discussed above, a higher welding
temperature can be obtained either by increasing the input voltage, or by decreasing the welding speed.
Therefore different combinations of welding voltage and welding speed can be used to obtain the same
predefined welding temperature, as shown in Figure 16.
Changing the welding voltage and/or the welding speed was found, however, not to have an effect on the
ratio between the temperature at the edges and the temperature at the middle of the overlap (e.g.
TC6/TC5), amounting to approximately 1.4. This results from the fact that voltage and speed are
responsible for resistive heating, which governs heat generation both at the middle and at the edges of the
welding overlap. Consequently, tuning of the welding voltage or welding speed changes the overall
temperatures at the welding overlap but does not influence the relative size of the gap between
temperature at the edges and at the middle of the overlap.
4.4. Effect of clamping pressure
The electrical clamping pressure directly influences the quality of the contact between block connectors
and heating element. Consequently, it is directly related to the contact resistance between the mesh and
the block connectors, as shown in section 3.1.1, and it is believed to also have an influence in the

Submitted to Composites Part A: Applied Science and Manufacturing
13
efficiency of heat transfer between the heating element and the block connectors, as explained in section
3.2. Therefore the clamping pressure is suspected to have a major influence in the edge effect, which was
further investigated using the process model.
Firstly, the effect of the contact resistance was investigated by using the process model to predict the
distribution of welding temperatures across the overlap in (i) the actual welding setup, i.e. with a contact
resistance amounting to 25% of the resistance of the mesh, and (ii) an ideal welding setup with zero
contact resistance. A h = 5W/m2K heat flux boundary condition at the mesh-block connector interface
was assumed in both cases in order to isolate the effect of the contact resistance. The results, depicted in
Figure 17 (a), show how the edge effect was indeed significantly decreased by considering zero contact
resistance, while the welding temperatures in the middle of the overlap remained unchanged.
Secondly, the effect of heat transfer efficiency between the heating element and block connectors was
investigated by predicting the temperature distribution across the overlap for a zero contact resistance
setup in which the heat flux coefficient was increased from 5 W/m2K to 100 W/m2K and 500 W/m2K . An
ideal heat transfer scenario consisting of full conduction between the heating element and the block
connectors was also considered in this analysis. The results, depicted in Figure 17 (b), show that the
temperature at the edges of the overlap was significantly reduced when the heat transfer coefficient was
increased from 5 to 500 W/m2K and even further reduced when full conduction between the heating
element and the block connectors was assumed.
4.5. Effect of the size of the block connectors
The width of the block connectors is directly related to the size of the melt zone (see Figure 1) and it is,
therefore, expected to have an effect on the welding process. In order to further investigate this potential
effect, the relationship between block width and resistance of the welding electrical circuit was firstly
analysed by modelling the experimental setup shown in Figure 5. The results of this simulation, shown in
Figure 18 (a), indicated that the resistance of the welding electrical circuit created between each pair of
electrified block connectors decreases with increasing width of the connectors. This results from the fact
that increasing the width of the block connector is analogous to increasing the effective cross section of
the mesh heating element.
Secondly, the relationship between the width of the block connectors and the welding temperature was
analysed by using the CRW process model. The welding temperature at TC5 was simulated using a fixed
welding voltage of 4.3 V and a fixed welding speed of 0.85 mm/s. Zero contact resistance was considered

Submitted to Composites Part A: Applied Science and Manufacturing
14
in this simplified analysis. As shown in Figure 18 (a), the welding temperature was found to increase with
increasing width of the block connectors. Therefore, increasing the width of the block connectors allows
higher welding speeds for a fixed welding temperature, as seen in Figure 18 (b). However, due to the
increased resistance, the faster welding speeds come at the cost of increased input power. Consequently,
the maximum capacity of the power supply must be taken into account when determining the width of the
block connectors.
5. Conclusions
A three-dimensional finite element process model was developed to simulate continuous resistance
welding of thermoplastic composites. The continuous welding process modelled in this study was
characterised by the use of a single-piece stainless steel woven mesh as the heating element and multiple
adjacent copper block connectors along the welding direction. The process model consisted of an
electrical model, used to predict heat generation at the mesh heating element, and a thermal model, used
to simulate the temperatures reached during welding. In order to validate the process model, temperature
was measured at different locations in the welding interface during continuous resistance welding of glass
fibre reinforced polyphenylene sulfide laminates in a single-overlap configuration. Subsequently, the
effects of electrical clamping pressure, welding voltage, welding speed and size of the block connectors
on the welding process were investigated using the process model. The main conclusions drawn from this
study are:
• The welding temperatures predicted by the process model were in good agreement with the
temperatures measured both along and transverse to the welding direction. The temperature
distribution along the welding direction was found to be fairly uniform. Contrarily, significant
non-uniformities were observed in the temperature distribution transverse to the welding
direction, in particular, the temperature was found to be substantially higher towards the edges
than in the middle of the overlap.
• Both the contact resistance and the efficiency of heat transfer between the heating element and
the block connectors, which are believed to be directly related to the clamping pressure applied
on the block connectors, were found to have a large influence on the temperature distribution
transverse to the welding direction. Decreasing the contact resistance and increasing the
effectiveness of heat transfer between the heating element and the block connectors, which are

Submitted to Composites Part A: Applied Science and Manufacturing
15
believed to happen when the clamping pressure is increased, was shown by the process model to
be an effective way to reduce the higher welding temperature observed near the edges of the
overlap.
• Welding voltage and welding speed were found to be the two most influential parameters for the
welding temperature. A higher welding temperature could be obtained by either increasing the
welding voltage or decreasing the welding speed. The welding temperature was found to be
more sensitive to the welding voltage than to the welding speed.
• The size of the block connectors was found to influence the selection of the welding parameters.
A higher welding speed can be achieved if wider block connectors are used, however, this comes
at a cost as more input power is required for the welding process.
Acknowledgements
The authors would like to express their gratitude for the support provided by TenCate Advanced
Composites, The Netherlands. H. Shi thanks the PhD Scholarship Fund from China Scholarship Council
(CSC) for overseas study.
References
[1] Stavrov D, Bersee HEN. Experimental investigation of resistance welding of thermoplastic
composites with metal mesh heating element. SAMPE-Europe conference proceedings. Paris,
France2004.
[2] Chang IY, Lees JK. Recent Development in Thermoplastic Composites: A Review of Matrix Systems
and Processing Methods. Journal of Thermoplastic Composite Materials. 1988;1(3):277-96.
[3] Offringa A, Myers D, Buitenhuis A. Redesigned A340-500/600 Fixed Wing Leading Edge (J-Nose) in
Thermoplastics. Proceedings of the 22nd International SAMPE Europe conference. Paris, France2001. p.
331-43.
[4] Ingen JWv, Buitenhuis A, Wijngaarden Mv, III FS. Development of the Gulfstream G650 induction
welded thermoplastic elevators and rudder. SAMPE International Conference 2010. Seattle, U.S.A2010.
[5] Stavrov D, Bersee HEN. Resistance welding of thermoplastic composites-an overview. Composites
Part A: Applied Science and Manufacturing. 2005;36(1):39-54.
[6] Yousefpour A, Hojjati M, Immarigeon J-P. Fusion Bonding/Welding of Thermoplastic Composites.
Journal of Thermoplastic Composite Materials. 2004;17(4):303-41.

Submitted to Composites Part A: Applied Science and Manufacturing
16
[7] Ageorges C, Ye L, Hou M. Advances in fusion bonding techniques for joining thermoplastic matrix
composites: a review. Composites Part A: Applied Science and Manufacturing. 2001;32(6):839-57.
[8] Hou M, Yang M, Beehag A, Mai Y-W, Ye L. Resistance welding of carbon fibre reinforced
thermoplastic composite using alternative heating element. Composite Structures. 1999;47(1-4):667-72.
[9] Stavrov D, Bersee HEN, Beukers A. Resistance Welding of Continuous Fibre Reinforced PPS
Composites with Metal Mesh Heating Element. 1st International Conference on Innovation and
Integration in Aerospace Sciences. Queen’s University Belfast, Northern Ireland, UK.2005.
[10] Dubé M, Hubert P, Yousefpour A, Denault J. Resistance welding of thermoplastic composites
skin/stringer joints. Composites Part A: Applied Science and Manufacturing. 2007;38(12):2541-52.
[11] Ageorges C, Ye L, Hou M. Experimental investigation of the resistance welding for thermoplastic-
matrix composites. Part I: heating element and heat transfer. Composites Science and Technology.
2000;60(7):1027-39.
[12] Talbot É, Hubert P, Dubé M, Yousefpour A. Optimization of thermoplastic composites resistance
welding parameters based on transient heat transfer finite element modeling. Journal of Thermoplastic
Composite Materials. 2013;26(5):699-717.
[13] Lambing CLT, Don RC, Andersen SM, Holmes ST, Leach BS, Gillespie JW. Design and
Manufacture of an Automated Resistance Welder for Thermoplastic Composites. 49th Annual Technical
Conference (ANTEC '90)1991. p. 2527-31.
[14] McKnight SH, Holmes ST, Gillespie JW, Lambing CLT, Marinelli JM. Scaling issues in resistance-
welded thermoplastic composite joints. Advances in Polymer Technology. 1997;16(4):279-95.
[15] Yousefpour A, Octeau M-A. Resistance Welding of Thermoplastics. US20090032184 A1.
Canada2009.
[16] Ageorges C, Ye L, Mai Y-W, Hou M. Characteristics of resistance welding of lap-shear coupons.
Part III. Crystallinity. Composites Part A: Applied Science and Manufacturing. 1998;29(8):921-32.
[17] Ageorges C, Ye L, Mai Y-W, Hou M. Characteristics of resistance welding of lap shear coupons.:
Part II. Consolidation. Composites Part A: Applied Science and Manufacturing. 1998;29(8):911-9.
[18] Colak ZS, Sonmez FO, Kalenderoglu V. Process Modeling and Optimization of Resistance Welding
for Thermoplastic Composites. Journal of Composite Materials. 2002;36(6):721-44.
[19] Maffezzoli AM, Kenny JM, Nicolais L. Welding of PEEK/carbon fiber composite laminates.
SAMPE Journal. 1989;25(1):35-40.

Submitted to Composites Part A: Applied Science and Manufacturing
17
[20] Jakobsen TB, Don RC, Gillespie JW. Two-Dimensional thermal analysis of resistance welded
thermoplastic composites. Polymer Engineering & Science. 1989;29(23):1722-9.
[21] Shi H, Villegas IF, Bersee HEN. Modelling of Heat Transfer and Consolidation For Thermoplastic
Composites Resistance Welding. 18th International Conference on Composites Materials. Jeju, South
Korea2011.
[22] Stavrov D, Bersee HEN, Beukers A. The Influence of the heating element on resistance welding of
thermoplastic composite materials. ICCM-14 Conference. 2003.
[23] http://k-mac-plastics.net/data%20sheets/gpo3_technical_data.htm. GP03 Technical Data. K-mac
Plastics. 2012.
[24] http://www.tencate.com. CETEX® PPS Technical Data. TenCate2009.
[25] http://www.chrtape.com/cloth-glass-tape.aspx. CHR® Cloth-Glass Tape. Saint-Gobain. 2011.
[26] Xiao XR, Hoa SV, Street KN. Processing and Modelling of Resistance Welding of APC-2
Composite. Journal of Composite Materials. 1992;26(7):1031-49.
[27] Ageorges C, Ye L, Mai Y-W, Hou M. Characteristics of resistance welding of lap shear coupons.
Part I: Heat transfer. Composites Part A: Applied Science and Manufacturing. 1998;29(8):899-909.
[28] Holmes ST, Gillespie JW. Thermal Analysis for Resistance Welding of Large-Scale Thermoplastic
Composite Joints. Journal of Reinforced Plastics and Composites. 1993;12(6):723-36.
[29] Talbot E, Yousefpour A, Hubert P, Hojjati M. Thermal Behavior During Thermoplastic Composites
Resistance Welding Annual Conference of The Society of Plastics Engineers (ANTEC) 2005 Boston,
Massachusetts2005.

Submitted to Composites Part A: Applied Science and Manufacturing
18
Figure1. A schematic diagram of continuous resistance welding of single-lap joints.
Figure 2. Continuous resistance welding setup, consisting of 1) pneumatic system for welding compaction,
2) block connectors, 3) laminates, 4) motion system, 5) pneumatic system for clamping, 6) insulators, and
7) power supply.
Blockconnectors
Power supplyHeating element
Laminates
Laminates
(Cross-section)
Melt zone
Welding direction
XY
Laminates
1
52
736
4

Submitted to Composites Part A: Applied Science and Manufacturing
19
Figure 3. Geometry of continuous welding setup for the welding of single lap shear joint
Figure 4. A flowchart of the process modelling for CRW.
Glass tape
Stainless steel meshInsulator
Adherend
Adherend
Insulator
Glass tape
Resin film
254mm
25.4mm16mm
12.7mm
12.7
mm
12.7
mm
1.9mm
6mm
Block connector
Wheel connector
Wheel connector
Material properties
Geometry model
Boundary conditions
Solving
Equivalent ρ measurement
Equivalent electric resistivity (ρ)
Geometry model
Welding voltage (U)Sub-area dividing
Solving
Resistive heating rate ( )
T_simulation T_measurement
Model validationThermal model
Electrical model
Contact resistance Rc measurement

Submitted to Composites Part A: Applied Science and Manufacturing
20
Figure 5. Resistance of the mesh versus clamping pressure.
0.060.070.080.09
0.10.110.120.130.140.150.160.17
0.0 0.5 1.0 1.5 2.0 2.5 3.0 3.5 4.0 4.5 5.0
Res
ista
nce
(Ω)
Clamping pressure (MPa)
27.4mmCopper
Stainless steel mesh
60mm
Copper
127m
m
127m
mClamping pressure Clamping pressure
X
Y
Submitted to Composites Part A: Applied Science and Manufacturing
21
Figure 6. (a) Total resistance versus mesh resistance for an actual welding process. (b) Influence of
location of connector wheels and contact between mesh and block connectors.
Submitted to Composites Part A: Applied Science and Manufacturing
22
Figure 7. Experimental relationship between the resistance and the length of the mesh heating element.
Figure 8. (a) Predicted voltage distribution in the heating element (b) Predicted and experimental voltage
difference distribution for three different positions of the electrified block connectors.
y = 7.411E-06xR² = 9.981E-01
0
0.2
0.4
0.6
0.8
1
1.2
1.4
1.6
1.8
0.0E+00 5.0E+04 1.0E+05 1.5E+05 2.0E+05 2.5E+05
Res
ista
nce
(Ω)
Length/Area (m-1)
R_meshLinear (R_mesh)
LengthArea
(=w· h)
Copper Copper
Stainless steel mesh
(a) (b)
0
0.04
0.08
0.12
0.16
0.2
0 50 100 150 200
Volta
ge d
iffer
ence
-ΔU
(V)
Position of the measurement-a (mm)
d=0mm_Testd=0mm_Simud=63.5mm_Testd=63.5mm_Simud=127mm_Testd=127mm_Simu
Leng
th 6
0mm
Width 254mm
L=25
.4m
m
d
ΔU0
a
ΔU1
ΔU2
...
X
Y
Block connector
Measurement positons

Submitted to Composites Part A: Applied Science and Manufacturing
23
Figure 9. (a) Predicted Q̇ distribution as a continuous function of the position in the mesh (1 V welding
voltage). (b) Predicted Q̇ distribution as a discrete function of the position in the mesh (1 V welding
voltage).
Figure 10. Average resistive heating rate in central row, i = 5, for different positions of the wheel
connectors, p = 1, 5, 10, 20 under a 1 V constant voltage
(L=16mm)
(L=1mm)
(L=3mm)
(L=16mm)
(L=4mm)
(L=11.4mm)
(L=4mm)
(L=3mm)
(L=1mm)
w=16mm
…
Resistive heat generation rate [W/m3](b)
0.00.4
0.81.1
0.0E+001.0E+082.0E+083.0E+084.0E+085.0E+086.0E+087.0E+088.0E+089.0E+081.0E+09
0.0 2.8 6.2 9.5 12.9 16.2 19.6 22.9 26.3 Width (mm)
Res
istiv
e he
at g
ener
atio
n ra
te (W
/m3 )
Length (mm)
Leng
th
Width
(a) Resistive heat generation rate [W/m3]
0.00.4
0.81.1
0.0E+001.0E+082.0E+083.0E+084.0E+085.0E+086.0E+087.0E+088.0E+089.0E+081.0E+09
0.0 2.8 6.2 9.5 12.9 16.2 19.6 22.9 26.3 Width (mm)Res
istiv
e he
at g
ener
atio
n ra
te (W
/m3 )
Length (mm)
0.0E+00
5.0E+07
1.0E+08
1.5E+08
1 2 3 4 5 6 7 8 9 1011121314151617181920Welding area - j
p=1p=5p=10p=20
Res
istiv
e he
atin
g ra
te -
Q5j
,p(W
/m3 )

Submitted to Composites Part A: Applied Science and Manufacturing
24
Submitted to Composites Part A: Applied Science and Manufacturing
25
Figure 11. Schematic diagram of contact interface between the stainless steel mesh and the block
connectors.
Figure 12. Predicted distribution of welding temperatures at the welding interface along and across the
welding direction for 4.3 V constant welding voltage, 1.27 mm/s welding speed and 0.3 MPa electrical
clamping pressure.
Block connector
Stainless steel mesh
0
50
100
150
200
250
300
0 50 100 150 200 250
Max
imum
tem
pera
ture
(°C)
Weld line length (mm)
Overlap length
Weld line length
A
BMiddle pointEdge point
Block connectors
Overlap area
A B

Submitted to Composites Part A: Applied Science and Manufacturing
26
Figure 13. Positions of the thermocouples used for temperature measurement.
Figure 14. Comparison between predicted and measured temperature evolution at different locations in
the welding interface for 4.3 V welding voltage and (a) 1.27 mm/s and (b) 0.85 mm/s welding speed.
1 2 3 4 5 6 7 8 9 10 11 12 13 14 15 16 17 18 19 20
1 2 3 4 5 6 7 8 9 10 11 12 13 14 15 16 17 18 19 20
TC1 TC2 TC3 TC4 TC5TC6
TC7 TC8 X
Y
Block connectors
Stainless steel mesh
PPS
TC

Submitted to Composites Part A: Applied Science and Manufacturing
27
Figure 15. (a) Influence of welding speed on welding temperature at TC5 for 4.3 V welding voltage; and
(b) influence of welding voltage on welding temperature at TC5 for 0.85 mm/s welding speed.
Figure 16. Welding speed and input voltage combinations for different maximum welding temperatures at
TC5 location.
0
100
200
300
400
500
600
700
0 200 400 600 800 1000 1200
Tem
pera
ture
(°C
)
Welding time (s)
Speed=1.27mm/s
Speed=0.85mm/s
Speed=0.58mm/s
Speed=0.28mm/s
0
100
200
300
400
500
600
700
0 50 100 150 200 250 300 350
Tem
pera
ture
(°C
)
Welding time (s)
Voltage=3VVoltage=4.3VVoltage=5VVoltage=6V
(a) (b)
0.0
0.5
1.0
1.5
2.0
2.5
3.0
3.5
4.0
2.5 3.5 4.5 5.5 6.5
Wel
ding
spee
d (m
m/s
)
Welding voltage (V)
Tmax=250°C
Tmax=320°C
Tmax=400°C
Tmax=550°C

Submitted to Composites Part A: Applied Science and Manufacturing
28
Figure 17. Temperature distribution across the weld direction atwelding area 10; (a) effect of contact
resistance (for a fixed heat transfer scenario) and (b) effect of increased heat transfer efficiency
represented by increased heat flux, h, and ending in ideal full conduction between the heating element and
the block connectors .
Figure 18. Effect of the width of block connectors on (a) resistance of the welding electrical circuit
between two electrified block connectors and welding temperature (4.3 V and 0.85 mm/s welding voltage
and speed, respectively); (b) selection of welding speed and required power input for the welding process
(320 °C welding temperature and 4.3 V welding voltage).
200
300
400
500
600
700
800
0 5 10 15 20 25
Max
imum
tem
pera
ture
(ºC
)
Transverse direction of weld line (mm)
With contact resistance, h=5W/m2KNo contact resistance, h=5W/m2K
200
300
400
500
600
700
800
0 5 10 15 20 25
Max
imum
tem
pera
ture
(ºC
)Transverse direction of weld line (mm)
No contact resistance, h=5W/m2KNo contact resistance, h=100W/m2KNo contact resistance, h=500W/m2KNo contact resistance, conduction
(a) (b)
0
100
200
300
400
500
600
700
00.010.020.030.040.050.060.070.080.09
0.1
0 10 20 30 40 50
Tem
pera
ture
(°C
)
Res
ista
nce
(Ω)
Width of block connector (mm)
ResistanceTemperature
0
100
200
300
400
500
600
700
0.00.20.40.60.81.01.21.41.61.82.02.22.4
0 10 20 30 40 50
Pow
er in
put (
W)
Wel
ding
spee
d (m
m/s
)
Width of block connectors(mm)
Welding speed
Power input
(a) (b)
Submitted to Composites Part A: Applied Science and Manufacturing
29
Table 1. Room temperature material properties
Density Specific heat Thermal conductivity
Reference ρ (kg/m3) Cp (J/kg·°C) kxx, kyy (W/m·°C) kzz (W/m·°C)
Stainless steel
mesh 7780 460 10 10 [21]
GPO3 Fibre
glass sheet 1795.5 1150 3.3 3.3 [23]
PPS resin film 1350 1090 0.19 0.19 [24]
GF/PPS 1900 900 0.53 0.42 ρ: [24]
Cp, k: Measured
Glass tape 2079 1073 1.4 1.4 [25]
Table 2. Temperature-dependent properties of GF/PPS and PPS
Temp (°C)
GF/PPS PPS
Specific heat Thermal conductivity Specific heat Thermal conductivity
Cp
(J/kg·°C)
kxx, kyy
(W/m·°C)
kzz
(W/m·°C)
Cp
(J/kg·°C)
k
(W/m·°C)
20 900 0.53 0.42 1090 0.19b
70 1030 0.57 0.44 1250 0.265b
120 1160 0.59 0.45 1510 0.272b
170 1250 0.61 0.45 1690 0.272b
220 1390 0.64 0.46 1970 0.279b
270 1380 0.62 0.38 1950 0.22b
320 1488 0.62a 0.38a 2166 0.22b
a Linearly extrapolated value
b Estimated using the rule of mixtures