continuous planning & rolling forecasts - jpk group planning & rolling forecasts utilize...
TRANSCRIPT

JPK
Gro
upBusiness Forecasting and Analytics Forum
September 19-20 • Chicago, IL
Continuous Planning & Rolling Forecasts
Utilize rolling forecasts to adaptto dynamic business challenges and opportunities
September 19, 9:45am
Juan Porter has over 25 years combined client, vendor, and consultant experiencewith Oracle Hyperion. He is a member of the Oracle Hyperion Partner Advisory
Council, he is actively involved in various Hyperion user groups, he has served asthe chair of Hyperion’s National Steering Committee, and he has led many
Hyperion enhancement committees. Juan is the president and founder of a leadingnationwide consulting firm, which serves over 400 of the Global 2000’s largest andbest performing companies. Industry analysts, editors, and authors frequently seekhis expertise on the future direction of EPM, current Hyperion releases, as well as
insight into strategic and practical ways to solve business problems.
View presentation online at:https://jpkgroupsummits.com/attendee5
Juan Porter – TopDown Consulting

CONTINUOUS PLANNING AND ROLLING FORECASTS
Juan Porter
September 19, 2016
JUAN PORTER – EXPERIENCE OVERVIEW
Representative Sample of Clients
– Adecco
– AT&T
– Bio-Rad
– DirecTV
– E*Trade
– Estee Lauder
– Franklin Templeton
– Group 1 Automotive
– HSBC
– Iron Mountain
– Olympus
– Pella
– Shutterfly
– Thompson Creek Metals
– Wachovia
– Washington University
School of Medicine
• President & Founder of TopDown Consulting
• Over 25 years experience delivering EPM
solutions to numerous Fortune 1000 clients
across more than 20 industry verticals
• Specializations include enterprise performance
management, business process, business
intelligence, data warehousing,
and master data management
• Regular blogger, frequent speaker, and
contributor to various industry publications


STEEPED IN TRADITION

TRADITIONAL PLANNING PROCESS
• Annual process
– Out-of-date when finalized
• Time consuming (3-6 months), expensive
• Focus is on detail data preparation and collection
• Heavy use of offline spreadsheets
• Becomes basis for comparison/variance
– Basis for compensation (bonuses)
– Relevant to today
• Authorization to spend – “It’s in my budget”
TRADITIONAL FORECASTING PROCESS
• Monthly or Quarterly
• Focuses only on the current year
• Derived from plan or prior forecast
• Short window (2-3 days) after monthly close
• No time for scenario modeling
• Adjustments are made on what’s happened so far
• Different level of detail than plan
– Data is often summarized

Jan Feb Mar Apr May Jun Jul Aug Sep Oct Nov Dec Jan Feb Mar Apr May Jun Jul Aug Sep Oct Nov Dec
Jan Fcst
Feb Fcst
Mar Fcst
Apr Fcst
May Fcst
Jun Fcst
Jul Fcst
Aug Fcst
Sep Fcst
Oct Fcst
Nov Fcst
Dec Fcst
FY15
Forecast
Actual
FY16
TRADITIONAL FORECASTING PROCESS
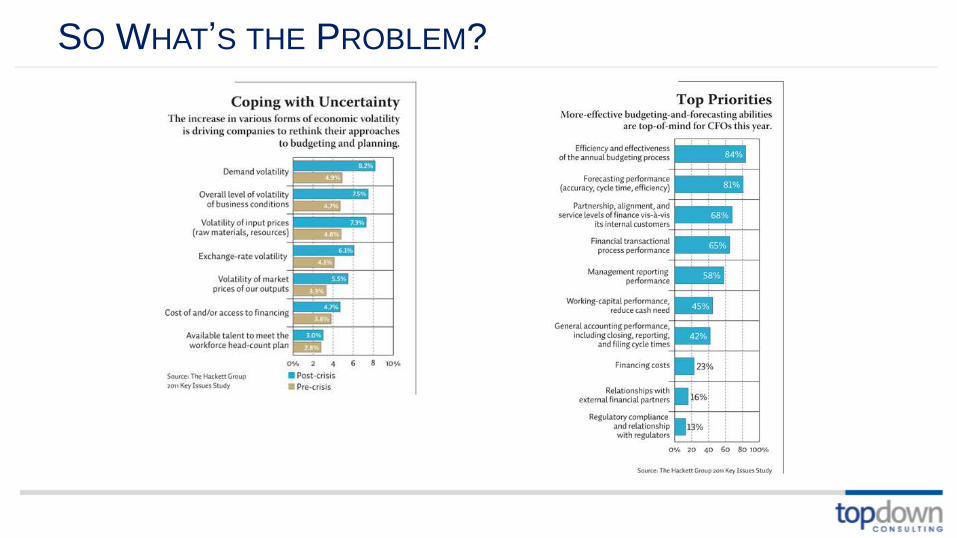
SO WHAT’S THE PROBLEM?
LOOKING FORWARD WITH ROLLING FORECASTS
A rolling forecast creates an ongoing cycle of planning, conducting,
evaluating and updating organization-wide operations.
Source: Rolling Forecast Solutions – Five Core Components of a Rolling Forecast, 2011
FIVE CORE COMPONENTS OF A ROLLING FORECAST
• Extends beyond the calendar/fiscal year and covers a
standard number of periods
• Updates on a regular and pre-determined basis
• Emphasizes key business drivers
• Rapid forecast creation
• Blends actual performance along with the updated
forecast
Source: Rolling Forecast Solutions – Five Core Components of a Rolling Forecast, 2011
WHAT IS A ROLLING FORECAST?
• More fluid approach to planning and forecasting
– If you are doing this, may not need to do a typical annual plan
• Emphasizes the forward movement of the business
– Always looking ahead 12, 18, or 24 months
– No cliff event like end-of-year
• Focus on what you manage
– Not what you transact
• Continuous process
– Combines traditional plan and forecast

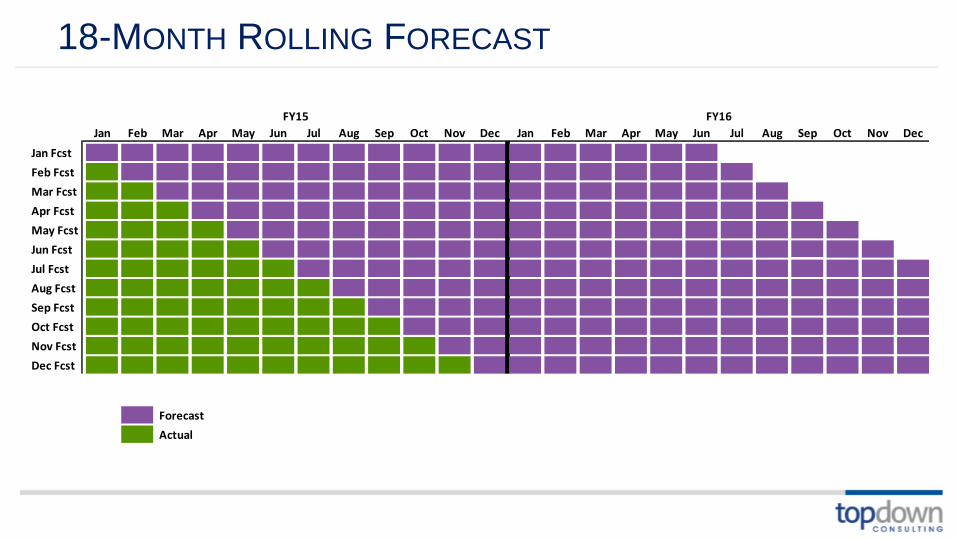
18-MONTH ROLLING FORECAST
Jan Feb Mar Apr May Jun Jul Aug Sep Oct Nov Dec Jan Feb Mar Apr May Jun Jul Aug Sep Oct Nov Dec
Jan Fcst
Feb Fcst
Mar Fcst
Apr Fcst
May Fcst
Jun Fcst
Jul Fcst
Aug Fcst
Sep Fcst
Oct Fcst
Nov Fcst
Dec Fcst
FY15 FY16
Forecast
Actual
WHY ROLLING FORECASTS?
• Forward looking
• Tightly linked to strategy
• Driver-based
• Avoid excessive detail
• Externally and internally focused
• Emphasis on ongoing results vs. just current year
• Focus more on factors and analysis rather than data gathering
Something to consider -Could this eliminate the need for an annual plan?
18-MONTH ROLLING FORECAST
Jan Feb Mar Apr May Jun Jul Aug Sep Oct Nov Dec Jan Feb Mar Apr May Jun Jul Aug Sep Oct Nov Dec
Jan Fcst
Feb Fcst
Mar Fcst
Apr Fcst
May Fcst
Jun Fcst
Jul Fcst
Aug Fcst
Sep Fcst
Oct Fcst
Nov Fcst
Dec Fcst
FY15 FY16
Forecast
Actual

HOW IS THIS DIFFERENT?
• More proactive approach to managing the business
– Perpetually forecasting (rolling fashion)
– Improved view beyond current year
• Synchronized with the business
– Process, metrics, etc.
• Less work once implemented
– Reduced cost of doing business
– Less burnout
– Free up time for other activities
– Allows for better analytical decisions
• Operations should be actively involved
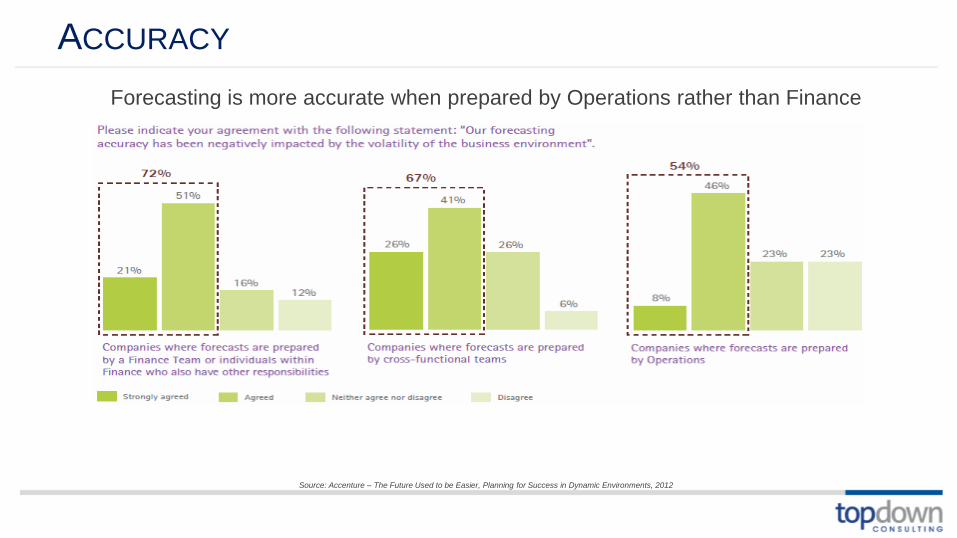
ACCURACY
Forecasting is more accurate when prepared by Operations rather than Finance
Source: Accenture – The Future Used to be Easier, Planning for Success in Dynamic Environments, 2012

PLANNING & FORECASTING LEADING PRACTICES
Leading Practices Benefits
• Align budgeting and forecasting with company strategy –
targets are set by management and cascaded across the
organization for budgeting/forecasting
• Don't burden with excessive detail – "false precision" slows
the process, and reduces the value to be realized through
frequent scenario iteration
• View planning as a continuous, iterative process to guide
business decision-making, not as a once-a-year
administrative exercise – rolling forecasts are one way to do
this
• Utilize "driver-based" logic wherever possible throughout the
planning process – build explicit links between external
forces, operational activities and the resulting financial
performance
• Utilize purpose-built planning tools to support rapid iteration
of complex, multi-dimensional models that are consistent
across business units/groups
• Creates a stronger linkage between the Strategic Plan, the
key targets and the operation of the business
• Provides organization with better ability to react to market
conditions
• Better focus on the review of key drivers of financial results
and influencing those drivers going forward
• Allows for continuous adjustments to planning
assumptions, rather than an annual review
• Improves communication within the business, about the
business, and its tactical and strategic areas of focus
• Increases management accountability for results
• Rolling forecast provides a view into the budget for the next
year
• Less time is spent on developing the detailed budget
• More time can be spent considering the operational
initiatives from the strategic plan
• Allows organization to focus on the analysis efforts not on
process

IMPLEMENTING A ROLLING FORECAST

KEY QUESTIONS TO ASK
• Evaluate how to improve current processes
– How did our current planning and forecasting process evolve over time?
– What do we like/dislike about the current process?
– What frequency – Monthly or Quarterly?
• Understand organizational direction
– Where are we going as a business?
• Determine what information you need to manage, and how you want to measure it
– What’s important to us?
– Does this align with our corporate goals and objectives?
• Do we have the time and resources to prepare plans/forecasts on a more frequent basis?

DECISION AND CRITERIA
• Timing of the implementation
• What resources do you need
– IT support
– Temps for data entry and validation
– New hardware
• Level of detail needed
– Consistency across organization?
– What can you control or influence?
• Choose the right solution
– On-Premise, Hosted, or Cloud
– Spreadsheet-based

WHERE EXCEL FALLS SHORT
• No proper version control
– Are all spreadsheets the correct versions?
• For every 150 lines in your forecasting model there is a 90% chance of a logic error
• Lack of robustness
– Can a CFO be confident in the numbers from an Excel forecast?
• Cannot accommodate changes to assumptions quickly
– how could you cope if the CEO asked “what is the financial impact of stopping production of line x?”
• Designed by staff who are not programmers, nor have been trained in documentation, quality assurance or other vital skills for a core business system
Source: Rolling Forecast Solutions – Five Core Components of a Rolling Forecast, 2011
PROCESS REVIEW AND CHANGE
• Balance the business drivers with technology
– Process and technology need to be aligned
• Determine what needs to change
– What are the key questions you are trying to answer?
– How do you want managers to interact?
• Pinpoint possible areas of resistance and manage them
through executive leadership
– Socialization of change

COMMON CHALLENGES
• Initial set up is labor intensive
• Resistance to change
– People are always resistant to change
– Perception that Driver-based not as accurate/detailed
• Costs associated with change
– Software & support
• Existing data
– It’s never as clean as you think
• Training, testing and parallels

KEYS TO SUCCESS
• Executive sponsor must be the “change sponsor”
• Define and socialize the process (who, what, and how)
• Change Management – Change takes time
– Adoption is acceptance and participation
– Identify areas of resistance
• Determine level of detail
– What are you responsible for?
– What can you control?
• Driver-based models
– Focus on key elements (drivers) impacting the business
– Minimizes data entry
– Ability to model different scenarios (Best/Worst case)
WHAT ARE DRIVERS?
• Calculations that require user to enter a single base element (cause) of a calculation and results (effect) are driven from that
• Certain elements are centrally defined/controlled
– Unit price/cost, discount rates, etc
– Salary mid-points, benefits, taxes, etc
– Depreciation rates
• Unit x Rate = Amount
– Unit is input by user and is their focus
– Rate is centrally supplied/controlled
– Amount is derived result
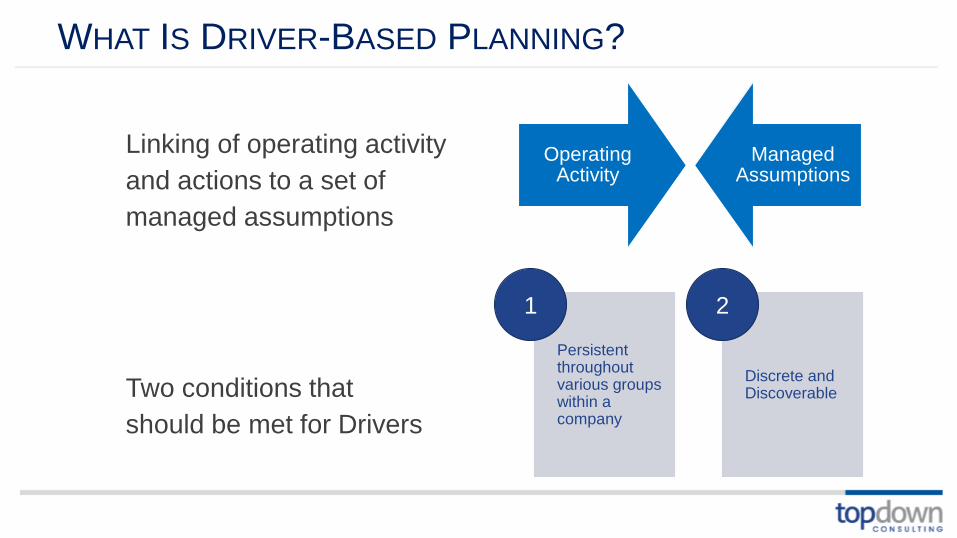
WHAT IS DRIVER-BASED PLANNING?
Linking of operating activity
and actions to a set of
managed assumptions
Two conditions that
should be met for Drivers
Operating Activity
Managed Assumptions
Persistent throughout various groups within a company
Discrete and Discoverable
1 2
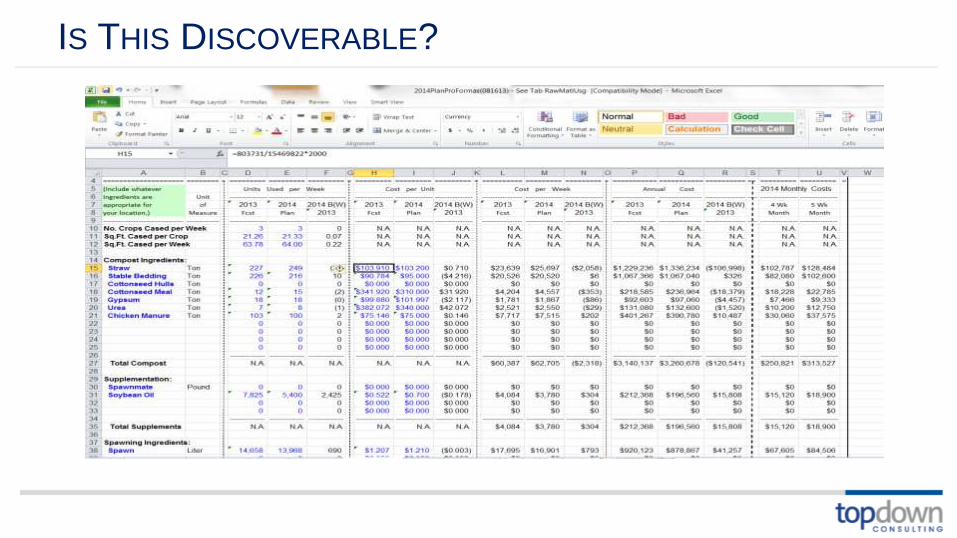
IS THIS DISCOVERABLE?
ACTIONABLE DRIVERS
• 20% drivers / 80% cost
• Set expectations: Better to be “good” than never achieving
“perfect”
• Identify operational drivers that yield financial data
• Management of universal financial drivers
– Diesel price per liter,
– Canadian to US dollars exchange rate
– Commodity prices
• Ability to do sensitivity analysis

REVENUE/COST BASED DRIVERS
• Drivers set by Corporate or LoB
– Unit Price and Cost
– Discounts, Returns, DiF, etc
– Currency dependencies
• Units sold are input by users
• Strategically link Sales and Manufacturing
– Total units sold has an impact on cost basis
– Improves Finance’s visibility and modeling
Units Sold
Price
Cost
Sales
CoS
Disc, Ret Revenue
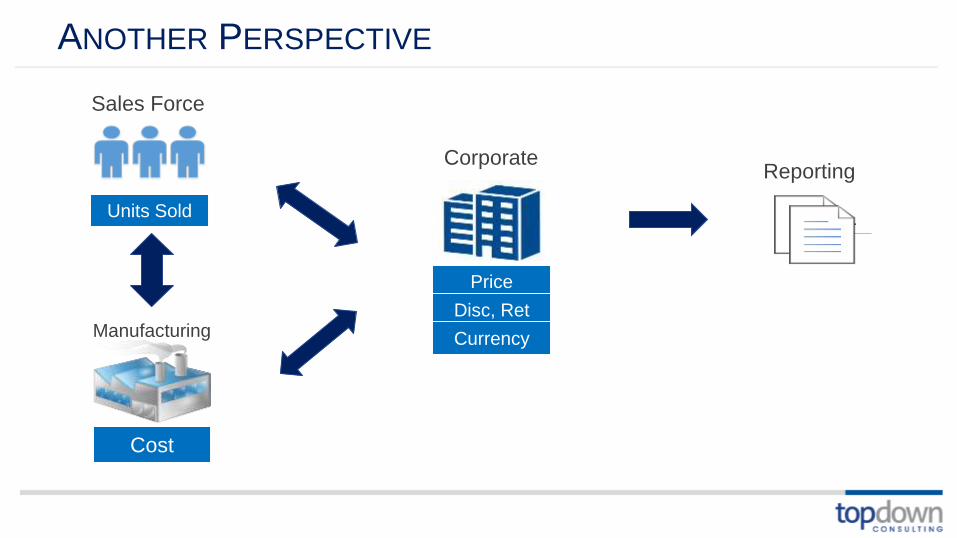
ANOTHER PERSPECTIVE
ReportingCorporate
Cost
Units Sold
Sales Force
Manufacturing
Price
Disc, Ret
Currency

EMPLOYEE-BASED DRIVERS
• Drivers set by Corporate or LoB
– Salary levels by grade or position
– Benefits and Payroll Tax rates
– Currency dependencies
• New Hires are input by users
• Focus on type of resource and when to hire
– Improves modeling of different hiring plans
New Hire• Position
• Date
Grade
Mid-point
Benefit
Rate
Salary
Expense
Benefit
Expense
Payroll
Tax Rate
Payroll
Taxes

Grade
Mid-point
Benefit
Rate
Salary
Expense
Benefit
Expense
Payroll Tax
Rate
Payroll
Taxes
Facility
Expense
PC
Purchase
Office
Space
Capital
Expense
Facility
Allocation
Depr
Rate
Depr
Expense
Recruiter
Fee
Recruiting
Expense
EMPLOYEE-BASED – ADVANCED DRIVERS
New Hire• Position
• Date

EXAMPLES OF DRIVERS
• Average Selling Price
• Discounts, Returns
• Average Cost per Unit
• Salary Grade Mid-Point
• Commission rate
• Merit Increase
• Annual Increase
• FICA, FUTA, SUTA
• State Unemployment
• Health Benefit
• Memberships
• 401K Contribution
• Stock Options
• Capital Purchases
• Depreciation
• Square Footage
• Country specific
• LoB specific
MEASURING WHAT YOU NEED TO MANAGE
UNDERSTANDING THE FORECAST
• Basis for variance analysis
– Communicate what is being measured
– Focus should be on what can be controlled, not just raw $’s
• Understand why there is a variance
– Track and store comments / explanations
– Visibility into assumptions and dependencies
• Don’t make currency the issue
– Local currency based
– Constant rate based
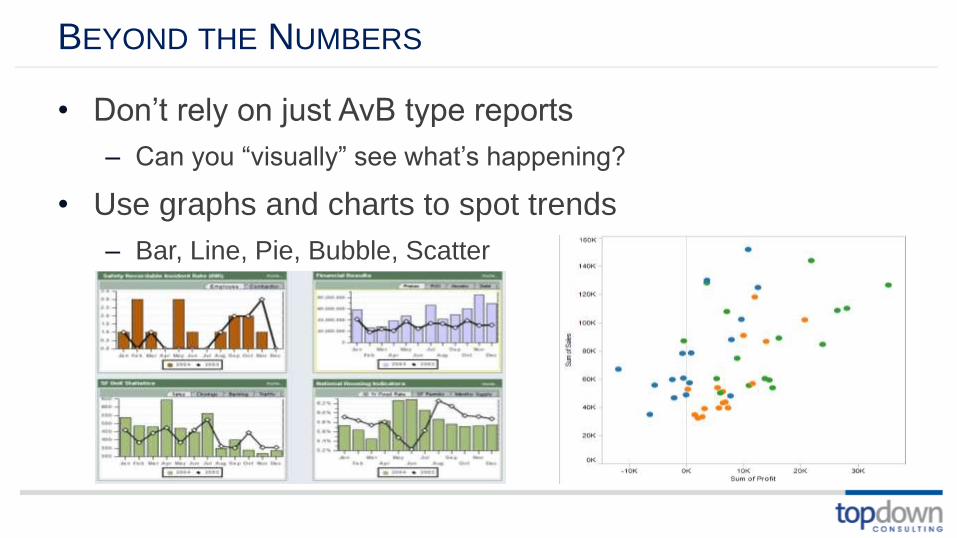
BEYOND THE NUMBERS
• Don’t rely on just AvB type reports
– Can you “visually” see what’s happening?
• Use graphs and charts to spot trends
– Bar, Line, Pie, Bubble, Scatter
– Easier to identify contribution
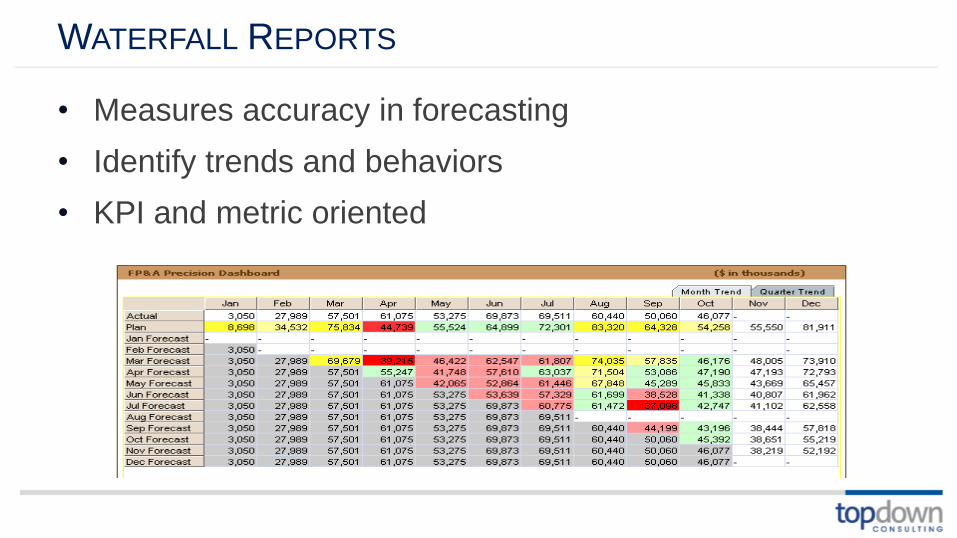
WATERFALL REPORTS
• Measures accuracy in forecasting
• Identify trends and behaviors
• KPI and metric oriented

ADDITIONAL CONSIDERATIONS

ADDITIONAL CONSIDERATIONS
• Change Management
– Users need to understand benefits
• Impact of multiple years on calculations/drivers
• Transition of new hires to employees
• New capital purchases included in depreciation forecast
• Parallel the process
– Balance this with other ongoing initiatives
– Take the time for adoption of the process
• Integration with other processes
– Monthly Close
– Strategic / Long-Range Plan
© Copyright 2016 TopDown Consulting, Incorporated. All Rights Reserved.
Juan Porter
Chief Solutions Officer & Founder
(415) 860-1115