continuous carbon dioxide electroreduction to concentrated ... · article continuous carbon dioxide...
TRANSCRIPT
Article
Continuous Carbon Dioxide Electroreductionto Concentrated Multi-carbon Products Usinga Membrane Electrode Assembly
Christine M. Gabardo, Colin P.
O’Brien, Jonathan P.
Edwards, ..., Jun Li, Edward H.
Sargent, David Sinton
HIGHLIGHTS
Membrane electrode assembly
design enables stable CO2
electroreduction
�50% Faradaic efficiency for
ethylene and �80% Faradaic
efficiency for C2+ products
>30% gas outlet concentration of
ethylene and direct production of
�4 wt % ethanol
Continuous 100 h operation at
>100 mA cm�2
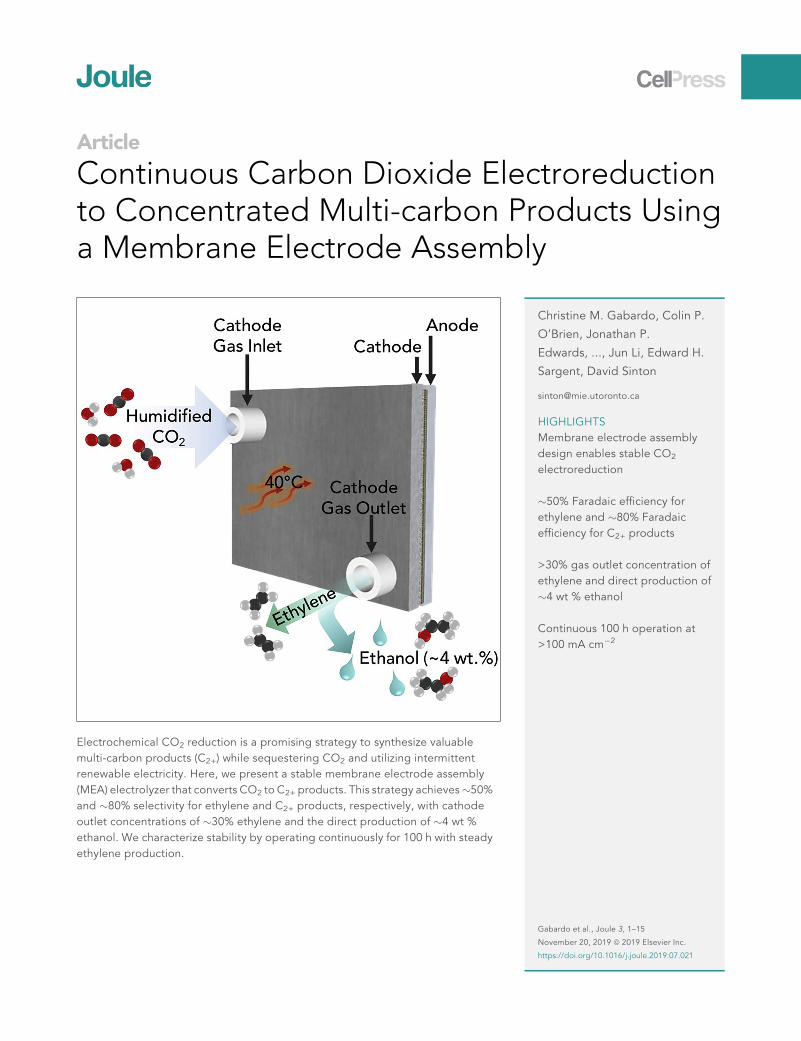
Electrochemical CO2 reduction is a promising strategy to synthesize valuable
multi-carbon products (C2+) while sequestering CO2 and utilizing intermittent
renewable electricity. Here, we present a stable membrane electrode assembly
(MEA) electrolyzer that converts CO2 to C2+ products. This strategy achieves�50%
and �80% selectivity for ethylene and C2+ products, respectively, with cathode
outlet concentrations of �30% ethylene and the direct production of �4 wt %
ethanol. We characterize stability by operating continuously for 100 h with steady
ethylene production.
Gabardo et al., Joule 3, 1–15
November 20, 2019 ª 2019 Elsevier Inc.
https://doi.org/10.1016/j.joule.2019.07.021

Please cite this article in press as: Gabardo et al., Continuous Carbon Dioxide Electroreduction to Concentrated Multi-carbon Products Using aMembrane Electrode Assembly, Joule (2019), https://doi.org/10.1016/j.joule.2019.07.021
Article
Continuous Carbon Dioxide Electroreductionto Concentrated Multi-carbon ProductsUsing a Membrane Electrode AssemblyChristine M. Gabardo,1,3 Colin P. O’Brien,1,3 Jonathan P. Edwards,1 Christopher McCallum,1 Yi Xu,1
Cao-Thang Dinh,2 Jun Li,1,2 Edward H. Sargent,2 and David Sinton1,4,*
Context & Scale
The advent of low-cost renewable
electricity and rising atmospheric
CO2 has led to a focus on
electrochemical CO2 reduction as
a means toward low-carbon-
intensity fuels and chemical
feedstocks. The conversion of
CO2 into C2+ hydrocarbons and
oxygenates (i.e., products
containing two or more carbon
atoms) is attractive in light of large
global market demand for these
high-energy-density products. A
limited number of prior studies
have focused on performance in
SUMMARY
Electrochemical carbon dioxide (CO2) reduction is a promising strategy to
synthesize valuable multi-carbon products (C2+) while sequestering CO2 and
utilizing intermittent renewable electricity. For industrial deployment, CO2
electrolyzers must remain stable while selectively producing concentrated C2+
products at high rates with modest cell voltages. Here, we present a membrane
electrode assembly (MEA) electrolyzer that converts CO2 to C2+ products. We
perform side-by-side comparisons of state-of-the-art electrolyzer systems and
find that the MEA provides the most stable cell voltage and product selectivity.
We then demonstrate an approach to release concentrated gas and liquid prod-
ucts from the cathode outlet. This strategy achieves �50% and �80% Faradaic
efficiency for ethylene and C2+ products, respectively, with cathode outlet con-
centrations of�30% ethylene and the direct production of�4 wt % ethanol. We
characterize stability by operating continuously for 100 h, the longest stable
ethylene production at current densities >100 mA cm�2 among reported CO2
electrolyzers.
the reaction rate regime above
100 mA cm�2 generally viewed as
necessary for industrial
deployment. In these works, gas
diffusion electrodes are used in
liquid electrolyte electrochemical
flow cells, which suffer in system
stability and/or energy efficiency.
We overcome this issue by
developing a membrane
electrode assembly-based
electrolyzer. The combined
catalyst and system strategy
produces concentrated gas and
liquid products and maintains
performance during long-term
(100 h) uninterrupted operation.
INTRODUCTION
Rising atmospheric CO2 levels have motivated reduced fossil fuel usage and a tran-
sition toward less carbon-intensive technologies. The electrochemical reduction of
CO2 to fuels and chemical feedstocks has gained attention as a means to close
the carbon cycle (fuels) or sequester CO2 into chemical feedstocks for the materials
industry (feedstocks), all powered using renewable energy.1,2
Of the possible chemicals generated through the electrochemical CO2 reduction re-
action (CO2RR), those containing carbon-carbon bonds, such as ethylene and
ethanol, are sought in view of their high-energy-density and market value. Many
copper (Cu)-based catalysts have achieved high selectivity (Faradaic efficiency, FE)
toward C2+ products during CO2RR.3 The overpotential has been lowered through
catalyst tuning3–5 and electrolyte engineering, also contributing to progress in elec-
trochemical energy efficiency (EE), the product of voltage efficiency (VE), the ratio of
thermodynamic cell potential to the applied cell potential), and FE.6,7
Techno-economic analysis highlights the importance of operating at high reaction
rates: current densities above 100 mA cm�2. These high rates are needed to ensure
that the capital cost of the CO2RR electrolyzer (amortized over its operating lifetime)
makes an acceptably low contribution to the total chemical product cost.8,9 More-
over, additional energy costs are incurred because of the downstream separation
Joule 3, 1–15, November 20, 2019 ª 2019 Elsevier Inc. 1

1Department of Mechanical and IndustrialEngineering, University of Toronto, Toronto, ONM5S 3G8, Canada
2Department of Electrical and ComputerEngineering, University of Toronto, Toronto, ONM5S 1A4, Canada
3These authors contributed equally
4Lead Contact
*Correspondence: [email protected]
https://doi.org/10.1016/j.joule.2019.07.021
Please cite this article in press as: Gabardo et al., Continuous Carbon Dioxide Electroreduction to Concentrated Multi-carbon Products Using aMembrane Electrode Assembly, Joule (2019), https://doi.org/10.1016/j.joule.2019.07.021
of the CO2RR products from each other, unreacted CO2, and/or the liquid electro-
lyte. Ultimately, these energy costs decrease the total EE in electrosynthesizing
the desired product, which is obtained by multiplying together the electrochemical,
separation, and balance of plant energy efficiencies. Generating more concentrated
CO2RR products can reduce the financial burden of the separation processes from
both the output gas and liquid streams.10 Electrolyzers have produced concentrated
acetate (6.5 wt %) and formate (1.8 wt %) from carbonmonoxide (CO) and CO2 feed-
stocks, respectively.11,12
Only by introducing CO2 in the gas phase are the mass transport rates associated
with CO2 diffusion in aqueous electrolyte overcome. Alkaline flow cells, in which
an alkaline electrolyte (usually potassium hydroxide, KOH) is flowed past the
cathodic gas diffusion electrode (GDE), have achieved high current density produc-
tion of ethylene,6,7,13–15 ethanol,16 acetate,17 and n-propanol18–20 from CO2 or CO
feedstocks. Operation of CO2RR electrolyzers in highly alkaline environments has
shown increased conductivity across the flow cell and improved reaction kinetics
compared to those with less alkaline electrolytes.6,21 Although very high current
densities and EEs can be achieved with alkaline flow cells; they suffer from carbonate
salt formation from the undesirable consumption of CO2 by the KOH electrolyte.
Neutral electrolytes, such as K2SO4 or KHCO3, can replace alkaline electrolytes,
but these have so far been limited to low EEs due to high ohmic resistance and over-
potentials.22,23 Maintaining the catholyte stability remains as an especially difficult
issue of the CO2RR system. The electrolyte can be altered by the absorption of
CO2 and/or the reaction-driven pH,24,25 leading to salt precipitation on the GDE
and/or ion exchange membrane and can lead to conductivity decreases throughout
the system, decreasing the full cell EE. Moreover, liquid products that are gener-
ated, like alcohols and oxygenates, are diluted into the large volume of electrolyte,
increasing downstream separation costs. Thus, designing a CO2RR electrolyzer that
can overcome these limitations and that is resistant to these electrolyte fluctuations
is critical to developing an industrially suitable system.
In theMEA system, the cathodic GDE is pressed up directly against the ion exchange
membrane. By eliminating the catholyte, issues associated with the electrolyte
ohmic losses, electrolyte consumption with CO2, electrolyte impurities fouling the
catalyst, and electrolyte flooding through the GDE can be eliminated. MEA electro-
lyzers have been used to produce C2+ products, but so far only at low current den-
sities (<100 mA cm�2) when CO2 is used as feedstock26–31 due to the use of proton
exchange membranes which create an acidic catalyst environment, favoring the
hydrogen evolution reaction (HER) over the generation of C2+ products. Moreover,
the formation of large quantities of liquid products at high current densities blocks
CO2 diffusion through the commercial carbon paper-based GDEs, leading to
increased HER over time. Developing strategies to overcome the limitations of pre-
vious MEA systems would enable the generation of C2+ products in a more energy-
efficient and stable system.
Here, we investigate liquid electrolyte flow cell and MEA systems that generate C2+
products via CO2RR. We design a MEA electrolyzer to overcome the low reaction
rates of previous MEA systems through the generation of a locally basic reaction
environment at the catalyst and the integration of a cathode GDE that remains
robust against liquid accumulation. This MEA electrolyzer strategy outperforms all
liquid electrolyte flow cells in terms of voltage stability and product stability and
significantly outperforms the reaction rate and stability of previous MEA electrolyz-
ers. Next, we explore operating parameters that impact the MEA gas and liquid
2 Joule 3, 1–15, November 20, 2019

Please cite this article in press as: Gabardo et al., Continuous Carbon Dioxide Electroreduction to Concentrated Multi-carbon Products Using aMembrane Electrode Assembly, Joule (2019), https://doi.org/10.1016/j.joule.2019.07.021
product concentrations, such as low CO2 flow rates and elevated temperatures. Sub-
sequently, we design a cathodic Cu catalyst strategy to take advantage of the high
concentration of CO2 at the catalyst, uniquely enabled by the MEA system, to
achieve a high FE toward ethylene (�50%), a high FE and EE toward C2+
products (�80% and 23%, respectively), and the generation of concentrated ethanol
(3.9 wt %). Finally, we present the stable and continuous production of these C2+
products for over 100 h at more than 100 mA cm�2.
RESULTS AND DISCUSSION
Comparison of CO2RR Electrolyzer Architectures
Cathode GDEs were prepared by sputtering Cu onto hydrophobic porous polytetra-
fluoroethylene (PTFE) membranes6 that were subsequently spray-coated with
conductive layers of carbon black and graphite particles (scanning electron micro-
scopy (SEM) images of the sputtered layer in Figures S1A and S1B and diagram of
the cathode in Figure S2). Anodes for the oxygen evolution reaction (OER) were pre-
pared by coating titanium supports with iridium oxide (IrO2, 2 mg cm�2)32 (SEM
images of the anode in Figures S1C and S1D).
An anion exchange membrane (AEM) was used to separate the cathode and anode
compartments of the cell (photographs in Figures S1E and S1F), each side with a
5 cm2 serpentine flow field. As CO2 travels through the flow field, it diffuses through
the PTFE layer to reach the Cu catalyst layer at either the liquid catholyte or polymer
electrolyte (AEM) interface for the liquid flowcells andMEAelectrolyzer, respectively.
Three electrolyzer configurations were compared: an alkaline flow cell (1 M KOH
catholyte and anolyte, Figure 1A), a neutral flow cell (0.5 M K2SO4 or 1 M KHCO3
catholyte and anolyte, Figures 1A and S4, respectively), and a MEA electrolyzer
(0.1 M KHCO3 anolyte, Figures 1A and S2). An additional flow field was used as
the catholyte flow channel to convert the MEA electrolyzer cell into the alkaline
and neutral flow cells (Figure S3) and each 50 mL electrolyte was recirculated. Each
electrolyzer architecture was operated under galvanostatic electrolysis for 2 h at
750 mA (150 mA cm�2), with the non-iR corrected full cell voltage monitored contin-
uously (Figure 1B) and the FE of gas products quantified every 20 min (Figure 1C).
The alkaline flow cell began operating at a full cell voltage of �3.25 V; however, the
voltage increased over the 2-h test to above�4.20 V. The increase in voltage can be
explained by the uptake of CO2 into the KOH electrolyte producing bicarbonate and
carbonate. Experimentally, this is observed as a decrease in the catholyte and ano-
lyte pH values and conductivities (Table S1). Despite the voltage instability, the gas
product selectivity remained relatively stable over the 2 h test, with a slight decrease
in ethylene FE (46% to <40%) (Figure 1C).
The neutral flow cell with 0.5 M K2SO4 remained at a full cell voltage of ��5.0 V
throughout the experiment. The higher cell voltage was due to electrolyte ohmic los-
ses of 0.5 M K2SO4 combined with decreased reaction kinetics in the lower alkalinity
environment. The pH gradient that developed between the cathode and anode over
the course of the reaction led to an increase in both the catholyte and anolyte con-
ductivity (Table S1), which may have counteracted the pH gradient-induced polari-
zation losses to lead to this relatively stable voltage. Moreover, throughout the
experiment, the FE toward ethylene and CO decreased, while that of hydrogen
and methane both increased. A similar trend was observed with 1 M KHCO3 electro-
lyte (Figure S4): thus, even with buffering capacity, the neutral flow cell electrolyte
Joule 3, 1–15, November 20, 2019 3

Figure 1. Voltage and Product Stability for Alkaline Flow Cell, Neutral Flow Cell, and Mea Electrolyzer
(A) Schematic of each cell configuration. The alkaline and neutral flow cells use 1 M KOH and 0.5 M K2SO4 for electrolytes in the cathode and anode
compartments. The MEA cell uses 0.1 M KHCO3 as electrolyte for the anode.
(B and C) Stability of the cell voltage (B) and gas products (C) for 120 min in each cell with an applied current of 750 mA (150 mA cm�2). Error bars for gas
products are calculated from the standard deviation of three samples taken at the same time.
Please cite this article in press as: Gabardo et al., Continuous Carbon Dioxide Electroreduction to Concentrated Multi-carbon Products Using aMembrane Electrode Assembly, Joule (2019), https://doi.org/10.1016/j.joule.2019.07.021
environment and cell performance are unstable, an observation that could be ex-
plained through the precipitation of electrolyte salts in the system.25
We then turned to the realization of a catholyte-free MEA system employing an AEM
along with a neutral anode electrolyte. Recent advances in AEM technology have led
to membranes with lower resistances than previous generations that can be incorpo-
rated intoMEAs to produce efficient electrolyzers.33–35We selected an AEMwith the
goal of generating a locally high pH at the catalyst by operating at a high current
density. Locally high pH at the catalyst has been found to decrease the onset of
4 Joule 3, 1–15, November 20, 2019

Please cite this article in press as: Gabardo et al., Continuous Carbon Dioxide Electroreduction to Concentrated Multi-carbon Products Using aMembrane Electrode Assembly, Joule (2019), https://doi.org/10.1016/j.joule.2019.07.021
CO production,21 and thus promote C-C coupling when a sufficient surface
coverage of this key intermediate for C2+ product generation is reached.36,37 A car-
bon-basedGDEwas determined to be unsuitable forMEA integration because of the
floodingof the electrodewithwater and liquid products duringprolongedoperation.
This flooding decreased CO2 diffusion to the catalyst, as evidenced by increased
HER over time (Figure S5). We integrated our previously demonstrated6 flooding-
resistant PTFE GDE into our MEA system. The MEA electrolyzer (0.1 M KHCO3 ano-
lyte) maintained a stable voltage of�4 V, a much lower voltage than the 1 M KHCO3
liquid flow cell. Increasing the concentration of the anolyte for the MEA has a slight
benefit for the voltage but leads to less stable long-term operation.38 The FE for
ethylene increased from 43% to 47% over the 2 h operating time, while the HER FE
remained constant, indicating that the PTFE GDE was more robust than the car-
bon-based GDE at expelling liquids and maintaining short CO2 diffusion lengths
through liquid. Measurements of anolyte pH and conductivity reveal that these
were constant over the duration of the experiment to within 2% (Table S1).
TheMEAelectrolyzer provides the lowest stable voltageperformanceof the three elec-
trolyzer architectures. It also provides the highest selectivity toward C2+ gas products.
We therefore explored the influence of operating conditions and catalyst tuning on the
performance of the MEA electrolyzer for concentrated C2+ chemical production.
Performance of the MEA Electrolyzer for Multi-carbon Product Generation
We characterized the current-voltage response of the MEA electrolyzer under
ambient conditions (20�C, 1 atm) (Figure 2A). Between �2.8 and �4.2 V, the current
density increased from 11 to over 200mA cm�2. For the gas products (Figure 2B), the
CO selectivity decreased continuously with increasing cell voltage and current den-
sity. The FE for ethylene increased concurrently, reaching a maximum selectivity of
nearly 50% FE at�4.1 V. The production of methane was negligible over all assessed
voltages (<0.5% FE). The competing HER was decreased to below 5% FE at voltages
more negative than �3 V.
The total gas FE decreased with increasing voltage, corresponding to a shift toward
liquid products at higher voltages. We measured the selectivity for liquid products
generated at the cathode by collecting from the cold trap connected to the cathode
gas outlet and from the anolyte, to detect liquid products that may have crossed
over the AEM with the flow of water and ions (Figure 2C). The production of ethanol
and acetate increased as the voltage increased, reaching FEs of 15% and 7%,
respectively. While most of the liquid products are detected in the anolyte (Fig-
ure S6A), a substantial quantity of the major liquid product, ethanol, was detected
in the liquid collected from the cathode outlet at �5% FE (0.5 wt %).
The total product FE was near 100%, indicating minimal oxidation of liquid products
that travel to the anolyte (Figure S6B). In addition, a control experiment was
conducted in which the liquid anolyte was spiked with typical concentrations of
generated liquid products and was run for several hours under HER conditions at
the cathode to avoid additional liquid product generation (150 mA cm�2) (Fig-
ure S6C). Minimal loss in the spiked liquid products was observed, with the excep-
tion of formate, suggesting that most products that crossover the AEM to the
anolyte are not oxidized. Iridium-based anode catalysts have shown activity for
formic acid oxidation39; however, these catalysts show lower activity for alcohol
oxidation.40,41 The electromigration of acetate and formate across the AEM is ex-
pected because of their anionic charge, and formate was detected only in the ano-
lyte (Figure S7); whereas the transport of the neutral alcohol products, ethanol and
Joule 3, 1–15, November 20, 2019 5
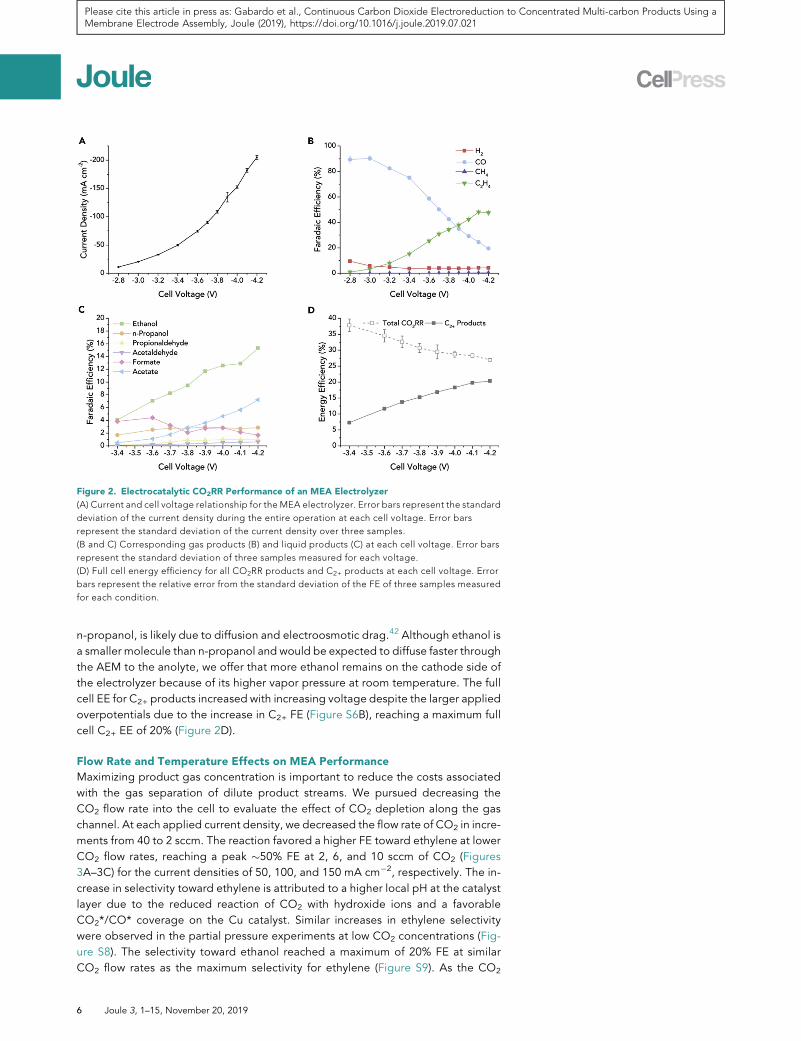
Figure 2. Electrocatalytic CO2RR Performance of an MEA Electrolyzer
(A) Current and cell voltage relationship for the MEA electrolyzer. Error bars represent the standard
deviation of the current density during the entire operation at each cell voltage. Error bars
represent the standard deviation of the current density over three samples.
(B and C) Corresponding gas products (B) and liquid products (C) at each cell voltage. Error bars
represent the standard deviation of three samples measured for each voltage.
(D) Full cell energy efficiency for all CO2RR products and C2+ products at each cell voltage. Error
bars represent the relative error from the standard deviation of the FE of three samples measured
for each condition.
Please cite this article in press as: Gabardo et al., Continuous Carbon Dioxide Electroreduction to Concentrated Multi-carbon Products Using aMembrane Electrode Assembly, Joule (2019), https://doi.org/10.1016/j.joule.2019.07.021
n-propanol, is likely due to diffusion and electroosmotic drag.42 Although ethanol is
a smaller molecule than n-propanol and would be expected to diffuse faster through
the AEM to the anolyte, we offer that more ethanol remains on the cathode side of
the electrolyzer because of its higher vapor pressure at room temperature. The full
cell EE for C2+ products increased with increasing voltage despite the larger applied
overpotentials due to the increase in C2+ FE (Figure S6B), reaching a maximum full
cell C2+ EE of 20% (Figure 2D).
Flow Rate and Temperature Effects on MEA Performance
Maximizing product gas concentration is important to reduce the costs associated
with the gas separation of dilute product streams. We pursued decreasing the
CO2 flow rate into the cell to evaluate the effect of CO2 depletion along the gas
channel. At each applied current density, we decreased the flow rate of CO2 in incre-
ments from 40 to 2 sccm. The reaction favored a higher FE toward ethylene at lower
CO2 flow rates, reaching a peak �50% FE at 2, 6, and 10 sccm of CO2 (Figures
3A–3C) for the current densities of 50, 100, and 150 mA cm�2, respectively. The in-
crease in selectivity toward ethylene is attributed to a higher local pH at the catalyst
layer due to the reduced reaction of CO2 with hydroxide ions and a favorable
CO2*/CO* coverage on the Cu catalyst. Similar increases in ethylene selectivity
were observed in the partial pressure experiments at low CO2 concentrations (Fig-
ure S8). The selectivity toward ethanol reached a maximum of 20% FE at similar
CO2 flow rates as the maximum selectivity for ethylene (Figure S9). As the CO2
6 Joule 3, 1–15, November 20, 2019

Figure 3. Increasing Gas and Liquid Product Concentrations at the Cathode Gas Outlet
(A–C) The effect of CO2 flow rates on gas product selectivity at 50 mA cm�2 (A), 100 mA cm�2 (B),
and 150 mA cm�2 (C). Error bars represent the standard deviation of three samples measured for
each condition.
(D) Gas composition of cathode outlet gas as a percentage for ethylene and total CO2RR product at
50, 100, and 150 mA cm�2. Error bars represent the relative error from the standard deviation of the
FE of three samples measured for each condition.
(E) Effect of temperature on the current density. Error bars represent the standard deviation of the
current density over three samples.
(F) Amounts and ratios of ethanol FEs that are recovered from the cathode and anode streams at
each temperature. The ethanol FEs were selected for the maximum cathode to anode ratio at each
temperature.
Please cite this article in press as: Gabardo et al., Continuous Carbon Dioxide Electroreduction to Concentrated Multi-carbon Products Using aMembrane Electrode Assembly, Joule (2019), https://doi.org/10.1016/j.joule.2019.07.021
flow rates were further reduced, the CO2 single-pass conversion (defined as the ratio
of CO2 converted into CO2RR products to the total CO2 fed into the electrolyzer)
continued to increase (>30% at 2 sccm) (Figure S9); however, when flow rates
were reduced past the point of peak ethylene selectivity, we observed CO2 mass
transport limitations and, consequently, increased hydrogen production. The
maximum concentration of the CO2RR gas products in the gas outlet reached a
peak of 65% at a flow rate of 3 sccm while operating at 50 mA cm�2, with 30% of
the outlet gas composed of ethylene (Figure 3D). This finding suggests that a system
that depletes CO2 along the channel could retain high FE performance toward
CO2RR and release concentrated gas products at the outlet.
Joule 3, 1–15, November 20, 2019 7
Please cite this article in press as: Gabardo et al., Continuous Carbon Dioxide Electroreduction to Concentrated Multi-carbon Products Using aMembrane Electrode Assembly, Joule (2019), https://doi.org/10.1016/j.joule.2019.07.021
Next, we investigated the impact of temperature on the MEA performance and
liquid product concentration. The current densities for the MEA system increased
(Figure 3E) with temperature, a finding we assign to the increase in membrane ionic
conductivity with temperature and improved reaction kinetics.34 As a result, the par-
tial current densities toward hydrogen (Figure S10A) and ethylene (Figure S10B)
each increased with temperature, with a higher rate of increase for hydrogen. How-
ever, when considering the changes in kinetics of all the different reactions, it is
observed that the peak ethylene FE decreased and shifted to less negative voltages
(Figures S10C and S10E) with elevated temperatures. At higher temperature, we
observed an increased recovery of generated ethanol at the cathode outlet
compared to the amount that crossed to the anode (Figures 3F, S10D, and S10F),
a finding we attribute to increased water transport from the anode to the cathode,
and increased vaporization of ethanol from the higher temperatures. The maximum
concentration of ethanol was achieved at 40�C and was measured to be 2.3 wt %
(or 0.5 M), a significant enhancement in recovered product compared to the
0.5 wt % collected at 20�C.
Catalyst Tuning and MEA Stability
We hypothesized that the high availability of CO2 in the MEA system would allow us
to further tune the Cu catalyst towardmaximal C2+ EE. Increasing the thickness of the
Cu catalyst increases the active surface area for CO2RR by taking advantage of the
three-dimensional network of PTFE fibers in the GDL and allows for higher current
densities. This catalyst modification is possible in an MEA based-system because
of the elevated CO2 concentration at the Cu catalyst compared to the alkaline
flow cell (Figure S11). The alkaline flow cell has a short CO2 diffusion length where
a thin catalyst would be preferred to avoid HER6; however, the MEA is not as limited
by CO2 solubility, and reactant can diffuse further into the catalyst layer.
To develop a catalyst strategy for this MEA environment, we varied the thickness of
the sputtered Cu to 50 and 250 nm, while screening the voltage to assess the activity
of each catalyst (Figure 4A). Increasing the thickness of the sputtered Cu layer in-
creases the coverage of the catalyst on the fibrous PTFEmembrane support (SEM im-
ages of the catalysts of different thicknesses; Figures S1A, S11A, and S11B), account-
ing for increased electrical connection and decreased sheet resistance (Table S2).
This increased interconnectivity of the catalyst also increases the available reaction
area for CO2RR. The 250 nmCu catalyst reached peak ethylene at�3.9 V (Figure 4C)
and achieved a high C2+ FE of �80%, corresponding to an increase in the C2+ EE to
23% (Figure 4D). The ethanol that was recovered on the cathode when operating at
room temperature reached �2 wt % in the liquid cold trap (Figure 4F), a 4-fold in-
crease in ethanol concentration compared to the 150 nm Cu catalyst also at 20�C.
By combining the optimized catalyst with higher temperatures, concentrated
ethanol was generated which dissolved parts of the membrane and formed a hole
within a couple hours of operation. Substituting the Sustainion X37-50 membrane
with an Aemion AF1-CNN8-60-X membrane, we achieved 3.9 wt % (0.85 M) ethanol
and 1.3 wt % (0.2M) n-propanol on the cathode side while operating at 40�Cwith the
250 nm catalyst (schematic shown in Figure 4G). This represents the most concen-
trated alcohol production from CO2RR reported to date. In addition, ethanol con-
centrations >1 wt % are required for energetically feasible distillation from aqueous
solutions, with energy costs decreasing with increasing alcohol concentration.10
The stability of the MEA with the 250 nm Cu catalyst was evaluated through poten-
tiostatic electrolysis at a cell voltage of �3.75 V. Gas products were collected
8 Joule 3, 1–15, November 20, 2019
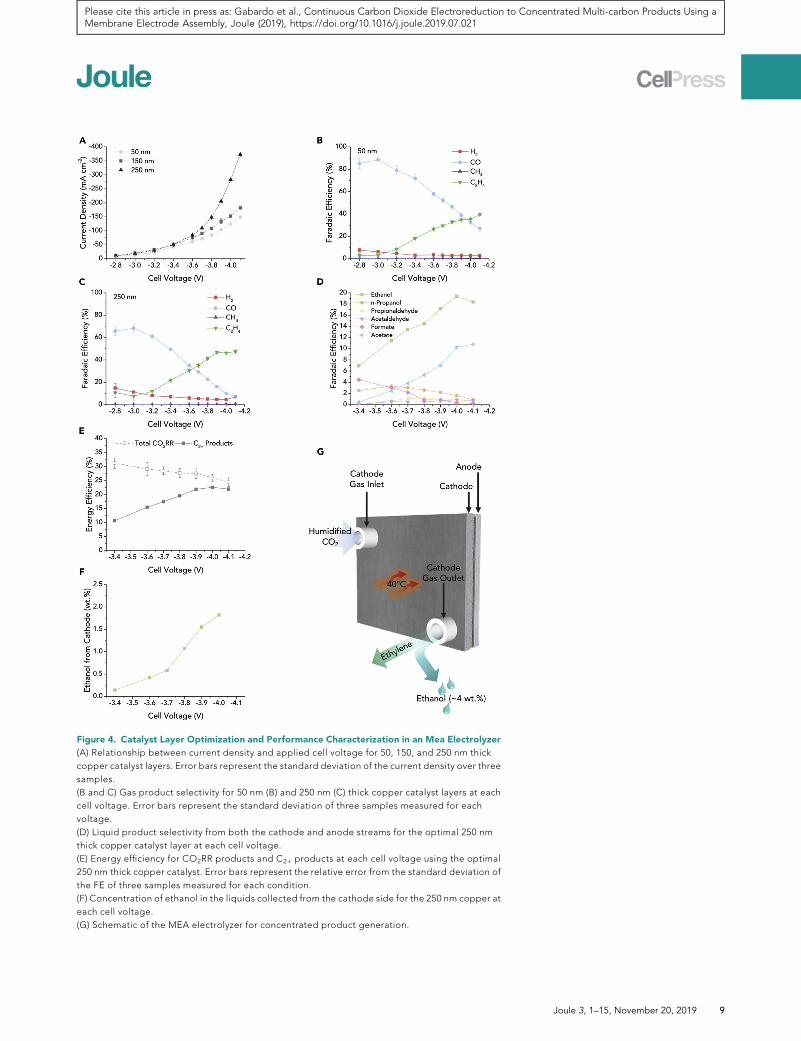
Figure 4. Catalyst Layer Optimization and Performance Characterization in an Mea Electrolyzer
(A) Relationship between current density and applied cell voltage for 50, 150, and 250 nm thick
copper catalyst layers. Error bars represent the standard deviation of the current density over three
samples.
(B and C) Gas product selectivity for 50 nm (B) and 250 nm (C) thick copper catalyst layers at each
cell voltage. Error bars represent the standard deviation of three samples measured for each
voltage.
(D) Liquid product selectivity from both the cathode and anode streams for the optimal 250 nm
thick copper catalyst layer at each cell voltage.
(E) Energy efficiency for CO2RR products and C2+ products at each cell voltage using the optimal
250 nm thick copper catalyst. Error bars represent the relative error from the standard deviation of
the FE of three samples measured for each condition.
(F) Concentration of ethanol in the liquids collected from the cathode side for the 250 nm copper at
each cell voltage.
(G) Schematic of the MEA electrolyzer for concentrated product generation.
Joule 3, 1–15, November 20, 2019 9
Please cite this article in press as: Gabardo et al., Continuous Carbon Dioxide Electroreduction to Concentrated Multi-carbon Products Using aMembrane Electrode Assembly, Joule (2019), https://doi.org/10.1016/j.joule.2019.07.021

Figure 5. Long-Term Stability of the Mea Electrolyzer and Distribution of Voltage Losses
(A) Current density and gas products measured during 100 h of continuous operation at �3.75 V
with the 250 nm thick copper catalyst.
(B) Stable ethylene partial current density for more than 24 h while operating at �3.9 V with the
250 nm thick copper catalyst. Total current density was >200 mA cm�2 at this applied cell voltage.
(C) Distribution of voltage losses measured in the MEA electrolyzer at 150 mA cm�2 (cell voltage
of �3.7 V).
Please cite this article in press as: Gabardo et al., Continuous Carbon Dioxide Electroreduction to Concentrated Multi-carbon Products Using aMembrane Electrode Assembly, Joule (2019), https://doi.org/10.1016/j.joule.2019.07.021
periodically and a single 200 mL volume of 0.1 M KHCO3 anolyte was recirculated
throughout the entire 100-h experiment. The MEA displayed a steady current den-
sity of approximately 120mA cm�2, as well as continuous ethylene production above
40% FE, throughout 100 h of operation (Figure 5A). Other gas products maintained
10 Joule 3, 1–15, November 20, 2019
Please cite this article in press as: Gabardo et al., Continuous Carbon Dioxide Electroreduction to Concentrated Multi-carbon Products Using aMembrane Electrode Assembly, Joule (2019), https://doi.org/10.1016/j.joule.2019.07.021
their FE across the experiment. In addition, the MEA electrolyzer used here is more
similar to a commercial system with smaller electrolyte volume per area that is recir-
culated rather than refreshed, and a larger electrode area than previous C2+
electrolyzers.6,7,13,43
This duration of uninterrupted operation time is 2 orders of magnitude longer than in
priorMEA electrolyzer reports of CO2RRC2+ production. It is accomplished at one order
of magnitude higher current density than in all prior MEA reports (Table S3). These im-
provements in ethylene stability were enabled by the combination of the robust Cu
catalyst and PTFE GDE with the locally alkaline environment of the cathode. The MEA
strategy was also assessed at a higher current density, >200 mA cm�2 by operating
at a cell voltage of �3.9 V. The partial current density of ethylene was
maintained >100 mA cm�2 throughout the entire 24 h operation (Figure 5B). Taken
together, these results indicate thatMEA systems enable increased stability inC2+ chem-
ical production toward the ultimate target of commercially viable CO2 electrolyzers.
The operating voltage of the MEA presented here is over 2 V higher than the
thermodynamic potential of the cell based on the product distribution at
150 mA cm�2 (�1.2 V). We performed an analysis to decouple all the sources of los-
ses in our cell and highlight areas that could be reduced to further improve the sys-
tem VE (Figure 5C). While operating at a current density of 150 mA cm�2, we
measured the cathode and anode overpotentials to be �0.71 and �0.70 V, respec-
tively, accounting for the majority of the losses in the system. The overpotential at
the cathode is similar to that of other C2+ alkaline liquid electrolyte flow cells,7 how-
ever, the anode could be improved further. At the same current density, we deter-
mined the voltage loss at the membrane and interfaces to be �0.16 and �0.17 V,
respectively, and the Nernstian pH losses to be �0.53 V. We have approximately
�0.23 V of unassigned losses which can be attributed to errors in our determination
of the other voltage loss sources in the system. We believe the accounting of the full
MEA system losses presented here will help direct future efforts to decrease the en-
ergy demand of operating similar systems.
Conclusion
We developed a CO2RR MEA electrolyzer strategy that outperforms incumbent
liquid electrolyte flow cells in terms of voltage and product stability, as well as prod-
uct concentration in the generation of C2+ products. The MEA electrolyzer operates
at industrially relevant current densities while simultaneously achieving high selec-
tivity toward multi-carbon products. The current densities reported here are at least
an order of magnitude greater than other CO2 to C2+ MEA electrolyzers.
Increasing operating temperature and decreasing CO2 flow rate, enables concen-
trated output liquid and gas product streams, respectively. To take further advan-
tage of the high CO2 availability provided by the MEA, we designed a cathodic cop-
per catalyst strategy to achieve a high FE and EE toward C2+ products (�80% and
23%, respectively), while effectively shedding concentrated liquid products (3.9 wt
% ethanol and 1.3 wt % n-propanol).
Finally, the stability of the MEA strategy was demonstrated through operation at
industrially relevant current densities for 100 h while maintaining steady, high selec-
tivity ethylene production. This is the only system, among all prior reactor reports,
that has been reported to maintain current densities above 100 mA cm�2 for over
100 h with high and stable selectivity toward ethylene with continuously recirculated
electrolyte.
Joule 3, 1–15, November 20, 2019 11

Please cite this article in press as: Gabardo et al., Continuous Carbon Dioxide Electroreduction to Concentrated Multi-carbon Products Using aMembrane Electrode Assembly, Joule (2019), https://doi.org/10.1016/j.joule.2019.07.021
EXPERIMENTAL PROCEDURES
Electrode Preparation
Cathodes were prepared by sputtering 150 nm of Cu (99.99%) onto a porous PTFE
membrane (0.45 mm pores), then airbrushed consecutively with carbon nanoparticle
and graphite powder inks, as previously reported.6 The anodes were prepared by
depositing IrO2 on a titanium support (0.002’’ thickness, Fuel Cell Store) by a dip
coating and thermal decomposition method.32 Briefly, the titanium mesh was first
degreased with acetone andDI water, then etched in a 6MHCl (Reagent Grade, Bio-
shop) solution heated to 80�C to 90�C for 45min before dip coating. The dip coating
solution consisted of 30 mg of IrCl3$xH2O (Alfa Aesar) dissolved in 10 mL of an iso-
propanol solution with 10% concentrated HCl. Subsequently, the etched titanium
mesh was dipped into the IrCl3 solution, dried in an oven at 100�C for 10 min before
calcination in a furnace at 500�C for 10 min. The dipping and calcination process was
repeated until a suitable loading was achieved (2 mg cm�2).
Electrolyzer Configuration
The CO2 reduction experiments in the MEA configuration were performed in a CO2
electrolyzer cell (Dioxide Materials, grade 2 titanium anode, and 904L stainless steel
cathode) with an active area of 5 cm2 accessed with a serpentine channel. The exper-
iments in the liquid flow cell configuration were performed in the same CO2 electro-
lyzer with an additional 3 mm thick, laser cut PMMA catholyte flow chamber, sealed
by two 1.5 mm silicone gaskets, resulting in a 6mm electrode spacing (Figure S3). All
the electrolyzer components were verified to be chemically resistant to all the reac-
tants and products under the CO2RR reaction potentials prior to experiments. An
anion exchange membrane (Sustainion X37-50 Grade RT, Dioxide Materials, or
Aemion AF1-CNN8-60-X, Ionomr) was inserted between the cathode and the IrO2
coated titanium mesh. Throughout all experiments, unless otherwise specified, 80
sccm of humidified CO2 was fed into the cathode flow channels using a mass flow
controller (Sierra SmartTrak 100), while the anode side was fed with 0.1 M KHCO3
electrolyte recirculated at 5 mL min�1 with a peristaltic pump. The cell was heated
in the elevated temperature experiments using two heaters (Dioxide Materials),
one on each side of the cell, connected to a temperature controller.
Electrochemical Measurements
An electrochemical workstation (Autolab PGSTAT204 with 10 A booster and FRA32
module) was used to measure the electrochemical response. The cell voltages re-
ported in all figures were recorded without iR correction.
The analysis of the voltage losses in the MEA electrolyzer was conducted at
150mA cm�2. The cathode overpotential was measured using an Ag/AgCl reference
electrode with 100% iR compensation in a flow cell with 0.5M K2CO3 electrolyte. The
anode overpotential was measured with an Ag/AgCl reference electrode with 100%
iR compensation while in an H-cell with 0.1 M KHCO3 electrolyte. In both cases, the
iR compensation was calculated using the ohmic resistance determined through
electrochemical impedance spectroscopy (EIS). The voltage losses in the membrane
was determined as the difference in the full cell potential running with and without a
membrane using 0.5 M K2CO3 electrolyte to ensure that the charge carrier through
the membrane is the same as in the MEA cell, as determined by other modeling
work38 and supported with our COMSOL model. The voltage losses through inter-
faces in the MEA cell were calculated by subtracting the membrane losses from
the full cell ohmic losses as determined using EIS between the anode and cathode
of the MEA cell. The Nernstian pH losses were calculated from the difference in
modeled local pH between the cathode and anode.
12 Joule 3, 1–15, November 20, 2019

Please cite this article in press as: Gabardo et al., Continuous Carbon Dioxide Electroreduction to Concentrated Multi-carbon Products Using aMembrane Electrode Assembly, Joule (2019), https://doi.org/10.1016/j.joule.2019.07.021
CO2RR Product Analysis
The gas products from CO2 reduction were taken from the cathode outlet in 1 mL vol-
umes after at least 20min of cell operation at a constant voltage or current to ensure sta-
ble performance. Flow rates and currents were measured just prior to collecting the gas
sample. The gas samples were analyzed with a gas chromatograph (PerkinElmer Clarus
590) coupled with a thermal conductivity detector (TCD) and flame ionization detector
(FID). Thegas chromatographwas equippedwith aMolecular Sieve 5ACapillaryColumn
andapackedCarboxen-1000Columnwithargonas the carriergas.Todetermine the vol-
ume fraction of the gas products in our outlet, the peaks are integrated and compared to
a calibration from known concentrations of a standard gas.
The liquid products were collected dripping from the gas side of the MEA using a
cold trap (Supelco, Sigma Aldrich) cooled in a water bath at 0�C to also condense
vapor-phase liquid CO2RR products. The liquid products from the contents of the
cold trap and the anolyte were quantified using proton nuclear magnetic reso-
nance spectroscopy (1H+ NMR) on an Agilent DD2 500 spectrometer in D2O using
water suppression mode, with dimethyl sulfoxide (DMSO) as the internal standard.
Calculations for FE and EE can be found in the Supplemental Information.
Electrode Characterization
The Cu catalyst surface and IrO2 on Ti mesh were characterized using scanning elec-
tron microscopy (SEM) at Centre For Nanostructure Imaging at the University of Tor-
onto using the Hitachi S-5200 high resolution scanning electron microscope.
COMSOL Continuum Transport Modeling
The system was modeled as a one-dimensional electrochemical cell for the reduction of
CO2 andH2O in 0.1MKHCO3with anAEMbetween the cathode and anode. Themodel
assumed a constant supply of CO2 into the catalyst layer from the GDE and a diffusion
boundary layer thickness of 100 mm in the anolyte. The model made every attempt to
mimic the experimental setup: the GDE was covered with a porous Cu catalyst layer,
whichwas stabilizedby carbonnanoparticles andgraphite. TheAEMseparated the cath-
ode and anode, after which anolyte was present. The species modeled include aqueous
CO2, CO32�, HCO3�, OH�, H+, K+, and H2O.
An in-depth model overview is outlined in previous literature,44,45 but, briefly, we
modeled all physics in COMSOL (COMSOL Multiphysics v5.4, Stockholm, Se) in
one dimension. Themodel incorporated polarization losses (ohmic, diffusive, Nerns-
tian), CO2 solubility (pressure, temperature, and Sechenov effects), species trans-
port (diffusive, reactive, and electromigrative), current density, and charge-transfer
reactions at the cathode and anode toward CO2RR, HER, and OER. The simulated
charge-transfer reactions were matched to the experimentally observed rates.
Feature conductivities and porosities were taken from empirical values. More details
in the Supplemental Information.
SUPPLEMENTAL INFORMATION
Supplemental Information can be found online at https://doi.org/10.1016/j.joule.
2019.07.021.
ACKNOWLEDGMENTS
The authors acknowledge support and infrastructure from the Natural Sciences and
Engineering Research Council (NSERC), the Government of Ontario through the
Joule 3, 1–15, November 20, 2019 13
Please cite this article in press as: Gabardo et al., Continuous Carbon Dioxide Electroreduction to Concentrated Multi-carbon Products Using aMembrane Electrode Assembly, Joule (2019), https://doi.org/10.1016/j.joule.2019.07.021
Ontario Research Fund—Research Excellence program, and the Canada Foundation
for Innovation. C.M.G. would like to thank NSERC for support in the form of a post-
doctoral fellowship award. C.P.O. thanks the Province of Ontario for their funding
toward graduate scholarships. J.P.E. thanks NSERC, Hatch, and the Government
of Ontario for their support through graduate scholarships. Y.X. thanks NSERC for
support in the form of a graduate scholarship. J.L. acknowledges the Banting Post-
doctoral Fellowships program. D.S. acknowledges the NSERC E.W.R Steacie Memo-
rial Fellowship and support from Canada Research Chairs Program. We would like to
acknowledge CMC Microsystems for the provision of products and services that
facilitated this research, including COMSOL Multiphysics.
AUTHOR CONTRIBUTIONS
C.M.G. and C.P.O. designed and carried out all experiments, as well as prepared the
manuscript. J.P.E and Y.X. performed NMR analysis and aided with experimental
setup. C.M. performed the COMSOL modeling simulations. C.T.D. and J.L. helped
with discussion of experimental design. E.H.S. and D.S. supervised the project. All
authors contributed to the discussion and analysis of data, as well as the editing
of the manuscript.
DECLARATION OF INTERESTS
The authors declare no competing interests.
Received: April 29, 2019
Revised: May 22, 2019
Accepted: July 23, 2019
Published: August 21, 2019
REFERENCES
1. Whipple, D.T., and Kenis, P.J.A. (2010).Prospects of CO2 utilization via directheterogeneous electrochemical reduction.J. Phys. Chem. Lett. 1, 3451–3458.
2. Bushuyev, O.S., De Luna, P., Dinh, C.T., Tao, L.,Saur, G., van de Lagemaat, J., Kelley, S.O., andSargent, E.H. (2018). What should we makewith CO2 and how can wemake it? Joule 2, 1–4.
3. Li, C.W., and Kanan, M.W. (2012). CO2
reduction at low overpotential on Cuelectrodes resulting from the reduction of thickCu2O films. J. Am. Chem. Soc. 134, 7231–7234.
4. Raciti, D., Livi, K.J., and Wang, C. (2015). Highlydense Cu nanowires for low-overpotential CO2
reduction. Nano Lett. 15, 6829–6835.
5. Tang, W., Peterson, A.A., Varela, A.S., Jovanov,Z.P., Bech, L., Durand, W.J., Dahl, S., Nørskov,J.K., and Chorkendorff, I. (2012). Theimportance of surface morphology incontrolling the selectivity of polycrystallinecopper for CO2 electroreduction. Phys. Chem.Chem. Phys. 14, 76–81.
6. Dinh, C.T., Burdyny, T., Kibria, M.G.,Seifitokaldani, A., Gabardo, C.M., Garcıa deArquer, F.P.G., Kiani, A., Edwards, J.P., DeLuna, P., Bushuyev, O.S., et al. (2018). CO2
electroreduction to ethylene via hydroxide-mediated copper catalysis at an abruptinterface. Science 360, 783–787.
7. Ma, S., Sadakiyo, M., Luo, R., Heima, M.,Yamauchi, M., and Kenis, P.J.A. (2016). One-
14 Joule 3, 1–15, November 20, 2019
step electrosynthesis of ethylene and ethanolfrom CO2 in an alkaline electrolyzer. J. PowerSources 301, 219–228.
8. Jouny, M., Luc, W., and Jiao, F. (2018). Generaltechno-economic analysis of CO2 electrolysissystems. Ind. Eng. Chem. Res. 57, 2165–2177.
9. Verma, S., Kim, B., Jhong, H.R.M., Ma, S., andKenis, P.J.A. (2016). A gross-margin model fordefining technoeconomic benchmarks in theelectroreduction of CO2. ChemSusChem 9,1972–1979.
10. Greenblatt, J.B., Miller, D.J., Ager, J.W., Houle,F.A., and Sharp, I.D. (2018). The technical andenergetic challenges of separating (photo)electrochemical carbon dioxide reductionproducts. Joule 2, 381–420.
11. Ripatti, D.S., Veltman, T.R., and Kanan, M.W.(2019). Carbon monoxide gas diffusionelectrolysis that produces concentrated C2
products with high single-pass conversion.Joule 3, 240–256.
12. Dıaz-Sainz, G., Alvarez-Guerra, M., Solla-Gullon, J., Garcıa-Cruz, L., Montiel, V., andIrabien, A. (2019). CO2 electroreduction toformate: continuous single-pass operation in afilter-press reactor at high current densitiesusing Bi gas diffusion electrodes. J. CO2 Util.34, 12–19.
13. De Luna, P., Quintero-Bermudez, R., Dinh,C.-T., Ross, M.B., Bushuyev,O.S., Todorovi�c, P.,Regier, T., Kelley, S.O., Yang, P., and Sargent,
E.H. (2018). Catalyst electro-redepositioncontrols morphology and oxidation state forselective carbon dioxide reduction. Nat. Catal.1, 103–110.
14. Lv, J.J., Jouny, M., Luc, W., Zhu, W., Zhu, J.J.,and Jiao, F. (2018). A highly porous copperelectrocatalyst for carbon dioxide reduction.Adv. Mater. 30, e1803111.
15. Kibria, M.G., Dinh, C.T., Seifitokaldani, A., DeLuna, P., Burdyny, T., Quintero-Bermudez, R.,Ross, M.B., Bushuyev, O.S., Garcıa de Arquer,F.P., Yang, P., et al. (2018). A surfacereconstruction route to high productivity andselectivity in CO2 electroreduction toward C2+hydrocarbons. Adv. Mater. 30, e1804867.
16. Hoang, T.T.H.H., Verma, S., Ma, S., Fister, T.T.,Timoshenko, J., Frenkel, A.I., Kenis, P.J.A.A.,and Gewirth, A.A. (2018). Nanoporous copper-silver alloys by additive-controlled electro-deposition for the selective electroreduction ofCO2 to ethylene and ethanol. J. Am. Chem.Soc. 140, 5791–5797.
17. Jouny, M., Luc, W., and Jiao, F. (2018). High-rate electroreduction of carbon monoxide tomulti-carbon products. Nat. Catal. 1, 748–755.
18. Pang, Y., Li, J., Wang, Z., Tan, C.-S., Hsieh, P.-L.,Zhuang, T.-T., Liang, Z.-Q., Zou, C., Wang, X.,De Luna, P., et al. (2019). Efficientelectrocatalytic conversion of carbonmonoxide to propanol using fragmentedcopper. Nat. Catal. 2, 251–258.
Please cite this article in press as: Gabardo et al., Continuous Carbon Dioxide Electroreduction to Concentrated Multi-carbon Products Using aMembrane Electrode Assembly, Joule (2019), https://doi.org/10.1016/j.joule.2019.07.021
19. Li, J., Che, F., Pang, Y., Zou, C., Howe, J.Y.,Burdyny, T., Edwards, J.P., Wang, Y., Li, F.,Wang, Z., et al. (2018). Copper adparticleenabled selective electrosynthesis ofn-propanol. Nat. Commun. 9, 4614.
20. Zhuang, T.-T., Pang, Y., Liang, Z.-Q., Wang, Z.,Li, Y., Tan, C.-S., Li, J., Dinh, C.T., De Luna, P.,Hsieh, P.-L., et al. (2018). Copper nanocavitiesconfine intermediates for efficientelectrosynthesis of C3 alcohol fuels fromcarbon monoxide. Nat. Catal. 1, 946–951.
21. Gabardo, C.M., Seifitokaldani, A., Edwards,J.P., Dinh, C.T., Burdyny, T., Kibria, M.G.,O’Brien, C.P., Sargent, E.H., and Sinton, D.(2018). Combined high alkalinity andpressurization enable efficient CO2
electroreduction to CO. Energy Environ. Sci.11, 2531–2539.
22. Jeanty, P., Scherer, C., Magori, E., Wiesner-Fleischer, K., Hinrichsen, O., and Fleischer, M.(2018). Upscaling and continuous operation ofelectrochemical CO2 to CO conversion inaqueous solutions on silver gas diffusionelectrodes. J. CO2 Util. 24, 454–462.
23. Haas, T., Krause, R., Weber, R., Demler, M., andSchmid, G. (2018). Technical photosynthesisinvolving CO2 electrolysis and fermentation.Nat. Catal. 1, 32–39.
24. Kim, B., Ma, S., Molly Jhong, H.R., and Kenis,P.J.A. (2015). Influence of dilute feed and pH onelectrochemical reduction of CO2 to CO on Agin a continuous flow electrolyzer. Electrochim.Acta 166, 271–276.
25. Dufek, E.J., Lister, T.E., and McIlwain, M.E.(2012). Influence of electrolytes andmembranes on cell operation for syn-gasproduction. Electrochem. Solid-State Lett. 15,B48–B50.
26. Merino-Garcia, I., Albo, J., and Irabien, A.(2018). Tailoring gas-phase CO2
electroreduction selectivity to hydrocarbons atCu nanoparticles. Nanotechnology 29, 014001.
27. Gutierrez-Guerra, N., Valverde, J.L., Romero,A., Serrano-Ruiz, J.C., and de Lucas-Consuegra, A. (2017). Electrocatalyticconversion of CO2 to added-value chemicals ina high-temperature proton-exchange
membrane reactor. Electrochem. Commun. 81,128–131.
28. Aeshala, L.M., Uppaluri, R., and Verma, A.(2014). Electrochemical conversion of CO2 tofuels: tuning of the reaction zone using suitablefunctional groups in a solid polymerelectrolyte. Phys. Chem. Chem. Phys. 16,17588–17594.
29. Genovese, C., Ampelli, C., Perathoner, S., andCenti, G. (2013). Electrocatalytic conversion ofCO2 on carbon nanotube-based electrodes forproducing solar fuels. J. Catal. 308, 237–249.
30. Cook, R.L., Macduff, R.C., and Sammells, A.F.(1988). On the electrochemical reduction ofcarbon dioxide at in situ electrodepositedcopper. J. Electrochem. Soc. 135, 1320–1326.
31. Dewulf, D.W., and Bard, A.J. (1988). Theelectrochemical reduction of CO2 to CH4 andC2H4 at Cu/nafion electrodes (solid polymerelectrolyte structures). Catal. Lett. 1, 73–79.
32. Luc, W., Rosen, J., and Jiao, F. (2017). AnIr-based anode for a practical CO2 electrolyzer.Catal. Today 288, 79–84.
33. Zheng, T., Jiang, K., Ta, N., Hu, Y., Zeng, J., Liu,J., and Wang, H. (2019). Large-scale and highlyselective CO2 electrocatalytic reduction onnickel single-atom catalyst. Joule 3, 265–278.
34. Kutz, R.B., Chen, Q., Yang, H., Sajjad, S.D., Liu,Z., and Masel, I.R. (2017). Sustainionimidazolium-functionalized polymers forcarbon dioxide electrolysis. Energy Technol. 5,929–936.
35. Liu, Z., Masel, R.I., Chen, Q., Kutz, R., Yang, H.,Lewinski, K., Kaplun, M., Luopa, S., and Lutz,D.R. (2016). Electrochemical generation ofsyngas from water and carbon dioxide atindustrially important rates. J. CO2 Util. 15,50–56.
36. Hori, Y., Murata, A., and Yoshinami, Y. (1991).Adsorption of carbon monoxide,intermediately formed in electrochemicalreduction of carbon dioxide, at a copperelectrode. J. Chem. Soc. Faraday Trans. 87,125–128.
37. Peterson, A.A., Abild-Pedersen, F., Studt, F.,Rossmeisl, J., and Nørskov, J.K. (2010). How
copper catalyzes the electroreduction ofcarbon dioxide into hydrocarbon fuels. EnergyEnviron. Sci. 3, 1311–1315.
38. Weng, L.-C., Bell, A.T., and Weber, A.Z. (2019).Towards membrane-electrode assemblysystems for CO2 reduction: a modeling study.Energy Environ. Sci. 12, 1950–1968.
39. Burke, L.D., and O’Dwyer, K.J. (1989).Mediation of oxidation reactions at noblemetal anodes by low levels of in situ generatedhydroxy species. Electrochim. Acta 34, 1659–1664.
40. Roca-Ayats, M., Garcıa, G., Soler-Vicedo, M.,Pastor, E., Lazaro, M.J., and Martınez-Huerta,M.V. (2015). The role of Sn, Ru and Ir on theethanol electrooxidation on Pt3M/TiCNelectrocatalysts. Int. J. Hydr. Energy 40, 14519–14528.
41. Hammond, C., Schumperli, M.T., Conrad, S.,and Hermans, I. (2013). Hydrogen transferprocesses mediated by supported iridiumoxide nanoparticles. ChemCatChem 5, 2983–2990.
42. Li, Y.C., Yan, Z., Hitt, J., Wycisk, R., Pintauro,P.N., and Mallouk, T.E. (2018). Bipolarmembranes inhibit product crossover in CO2
electrolysis cells. Adv. Sustainable Syst. 2.
43. Hoang, T.T.H., Verma, S., Ma, S., Fister, T.T.,Timoshenko, J., Frenkel, A.I., Kenis, P.J.A., andGewirth, A.A. (2018). Nano porous copper-silver alloys by additive-controlled electro-deposition for the selective electroreduction ofCO2 to ethylene and ethanol. J. Am. Chem.Soc.
44. Singh, M.R., Clark, E.L., and Bell, A.T. (2015).Effects of electrolyte, catalyst, and membranecomposition and operating conditions on theperformance of solar-driven electrochemicalreduction of carbon dioxide. Phys. Chem.Chem. Phys. 17, 18924–18936.
45. Singh, M.R., Goodpaster, J.D., Weber, A.Z.,Head-Gordon, M., and Bell, A.T. (2017).Mechanistic insights into electrochemicalreduction of CO2 over Ag using densityfunctional theory and transport models. Proc.Natl. Acad. Sci. USA 114, E8812–E8821.
Joule 3, 1–15, November 20, 2019 15