contingent valuation and lost passive use: damages …rcarson/papers/exxonere.pdf · contingent...
TRANSCRIPT
Environmental and Resource Economics 25: 257–286, 2003.© 2003 Kluwer Academic Publishers. Printed in the Netherlands.
257
Contingent Valuation and Lost Passive Use:Damages from the Exxon Valdez Oil Spill
RICHARD T. CARSON1, ROBERT C. MITCHELL2, MICHAELHANEMANN3, RAYMOND J. KOPP4, STANLEY PRESSER5 andPAUL A. RUUD3
1University of California, San Diego, USA; 2Clark University, USA; 3University of California,Berkeley, USA; 4Resources for the Future, USA; 5University of Maryland, USA
Accepted 31 March 2003
Abstract. We report on the results of a large-scale contingent valuation (CV) study conducted afterthe Exxon Valdez oil spill to assess the harm caused by it. Among the issues considered are the designfeatures of the CV survey, its administration to a national sample of U.S. households, estimation ofhousehold willingness to pay to prevent another Exxon Valdez type oil spill, and issues related toreliability and validity of the estimates obtained. Events influenced by the study’s release are alsobriefly discussed.
Key words: natural resource damage assessment
JEL classification: Q26
1. Introduction
On the night of 24 March 1989, the Exxon Valdez left the port of Valdez, Alaskaand was steaming through the Valdez Narrows on its way to the open waters ofPrince William Sound. The tanker left the normal shipping lanes to avoid icebergsfrom the nearby Columbia Glacier and ran into the submerged rocks of Bligh Reef;its crew failed to realize how far off the shipping lanes the tanker had strayed.1 Oilcompartments ruptured, releasing 11 million gallons of Prudhoe Bay crude oil intothe Prince William Sound. It was the largest tanker spill in U.S. waters and to thepublic it was one of the major environmental disasters in U.S. history.
Prior to the Exxon Valdez oil spill, the estimation of passive use value (Carson,Flores and Mitchell 1999) or as it has often been previously termed, nonuseor existence value, was an area of economic research not well known to manyeconomists working outside the area of benefit cost analysis of projects involvingenvironmental amenities and health risks. However, based on a belief that theState of Alaska and the Federal Government intended to litigate a natural resourcedamage claim for lost passive use value, the attention paid to the conceptual

258 RICHARD T. CARSON ET AL.
underpinnings and estimation techniques for passive use value changed ratherabruptly.
Further sparking the rapidly growing interest in passive use values was animportant 1989 court opinion, Ohio v. U.S. Department of the Interior,2 whichremanded back to the Department of the Interior (DOI) various components ofits regulations for conducting natural resource damage assessments under theClean Water Act and the Comprehensive, Environmental Response, Compensationand Liability Act (CERCLA), commonly known as Superfund.3 Two particularlyimportant aspects of the court’s ruling for passive use value were its findingsthat: (1) passive use losses were compensable under those Acts and (2) the DOIhierarchy of damage assessment techniques, which placed contingent valuationat the bottom, was unjustified.4 Interest in passive use values was also height-ening at the time of the study by the passage of the Oil Pollution Act of 1990(OPA) and the regulations that National Oceanic and Atmospheric Administration(NOAA) enacted under it for natural resource damage assessments. The regulationsstated: “NOAA believes that the trustee(s) should have the discretion to includepassive use values as a component within the natural resource damage assessmentdetermination of compensable values.5
This brings us to the current debate over contingent valuation. It is gener-ally recognized that only stated preference methods (Mitchell and Carson 1989;Louviere, Hensher and Swait 2000; Carson, Flores and Meade 2001) are applic-able to the estimation of passive use value. Unlike direct use of resources, wherefor example, one can potentially observe individuals boating and fishing and usethese observations to build economic models permitting inference about the valueindividuals place on such activities,6 passive use entails no direct involvement withnatural resources. As a result, economists are fond of saying passive use leaves nobehavioral trace.
Contingent valuation is a survey approach designed to create the missing marketfor public goods by determining what people would be willing to pay (WTP) forspecified changes in the quantity or quality of such goods or, more rarely, whatthey would be willing to accept (WTA) in compensation for well-specified degrad-ations in the provision of these goods (Hanemann 1999; Bateman et al. 2002).7
Contingent valuation (CV) circumvents the absence of markets for natural resourceservices by presenting consumers with a choice situation in which they have theopportunity to buy or sell the services in question. A CV scenario may be modeledafter either a private market or a political referendum. The popular name for thisform of non-market valuation arose because the elicited values are contingent uponthe particular scenario described to survey respondents.
It is fair to say that the debate within the economics community, instigated bythe Exxon Valdez spill and the natural resource damage provisions of various laws,includes discussions of both the conceptual underpinnings of passive use and thetechnique for its measurement. However, it is the measurement technique itself,which has been the target of the sharpest criticism. Much of the recent criticism

CONTINGENT VALUATION AND LOST PASSIVE USE 259
of CV is contained in the Exxon-sponsored conference volume, Hausman (1993),and written submissions directed to writers of natural resource damage assess-ment regulations in DOI and NOAA.8 To help assess these comments, the NOAAGeneral Counsel, Thomas Campbell, formed a panel of social scientists to explic-itly consider the criticisms of contingent valuation and make recommendations toNOAA. The panel was co-chaired by Kenneth Arrow and Robert Solow and wascomprised of three additional economists: Edward Leamer of the University ofCalifornia, Los Angeles, Paul Portney of Resources for the Future and Roy Radnerof Bell Laboratories, as well as Howard Schuman, former Director of the SurveyResearch Center at the University of Michigan. The panel concluded that CVstudies convey “useful information” for damage assessment including lost passiveuse values, provided they follow a number of “stringent guidelines” (Arrow et al.1993). The recommendations of this panel have influenced the form of both theNOAA and DOI regulations and the wider academic debate.
The results of the CV study conducted for the State of Alaska in preparationfor the Exxon Valdez litigation presented here represented the contemporary state-of-the-art, and therefore, stands as a reference point that may be used to assessthe criticisms of CV and perhaps the more general debate surrounding passiveuse. Most of the recommendations made by the NOAA panel to help insure thereliability of CV estimates of lost passive use had already been implemented in theAlaska study including: (1) the use of rigorous probability sampling with a highresponse rate, (2) in-person interviews, (3) a discrete choice referendum elicitationformat, (4) accurate description of the program, (5) conservative design features,(6) checks on understanding and acceptance, (7) debriefing questions following thereferendum questions, and (8) careful pretesting. As much of the debate focuses onold CV studies, or small experiments, a reference point portraying CV practicewhen substantial resources were available to undertake the study should enhancethe quality of the debate.9
The plan of the paper is as follows. Section 2 discusses the design and develop-ment of the survey questionnaire used in the study. Section 3 reviews for the readerthe crucial elements of the survey. In section 4 we discuss the execution of thesurvey including survey sampling, interviewer training, and survey administration.Section 5 presents statistical results, and section 6 contains a postscript on theExxon Valdez settlement.
2. Survey Design and Development
The Exxon Valdez CV survey instrument was developed over an 18-month periodfrom July 1989 to January 1991. It was designed to be administered, face-to-face, to a national sample. The central part of the survey instrument was thevaluation scenario that described the damages caused by the Exxon Valdez oilspill and established a referendum market for eliciting the value respondentsplace on preventing a future accident that would cause an equivalent amount of

260 RICHARD T. CARSON ET AL.
damage in the Prince William Sound area. Other questions preceding and followingthe scenario asked about the respondent’s attitudes, previous awareness of thespill, understanding of the scenario, and personal characteristics. At appropriateplaces during the in-person interview, display cards, photographs, and maps wereshown to the respondent to supplement the information conveyed verbally by theinterviewer.
2.1. INITIAL DEVELOPMENT
An extensive program of instrument development research was conducted. The firststage of instrument development involved exploratory research primarily throughfocus groups. In the second stage, an initial draft questionnaire was produced andrevised during a series of one-on-one interviews followed by informal field testing.The third and final stage involved formal field testing and further developmentwork, including a series of four pilot surveys.
The research goal was to develop a valid survey instrument to measure lostpassive use values due to the natural resource injuries caused by the Exxon Valdezoil spill. This is a demanding task for the survey designer because the instrumenthad to meet multiple goals. The first was to measure only a defined set of injuries.This required carefully describing the specific injuries to be valued, the variousrecovery times for the injured resources, and the available substitutes, to ensure asmuch as possible that respondents did not value more extensive or less extensiveinjuries than intended.10 Open-ended questions at various points in the valuationscenario and diagnostic questions that followed the valuation scenario were usedto gauge success in meeting this goal.
The second objective was to ensure consistency with economic theory byeliciting an approximation to the monetized loss in utility suffered by the respond-ents as a result of the injuries caused by the spill.
The third objective was a basic survey research goal: respondents from alleducational levels and varied life experiences should be able to comprehend thelanguage, concepts, and questions used in the survey so that they could make aninformed decision. The particular challenge in CV surveys is to convey to respond-ents what they would get, how it would be provided, and that they would haveto pay for it. Given the amount of information it was necessary to convey in thesurvey, this required an extended period of instrument development research, whichis described below. Various diagnostic checks were used in the survey to determineacceptance of scenario features.
Plausibility, the fourth objective, requires that a respondent find the scenario andthe payment vehicle believable. Lack of plausibility is a major source of error inCV surveys because it keeps respondents from taking the choice situation seriously.We took various steps to enhance plausibility, including the use of WTP rather thanWTA elicitation questions.11 A referendum format asked respondents to make a

CONTINGENT VALUATION AND LOST PASSIVE USE 261
judgment as to whether they would vote for or against a program that, if adopted,would cost their household a specified amount.
The fifth objective was neutrality: the wording and information in the surveyinstrument should not be perceived by respondents as promoting the interests ofany particular party such as the oil companies, government or environmentalists.12
The instrument’s wording was critically peer reviewed at various stages in its devel-opment to help assess our success in meeting this objective. A diagnostic questionabout who the respondents believed was sponsoring the study was also included tosee if one party was identified more than another.
The final objective was to be conservative in estimating WTP. When faced witha decision between two wording, design, or analysis options, neither of which wasclearly preferred on the basis of theory or solid methodological grounds, we chosethe one that would, if it had any effect, lower the aggregate WTP amount. Onthis basis, for example, pictures of oiled birds were not shown to respondents, aone-time payment was used rather than installment payments, and “don’t know”responses were treated as “no” votes instead of dropping them from the sample.
2.2. DESIGN RESEARCH
During the first stage of the instrument development, we conducted six focusgroups (Krueger 1988)13 in different locations around the United States. In thefirst groups, discussions explored participant knowledge of the Exxon Valdez spill,beliefs about the cause and nature of the harm, and perceptions of the plausi-bility of possible ways of preventing a future spill. Once particular patterns ofunderstanding and knowledge were established and confirmed, new topics wereintroduced in subsequent groups.14
In the next stage, which took place in the fall of 1989, we developed a draft ofthe questionnaire and used it to conduct trial interviews. During these in-depth one-on-one interviews, the instrument was repeatedly revised to refine the informationit presented and to improve its clarity and flow before experienced interviewerstested it in the field.
During the third stage of instrument development research, which took placefrom February to November 1990, we conducted four pilot surveys in various partsof the country.15 The pilots allowed us to test the instrument in a setting close to thatof the final survey, obtain quantitative data to assess how the survey instrument wasworking, and conduct split-sample experiments to investigate key design issues.The location, date, and sample size of the pilot surveys are shown in Table I.16
After each pilot, we analyzed the data and revised the questionnaire on thebasis of the analysis and extensive interviewer debriefings. The instrument wasiteratively revised and improved in this manner until we were confident it met ourresearch objectives.

262 RICHARD T. CARSON ET AL.
Table I. Pilot studies for Exxon Valdez study
Pilot I San Jose, California February, 1990 N = 105
Pilot II Dayton & Toledo, Ohio May, 1990 N = 195
Pilot III Five rural counties in Georgia September, 1990 N = 244
Pilot IV Dayton & Toledo, Ohio November, 1990 N = 176
2.3. KEY DESIGN ISSUES
Key design issues for this study included the choice of the elicitation method, thenature of the payment vehicle, the years over which payments are collected, andwhether the good is valued in a sequence which includes other goods.
With respect to the elicitation method, we determined early in the processthat respondents should be asked a binary discrete choice question (Bishop andHeberlein 1979). This type of question, often called a take-it-or-leave-it question,requests the respondent give a yes-or-no response to a specific cost. A single take-it-or-leave-it referendum-like question for a public good is incentive-compatibleunder fairly general conditions when the government has the ability to compelpayment if the policy is implemented; that is, a respondent can do no betterthan saying “yes” if the policy is actually preferred at the specified cost or bysaying “no” if otherwise. The simple binary discrete choice elicitation has beenextended to the double-bounded dichotomous choice question (Hanemann, Loomisand Kanninen 1991). Here the respondent is asked to give a yes-or-no responseto a second pre-specified higher amount if the response to the initial take-it-or-leave-it question is “yes” and to a pre-specified lower amount if the initial responseis “no.” Using both responses substantially increases the statistical power of theWTP estimate, i.e., it tends to produce a much tighter confidence interval for theWTP estimate for any fixed sample size; however, it does so at the expense ofa downward bias in the estimate because the second response is not, in general,incentive-compatible.17
Of the three natural choices for the payment vehicle – higher taxes – higheroil prices, and higher prices over a wider range of goods – only the first two werefound to be plausible in our preliminary research. After conducting split-samplecomparisons of a tax and an oil price vehicle in Pilots II and III, we decided touse the tax vehicle in the final survey for two reasons. First, the price of gasoline,the major type of oil product through which consumers would pay for the plan ifwe used the oil prices vehicle, had become quite unstable due to Iraq’s invasionof Kuwait. It appeared likely that gasoline prices would increase rapidly in thenear future when the final survey would be in the field or, perhaps, decrease if thecrisis was resolved peacefully. This instability raised the prospect that if we usedthe oil prices vehicle, the respondents’ WTP amounts might be distorted becauseof factors unrelated to any economic value they held for preventing future damage

CONTINGENT VALUATION AND LOST PASSIVE USE 263
to Prince William Sound. Second, the two split-sample experiments showed that,if anything, the tax vehicle tended to elicit the same (Pilot III) or lower (Pilot II)amounts than those elicited by the oil prices vehicle.
With respect to the number of years over which payments are collected, threemajor issues were considered. First, longer payment periods mean that budgetconstraints, particularly for lower income households, are less binding. Second,periodic payments tend to assure respondents that the good will be provided infuture years. Third, with multiple year payments some respondents may believethat it is possible for the government to recontract if better opportunities comealong. There was no obvious a priori basis on which to choose between the lumpsum and the annual payment schemes. On the basis of additional focus groupwork and a telephone survey, we chose the lump-sum payment.18 Focus groupparticipants were committed to making at least the initial payment and generally topaying for two or three additional years, but any payment schedule longer than thatappeared to suffer from the recontracting problem. The lump-sum payment avoidsthis problem and has the advantage of eliminating the need to determine what rateought to be applied to discount future payments. It also has the disadvantage offorcing a much tighter budget constraint on respondents, a conservative feature.
Finally, there were two choices related to “embedding.”19 The first was whetherto value the good of primary interest by itself or in a sequence of other substitutepublic goods. Here economic theory provides some important guidance for thevaluation of natural resource damages.20 Due to substitution and income effects,the later in a WTP sequence a normal good is valued, the lower its value. Theopposite, however, is true of a WTA sequence; the later in such a sequence a goodis valued, the greater its value. These two propositions can be combined with thefact that WTA compensation for a good is greater than or equal to willingness topay for the same good (Hanemann 1991) to show that valuing a good first (i.e.,by itself) in a WTP sequence is the closest approximation to whatever sequence-specific WTA compensation measure is desired (short of being able to measurewillingness to accept directly, which is generally difficult to do).
The second “embedding” choice was methodological: the design should ensurethat respondents do not answer a different question than the one they are asked,whether by forgetting about their budget constraints or by letting Prince WilliamSound stand for all oil spills or even all environmental damage. To meet thisrequirement, the scenario must present a plausible choice situation describing thegood and its method of provision in adequate detail so that the respondents knowwhat they will and what they will not get. The design choice is whether to valuemultiple goods in a single survey or to value a single good and carefully differen-tiate it in the instrument from those other goods with which it might be confused. Asurvey valuing a single good was used for two reasons. First, it avoids difficultiesthat are introduced by valuing multiple goods. Second, well-designed single-goodCV surveys have been shown to be capable of eliciting values that are sensitive

264 RICHARD T. CARSON ET AL.
to the characteristics of the good being valued (Carson and Mitchell 1995; Carson1997; Carson, Flores and Meade 2001).
In constructing the scenario for this study, we took several steps to minimize thepossibility of respondent perceptual error in understanding the good they are beingasked to value. First, we paid particular attention in the focus groups and in-depthinterviews to how people think about the good we offer them. Second, we used thisknowledge, in ways that will be described later, to focus the respondents’ attentionon what they would and would not get if the program were implemented. Third,each time we used the instrument, both during the development process and in thefinal interview itself, we asked open- and close-ended questions to assess how wellrespondents understood what we were attempting to convey in the survey. Thisenabled us in the analysis to identify the presence of any remaining perceptualproblems and, to the extent that they were present, to determine if and how theyaffected the results.
3. Structure of the Final Questionnaire
CV instruments such as the one used in this study differ from ordinary publicopinion surveys in several important respects. One difference is the amount ofinformation that the interviewer conveys to the respondent during the presentationof the scenario. Almost half the length of the 40-minute interview was devotedto informing the respondent about the effects of the spill; a program that couldprevent another spill with the same effects, and how the respondent could pay forthis program if the respondent thought it was worth the specified cost. A second isthe focus of the survey on a single question: whether the respondent would vote foror against the program. The scenario systematically builds up to this question and aseries of follow-up questions explores the respondents’ reasons for voting the waythey did and what they had in mind when they voted. A third is the opportunityrespondents were given to change their vote at a later point in the survey in casethey wished to do so after further reflection.
To maintain the respondents’ interest and enhance their ability to comprehendthe information received during their interview, the material was presented ina carefully designed sequence interspersed with visual aids and questions. Thissection provides an overview of the interview. Boxed or quoted text is from thequestionnaire unless otherwise indicated. Survey text in capital letters indicatesinterviewer instructions not read to the respondents.
3.1. INITIAL QUESTIONS
At the beginning of the interview, respondents did not know that the main subjectmatter of the survey was the Exxon Valdez oil spill.21 This allowed us to measurerespondent’s attitudes about various types of public goods and their prior awarenessof the spill before revealing the purpose of the survey.
CONTINGENT VALUATION AND LOST PASSIVE USE 265
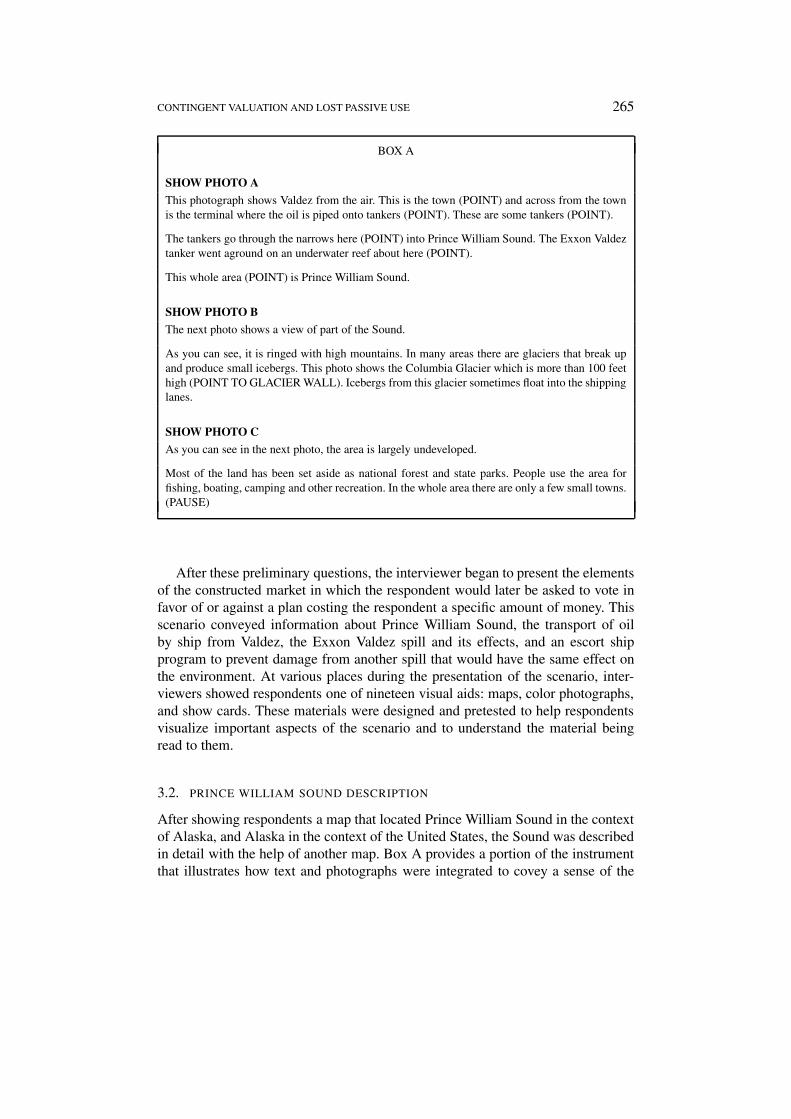
BOX A
SHOW PHOTO A
This photograph shows Valdez from the air. This is the town (POINT) and across from the townis the terminal where the oil is piped onto tankers (POINT). These are some tankers (POINT).
The tankers go through the narrows here (POINT) into Prince William Sound. The Exxon Valdeztanker went aground on an underwater reef about here (POINT).
This whole area (POINT) is Prince William Sound.
SHOW PHOTO B
The next photo shows a view of part of the Sound.
As you can see, it is ringed with high mountains. In many areas there are glaciers that break upand produce small icebergs. This photo shows the Columbia Glacier which is more than 100 feethigh (POINT TO GLACIER WALL). Icebergs from this glacier sometimes float into the shippinglanes.
SHOW PHOTO C
As you can see in the next photo, the area is largely undeveloped.
Most of the land has been set aside as national forest and state parks. People use the area forfishing, boating, camping and other recreation. In the whole area there are only a few small towns.(PAUSE)
After these preliminary questions, the interviewer began to present the elementsof the constructed market in which the respondent would later be asked to vote infavor of or against a plan costing the respondent a specific amount of money. Thisscenario conveyed information about Prince William Sound, the transport of oilby ship from Valdez, the Exxon Valdez spill and its effects, and an escort shipprogram to prevent damage from another spill that would have the same effect onthe environment. At various places during the presentation of the scenario, inter-viewers showed respondents one of nineteen visual aids: maps, color photographs,and show cards. These materials were designed and pretested to help respondentsvisualize important aspects of the scenario and to understand the material beingread to them.
3.2. PRINCE WILLIAM SOUND DESCRIPTION
After showing respondents a map that located Prince William Sound in the contextof Alaska, and Alaska in the context of the United States, the Sound was describedin detail with the help of another map. Box A provides a portion of the instrumentthat illustrates how text and photographs were integrated to covey a sense of the

266 RICHARD T. CARSON ET AL.
SHOW PHOTO J
The next photo shows some of the cleanup activity that took place in the summer after the spill.One of the cleanup techniques was to wash as much of the oil as possible off the shore intothe water where it was scooped up by special equipment and taken away. It was not possible toremove all the oil from the rocky beaches in this way because some had already soaked into theground and couldn’t be washed out. Scientists believe that natural processes will remove almostall the remaining oil from the beaches within a few years after the spill. (PAUSE)
Sound and its features. Photographs A, B, and C were of various features of theSound including the Columbia Glacier.
The description then turned to wildlife. During this part of the narrative respond-ents were shown photographs of living examples of some of the types of wildlifethat were killed by the spill. To be conservative, we did not use photographs ofactual animals harmed or killed by the spill.
The next section of the scenario described the spill and its impact on theshoreline. After a photograph of a tanker in the sound, the narrative focused onthe Exxon Valdez spill. A series of questions were asked at this point to keep therespondent actively involved in the survey. The interviewer then presented a mapof the spill area and pointed out where the spill began, how far it traveled, and thetime it took for oil to travel that far.
Another map identified the places where the shore was and was not affectedin Prince William Sound. Attention was then called to the cleanup effort in thestatement, “As you may know, Exxon made a large effort to clean up the oil on thebeaches,” and in the presentation of Photo J which showed workers washing theoil off a beach. Respondents were given specific information about the duration ofthe injuries: “Scientists believe that natural processes will remove almost all theremaining oil from the beaches within a few years after the spill.”
3.3. DESCRIPTION OF WILDLIFE
The scenario then described the effect of the spill on wildlife. Card 4 displayedinformation about the twelve bird species most affected by the spill. In addition tothe number of dead birds recovered, it gave the total pre-spill population for each ofthe species to provide a perspective on the available substitutes. For example, withrespect to murres, 16,600 were reported dead, and the total population of murreswas described as 350,000. Box B presents the narrative that accompanied Card 4.This material communicated a number of important items.
For example, assurance was given that none of these species was threatenedwith extinction because our focus groups showed that this aspect of the spill injurieswas important to respondents. In order to put the bird kill in perspective the textcalled attention to the fact that large bird kills can occur naturally. Respondents

CONTINGENT VALUATION AND LOST PASSIVE USE 267
BOX B
During the period of the spill there were about one and a half million seabirds and sea ducks ofvarious species in the spill area inside and outside Prince William Sound. (POINT)
As you can see from this card, 22,600 dead birds were found. (POINT)
The actual number of birds killed by the oil was larger because not all the bodies were recovered.Scientists estimate that the total number of birds killed by the spill was between 75,000 and150,000.
About three-fourths of the dead birds found were murres, the black and white bird I showed youearlier. This is shown on the first line of the card. (POINT)
Because an estimated 350,000 murres live in the spill area, this death toll, though high, does notthreaten the species.
One hundred of the area’s approximately 5,000 bald eagles were also found dead from the oil.
The spill did not threaten any of the Alaskan bird species, including the eagles, with extinction.(PAUSE)
Bird populations occasionally suffer large losses from disease or other natural causes. Based onthis experience, scientists expect the populations of all these Alaskan birds to recover within 3 to5 years after the spill. (PAUSE)
were also told that the numbers of dead birds shown on the cards are limited tothose that were recovered and that the actual toll is estimated to be three to sixtimes higher.
Mammal deaths were shown in a table on another card. As with birds, totalpre-spill population estimates were provided in addition to kill estimates. Zero killestimates were listed for three species for which no kills were reported becausesome pretest respondents had assumed that there were also injuries to these species.
3.4. EXPLANATION OF THE ESCORT SHIP PLAN
The next portion of the scenario introduced the concept of a possible second spilllike the Exxon Valdez spill and described how an escort ship program wouldprevent and/or contain such a spill. It was important that the program be perceivedas feasible, effective, and requiring the amount of money later stated as the costthe household would pay if it was approved in the referendum. Respondents weretold that if the program were put into effect, two large Coast Guard ships wouldescort each tanker throughout its journey in Prince William Sound. The escort shipswould help prevent an accident and, if an accident occurred, they would keep evena very large spill from spreading beyond the tanker.22

268 RICHARD T. CARSON ET AL.
BOX C
A-14E. Because everyone would bear part of the cost, we are using this survey to ask peoplehow they would vote if they had the chance to vote on the program.
We have found some people would vote for the program and others would vote against it. Bothhave good reasons for why they would vote that way.
Those who vote for say it is worth money to them to prevent the damage from another large spillin Prince William Sound.
Those who vote against mention concerns like the following.
Some mention that it won’t protect any other part of the country except the area around PrinceWilliam Sound.
Some say that if they pay for this program they would have less money to use for other things thatare more important to them.
And some say the money they would have to pay for the program is more than they can afford.
To avoid overburdening the respondents, only information shown in ourpretesting to be essential to communicating a plausible choice situation wasincluded in the narrative. For example, mention of the requirement that all tankersshould be double-hulled within the next ten years was included because duringour pretests we learned that it added credibility. This information also helped tosharply define the ten-year period during which the escort ship program wouldoperate. The narrative further noted that the plan would not provide spill protectionoutside Prince William Sound.
3.5. VALUATION QUESTIONS
Respondents were informed that the program would be funded by a one-time tax onthe oil companies that take oil out of Alaska and that households like theirs wouldalso pay a special one-time federal tax that would go into a Prince William SoundProtection Fund.23 Immediately before asking the WTP questions, the interviewerpresented the material shown in Box C, which was intended to reassure respond-ents who might not be willing to pay for the program that a no vote was sociallyacceptable. The reasons presented here for voting against the program came fromthose given by respondents during the design phase of the research.
The WTP question, A-15, used a discrete-choice referendum elicitation formatto ask whether the respondent would vote for the program if it cost a specifiedamount that would be paid by a one-time federal tax payment. To obtain responsesto a range of amounts, four different versions (A through D) of the instrument were

CONTINGENT VALUATION AND LOST PASSIVE USE 269
Table II. Program cost by version and question
Version A-15 A-16 A-17
A $10 $30 $5
B $30 $60 $10
C $60 $120 $30
D $120 $250 $60
administered to equivalent subsamples. Every respondent was also asked a follow-up amount appropriate to the version they received and their answer to the firstWTP question. Those who voted “for” were asked the higher amount for questionA-16 and those who voted “against” the lower amount shown for A-17.
The dollar amounts used in this study (see Table II) were based on informationabout the underlying WTP distribution obtained from the pilot studies.24 They werechosen to provide reasonable efficiency in estimating key statistics, such as themedian, while providing some robustness (Alberini and Carson 1993) with respectto observing a substantially different WTP distribution in the final survey.
The remainder of Section A was devoted to open-ended debriefing questionsdesigned to provide some information about the reasons for respondent answersto the valuation questions. Respondents who said “yes” were asked: “What was itabout the program that made you willing to pay for it?” Respondents answering“no” or “not sure” were asked similar questions.
Section B contained a number of questions designed to assess the beliefsrespondents held about key elements of the scenario when they answered the WTPquestions. Although this type of assessment is difficult to make, it can be veryhelpful in checking whether respondents understood the scenario and accepted itsbasic features. Other questions in this section measured attributes that might affectpreferences for protecting the Prince William Sound environment from the effectsof another oil spill.
In addition to demographic questions, in Section C all respondents who hadvoted for one or more of the amounts asked about in the WTP questions wereasked how strongly they favored the program if it cost this much money. Everyonewho answered “not too strongly” or “not at all strongly” was then asked: “Allthings considered, would you like to change your vote on the program if it costyour household $__ from a vote for the program to a vote against?” The interviewconcluded with the question that asked for their best guess as to who “employedmy company to do this study.”25

270 RICHARD T. CARSON ET AL.
4. Survey Execution
The survey was conducted using a multi-stage area probability sample of residen-tial dwelling units drawn from the 50 United States and the District of Columbia. Inthe first stage selection, 61 counties or county groups known as primary samplingunits (PSU’s) were drawn with probabilities proportionate to their populationcounts.26 Within these selected PSU’s, 334 Census block groups were drawnwith probabilities proportionate to their total population counts. The census blockgroups were stratified by two block characteristics: percent of the population thatwas black and a weighted average of the value of owner-occupied housing and therent of renter-occupied housing. In the third stage, approximately 1,600 dwellingunits were drawn from the selected blocks. All dwelling units chosen for the samplewere then randomly assigned to one of the four different dollar versions of thesurvey instrument.
A respondent within each dwelling unit was randomly chosen for the interview.After dropping vacant dwelling units and non-English speaking households whowere ineligible for the survey,27 the survey had an overall response rate of 75.2%.This response rate compares favorably with the best academic surveys such as theUniversity of Michigan’s American National Election Surveys and the Universityof Chicago’s General Social Survey.
As information about the survey topic was not provided to individuals untilthe interview was underway, willingness to pay for the Prince William SoundProgram per se could not have directly affected whether a household responded.It is possible, however, that other characteristics (e.g., household size or, resid-ence in large urban areas) were related to responding/non-responding status. Thus,the composition of the interviewed sample could differ from that of the randomsample initially chosen. To help correct this potential problem, sample weightswere constructed that incorporated both nonresponse adjustment and poststrati-fication to household totals from the 1990 Decennial Census. The variables usedwere region, age, race, household size and type (married versus other). Respond-ents from a western state, the elderly, blacks, and single households tended to beassigned higher weights.
5. Results
5.1. WILLINGNESS TO PAY QUESTIONS
Table III shows the frequencies of each response to question A-15. As expected,the percentage responding with a “for” vote declines as the amount the respondentis asked to pay increases, dropping from 67 percent in favor at $10 to 34 percent at$120.
The A-15 response can be analyzed with a binary discrete choice model, suchas a probit, or it can be combined with the A-16 and A-17 responses. Treating the

CONTINGENT VALUATION AND LOST PASSIVE USE 271
Table III. A-15 response by version
Version No Not sure Yes
A ($10) 29.92% 2.65% 67.42%
B ($30) 39.33% 8.99% 51.69%
C ($60) 43.53% 5.88% 50.59%
D ($120) 59.14% 6.61% 34.24%
Table IV. Questionnaire version by type of response
Version Yes-Yes Yes-No No-Yes No-No
A ($10, $30, $5) 45.08% 22.35% 3.03% 29.55%
B (30, 10, 60) 26.04% 26.04% 11.32% 36.60%
C (60, 120, 30) 21.26% 29.13% 9.84% 39.76%
D (120, 250, 60) 13.62% 20.62% 11.67% 54.09%
“not sure” responses as “no” responses results in four response types.28 These arepresented by questionnaire version in Table IV.
The yes-yes and no-no responses are the easiest to interpret because one wouldexpect the yes-yes responses to fall as the dollar amount the respondent is asked topay goes from $30 in version A (i.e., 45 percent say yes to $30) to $250 in versionD (i.e., 14 percent say yes to $250). We would also expect the no-no responses toincrease as one moves from version A (i.e., 30 percent say no to $5) to version D(i.e., 54 percent to $60). The no-no responses to version A define the upper boundon the percentage of respondents who may not care about preventing an ExxonValdez type oil spill. It should be noted, though, that this group of respondents isalso likely to include those who do not think that the escort ship plan will work orwho believe that the oil companies should pay the entire cost of the plan.
5.2. STATISTICAL MODEL
The type of data gathered using the double-bounded dichotomous choice elicitationmethod is sometimes referred to as interval-censored survival data (Nelson 1982).Its use in CV work has been explicated at length by Carson and Steinberg (1990),Hanemann, Loomis and Kanninen (1991), Carson, Wilks and Imber (1994), andHaab and McConnell (1997) under the assumption of truthful preference revelationto both questions.29 Instead of “time”, survival is defined with respect to the costvariable. A respondent willing to pay a specific amount “survives” that amount anda respondent who is not willing to pay a specified amount “fails” that amount. Ayes-yes response indicates that the respondent’s maximum willingness to pay lies

272 RICHARD T. CARSON ET AL.
between the A-16 amount and infinity. A yes-no response (i.e., yes to A-15 and noto A-16), indicates that the respondent’s maximum WTP amount lies between theamount asked in A-15 and the amount asked in A-16. In survival analysis terms,the failure occurred between the A-15 and A-16 cost amounts. A no-yes responseindicates that the respondent’s maximum WTP response lies between the amountasked in A-15 and the amount asked in A-17. A no-no response indicates that therespondent’s maximum willingness to pay lies between zero and the amount askedin A-17.30 Thus, a respondent’s WTP response can be shown to lie in one of thefollowing intervals depending on the particular response pattern and questionnaireversion: A: ($0–$5 [No-No]; $5–$10 [No-Yes]; $10–$30 [Yes-No]; $30–∞ [Yes-Yes]), B: (0–10; 10–30; 30–60; 60–∞), C: (0–30; 30–60; 60–120; 120–∞), D:(0–60; 60–120; 120–250; 250–∞).31
The survival analysis framework imposes the key assumption from economictheory that the fraction of the public in favor of the program is weakly mono-tonically decreasing in its cost. Effectively, the log likelihood function is definedby the difference in WTP density evaluated at two points defined by the two costamounts the respondent was asked about with the upper end being infinity in thecase of a yes-yes response and the lower end being zero in the case of a no-noresponse. One can maximize this likelihood function assuming a particular para-metric distribution, such as the Weibull, or by using Turnbull’s (1976) modificationof the Kaplan-Meier estimator.32
The Turnbull nonparametric approach makes no assumptions about the shapeof the underlying WTP distribution. As a result, this technique only estimatesthe fraction of the density falling into the intervals defined by the different dollarthresholds used in A-15, A-16, and A-17. Table V shows that about 29 percentof the respondents fall into the interval $0 to $5, and that less than 9 percent arewilling to pay over $250, and that the median falls into the interval $30–$60.33 Wecan also use the estimates of the change in density occurring in each interval todetermine a lower-bound estimate for the mean of the WTP distribution. This isdone by multiplying the density estimated to be in each interval by the lower end-point of the interval and then summing over the interval that yields a lower-boundestimate of mean WTP of $53.60.34 Thus, any empirical distribution that producedthe Turnbull interval estimates would result in an empirical estimate of the meanequal to or greater than $53.60.
Maximizing the likelihood function under the assumption of a Weibull distribu-tion yields the estimates in Table VI and result in estimates of $30 for the medianand $97 for the mean. The standard errors indicate that the parameters are estimatedwith reasonable precision and are reflected in the 95 percent confidence intervalsfor the mean and median. Figure 1 displays the Weibull survival curve. An idealparametric fit occurs when the parametric survival curve just touches the top ofeach step of the nonparametric function. The Weibull is a good approximation overmost of the dollar range with some indication of divergence in the two tails. Thisproblem can be rectified by fitting a Weibull model that allows for a spike at zero.35

CONTINGENT VALUATION AND LOST PASSIVE USE 273
Table V. Turnbull estimation results
Lower bound Upper bound Probability of Change in Asymptotic
of interval of interval being greater density t-value*
than upper bound
0 5 0.714 0.286 15.46
5 10 0.685 0.029 2.93
10 30 0.535 0.150 10.57
30 60 0.377 0.157 11.04
60 120 0.220 0.157 11.46
120 250 0.088 0.132 9.02
250 ∞ 0.000 0.088 Normalized
Log-Likelihood – 1325.186 *Against null of no change in density
Table VI. Weibull estimation results
Parameter Estimate Standard error Asymptotic t-value
Location 58.417 3.914 14.93
Scale 0.558 0.024 23.68
Median $30.30 [$26.18–$35.08]* Mean $97.18 [$85.82–$108.54]*
Log-Likelihood –1343.014 *95% Confidence Interval
That model significantly improves the fit by placing 20.6% of the respondents atzero and reduces the estimated mean to $79.20 with a 95% confidence interval of[$67.93–$90.47].36
5.3. A VALUATION FUNCTION
A valuation function is a statistical way to relate respondents’ WTP to their char-acteristics. They are often estimated to demonstrate the construct validity of theestimate from a CV study. In the simplest sense, the respondent’s WTP or anindicator of that WTP is regressed on respondent characteristics such as incomeand on preferences relevant to the good being valued.
A valuation function is estimated in several steps. First, for observations withmissing values in predictor variables, those values must either be imputed or theobservations dropped from any estimation using that variable, a generally undesir-able option.37 Next, the variables to include in the valuation function must bedetermined. Some variables should clearly be included, while for others, the choice

274 RICHARD T. CARSON ET AL.
Figure 1. Percent willing to pay as a function of program cost.
is less clear. Finally, the valuation function may be used to make adjustments toWTP estimates for such things as protest responses.
A large number of possible predictors are available for use in the valuationfunction we wish to estimate. A few, such as income, are obvious choices. Anotherobvious choice is concern about the environment. Different survey questions thattap this dimension can be used to operationalize this variable in a variety ways.Other good candidates for predictor variables include the likelihood of visitingAlaska and answers to questions that elicit the respondent’s perceptions of thecharacteristics of the oil spill prevention plan. Also, a strong candidate is someindicator of protest responses.
We present our preferred valuation function in Table VII. The first two para-meters are the scale and location parameters based on the assumption of a Weibullsurvival distribution. Note that the scale parameter is a little larger than that esti-mated in Table VI and the location parameter is quite different because we areparameterizing the original location parameter as a function of the various covari-ates included in the equation. After the introduction of the covariates, a spike atzero is no longer significant, as many respondents are now predicted to have verysmall willingness to pay values.
The first four variables, GMORE, MORE, LESS, and NODAM, are dummyvariables indicating which respondents believed that the damage likely to occur inthe absence of the escort ship plan would be different from that of the Exxon Valdezspill. The coefficients on all four of these variables are significant and follow theexpected rank ordering. Those respondents who think that there would be a great

CONTINGENT VALUATION AND LOST PASSIVE USE 275
Table VII. Weibull valuation function
Parameter Estimate Standard Asymptotic Covariate
error t-value Mean
Location 1.637 1.641 1.00 –
Scale 0.662 0.029 22.91 –
GMORE 0.867 0.284 3.06 0.072
MORE 0.669 0.164 4.07 0.162
LESS –0.273 0.146 –1.88 0.228
NODAM –0.794 0.432 –1.84 0.028
MWORK –0.862 0.131 –6.57 0.265
NWORK –1.754 0.200 –8.79 0.073
NAME 0.203 0.134 1.51 0.520
COASTAL 0.414 0.143 2.89 0.803
WILD 0.261 0.119 2.19 0.556
STENV 0.473 0.229 2.06 0.098
LIKVIS 0.240 0.138 1.74 0.335
LINC 0.284 0.100 2.85 10.228
WHITE 0.423 0.151 2.80 0.784
PROTEST –1.226 0.145 –8.45 0.179
Log-Likelihood –1197.728
deal more damage, GMORE, are willing to pay quite a bit more money than theaverage respondent. Those who think that there will be somewhat less, but stillmore damage, MORE, are willing to pay less than the GMORE respondents, butstill quite a bit more than the average respondent. Those who think that there wouldbe less damage, LESS, are willing to pay less than the average respondent, andthose who think that there would likely be no damage, NODAM, are willing topay much less. These four variables taken together provide suggestive evidence ofrespondent sensitivity to the scope of the good valued.
The next two variables, MWORK and NWORK, indicate respondents whothink that the plan will prevent less than a great deal of the damage, with MWORKindicating those who think that the plan will prevent some of the damage andNWORK indicating those who think that the plan will not reduce the damage atall. Again, both variables are significant and of the expected negative sign. TheNWORK coefficient is about twice the size of the MWORK coefficient in absolutevalue. The MWORK and NWORK variables provide further evidence undercuttingthe insensitivity to scope criticism, as they suggest that respondents’ valuations andexpressed WTP are responsive to the characteristics of the good being offered; inthis case, the ability of the program to actually prevent the described injuries.

276 RICHARD T. CARSON ET AL.
NAME is a dummy variable for those respondents who spontaneously namedthe Exxon Valdez spill in question A-2 as one of the major environmental acci-dents caused by humans. As expected, this variable, which measures salience, hasa positive influence on a respondent’s willingness to pay. COASTAL, which is adummy variable indicating which respondents said that protecting coastal areasfrom oil spills was “extremely important” or “very important” in A-3f, has a largeand highly significant positive influence on a respondent’s willingness to pay. Like-wise, WILD, which is a dummy variable for those who felt that the governmentshould set aside a “very large amount” or “large amount” of new land as wildernessin A-4, has a positive effect on a respondent’s willingness to pay. STENV, identifi-cation of oneself as a strong environmentalist, and LIKVIS, a dummy variablefor indicating that the household was “very likely” or “somewhat likely” to visitAlaska in the future, also suggest higher willingness to pay.
Respondents with higher incomes, LINC, are strongly associated with havinga higher willingness to pay to prevent another Exxon Valdez type oil spill as isbeing WHITE. LINC is even more strongly associated with willingness to payusing the subset of respondents for whom income is not imputed. Only 3 of 1043respondents said “yes” to an amount more than 2% of their income and only 17 said“yes” to an amount more than 1% of their income. Respondents who spontaneouslyprotested (PROTEST) in A-14D or A-15A that Exxon should pay all of the escortship plan costs (before being asked why they were not willing to pay in A-18),were on average willing to pay much less than those respondents with the samecharacteristics who did not protest (that Exxon should pay) by this point in thequestionnaire.
Depending on a respondent’s characteristics, the conditional median willing-ness to pay predicted by the valuation function varies widely; the lowest predictedvalue for a respondent in our sample is less than $1 and the highest is $421.
5.4. ADJUSTMENTS AND SENSITIVITY ANALYSIS
The valuation function estimated above allows us to examine the effect that variousadjustments would have on our median WTP estimate. The first type of adjustmentcorrects for respondent assumptions inconsistent with three important features ofthe scenario. Our information about these inconsistencies comes from respondentanswers to questions in Section B of the survey concerning what they had inmind when they answered the WTP questions. Ideally, respondents would havebased their WTP amounts on preventing damages of the same magnitude as thosecaused by the Exxon Valdez spill. For those respondents who did not, there arefour dummy variables in our valuation function. One of these has a value of one torepresent the particular deviation from this desired perception of the same damage:GMORE, MORE, LESS, and NODAM. Setting the value of these dummy variablesto zero effectively forces the perceptions to the same damages. This adjustmentreduces the estimate of the median household willingness to pay from $30 to $27.

CONTINGENT VALUATION AND LOST PASSIVE USE 277
Another possible adjustment is for the perceived effectiveness of the escort shipplan. Ideally, all respondents would have perceived the plan as being completelyeffective. One of two dummy variables in the valuation function has a value ofone if a respondent indicated that the plan was not completely effective: MWORKand NWORK. Setting both of these dummy variables to zero forces the perceptionthat the plan was completely effective. This adjustment changes the estimate of themedian willingness to pay from $30 to $42.
A third adjustment is that for protest responses. The problem here is how toexactly define a protest response. The most conservative definition is the one usedin the variable PROTEST in the valuation function. This indicator variable takesthe value of one if the respondent volunteered that Exxon or the oil companiesshould pay before the respondent was asked why he was against the plan (A-18) and takes the value zero otherwise. Setting PROTEST to zero forces out thatconsideration and changes the estimate of the median from $30 to $37. Makingall three adjustments simultaneously yields a point estimate of $48 for the medianhousehold willingness to pay to prevent an Exxon Valdez type oil spill.
We have also examined the sensitivity of the estimates to four other factors.The first of these is using only the A-15 response (rather than A-15, A-16 andA-17) since the second response may introduce some bias. Here the Turnbullestimator still places the median in the $30–$60 interval and results in a lower-bound estimate of the mean which is less than $2 lower.38 Parametric approachestend to result in somewhat higher estimates. The second is to drop respondentsfrom the sample who may not have clearly understood the CV scenario posed tothem. Here a number of more or less inclusive criteria can be employed basedupon the interviewer evaluations and responses to particular debriefing questions.In all instances, dropping these respondents raises WTP estimates for the remainingsample. The third is to look at the sponsor question. A plurality (42%) of therespondents believed that Exxon or the oil companies sponsored the survey withthe government (23%) being next. Believing that Exxon or the oil companies hadsponsored the survey was not a statistically significant predictor of respondentwillingness to pay.
The fourth type of sensitivity analysis is a consideration of how stable theestimates of the WTP distribution are over time. This can be done by looking atthe surveys completed in Dayton-Toledo, Ohio, two pilot studies and a trackingsurvey conducted simultaneously with the final survey. This comparison showsthat the estimates of the WTP distribution were statistically indistinguishable atthree different points in time over the course of a year. The University of Chicago’sNational Opinion Research Center administered the final questionnaire nationallytwo years later and, from that data, we obtained almost identical estimates to thosereported here (Carson et al. 1997).

278 RICHARD T. CARSON ET AL.
5.5. AGGREGATE LOST PASSIVE USE VALUE
The original study reported an estimate of $2.8 billion (1990) dollars as thelower bound on the estimated aggregate lost passive use values. This estimate wasobtained by multiplying the number of English-speaking households, the popula-tion sampled, by the estimate of median WTP. This estimate was very conservativein two main ways. First, from a theoretical perspective, mean WTA (which isgreater than mean WTP) is the most appropriate measure of the services lost ordisrupted by the Exxon Valdez oil spill.39 Second, median WTP is less than themean WTP under the weak assumption that the WTP distribution is positivelyskewed. The advantage of the median is that it tends to be quite robustly estimatedin survival models and is relatively insensitive to distributional assumptions. Sincethe report, substantial progress has been made on estimating non-parametric andmore flexible parametric models of the WTP distribution. If one were to employ themost conservative estimate of mean WTP consistent with the non-parametric Turn-bull density parameters, the estimate of aggregate lost passive use is 4.87 billiondollars.40 Using the mean WTP estimate from the parametric three-parameterWeibull distribution yields an estimate of 7.19 billion dollars.
These amounts reflect the public’s willingness to pay to prevent another ExxonValdez type oil spill given the scenario posed. Simultaneously adjusting the WTPestimates for protest responses, perceptions of damages larger or smaller thanthe Exxon Valdez spill, and for perceptions that the proposed plan would not becompletely effective, results in higher estimates.
6. A Postscript
The State of Alaska and the U.S. Government settled their lawsuits against Exxonfor 1 billion dollars in natural resource damages and restitution for injuries.41 Inaddition, Exxon spent over 2 billion dollars on oil spill response and restoration.This compares to the 2.8 billion dollars to prevent an Exxon Valdez type oil spill putforth in the original study report. In thinking about the settlement, it may be usefulto keep in mind that guidelines on natural resource damage assessment requirethat any money collected by the government be spent on restoration and/or theacquisition of like resources where restoration is not feasible. It is clearly possibleto argue about which Exxon expenditures represented response (not to be countedtoward compensable damages) and which represented restoration (counted towardcompensable damages). It is also possible to be critical of the restoration effort.Much, however, has been learned since the Exxon Valdez oil spill about the effectsof oil spills, how to prevent them, how to respond to them.42
Indeed, instances where a spill is averted receive little attention. After theExxon Valdez oil spill, the U.S. Coast Guard put into effect an oil spill preventionand response program that strongly resembled the program described to respond-ents in this study. Their regulatory impact assessment for this plan was basedon preventing damages of the magnitude indicated by Exxon’s settlement with

CONTINGENT VALUATION AND LOST PASSIVE USE 279
the government. The costs of this program have subsequently been passed on toconsumers throughout the United States in the form of higher oil prices. Afterthe plan was put into effect, a tanker had problems with its steering system afterleaving Valdez and was about 100 feet from hitting the rocks when its escort shipsucceeded in pushing it away (Fararo 1992). This use of the study results for abenefit-cost assessment of a program to protect ex ante the natural resources ofPrince William Sound complete the circle between the usual policy analysis andnatural resource damage assessment.43
The debate over CV measures of passive use and their role in the assessmentof natural resource damages and public decision-making has become a major topicof debate for the economics community (Carson, Flores and Meade 2001). TheExxon Valdez represented the quintessential case in which, to ignore passive usevalues, was to effectively say that resources that the public had chosen to set asideand not develop could be harmed at little or no cost to the responsible party.
It is possible to belief that lost passive use values should be compensated butnot believe in using direct monetary valuation via CV. Requiring restoration of aninjured resource as many critics of using monetary valuation had argued shouldbe the remedy has been shown to be a vacuous concept when large numbers ofanimals are killed and ecosystems disrupted for years. While it is clearly possibleto compensate the public by providing additional natural resources to compensatefor the lost service flows until the resource recovers, determining the level ofcompensatory resources that would make the public whole effectively requiresknowledge of how much monetary value the public placed on the resource (Flores2002).
At the time of the Exxon Valdez oil spill it was not clear whether Admiralty lawwhich limits damages to the value of the ship and its cargo would take precedentin determining liability over federal/state pollution statues. The passage of the U.S.Oil Pollution Control Act of 1990 removed that ambiguity and came down clearlyon the side of including passive use in assessing damages. That policy decision hasnot been decisively made elsewhere in the world. As such, perceived liability for amajor oil spill in the United States is very high and, perhaps as a consequence, therehave been no extremely large spills in the United States since the Exxon Valdezoil spill. There have been spills that might have become very large and causedwidespread injuries if it had not been for the preplanned aggressive response effortundertaken.44 This lack of extremely large oil spills in the United States for overa decade has had an interesting effect; it implies that while CV has not been usedmuch for assessing natural resource damage of large oil spills, its potential use maybe playing an important role in preventing such spills.45 Elsewhere, the pattern ofbig oil spills has been largely unchanged (Chapple 2000).

280 RICHARD T. CARSON ET AL.
Acknowledgements
The authors wish to acknowledge the many contributions provided by MichaelConaway and Kerry Martin during the course of this study. Richard Bishop,Gardner Brown, Howard Schuman, Norbert Schwarz, Paul Slovic, and RobertSolow provided comments during the course of the study. We also thank JonKrosnick, V. Kerry Smith, Jon Strand and journal referees who provided commentson earlier drafts. The State of Alaska provided funding for this study. Koppacknowledges the partial support of the Alfred P. Sloan Foundation to the WelfareEconomics Program at Resources for the Future. All opinions expressed in thispaper are those of the authors and should not be attributed to the State of Alaska,the Alfred P. Sloan Foundation, or the authors’ home institutions. The authors bearsole responsibility for any errors or omissions.
Notes
1. Descriptions of the grounding of the Exxon Valdez may be found in National Safety Transpor-tation Board (1990) and Moore (1994). A number of spill prevention and containment measureswere put into place when oil first began to be shipped from Valdez. These measures wereintended to reduce various types of risks that had been identified in an initial comprehensiverisk assessment. That assessment had identified one of its most likely bad accidents as a tankhitting the reef next to Bligh Reef under somewhat similar conditions as the Exxon Valdez.These measures had been progressively “relaxed” over time, in part due to their expense and inpart because there had not previously been any really serious accident. These measures mighthave prevented or largely contained the Exxon Valdez spill had they been in place at the time ofthe spill.
2. Ohio v. Department of Interior, 880 F.2d 432 (D.C. Cir. 1989).3. See Ohio v. Department of Interior, 1989. The original Department of the Interior rules chal-
lenged in the Ohio v. DOI case were published in the Federal Register, vol. 51, August 1, 1986.See Kopp, Portney and Smith (1990) for a comprehensive discussion of the Ohio decision.
4. Following the Ohio decision, the U.S. District Court of Utah in a 1992 CERCLA case rejecteda proposed consent decree, in part, for failing to include lost passive use values in the determi-nation of damage associated with groundwater contamination. See State of Utah v. KennecottCorporation, No. CIV 86-0902G, United States District Court, D. Utah, September 3, 1992,Memorandum Decision and Order.
5. This position is consistent with OPA legislative history that specifically refers to diminution invalue as a part of damages and cites the Ohio decision definition of value, which includes bothdirect use and passive use.
6. These models and methods are termed indirect approaches and include the travel cost model andthe hedonic property value model. An introduction to the use of these models for the assessmentof damages due to natural resource injuries can be found in McConnell (1993).
7. A comprehensive discussion of contingent valuation is contained in Mitchell and Carson (1989).8. For a sense of the debate immediately post Exxon Valdez, see the 1994 Journal of Economic
Perspective Symposium papers by Diamond and Hausman, Hanemann, and Portney. For a morerecent review see Carson, Flores and Meade (2001).
9. Due to space limitations, many details of the study and the complete survey instrument couldnot be incorporated into this paper. The complete text of the report can be found online at ExxonValdez Oil Spill Trustee website: http://www.oilspill.state.ak.us/gem/facts/econ omic.html. Thecomplete survey instrument including color copies of visual material used can be found at:

CONTINGENT VALUATION AND LOST PASSIVE USE 281
http://www.econ.ucsd.edu/∼rcarson as can the complete dataset from the study. Mitchell andCarson (1995) and Mitchell (2002) provide additional discussion of various issues involved inthe design of contingent valuation surveys.
10. The description of the injuries was based on scientific information provided to the study teamby the State of Alaska. There was substantial uncertainty regarding the precise extent of someof the injuries at the time the final survey was conducted. In order to minimize the litigationrisk associated with that uncertainty, the study team valued a conservative representation of theinjuries. Therefore, only injury facts of which scientists were reasonably certain as of the fallof 1990 were used. When the best estimate of the actual state of affairs required a range, theconservative end of that range was used.
11. Willingness to accept is the appropriate property right for natural resource damages. Respondentsin CV surveys tend to find questions that ask them how much they would accept in compensationto voluntarily accept a loss to a public environmental good implausible for a variety of reasons(Mitchell and Carson 1989), since they do not believe they possess a personal property right tosell the good.
12. The identity of the survey’s sponsor, the State of Alaska, was not revealed to either theinterviewers or the respondents.
13. This type of qualitative research is increasingly used by survey researchers in the early stagesof designing contingent valuation questionnaires because they are an efficient way to explorepeople’s beliefs, attitudes, and knowledge about the good to be valued, and to obtain theirreactions to possible CV scenario elements (Morgan 1993).
14. In later groups, elements of a possible questionnaire were described in more detail to help usunderstand how the participants understood these elements and how they used this information.These included the payment vehicle, duration of payments, description of the injuries, descrip-tion of a plan to prevent future spills, and use of particular photographs and maps to communicatefactual aspects of the scenario.
15. Westat, one of the country’s premier survey research organizations conducted the interviewsfor this study, recruited the professional interviewers (who gave face-to-face interviews at therespondent’s home), prepared the interview materials based on the instrument we delivered tothem, conducted the interviewer training, supervised the production of interviews in the field,and edited and validated the completed questionnaires.
16. Pilot I reflects the first formal field test. Pilot II, a split-sample test, compared the effect oftwo possible payment vehicles, income taxes and oil prices. Pilot III encompassed two split-sample tests comparing: a) revised versions of the income tax and oil price payment vehiclesand, b) effect of excluding an environmental item in each of questions A-1 and A-3 on the WTPestimate. Pilot IV was the last formal field test and closely resembled the final survey.
17. This downward bias is suggested by empirical evidence and probably results from expectationsformed by the initial cost estimate given to the respondent. Some respondents who vote topay the first amount might be willing to pay the second (higher) amount but vote against thehigher amount when asked because they feel that the government would waste the extra moneyrequested. In addition, some respondents who are not willing to pay the first amount would bewilling to pay the second (lower) amount but may vote against the second amount because theybelieve that either the government will deliver a lower quality good than that first promised orthat the probability of the government delivering the good is lower at the lower price. Both ofthese voting patterns result in a downward bias. The extent of the bias depends on the degree towhich the second amount is perceived by the respondent as being an independent cost estimate.Carson, Groves and Machina (1999) provide a formal conceptual framework for considering thisissue.
18. The telephone survey valued the installation of a scrubber on a power plant in Columbus, Ohiousing 500 observations in a split-sample design with a lump sum and annual payment schemes.While the results from this survey clearly rejected (p < 0.01) Kahneman and Knetsch’s (1992,

282 RICHARD T. CARSON ET AL.
p. 63) contention that respondents do not focus on the temporal nature of the payment obliga-tion, they were consistent with the presence of high discount rates and/or borrowing constraintsobserved with many consumer durables.
19. Embedding is a term introduced into the contingent valuation literature by Kahneman to refer tovarious issues related to the sequencing and nesting of goods as well as a survey design problemknown as part-whole bias. See Carson and Mitchell (1995) for a discussion.
20. For discussions, see Hoehn and Randall (1989); Bishop and Welsh (1992); and Carson, Floresand Hanemann (1998).
21. Potential respondents were told that the interview was for a study of people’s views about currentissues.
22. A line drawing of an escort ship recovering oil at an oil spill proved to be very helpful inexplaining how the escort program would work.
23. Pretests had shown that some respondents criticized the notion that citizens should share inpaying the cost of the plan. Because this could lead respondents to reject the premise of thescenario, that they should make a judgment about what the plan is worth to them, the inter-viewers were instructed to say the following to those who expressed the view that Exxon orthe oil companies should pay in an attempt to persuade them that the oil companies wouldpay a share: “If the program is approved, the oil companies that bring oil through the Alaskapipeline (including Exxon) will have to pay part of the cost by a special tax on their corporateprofits.”
24. The first pilot study established a large fraction of the population was willing to pay smallamounts for the program while zero percent was willing to pay $1000. After this effort wasdevoted to helping to get reasonable estimates of the fraction in favor at more central quantilesof the WTP distribution.
25. Shortly after completing each interview, the interviewer completed a series of questions inSection D about the circumstances under which the interview was conducted and the inter-viewer’s impressions about whether the respondent had any difficulty understanding the votequestions and the seriousness of the consideration the respondent gave to these questions.
26. Before the selection was made, the 1,179 PSU’s were stratified by the following 1980 Decen-nial Census characteristics: (1) region of the country; (2) SMSA versus non-SMSA; (3) rate ofpopulation change between 1970 and 1980; (4) percent living on a farm (for non-SMSA PSU’s);(5) percent employed in manufacturing; (6) percent white; (7) percent urban; and (8) percent overage 65. Selection from strata typically increases the precision of the survey results compared tounstratified selection. For a discussion of the comparative advantages of stratified selection, seeSudman (1976). The 1980 census was used for the sample, as results from the 1990 census werenot yet available.
27. Due primarily to logistical and cost considerations, no foreign language versions of the ques-tionnaire were developed. As a result, non-English speaking households were not eligible tobe interviewed. Thus, we correspondingly reduced the 1990 Census estimate of the number ofU.S. households (93,347,000) by 2.7%, our survey’s estimate of the proportion of U.S. house-holds that were non-English speaking. This yields a population of 90,838,000 English-speakinghouseholds to which our results may be extrapolated.
28. For most of the respondents giving “not sure” answers, this interpretation seems to be appro-priate. Some respondents gave a “not sure” answer to A-15 and subsequently gave a “yes” answerto the substantially lower amount in A-17. Similarly, some respondents gave “yes” responsesto A-15 and “not sure” responses to the higher amount in A-16. A likely interpretation is thatthese “not sure” responses represent respondents who were reasonably close to their indifferencethresholds. Of the 141 respondents who gave one or more “not sure” responses, 111 followedthis pattern. The other 30 respondents (less than 3% of the sample) gave “not sure” responsesto both A-15 and A-17; these respondents may not have been capable of answering the WTPquestions. We have also conservatively treated these as no-no responses.

CONTINGENT VALUATION AND LOST PASSIVE USE 283
29. In the analysis that follows we have also assumed that respondents do not engage in non-truthfulpreference revelation with respect to the second choice question. The strong theoretical predic-tion (Carson, Groves and Machina 1999) is that the response to the second question should beinconsistent with the first. Under stronger but plausible conditions, the response to the secondquestion will be consistent with lower willingness to pay than the first question. The empiricalresults obtained here are consistent with this prediction in that an analysis based upon only thefirst question results in a larger WTP estimate than using both questions. Useful informationcan be obtained from a second question without assuming consistency between questions, butthe statistical modeling is much more complex and more dependent upon assumptions made(Alberini, Kanninen and Carson 1997).
30. If the amenity being valued is a “bad” to the respondent, then the lower bound on the intervalis potentially negative infinity rather than zero. While a possibility with some public goods, it isunlikely that anyone views an Exxon Valdez type oil spill as something desirable.
31. The WTP intervals of the 10 respondents who indicated that they wanted to change their voteswere set from zero to the highest amount to which they had previously said they would vote “for.”In addition, four respondents who did not answer the second WTP question (A-16 or A-17) hadtheir WTP intervals based only on their response to A-15.
32. The Weibull is the simplest distribution that allows an increasing, decreasing, or constanthazard function. It is also flexible enough to approximate several other commonly used survivaldistributions, such as the exponential, the Raleigh, the normal, and the smallest extreme value.
33. From this point on we use the household weights provided by Westat in performing any estima-tions. The differences between the weighted and unweighted estimates are almost always quitesmall, with the weighted estimates being slightly lower than the unweighted estimates. Theconstruction of the weights is discussed at length in section 4.10 and Appendix B.3 of theoriginal study and are based solely on Census demographic variables. Unweighted and weightedfrequencies are provided in Appendix C.1.
34. Since this estimate is a linear function of predetermined design points and a multinomial vari-able, a standard error for this estimate $2.71, and a 95% confidence interval [$48.28–$58.91] arestraightforward to calculate. The Turnbull lower bound on the mean increases toward the meanfrom below as more design points are added. However, for a fixed sample size adding moredesign points causes the variance of this estimator to grow and hence this estimator can be seento represent the commonly found bias-variance tradeoff.
35. It is possible to fit a number of other common two-parameter survival distributions to our data.These tend to result in similar estimates of the median WTP but quite different estimates of themean. The fit of the Weibull distribution is either statistically superior or indistinguishable withrespect to these other distributions. More flexible three parameter distributions tend to suggest asharper drop-off in the percent willing to pay near zero and a sharper drop-off in the right tail. Asa result, estimates of mean WTP from these distributions tend to fall between the lower-boundestimate from the Turnbull estimator and that of the two parameter Weibull.
36. The log-likelihood for the Weibull spike model (Kristrom 1997) is –1331.293 so a likelihoodratio test rejects the two parameter Weibull model in favor of the Weibull spike model at p <
0.01. Effectively what is happening is that the better fit near zero reduces the implied variance ofthe WTP distribution. This reduction in variance (reflected in a decreased scale parameter) pullsin the right tail of the distribution, and hence, reduces the estimate of mean WTP.
37. Because most of the missing values are on income, we have estimated an equation to predictthe log of income. The estimated coefficients for this equation, which is based largely on demo-graphic characteristics, are provided in the study report. All of the variables have the expectedsign, and the equation has an R2 of 0.46.
38. The Turnbull lower bound on the mean should approach the true mean from below as oneincreases the number of design points. The main reason for not using a large number of designpoints in conjunction with the Turnbull approach is that the variance of the estimate can increase

284 RICHARD T. CARSON ET AL.
rapidly as a fixed sample size is randomly allocated to a larger and larger number of designpoints. While the Turnbull estimates of the lower bound on the mean from the single anddouble bounded data from this study are potentially consistent with each other if the actual WTPdistribution closely follows a step function, this seems unlikely. A more plausible explanationfor the similarity between the two estimates is that the downward bias induced in the secondquestion just offsets the increase in the lower bound estimate of the mean that would be foundfrom increasing the number of design points in the double bounded framework. As such, someof the statistical gain from using the double bounded approach may be illusory, although theinformation from it may be useful in a more general context.
39. The damage assessment regulations under OPA also note that WTA is the appropriate measureof damages: “Because the government is holding natural resources in trust for the public, theWTA criterion is conceptually the more appropriate measure of damages for natural resourcedamage claims.” Federal Register, vol. 59, January 7, 1994, p. 1150.
40. This number is obtained by multiplying the Turnbull lower bound mean by the number ofEnglish-speaking U.S. households (90,838,000).
41. There were also a number of private claims for commercial and punitive damages brought byprivate parties. While many of those cases have been settled, some litigation continues as of2003.
42. Much has also been learned about structuring restoration and resource compensation plans. Fordetails in this case, see http://www.oilspill.state.ak.us/.
43. The State of California commissioned an ex ante study (Carson et al., forthcoming) of thebenefits of preventing oil spills along California’s central coast and has used it for a numberof different policy purposes. This study builds upon the Exxon Valdez study reported in thispaper. It incorporates a number of refinements to that survey and was intentionally designed sothat its survey instrument could be more readily adaptable to other geographic areas.
44. Most oil spill injuries in the U.S. since the Exxon Valdez have been short term to outdoorrecreation or to small parts of larger ecosystems for which the government is the trustee. Statedpreference techniques, indirect techniques like travel cost analysis, and habitat equivalenceanalysis have been used to help settle these cases. These spills have also caused some harmto commercial interests who can bring private lawsuits where lost profits, current or perspective,are at issues.
45. The vast majority of CV studies have always been done for policy purpose. The number of suchstudies continues to grow rapidly. Carson (forthcoming) provides citations to over 5000 CVpapers and studies from over 100 countries.
References
Alberini, Anna and Richard T. Carson (1993), ‘Choice of Thresholds for Efficient Binary DiscreteChoice Estimation’. Discussion Paper 90-34R, Department of Economics, University of Cali-fornia, San Diego.
Alberini, A., B. Kanninen and R.T. Carson (1997), ‘Modeling Response Incentives in DichotomousChoice Contingent Valuation Data’, Land Economics 73, 309–324.
Arrow, Kenneth, Robert Solow, Paul R. Portney, Edward E. Leamer, Roy Radner and HowardSchuman (1993), ‘Report of the NOAA Panel on Contingent Valuation’, Federal Register 58,4601–4614.
Bateman, Ian, Richard T. Carson, Brett Day, W. Michael Hanemann, Nick Hanley, Tannis Hett,Michael Jones-Lee, Graham Loomes, Susana Mourato, Ece Özdemiroglu, David Pearce, RobertSugden and John Swanson (2002), Economic Valuation with Stated Preference Techniques: AManual. Northhampton, MA: Edward Elgar.

CONTINGENT VALUATION AND LOST PASSIVE USE 285
Bishop, Richard C. and Thomas A. Heberlein (1979), ‘Measuring Values of Extra-Market Goods:Are Indirect Measures Biased?’ American Journal of Agricultural Economics 61, 926–930.
Bishop, Richard C. and Michael P. Welsh (1992), ‘Existence Values in Benefit-Cost Analysis andDamage Assessment’, Land Economics 68, 405–417.
Carson, Richard T. (1997), ‘Contingent Valuation Surveys and Tests of Insensitivity to Scope’, in R.J.Kopp, W. Pommerhene and N. Schwartz (eds.), Determining the Value of Non-Marketed Goods:Economic, Psychological, and Policy Relevant Aspects of Contingent Valuation Methods. Boston:Kluwer.
Carson, Richard T. (forthcoming), Contingent Valuation: A Comprehensive Bibliography andHistory. Northampton, MA: Edward Elgar.
Carson, Richad T., Michael B. Conaway, W. Michael Hanemann, Jon A. Krosnick, Robert CameronMitchell and Stanley Presser), Valuing Oil Spill Prevention: A Case Study of California’s CentralCoast. Boston: Kluwer Academic Press, forthcoming.
Carson, Richard T., Nicholas E. Flores and W. Michael Hanemann (1998), ‘Sequencing and ValuingPublic Goods’, Journal of Environmental Economics and Management 36, 314–323.
Carson, Richard T., Nicholas E. Flores and Norman F. Meade (2001), ‘Contingent Valuation:Controversies and Evidence’, Environmental and Resource Economics 19, 173–210.
Carson, Richard T., Nicholas E. Flores and Robert C. Mitchell (1999), ‘The Theory and Measurementof Passive Use Value’, in I.J. Bateman and K.G. Willis (eds.), Valuing Environmental Prefer-ences: Theory and Practice of the Contingent Valuation Method in the US, EC, and DevelopingCountries. Oxford: Oxford University Press.
Carson, R.T., T. Groves and M. Machina (1999), ‘Incentive and Informational Properties of Pref-erences Questions’, Plenary Address, European Association of Environmental and ResourceEconomists, Oslo, Norway.
Carson, Richard T., W. Michael Hanemann, Raymond J. Kopp, Jon A. Krosnick, Robert C. Mitchell,Stanley Presser, Paul A. Ruud and V. Kerry Smith (1997), ‘Temporal Reliability of Estimatesfrom Contingent Valuation’, Land Economics 73, 151–163.
Carson, Richard T. and Robert Cameron Mitchell (1995), ‘Sequencing and Nesting in ContingentValuation Surveys’, Journal of Environmental Economics and Management 28, 155–173.
Carson, Richard T. and Dan Steinberg (1990), ‘Experimental Design for Discrete Choice VoterPreference Surveys’, in 1989 Proceeding of the Survey Methodology Section of the AmericanStatistical Association. Washington: American Statistical Association.
Carson, Richard T., Leanne Wilks and David Imber (1994), ‘Valuing the Preservation of Australia’sKakadu Conservation Zone’, Oxford Economic Papers 46(S), 727–749.
Chapple, Clive (2000), ‘The 1990 Oil Pollution Act: Consequences for the Environment’, paperpresented at the Association of Environmental and Resource Economists summer workshop, LaJolla, CA.
Diamond, Peter and Jerry A. Hausman (1994), ‘Contingent Valuation: Is Some Number Better ThanNo Number’, Journal of Economic Perspectives 8(4), 45–64.
Fararo, Kim (1992), ‘Near Miss in the Narrows Oil-Laden Tanker’s Tugboat Escort Puts Itself in aHard Spot Between Middle Rock and a New Disaster’, Anchorage Daily News, November 22,A1.
Flores, Nicholas E. and Jennifer Thatcher (2002), ‘Money Who Needs It?: Natural Resource DamageAssessment’, Contemporary Economics Policy 20, 171–178.
Haab, Timothy C. and Kenneth E. McConnell (1997), ‘Referendum Models and Negative Willing-ness to Pay: Alternative Solutions’, Journal of Environmental Economics and Management 32,251–270.
Hanemann, W. Michael (1991), ‘Willingness to Pay and Willingness to Accept: How Much Can TheyDiffer?’ American Economic Review 81, 635–647.
Hanemann, W. Michael (1994), ‘Valuing the Environment Through Contingent Valuation’, Journalof Economic Perspectives 8(4), 19–43.

286 RICHARD T. CARSON ET AL.
Hanemann (1999), ‘Neo-Classical Economic Theory and Contingent Valuation’, in I.J. Bateman andK.G. Willis (eds.), Valuing Environmental Preferences: Theory and Practice of the ContingentValuation Method in the US, EC, and Developing Countries. Oxford: Oxford University Press.
Hanemann, W. Michael, John Loomis and Barbara Kanninen (1991), ‘Statistical Efficiency ofDouble-Bounded Dichotomous Choice Contingent Valuation’, American Journal of AgriculturalEconomics 73, 1255–1263.
Hausman, Jerry A. (ed.) (1993), Contingent valuation: A Critical Assessment. Amsterdam: North-Holland.
Hoehn, John P. and Alan Randall (1989), ‘Too Many Proposals Pass the Benefit Cost Test’, AmericanEconomic Review 79, 544–551.
Kahneman, Daniel and Jack L. Knetsch (1992), ‘Valuing Public Goods: The Purchase of MoralSatisfaction’, Journal of Environmental Economics and Management 22, 57–70.
Kopp, Raymond J., Paul R. Portney and V. Kerry Smith (1990), ‘The Economics of Natural ResourceDamages After Ohio v. U.S. Department of the Interior’, Environmental Law Reporter 20(4),10127–10131.
Kristrom, Bengt (1997), ‘Spike Models in Contingent Valuation’, American Journal of AgriculturalEconomics 79, 1013–1023.
Krueger, Richard A. (1988), Focus groups: A Practical Guide for Applied Research. Newbury Park,CA: Sage Publications.
Louviere, Jordan J., David A. Hensher and Joffre D. Swait (2000), Stated Choice Methods: Analysisand Applications. New York: Cambridge University Press.
McConnell, Kenneth E. (1993), ‘Indirect Methods for Assessing Natural Resource Damages UnderCERCLA’, in R.J. Kopp and V.K. Smith (eds.), Valuing Natural Assets: The Economics ofNatural Resource Damage Assessment. Washington: Resources for the Future.
Mitchell, Robert Cameron (2002), ‘On Designing Constructed Markets in Valuation Surveys’,Environmental and Resource Economics 22, 297–321.
Mitchell, Robert Cameron and Richard T. Carson (1989), Using Surveys to Value Public Goods: TheContingent Valuation Method. Washington: Resources for the Future.
Mitchell, Robert Cameron (1995), ‘Current Issues in the Design, Administration, and Analysis ofContingent Valuation Surveys’, in P.O. Johansson, B. Kristrom and K.G. Mäler (eds.), CurrentIssues in Environmental Economics. Manchester: Manchester University Press.
Moore, William H. (1994), ‘The Grounding of the Exxon Valdez: An Examination of the Human andOrganizational Factors’, Marine Technology 31, 41–51.
Morgan, David L. (ed.) (1993), Successful Focus Groups: Advancing the State of the Art. NewburyPark, CA: Sage Publications.
National Transportation Safety Board (1990), Grounding of the U.S. Tankership Exxon Valdez onBligh Reef, Prince William Sound Near Valdez Alaska, PB90-916405. Washington: NationalSafety Transportation Board.
Nelson, Wayne (1982), Applied Life Analysis. New York: John Wiley.Portney, Paul R. (1994), ‘The Contingent Valuation Debate: Why Economists Should Care’, Journal
of Economic Perspectives 8(4), 3–17.Sudman, Seymour (1976), Applied Sampling. New York: Academic.Turnbull, Bruce W. (1976), ‘The Empirical Distribution Function with Arbitrarily Grouped, Censored
and Truncated Data’, Journal of the Royal Statistical Society, Series B 38, 290–295.