contingent and alternative employment … of about 60,000 households that provides data on...
TRANSCRIPT

For release 10:00 a.m. (EDT) Thursday, June 7, 2018 USDL-18-0942 Technical information: (202) 691-6378 • [email protected] • www.bls.gov/cps Media contact: (202) 691-5902 • [email protected] CONTINGENT AND ALTERNATIVE EMPLOYMENT ARRANGEMENTS — MAY 2017
In May 2017, 3.8 percent of workers—5.9 million persons—held contingent jobs, the U.S. Bureau of Labor Statistics reported today. These contingent workers are persons who do not expect their jobs to last or who report that their jobs are temporary. Using three different measures, contingent workers accounted for 1.3 percent to 3.8 percent of total employment in May 2017. (See tables A and 1.) In February 2005, the last time the survey was conducted, all three measures were higher, ranging from 1.8 percent to 4.1 percent of employment. In addition to contingent workers, the survey also identified workers who have various alternative work arrangements. In May 2017, there were 10.6 million independent contractors (6.9 percent of total employment), 2.6 million on-call workers (1.7 percent of total employment), 1.4 million temporary help agency workers (0.9 percent of total employment), and 933,000 workers provided by contract firms (0.6 percent of total employment). (See tables A and 5.) Contingent work and alternative employment arrangements are measured separately. Some workers are both contingent and working in an alternative arrangement, but this is not automatically the case. The measures of contingent work and alternative employment arrangements apply only to a person's sole or main job. For individuals with more than one job, this is the job in which they usually work the most hours.
Note on New Questions in 2017 Contingent Worker Supplement
Four new questions were added to the May 2017 Contingent Worker Supplement. These questions were designed to identify individuals who found short tasks or jobs through a mobile app or website and were paid through the same app or website. BLS continues to evaluate the data from these new questions; the data do not appear in this news release. When available, additional information will be at www.bls.gov/cps/electronically-mediated-employment.htm. Findings from this research will be published in a Monthly Labor Review article by September 30, 2018.

-2-
Table A. Contingent workers and workers in alternative arrangements as a percent of total employment, May 2017
Contingent workersPercent of
total employed
Contingent workers are those who do not have an implicit or explicit contract for ongoing employment. Persons who do not expect to continue in their jobs for personal reasons such as retirement or returning to school are not considered contingent workers, provided that they would have the option of continuing in the job were it not for these personal reasons.
Estimate 1Wage and salary workers who expect their jobs will last for an additional year or less and who had worked at their jobs for 1 year or less. Self-employed workers and independent contractors are excluded from this estimate. Temporary help and contract workers are included in this estimate based on the expected duration and tenure of their employment with the temporary help or contract firm, not with the specific client to whom they are assigned.
1.3
Estimate 2Workers, including the self-employed and independent contractors, who expect their employment to last for an additional year or less and who had worked at their jobs (or been self-employed) for 1 year or less. Temporary help and contract workers are included in this estimate based on the expected duration and tenure with the client to whom they are assigned, instead of their tenure with the temporary help or contract firm.
1.6
Estimate 3Workers who do not expect their jobs to last. Wage and salary workers are included even if they already have held the job for more than 1 year and expect to hold the job for at least an additional year. The self-employed and independent contractors are included if they expect their employment to last for an additional year or less and they had been self-employed or independent contractors for 1 year or less.
3.8
Alternative employment arrangements
Independent contractorsWorkers who are identified as independent contractors, independent consultants, or freelance workers, regardless of whether they are self-employed or wage and salary workers.
6.9
On-call workersWorkers who are called to work only as needed, although they can be scheduled to work for several days or weeks in a row.
1.7
Temporary help agency workersWorkers who are paid by a temporary help agency, whether or not their job is temporary.
0.9
Workers provided by contract firmsWorkers who are employed by a company that provides them or their services to others under contract, are usually assigned to only one customer, and usually work at the customer’s worksite.
0.6
See the Technical Note for the concepts and key questions used to identify these workers.

-3-
This information was obtained from the Current Population Survey (CPS), a monthly sample survey of about 60,000 households that provides data on employment and unemployment in the United States. Data on contingent and alternative employment arrangements were collected periodically in supplements to the CPS from February 1995 to February 2005. The May 2017 supplement was sponsored by the U.S. Department of Labor's Chief Evaluation Office. Table A presents a summary of the three contingent worker estimates and four alternative employment arrangements. The concepts and definitions used in the supplement are included in the Technical Note in this news release. Also see www.bls.gov/cps/contingent-and-alternative-arrangements-faqs.htm for answers to frequently asked questions. Highlights from the May 2017 data:
• Under the broadest measure of contingency, there were 5.9 million contingent workers; these workers who did not expect their jobs to last accounted for 3.8 percent of total employment. (See table 1.)
• Contingent workers were more than twice as likely as noncontingent workers to be under age 25. They were also more than twice as likely as noncontingent workers to work part time. (See table 2.)
• Young contingent workers (16- to 24-year-olds) were much more likely than their
noncontingent counterparts to be enrolled in school (62 percent and 36 percent, respectively). (See table 3.)
• Contingent workers were more likely to work in professional and related occupations and
in construction and extraction occupations than noncontingent workers. (See table 4.)
• More than half of contingent workers (55 percent) would have preferred a permanent job. (See table 10.)
• In terms of alternative employment arrangements, 6.9 percent of all workers were
independent contractors, 1.7 percent were on-call workers, 0.9 percent were temporary help agency workers, and 0.6 percent were workers provided by contract firms. (See table A.)
• The demographic characteristics of workers in alternative employment arrangements
varied between the four arrangements. Compared to workers in traditional arrangements, independent contractors were more likely to be older, temporary help agency workers were more likely to be Black or Hispanic or Latino, and workers provided by contract companies were more likely to be men. (See table 6.)
• While 79 percent of independent contractors preferred their arrangement over a
traditional job, only 44 percent of on-call workers and 39 percent of temporary help agency workers preferred their work arrangement. (See table 11.)

-4-
• The proportion of workers employed in alternative arrangements who also were classified as contingent workers ranged from 3 percent of independent contractors to 42 percent of temporary help agency workers. (See table 12.)
Contingent Work In May 2017, the three estimates of contingent workers ranged from 1.3 percent to 3.8 percent of employment. (See table A and the Technical Note for an explanation of the concepts.) In February 2005, the last time the survey was conducted, all three measures were higher, ranging from 1.8 percent to 4.1 percent of employment. In February 1995, the first year the survey was conducted, the estimates ranged from 2.2 percent to 4.9 percent. The characteristics of workers in contingent jobs in May 2017 were generally similar to those in prior surveys. The analysis in this news release focuses on the third and largest estimate of contingent workers—all those who do not expect their current job to last. Demographic Characteristics of Contingent Workers Using the broadest estimate of contingency, 5.9 million workers were classified as contingent in May 2017. Contingent workers were more than twice as likely as noncontingent workers to be under 25 years old (28 percent versus 12 percent). Of these young workers, 3 in 5 contingent workers were enrolled in school, compared with fewer than 2 in 5 youth with noncontingent jobs. Contingent workers ages 25 to 64 were found at all levels of educational attainment. Contingent workers were about twice as likely as noncontingent workers to have less than a high school diploma (14 percent, compared with 7 percent) and slightly more likely to hold at least a bachelor’s degree (44 percent, compared with 41 percent). (See tables 1, 2, and 3.) In May 2017, 47 percent of both contingent and noncontingent workers were women. In past surveys, contingent workers were slightly more likely to be women than were noncontingent workers. In May 2017, contingent workers remained slightly less likely than noncontingent workers to be White (76 percent, compared with 79 percent) and much more likely to be Hispanic or Latino (22 percent, compared with 16 percent). Contingent workers are more likely to work part time than are noncontingent workers. In May 2017, about 2 in 5 contingent workers worked less than 35 hours per week, compared with fewer than 1 in 5 noncontingent workers. However, the vast majority of part-time workers were not employed in contingent arrangements. Occupation and Industry of Contingent Workers As in previous surveys, contingent workers were distributed throughout the major occupational groups. In May 2017, nearly one-third of contingent workers were employed in professional and related occupations, compared with one-fourth of noncontingent workers. Contingent workers were also more likely than their noncontingent counterparts to work in construction and extraction occupations (11 percent and 5 percent, respectively). Contingent workers were less

-5-
likely than noncontingent workers to be employed in management, business, and financial operations occupations (8 percent and 17 percent, respectively). (See table 4.) By industry, about one-third of contingent workers were employed in the education and health services industry, compared with roughly one-fourth of noncontingent workers. Contingent workers also were more likely than noncontingent workers to be employed in the agriculture and construction industries. Contingent workers were less likely to work in retail trade and manufacturing than were noncontingent workers. Job Preferences of Contingent Workers Just over half of contingent workers would have preferred a permanent job in May 2017, while one-third preferred their contingent employment arrangement. (The remainder expressed no clear preference.) The share of contingent workers who would have preferred a permanent job was about the same as in past surveys. (See table 10.) Compensation of Contingent Workers Contingent workers earned less than their noncontingent counterparts in May 2017. Among full-time workers, median weekly earnings for contingent workers ($685) were 77 percent of those of noncontingent workers ($886). The disparity in earnings likely reflects the many differences in the demographic characteristics of contingent and noncontingent workers and the jobs they hold. (See table 13.) Contingent wage and salary workers were half as likely to be covered by employer-provided health insurance as noncontingent workers. One-fourth of contingent workers had employer-provided health insurance in May 2017, compared with half of noncontingent workers. Although most contingent workers did not receive health insurance from their jobs, a substantial share—nearly 3 in 4—had health insurance from some source, including coverage from another family member's policy, through a government program, or by purchasing it on their own. Overall, contingent workers were less likely than noncontingent workers to have health insurance coverage from any source (73 percent and 84 percent, respectively). The gap in health insurance coverage between contingent and noncontingent workers is smaller than in 2005. (See table 9.) Among wage and salary workers, contingent workers were about half as likely as noncontingent workers to be eligible for employer-provided pension or retirement plans in May 2017—23 percent of contingent workers compared with 48 percent of noncontingent workers. Overall, the proportion of contingent workers who actually participated in employer-provided plans (18 percent) also was much lower than that of noncontingent workers (43 percent). Alternative Employment Arrangements The May 2017 survey collected information on the number and characteristics of workers in four alternative employment arrangements—independent contractors, on-call workers, temporary help agency workers, and workers employed by contract companies.

-6-
Compared with February 2005 (the last time the survey was conducted), the proportion of the employed who were independent contractors was lower in May 2017, while the proportions employed in the other three alternative arrangements were little different. Workers in the four groups continued to differ significantly from each other as well as from workers in traditional arrangements. Independent Contractors Independent contractors (including independent consultants and freelance workers) remained the largest of the four alternative work arrangements. In May 2017, there were 10.6 million independent contractors, representing 6.9 percent of total employment. This estimate is smaller than the 7.4 percent of workers in February 2005 who were independent contractors. (See tables A and 5.) Independent contractors are generally older than workers in other alternative and traditional arrangements. In May 2017, more than 1 in 3 independent contractors were age 55 or older, compared with fewer than 1 in 4 workers in traditional arrangements. This reflects the fact that the likelihood of employed persons being independent contractors increases with age. (See tables 5 and 6.) As in past surveys, men were more likely to be independent contractors than were women; about two-thirds of independent contractors were men in May 2017. Independent contractors also remained more likely to be White than workers in other alternative and traditional arrangements. Independent contractors were more likely than those in traditional arrangements to be in management, business, and financial operations occupations; sales and related occupations; and construction and extraction occupations. In terms of industry, independent contractors were more likely than traditional workers to be employed in construction and in professional and business services. (See table 8.) Independent contractors overwhelmingly prefer their work arrangement (79 percent) to traditional jobs. Fewer than 1 in 10 independent contractors would prefer a traditional work arrangement. (See table 11.) Only 3 percent of independent contractors were also contingent workers in May 2017—the same percentage as workers in traditional arrangements. (See table 12.) On-call Workers On-call workers are defined as those who report to work only when called, although they can be scheduled to work for several days or weeks in a row. In May 2017, there were 2.6 million on-call workers, accounting for 1.7 percent of total employment. The demographic characteristics of on-call workers were generally similar to those in traditional arrangements except that on-call workers were somewhat more likely to be age 65 or older. (See tables 5 and 6.)
-7-
About 45 percent of on-call workers worked part time, a much higher proportion than either traditional workers or workers in other alternative arrangements. On-call workers were more likely than those in traditional arrangements to work in professional and related occupations, service occupations, construction and extraction occupations, and transportation and material moving occupations. By industry, on-call workers were more likely to work in education and health services and in construction. (See table 8.) In May 2017, 43 percent of on-call workers would have preferred to work in a traditional arrangement, about the same percentage as preferred their alternative arrangement. Roughly 1 in 5 on-call workers was also a contingent worker. (See tables 11 and 12.) Temporary Help Agency Workers In May 2017, 1.4 million workers were paid by a temporary help agency, about 0.9 percent of total employment. As in earlier surveys, they were much more likely than workers in traditional arrangements to be Black or Hispanic or Latino. Temporary help agency workers ages 25 to 64 were less likely than traditional workers or workers in other arrangements to have attended college—about half of temporary help agency workers had completed at least one year of college, compared with roughly two-thirds of those in other alternative or traditional arrangements. About 1 in 4 temporary help agency workers had a part-time schedule—a slightly higher proportion than for traditional workers. (See tables 5, 6, and 7.) Temporary help agency workers were heavily concentrated in the production, transportation, and material moving occupations and in manufacturing industries. In May 2017, 46 percent of temporary help agency workers would have preferred a traditional job, less than the 56 percent in February 2005. In May 2017, 42 percent of temporary help agency workers were also contingent workers, a smaller share than in past surveys. (See tables 8, 11, and 12.) Workers Provided by Contract Firms The smallest of the four alternative arrangements was contract company employment, with 933,000 workers or 0.6 percent of total employment in May 2017. These individuals work for companies that provide workers or their services to other organizations under contract; they usually are assigned to one client at a time and work at the client’s place of business. Two-thirds of contract company workers were men, compared with about half of traditional workers. Workers provided by contract firms were more likely to be Asian than were traditional workers or workers in other arrangements. (See tables 5 and 6.) In May 2017, more than one-third of contract company workers were in professional and related occupations and one-fourth were in service occupations. Computer professionals and security guards are common occupations for workers provided by contract firms. By industry, contract company workers were much more likely to be employed in public administration than those in other alternative or traditional arrangements. Fifteen percent of contract company workers were also contingent workers. (See tables 8 and 12.)
-8-
Compensation of Workers in Alternative Employment Arrangements Among full-time workers, there was wide variation in the median earnings of those in alternative employment arrangements relative to one another and to workers in a traditional arrangement. In May 2017, median weekly earnings were highest for contract company workers ($1,077). Earnings for independent contractors ($851) were roughly similar to those for workers in traditional arrangements ($884), while earnings for on-call workers ($797) and temporary help agency workers ($521) were lower. (See table 13.) Differences in earnings for workers in the four alternative arrangements reflect, in part, variations in the occupational distributions and the demographic characteristics of the workers. For example, contract company workers are concentrated in professional and related occupations, which tend to be more highly paid. On the other hand, temporary help agency workers are less likely to have attended college and are concentrated in lower-paying production, transportation, and material moving occupations. Workers in alternative arrangements remained less likely than workers in traditional arrangements to have employer-provided health insurance. In May 2017, 41 percent of contract company workers had employer-provided health insurance, compared with 28 percent of on-call workers and 13 percent of temporary help agency workers. In contrast, 53 percent of workers in traditional arrangements received health insurance benefits through their employers. (Estimates of employer-provided health insurance were not tabulated for independent contractors.) (See table 9.) Although most workers in alternative arrangements did not receive health insurance through their jobs, a large share had health insurance from some source, including coverage from another family member's policy, through a government program, or by purchasing it on their own. Compared with workers in traditional arrangements (84 percent) and those employed by contract companies (85 percent), workers in the other alternative employment arrangements were less likely to be covered by health insurance from any source. In particular, temporary help agency workers were the least likely to have health insurance from any source (67 percent). The likelihood of having health insurance was higher for workers in all categories in May 2017 than in February 2005, with the largest increase among temporary help agency workers. Eligibility for employer-provided pension or retirement plans varies across employment arrangements. In May 2017, temporary help agency workers (13 percent) and on-call workers (35 percent) were less likely to be eligible for employer-provided plans than were contract company workers (48 percent) or those in traditional arrangements (51 percent). Overall, the proportions of workers in alternative arrangements who actually participated in employer-provided plans were lower than for those in traditional arrangements. (These data were not collected for independent contractors.)

Technical Note
The data presented in this news release were collected through a supplement to the May 2017 Current Population Survey (CPS), a monthly survey of about 60,000 eligible households that provides data on employment and unemployment for the nation. The CPS is conducted by the U.S. Census Bureau for the U.S. Bureau of Labor Statistics (BLS).
The May 2017 supplement obtained information from workers on whether they held contingent jobs—jobs that are expected to last only a limited period of time—and whether they had alternative employment arrangements, such as working as independent contractors, as on-call workers, through temporary help agencies, or through contract firms. Contingent work and alternative employment arrangements are measured separately. A person in an alternative employment arrangement may or may not be a contingent worker. Likewise, a contingent worker may or may not be in an alternative employment arrangement.
Supplement questions were asked of all employed people except unpaid family workers. For people holding more than one job, the questions referred to the characteristics of their main job—the job in which they worked the most hours. The collection of these data was sponsored by the U.S. Department of Labor's Chief Evaluation Office. Additional information, including articles and archived news releases, is available online at www.bls.gov/cps/lfcharacteristics.htm#contingent. Answers to frequently asked questions are available online at www.bls.gov/cps/contingent-and-alternative-arrangements-faqs.htm.
Four new questions were added to the May 2017 supplement. These questions were designed to identify individuals who found short tasks or jobs through a mobile app or website and were paid through the same app or website. Data from these new questions are not included in this news release. For information about these questions, see www.bls.gov/cps/electronically-mediated-employment.htm.
Information in this release will be made available to sensory impaired individuals upon request. Voice phone: (202) 691-5200; Federal Relay Service: (800) 877-8339. Concepts and definitions
Information about general employment and earnings concepts in the CPS is available on the BLS website at www.bls.gov/opub/hom/cps/concepts.htm.
Defining and estimating the contingent workforce. Contingent workers are those who do not have an explicit or implicit contract for continuing employment. Several questions are asked in the supplement to determine whether
a worker's job is contingent. These include whether the job is temporary or not expected to continue, how long the worker expects to be able to hold the job, and how long the worker has held the job.
The key factor used to determine if workers fit the conceptual definition of contingent is whether their job is temporary or not expected to continue. The first questions of the supplement are:
1. Some people are in temporary jobs that last for a limited time or until the completion of a project. Is your job temporary?
2. Provided the economy does not change and your job performance is adequate, can you continue to work for your current employer as long as you wish?
Workers who answered either "yes" to the first question or "no" to the second are then asked a series of questions to distinguish workers who are in temporary jobs from those who, for personal reasons, are temporarily holding jobs that offer the opportunity of ongoing employment. A job is defined as being short term or temporary if the person holding it is working only until the completion of a specific project, temporarily replacing another worker, being hired for a fixed time period, filling a seasonal job that is available only during certain times of the year, or if other business conditions dictate that the job is short term.
For example, a person hired for 6 months to replace a teacher on paternity leave and a person hired to work in a company's shipping department for the holiday season would both be considered contingent workers. In contrast, students holding jobs at fast-food restaurants while in school might view their jobs as temporary if they intend to leave them at the end of the school year. The jobs themselves, however, would be filled by other workers once the students leave, and thus, the students are not contingent workers.
Workers also are asked how long they expect to stay in their current job and how long they have been with their current employer. Workers are asked how long they expect to remain in their current job because being able to hold a job for a year or more could demonstrate at least an implicit contract for ongoing employment. In other words, the employer's need for the worker's services is not likely to end tomorrow. Similarly, the information on how long a worker has been with their employer shows whether a job has been ongoing. Having remained with an employer for more than a year may demonstrate that, at least in the past, there was an explicit or implicit contract for continuing employment.
To assess the impact of altering some of the defining factors on the estimated size of the contingent workforce,

three measures of contingent employment were developed, as follows:
Estimate 1 is the narrowest definition of contingent work. Under Estimate 1, contingent workers are wage and salary workers who expect to work in their current job for 1 year or less and who have worked for their current employer for 1 year or less. All self-employed workers—both incorporated and unincorporated—and independent contractors are excluded from the count of contingent workers under Estimate 1. Although they may face financial risks, people who work for themselves, by definition, have ongoing employment arrangements. Individuals who work for temporary help agencies or contracting companies are considered contingent under Estimate 1 if they expect their employment arrangement with the temporary help or contracting company to last for 1 year or less and they have worked for that company for 1 year or less.
Estimate 2 expands the definition of contingent work by including the self-employed—both the incorporated and the unincorporated—and independent contractors who expect to be, and have been, in such employment arrangements for 1 year or less. (The questions asked of the self-employed are different from those asked of wage and salary workers.) In addition, temporary help and contract company workers are classified as contingent under Estimate 2 if they have worked and expect to work for the customers to whom they are assigned for 1 year or less. For example, a "temp" secretary who is sent to a different customer each week but has worked for the same temporary help agency for more than 1 year and expects to be able to continue with that agency indefinitely is contingent under Estimate 2, but not under Estimate 1. In contrast, a "temp" who has been assigned to a single client for more than a year and expects to be able to stay with that client for more than a year is not counted as contingent under either estimate.
Estimate 3 is the broadest definition of contingent work—people who do not expect their jobs to last—and the focus of the analysis in this news release. Estimate 3 expands the definition of contingent work further by removing the 1-year requirement on both expected duration of the job and current tenure for wage and salary workers. The estimate includes all wage and salary workers who do not expect their employment to last, except for those who, for personal reasons, expect to leave jobs that they would otherwise be able to keep. Thus, a worker who has held a job for 5 years could be considered contingent if he or she now views the job as temporary. The 1-year requirement on expected and current tenure is retained for the self-employed and independent contractors.
Defining alternative employment arrangements. Alternative employment arrangements are determined by the workers' relationship to their employer. To provide estimates of the number of workers in alternative employment arrangements, the supplement includes
questions about whether individuals are paid by a temporary help agency or contract company, or whether they are on-call workers or independent contractors. (The survey also includes questions about day laborers. Estimates for day laborers are not presented as a separate category of alternative arrangements in this news release because the group is very small. They are included in estimates of total employment.)
Contingent work, which is determined by expectations about the duration of a person's job, is a separate concept from alternative employment arrangements. Some workers are both contingent and working in an alternative arrangement, but this is not automatically the case.
Definitions of the four main alternative employment arrangements follow, as well as the key questions used to identify workers in each category:
Independent contractors are those who are identified as independent contractors, consultants, or freelance workers in the supplement, regardless of whether they are identified as wage and salary workers or self-employed in the basic CPS labor force status questions. To distinguish independent contractors from business operators such as a restaurant owner, the supplement includes a question for workers who identified as self-employed (incorporated and unincorporated) in the basic CPS that asks, "Are you self-employed as an independent contractor, independent consultant, freelance worker, or something else (such as a shop or restaurant owner)?" Those identified as wage and salary workers in the basic CPS are asked, "Last week, were you working as an independent contractor, an independent consultant, or a freelance worker? That is, someone who obtains customers on their own to provide a product or service." Nearly 9 in 10 independent contractors are self-employed. Conversely, 3 in every 5 self-employed workers are independent contractors.
On-call workers are called into work only when they are needed. This category includes workers who answer "yes" to the question, "Some people are in a pool of workers who are ONLY called to work as needed, although they can be scheduled to work for several days or weeks in a row, for example, substitute teachers and construction workers supplied by a union hiring hall. These people are sometimes referred to as ON-CALL workers. Were you an ON-CALL worker last week?" Individuals with regularly scheduled work, which might include periods of being "on call" to perform work at unusual hours, such as medical residents, are not included in this category.
Temporary help agency workers are those who are paid by a temporary help agency. This category includes workers who say their job is temporary and answer "yes" to the question, "Are you paid by a temporary help agency?" Also included are workers who say their job is not temporary and answer affirmatively to the question, "Even though you

told me your job is not temporary, are you paid by a temporary help agency?" Temporary help agency workers include both the permanent staff of the agencies and those who are placed with other companies in temporary assignments.
Workers provided by contract firms are those who work for a contract company, usually work for only one customer, and usually work at the customer's worksite. This refers to individuals who are employed by firms who contract out their workers or their workers' services, rather than all workers employed by firms that provide services under contract, such as advertising agencies and law firms. This category includes workers who answer "yes" to the question, "Some companies provide employees or their services to others under contract. A few examples of services that can be contracted out include security, landscaping, or computer programming. Did you work for a company that contracts out you or your services last week?" These workers also responded "no" to the question, "Are you usually assigned to more than one customer?" Finally, these workers responded "yes" to the question, "Do you usually work at the customer's worksite?" Comparability of the estimates
The concepts of contingent work and alternative employment arrangements used in the May 2017 survey are the same as those collected in the past. The questions used to identify these workers were essentially unchanged from past surveys. However, there are a few issues that could affect the comparability of these estimates with those from prior years. The prime concern is that the 2017 supplement was collected in May and earlier surveys were conducted in February of 1995, 1997, 1999, 2001, and 2005. The seasonality of contingent jobs and alternative employment arrangements is not known. However, any seasonality may affect the size and composition of the contingent workforce and people working in alternative employment arrangements. For example, a seasonal job that is only available at a certain time each year counts as a contingent job. The number and types of these kinds of jobs available in February and May might be different.
Two tables in this news release present slightly
different displays of data than prior releases. Table 13 of this news release contains usual weekly earnings estimates for
workers in noncontingent and traditional arrangements, which were omitted from the February 2001 and 2005 news releases. Earnings for noncontingent and traditional workers were not collected in February 2001 and 2005. Earnings for such workers had been published in earlier news releases.
The estimates of workers eligible for employer-
provided pension or retirement plans in table 9 of this news release are not strictly comparable with those of earlier years because the May 2017 estimates exclude all self-employed workers and independent contractors. In previous years, some of these workers were included in the estimates.
Other data presented in this news release are not strictly
comparable with those for earlier years due to several other methodological issues. Comparability of estimates over time is affected by the introduction of population controls and changes in the classification of industries and occupations. Additional information about comparability of data over time is available at www.bls.gov/cps/documentation.htm. Reliability of the estimates
Statistics based on the CPS are subject to both sampling and nonsampling error. When a sample, rather than the entire population, is surveyed, there is a chance that the sample estimates may differ from the true population values they represent. The component of this difference that occurs because samples differ by chance is known as sampling error, and its variability is measured by the standard error of the estimate. There is about a 90-percent chance, or level of confidence, that an estimate based on a sample will differ by no more than 1.6 standard errors from the true population value because of sampling error. BLS analyses are generally conducted at the 90-percent level of confidence.
The CPS data also are affected by nonsampling error. Nonsampling error can occur for many reasons, including the failure to sample a segment of the population, inability to obtain information for all respondents in the sample, inability or unwillingness of respondents to provide correct information, and errors made in the collection or processing of the data.
Information about the reliability of data from the CPS and guidance on estimating standard errors is available at www.bls.gov/cps/documentation.htm#reliability.

Table 1. Employed contingent and noncontingent workers by selected characteristics, May 2017
(In thousands)
Characteristic Total employedContingent workers
Estimate 1 Estimate 2 Estimate 3
Noncontingentworkers
AGE AND SEX
Total, 16 years and over 153,331 1,958 2,511 5,858 147,47316 to 19 years 4,842 316 330 501 4,34020 to 24 years 14,212 567 647 1,110 13,10225 to 34 years 33,991 472 616 1,419 32,57235 to 44 years 32,065 271 392 992 31,07345 to 54 years 32,745 175 285 817 31,92855 to 64 years 26,236 116 179 680 25,55665 years and over 9,240 41 62 338 8,902
Men, 16 years and over 81,545 1,062 1,349 3,085 78,46116 to 19 years 2,365 166 180 271 2,09320 to 24 years 7,412 310 340 560 6,85225 to 34 years 18,169 274 376 853 17,31635 to 44 years 17,585 144 196 503 17,08245 to 54 years 17,099 94 139 408 16,69155 to 64 years 13,840 65 94 337 13,50365 years and over 5,076 10 23 152 4,924
Women, 16 years and over 71,785 896 1,162 2,773 69,01216 to 19 years 2,477 150 150 230 2,24720 to 24 years 6,800 257 306 550 6,25025 to 34 years 15,823 198 240 566 15,25735 to 44 years 14,480 127 196 489 13,99145 to 54 years 15,646 81 146 408 15,23855 to 64 years 12,396 51 85 343 12,05365 years and over 4,164 31 39 186 3,977
RACE AND HISPANIC OR LATINO ETHNICITY
White 120,638 1,451 1,885 4,428 116,211Black or African American 18,588 225 295 742 17,846Asian 9,110 182 224 445 8,665Hispanic or Latino ethnicity 25,525 435 538 1,299 24,225
FULL- OR PART-TIME STATUS
Full-time workers 125,240 1,051 1,349 3,466 121,774Part-time workers 28,091 907 1,162 2,391 25,699
NOTE: Noncontingent workers are those who do not fall into any estimate of "contingent" workers. Estimates for the above race groups (White, Black orAfrican American, and Asian) do not sum to totals because data are not presented for all races. Persons whose ethnicity is identified as Hispanic orLatino may be of any race. Detail for other characteristics may not sum to totals due to rounding.
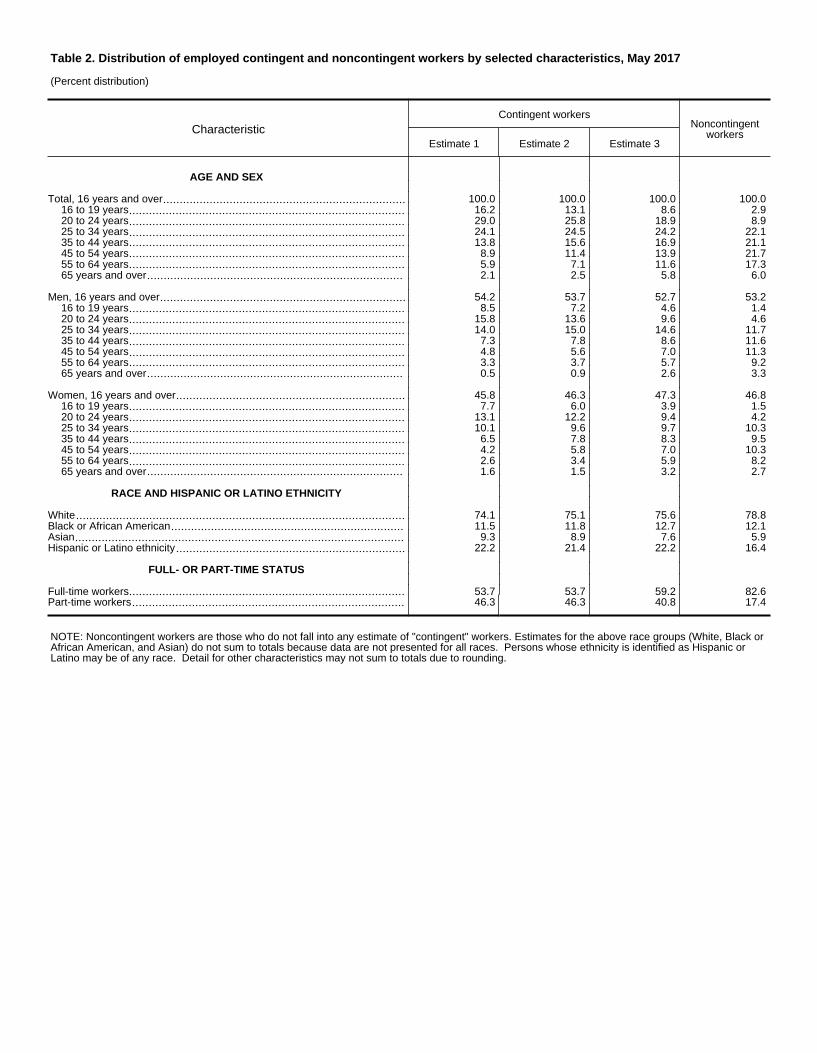
Table 2. Distribution of employed contingent and noncontingent workers by selected characteristics, May 2017
(Percent distribution)
CharacteristicContingent workers
Estimate 1 Estimate 2 Estimate 3
Noncontingentworkers
AGE AND SEX
Total, 16 years and over 100.0 100.0 100.0 100.016 to 19 years 16.2 13.1 8.6 2.920 to 24 years 29.0 25.8 18.9 8.925 to 34 years 24.1 24.5 24.2 22.135 to 44 years 13.8 15.6 16.9 21.145 to 54 years 8.9 11.4 13.9 21.755 to 64 years 5.9 7.1 11.6 17.365 years and over 2.1 2.5 5.8 6.0
Men, 16 years and over 54.2 53.7 52.7 53.216 to 19 years 8.5 7.2 4.6 1.420 to 24 years 15.8 13.6 9.6 4.625 to 34 years 14.0 15.0 14.6 11.735 to 44 years 7.3 7.8 8.6 11.645 to 54 years 4.8 5.6 7.0 11.355 to 64 years 3.3 3.7 5.7 9.265 years and over 0.5 0.9 2.6 3.3
Women, 16 years and over 45.8 46.3 47.3 46.816 to 19 years 7.7 6.0 3.9 1.520 to 24 years 13.1 12.2 9.4 4.225 to 34 years 10.1 9.6 9.7 10.335 to 44 years 6.5 7.8 8.3 9.545 to 54 years 4.2 5.8 7.0 10.355 to 64 years 2.6 3.4 5.9 8.265 years and over 1.6 1.5 3.2 2.7
RACE AND HISPANIC OR LATINO ETHNICITY
White 74.1 75.1 75.6 78.8Black or African American 11.5 11.8 12.7 12.1Asian 9.3 8.9 7.6 5.9Hispanic or Latino ethnicity 22.2 21.4 22.2 16.4
FULL- OR PART-TIME STATUS
Full-time workers 53.7 53.7 59.2 82.6Part-time workers 46.3 46.3 40.8 17.4
NOTE: Noncontingent workers are those who do not fall into any estimate of "contingent" workers. Estimates for the above race groups (White, Black orAfrican American, and Asian) do not sum to totals because data are not presented for all races. Persons whose ethnicity is identified as Hispanic orLatino may be of any race. Detail for other characteristics may not sum to totals due to rounding.

Table 3. Employed contingent and noncontingent workers by school enrollment and educational attainment, May 2017
(Percent distribution)
CharacteristicContingent workers
Estimate 1 Estimate 2 Estimate 3
Noncontingentworkers
SCHOOL ENROLLMENT
Total, 16 to 24 years (thousands) 884 977 1,611 17,442Percent 100.0 100.0 100.0 100.0
Enrolled in school 60.1 59.2 61.6 35.7Not enrolled in school 39.9 40.8 38.4 64.3
Less than a high school diploma 3.3 3.8 4.6 5.3High school graduates, no college¹ 12.5 13.5 13.9 27.7Some college or associate degree 15.3 14.9 11.5 19.5Bachelor's degree and higher² 8.9 8.6 8.3 11.7
EDUCATIONAL ATTAINMENT
Total, 25 to 64 years (thousands) 1,034 1,472 3,908 121,129Percent 100.0 100.0 100.0 100.0
Less than a high school diploma 13.0 13.1 13.5 7.0High school graduates, no college¹ 23.8 21.2 22.1 25.2Some college or associate degree 23.4 24.5 20.9 27.2Bachelor's degree and higher² 39.8 41.2 43.5 40.6
¹ Includes persons with a high school diploma or equivalent.² Includes persons with bachelor's, master's, professional, and doctoral degrees.NOTE: Noncontingent workers are those who do not fall into any estimate of "contingent" workers. Detail may not sum to totals due to rounding.

Table 4. Employed contingent and noncontingent workers by occupation and industry, May 2017
(Percent distribution)
CharacteristicContingent workers
Estimate 1 Estimate 2 Estimate 3
Noncontingentworkers
OCCUPATION
Total, 16 years and over (thousands) 1,958 2,511 5,858 147,473Percent 100.0 100.0 100.0 100.0
Management, professional, and related occupations 31.0 33.3 39.1 40.7Management, business, and financial operations occupations 5.6 7.4 7.9 17.2Professional and related occupations 25.4 25.9 31.2 23.5
Service occupations 18.2 18.8 17.1 17.2
Sales and office occupations 20.7 18.0 16.2 21.5Sales and related occupations 5.1 5.2 4.9 10.1Office and administrative support occupations 15.5 12.8 11.3 11.4
Natural resources, construction, and maintenance occupations 15.1 15.8 15.3 9.0Farming, fishing, and forestry occupations 3.5 2.7 2.7 0.7Construction and extraction occupations 11.0 11.5 10.6 5.0Installation, maintenance, and repair occupations 0.6 1.6 2.0 3.2
Production, transportation, and material moving occupations 14.9 14.1 12.2 11.6Production occupations 4.9 4.6 4.6 5.8Transportation and material moving occupations 10.0 9.5 7.7 5.8
INDUSTRY
Total, 16 years and over (thousands) 1,958 2,511 5,858 147,473Percent 100.0 100.0 100.0 100.0
Agriculture and related industries 4.5 4.0 3.2 1.6Mining, quarrying, and oil and gas extraction 0.4 0.3 0.2 0.5Construction 9.6 10.9 10.8 6.7Manufacturing 6.5 5.8 6.3 10.6Wholesale trade 1.5 1.1 1.0 2.3Retail trade 8.5 8.1 6.2 10.7Transportation and utilities 3.8 5.5 4.1 5.1Information 1.6 1.5 1.6 1.9Financial activities 1.9 2.3 2.6 7.1Professional and business services 12.7 16.3 14.9 12.0Education and health services 29.1 25.3 31.3 22.7Leisure and hospitality 12.1 10.1 9.3 9.3Other services 5.2 6.7 5.3 4.9Public administration 2.7 2.1 3.3 4.7
NOTE: Noncontingent workers are those who do not fall into any estimate of "contingent" workers. Detail may not sum to totals due to rounding.

Table 5. Employed workers with alternative and traditional work arrangements by selected characteristics, May 2017
(In thousands)
Characteristic Totalemployed
Workers with alternative arrangements
Independentcontractors
On-callworkers
Temporaryhelp agency
workers
Workersprovided by
contract firms
Workers withtraditional
arrangements
AGE AND SEX
Total, 16 years and over 153,331 10,614 2,579 1,356 933 137,85316 to 19 years 4,842 43 107 25 14 4,64720 to 24 years 14,212 330 263 195 53 13,37025 to 34 years 33,991 1,593 516 303 224 31,36135 to 44 years 32,065 2,160 565 283 207 28,84945 to 54 years 32,745 2,562 446 276 206 29,26355 to 64 years 26,236 2,426 399 170 124 23,11065 years and over 9,240 1,500 283 105 106 7,253
Men, 16 years and over 81,545 6,820 1,355 709 625 72,03516 to 19 years 2,365 42 53 20 9 2,23520 to 24 years 7,412 187 169 100 28 6,93125 to 34 years 18,169 1,016 271 170 157 16,55435 to 44 years 17,585 1,430 329 122 144 15,55745 to 54 years 17,099 1,611 208 166 146 14,97155 to 64 years 13,840 1,547 209 81 81 11,91465 years and over 5,076 986 117 50 60 3,873
Women, 16 years and over 71,785 3,794 1,224 647 308 65,81816 to 19 years 2,477 1 55 5 5 2,41220 to 24 years 6,800 143 94 95 25 6,43925 to 34 years 15,823 577 245 133 67 14,80735 to 44 years 14,480 730 237 161 63 13,29245 to 54 years 15,646 951 238 110 60 14,29255 to 64 years 12,396 878 190 88 44 11,19665 years and over 4,164 514 166 55 45 3,380
RACE AND HISPANIC OR LATINO ETHNICITY
White 120,638 8,975 2,019 797 614 108,237Black or African American 18,588 880 323 351 132 16,902Asian 9,110 461 129 104 115 8,297Hispanic or Latino ethnicity 25,525 1,566 449 345 163 22,973
FULL- OR PART-TIME STATUS
Full-time workers 125,240 7,485 1,428 1,042 785 114,496Part-time workers 28,091 3,129 1,151 314 148 23,357
NOTE: Workers with traditional arrangements are those who do not fall into any of the "alternative arrangements" categories. Detail may not add tototals because the total employed includes day laborers (an alternative arrangement, not shown separately) and there are a small number of workerswho were both "on call" and "provided by contract firms." Estimates for the above race groups (White, Black or African American, and Asian) do notsum to totals because data are not presented for all races. Persons whose ethnicity is identified as Hispanic or Latino may be of any race. Detail forother characteristics may not sum to totals due to rounding.

Table 6. Distribution of employed workers with alternative and traditional work arrangements by selected characteristics, May 2017
(Percent distribution)
Characteristic
Workers with alternative arrangements
Independentcontractors On-call workers Temporary help
agency workers
Workersprovided by
contract firms
Workers withtraditional
arrangements
AGE AND SEX
Total, 16 years and over 100.0 100.0 100.0 100.0 100.016 to 19 years 0.4 4.2 1.9 1.5 3.420 to 24 years 3.1 10.2 14.4 5.6 9.725 to 34 years 15.0 20.0 22.3 23.9 22.735 to 44 years 20.4 21.9 20.9 22.2 20.945 to 54 years 24.1 17.3 20.3 22.1 21.255 to 64 years 22.9 15.5 12.5 13.3 16.865 years and over 14.1 11.0 7.7 11.3 5.3
Men, 16 years and over 64.3 52.5 52.3 67.0 52.316 to 19 years 0.4 2.0 1.5 1.0 1.620 to 24 years 1.8 6.5 7.4 3.0 5.025 to 34 years 9.6 10.5 12.5 16.8 12.035 to 44 years 13.5 12.7 9.0 15.4 11.345 to 54 years 15.2 8.1 12.2 15.7 10.955 to 64 years 14.6 8.1 6.0 8.6 8.665 years and over 9.3 4.5 3.7 6.5 2.8
Women, 16 years and over 35.7 47.5 47.7 33.0 47.716 to 19 years 0.0 2.1 0.4 0.5 1.720 to 24 years 1.3 3.7 7.0 2.6 4.725 to 34 years 5.4 9.5 9.8 7.1 10.735 to 44 years 6.9 9.2 11.8 6.8 9.645 to 54 years 9.0 9.2 8.1 6.4 10.455 to 64 years 8.3 7.4 6.5 4.7 8.165 years and over 4.8 6.4 4.1 4.9 2.5
RACE AND HISPANIC OR LATINO ETHNICITY
White 84.6 78.3 58.8 65.8 78.5Black or African American 8.3 12.5 25.9 14.1 12.3Asian 4.3 5.0 7.7 12.3 6.0Hispanic or Latino ethnicity 14.8 17.4 25.4 17.4 16.7
FULL- OR PART-TIME STATUS
Full-time workers 70.5 55.4 76.9 84.1 83.1Part-time workers 29.5 44.6 23.1 15.9 16.9
NOTE: Workers with traditional arrangements are those who do not fall into any of the "alternative arrangements" categories. Estimates for the above racegroups (White, Black or African American, and Asian) do not sum to totals because data are not presented for all races. Persons whose ethnicity is identified asHispanic or Latino may be of any race. Detail for other characteristics may not sum to totals due to rounding.
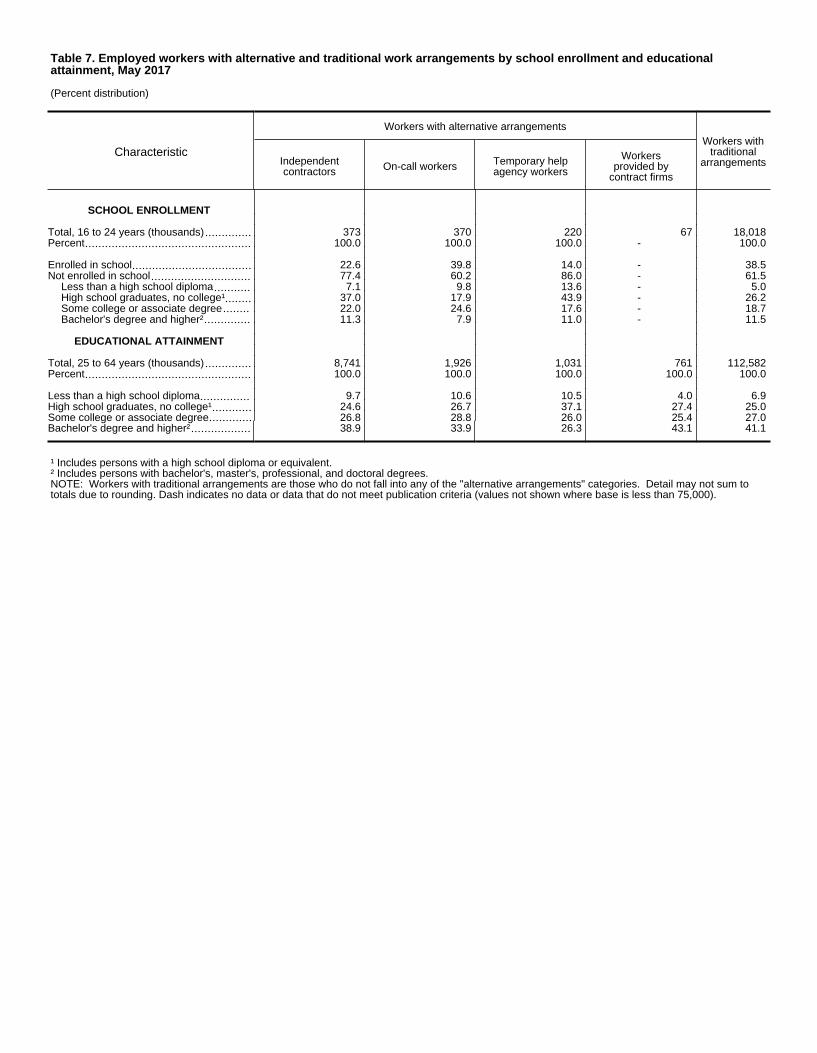
Table 7. Employed workers with alternative and traditional work arrangements by school enrollment and educationalattainment, May 2017
(Percent distribution)
Characteristic
Workers with alternative arrangements
Independentcontractors On-call workers Temporary help
agency workers
Workersprovided by
contract firms
Workers withtraditional
arrangements
SCHOOL ENROLLMENT
Total, 16 to 24 years (thousands) 373 370 220 67 18,018Percent 100.0 100.0 100.0 - 100.0
Enrolled in school 22.6 39.8 14.0 - 38.5Not enrolled in school 77.4 60.2 86.0 - 61.5
Less than a high school diploma 7.1 9.8 13.6 - 5.0High school graduates, no college¹ 37.0 17.9 43.9 - 26.2Some college or associate degree 22.0 24.6 17.6 - 18.7Bachelor's degree and higher² 11.3 7.9 11.0 - 11.5
EDUCATIONAL ATTAINMENT
Total, 25 to 64 years (thousands) 8,741 1,926 1,031 761 112,582Percent 100.0 100.0 100.0 100.0 100.0
Less than a high school diploma 9.7 10.6 10.5 4.0 6.9High school graduates, no college¹ 24.6 26.7 37.1 27.4 25.0Some college or associate degree 26.8 28.8 26.0 25.4 27.0Bachelor's degree and higher² 38.9 33.9 26.3 43.1 41.1
¹ Includes persons with a high school diploma or equivalent.² Includes persons with bachelor's, master's, professional, and doctoral degrees.NOTE: Workers with traditional arrangements are those who do not fall into any of the "alternative arrangements" categories. Detail may not sum tototals due to rounding. Dash indicates no data or data that do not meet publication criteria (values not shown where base is less than 75,000).

Table 8. Employed workers with alternative and traditional work arrangements by occupation and industry, May 2017
(Percent distribution)
Characteristic
Workers with alternative arrangements
Independentcontractors
On-callworkers
Temporaryhelp agency
workers
Workersprovided by
contract firms
Workers withtraditional
arrangements
OCCUPATION
Total, 16 years and over (thousands) 10,614 2,579 1,356 933 137,853Percent 100.0 100.0 100.0 100.0 100.0
Management, professional, and related occupations 43.4 35.6 21.7 49.1 40.7Management, business, and financial operations occupations 23.9 5.3 4.6 13.9 16.7Professional and related occupations 19.5 30.3 17.1 35.1 24.0
Service occupations 18.1 23.7 13.8 24.6 17.0
Sales and office occupations 16.0 11.3 19.3 6.5 22.0Sales and related occupations 13.5 4.5 2.8 2.4 9.8Office and administrative support occupations 2.5 6.8 16.5 4.1 12.1
Natural resources, construction, and maintenance occupations 15.9 16.1 6.1 13.3 8.5Farming, fishing, and forestry occupations 0.4 1.2 0.4 0.4 0.8Construction and extraction occupations 12.1 11.7 3.4 8.8 4.5Installation, maintenance, and repair occupations 3.3 3.2 2.2 4.0 3.2
Production, transportation, and material moving occupations 6.7 13.2 39.2 6.6 11.8Production occupations 1.7 2.6 19.8 2.2 6.0Transportation and material moving occupations 5.0 10.6 19.3 4.4 5.8
INDUSTRY
Total, 16 years and over (thousands) 10,614 2,579 1,356 933 137,853Percent 100.0 100.0 100.0 100.0 100.0
Agriculture and related industries 2.0 1.8 0.4 0.4 1.6Mining, quarrying, and oil and gas extraction 0.1 0.8 0.6 1.6 0.5Construction 19.3 11.4 3.6 7.2 5.8Manufacturing 2.2 3.7 32.2 12.0 11.1Wholesale trade 1.5 1.1 3.6 1.0 2.3Retail trade 6.4 6.0 1.2 3.2 11.1Transportation and utilities 5.7 8.6 3.0 6.6 5.0Information 2.2 2.3 1.9 2.0 1.9Financial activities 9.6 3.4 4.2 8.5 6.9Professional and business services 25.1 6.6 26.8 17.0 10.7Education and health services 9.6 35.3 15.0 18.3 24.0Leisure and hospitality 6.2 10.1 2.0 4.4 9.6Other services 9.7 4.6 3.1 2.5 4.6Public administration 0.4 4.2 1.2 14.7 5.0
NOTE: Workers with traditional arrangements are those who do not fall into any of the "alternative arrangements" categories. Detail may not sum tototals due to rounding. For temporary help agency workers and workers provided by contract firms, the industry classification is that of the place towhich they were assigned. For a very small percentage of these workers, the industry was not provided.
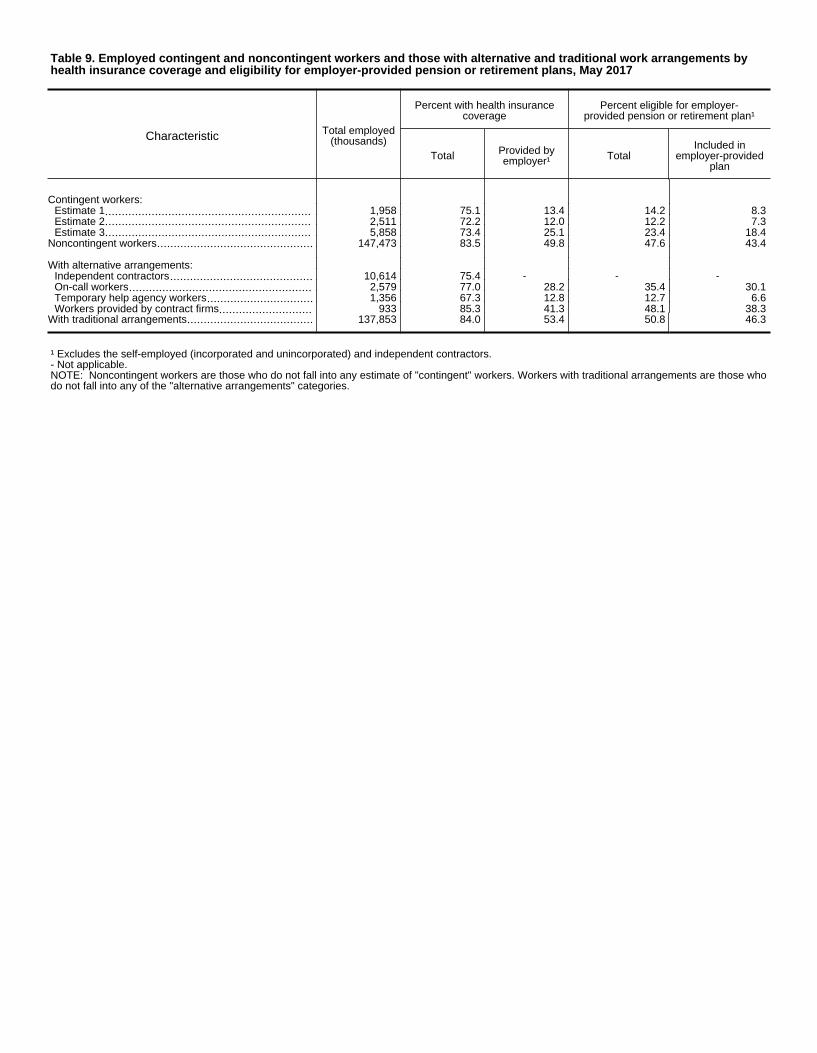
Table 9. Employed contingent and noncontingent workers and those with alternative and traditional work arrangements byhealth insurance coverage and eligibility for employer-provided pension or retirement plans, May 2017
Characteristic Total employed(thousands)
Percent with health insurancecoverage
Total Provided byemployer¹
Percent eligible for employer-provided pension or retirement plan¹
TotalIncluded in
employer-providedplan
Contingent workers:Estimate 1 1,958 75.1 13.4 14.2 8.3Estimate 2 2,511 72.2 12.0 12.2 7.3Estimate 3 5,858 73.4 25.1 23.4 18.4
Noncontingent workers 147,473 83.5 49.8 47.6 43.4
With alternative arrangements:Independent contractors 10,614 75.4 - - -On-call workers 2,579 77.0 28.2 35.4 30.1Temporary help agency workers 1,356 67.3 12.8 12.7 6.6Workers provided by contract firms 933 85.3 41.3 48.1 38.3
With traditional arrangements 137,853 84.0 53.4 50.8 46.3
¹ Excludes the self-employed (incorporated and unincorporated) and independent contractors.- Not applicable.NOTE: Noncontingent workers are those who do not fall into any estimate of "contingent" workers. Workers with traditional arrangements are those whodo not fall into any of the "alternative arrangements" categories.

Table 10. Employed contingent workers by their preference for contingent or noncontingent work arrangements, May 2017
(Percent distribution)
PreferenceContingent workers
Estimate 1 Estimate 2 Estimate 3
Total, 16 years and over (thousands) 1,958 2,511 5,858Percent 100.0 100.0 100.0
Prefer noncontingent employment 62.5 58.8 55.1Prefer contingent employment 29.9 31.8 32.8It depends 7.0 8.5 9.5Not available 0.6 0.9 2.6
NOTE: Noncontingent employment refers to work that does not fall into any estimate of "contingent" workers. Detail may not sum to totals due torounding.
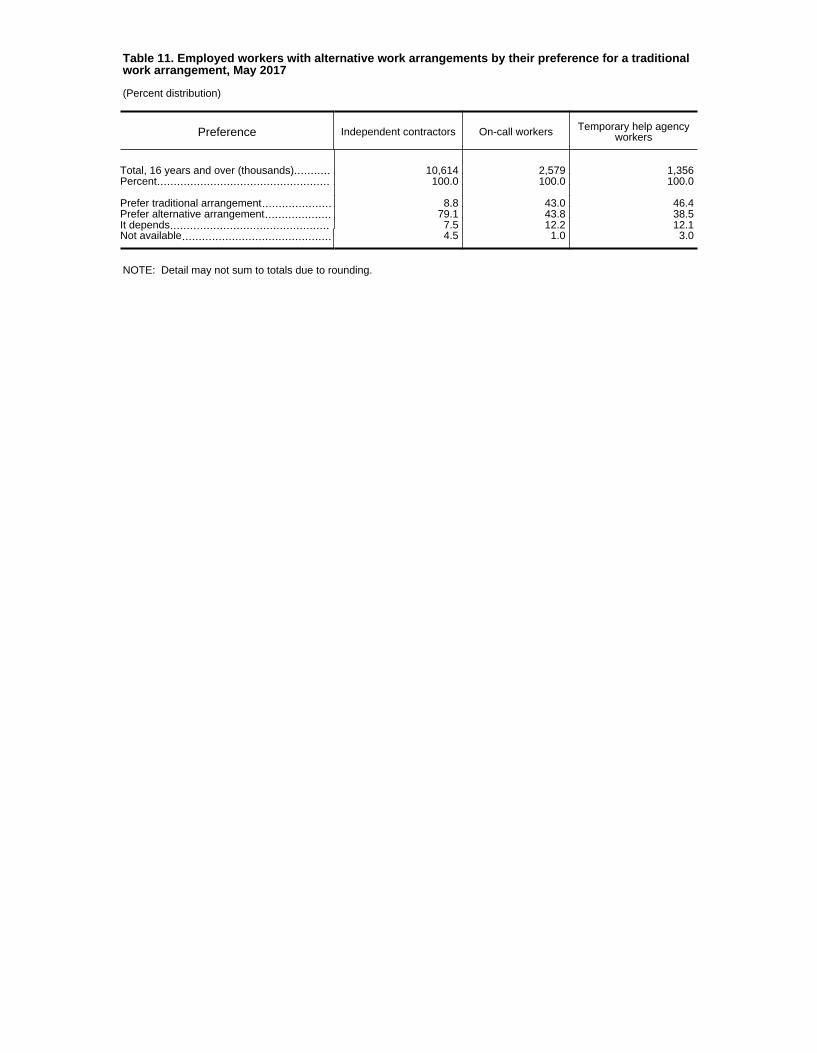
Table 11. Employed workers with alternative work arrangements by their preference for a traditionalwork arrangement, May 2017
(Percent distribution)
Preference Independent contractors On-call workers Temporary help agencyworkers
Total, 16 years and over (thousands) 10,614 2,579 1,356Percent 100.0 100.0 100.0
Prefer traditional arrangement 8.8 43.0 46.4Prefer alternative arrangement 79.1 43.8 38.5It depends 7.5 12.2 12.1Not available 4.5 1.0 3.0
NOTE: Detail may not sum to totals due to rounding.

Table 12. Employed workers with alternative and traditional work arrangements by contingent and noncontingentemployment, May 2017
Arrangement Total(thousands)
Percent distribution
Contingent workers
Estimate 1 Estimate 2 Estimate 3
Noncontingentworkers
With alternative arrangements:Independent contractors 10,614 - 3.2 3.2 96.8On-call workers 2,579 7.7 7.8 21.1 78.9Temporary help agency workers 1,356 16.8 22.9 42.0 58.0Workers provided by contract firms 933 3.6 5.1 15.0 85.0
With traditional arrangements 137,853 1.0 1.1 3.1 96.9
- Not applicable. Excludes independent contractors and the self-employed (incorporated and unincorporated).NOTE: Noncontingent workers are those who do not fall into any estimate of "contingent" workers. Workers with traditional arrangements are those whodo not fall into any of the "alternative arrangements" categories.
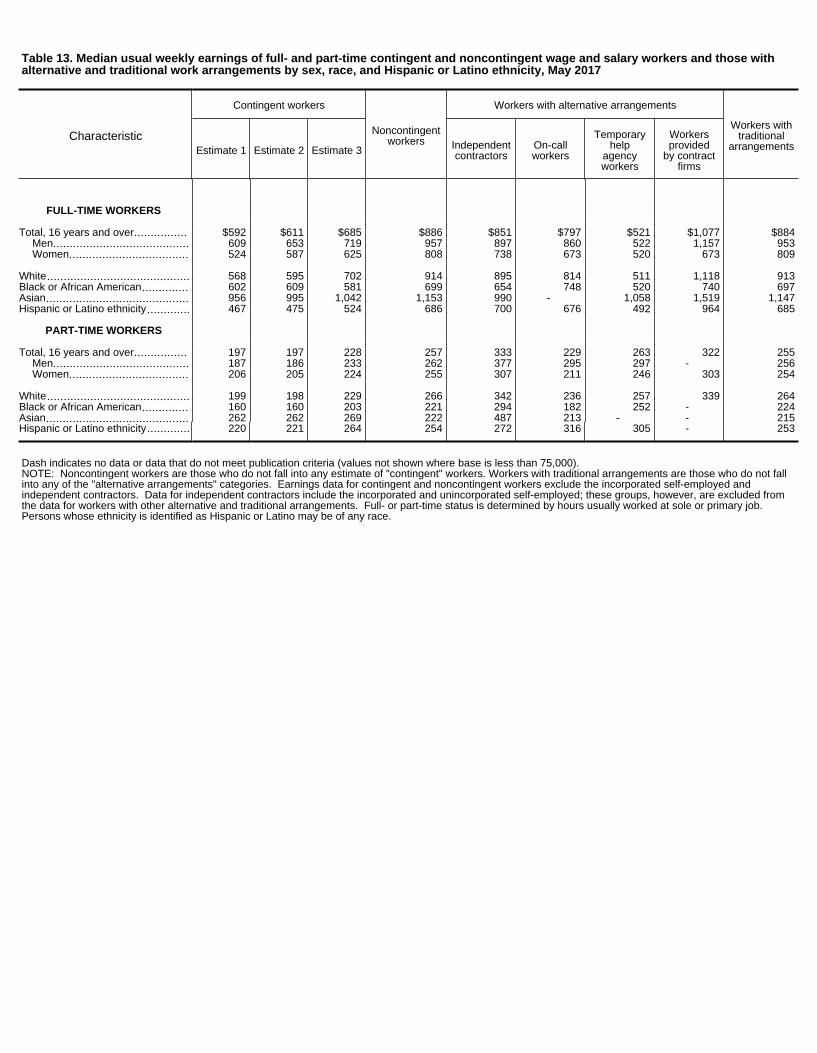
Table 13. Median usual weekly earnings of full- and part-time contingent and noncontingent wage and salary workers and those withalternative and traditional work arrangements by sex, race, and Hispanic or Latino ethnicity, May 2017
Characteristic
Contingent workers
Estimate 1 Estimate 2 Estimate 3
Noncontingentworkers
Workers with alternative arrangements
Independentcontractors
On-callworkers
Temporaryhelp
agencyworkers
Workersprovided
by contractfirms
Workers withtraditional
arrangements
FULL-TIME WORKERS
Total, 16 years and over $592 $611 $685 $886 $851 $797 $521 $1,077 $884Men 609 653 719 957 897 860 522 1,157 953Women 524 587 625 808 738 673 520 673 809
White 568 595 702 914 895 814 511 1,118 913Black or African American 602 609 581 699 654 748 520 740 697Asian 956 995 1,042 1,153 990 - 1,058 1,519 1,147Hispanic or Latino ethnicity 467 475 524 686 700 676 492 964 685
PART-TIME WORKERS
Total, 16 years and over 197 197 228 257 333 229 263 322 255Men 187 186 233 262 377 295 297 - 256Women 206 205 224 255 307 211 246 303 254
White 199 198 229 266 342 236 257 339 264Black or African American 160 160 203 221 294 182 252 - 224Asian 262 262 269 222 487 213 - - 215Hispanic or Latino ethnicity 220 221 264 254 272 316 305 - 253
Dash indicates no data or data that do not meet publication criteria (values not shown where base is less than 75,000).NOTE: Noncontingent workers are those who do not fall into any estimate of "contingent" workers. Workers with traditional arrangements are those who do not fallinto any of the "alternative arrangements" categories. Earnings data for contingent and noncontingent workers exclude the incorporated self-employed andindependent contractors. Data for independent contractors include the incorporated and unincorporated self-employed; these groups, however, are excluded fromthe data for workers with other alternative and traditional arrangements. Full- or part-time status is determined by hours usually worked at sole or primary job.Persons whose ethnicity is identified as Hispanic or Latino may be of any race.