continental shelf definition in the south tasman rise ... · the south tasman rise region: law of...
TRANSCRIPT

Continental Shelf Definition in the South Tasman Rise Region:
Law of the Sea Survey 202, Preliminary Results
by
George Bemardel
AGSO Record 1999/26
IIIIi .;;.._ ,,--- - ~-:
...... -

• • • • • • • • • • • • • • • • • • • • • • • • • • • • • • • • •
Australian Geological Survey Organisation
Petroleum and Marine Division
AGSO Record 1999/26
Continental Shelf Definition in the South Tasman Rise Region : Law of the Sea Survey 202,
Preliminary Results
by
George Bemardel

Department of Industry, Science & Resources
Minister for Industry, Science & Resources: Senator the Hon. Nick Minchin Parliamentary Secretary: The Hon. Warren Entsch, MP Secretary: Russell Higgins
Australian Geological Survey Organisation
Executive Director: Neil Williams
O Commonwealth of Australia 1999
This work is copyright. Apart from any fair dealings for the purposes of study, research, criticism or review, as permitted under the Copyright Act 1968, no part may be reproduced by any process without written permission. Copyright is the responsibility of the Executive Director, Australian Geological Survey Organisation. Requests and enquiries should be directed to the Executive Director, Australian Geological Survey Organisation, GPO Box 378, Canberra, ACT, 2601, Australia.
ISSN 1039-0073 ISBN 0 642 39786 4
Bibliographic reference: Bernardel, G., 1999. Continental Shelf Definition in the South Tasman Rise Region: Law of the Sea Survey 202, Preliminary Results. Australian Geological Survey Organisation, Record 1999126.
AGSO has tried to make the information in this product as accurate as possible. However, it does not guarantee that the information is totally accurate or complete. Therefore, you should not rely solely on this information when malung a commercial decision.
11
Australian Geological Survey Organisation

Contents
Executive Summary
Introduction
Geological and Morphological . . Setting .. .
Survey Line Design . .
, . . . . . . .
Survey Line Summary
survey Line Descriptions
Cruise Narrative
Conclusion
Acknowledgments
References
Appendices
UNCLOS Article 76 Informal Terms relating to Article 76 Description of RV Rig Seismic Crew List Proposed Survey Way Points Sonobuoy Deployments Preliminary Law of the Sea Parameter List Weather Diary
Figures
1. Map of LOS South Tasman Rise AGSO Surveyt202 showing EEZ 41 (stippled area), proposed seismic (solid), actual seismic (dashed) and main morphological features (Sx are sonobuoy positions - see Appendix 6).
2. Line diagrams for seismic acquired. Seismic lines given in terms of shot 42-47 points (1000 SPs = 50 km) and TWT in seconds.
. . . 111
Australian Geological Survey Organisation

Executive Summary
This report presents the preliminary results of Australian Geological Survey Organisation RV Rig Seismic survey 202. It was conducted for the Law of the Sea project, as part of the continuing effort to optimise Australia's definition of its 'legal' Continental Shelf. Its purpose was to determine the maximum extent of the Continental Shelf beyond the 200 nautical mile Exclusive Economic Zone around southern Tasmania. This claim is based on the natural continental prolongation of the South Tasman Rise and East Tasman Plateau features. All objectives of the cruise proposal were met. In adhtion, data in support of two proposed Ocean Drilling Program sites along with two deep seismic transects of the South Tasman Rise were acquired.
The cruise commenced in Hobart on 13 January, 1998, and ended in the same port on 18 February, 1998. A total of some 3900 kilometres of deep seismic coverage was obtained. Gravity and bathymetry data was acquired continuously, but magnetics data was limited to seismic lines and long transits. Navigation was provided entirely by two independent differential GPS systems. Ten sonobuoys were successfully deployed in order to determine sonic velocities for the underlying rocks.
The seismic lines for the survey area were designed to add to existing seismic and bathymetric coverage, and provide not only positions for the foot-of-slope and the 2500 metre isobath, but also to determine the thickness of sediment beyond the Hedberg line. By identifying these points along lines separated no further than 60 nautical miles, Australia is in a position to maximise its extended Continental Shelf beyond the Australian Exclusive Economic Zone, under rules outlined in Article 76 of the United Nationsconvention on the Law of the Sea.
iv Australian Geological Survey Organisation

Introduction
The area of ocean floor beyond the Australian Exclusive Economic Zone (AEEZ) off southern Tasmania has been identified as potentially extending Australia's entitlement to 'legal' Continental Shelf (CS) (Syrnonds and Willcox, 1989). The area in question represents seabed, with associated subsoil, approximately three times the size of the Tasmanian landmass. It is based on the continental affinity of two seafloor plateaus: the South Tasman Rise (STR) and the East Tasman Plateau (ETP), that are considered to form part of the natural prolongation of Tasmania. Although the ETP is wholly positioned within the AEEZ, about half of the STR lies outside it.
As part of the Australian government's continuing effort to acquire scientific data to support its CS limits beyond the AEEZ, the Australian Geological Survey Organisation (AGSO), through its Law of the Sea (LOS) project, proposed a marine survey for the STR area. For this, a series of combined seismic and bathyrnetric traverses were designed. The geometry of these lines and pre-existing subsea data, were such as to ensure that the requirements laid out in Article 76 (Appendix 1) of the 1982 United Nations Convention on the Law of the Sea (UNCLOS) could be met. As a result of this proposal, LOS survey 202 was carried out using AGSO's chartered marine vessel RV Rig Seismic (Appendix 3).
A total seismic coverage of some 3400 km over 11 lines was originally planned. The lines were devised to acquire data over the eastern and southern margins of the STR as well as the southern and northeastern margins of the ETP. This planning was aided by a set of pre-existing sparse seismic lines, and by interpretation of the regional gravity field from satellite altimetry (Sandwell and Smith, 1997). The gravity dataset outlines the general structural setting for the region. The seismic traverses were positioned both to satisfy the 60 nautical mile (n mile) maximum separation criteria (Appendix 1) and to determine those margin areas likely to support a more distal foot-of-slope (FoS) pick. In addition, two short seismic lines were included to traverse to intersect a proposed Ocean Drilling Program (ODP) site on the southern nose of the STR.
The survey began in Hobart on Tuesday, 13 January 1998, and ended in the same port on Wednesday, 18 February 1998. Good weather conditions in the first three weeks of the survey allowed several of the proposed lines to be extended, thus resulting in a final seismic line total of about 3900 kilometres. However, the final two weeks of the cruise were beset with equipment and weather problems. This was further compounded by dominant west-southwest swells causing high levels of cable noise for the last two lines. In response, cable depths of between 14 and 17 metres were used to alleviate the problem, which has resulted in some degradation of the high frequency content of the seismic data.
This report1 covers the preliminary results of the survey. A basic overview of both the geological and UNCLOS parameters is given along with a day-by-day summary of survey conditions and events. These are, in turn, supported by relevant appendices. No
' The data, and the interpretations based on that data, contained in this report are preliminary only. It is not necessarily indicative or representative of the final information that might be used by Australia to support the location of the outer limit of the continental shelf beyond 200 nautical miles.
1 Australian Geological Survey Organisation

detailed geological or morphological interpretation is presented, but some of this information can be found in the references cited.
Geological and Morphological Setting
The STR is a continental fragment centred at approximately 47OS, 148' E with an area covering about 200 000 krn2. It can be described as a core of planated Palaeozoic basement that is flanked on all sides by sedmentary basins of Cretaceous and Cenozoic age (Willcox, 1989). Morphologically, it can be described as a northwest- southeast oriented bathyrnetric high rising from abyssal depths of between 4000 - 5000 m to a central high reaching to within 900 m of sea level, where it is a broad dome with low-gradient slopes in all directions. The STR is separated from Tasmania to the north by the west-northwesterly trending South Tasman Saddle. To its east and south lie broad expanses of abyssal sediment on oceanic crust. To its west lies thinly covered oceanic crust beyond a major north-northeasterly trending cliff-like feature, known as the Tasman Escarpment. This tectonic element is the northern expression of the Tasman Fracture Zone (TFZ) that extends southward to Antarctica, and is considered to be Australia's most spectacular physiographic feature (Exon and Crawford, 1997b).
The southern margin of the STR is steep and characterised by both south-dipping normal faults and north-south strike-slip faults. Around and to the north along.,the eastern mkgin the slope becomes more gradual and a more gentle transition down to the abyssal region prevails. Here, the geology is dominated by moderate levels of sedimentation, often thickening under the continental rise, which is interrupted, in places, by substantial volcanic developments. This volcanic character is further emphasised by the widespread emplacement of seamounts. These appear to have formed part of a series of hotspots that have migrated down the eastern margin of Australia to the Balleny chain near Antarctica. In contrast to the bare western side of the STR, oceanic crust to the east of this margin supports a substantial development of sedimentary cover.
The ETP is a smaller continental fragment than the STR, of approximately 50 000 krn2, and lies just to the southeast of Tasmania. Its continental affinity was confirmed by dredging (Exon et al., 1997a). The Cascade Seamount, a large volcanic guyot, occurs in the centre of the ETP at about 44OS, 150.5' E. The remainder of the plateau, except for some of its margins, is covered by substantial Cenozoic sedimentation. Topographically, apart from the seamount which rises to within 600 m of the sea surface, much of the plateau lies deeper than 2500 m.
To the northwest and west of the ETP the margin descends gradually to a deep depression that separates it from Tasmania, and is termed the East Tasman Saddle (Exon et al., 1997d). The slope to the east and southeast of the ETP is defined by a high-angle escarpment, while the remaining margins appear to be characterised by a low-gradent slope down to the abyssal plain.
The structural style of the STR, ETP and intervening L'Atalante Depression reflects the multi-phase break-up of East Gondwana. Briefly, the latest Cretaceous was
2 Australian Geological Survey Organisation

characterised by east-west extension and subsequent sea-floor spreading between the STR and ETP. Oceanic crust was emplaced and later formed basement for the large amount of sediment deposited in the L'Atalante Depression. By the end of the Cretaceous, spreading ceased here and was initiated further to the east between the ETP and the Lord Howe Rise continental fragment. Further to the west, fast north- south spreading between Australia and Antarctica began in the Middle Eocene. The STR then began to subside beneath the sea, and by the mid-Oligocene the Circum- Antarctic Current moved eastwards across the rise. This resulted in extensive erosion and is evident today as widespread planation over its crest. A more detailed description of the tectonic and stratigraphic framework is to be found in Exon et al. (1997a, 1997d), Exon and Crawford (1997b), Hill et al. (1995) and Royer and Rollet (1997).
Survey Line Design
UNCLOS requires that at sampling intervals no greater than 60 n mile2, data must be able to support the following to justify a maximum possible claim to CS:
definition of the maximum cut-off, 100 n mile beyond the 2500 m isobath;
definition of the Hedberg Line, 60 n mile beyond the foot-of-slope (FoS); and
determination of the sediment thickness distribution beyond the Hedberg Line up to the maximum allowable claim3.
In consideration of these rules, AGSO devised a survey plan of 11 seismic lines. These were named STR-A, STR-C, STR-D, STR-F to STR-M. The proposed line way points are presented in Appendix 5 while the proposed and final line geometries are shown in Figure 1. The survey was to concentrate over the eastern and southern slopes of the STR, as a substantial amount of swath bathymetry had been acquired over the western margins of Tasmania and the STR (ie. using the NO 1 'Atalante of IFREMER~) in 1994. This more than adequately delineated the western extremities of the FoS and 2500 m isobath. Seismic was not proposed for this western region as the geological setting meant that there was little chance of substantial sediment coverage beyond a Hedberg Line. This was confirmed by the passage of several swath bathymetry tracks indicating widespread exposure at the seafloor of oceanic crust (Bernardel, 1997). In devising the layout of these lines it is important to note that beyond the LOS requirements there was also general interest in recording deep seismic transects for scientific and hydrocarbon prospectivity purposes, as the STR is considered a frontier area for petroleum exploration.
- --
* Survey time constraints coupled with the imminent loss of AGSO's charter of the RV Rig Seismic meant that the survey could not be designed according to AGSO's "safe minimum approach", which incorporates a survey line spacing of 30 n mile.
The rules of Article 76 stipulate a maximum claimable limit as the greater of either 350 n mile from the baselines defining the territorial sea, or 100 n mile beyond the 2500 m isobath (Appendix 1).
Institut Fran~ais de Rkherche et Exploitation de la MER.
3 Australian Geological Survey Organisation

Lines STR-D, STR-K, STR-F to STR-H were positioned in parallel down the eastern slope of the STR (Figure 1). This served primarily to obtain picks for the FoS and determine sediment thickness beyond the associated Hedberg arc constructions. To the south, STR-G and STR-H were placed equidistantly about a pre-existing seismic line of the RV Maurice Ewing. Further to the north, STR-K and STR-F were designed such that STR-K is within 60 n mile of the more southerly placed STR-G, should STR-K support a greater sediment thickness than STR-F for a Hedberg Line arc drawn from a possible FoS position at the base of the more distal seamount on STR-F (see Figure I). In addition, STR-D was extended substantially to the southwest to obtain a deep seismic transect across several basins perched on the western flank of the STR.
Lines STR-I and STR-J were designed to test the positions of the southernmost projections of the FoS and 2500 m isobath on the STR. Although these lines extend out to the likely Hedberg Line boundary, the satellite gravity image and pre-existing RV Maurice Ewing seismic data indicated little prospect for substantial sediment thickness.
Line STR-L had no UNCLOS parameter significance, but was intended to provide a seismic tie along the eastern margin of the STR.
Lines STR-M, STR-A and STR-C were planned to locate FoS positions for the ETP. STR-M was also required to provide a deep seismic transect across the LYAtalante Depression. This line, however, was extensively modified during the survey to include a second traverse across the entire STR. Furthermore, the configurations of STR-A and STR-C allowed for the proposed ODP site ETP02A to be crossed at their common junction (Figure 1).
Two short lines, STR-R and STR-S, were included late in the survey design stage to survey a second proposed ODP site, STR02A, on the southern STR. They were not significant in terms of UNCLOS requirements.
Survey Line Summary
The following listing details the lines planned and acquired in the survey area (Figure 1). Altered configurations are indicated with respect to the proposed lines defined by the way points presented in Appendix 5. The order given is that recorded.
Length (km) Planned Line Actual Line Alteration Planned Actual
STR-C STR-D (eastern) STR-F STR-K STR-R STR-S STR-G STR-H
none shortened lengthened lengthened straightened straightened lengthened lengthened
4 Australian Geological Survey Organisation

STR-I~ 202109 shortened 232 183 STR-J 202110 lengthened 192 202 STR-L 2021 1 1 lengthened 352 417 STR-D (western) 202102 shortened 332 3 16 STR-M 202112 lengthened 368 758 STR-A 2021 13 shortened 243 224
--
Total: 3392 3875
Survey Line Descriptions
It should be emphasised that the following line descriptions, and the interpretation of LOS parameters, in particular, are preliminary and may not necessarily represent the arguments that will be put forward by the Australian Government in its submission supporting Continental Shelf in the survey area.
The following survey line descriptions present a broad overview of the geology seen and significant UNCLOS parameters dealt with. Simple line diagrams are found in Figure 2. A more detailed discussion on both stratigraphy and structure is to be found in Exon et al. (1997a, 1997d) and Exon and Crawford (1997b). Much of the discussion below is based on either single-channel seismic monitor records or onboard-processed brute stacks. While UNCLOS picks are presented here, a more comprehensive summary is included in Appendix 7. Additional information on sonobuoy deployments can be found in Appendix 6 - see Figure 1 for positions.
Line 202101 - East Tasman Plateau and abyssal plain transect (Fig. 2a)
Source: 3000 in3 sleeve guns Streamer: 3000 m, 240 channels Record: 16 seconds, 4 ms sample Orientation: southeast
Objective: Line STR-C was designed primarily to determine the position of the FoS and the sediment thickness beyond the Hedberg Line for the southeast margin of the ETP. This objective was broadened to include a deep seismic transect across both the plateau and the proposed ODP site ETP02A (Exon et al., 1997~).
Actual con.guration: The line began as 20210101 and ran southeast, crossing the proposed ODP site at 43' 57.6' S, 149' 55.7'E, and ending at the proposed end-of-line (EOL) as 20210 102.
Sediment: The line is dominated by three broad depocentres that have varying sediment thickness of 1.5 - 2.0 seconds TWT. Two of these are perched on the ETP (SPs 1000-3000 and 4000-5000, Fig. 2(a)), while the third extends out from the plateau's FoS to the EOL. The sedimentary section on the plateau is masked in places by multiple diffractive events indicating the presence of volcanics. These are
Actually shot in two parts - before and then after STR-J.
5 Australian Geological Survey Organisation

concentrated midway down the plateau, close to the Cascade Seamount feature. Rugged basement on the abyssal plains has promoted differential compaction in the overlying strata.
Basement: Basement is a strong event across much of the section, though strongly faulted and masked by lffractions in places. It shallows to form a major wall on the southern edge of the plateau against which plateau sediments onlap. A deep reflector in the vicinity of SP 5600 may be Moho, though final processing should confirm this.
Initial UNCLOS parameters: A clear FoS pick can be made on the southern ETP edge (about SP 5600, Fig. 2(a)). This places a Hedberg arc point down the line at about SP 7800. Sediment thickness at this point is approximately 800 ms TWT and so does not appear to support an extended CS claim beyond the Hedberg Line.
Line 202102 - east South Tasman Rise and abyssal plain transect (Fig. 2b)
Source: 1500 and 3000 in3 sleeve guns Streamer: 3000 m, 240 channels Record: 16 seconds, 4 ms sample Orientation: east-northeast
Objective: The eastern half of line STR-D was devised to sample sediment thickness beyond two widely-spaced potential Hedberg arcs, a FoS down the eastern margin of the STR as well as to obtain a good deep seismic transect of the sedimentary section implied by the regional gravity field for the margin and abyssal plain region. The inner potential Hedberg Line is based on a proposed FoS for the current line while the outer Hedberg point rests on the Hedberg arc drawn from a possible outer FoS on line STR- F further to the south (see below). The western half of the line, which does not form part of the LOS objectives for this survey, aimed to obtain a deep seismic and high- fold transect of the sedimentary basins of the STR out to the edge of the TFZ. Its description is given below.
Actual configuration: The line was commenced as 20210201. The actual start-of-line (SOL) was started about 35 krn further down the line from that proposed to make up for some lost time due to bad weather. This was not thought to be detrimental to the survey objectives as it was well beyond the outermost potential Hedberg Line. Nevertheless, the gravity image inlcated that at the SOL sediment overlying oceanic crust was thinning towards a neighbouring seamount. This was subsequently supported by the seismic data. The EOL was chosen at a point on the STR where a crossing to a previous NO 1 'Atalante seismic line enables a tie should the rest of the line to the west not be completed within the allotted survey time. A short 30 km stretch of the line was shot with alternate single arrays to allow for along line gun maintenance. This was commenced about 80 km into the line where thin sediment on oceanic basement meant that full source energy could be spared.
Sediment: A large seamount lies at the foot of the STR slope (SP 5800, Fig. 2(b)). Inboard to the STR, it appears to have acted as a barrier to down-slope selment movement. Consequently, a thick sedimentary pile has developed on the underlying basement and contains some 1.5 sec TWT of section. The reflectors here are mostly
6 Australian Geological Survey Organisation

continuous, but are masked by diffractions at deeper levels. To the east of the seamount reflectors are strongly continuous and sediment cover varies from a thickness of about 2.0 sec TWT in a depocentre (SP 5000, Fig. 2@)) at the seamount's base, thinning to an average of 1.0 sec TWT for the remainder of the line. At the line's eastern end it onlaps onto basement rising towards a seamount. Parts of the section are masked by probable complexes of volcanic intrusions and extrusions as indicated by multiple diffractive events. Reflectors across the line are mostly continuous, but vary in character due to differential compaction, basement movements and volcanic disruptions.
Basement: Basement across the line is clearly identified where overlain by sediments. To the east it is characterised by widespread diffractions indicating oceanic composition. Sections of high basement relief (SPs 2500-4500, Fig. 2(a)) indicate seamount developments and large-scale block faulting. Below the STR slope basement is often difficult to identify because of widespread diffractions.
Initial UNCLOS parameters: The 2500 m isobath was sampled at approximately SP 7015. The eastern base of the seamount to the east of the STR is a potential FoS pick. This FoS defines a potential Hedberg Line at about SP 3500, where sediment thickness is approximately 700-800 ms TWT. This is unlikely to support a CS boundary extension. However, if the outer seamount base on line STR-F (SP 5300, Fig. 2(c)) is accepted as a FoS then the constructed Hedberg arc is projected onto the line at about SP 1900. Sediment thickness here is over 1200 ms TWT thick and thins to about 1000 ms TWT within 8 krn. Therefore, a short extension to CS could be made. A second, more proximal, FoS pick is possible at about SP 6740, and defines a potential Hedberg arc at about SP 4510. Sediment here is 1200 ms TWT thick and thins quickly over uplifted basement, so that any possible extension to CS is likely to be small.
Line 202/02 - west South Tasman Rise transect (Fig. 2b)
Source: 3000 in3 sleeve guns Streamer: 3000 m, 240 channels Record: 16 seconds, 2 ms and 4 ms sample Orientation: northeast
Objective: The southwestern extension of line STR-D was designed so that should time remain once the major LOS requirements of the survey had been met then a major deep seismic transect should be acquired down the western margn of the STR. This would provide good high-fold coverage of the basinal sedments therein.
Actual configuration: The line was treated as an extension to 20210201, which was shot earlier in the survey. That is, a full-fold join was made at about 46' 55.47' S, 148' 31.30' E. The line was then shot as 20210202 and 20210203.
Sediment: The first quarter of this western extension to STR-D traverses the central north-northwesterly striking axis of the STR. Here, a high basement arch is thinly covered by sediment (SPs 7500-9000, Fig. 2(b)). Down the western margin several sedimentary basins are developed. These basins are separated by high-relief and
7 Australian Geological Survey Organisation

faulted basement blocks with partial rotation. The depocentres vary in thickness from approximately 900 ms TWT to at least 2 sec TWT in a steeply-bounded half-graben at about SP 10400 (Fig. 2(b)). Most of the basin reflectors are parallel to sub-parallel and strongly continuous with evidence of at least two unconfonnities acting as widespread sequence boundaries. The pockets of section developed here are less disrupted by diffractions in comparison to those on the eastern margin and may suggest that volcanic activity was not as active in the west. The TFZ is characterised by sedimentary build-ups in two deeply-incised north-northwesterly striking trenches. Sediment is very thin or absent over oceanic crust to its west.
Basement: The basement reflection event is well defined over most of the line as a clear interface between overlying continuous reflectors and a series of diffractive events suggesting rugged crystalline basement. Its uplifted and faulted form down the margin suggests a major extensional phase in its evolution, which is likely to be related to the separation of Australia and Antarctica in the Late Jurassic. From SPs 12000-12500 basement is characterised as an angular unconformity over older dipping strata.
Initial UNCLOS parameters: The 2500 m isobath was sampled with a likely FoS position at about SP 12600, which is the base of the Tasman Escarpment.
Line 202103 - east South Tasman Rise and abyssal plain transect (Fig. 2c)
Source: 1500 and 3000 in3 sleeve guns Streamer: 3000 m, 240 channels Record: 16 seconds, 4 ms sample Orientation: east-northeast
Objective: Line STR-F was designed to sample potential FoS picks at the base of the eastern margin of the STR and at the base of the more distal of two seamounts positioned at its foot. It was also required to go beyond the furthest potential Hedberg Line and determine sediment thickness.
Actual configuration: The line 20210301 followed the coordinates given in Appendix 5 up to the second dogleg. A small tangent line at the more westerly dogleg was implemented to lessen the severity of the angle. After a loop for gun maintenance at the easterly dogleg the line was recommenced as 20210302 until EOL. Furthermore, a 10 krn extension to the EOL was planned to include the capture of a recomputed Hedberg Line point for the outer seamount. As there appeared to be sufficient sediment coverage at this outer potential Hedberg Line, seismic was extended by a further 10 km until sediment began thinning.
Sediment: Se&ment cover is localised in two small basins perched on the STR at the line's western end and is widespread on the over the Tasman Basin in the abyssal regions to the east of the seamounts, where it averages 800 ms TWT in thickness. The central portion of the line, at the foot of the STR, is dominated by two large seamounts that are devoid of sediments. A small basin is developed at the base of the rise and to the west of the more westerly seamount (at SP 3500, Fig. 2(c)). Reflectors
8 Australian Geological Survey Organisation

in the abyssal plain fill are poorly continuous, while those in the STR basins are more SO.
Basement: Basement on the STR slope is obscured, in part, by large-scale volcanic activity. At the base of the abyssal plain section it is highly diffractive indicating an oceanic origin. A 40 km stretch at the eastern extremity, however, is continuous with faulting and slight rotation. This may support an extensional phase between the STR and some other feature prior to the onset of ocean-floor spreading.
Initial UNCLOS parameters: An inner FoS was sampled at about SP 3450 with an outer FoS at the base of the seamount at about SP 5300. The outer FoS produces a Hedberg Line point at SP 7500, where sediment is 1150 - 1200 ms TWT in thickness. Once more accurate velocity information is determined for the sediment column, a small CS extension beyond this potential Hedberg Line may be possible. The inner FoS defines a Hedberg arc point just beyond the outer seamount. Sediment thickness averages 700 - 800 ms here and is thus not able to support an extension. Down the slope to the east the 2500 metre isobath was intersected at about SP 2720. It is then crossed a further four times over the two large seamounts cited.
Line 202104 - east South Tasman Rise and abyssal plain transect (Fig. 26)
Source: 3000 in3 sleeve guns Streamer: 3000 m, 240 channels Record: 16 seconds, 4 ms sample Orientation: east-northeast
Objective: Line STR-K was designed to sample a FoS pick and determine sediment thickness beyond two potential Hedberg Line positions. A deep seismic transect down the eastern slope of the STR and across sediment cover on the abyssal plain was also intended.
Actual configuration: Line STR-K was shot as 20210401 until the proposed dogleg. The SOL was chosen some 70 krn further back from that proposed because of the possibility of meeting sediment thickness requirements beyond a Hedberg Line arc defined by the outermost potential FoS on STR-F (see above). After a gun maintenance loop it was continued as 20210402 until the proposed EOL.
Sediment: Sediment cover is variable across the line. The STR at the line's western end supports an average thickness of 100 ms TWT on basement where widespread peneplanation has occurred. The sedimentary section down the slope is difficult to identify because of widespread volcanism. At the base of the slope a major angular unconformity appears to have eroded a large section of sediment (SP 6000, Fig. 2(d)). Further to the east, under the continental rise, the pile appears to thicken as it extends out to the abyssal regions into the Tasman Basin. Here, there may be up to 2.0 sec TWT of sediment, though much is obscured by diffractive events. This section then gradually thins out to an average thickness of 600 - 800 ms TWT over uneven basement for most of the line. The reflectors are dominantly continuous and parallel for most of the line where not obscured by volcanics. A slight thickening of the pile
9 Australian Geological Survey Organisation

occurs to the east where a maximum thickness of 1300 ms TWT develops on faulted basement. The abyssal section is pierced in places by probable seamount formations.
Basement: Basement is masked under parts of the continental slope and rise by widespread volcanism. For much of the abyssal section it is highly diffractive indicating its ocean basaltic composition. To the east, however, it is more continuous in character and partly faulted with slight rotation about the faults. This rotated character was also seen along the eastern part of line STR-F and again suggests an extensional phase.
Initial UNCLOS parameters: A more proximal potential FoS pick was found at about SP 6280 defining a Hedberg Line arc at about SP 4200. Sediment thickness here, however, is of the order of 600 ms TWT so that an extension to CS is not possible. If the outer FoS for STR-F is considered instead, then the associated Hedberg arc strikes STR-K at about SP 1190. At this point, there appears to be some 1200-1300 ms TWT of sedment thickness and so an extension to the Hedberg Line may be possible. However, the extension will not be great as the section thins to about 1100 ms TWT within some 10 krn (ie. at about SOL). Two more distal FoSs were picked at about SPs 6100 and 5450. Their potential Hedberg Lines are at approximately SPs 3900 and 3 130, respectively. Both of these Hedberg arc points overlie an uplifted basement complex, which supports insufficient sediment coverage to promote extended claims.
Line 202105 - seismic traverse over proposed ODP site STR02A (Fig. 2e)
Source: 3000 in3 sleeve guns Streamer: 3000 m, 240 channels Record: 16 seconds, 4 ms sample Orientation: south-southeast
Objective: Line STR-R was designed as a short seismic transect across the proposed ODP site STR02A (Exon et al., 1997c) for the STR at 48' 30.000' S, 149' 6.700' E.
Actual configuration: The line was shot as 20210501 on a bearing of 153.8' from approximately 48' 21.29' S, 149' 0.26' E to 48' 39.49' S, 149' 13.73' E for a length of 36 km. This involved a slight alteration to the way points proposed (Appendix 5).
Sediment: The sedimentary section is concentrated in two depocentres separated by a basement complex high. The central depocentre is about 2.0 sec TWT thick and is defined by a tight, faulted half-graben (SPs 1250-1500, Fig. 2(e)). Reflectors within this feature onlap opposing basement blocks; that to the south as it rises and breaks through to the sea floor. Reflectors are parallel and mostly continuous. Slight deformation and faulting is evident due to the effects of differential compaction and movements along the basement faults.
Basement: Basement is uplifted as a block in the north and then plunges to a deep low before rising through to the seafloor in the south. It is readily identifiable across the line.
10 Australian Geological Survey Organisation

Initial UNCLOS parameters: This is not a LOS line so no LOS parameters were sought.
Line 20W06 - seismic traverse over proposed ODP site STR02A (Fig. 2f)
Source: 3000 in3 sleeve guns Streamer: 3000 m, 240 channels Record: 16 seconds, 4 ms sample Orientation: east-northeast
Objective: Line STR-S was designed to run over the same proposed ODP site as line STR-R, but at right-angles to it.
Actual configuration: The line was shot as 20210601 on a bearing of 64.4' from approximately 48' 33.73' S, 148' 54.98' E to 48' 25.91' S, 149' 19.54' E for a length .
of 32 km.
Sediment: The seQment cover characteristics are similar to those on line STR-R. The central depocentre, however, is somewhat broader and so probably indicates its general strike in the lrection of this line. The basement high at the eastern end is covered by about 500 ms TWT of sediment.
Basement: A basement high to the east appears to be the continuation of that in the south of STR-R, but with lower relief as it fails to break through to the seafloor (SPs 1400-1670, Fig. 2(f)).
lnitial UNCLOS parameters: This is not a LOS line so no LOS parameters were sought.
Line 202107 - east South Tasman Rise and abyssal plain transect (Fig. 2g)
Source: 3000 in3 sleeve guns Streamer: 3000 m, 240 channels Record: 16 seconds, 4 ms sample Orientation: east-northeast
Objective: Line STR-G was designed to determine potential FoS picks along the eastern margin of the STR and the sediment thickness beyond the respective potential Hedberg Lines further to the east. In addition, a deep-penetration transect of the STR slope and Tasman Basin section was sought.
Actual configuration: The line was shot as 20210701 with the actual SOL beginning some 9 km back from the proposed SOL as the system was ready early for seismic acquisition.
Sediment: To the line's west sediment cover down the STR slope averages 800 ms TWT in thickness. Reflectors are generally strong and continuous, except where there is slight masking by probable volcanics. The section deepens to 1.4 sec TWT at the base of the slope and rise region and then thins gradually to the east over faulted
1 1 Australian Geological Survey Organisation

basement. The sediment character here is masked by diffractions off a seamount and associated volcanism. Reflectors in the abyssal region are strong and parallel except at the eastern end, where they are deformed and broken by basement-controlled faulting.
Basement: Basement is readily identified except in the vicinity of the STR slope-rise region where overlying diffractions mask its identification (SPs 2100-2500, Fig. 2(g)). Its character is diffractive in the abyssal regions where it probably indcates oceanic composition. Mounding in places is probably related to minor seamount developments. In the eastern half it has a block-faulted form with slight rotation indicating some extension. Slight stepping at the sea floor suggests the reactivation of basement faults.
Initial UNCLOS parameters: Two candidates for the FoS pick were identified. An inner FoS pick is found at SP 2040, while that more distal is at about SP 2275. The latter is found at the base of a small seamount. The former FoS pick defines the Hedberg Line at about SP 4250, where sediment cover of 600 ms TWT will not support a claim to extend CS, while the latter supports even less sediment depth at the potential Hedberg position of about SP 4490. In the possible situation that the outer FoS on line STR-F is considered (see above), then the Hedberg arc would fall at or just beyond the EOL for this line. However, the line was not extended to test the sediment thickness as it was clear from the seismic monitors that sediment was thinning well beyond the required minimum thickness (300 ms TWT at EOL, Fig. 2(g)).
Line 202108 - east South Tasman Rise and abyssal plain transect (Fig. 2h)
Source: 3000 in3 sleeve guns Streamer: 3000 m, 240 channels Record: 16 seconds, 4 ms sample Orientation: northeast
Objective: Line STR-H was designed to obtain a pick for the FoS and check for sediment thickness beyond the associated Hedberg Line. A good deep seismic transect across the STR slope and adjoining abyssal region over the Tasman Basin was sought as well.
Actual configuration: Line STR-H was shot as 20210801 commencing and ending at the proposed way points.
Sediment: The lower part of the STR continental slope, the continental rise and abyssal regions is covered by sediment. This section averages 400 ms TWT in thickness for the slope to around 800 ms TWT over much of the abyssal region. Reflectors here are strongly continuous and parallel. Sedmentary cover is absent from much of the upper slope due to the presence of volcanism. The pinching out of the shallower sequence against the slope defines a probable FoS pick. The section ends to the east by onlap onto a rising seamount. A shallow sedimentary pile is developed on the STR plateau at the top of the slope (SPs 4200-4600, Fig. 2(h)).
12 Australian Geological Survey Organisation

Basement: Basement is discernible across most of the line excepting for the upper slope of the STR where it is masked by seafloor diffractions, a probable consequence of volcanism. The basement's highly diffractive character across the abyssal section implies oceanic composition. Here, minor mounding may point to volcanic piling.
Initial UNCLOS parameters: The 2500 m isobath was intersected at about SP 4590. A probable FoS pick is to be found at SP 3320 with the associated Hedberg Line point at about SP 1090. There is no sediment at this potential Hedberg Line point so an extension to CS is not possible. A second less likely FoS pick is found further up the riselslope at about SP 3740, which defines a Hedberg arc point at SP 1525. Sediment thickness here, too, is unable to provide justification for an extended CS claim.
Line 202109 - south South Tasman Rise and abyssal plain transect (Fig. 2i)
Source: 3000 in3 sleeve guns Streamer: 3000 m, 240 channels Record: 16 seconds, 4 ms sample Orientation: southeast
Objective: Line STR-I was designed to determine a FoS pick for a stretch of the southeastern comer of the STR, as well as obtain a deep seismic transect part way out onto the abyssal plain. The gravity image indicated minor sediment coverage towards the inferred Hedberg Line point, which is at the proposed EOL. If this were to be supported by seismic along line then, it was decided, recording would be stopped short of the EOL.
Actual configuration: Line STR-I was shot in two parts: the first as 20210901 from the tie-point with STR-H out to a point towards the proposed EOL and as 20210902 from the proposed SOL to a full-fold overlap where 20210901 began. In effect, this was achieved by shooting 20210902 after the completion of line STR-J at its northern end.
Sediment: There is no uniform sediment coverage across the line, but is concentrated in several minor depocentres. The northern half of the section is characterised by the high plateau of the STR, where a thin veneer of flat-lying section is extensive over what appears to be deeper basinal sediments (SPs 1400-2000, Fig. 2(i)). Small seamounts have developed at the southern edge of the plateau and mask identification of underlying sedimentary section. At the base of the slope a small, partly folded section of sediments has formed (SPs 3300-3500, Fig. 2(i)). Further to the southeast, out on the abyssal plain, sedimentary cover is present over uplifted basement. Here, two moderately-sized basins have developed; the deeper with about 1200 ms TWT of sediment at the foot of the STR riselslope. Within the abyssal section reflectors are generally continuous and parallel to sub-parallel, though deformed in places as a result of basement-controlled faulting.
Basement: Basement is clearly identified across the line where it is overlain by sediment. It is heavily faulted and uplifted below the abyssal section, which indicates a period of extension and is associated with fault reactivation.
13 Australian Geological Survey Organisation

Initial UNCLOS parameters: The 2500 m isobath was intersected at approximately SP 2760. Further down the STR slope two FoS picks are possible: one more proximal to the STR at about SP 3270 and another more distal at about SP 3600. The line was ended before the associated Hedberg point determinations, as a gradually thinning sediment cover over rugged and faulted basement into the abyssal region indicated that the sedlment thickness criteria would not be met.
Line 20310 - south South Tasman Rise and abyssal plain transect (Fig. 2j)
Source: 3000 in3 sleeve guns Streamer: 3000 m, 240 channels Record: 16 seconds, 4 ms sample Orientation: north-northeast
Objective: Line STR-J was designed to determine a FoS pick and obtain a deep seismic transect across the abyssal regions to the south of the STR. The satellite gravity image suggested that sediment cover would be marginal and concentrated in small elongate basins. Nevertheless, the line SOL was proposed a short distance beyond the expected Hedberg Line position.
Actual configuration: Line STR-J was shot as 20211001 with an SOL and EOL as proposed.
Sediment: Three small basins are found in the abyssal plain. The largest basin lies at the base of the STR slope and contains up to 1200 ms TWT of sediment (SPs 2700- 3300, Fig. 2(j)). The deeper sequence characteristics are masked by diffractions and may indicate the presence of volcanics within the sedimentary column. All three basins are separated by basement highs and are covered by a thin shallow sequence of mostly continuous reflectors. A considerably smaller basin is perched on the upper reaches of the STR slope (about SP 3800, Fig. 2(j)). The plateau itself is characterised by planated basement with small seamounts at the edge of the slope.
Basement: Basement is identified as a series of diffractions at the base of the sedimentary sections in the abyssal regions. It is the seafloor on the STR.
Initial UNCLOS parameters: The 2500 m isobath was intersected at about SP 3900. Two FoS picks can be identified at about SP 3210 and SP 3560. The latter pick defines an associated Hedberg Line point at about SP 1340, where there is approximately 400 ms TWT of sediment. This indicates that an extension beyond this potential Hedberg Line point for CS is unlikely. The former FoS pick positions the Hedberg arc at the SOL, where there is little evidence of sediment.
Line 2 0 U l l - eastern slope South Tasman Rise transect and seismic tie (Fig. 2k)
Source: 3000 in3 sleeve guns Streamer: 3000 m, 240 channels Record: 16 seconds, 4 ms sample Orientation: southeast
14 Australian Geological Survey Organisation

Objective: Line STR-L was designed as a seismic tie line for the western ends of those LOS lines proposed over the eastern margin of the STR.
Actual configuration: To tie into a modified line STR-M (see below) to the north line STR-L was extended by some 65 km. It began in the south at the proposed SOL and ran northwestwards to end at about 46' 14.43' S, 148' 24.75' E. The minor dogleg was traversed without looping.
Sediment: As an extensive traverse of the eastern slope of the STR this line is characterised by areas of uniform sediment cover, several small basins and seamount developments. The southern third of the line is dominated by sediment of 600 - 1000 ms TWT thickness made up mostly of strong and parallel reflectors. Parts of this section are masked by volcanics. The middle third is dominated by three seamounts separated by two minor basins of sedimentary section. The more northerly basin is characterised by strong, parallel to sub-parallel reflections and attains a maximum thickness of 1000 ms TWT (SPs 5600-6000, Fig. 2(k)). The northern third of the line has a thicker sedimentary cover of between 1200 - 1800 ms TWT. The reflectors here are strongly continuous and parallel, but masked in places by the effects of volcanic extrusives/intrusives.
Basement: Basement is generally obscured by diffractions across much of the line. Where apparent under a sedimentary cover it is often diffractive and highly rugged, which probably suggests the piling up of volcanic extrusives. In other places, it is characterised by a strong and continuous reflector indicating a boundary with probable crystalline basement. Draping of lower sequence sediments over basement mounding in the northern part of the line suggests syndepositional basement movements. This may be related to the early rifting phase of the L7Atalante Depression feature. Deep intrabasement reflectors may represent shallower features out of the plane of the section.
Initial UNCLOS parameters: As this line was not designed to determine FoS positions none are provided. Several major slope changes exist, though, but are of little use in delineating Hedberg arcs, as they are all inner to those found on the margin dip lines.
Line 202112 - South Tasman Rise and East Tasman Plateau transect (Fig. 21)
Source: 3000 in3 sleeve guns Streamer: 3000 m, 240 channels Record: 16 seconds, 2ms and 4 ms sample Orientation: northeast
Objective: Way points for line STR-M were modified during the cruise. The SOL was altered to commence on oceanic crust at the base of the western margin of the STR and run firstly east-northeast and then more northeast as a means of traversing both the STR and ETP, and intervening L' Atalante Depression. This configuration was meant to obtain a good deep-seismic transect across these large-scale morphological features. The original objective of obtaining a FoS pick for the northeastern margin of the ETP was retained.
15 Australian Geological Survey Organisation

Actual configuration: The line began at the modified SOL and ended in the northeast at about 43' 9.8' S, 151' 45.48' E. This actual EOL represents an 80 km extension to that originally proposed, and was warranted by the presence of substantial amounts of sediment -on the abyssal plain to the northeast of the ETP.
Sediment: Line STR-M is an extensive transect of the STR, ETP and intervening L' Atalante Depression. It is characterised by widespread sediment coverage with deeper basinal sediments on the STR. The western third of the line bisects the STR at right angles to its general north-northwesterly strike. Several basins are developed here with the largest containing up to 2.0 sec TWT of sediment infill against a faulted basement block (SPs 4000-5000, Fig. 2(1)). This large block represents the central axis of the STR and its thin cover of sediment indicates the effects of large-scale peneplanation by ocean currents. Reflectors here are mostly continuous and parallel. To the east the line descends down the eastern margin of the STR out across the L' Atalante Depression and up onto the ETP. Apart from a large seamount positioned midway across the depression much of this broad morphological feature is filled in by up to 1500 ms TWT of sediment. Deeper parts of the sedimentary section to the seamount's west indicate the presence of volcanics (SPs 7500-8500, Fig. 2(1)). That to the east of the seamount is disturbed in places by small-scale seamount intrusions. The reflectors across the depression are continuous and parallel. The remaining eastern third of the line rises over the ETP and extends for some 60 km beyond its eastern margin FoS into the abyssal plain regions of the Tasman Basin. The plateau itself is covered by an average of 1200 ms TWT of sediment, except where interrupted both by a southeasterly spur of the Cascade Seamount (about SP 13400, Fig. 2(1)) and a basement-block high forming the eastern margin of the ETP. Sediment out beyond this margin into the abyssal regions averages 1200 ms TWT in thickness and is made up predominantly of continuous and flat-lying reflectors.
Basement: Basement is well defined over most of the line excepting for part of the L' Atalante Depression where widespread dffractive events, probably associated with volcanics, mask its presence. Furthermore, the appearance here of faulted and partly rotated basement blocks indicates an early extensional phase.
Initial UNCLOSparameters: A FoS pick for the western side of the STR was made at about SP 1950, while that for the eastern side of the ETP was found at about SP 15250. The 2500 m isobath for both the western and eastern side of the STR was intersected at about SPs 3325 and 7060, respectively. It was not crossed for the ETP.
Line 202113 - East Tasman Plateau transect (Fig. 2m)
Source: 3000 in3 sleeve guns Streamer: 3000 m, 240 channels Record: 16 seconds, 4 ms sample Orientation: southwest
Objective: Line STR-A was designed as a low priority LOS line to establish a FoS pick for the northeastern margin of the ETP and obtain some deep seismiccoverage across its sedimentary cover through to the proposed ODP site ETP02A. The ODP site forms the tie with line STR-C. The orientation of the line across the margin also
16 Australian Geological Survey Organisation

included the traverse of a large seamount at the base of the slopelrise. From its position and form argument may be made as to its attachment to the plateau and so potentially define a more distal FoS pick.
Actual configuration: The actual line configuration matches that proposed except for a shortening by 20 km at its northeastern end. This was done to recover some lost survey time given the encroaching deadline for arrival in Hobart.
Sediment: The line traverses abyssal plain sediment to the northeast, both rise and slope sediment in the middle portion and sediment infill on the ETP to the southwest. The cover is continuous across the section excepting for a large seamount to the northeast (SPs 1700-2100, Fig. 2(m)) and a high basement arch at the plateau's edge. To the northeast of this seamount the cover is up to 1400 ms TWT in thickness and is characterised by parallel reflectors that are interrupted by diffractive events. These most likely indicate volcanic extrusives. Up the ETP rise and slope the reflectors are both continuous and parallel. Sediment cover here averages 800 ms TWT in thickness. On the plateau itself sediment averages 1200 ms TWT in thickness and is made up of continuous and mostly parallel reflectors. Basement mounding, which appears to be the result of small buried seamount formations, has produced slight deformation in the overlying section.
Basement: The basement reflective event is clearly discernible across much of the line. It is generally a strong diffractive event, but absent in those parts where volcanics in the sedimentary column mask its characteristics.
Initial UNCLOS parameters: A potential FoS pick at the northeastern end of the seamount was found at about SP 1550, while a second pick is possible, more proximal to the ETP, at about SP 2510. The 2500 m isobath that encircles the crown of the seamount was intersected at SPs 1800 and 2020. It was not crossed on the ETP.
Cruise Narrative
The following is a brief overview of both weather and equipment conditions for the survey. Where given UTC means Universal Time Constant. More detailed information may be gleaned from the seismic and navigation line logs as well as the respective cruise Electronic, Quality Control and Parameter reports. Concise daily weather details, as noted by the ship's bridge, are to be found in Appendix 8. Sonobuoy deployment details and preliminary Law of the Sea parameters can be found in appendices 6 and 7, respectively.
January 13 Left Macquarie wharf, Hobart, 6.00 pm local time. Conditions heading out of Hobart are very calm.
January 14 Cable deployment began at UTC 013: 1500 (2.00 am local). Deployment completed at 7.10 am with tow leader set at 71 metres. Running into line lost power to the cable for about 5 minutes (GFI). Began line 20210101 (ie. STR-C) at UTC 014:0103 but
17 Australian Geological Survey Organisation

stopped recording after 50 shots because of GFI causing loss of power to the cable. Cable is being retrieved to determine GFI cause and to re-right the tailbuoy.
January 15 Sea conditions worsened during the night to force 9-10 and we are awaiting better states to recommence shooting line STR-C. Cable is in water and have lost power to it again indicating continued presence of GFI problem. Tailbuoy has gone over again! Not a good start to the survey. Cable partly retrieved and two bad sections changed out - one with large fish bites. Line 20210101 started at UTC 015: 1121 (ie. about 10.00 pm) with both gun arrays and the tailbuoy upside down again - will attempt re-righting at next cable repair or retrieval opportunity.
January 16 Shooting on 20210101 continues in low swell and slightly choppy seas. Two sonobuoys launched over proposed ODP site, but both failed - need to conserve those that remain for the remainder of the cruise, so no more were attempted. Magnetometer controller repaired and head placed in water at UTC 016.0200 though data is very noisy. Line was broken at about the mid-point for preventative gun maintenance - recommenced as 20210 102.
January 17 Continuing down 20210102 in moderate seas with slight swell. Apart from swell noise and high feather angles (about 170) the seismic monitors indicate that the data is of good quality. 20210102 was completed in calm-moderate seas at 7.00 pm local time. Making way to eastern end of STR-D. STR-D's eastern end has been shortened by about 35 km from that proposed in order to make up for some lost time on STR-C. This end lies over predominantly oceanic crust as indicated by the gravity image and subsequently supported by the monitors.
January 18 Weather deteriorating during the night as a low pressure system makes its way across southern Tasmanian waters. The beginning of STR-D was abandoned as it worsened further to about force 9-10. Though noise levels were moderate with the cable set at 12 m, it was decided to hold off the commencement of the line because of concerns by the bridge as to possible worsening conditions and given pitch requirements with both cable and guns in water and heading into the swell. While hove-to GFI faults indicate another possible fish-bite. Weather continues to be bad during day with gusts up to 60 knots. Await improvements though synoptic chart indicates 2 approaching fronts in succession once this low pressure system moves to the south-east.
January 19 Cable retrieval began at 5.30 am in calm seas with moderate swell. Line 20210201 (ie. STR-D) began at UTC 019.0552.
January 20 Line 20210201 continuing in light seas with a moderate swell. The gun mechanics have requested a 24-hour turn-around-time for gun maintenance. This equates to about 220 km of recordng without a line break. I was reluctant to do this as the line is 350 km long and I wanted to make use of the good shooting conditions whilst they lasted.
18 Australian Geological Survey Organisation

As a compromise, therefore, at about 80 km into the line I allowed the alternate bringing in of each array for maintenance. This meant that we were down to one array for about 3 hours of the line, but was not considered significant as the gravity image indicated,.and seismic monitors supported, thin sediment cover over oceanic basement. In cases of thick sediment cover I would prefer breaking the line to loop so as to maintain full penetration potential. The magnetometer was retrieved about midday. Its performance has been less than satisfactory so far despite constant attention by the electronic technicians.
January 21 Line 20210201 ended at UTC 20.1901 in calm seas. Transiting to eastern end of STR- F. Line 20210301 commenced at UTC 21.0928 in calm-moderate seas with cable set to 12 m. 5 km short of SOL 2 guns on starboard array failed. To get them repaired and avoid looping it was decided to commence the line with one gun string as the gravity image indicated thin sediment cover. The array was redeployed about 1 hour later meaning that the first 3 km of the line was recorded with one string.
January 22 Continuing 20210301 (ie. STR-F) in moderate seas with winds picking up around midday as a front approaches. The line was ended at UTC 22.0027 midway at a 26' dogleg to loop and allow for gun maintenance. The magnetometer was brought in early on as its data was very noisy - the saga continues. The electronic technicians will attempt to fit a spare head and monitor its performance. Recommenced STR-F as 20210302 at UTC 22.0446 in moderately rough seas. The cable was set to 14 m depth to lessen noise levels. Although cable noise is moderate and it is worth continuing to acquire data, conditions are making it difficult for the Bridge to keep the line within a conservative CCE (ie. +I- 20 m).
January 23 Continuing 20210302 in moderately rough seas with gusts up to 50 knots. The cable appears to be well behaved at 14 m and shows moderate amounts of noise with peaks in the high 30s microbar range. Due to sausage buoy problems one gun array had to be brought in and so part of the line (ie. about 2 hours) was shot with one string. Sediment cover was not great and so a loop was not thought necessary. 20210302 was completed at UTC 22.0446 some 20 km beyond the originally supplied EOL. 10 km of this was due to a recomputed potential Hedberg Line. The remaining 10 km extension was performed to test and capture terrain where sediment thickness appeared to warrant it. The magnetometer continues to fail to provide a good signal. The tailbuoy has commenced to communicate its position intermittently. Started STR-K as 20210401 at UTC 23.0840 with cable set to 12 m.
January 24 Continuing 20210401 in excellent conditions. Sonobuoy launched at UTC 023.2103 and worked. Ended 20210401 at dogleg at UTC 024.0448 to allow for gun maintenance - STR-K continued as 20210402 at UTC 24.0838.
January 25 Ended 20210402 at UTC 024.2250 in excellent sea states. Two sonobuoys launched in early morning - the second transmitting for a good period. Began STR-R as 20210501
19 Australian Geological Survey Organisation

at UTC 025.0743. This line and STR-S are designed to cross over a proposed ODP drill site. Cable set to 10 m for these two lines, sample rate maintained at 4 ms. 20210501 ended at UTC 025.1 140.
January 26 Began 20210601 (STR-S) at UTC 025.1558. Successful recording of sonobuoy for most of the line. Line ended at UTC 025.1921 and transit began to western end of STR-G. Began STR-G as 20210701 at UTC 026.0500 9 krn before the designated SOL. Seas are quite calm but there is a general 2 m swell. The cable was left at 10 m depth as the noise monitors indicate low levels.
January 27 Finished 20210701 at UTC 027.0120 in calm seas again. Although there is always a constant swell of between 2 - 4 m the general conditions are extraordinarily good for these latitudes. After surfacing cable to replace bird 6 by boat we will transit down to eastern end of STR-H.
January 28 Began STR-H as 20210801 at UTC 027.1709. Cable set at 12 m, seas calm with 15-20 knot winds. Magnetometer with 'New Zealand' head has finally gone into the water at UTC 028.0605 and is producing a good signal.
January 29 Completed STR-H at UTC 028.1630. Began STR-I as 20210901 at an approximate SOL of 80 krn at UTC 028.2110. The line will most likely be finished early as sediment thickness is not expected to warrant progress of the line to the Hedberg point. Ended STR-I at UTC 029.0743 at an EOL of about 50 krn. This was completed early as sediment thickness was not uniform across the section and the gravity image indicated no substantial sedlment cover out to the Hedberg Line and beyond. The cable was retrieved at UTC 029.1100 and we began the long transit to the southern end of STR-J.
January 30 Began STR-J as 20211001 at UTC 030.0333 in moderately rough seas. Although conditions are rough most of the swell is side-on meaning that at 12 m the cable is registering relatively low levels of noise.
January 31 Ended 20211001 at UTC 031.0135. Day began in moderately rough seas that abated later in the morning. Recommenced STR-I from northern end as 20210902 at UTC 031.0649. Conditions are moderate with cable set at 12m.
February 1 Completed 20210902 at UTC 03 1.1526. Commenced STR-L as 20211 101 at UTC 031.2300 in moderate seas with cable set at 12m. Noise levels reasonable at less than 10 mbars averaged (ie. 8 Hz low-pass filtered).
20 Australian Geological Survey Organisation

February 2 Continuing on 20211 101 and then looped for preventive gun maintenance at UTC 032.1950 before recommencing line at UTC 032.2330 as 20211 102. Conditions are beginning. to worsen by about midday as winds reach 30-40 knots.
February 3 Line 20211 102 abandoned at UTC 033.1356 due to worsening sea state (gusts of 55 knots and high seas). Most of day spent hove-to and looping back to try recommencing line as conditions abated by midday. Line was restarted as 20211 103 at UTC 034.0641 in moderately rough seas. Seas have begun to worsen towards midnight with wind gusts beyond 40 knots. Noise levels are up into the 20 mbar range (ie. filtered at 8 Hz).
February 4 Line 20211 103 abandoned at UTC 034.1458 due to bad sea state - wind gusts up to 50 knts and cable at 14 m being affected by swell. As we were ready to re-shoot the line as 20211 104 around midday the cable developed an electrical fault by which it failed to communicate. Cable retrieval and fault-finding was implemented. 20211 104 was designed to reshoot about the last 20 km of 20211 103 where noise levels were moderately high. Two sections of cable were replaced and the whole was redeployed by midnight.
February 5 Line 20211 104 was begun at UTC 035.1648 at about an EOL (ie. with the new extension) of approximately 65 km. 20211 104, and so STR-L, was finally completed at UTC 035.2253. Bird 9 had a frozen wing angle of -15' so at the end of the line the cable was retrieved to replace it. This would normally be performed by changing the bird in the water, assisted by boat, but the moderate-swell sea state precluded this. Unfortunately, once the cable was back in the water and we began transiting south to complete the western half of STR-D, channels 41 to 48 ceased transmitting back any data. This meant that the cable had to be retrieved to active 6, and that section swapped out.
February 6 The western half of STR-D was begun as 20210202 at UTC 036.1326. Early in the line the cable suffered from frame parity errors and had to be repowered. This meant that 12 shots were lost. I was willing to accept this and will mean that one CDP gather will have 30 -12 = 18 fold with those 'before' being less degraded. Therefore, a loop was not enforced and we continued. However, at UTC 036.2013 the line had to be abandoned as our primary navigation had dropped out from DGPS for nearly 112 hour. A loop was implemented to wait till it came back (apparently due to a problem at the uplink base at Perth). The system was back up within 1 hour and so the line was recommenced at UTC 036.2359 as line 20210203. The cable was initially set at 12 my but a prevailing swell saw the cable holding depth better at 14 m. The opportunity was taken during this loop to service the guns meaning that we may run to EOL without a maintenance loop. A large quantity of "frame-parity errors" are appearing during recording. These number about 10% of all shots and are not evenly spaced. These generally have tc! be edited out so that many CDP gathers will not have the full fold complement of 30 channels to stack. The system QC officer believes the problem to
2 1 Australian Geological Survey Organisation

be in the cable and would require another retrieval effort of several hours down time. The amount of errors are within specification and so it was decided to continue on till the EOL when cable work would be undertaken. I was reluctant to fix the problem along line because of the lost time involved given that a low-pressure system is heading our way and may make finishing the line without major delays a real probability. Nevertheless, if the line has to be stopped short of the EOL we will loop and take the opportunity to trace the intermittent fault by cable retrieval (ie. probably bad section/connection).
February 7 Frame-parity errors appeared less frequently during the early part of today as we continued along 20210203. The weather is worsening gradually with the onset of a low pressure system, but the cable is still maintaining depth with low-moderate levels of noise. The cable developed serious frame-parity problems at UTC 037.0600 necessitating a repowering of it. This happened at about 12 km from the original EOL and resulted in the loss of too much seismic-fold. 1 decided to forego a reshoot and 1 therefore acquisition for the rest of the line was abandoned. Much of the last 50 krn of the line was over hard-bottom oceanic crust with no sign of sediment. Cutting the line short enabled an earlier retrieval of the cable and t rachg down of the parity problem before the onset of the front associated with the low mentioned above. The replacement of sections 13 and 14 did not solve the problem. Changing tow-leaders by attaching the cable to the port reel resulted in the problem being fixed. Once this had been done we commenced the transit to STR-M.
February 8 Line STR-M was begun as 20211201 at UTC 038.1626 with the cable set at 12 m. Conditions are good for recording. Sea state began to pick up at about UTC 039.0600 with consequent increases in noise levels. The cable was dropped to 14 m as a result.
February 9 Sea state worsened on 20211201 to the point that at about UTC 039.1541 it became no longer possible to control cable depth. For this reason the line was terminated and a loop begun to await improved conditions. The weather appeared to improve in the afternoon so two attempts were made to come back on line and recommence shooting. Unfortunately, a very persistent swell from the west was effecting the cable depth at 15 m with consequent high noise levels. Therefore, the line was not commenced.
February 10 A third attempt was made in the morning. The cable was set at 17 m. Although this degrades the high frequency content of the signal it was thought best to restart the line and live with the moderately high noise levels. The fact that much of the sea bottom is hard volcanic terrain with only a thin sliver of sediment cover swayed my decision towards continuing to record the line. The line then was recommenced as 20211202 at UTC 040.1900. Due to a major GFI the line was stopped at UTC 041.0304. Retrieval of the cable then began. Section 17 with a fish bite was replaced. STR-M was again recommenced at UTC 041.1032 as 20211203. The swell had abated remarkably over the period of cable work so the line began with the cable set at 14 m.
22 Australian Geological Survey Organisation

February 11 Continued recording 20211203 in calm seas. The cable was set to 12 m in the morning. The line was stopped at UTC 042.1030 due to a cable GFI. These GFIs are a real hindrance to maintaining production levels and appear to be due to fishbites. Perhaps there has been some recent fishing in the area that has attracted a great number of sharks and tuna.
February 12 Further GFI problems with the cable developed in the early morning. STR-M was once again restarted, this time as 20211204 at UTC 043.0253. Unfortunately, another GFI developed in the afternoon and we were unable to power up the cable. Recording was then stopped at UTC 043.0424 and a loop implemented to retrieve the cable and commence fault-finding. GFI's, fish and swell have been an enormous problem on line STR-M and have greatly impeded our progress to date. The earlier forecasts of being well ahead of schedule are now clearly in jeopardy. Eventually, the cable fault was traced to a bad stretch section at the front.
February 13 STR-M was once again recommenced as 20211205 at UTC 043.1517. Moderate swell saw the cable being deployed at a depth of 14 m. Increasing swell later in the morning forced me to set the cable to 16 m depth. This could not fix the front third of the cable which was riding high and contributing large noise values. An attempt was made to increase the tow leader length whilst recording, but this failed in that it brought the cable to the surface. Therefore, the line was abandoned at UTC 044.0005 and a loop implemented. The line was recommenced as 20211206 at UTC 044.0640. The cable was set to 16 m depth and appears to keep depth much better with the additional tow leader let out. It is general practice not to allow the cable to run at this depth because of the consequent degradation of high frequency signal - around 100 Hz in this case. The great water depths, however, make it unlikely that any valuable signal at this level of frequency would be present. Continuing high swell conditions and another approaching front make it impractical to wait around to continue shooting at a more opportune occasion. The data will suffice for Law of the Sea purposes.
February 14 Finally completed STR-M on UTC 045.01 11 after extending the line by 80 km beyond the original EOL proposal. The FoS was sampled at the Plateau's northeastern margin and continued along line to acquire a seismic traverse over a moderately thick sedimentary section from its base out into the abyssal regions. Line STR-A was commenced as 20211301 at UTC 045.1132 with both arrays. Cable depth was set to 16 m as the southwestern aspect of the line meant we were recording directly into the prevailing swell of up to 4 m. Noise levels continued to be moderately high even though the cable was maintaining depth better into the swell. This is most probably due to cable jerking as the vessel pitches up and down.
February 15 Line 20211301 had to be cut short at UTC 045.1 132 due to multiple cable GFIs. A loop was begun to begin part retrieval and start fault-finding. Section 28 had to be replaced because of a fish bite. The cable was redeployed and the line recommenced
23 Australian Geological Survey Organisation

as 20211302 at UTC 046.1256. A large swell necessitated leaving the cable at 16 m depth.
February 16 20211302 continued in moderating conditions - noise levels got below 10 mbars for the first time in about a week. Unfortunately, at UTC 046.1256 the cable suffered more intermittent GFIs and the line was stopped. The port tow leader was suspect and various combinations of tests showed it to be okay. This means that the problem is in the water and so cable retrieval was begun. Another fish bite?!!! A few hours of bad weather postponed cable retrieval till the evening. Section 10 had suffered a fish bite and was replaced with the one remaining spare 12.5 m active.
--
February 17 Line STR-A was recommenced as 20211303 at UTC 047.1338. At UTC 047.1453 the line had to be stopped because a series of frame-parity errors meant that seismic fold was lost. A loop was commenced and tests indicated that a stretch was at fault. This was replaced and the line recommenced at UTC 047.1930 as 20211304. Some 20 kms remain for the line to be finished and time is running out as we should be steaming for Hobart by midday. Fortunately, the line was completed without further problems. The cable was retrieved and the transit for Hobart began at UTC 048.0138.
February 18 Arrived Macquarie wharf in Hobart at 8.00 am local time.
Conclusion
AGSO Survey 202 successfully completed its intended LOS and proposed ODP site-survey objectives. In addition, one of the lines was extended to provide a major
I deep-seismic traverse of the South Tasman Rise, L' Atalante Depression and East Tasman Plateau crustal features. There is a possibility that Australia may be able to enhance its claim to 'legal' Continental Shelf over the Tasman Basin, to the east of the South Tasman Rise, using the sediment thickness approach.
Acknowledgments
I would like to thank, on behalf of the Law of the Sea project, Bob Hardinge and his AMSA crew for all aspects of ship operations, as well as the AGSO scientific staff for their professionalism in obtaining results beyond those required for the proposed survey effort.
References
Bernardel, G., 1997. Digital Terrain Model for the Tasmanian Region: a pilot study into combining disparate datasets. Australian Geological Survey Organisation, Record 199716 1.
24 Australian Geological Survey Organisation

Exon, N.F., Berry, R.F., Crawford, A.J. and Hill, P.J., 1997a. Geological Evolution of . the East Tasman Plateau, a continental fragment southeast of Tasmania. Australian
Journal of Earth Sciences, 44, p. 597-608.
Exon, N.F. and Crawford, A.J., 1997b. West Tasmanian margin and offshore plateaus: geology, tectonic and climatic history, and resource potential. Australian Journal of Earth Sciences, 44, p. 540-542.
Exon, N.F., Kennett, J.P., Howard, W.R., Hill, P.J., Sikes, E.L., Royer, J.-Y., Shafik, S., and Chaproniere, G.C.H., 1997c. The "Southern Gateway" between Australia and Antarctica: a proposal for ODP paleoclimatic and paleoceanographic drilling. ODP Proposal 485. Full 3. (Unpublished)
Exon, N.F., Moore, A.M.G. and Hill, P.J., 1997d. Geological framework of the South Tasman Rise, south of Tasmania, and its sedimentary basins. Australian Journal of Earth Sciences, 44, p. 561-577.
Hill, P.J., Exon, N.F. and Royer, J-Y., 1995. Swath-mapping the Australian continental margin: results from offshore Tasmania Exploration Geophysics, 25, p. 403-41 1.
Ramsay, D.C., Herzer, R.H. and Barnes, P.M., 1997. Continental Shelf Definition in the Lord Howe Rise and Norfolk Ridge Regions: Law of the Sea Survey 177, Part 1 - Preliminary Results. Australian Geological Survey Organisation, Record 1997154.
Royer, J-Y. and Rollet, N., 1997. Plate-tectonic setting of the Tasmanian region. Australian Journal of Earth Sciences, 44, p. 543-560.
Sandwell, D.T. and Smith, W.H.F., 1997. Marine gravity anomaly from Geosat and ERS 1 satellite altimetry. Journal of Geophysical Research, Vol. 102, No. B5, p. 10039-10054.
Syrnonds, P.A. and Willcox, J.B., 1989. Australia's petroleum potential in areas beyond an Exclusive Economic Zone. BMR Journal 11 No. 1, p. 11-36.
Willcox, J.B., 1989. South Tasman Rise. Bureau of Mineral Resources, Record 1989113.
25 Australian Geological Survey Organisation

Appendices
Appendix 1
1982 United Nations Convention on the Law of the Sea (UNCLOS)
Article 76 : Definition of the continental shelf
1. The continental shelf of a coastal State comprises the seabed and subsoil of the submarine areas that extend beyond its territorial sea throughout the natural prolongation of its land territory to the outer edge of the continental margin, or to a distance of 200 nautical miles from the baselines from which the breadth of the territorial sea is measured where the outer edge of the continental margin does not extend up to that distance.
2. The continental shelf of a coastal State shall not extend beyond the limits provided for in paragraphs 4 to 6.
3. The continental margin comprises the submerged prolongation of the land mass of the coastal State, and consists of the seabed and subsoil of the shelf, the slope and the rise. It does not include.the deep ocean floor with its oceanic ridges or the subsoil thereof.
4. (a) For the purposes of this Convention, the coastal State shall establish the outer edge of the continental margin wherever the margin extends beyond 200 nautical miles from the baselines from which the breadth of the territorial sea is measured, by either:
(i) a line delineated in accordance with paragraph 7 by reference to the outermost fixed points at each of which the thickness of sedmentary rocks is at least 1 per cent of the shortest distance from such point to the foot of the continental slope; or
(ii) a line delineated in accordance with paragraph 7 by reference to fixed points not more than 60 nautical miles from the foot of the continental slope.
(b) In the absence of evidence to the contrary, the foot of the continental slope shall be determined as the point of maximum change in the gradient at its base.
5. The fixed points comprising the line of the outer limits of the continental shelf on the seabed, drawn in accordance with paragraph 4 (a) (I) and (ii), either shall not exceed 350 nautical miles from the baselines from which the breadth of the territorial sea is measured or shall not exceed 100 nautical miles from the 2,500 metre isobath, which is a line connecting the depths of 2,500 metres.
26 Australian Geological Survey Organisation

6. Notwithstanding the provisions of paragraph 5, on submarine ridges, the outer limit of the continental shelf shall not exceed 350 nautical miles from the baselines from
. which the breadth of the territorial sea is measured. This paragraph does not apply to submarine elevations that are natural components of the continental margin, such as its plateaux, rises, caps, banks and spurs.
7. The coastal State shall delineate the outer limits of its continental shelf, where that shelf extends beyond 200 nautical miles from the baselines from which the breadth of the territorial sea is measured, by straight lines not exceeding 60 nautical miles in length, connecting fixed points, defined by coordinates of latitude and longitude.
8. Information on the limits of the continental shelf beyond 200 nautical miles from the baselines from which the breadth of the temtorial sea is measured shall be submitted by the coastal State to the Commission on the Limits of the Continental Shelf set up under Annex II on the basis of equitable geographical representation. The Commission shall make recommendations to coastal States on matters related to the establishment of the outer limits of their continental shelf. the limits of the shelf established by a coastal State on the basis of these recommendations shall be final and binding.
9. The coastal State shall deposit with the Secretary-General of the United Nations charts and relevant information, including geodetic data, permanently describing the outer limits of its continental shelf. The Secretary-General shall give due publicity thereto.
10. The provisions of this article are without prejudice to the question of delimitation of the continental shelf between States with opposite or adjacent coasts.
27 Australian Geological Survey Organisation

Appendix 2
Informal Terms relating to Article 76
Application of Article 76 of United Nations Convention on the Law of the Sea (UNCLOS) raises several concepts and terms which will be referred to frequently in interpretations of seismic/bathymetric survey lines for the purposes of legal' Continental Shelf (CS) definition. Following are simplified definitions of the more important terms that we commonly use. Some aspects of the application of Article 76 remain unclear, and will only be resolved following further deliberation by the Commission on the Limits of the Continental Shelf. ,
Firstly, a Hedberg arc may be drawn, with a radius of 60 n miles, from an interpreted foot-of-slope (FoS) position. The location at which this arc intersects the seaward extension of the survey line is called the Hedberg point. With a series of FoS positions established around a continental margin, at a spacing of less than 120 n miles, a series of intersecting Hedberg arcs may then be constructed. Clearly, as the spacing between survey lines (and therefore, the FoS positions) decreases, the envelope of the intersecting Hedberg arcs approaches a 60 n mile buffered locus of the FoS, except in some cases where the latter contains embayments. This is part of the reason for AGSO's 'safe minimum' approach, where we aim to space survey lines -30 n mile apart, where logistically possible. The final outcome, the true Hedberg Line (the informal name for the line that defines the outer edge of the 'legal' continental margin, as contained in Article 76, paragraph 4(a)(ii), of UNCLOS), is constructed by joining selected points on the Hedberg arcs by'straight lines, not more than 60 n mile long. This would normally be done in a manner so as to maximise the size of the enclosed 'legal' continental margin. This true Hedberg Line will normally only intersect the survey line at the Hedberg point where the locus of the FoS points is a straight line. Such situations are unusual in the context of CS beyond 200 n mile, since it is normally associated with irregularly shaped marginal plateaus.
Secondly, a Sediment Thickness point may be determined, by interpretation of a seismic survey line (or possibly by dnlling), where the 1% sediment thickness criterion is satisfied. That is, the point at which the thickness of sedimentary rocks is at least 1% of the shortest distance from such point to the FoS. In contrast to the Hedberg arc, this is strictly a single point, which may be joined to adjacent Sediment Thickness points to form the Sediment Thickness Line (the informal name for the line that defines the outer edge of the 'legal' continental margin, as contained in Article 76, paragraph 4(a)(i), of UNCLOS), or to selected points on Hedberg arcs, again by straight lines, not more than 60 n mile in length.
Finally, the fixed points (not more than 60 n mile apart) comprising the line which defines the outer limits of the CS, may not lie beyond one or other of two cut-offs. The first cut-off is 350 n mile from the baseline (informally called the 350 n mile cut- of line), and the second is 100 n mile beyond the 2500 m isobath (informally called the isobath cut-ofline). The former is purely a geometrical construction from the Territorial Sea baselines, whereas the latter depends on definition of the 2500 m isobath.
28 Australian Geological Survey Organisation

Appendix 3
~ e s c r i ~ t i o n of RV Rig Seismic
The research vessel RV Rig Seismic is chartered and equipped by the Australian ~ e o l o ~ i c a l Survey Organisation (AGSO) of the Australian Commonwealth Government. Its mission is to support the primary geoscientific requirements of acquiring data for Australia's Law of the Sea claims and the Australian Ocean Temtory Mapping Program. It was constructed in Norway in 1982 and later commissioned by AGSO in 1984. The vessel is registered in Newcastle, New South Wales, and is operated for AGSO by the Australian Maritime Safety Authority (AMS A).
Gross tonnage: 1545 tonnes Length: 72.5 metres Breadth: 13.8 metres Draft: 6.0 metres
Engines: Main: Bergen KVMB- 12
2640 H.P.1825 r.p.m. Auxiliary: 3 x Caterpillar 564 H.P.1482 kVA
1 x Mercedes 78 H.P.156 kVA Shaft Generator: AVK 1000 kVA; 440 Vl60 Hz Side Thrusters: 2 forward, 1 aft; each 600 HP
Helicopter Deck: 20 metres diameter
Accommodation: 3 double-berth cabins 38 single-berth cabins
29 Australian Geological Survey Organisation

Appendix 4
Crew List
Australian Maritime Safety Authority
Master 1 st Mate 2nd Mate Chief Engineer 1st Engineer Electrician Chief IR IR IR IR Chief Cook Cook Catering Attendant Catering Attendant
Australian Geological Survey Organisation
Ship Manager Client Representative Quality Control Seismic Processor Science Technician Science Technician Science Technician Science Technician Science Technician Science Technician Electronics Technician Electronics Technician Gun Mechanic Gun Mechanic Gun Mechanic Gun Mechanic Visiting Student
Bob Hardinge Otto Weysenfeld Danny Watson Roger Thomas John Vitner Lazlo Polgardi Lee Gritt Frank Rochford Dave Kane Matt Stapleton Geoff Conley Adrian Clark Don Joyce George Lilja
Paul Lashko George Bernardel Mark Alcock Bill Plumridge John Ryan Lyndon O'Grady Stephen Ridgway Fleur Wiley Andrea Cortese Linda Philippa Steve Thomas Wojciech Wierzbicki Simon Milnes Craig Wintle Alan Radley John Keyte Ian Faichney
30 Australian Geological Survey Organisation

Appendix 5
Proposed Survey Way Points
Line Name Latitude Longitude
STR- A 42 30.000 S 152 03.733 E STR-A 43 55.028 S 149 59.363 E STR- A 43 56.293 S 149 57.552 E STR- A 43 57.600 S 149 55.700 E ODP site ETP02A STR-A 43 58.480 S 149 54.302 E STR-A 43 59.757 S 149 52.423 E
STR-C 45 14.417 S 152 39.933 E STR-C 43 57.600 S 149 55.700 E ODP site ETP02A STR-C 43 30.000 S 149 00.000 E
STR-D 46 06.343 S 153 05.543 E STR-D 46 46.778 S 148 59.315 E STR-D 48 09.567 S 144 29.600 E
STR-F 46 53.067 S 152 46.633 E STR-F 47 22.767 S 150 29.617 E STR-F 47 45.300 S 149 55.317 E STR-F 48 04.000 S 149 01.000 E
STR-G 47 30.817 S 152 47.667 E STR-G 47 47.700 S 15 1 52.708 E STR-G 48 04.583 S 150 57.750 E STR-G 48 05.950 S 150 53.833 E STR-G 48 07.317 S 150 50.1 17 E STR-G 48 08.517 S 150 46.233 E STR-G 48 10.765 S 150 38.373 E
STR-H 48 51.550 S 152 52.083 E STR-H 49 32.250 S 150 47.000 E
STR-I 50 21.250 S 152 26.600 E STR-I 49 00.967 S 149 59.183 E
STR-J 49 00.867 S 150 03.650 E STR-J 50 42.333 S 149 31.917 E
STR-K 46 46.833 S 151 53.700 E STR-K 47 01.867 S 150 37.317 E STR-K 47 33.800 S 149 03.100 E
STR-L 49 18.517 S 151 36.183 E STR-L 48 15.467 S 150 47.883 E
3 1 Australian Geological Survey Organisation

STR-L
STR-M STR-M STR-M
STR-R STR-R STR-R
STR-S STR-S STR-S
4642.417 S 14857.367 E
4345.533 S 15110.067 E 4500.000 S 14955.167 E 46 10.233 S 14800.333 E
4823.842 S 14902.663 E 4830.000 S 14906.700 E ODP site STR02A 4838.500 S 14913.000 E
4833.550 S 14855.550 E 4830.000 S 14906.700 E ODP site STR02A 4826.703 S 14917.622E
32 Australian Geological Survey Organisation
• • • • • • • • • • • • • • • • • • • • • • • • • • • • • • • • • •

Appendix 6
Sonobuoy Deployments
Note: the end shots and times refer only to the end of onboard monitor displays - data continues to be recorded by the system.
No. UTCtime Line Shot Latitude Longitude Comment
1 15.2040 STR-C 2613 43 54.542 149 49.520 never transmitted
2 15.2050 STR-C 2641 43 54.986 149 50.367 15.2059 2668 43 55.357 149 51.152 early end
3 20.0108 STR-D 4454 46 32.243 150 28.143 20.0436 5066 46 36.067 150 04.846
STR-K 3140 4651.594 15129.553 3750 46 56.142 151 06.471
STR-K 6880 47 17.786 149 50.463 6940 47 18.492 149 48.357 early end
STR-K 6962 47 18.773 149 47.552 7577 47 26.171 149 25.683 early end
STR-S 1001 48 33.732 148 54.979 1610 48 26.629 149 17.273 early end
STR-L 3724 48 13.267 150 45.241 4310 48 01.014 150 30.515
STR-D 12176 47 24.539 146 59.191 12746 47 30.869 146 36.560
STR-M 3004 47 22.929 146 01.38 1 3596 47 14.354 146 21.198
STR-M 9950 46 09.822 148 43.256 10140 46 05.522 148 47.726 early end
STR-M 10160 46 05.021 148 48.223 10930 45 48.175 149 05.684
STR-A 2740 43 09.445 15 1 06.400
33 Australian Geological Survey Organisation

3131
STR-A 5815 5898
STR-A 8066 8212 8280 8349 8397 8499
150 55.856 cable GFI
150 10.191 150 07.929 cable GFI
150 05.556 149 59.360 1' dogleg 149 57.543 149 55.707 3' dogleg 149 54.339 2' dogleg 149 51.563
34 Australian Geological Survey Organisation

Appendix 7
Preliminary Law of the Sea Parameter List
Note that the parameters given were interpreted on board, and are subject to modification following final data processing and interpretation.
Parameter definitions are: SOL - start of line; EOL - end of line; FoS - potential foot of slope; 2500 m - 2500 metre isobath; and Hedberg - potential Hedberg Line position.
Depths are in meters, sediment thickness in milliseconds of seismic two-way-time, SP is survey shot point, UTC is time in Universal Time Constant, and positions are given with reference to the WGS84 datum.
35 Australian Geological Survey Organisation
Line No.
20210101
20210201
20210301
20210302
20210401
Name
STR-C
STR-D
STR-F
STR-F
STR-K
LOS parameter
SOL 2500 m
FoS
Hedberg EOL SOL
Hedberg Hedberg
FoS FoS
2500 m EOL SOL 2500 m
FoS EOL SOL
2500 2500 2500 2500 FoS
Hedberg EOL SOL
Hedberg
Hedberg Hedberg Hedberg
EOL
Depth
3493
4311
4688 4645 4400 4700 4606 4202 3211
1249 1839
4028 3510 3447
4600? 4549 4462 4376 4489
4934 4850 4815 4467
SP
1000 3525 6580
8810 9039 1001 3470 4510 5700 6740 7015 7600 1001 2720 3450 3750 4751
4875 5242 5675 5920 6300 8520 8818 1001 1190
3130 3900 4100 4551
Sediment
2000 500 ? 0
800 1000 200 800 1200 0
1300 400
100-200 200 0 100 0 0
0 0 0 0
100? 1150 1150 1100 1200
800 300 600 1200
Latitude
43 29.994 44 08.217 44 38.573
45 11.423 45 14.863 46 10.705 46 26.157 46 32.646 46 40.015 46 46.494 46 49.41 1 4655.871 48 04.004 47 41.303 47 27.924 47 22.169 47 22.766
47 21.809 47 18.739 47 15.281 47 13.284 47 10.130 46 5 1.955 46 49.546 46 35.660 46 37.080
4651.500 4657.000 4658.759 47 02.101
Longitude
149 00.000 150 18.181 151 22.843
152 33.474 15240.894 152 39.098 15 1 05.265 150 25.723 149 40.696 149 1.063 148 50.837 14830.053 14901.003 15001.417 15021.783 150 30.514 150 29.616
150 34.086 150 48.283 151 04.260 151 13.499 151 28.107 152 5 1.746 153 02.807 152 50.240 152 43.077
151 30.029 151 0.000 15053.120 150 36.112
UTC
15.1121 16.0142 16.1850
17.0643 17.0803 19.0552 19.1952 20.0125 20.0814 20.1420 20.1551 20.1901 21.0928 21.1851 21.2250 22.0027 22.0446
22.0528 22.0744 22.1017 22.1148 22.1410 23.02 11 23.0352 23.0840 23.0947
23.2100 24.0100 24.0210 24.0448
Comments
just crossed it formed by sed wedge
against slope
from seamount FoS
base of seamount
looping on dogleg continuation of
20210301 after dogleg towards seamount
down off seamount towards seamount down seamount outer seamount
based on outer seamount of STR-F
based on FoS 1 based on FoS2 based on FoS3

36 Australian Geological Survey Organisation
20210402
20210501
20210601
202/0701
20210801
20210901
20211001
20210902
20211101
20211102
20211 103
20211 104
20210202
20210203
20211201
STR-K
STR-R
STR-S
STR-G
STR-H
STR-I
STR-J
STR-I
STR-L
STR-L
STR-L
STR-L
STR-D
STR-D
STR-M
SOL FoS FoS FoS 2500 EOL SOL EOL SOL EOL SOL FoS FoS
Hedberg Hedberg
EOL Hedberg?
SOL Hedberg Hedberg
FoSlEoAP FoS 2500 EOL SOL
2500 FoS
FoSlEoAP EOL SOL
Hedberg FoSlEoAP
FoS 2500 EOL SOL EOL SOL 2500 m
EOL SOL EOL SOL EOL SOL EOL SOL EOL SOL 2500 m
FoS EOL SOL FoS
2500 m EOL
4480 4086 3243 3276
1280 2050 1877 2424 1986 2684 4229 4437 4850 4774 4718 4732
4406 4389 4628 4287 3804
2138 2174
3626 4039 4367 4112 3525 4194 3609
1510 1476 2269 3107
2920 2939 3107 3 102 3166 3175 3368 1259 901 904
4274 4335 3296 4028
1284
5557 6450 7100 7280 7488 8242 1001 1753 1001 1672 1001 2040 2275 4250 4490 4762
1001 1090 1525 3320 3740 4590 5225 1001
1160 1670 1975 3062 1001 1340 3210 3560 -3900 5071 1001 2633 1001 4750 4845 5846 8240 9241 10570 11271 12378 8565 9671 10530 13320 14580 15900 1001 1950 3325 5470
1200 ?
> 600 > 200 100 0
1200 400 1200 400 200 900 ? 300? 500 300 300 300
0 0 800 500
? 100 0 0
0 0 200 400 0 400 400
? 0 0 0 0 0 0 0 0
1400? 1000 lOOO? 1000 ? 800 0 100 100 600 ? 0 0 0 0 0
1000
4701.867 47 12.431 47 20.438 47 22.687 47 25.081 47 34.176 48 21.286 48 39.491 48 33.732 48 25.906 48 12.669 48 01.073 47 58.283 47 36.237 47 33.450 47 30.471 47 30.359
48 41.956 48 43.084 48 48.132 49 09.731 49 14.745 49 25.090 49 32.620 49 28.714
49 31.770 49 40.464 49 45.591 50 04.455 50 47.619 50 38.669 4949.273 49 39.927 49 30.981 49 00.024 49 00.970 49 29.268 49 18.519 47 51.795 47 49.713 47 49..691 46 59.368 46 59.347 46 31.415 46 37.709 46 14.426 46 55.474 47 07.840 47 06.224 47 37.289 47 51.392 4805.970 4751.955 47 38.088 47 18.307 4647.329
15037.317 150 06.253 149 42.629 149 35.998 149 28.914 149 01.985 149 00.256 149 13.730 148 54.979 149 19.540 150 31.691 151 09.220 151 18.297 152 30.027 152 39.145 152 48.799 152 49.156
153 21.335 153 17.941 153 2.5 10 151 56.434 151 41.017 151 09.143 150 45.835 150 49.680
150 55.267 151 11.194 151 20.607 151 55.429 149 30.226 149 33.082 14948.663 149 5 1.554 149 54.350 150 03.929 149 59.180 150 50.696 151 36.178 150 19.440 150 16.958 150 16.933 149 17.266 149 17.242 14844.483 148 51.855 148 24.753 148 31.304 147 51.319 147 56.626 146 15.602 145 29.450 14441.443 14453.945 145 26.242 146 12.062 147 23.273
24.0838 24.1320 24.1650 24.1751 24.1855 24.2250 25.0743 25.1140 25.1558 25.1921 26.0500 26.1030 26.1150 26.2241 26.2359 27.0120 27.0123
27.1709 27.1741 27.2003 28.0544 28.0805 28.1310 28.1630 28.21 10
28.2204 29.0040 29.0212 29.0743 30.0333 30.0524 30.1525 30.1725 30.1916 31.0135 31.0649 3 1.1526 31.2300 32.1841 32.1912 33.0023 33.1440 34.0654 34.1458 35.1659 35.2253 36.1326 36.2013 36.2359 37.1536 37.2240 37.0531 38.1626 38.2120 39.0418 39.1541
.
FoS ? FoS ? FoS ?
inner to STR outer to STR
based on inner FoS based on outer FoS
based on outer seamount of STR-F
based on outer FoS based on inner FoS
outer to STR inner to STR
start is part way down proposed line
to inner FoS pick outer to STR inner to STR
seamount peak ? gun maintenance
first chargeable SP bad sea state
first chargeable SP bad sea state
first chargeable SP
loss of navigation
cable problems
bad sea state

37 Australian Geological Survey Organisation
20211202
202/1203
2W1204
20211205
20211206
2W1301
20211302
20211303
20211304
STR-M
STR-M
STR-M
STR-M
STR-M
STR-A
STR-A
STR-A
STR-A
1304 2185 2155
3581 3617 3338 3381 3054 2888 4194 4283 4491 4394
4098 3546 3669 2622 2630 2607 2616 2680
SOL EOL SOL
2500 m EOL SOL EOL SOL EOL SOL FoS EOL SOL FoS?
2500 m 2500 m FoS ? EOL SOL EOL SOL EOL SOL EOL
6365 7750 8715 9060 13400 14345 14641 15606 17206 17971 20010 21166 1001 1550 1800 2020 2510 3131 4055 5898 6841 7077 7985 8499
147 20.091 148 5.880 148 04.727 148 16.696 15000.875 149 59.825 150 06.398 15005.627 150 40.979 15035.801 151 20.713 15145.479 151 53.062 15 1 37.990 15 1 3 1.505 151 25.722 151 12.550 15055.856 15057.903 15007.929 15009.471 15003.058 15005.556 149 51.563
200 800? 200 700 1400
1500? 1500? 1500? 1000 ? 1200 400? 1000 1400 400 0 0
600 1000 1000 1300 1000 800 800 1400
40.1900 41.0304 41.1032 41.1223 42.1030 43.0253 43.0424 43.1517 44.0005 44.0640 44.1853 45.0111 45.1132 45.1440 45.1557 45.1706 45.1945 45.2308 46.1256 46.2237 47.1338 47.1453 47.1930 47.2242
46 48.721 46 28.655 4629.163 46 23.888 4454.305 44 55.335 44 48.854 4449.623 44 14.603 44 19.743 43 34.838 4309.809 42 37.380 42 47.770 42 52.217 42 56.200 43 05.231 43 16.658 43 15.525 43 49.235 43 48.175 43 52.541 43 50.837 44 00.337
cable GFI
cable GFI
cable GR
loss of cable control
base of seamount going up seamount
going down seamount
cable GFI
cable GFI
cable problems

Appendix 8
Weather Diary
Compilation of 6-hourly weather observations made by the Bridge, RV Rig Seismic. Note that blank entries indcate that no measurement was taken.
Date Time Lat Long Temperature Wind Waves Pressure (UTC) Dry Wet Sea Dir. Speed Sea Swell
(cO) (knts) (mbars) 15-Jan 0:OO 43.40 148.70 12.0 10.5 14.5 230 40 6.0 1007.8
6:OO 43.30 148.60 13.0 11.1 17.5 180 28 5.0 6.0 1016.2 12:OO 43.60 149.10 12.0 10.5 14.8 180 18 1019.8 18:OO 43.80 149.60 11.0 9.0 14.6 70 10 2.0 6.0 1020.3
16-Jan 0:OO 44.10 150.20 13.5 11.5 13.9 330 20 2.0 5.0 1019.2 6:OO 44.30 150.70 16.5 15.5 15.5 320 20 2.0 4.0 1017.7 12:OO 44.40 150.80 15.0 15.0 14.6 320 10 1017.6 18:OO 44.60 151.30 14.1 14.1 14.8 340 10 2.0 4.0 1014.3
17-Jan 0:OO 44.90 151.90 15.0 15.0 13.9 340 10 2.0 4.0 1012.3 6:OO 45.10 152.50 15.0 15.0 14.5 360 28 4.0 4.0 1006.3 12:OO 45.60 152.70 16.0 15.4 14.0 360 35 999.7 18:OO 46.00 152.70 14.1 13.1 14.3 280 25 4.0 5.0 991.7
18-Jan 0:00 46.10 152.60 18.0 16.3 14.0 280 40 6.0 5.0 991.0 6:OO 46.20 152.70 11.9 10.8 14.0 260 40 8.0 11.0 1003.4 12:OO 46.20 152.40 10.0 7.5 11.0 240 26 1013.3 18:OO 46.20 152.60 10.5 8.0 12.0 210 24 3.0 8.0 1016.5
19-Jan 0:OO 46.10 153.00 11.5 10.0 11.4 210 15 3.0 6.0 1014.4 6:OO 46.20 152.60 12.5 10.5 12.5 280 14 2.0 5.0 1018.7 12:OO 46.30 152.00 12.0 11.0 12.5 330 10 1018.2 18:OO 46.20 151.30 12.0 11.0 11.5 350 7 1.0 4.0 1015.9
20-Jan 0:OO 46.50 150.60 11.5 11.0 12.0 270 7 1.0 1.0 1017.1 6:OO 46.60 149.90 14.5 13.8 13.0 270 13 1.0 1.0 1016.9 12:OO 46.70 149.30 13.0 13.0 12.2 280 18 1017.8 18:OO 46.90 148.60 13.0 12.5 12.5 290 20 3.0 5.0 1016.8
21-Jan 0:00 47.40 148.50 13.5 13.0 14.0 270 15 3.0 4.0 1017.3 6:OO 47.90 148.70 13.8 13.5 13.6 290 20 3.0 5.0 1016.4 12:OO 48.00 149.30 12.5 12.0 12.2 310 22 1015.2 18:OO 47.60 150.00 12.0 12.0 12.8 360 24 3.0 5.0 1011.8
22-Jan 0:OO 47.40 150.40 12.6 12.4 11.5 10 30 4.0 7.0 1008.3 6:OO 47.30 150.60 13.0 13.0 11.7 350 35 5.0 1003.2 12:OO 47.20 151.20 12.0 12.0 350 40 1000.9 18:OO 47.10 151.90 12.1 12.1 12.2 320 20 3.0 6.0 996.8
23-Jan 0:00 46.90 152.60 10.6 8.6 13.0 240 25 4.0 6.0 1004.8 6:OO 46.70 153.00 10.8 9.5 13.0 210 20 4.0 5.0 1010.8 12:OO 46.70 152.50 11.5 10.0 12.2 220 10 1015.0 18:OO 46.80 151.90 12.0 10.0 12.6 340 12 1.0 4.0 1015.8
24-Jan 0:OO 46.90 151.20 13.0 11.5 12.6 350 10 1.0 3.0 1016.9 6:OO 47.00 150.60 13.2 12.0 12.4 350 14 2.0 3.0 1017.3 12:OO 47.10 150.30 12.4 12.0 12.0 350 10 1019.1
3 8 Australian Geological Survey Organisation

39 Australian Geological Survey Organ

• • 6-Feb 0:00 47.10 148.00 14.2 11.4 13.8 • 260 15 2.0 5.0 1020.0
6:00 47.30 147.30 14.0 11.5 14.0 320 18 2.0 5.0 1020.6 • 12:00 47.50 146.70 13.0 11.8 13.8 320 18 1019.9 18:00 47.70 146.70 12.6 10.5 14.0 360 20 1014.0 • 7-Feb 0:00 47.90 145.40 13.0 12.0 12.9 290 18 2.0 5.0 1008.8 • 6:00 48.10 144.70 11.5 10.1 12.7 260 15 3.0 6.0 1003.6 12:00 48.10 145.00 11.0 9.5 11.0 300 18 1003.8 • 18:00 47.80 150.00 11.4 8.9 12.5 240 20 1003.1
8-Feb 0:00 47.50 145.70 11.8 8.3 11.0 240 25 3.0 5.0 1004.6 • 6:00 47.20 146.40 11.4 9.8 14.1 260 28 4.0 4.0 1005.6 • 12:00 46.80 147.00 12.5 11.5 13.5 280 35 1006.6 18:00 46.70 147.50 12.5 12.0 13.8 270 38 1007.9 • 9-Feb 0:00 46.70 147.20 13.8 12.0 12.7 240 33 4.0 8.0 1014.3 6:00 46.80 147.20 13.4 10.8 12.4 240 24 3.0 8.0 1020.0 • 12:00 46.90 147.10 12.0 10.0 12.0 230 12 1023.7 • 18:00 46.90 147.20 11.5 11.0 12.6 320 17 1023.3
IO-FebO:OO 46.60 147.80 14.4 13.5 14.8 320 30 3.0 8.0 1022.2 • 6:00 46.50 148.30 14.8 14.5 13.3 300 17 3.0 7.0 1019.4 12:00 46.50 148.10 14.3 13.3 15.0 300 15 1019.4 • 18:00 46.10 148.80 14.3 14.0 14.8 300 14 1018.3
l1-FebO:OO 45.60 149.20 15.0 14.5 15.5 320 12 2.0 4.0 1013.1 • 6:00 45.20 149.70 15.8 15.5 15.0 340 10 1.0 4.0 1015.2 • 12:00 44.90 150.10 18.3 17.9 16.8 360 20 1013.6 18:00 45.00 150.00 17.3 17.0 16.2 350 30 1007.5 • 12-FebO:00 45.10 150.00 15.5 15.5 14.6 330 12 2.0 4.0 1004.1 6:00 44.80 150.20 16.0 16.0 15.0 250 15 2.0 6.0 1001.6 • 12:00 44.90 150.10 14.4 14.4 15.0 260 32 1003.2 • 18:00 44.60 150.30 13.6 13.6 15.2 260 33 1007.8
13-FebO:OO 44.30 150.60 12.5 14.5 15.1 260 20 4.0 8.0 1012.4 • 6:00 44.40 150.50 15.0 14.9 15.3 310 33 5.0 8.0 1009.9 12:00 44.00 150.90 16.0 15.9 15.0 320 36 1008.4 • 18:00 43.60 151.30 16.4 15.9 15.3 310 20 1009.5 • 14-FebO:00 43.30 151.70 17.0 15.6 18.5 290 15 4.0 8.0 1013.3 6:00 42.80 151.90 16.9 13.5 18.0 220 17 2.0 9.0 1015.5 • 12:00 42.60 151.90 16.5 13.5 16.2 130 12 1015.5 18:00 43.00 151.30 15.7 15.0 18.0 130 10 1.0 7.0 1010.1 • 15-FebO:00 43.30 150.90 17.1 16.4 15.0 170 25 3.0 7.0 1003.3 • 6:00 43.10 150.90 15.6 12.6 17.6 170 14 2.0 7.0 1013.1 12:00 43.20 151.00 14.5 12.0 16.0 130 12 1014.1 • 18:00 43.50 150.50 13.6 11.0 16.0 130 20 1008.3
16-FebO:00 43.80 150.10 13.1 12.6 14.5 110 20 3.0 7.0 1004.4 • 6:00 43.60 150.10 11.6 10.6 190 35 5.0 6.0 1003.5 12:00 43.70 150.20 12.0 10.0 13.0 190 35 1008.2 • 18:00 43.90 150.10 12.6 10.3 13.8 250 20 1008.4 •
• • •
40 • Australian Geological Survey Organisation
•

Figure 1. Map of LOS South Tasman Rise AGSO Survey 202 showing EEZ (stippled area), proposed seismic (solid), actual seismic (dashed) and main morphological features (Sx are sonobuoy positions - see Appendix 6).
4 1 Australian Geological Survey Organisation

1000 2000 3000 4000 5000 6000 7000
proposed ODP site E T P O P A 4 BPeP
E a s t T a s m a n P l a t e a u SOUTHEAST -*
4
5
T a s m a n B a s i n
6
'\ \ f \/ deep relleclor 7
(a) Seismic line 202101 (ie. STR-C).
42 Australian Geological Survey Organisation

1000 000 000
South Tasman Rise EAST·NORTHEAST
Tasm an Basin
(c) Seismic line 202/03 (ie. STR-F).
~th Tasman Rise EAST·NORTHEAST
Tasman Basin
(d) Seismic line 202/04 (ie. STR-K).
43 Australian Geological Survey Organisation
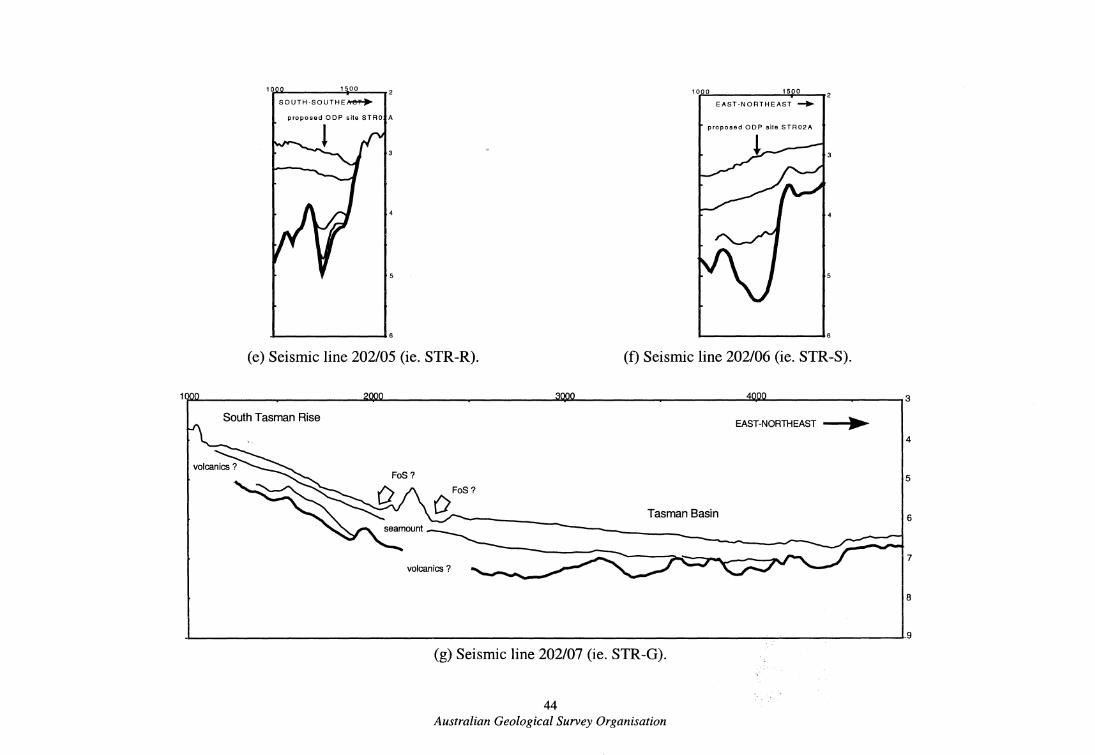
1 00 1000 1500
SOUTH-SOUTHE~ EAST-NORTHEAST ~
proposed OOP site STR02A
(e) Seismic line 202/05 (ie. STR-R). (f) Seismic line 202/06 (ie. STR-S).
~~ ____________________ ~~~ ______________________ ~~ ________________________ ~~ ________________ -,3
South Tasman Rise EAST-NORTHEAST -"""i.~
4
5
Tasman Basin 6
7 volcanics ?
8
~ ________________________________________________________________________ ~~ ______ ~ ______ ~9
(g) Seismic line 202/07 (ie. STR-G).
44 Australian Geological Survey Organisation

5000 4000 3000 2000 1000
South Tasman Rise
10.Q..Q.
South Tasman Rise
~~
./ -'-/\.,'"
volcanic developm ents
F 0 S ?
(h) Seismic line 202/08 (ie. STR-H).
(i) Seismic line 202/09 (ie. STR-I).
45 Australian Geological Survey Organisation
I
NORTHEAST
Tasman Basin
seam ount
SOUTHEAST

10Q..Q.
90DO 80.00 70.00
~~
"'....--'vv
volcanics
"
NOR T H -N 0 R THE A S T
(j) Seismic line 202110 (ie. STR-J).
60.00 50 40DO
8eam ou nls
-----..."
volcanics
/ deep reflector. ?
(k) Seismic line 202111 (ie. STR-L).
46 Australian Geological Survey Organisation
0.00
SOUTHEAST
/ /
/
O~OO 000

(1) Seismic line 202112 (ie. STR-M).
Proposed ODP site EFP02A
East Tasman Plateau
Tasman Basin 4
- 8
(m) Seismic line 202113 (ie. STR-A).
Figure 2. Line diagrams for seismic acquired. Seismic lines given in terms of shot points (1000 SPs = '50 km) and TWT in seconds.
47 Australian Geological Survey Organisation