continental scale antarctic deposition of sulphur and
TRANSCRIPT

Atmos. Chem. Phys., 10, 2457–2465, 2010www.atmos-chem-phys.net/10/2457/2010/© Author(s) 2010. This work is distributed underthe Creative Commons Attribution 3.0 License.
AtmosphericChemistry
and Physics
Continental scale Antarctic deposition of sulphur and black carbonfrom anthropogenic and volcanic sources
H.-F. Graf1, S. V. Shirsat1, C. Oppenheimer1, M. J. Jarvis2, R. Podzun3, and D. Jacob3
1University of Cambridge, Geography Department, Cambridge, UK2British Antarctic Survey, Cambridge, UK3Max-Planck-Institute for Meteorology, Hamburg, Germany
Received: 8 October 2009 – Published in Atmos. Chem. Phys. Discuss.: 11 December 2009Revised: 1 March 2010 – Accepted: 5 March 2010 – Published: 11 March 2010
Abstract. While Antarctica is often described as a pristineenvironment, there is an increasing awareness of the potentialthreats from local pollution sources including tourist shipsand emissions associated with scientific activities. However,to date there has been no systematic attempt to model the im-pacts of such pollutants at the continental scale. Indeed, untilvery recently there was not even a sulphur emission budgetavailable for Antarctica. Here we present the first compre-hensive study of atmospheric pollution in Antarctica using alimited area chemistry climate model, and a monthly emis-sions inventory for sulphur from maintenance of researchstations, ground and air traffic, shipping and the active Ere-bus volcano. We find that ship emissions, both sulphurousand black carbon, dominate anthropogenic pollution near theground. Their prevalence is likely to rise dramatically if re-cent trends in tourism continue.
1 Introduction
The remote and mostly uninhabited continent of Antarcticawas discovered in the late 18th century but forsaken exceptfor sporadic expeditions until the International GeophysicalYear in 1957/1958 when a number of permanent researchstations were established. Today, 37 year-round and 16summer-only research bases operate in Antarctica, of whichMcMurdo (managed by the US Antarctic Program) is the
Correspondence to:H.-F. Graf([email protected])
largest with a population of around 1000 people during theaustral summer (November to March) and of 250 during win-ter (April to October). The history of tourism in Antarcticaalso dates back to the 1950s. In 2000 an international organi-zation was created (IAATO,www.iaato.org) to monitor andregulate tourist activity in the region. Their reports reveal astrongly increasing number of tourist visits from 12 248 toabout 46 000 between the 2001/2002 and the 2007/2008 sea-sons, with an anticipation of further growth. Most of thetourists (98%) are ship borne.
Several prior studies have investigated pollution due toresearch activity at stations. PM10 abundance measured inMcMurdo during the austral summer routinely exceeds lev-els found in remote coastal regions of the continent (Lu-gar, 1993; Mazzera et al., 2001). Another study (Wolffand Cachier, 1998) conducted during 1992–1995 measuredBlack Carbon (BC) at Halley research station and founda mean background atmospheric level of approximately1 ng BC m−3, and spikes of several hundred ng BC m−3 350–400 m downwind of the generators. It was also suggestedthat the annual cycle of BC from its timing appears to becontrolled by biomass burning in the tropics, strongly mod-ulated by the efficiency of transport to Antarctica. In a morerecent study Stohl and Sodemann (2010) assessed long-rangetransport of BC towards Antarctica excluding any loss pro-cesses along the transport path. They conclude that it is “un-likely for air from these continents to reach Antarctica ontime scales relevant for aerosols and many short-lived tracegases”. This makes local sources of pollution especially rel-evant.
Published by Copernicus Publications on behalf of the European Geosciences Union.

2458 H.-F. Graf et al.: Continental scale Antarctic deposition of sulphur and black carbon
Table 1. Emissions from sulphur inventory (6) in Mg SO2month−1.
Source Station Ship Aircraft Erebus
April 4 – 2229May 4 – 2229June 4 – 2229July 4 – 2229August 4 – 2229September 4 – 2229October 4 – 2229November 26 223 6.4 2229December 26 1971 5.6 2229January 26 769 21.3 2229February 26 693 21.2 2229March 26 217 1.3 2229
Other pollutant sources include combustion of fuel fortransport and energy production, sewage burning (banned af-ter 1997) and accidental oil spills (Bargagli, 2008), for ex-ample from shipping accidents such as befell the Antarcticcruise vessel “Explorer” in 2007 or the “Bahia Paraiso” acci-dent in 1989 where 6×10⁵ l of oil were spilled. Most of thesestudies concerned point measurements in the proximity of re-search stations (for a comprehensive review on the effects ofhuman presence in Antarctica see Tin et al., 2009), and weare unaware of any study of continental scale contamination.Only very recently was a first comprehensive emission in-ventory published for 2004/2005 (Shirsat and Graf, 2009).
Natural sources of pollution include Erebus volcano,whose summit crater reaches 3794 m above sea level on RossIsland, and which has probably been degassing continuouslyfrom its active lava lake since at least its discovery in 1972(Giggenbach et al., 1973). Between 1992 and 2005, theaverage of all SO2 flux measurements for the volcano was61 Mg d−1 (∼1860 Mg month−1; Sweeney et al., 2008) verysimilar to measurements made in 2006 (Boichu et al., 2010).In December 2003, ultraviolet spectroscopy indicated thatErebus volcano is also an important source of NOx (Oppen-heimer et al., 2005). This finding was substantiated by insitu sampling of the drifting plume with an instrumented air-craft, which revealed significant abundances of volcanogenicHNO3 and HO2NO2 as well as ozone depletion likely due toa combination of reactive halogen and NOx chemistry (Op-penheimer et al., 2010). Several sporadically active volca-noes are located in the outer South Sandwich and ShetlandIslands, but their emissions have not been measured and theyare not taken into account here.
Oceanic and coastal biota (mainly penguins) also con-tribute to atmospheric pollution as does the emission of NOxfrom snow pack (Wang et al., 2008). Marine bioactivityleads to the emission of dimethylsulphate (DMS), which
oxidises to SO2 and, ultimately, to sulphate in the atmo-sphere. Estimates of source strength range between 1.4 and2.7 Tg S yr−1 for the Southern Ocean (Berresheim, 1987;Curran and Jones, 2000) but their transformation into othersulphur species and subsequent deposition is highly uncer-tain (Boucher et al., 2003). In any case, these sources by farexceed anthropogenic emissions of sulphur species and maskthe contribution from anthropogenic sources. In order to de-termine the patterns of anthropogenic sulphur deposition wetherefore exclude DMS sources from our study. The mod-elled distributions of sulphur emissions may also be seen asgiving a guide to the potential dispersal of other, potentiallymore toxic chemical species that are emitted concurrently butnot treated in our model.
The weather and climate of Antarctica are dominated bystrong katabatic winds blowing from the continent’s interiortowards the open ocean and by strong westerlies with embed-ded synoptic storms encircling the continent between 60◦ Sand 40◦ S, making the region extremely windy, cloudy andprecipitation rich. Most human activity is concentrated incoastal areas with relatively easy access in summer, whenthe prevailing weather conditions tend to hinder transport ofairborne pollutants towards the interior of the continent.
2 Emission inventory
We use a new emissions inventory (Shirsat and Graf, 2009) ina model simulation of transport, chemical transformation anddeposition of sulphur compounds and BC (from ship emis-sions only) for the year 2004/2005. The emissions from eachsource (station activity, ground transport, aviation, ships, andemissions from Erebus volcano) were tagged to allow com-parison of their individual contributions to the total atmo-spheric abundance and deposition. Station activity includingground transport contributes 158 Mg of SO2 for April 2004to March 2005, only 18 Mg more than an earlier estimate(Boutron and Wolff, 1989). Aircraft operations contribute56 Mg of SO2 at varying altitudes but exclusively during theAntarctic summer.
By far the highest anthropogenic source during the2004/2005 summer season is shipping: 3.873 Gg of SO2 and14.5 Mg of BC. This is 40 times more SO2 than the esti-mated total shipping source south of 60◦ S in 1989 (Boutronand Wolff, 1989)! Bond et al. (2007) as quoted by Stohland Sodemann (2010) estimated the total BC emission fromships south of 60◦ S, including fishery activities, as 100 Mgper year, an amount exceeding our BC emission data by afactor of ∼7. The number of ship visits to Antarctica, in-cluding scientific missions, support of station operations andtourism, is rising. In the Antarctic summer (November toMarch) 2004/2005, 65% of all ships carried tourists (Shir-sat and Graf, 2009) and their number rose from 210 trips in2004/2005 (our study period) to 301 trips in the 2007/2008austral summer, an increase of 43% within three years.
Atmos. Chem. Phys., 10, 2457–2465, 2010 www.atmos-chem-phys.net/10/2457/2010/

H.-F. Graf et al.: Continental scale Antarctic deposition of sulphur and black carbon 2459
Human activity on the continent is highly localised aroundbases, with the highest populations found on the AntarcticPeninsula, in the Ross Sea area (Ross Island and Terra NovaBay), Queen Maud Land and around the Amery Ice Shelf.Even though the sulphur emission of Erebus volcano is morethan six times higher than all anthropogenic emissions, thecrater is∼3800 m above sea level allowing winds to diluteand disperse the plume over a much greater area than thenear-ground emissions.
Estimates of total emissions of SO2 from different sourcetypes are shown in Table 1. They are based on emission fac-tors for different fuel types and fuel consumption. The latterquantity is either based on reported values or was estimatedfrom gross data on a per capita basis. For a detailed descrip-tion of the methods see Shirsat and Graf (2009). During theaustral winter, station activity is reduced and ship operationsand aviation cease. Station emissions were distributed to thebase locations and, where known, to transport routes accord-ing to available information. In many cases, only the sea-sonal total of burned fuel was available. If one nation op-erates several stations, national total fuel use was then dis-tributed on a per capita basis to the station locations. Shiproutes and mooring times were obtained from a number ofdifferent sources, including the on-line ship tracking system(www.sailwx.info) and sea ice maps. Air operations peakin January and February when research activity is highest.They had to be estimated taking into account different modesof operation during take-off, climb, approach and cruise us-ing data on travel route, number of flights (intercontinentaland intra-continental) and fuel consumption by aircraft oper-ations in Antarctica as obtained from COMNAP and personalcommunications.
As seen from Table 1, ship emissions dominate anthro-pogenic sources during the Antarctic summer. The busi-est month is December when, in 2004, SO2 emission wascomparable to volcanic emissions. Considering the dramatic>40% increase in tourist activity between 2004 and 2007 itis possible that December ship emissions today exceed thosefrom Erebus volcano. BC emissions were estimated only forships. They are based on an emission factor of 0.18×10⁻³. Itremains unclear if the lower emission of BC in our inventorycompared to the numbers reported in Bond et al. (2007) isdue to our rather conservative emission factor or comes fromexclusion of fishery activities. Very possibly our estimatesrepresent a lower limit.
3 Model simulations
To estimate the contribution of each source to the total de-position and atmospheric abundance of anthropogenic sul-phur, we ran the 20 layer limited area model REMOTE(Langmann, 2000) at 0.5◦ resolution from April 2004 toMarch 2005. The model resolution smoothes the topogra-phy (especially steep slopes). The model meteorology was
driven at the lateral boundaries every 6 h by ECMWF ERA40reanalysis data (Uppala et al., 2005) after initialization at allgrid points on 1 April 2004. Gas phase RADM2 (Stockwellet al., 1990) sulphur chemistry was included and both wet(Walcek and Taylor, 1986) and dry (Wesley, 1989) depositionwere calculated. We concentrate on anthropogenic effectsfrom point and line sources (mainly stations and ships) andErebus volcano and did not take into account the uncertainbackground emissions and transformation pathways of DMSin our model study. The model was applied over Antarc-tica for the first time and so we checked winds and tem-peratures against observations and reanalysis data. Surfacetemperatures from the model simulation were compared withavailable observations at Halley, Syowa, Dumont d’Urville,Neumayer and McMurdo. Both temperatures agree within arange of 2–3◦C. A comparison of three day mean temper-atures from ECMWF reanalysis with our model data yieldscorrelations between 0.8 and 0.9, while wind speeds are lesswell correlated (r=0.9 at the lateral boundaries of the modeldomain dropping tor=0.5 to 0.6 in the interior of the conti-nent). Overall, the results showed good agreement and madeus confident that the model is a useful tool for our task.
The mean lifetime of SO2 was estimated from the modelcalculations as 2 weeks in summer and 3 weeks in win-ter, comparable to estimates for the Arctic (Barrie and Hoff,1984). Figure 1 shows atmospheric mixing ratios of SO2in the lowest model level (ca. 50 m height above surface)for December 2004, the month with highest anthropogenicemissions, originating from i) station activity and groundtraffic, (ii) ships and (iii) Erebus volcano. Clearly the high-est abundance of SO2 from research activity is found wheremost of the stations are situated, i.e., around the largest sta-tion (McMurdo) in the Ross Sea, and on Amery Ice Shelfand in Queen Maud Land, where clusters of bases oper-ate. Weather conditions over the Peninsula, where further re-search bases are found, reduce the build up of SO2 abundancesince oxidation is faster here due to higher temperatures, at-mospheric moisture and insolation. The rate of oxidationof SO2 into sulphate leads to a much smoother distributionof sulphate in the lowest model level, but still the dominat-ing ship source can be traced. Once sulphate is formed itis quickly washed out from the atmosphere. The maximumanthropogenic sulphate (gas phase plus condensed) concen-tration reaches 0.01 ppbv close to McMurdo and just northof the tip of the Peninsula (Fig. 1d), where they contributeless than 20% to volcanic plus anthropogenic atmosphericconcentration. Most tourist ships are bound for the Penin-sula region since its attractions are easier to access. SO2abundances from ship operation are thus especially high inthis area, contributing at least ten times as much as researchbases.
Emissions from Erebus volcano reveal high surface SO2abundance extending from the crater Island to adjacent areasof the Ross Sea and Transantarctic Mountains. Because ofthe high summit elevation, they are distributed more evenly
www.atmos-chem-phys.net/10/2457/2010/ Atmos. Chem. Phys., 10, 2457–2465, 2010

2460 H.-F. Graf et al.: Continental scale Antarctic deposition of sulphur and black carbon
a b
c d
e
Fig. 1. Monthly mean December 2004 mixing ratio in ppbv at lowest model level(a) SO2 from power generation and vehicle operation atand between stations,(b) SO2 from ship emissions and(c) SO2 from volcanic emissions, sulphate concentration from all these sources(d)and black carbon from ships(e).
Atmos. Chem. Phys., 10, 2457–2465, 2010 www.atmos-chem-phys.net/10/2457/2010/

H.-F. Graf et al.: Continental scale Antarctic deposition of sulphur and black carbon 2461
Fig. 2. Annual deposition in kg km−2 of Black Carbon (BC) from ships (left) and of Sulphur from stations, volcano and ships (right).
and over a wider area than the near surface emissions fromships and station activity.
Clearly, even the highest simulated grid cell means of at-mospheric SO2 abundances from anthropogenic sources arewell below observed local values elsewhere in the world,including the Arctic. In Nuuk, Greenland, between Febru-ary 2002 and August 2004, mean SO2 concentrations of0.44 µg m−3 were reported (Skov et al., 2006), an orderof magnitude higher than the maximum values we simu-lated for Antarctica from emissions of research bases andship operation (Peninsula 0.035gµg m−3 and Ross Island0.057 µg m−3). Erebus volcano contributes significantly tothe SO2 abundance in the Ross Sea area, with a mixing ratioof ∼0.020 µg m−3 (∼6.4 pptv). Aviation related atmosphericsulphur abundance remains several orders of magnitude be-low all other sources. We have to keep in mind, however thatsulphur from the oceanic DMS source is excluded in the sim-ulations and that the model results represent means for areasof about 2500 km2 and cannot, therefore, capture local max-ima, especially in the vicinity of strong point sources. Obser-vations (Wolff and Cachier, 1998) revealed an average SO2concentration of 0.74 µg m3(∼250 pptv) near McMurdo Sta-tion during the austral summers 1995/1996 and 1996/1997and Eisele et al. (2008) reported SO2 measurements at SouthPole of about 10 pptv. This point measurement exceeds theNuuk observations, and represents a much higher abundancethan our model simulations yield for the area mean. Abun-dances representative of the scale of our model are not avail-able, but since all relevant emission sources are point or line(cruising ships) sources, variations of one to two orders ofmagnitude can be expected within the model resolved gridcells.
The only BC source considered in this study is shipping.As seen in Fig. 1e, maximum mixing ratios are<0.1 pptveven in the most contaminated areas around the Peninsula.Such low concentrations do not significantly affect radiation
processes and, hence, we will concentrate on cumulative ef-fects of deposition.
Melted snow is the exclusive source of fresh water inAntarctica and therefore deposition of sulphur and BC is im-portant. Sulphur and BC deposition may also serve as anindicator for the deposition of other, more toxic co-emittedsubstances including trace metals, especially from ship dieselengines. During melting or by evaporation from the snowpack, any pollutants become more concentrated enhancingthe potential to affect ecosystems.
The total modelled deposition of sulphur (from SO2 andSO4) and of BC from ship exhaust during the year 2004/2005is plotted in Fig. 2. Black carbon deposition reaches its high-est rates at the outer Peninsula, where most shipping activ-ity takes place. The maximum local concentrations of BCin snow just reach the order of 1 ng g−1 BC. The reductionin albedo of snow is∼1.5% for 10 ng g−1 of BC in snow(Hansen and Nazarenko, 2004), so the present pollution canonly affect snow albedo marginally. However, with furtherincreases in shipping in the Peninsula region, significant ef-fects on snow albedo may arise. Most of the deposition ofsulphur takes place into the Southern Ocean since the prevail-ing winds blow the pollutants away from the continent. How-ever, maximum deposition rates exceeding 0.4 kg S km−2 arefound along the coast of Ross Sea (0.54 kg S km−2) andstretching from the tip of the Antarctic Peninsula towardsthe Southern Ocean (0.85 kg S km−2). The western hemi-sphere, where sources are concentrated, experiences gener-ally higher deposition rates and the interior of the continentremains nearly unaffected due to the strong katabatic windsdirected towards the ocean.
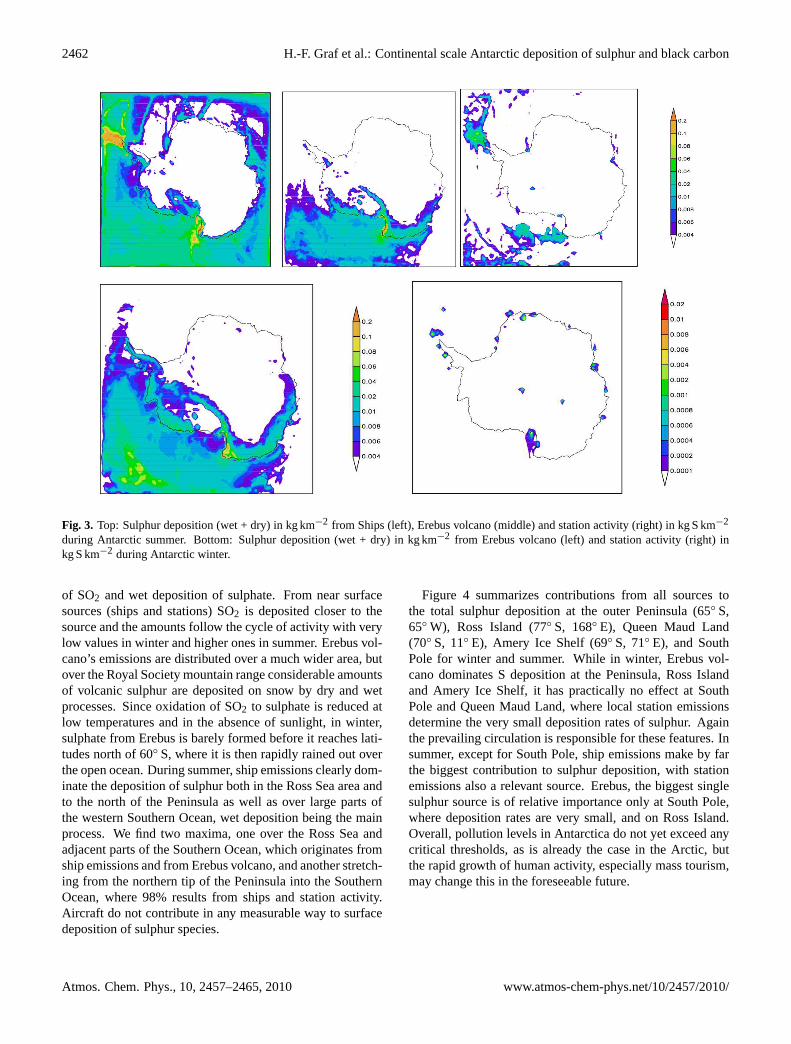
There are large differences between winter and summerdeposition patterns resulting from the seasonal contributionfrom anthropogenic sources, but also due to seasonal dif-ferences in weather conditions and sulphur photochemistry(Fig. 3). Sulphur deposition is due mainly to dry deposition
www.atmos-chem-phys.net/10/2457/2010/ Atmos. Chem. Phys., 10, 2457–2465, 2010
2462 H.-F. Graf et al.: Continental scale Antarctic deposition of sulphur and black carbon
Fig. 3. Top: Sulphur deposition (wet + dry) in kg km−2 from Ships (left), Erebus volcano (middle) and station activity (right) in kg S km−2
during Antarctic summer. Bottom: Sulphur deposition (wet + dry) in kg km−2 from Erebus volcano (left) and station activity (right) inkg S km−2 during Antarctic winter.
of SO2 and wet deposition of sulphate. From near surfacesources (ships and stations) SO2 is deposited closer to thesource and the amounts follow the cycle of activity with verylow values in winter and higher ones in summer. Erebus vol-cano’s emissions are distributed over a much wider area, butover the Royal Society mountain range considerable amountsof volcanic sulphur are deposited on snow by dry and wetprocesses. Since oxidation of SO2 to sulphate is reduced atlow temperatures and in the absence of sunlight, in winter,sulphate from Erebus is barely formed before it reaches lati-tudes north of 60◦ S, where it is then rapidly rained out overthe open ocean. During summer, ship emissions clearly dom-inate the deposition of sulphur both in the Ross Sea area andto the north of the Peninsula as well as over large parts ofthe western Southern Ocean, wet deposition being the mainprocess. We find two maxima, one over the Ross Sea andadjacent parts of the Southern Ocean, which originates fromship emissions and from Erebus volcano, and another stretch-ing from the northern tip of the Peninsula into the SouthernOcean, where 98% results from ships and station activity.Aircraft do not contribute in any measurable way to surfacedeposition of sulphur species.
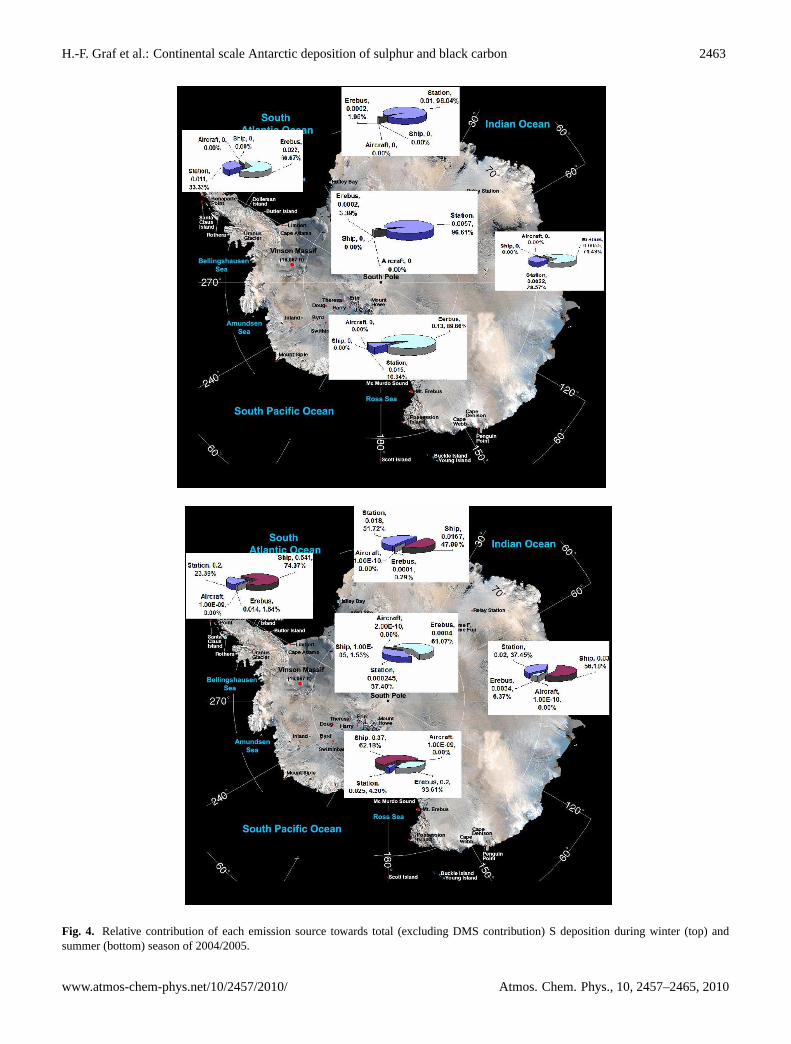
Figure 4 summarizes contributions from all sources tothe total sulphur deposition at the outer Peninsula (65◦ S,65◦ W), Ross Island (77◦ S, 168◦ E), Queen Maud Land(70◦ S, 11◦ E), Amery Ice Shelf (69◦ S, 71◦ E), and SouthPole for winter and summer. While in winter, Erebus vol-cano dominates S deposition at the Peninsula, Ross Islandand Amery Ice Shelf, it has practically no effect at SouthPole and Queen Maud Land, where local station emissionsdetermine the very small deposition rates of sulphur. Againthe prevailing circulation is responsible for these features. Insummer, except for South Pole, ship emissions make by farthe biggest contribution to sulphur deposition, with stationemissions also a relevant source. Erebus, the biggest singlesulphur source is of relative importance only at South Pole,where deposition rates are very small, and on Ross Island.Overall, pollution levels in Antarctica do not yet exceed anycritical thresholds, as is already the case in the Arctic, butthe rapid growth of human activity, especially mass tourism,may change this in the foreseeable future.
Atmos. Chem. Phys., 10, 2457–2465, 2010 www.atmos-chem-phys.net/10/2457/2010/
H.-F. Graf et al.: Continental scale Antarctic deposition of sulphur and black carbon 2463
Fig. 4. Relative contribution of each emission source towards total (excluding DMS contribution) S deposition during winter (top) and
summer (bottom) season of 2004/2005.
www.atmos-chem-phys.net/10/2457/2010/ Atmos. Chem. Phys., 10, 2457–2465, 2010

2464 H.-F. Graf et al.: Continental scale Antarctic deposition of sulphur and black carbon
4 Conclusions
Model simulations for the year 2004/2005 indicate ships asthe most significant source of anthropogenic sulphur con-tamination during the austral summer, exceeding the naturalsource, Erebus volcano. Sulphur originating from oceanicDMS production is not included in this study. It generallywill dominate the overall atmospheric concentration, thus ob-scuring anthropogenic contribution. Currently a new study isbeing prepared considering this source and reports will bereported later. Ships are the only source of BC consideredhere. Most of these ships are tourism related and the mostaffected areas are the outer Antarctic Peninsula, a main desti-nation of tourist cruises, and the Ross Sea, where the biggestresearch station operates. While current atmospheric abun-dances and deposition of anthropogenic sulphur and blackcarbon do not seem to be critical, they may serve as indi-cators of contamination with other, more toxic substances,including heavy metals, polycyclic aromatic hydrocarbonsand other toxic substances which are emitted especially to-gether with BC, i.e. from ships. The simulated depositionpatterns will help determine locations where snow samplescan be collected to analyze large scale pollution in more de-tail.
Acknowledgements.We wish to thank Zoe Fleming and an anony-mous reviewer for their constructive remarks during the discussionprocess.
Edited by: M. Dameris
References
Bargagli, R.: Environmental contamination in Antarc-tic ecosystems, Sci. Total Environ., 400(1–3), 212–226,doi:10.1016/j.scitotenv.2008.06.062, 2008.
Barrie, L. A. and Hoff, R. M.: The oxidation rate and residence timeof sulphur dioxide in the Arctic atmosphere, Atmos. Environ.,18(12), 2711–2722, 1984.
Berresheim, H.: Biogenic sulfur emissions from the Subantarcticand Antarctic oceans, J. Geophys. Res., 92, 1324513262, 1987.
Boichu, M., Oppenheimer, C., Tsanev, V. I., and Kyle, P. R.: Hightemporal resolution SO2 flux measurements at Erebus volcano,Antarctica, J. Volcanol. Geoth. Res., 190, 325–336, 2010.
Bond, T. C., Bhardwaj, E., Dong, R., Jogani, R., Jung, S., Roden,C., Streets, D. G., Fernandes, S., and Trautmann, N.: Histori-cal emissions of black and organic carbon aerosol from energy-related combustion, 1850–2000, Global Biogeochem. Cy., 21,GB2018, doi:10.1029/2006GB002840, 2007.
Boucher, O., Moulin, C., Belviso, S., Aumont, O., Bopp, L., Cosme,E., von Kuhlmann, R., Lawrence, M. G., Pham, M., Reddy, M.S., Sciare, J., and Venkataraman, C.: DMS atmospheric concen-trations and sulphate aerosol indirect radiative forcing: a sen-sitivity study to the DMS source representation and oxidation,Atmos. Chem. Phys., 3, 49–65, 2003,http://www.atmos-chem-phys.net/3/49/2003/.
Boutron, C. F. and Wolff, E. W.: Heavy metal and sulphur emissionsto the atmosphere from human activities in Antarctica, Atmos.Environ., 23(8), 1669–1675, 1989.
COMNAP: Council of Managers for National Antarctic Pro-grammes,www.comnap.aq, last access: January 2010.
Curran, M. A. and Jones, G. B.: Dimethyl sulfide in the South-ern Ocean: seasonality and flux, J. Geophys. Res., 105, 20451–20459, 2000.
Eisele, F., Davis, D. D., Helmig, C. D., Oltmans, S. J., Neff, W.,Huey, G., Tanner, D., Chen, G., Crawford, J., Arimoto, R., Buhr,M., Mauldin, L., Hutterli, M., Dibb, J., Blake, D., Brooks, S.B., Johnson, B., Roberts, J. M., Wang, Y., Tan, D., and Flocke,F.: Antarctic tropospheric chemistry investigation (ANTCI) 2003overview, Atmos. Environ. 42, 2749–2761, 2008.
Giggenbach, W. F., Kyle, P. R., and Lyon, G. L.: Present volcanicactivity on Mount Erebus, Ross Island, Antarctica, Geology, 1,135–136, 1973.
Hansen, J. and Nazarenko, L.: Soot climate forcing viasnow and ice albedos, P. Natl. Acad. Sci., 101, 423–428,doi:10.1073/pnas.2237157100, 2004.
IAATO: International Association of Antarctic Tour Operators,www.iaato.org, last access: January 2010.
Langmann, B.: Numerical modelling of regional scale transport andphotochemistry directly together with meteorological processes,Atmos. Environ., 34, 3585–3589, 2000.
Lugar, R. M.: Results of PM10 and TSP monitoring at McMurdostation, Antarctica, US Department of Energy, May 1993.
Mazzera, D. M., Lowenthal, D. H., Chow, J. C., Watson, J. G., andGrubisıc, V.: PM10 measurements at McMurdo Station, Antarc-tica, Atmos. Environ., 35, 1891–1902, 2001.
Minikin, A., Legrand, M., Hall, J., Wagenbach, D., Kleefeld, C.,Wolff, E., Pasteur, E.-C., and Ducroz, F.: Sulphur contain-ing species (sulphate and methanesulfonate) in coastal Antarcticaerosol, J. Geophys. Res., 103(D9), 10975–10990, 1998.
Oppenheimer, C., Kyle, P. R., Tsanev, V. I., McGonigle, A. J. S.,Mather, T. A., and Sweeney, D.: Mt. Erebus, the largest pointsource of NO2 in the Antarctic atmosphere, Atmos. Environ., 39,6000–6006, 2005.
Oppenheimer, C., Kyle, P., Eisele, F., Crawford, J., Huey,G., Tanner, D., Kim, S., Mauldin, L., Blake, D., Beyers-dorf, A., Buhr, M., and Davis, D.: Atmospheric chemistryof an Antarctic volcanic plume, J. Geophys. Res., in press,doi:10.1029/2009JD011910, 2010.
Shirsat, S. V. and Graf, H. F.: An emission inventory of sulfurfrom anthropogenic sources in Antarctica, Atmos. Chem. Phys.,9, 3397–3408, 2009,http://www.atmos-chem-phys.net/9/3397/2009/.
Skov, H., Wahlin, P., Christensen, J., Heidam, N. Z., and Pe-tersen, D.: Measurements of elements, sulphate and SO2 in NuukGreenland, Atmos. Environ., 40, 4775–4781, 2006.
Stockwell, W. R., Middleton, P., Chang, J. S., and Tang, X.: Thesecond generation regional acid deposition model: Chemicalmechanism for regional air quality modelling, J. Geophys. Res.,95, 16343–16367, 1990.
Stohl, A. and Sodemann H.: Characteristics of atmospheric trans-port into the Antarctic troposphere, J. Geophys. Res., 115,DO2305, doi:10.1029/2009JD012536, 2010.
Sweeney, D., Kyle, P. R., and Oppenheimer, C.: Sulfur dioxideemissions and degassing behavior of Erebus volcano, Antarctica,
Atmos. Chem. Phys., 10, 2457–2465, 2010 www.atmos-chem-phys.net/10/2457/2010/

H.-F. Graf et al.: Continental scale Antarctic deposition of sulphur and black carbon 2465
J. Volcanol. Geoth. Res., 177, 725–733, 2008.Tin, T., Fleming, Z. L., Hughes, K. A., et al.: Impacts of local hu-
man activities on the Antarctic environment, Antarct. Sci., 21(1),3–33, 2009.
Uppala, S. M., Kallberg, P. W., Simmons, A. J., et al.: The ERA-40re-analysis, Q. J. Roy. Meteorol. Soc., 131, 2961–3012, 2005.
Wang, Y., Choi, Y., Zng, T., Davis, D., Buhr, M., Huey, L. G.,and Neff, W.: Assessing the photochemical impact of snow NOxemissions over Antarctica during ANTCI 2003, Atmos. Environ.,42(12), 2849–2863, 2008.
Walcek, C. J. and Taylor, G. R.: A theoretical method for comput-ing vertical distributions of acidity and sulfate production withincumulus clouds, J. Atmos. Sci., 43, 339–355, 1986.
Wesley, M. L.: Parameterization of surface resistances to gaseousdry deposition in regionalscale numerical models, Atmos. Envi-ron., 23, 1293–1304, 1989.
Wolff, E. W. and Cachier, H.: Concentrations and seasonal cycle ofBlack Carbon aerosol in a coastal Antarctic station, J. Geophys.Res., 103(D9), 11033–11041, 1998.
www.atmos-chem-phys.net/10/2457/2010/ Atmos. Chem. Phys., 10, 2457–2465, 2010