contextual modulation of v1 receptive fields depends on
TRANSCRIPT
Contextual modulation of V1 receptive fieldsdepends on their spatial symmetry
Tatyana O. Sharpee & Jonathan D. Victor
Received: 20 April 2008 /Revised: 9 June 2008 /Accepted: 10 June 2008# Springer Science + Business Media, LLC 2008
Abstract The apparent receptive field characteristics ofsensory neurons depend on the statistics of the stimulusensemble—a nonlinear phenomenon often called contextualmodulation. Since visual cortical receptive fields deter-mined from simple stimuli typically do not predictresponses to complex stimuli, understanding contextualmodulation is crucial to understanding responses to naturalscenes. To analyze contextual modulation, we examinedhow apparent receptive fields differ for two stimulusensembles that are matched in first- and second-orderstatistics, but differ in their feature content: one ensembleis enriched in elongated contours. To identify systematictrends across the neural population, we used a multidimen-sional scaling method, the Procrustes transformation. Wefound that contextual modulation of receptive field compo-nents increases with their spatial extent. More surprisingly,we also found that odd-symmetric components change
systematically, but even-symmetric components do not.This symmetry dependence suggests that contextual mod-ulation is driven by oriented On/Off dyads, i.e., modulationof the strength of intracortically-generated signals.
Keywords Primary visual cortex . Plasticity .
Linear–nonlinear model . Reverse correlation
1 Introduction
Neurons in primary visual cortex are often described asdetectors of oriented features (Hubel and Wiesel 1959,1968), or as oriented filters (De Valois et al. 1982a, b; DeValois and Thorell 1988). Such spatial processing can beadequately characterized by stimuli that vary along onlyone dimension, such as bars, edges, and gratings. More-over, implicit (or sometimes explicit) in this view is thenotion that the main qualitative features of a V1 neuron’sresponse can be described in terms of a linear spatial filter,or a linear spatial filter followed by a simple nonlinearitysuch as a threshold, or an energy operation.
However, there is a large and increasing body ofevidence that this simple picture is incomplete. First, thereis the intriguing role of the surround of the receptive field.Increasing stimulation of the surround increases sparseness(Vinje and Gallant 2000) and efficiency of informationtransmission (Vinje and Gallant 2002) during naturalvision. Second, even simple visual stimuli placed in thesurround strongly influence a cell’s responses. Thesemodulatory effects may arise at several levels. Some mayreflect processes that have already occurred in the retina(Shapley and Victor 1978) and lateral geniculate nucleus(Ohzawa et al. 1985). Some can be explained by thenonlinearities of processing within a single cortical cell
J Comput NeurosciDOI 10.1007/s10827-008-0107-5
Electronic supplementary material The online version of this article(doi:10.1007/s10827-008-0107-5) contains supplementary material,which is available to authorized users.
Action Editor: Matthew Wiener
T. O. Sharpee (*)Computational Neurobiology Laboratory,The Salk Institute for Biological Studies,La Jolla( CA 92037, USAe-mail: [email protected]
T. O. SharpeeCenter for Theoretical Biological Physics,University of California, San Diego,La Jolla( CA 92093, USA
J. D. VictorWeill Cornell Medical College,New York, NY 10065, USAe-mail: [email protected]

(Priebe and Ferster 2006) or synapse (Carandini et al. 2002;Freeman et al. 2002). Others appear to require corticalnetwork mechanisms (Das and Gilbert 1999) includingsuppressive connections between neurons of differentorientations and spatial frequencies (Bonds 1989; Carandiniet al. 1997; Heeger 1992).
Here we examine how the shape of the apparentreceptive field sensitivity profile depends on context, andfocus on aspects of context that are not likely to triggersimple gain control mechanisms. We do this by analyzingresponses of neurons to two sets of two-dimensionalHermite functions (Fig. 1). The two stimulus sets arematched in spatial extent, contrast, and second-orderstatistics, but differ in their higher-order statistics. Thesedifferences are visually obvious and lead to qualitativelydifferent two-dimensional patterns: one set has Cartesiansymmetry and contains Gabor-like patterns, checkerboard-like patterns, and elongated contours; the other set has polarsymmetry and contains target-like and pinwheel patterns. Ifthe neural response were described by a linear function ofthe stimulus (perhaps followed by a nonlinearity), then bothstimulus ensembles would provide identical reconstructionsof the neural receptive field. This is because individualstimuli within one stimulus ensemble can be expressed aslinear combinations of stimuli from the other stimulusensemble. Moreover, even if the spatial sensitivity weremodulated by mechanisms sensitive to the “context” offirst- and second-order statistics (such as mean luminance,contrast, and power spectrum), the two ensembles wouldstill provide identical reconstructions—because their statis-tics are matched at first and second order.
The focus on context-dependence induced by statistics oforder greater than two might at first seem like amathematical curiosity, but it is actually of central impor-
tance. This is because it is these high-order statistics (phasecorrelations) that lead to visually salient structure such aslines and edges, both in artificial stimuli (Morrone and Burr1988) and in natural scenes (Oppenheim and Lim 1981;Ruderman and Bialek 1994; Simoncelli and Olshausen2001). Moreover, standard models for V1 neuronalresponses tend to be inaccurate specifically for naturalscene stimuli in which such high-order correlations arepresent (Felsen et al. 2005). Thus, delineation of theinfluence of high-order statistics on V1 neurons is crucialto advance our understanding of the computations that theycarry out.
However, studying context-dependence induced by high-order statistics via responses to natural scenes is difficult,because high-order statistics of natural scenes are complexand incompletely characterized. This, specifically, motivat-ed our study of context-dependence driven by Hermitefunctions, which are analytically simple, and have fully-characterized statistics. We recently showed (Victor et al.2006) that Hermite functions induced significant context-dependent changes in a large fraction of V1 cat andmacaque neurons. However, it was not clear how thosechanges in apparent receptive field shape could besuccinctly characterized, or what features of these changeswere systematic. For example, across the population, wefound no consistent shifts in either spatial frequency ororientation tuning. Therefore, we sought a more data-driven, non-parametric approach to characterize thesechanges.
The present study carries out such an approach. Byconsidering the population of V1 neurons as a whole, itsucceeds in identifying two systematic aspects of thecontext-dependence of their receptive fields. First, receptivefield components covering a wider area show strongercontext-dependent changes that those that cover a narrowerarea. Second, we find that consistency of context-dependentchanges across the population of cells depends on symme-try properties of receptive field components: in particular,components that invert their contrast under 180-degreespatial rotation change in a more consistent manner thancomponents that remain unchanged with this rotation.
This latter conclusion is unexpected, and neither con-clusion was apparent from casual inspection of the dataset.Rather, they emerged from a novel method that we used tostudy context-dependent changes, which we believe isapplicable far beyond the present scenario. The approach isbased on a version of the Procrustes transformation of multi-dimensional scaling (Kabsch 1976). The main idea of thismethod is to find the best transformation from a set ofreceptive fields obtained in one context to a set of receptivefields from the same neurons recorded in a second context.
A distinctive feature of this approach is that it seeks toidentify a single transformation that applies to all measured
rank
0
1
2
3
4
5
6
7
Cartesian stimulus set polar stimulus set
cosine
x
y
sine
Fig. 1 Stimulus patterns used in these experiments. Stimuli were two-dimensional Hermite functions (Victor et al. 2006). Cartesian stimuli(left panel) are products of one-dimensional Hermite functions invertical and horizontal coordinates. Each row contains all theCartesian stimuli of a given rank. Linear combinations of patterns ofthe same rank can be constructed to be separable in radial and angularcoordinates. These are the polar stimuli (right panel). Modified withpermission from Victor et al. 2006
J Comput Neurosci

receptive fields within a population. Thus, it can identifypatterns that would not be apparent if each neuron’sreceptive field were studied independently. As such, thisis an approach that is likely to be widely applicable to theproblem of characterizing how receptive field shapesdepend on some manipulation, such as contrast, attention,or a pharmacologic perturbation.
2 Methods
Electrophysiological recordings The data presented herewere collected for a previous study (Victor et al. 2006), andthe experimental preparation has been detailed there.Briefly, neural responses were collected using tetrodes fromthe primary visual cortex of anesthetized, paralyzed catsand macaques. Single units were tentatively identifiedduring recording using real-time spike-sorting software(Datawave Technologies); quantitative analysis of receptivefields was carried out off-line following spike sorting withcustom software (Reich 2001).
At each recording site, one well-isolated single unit withsignal-to-noise of the spike waveform >2:1, and usually3:1, was selected as the “target” neuron. Orientation tuningof the target neuron was determined from responses todrifting gratings at orientations spaced in steps of 22.5° (or,for narrowly tuned units, 11.25°), with spatial and temporalfrequency determined by initial assessment. Next, thespatial frequency tuning was determined using driftinggratings at an 8-to 16-fold range of spatial frequenciesstraddling the value determined by auditory assessment.Temporal tuning was determined from responses to 1-, 2-,4-, 8-, and 16 Hz drifting gratings of optimal orientationand spatial frequency. Finally, a contrast response functionwas determined from responses to drifting gratings atcontrast of 0, 0.0625, 0.125, 0.25, 0.5, and 1.0, withorientation, spatial and temporal frequencies previouslydetermined.
The center of the receptive field was determined fromthe response to either a bright or a dark bar, moving slowly(≤1deg/s) and symmetrically in both directions along thepreferred axis. The center of the receptive field along thepreferred axis was determined as the position correspondingto the mean time of the peak responses elicited by barsmoving slowly in the preferred and anti-preferred direc-tions. The center of the receptive field in the orthogonaldirection was taken as a halfway point between the upperand lower edges of the receptive field, which in turn weredetermined by the appearance of a response to slowly sweptpatches along multiple trajectories parallel to the preferredaxis.
Once centered, the size of the classical receptive fieldwas determined from response to a drifting grating (all
parameters optimized) presented in disks of increasingdiameter and in a series of annuli. The effective diameter Dof the receptive field was taken to be the smallest innerdiameter of an annulus that did not produce a statisticallysignificant response above zero. The set of annuli werechosen so that D was determined to within 1/2 deg or, forsmaller receptive fields, 1/4 deg. The effective diameter Dwas used (below) to set the width of the zero-rank two-dimensional Hermite function, a Gaussian. Higher-rankfunctions were scaled in proportion to this Gaussian, as inFig. 1.
Stimulus presentation Neurons were probed with visualpatterns derived from two-dimensional Hermite functions(see Fig. 1). The contrast profiles of these patterns arepolynomials multiplied by a Gaussian envelope. Stimuliwere rotated so that the x-axis was along the target neuron’spreferred orientation and the positive y-axis was thepreferred direction for drifting gratings. We set the spatialparameter σ of the Hermite functions (Eqs. A1 through A5of Victor et al. 2006) at σ=D/10, where D is the diameter ofthe classical receptive field of the target neuron asdetermined by responses to disks and annuli containingoptimal drifting gratings (see above and Victor et al. 2006).This choice of σ creates Hermite function stimuli that haveone, two, or three oscillations within a region of space thatcovers the receptive fields. Each stimulus was presented asillustrated in Fig. 1, and also with luminance polarityreversed.
Computation of receptive fields for Cartesian and polarstimuli For the reverse-correlation modeling approach (L-filters), receptive fields were computed in a manner similarto a spike-triggered average. The contribution of each basisfunction to the linear component of the estimated receptivefield (L-filter) was determined from the difference betweenthe response to that basis function, and to its contrast-inverse. This yields the desired filter shapes becauseindividual stimulus patterns are orthogonal to each other.See (Victor et al. 2006) and Supplementary Information forfurther details, including characterization of the nonlinearcomponent of the receptive field.
For the MID modeling approach (M-filters), receptivefields were computed using the method of (Sharpee et al.2004). Any candidate receptive field shape can be inter-preted as a direction in stimulus space. Stimuli can beprojected along that direction to yield a set of scalars. Thereceptive field determined by this method is the directionfor which the mutual information between these scalars andthe firing rate is maximized. Advantages of this method arethat (a) it does not place requirements on the correlationstructure of the stimulus set, and (b) it does not postulate aspecific form for the relationship between the projection
J Comput Neurosci

and the response—this can be an arbitrary nonlinearfunction.
Details of the computational algorithm have beenpreviously described in (Sharpee et al. 2004) and in thesupplementary information of (Sharpee et al. 2006). Briefly,the spike-triggered average was chosen as an initial guess.Then, we used a combination of gradient ascent andsimulated annealing to maximize information; 1000 lineoptimizations were used. Each line optimization was carriedout along the gradient of information evaluated along thecurrent candidate relevant dimension. No regularization bythe performance on the test set was implemented. Thus,computation of jackknife estimates (by setting aside onepresentation, see below) was completely independent fromthe data in the omitted presentation.
Debiasing and standard error estimation for correlationcoefficients We used correlation coefficients to comparereceptive field shapes. Two kinds of comparisons weremade: receptive fields derived from the two modelingapproaches (reverse correlation vs. MID) for a singlestimulus set (Cartesian or polar), and receptive fieldsderived from two stimulus sets but according to a singlemodeling approach. In each case, we used a jackknifemethod to debias the estimates of the correlation coeffi-cients, and to obtain estimates of their standard error.
We are interested in the absolute value of the correlationcoefficient cc ¼ ~v �~uj j between two receptive field esti-mates,~v and~u. The absolute value is used because for MID,receptive fields are defined up to a scaling factor, whichcould be negative.
To carry out the jackknife procedure (Efron andTibshirani 1998), we computed receptive fields from allstimulus presentations~vfull and~ufull, and also the “drop one”jackknife estimates ~vi and ~ui computed by leaving out theith stimulus repetition from the analysis.
The jackknife estimate of the bias of a statisticalestimator θ that has an approximately Gaussian distributionis
01 ¼ qfull � N � 1ð Þ qih i � qfullð Þ; ð1Þwhere θfull is estimated taking all of the data into account,and qih i is the mean of the drop-one estimates, obtained bysuccessively omitting one of the N repetitions (in thisdataset N ranged from 8 to 16). Correlation coefficients arelimited to the range between −1 and 1, and their distributionis not well approximated by a Gaussian. To normalize theirdistribution and make the jackknife procedure applicable,we first applied the Fisher z-transform to the correlationcoefficients (Efron and Tibshirani 1998), i.e., θ=arctanh(cc).After the z-transformed correlation coefficients weredebiased according to Eq. (1), we applied the inversetransformation, i.e., cc=tanh(θ), to obtain debiased correla-
tion coefficients. We note that even though correlationcoefficients computed from jackknife estimates and the fulldataset are always positive, negative values can appear afterdebiasing.
The standard error of jackknife estimates was alsofirst computed on the z-transformed variables θ: Δq ¼ffiffiffiffiffiffiffiffiffiffiffiffiffiffiffiffiffiffiffiffiffiffiffiffiffiffiffiffiffiffiffiffiffiffiffi
N�1N
PNi¼1
qi�qfullð Þ2s
and then transformed back to obtain
standard error for the correlation coefficients:
s jack;� ¼ tanh q1 �Δqð Þ � tanh q1ð Þ; ð2Þwhere q1 was computed according to Eq. (1). This resultsin an asymmetric confidence interval. We quote the largerof the two values when describing correlation coefficientsin figure legends.
3 Results
3.1 Context-dependence of responses to Cartesian and polarstimuli
Our analysis is based on n=51 single neurons (n=34 fromcat visual cortex and n=17 from monkey visual cortex)previously recorded (Victor et al. 2006). This study founddifferences between the receptive fields measured with theCartesian and polar stimulus sets showed in Fig. 1, but wasunable to characterize the nature of this context-inducedchange—which is the goal of the present study.
To pursue this goal, the first step is to characterize theresponses to each stimulus set in a concise fashion—i.e., bydetermining the effective receptive field in each context.This characterization necessarily entails assumptions (areceptive field model) and approximations (which aspectsof the response are incorporated into the model). Therefore,before drawing conclusions about the differences betweenCartesian and polar stimulus sets, a prerequisite is to showthat our characterization is robust. To do this, we will usetwo complementary strategies to estimate the receptivefields from each context, and show that these two modelingapproaches lead to the same estimate.
The basic element of our receptive field model is a linearfilter followed by a static nonlinearity (an “LN” model, deBoer and Kuyper 1968; Meister and Berry 1999; Schwartzet al. 2006; Victor and Shapley 1980). One way of fittingthis model consists essentially of reverse correlation (Victoret al. 2006). The key assumption of this approach is that thenonlinearity can be decomposed into a linear componentand an even-symmetric component. In the second approach,known as the maximally informative dimension (MID)method (Sharpee et al. 2004), the best LN approximation isdetermined according to an information-theoretic criterion.
J Comput Neurosci

This allows us to avoid making assumptions about theshape of the nonlinearity. Another difference between thesetwo approaches is that in the reverse-correlation method,the estimate of the L-filter is unaffected by the spatialdistribution of On/Off responses (instead, the On/Offresponses are characterized by a second LN pathway),while in the MID method as implemented here, a single LNpathway is used to model all responses. These approachesalso differ in their sensitivity to response variability andlimited amounts of data. This is because the MID methodrelies on a nonlinear optimization, while the reversecorrelation method does not.
We will refer to the linear component of the LN modelextracted by reverse correlation as L-filters, and thosecomputed as MIDs as M-filters.
As we now show, despite these differences in how the L-filters and M-filters are estimated, they have similar shapeswhen estimated from responses to the same basis set (i.e., inthe same context), and show parallel changes in shape whencontext is altered (Fig. 2 and Supplementary Figs. 1 and 2).Thus, the LN model (as determined by either method) is ameaningful way to characterize the response to either basisset, and how this characterization changes with context.
Figure 2 shows several example cells that cover theobserved range of context dependence. In all cases, the L-filters and the M-filters were similar to each other whenobtained with the same stimulus set (Cartesian or polarstimuli). Both characterizations (L-filters and M-filters) alsohad a similar dependence on context (Cartesian vs. polarstimuli). In Fig. 2(a) we show examples of cells that did notshow contextual modulation. In these cells, the L-filters andthe M-filters (compare two columns shown for each cell)are similar, as are the filters obtained from Cartesian andpolar stimulus sets (compare the two rows shown for eachcell). The example cells of Fig. 2(b,c) show a contexteffect: the L-filters and the M-filters determined from thesame stimulus set (either Cartesian or polar) are similar, butthe filters depend on which stimulus set (Cartesian vs.polar) is used. For the cells of Fig. 2(b), the context-dependence was statistically significant (p<0.05, seeMethods) for both the L-filters and the M-filters. For thecells of Fig. 2(c), the context-dependence was statisticallysignificant only for the L-filters. For the M-filters, thedifferences between the Cartesian and polar M-filters arequalitatively similar to the differences seen for the L-filters,but did not reach statistical significance.
To quantify the magnitude of context-dependent changesat the population level, we compute the distribution ofcorrelation coefficients between normalized L-filters com-puted from Cartesian and polar stimulus set [Fig. 3(a)]. Thisquantity measures the extent to which the receptive fieldmap, as determined by reverse correlation, depends on thestimulus set. In agreement with the previous report (Victor
et al. 2006), more than half (39/51) of the cells in ourdataset had significant differences in receptive fields of thelinear model between Cartesian and polar stimuli, with 28cells showing differences significant at p<0.01, and 11 cellsshowing differences significant at 0.01<p<0.05. For theremaining 12 cells, there was no significant difference inreceptive fields determined from Cartesian and polarstimuli. Figure 3(b) shows a parallel analysis using thecorrelation coefficient determined from the M-filters: 20 outof 51 cells showed significant context-dependence (17cells at p<0.01 and three cells at 0.01<p<0.05). Fewercells with significant differences between receptive fieldsfor Cartesian and polar stimuli were found for the M-filters (20) than for the L-filters (39). Most likely this isdue to larger uncertainty in the M-filter profiles than forthe L-filters, which is in turn a consequence of the absenceof assumptions on the shape of the nonlinear gain functionin the MID method (see Supplementary Fig. 3). Asexamples in Fig. 2(c) illustrate, the context-dependencerevealed by the two methods is qualitatively similar, evenif it does not reach statistical significance with one of theapproaches.
3.2 Identifying systematic changes in receptive fieldsacross a population
Having found that approximately half of the neuronsexhibit changes in receptive field profiles when probedwith Cartesian versus polar stimuli, we now seek todetermine the extent to which these changes are systematic.As previously reported in this population of cells (Victor etal. 2006), the change in effective receptive field as afunction of Cartesian vs. polar context was not associatedwith a systematic change in sensitivity, spatial frequencytuning, or orientation tuning. This motivated us to pursue amore data-driven, nonparametric approach to this problem.As a first step, we make use of the fact that each receptivefield profile (e.g., the profiles shown in Fig. 2) can beconsidered to be members of a vector space of moderatedimension. This is because each filter shape is a linearcombination of the stimuli. Moreover, since each set ofstimuli is a linear combination of the other one, we can useeither stimulus set as a basis for describing the filter shapes.For definiteness, we choose the polar ones. With thisconvention, the filter shape of a single cell is described by avector of 36 numbers—the coefficients in the linearcombination of the 36 polar functions.
Extending this idea, the set of filters obtained from allcells with Cartesian stimuli can be thought of as a set ofvectors in a 36-dimensional space of polar filter shapes.Similarly, the set of filters obtained from the same cellswith the polar stimuli can be thought of as a correspondingset of vectors in the same 36-dimensional space.
J Comput Neurosci

(a)
(b)
(c)
c34 site 2 experiment 1 unit 6 cell #27c30 site 3 experiment 3 unit 6 cell #4
Lcart
Mcart
Mpolar
Lpolar
Lcart
Mcart
Mpolar
Lpolar
c30 s ite 7 experiment 1 unit 2 cell #9 c30 s ite 3 experiment 3 unit 2 cell #2c33 s ite 1 experiment 1 unit 2 cell #12
Lcart
Mcart
Mpolar
Lpolar
Lcart
Mcart
Mpolar
Lpolar
Lcart
Mcart
Mpolar
Lpolar
c33 s ite 1 experiment 1 unit 1 cell #11c30 s ite 3 experiment 3 unit 3 cell #3 l50 site 7 experiment 2 unit 2 cell #36
Lcart
Mcart
Mpolar
Lpolar
Lcart
Mcart
Mpolar
Lpolar
Lcart
Mcart
Mpolar
Lpolar
Lcart
Mcart
Mpolar
Lpolar
c34 site 2 experiment 1 unit 1 cell #24
* * * * * *
***
Fig. 2 Comparison of receptive fields for Cartesian and polar stimulicomputed within two models. (a) Cells with no consistent differencesbetween receptive fields determined from Cartesian or polar basis setsby reverse correlation (L-filters) or MID (M-filters). Lcart: Linear filterderived from reverse correlation of Cartesian responses, Mcart: filterderived from MID analysis of Cartesian responses, Lpolar: linearfilter derived from reverse correlation of polar responses, Mpolar: filterderived from MID analysis of polar responses. Correlation coefficientsof filters determined from the two stimulus contexts (Lcart vs. Lpolar,Mcart vs. Mpolar) were not significantly different from 1. L-filters (fromleft to right): 0.89±0.09, 0.97±0.02, 0.92±0.05 (all p>0.05); M-filters: 0.92±0.07, 0.991±0.009, 0.99±0.01 (all p>0.05). (b) Cellswith context-dependent receptive fields as determined by reversecorrelation (L-filters) and MID (M-filters). Correlation coefficients offilters determined from the two stimulus contexts were all significantly
different from 1 (marked by arrows). L-filters: 0.89±0.03 (p<0.01),0.70±0.10 (p<0.01), 0.73±0.08 (p<0.05); M-filters: 0.70±0.10 (p<0.05), 0.92±0.04 (p<0.05), 0.60±0.10 (p<0.01). (c) Cells withcontext-dependence of receptive fields as determined by reversecorrelation (L-filters) but not by MID (M-filters). Correlationcoefficients of filters determined from the two stimulus contexts weresignificantly different from 1 (marked by arrows) for L-filters: 0.40±0.15, 0.50±0.10, cc=0.91±0.03 (all p<0.01) but not for M-filters:0.91±0.16, 0.98±0.03, 0.90±0.10 (all p>0.05). None of these ninecells had consistent differences between L- and M-filters for eitherCartesian or polar basis sets. Color scale is arbitrary, but is the samefor all of the four filters pertaining to a neuron. For each neuron, thecolor scale covers the range from the minimal to the maximal valueacross the four filters
J Comput Neurosci

It is then natural to ask what linear transformation bestaccounts for differences between the two sets of receptivefields. That is, can we find a transformation of the 36-dimensional space that maps the Cartesian filter shapes intothe corresponding polar filter shapes?
There are many linear transformations that will trans-form one vector (e.g., the filter from Cartesian stimuli for aparticular cell) into a second vector (e.g., the filter for thatcell from polar stimulus set). However, since each cellwithin the population has its own set of filters, the problemof finding a single transformation that works for all cells ishighly constrained. Indeed, since we have more cells (51)than coordinates (36), it would be surprising if a singletransformation would be able to map each cell’s filterobtained from Cartesian stimuli into each cell’s filterobtained from polar stimuli. Since we cannot expect toaccount for all of the variance with a single lineartransformation, instead we seek the linear transformationthat accounts for the largest possible fraction of thevariance. This linear transformation indicates the differ-ences between the Cartesian and polar filters that aresystematic across the population.
This is generally known as the Procrustes problem, oftenencountered in multidimensional scaling (Cox and Cox2000). Because we are interested in how the shapes, not theamplitudes, of receptive fields depend on context, wenormalize filters to unit length, and look for the bestrotation that can transform one set of vectors into anotherwith minimum least square error. Note that the rotations weseek are not literal rotations in space, but abstract rotationswithin the 36-dimensional shape space defined by thestimulus patterns. For example, a rotation might specifythat neurons whose sensitivity profiles had had a largecomponent of the rank-0 (Gaussian) basis function whenstudied with Cartesian stimuli tended to have a largecomponent of the rank-2 target-like basis function whenstudied with polar stimuli.
3.3 No systematic differences between L-filtersand M-filters
As a test of this approach, we first compare receptive fieldsobtained from Cartesian stimuli via reverse correlation(Lcart) and with those obtained from the same stimulus setby MID (Mcart). Since we have already seen that the L-filters and the M-filters were similar (Fig. 2), we expect thatthe best rotation matrix is close to the identity—and this iswhat we found [Fig. 4(a)]. Similarly, the best rotationmatrix that transforms the receptive fields obtained frompolar stimuli via reverse correlation (Lpolar) into thereceptive fields obtained from the same stimulus set byMID (Mpolar) is also close to the identity matrix [Fig. 4(b)].This supports the validity of the approach.
Because the rotation matrices identified by this proce-dure are not precisely the identity, the possibility remainsthat there are systematic differences between the receptivefields determined by the two methods that not evident fromcasual inspection of Fig. 4(a,b). To determine whether thisis the case, we exploit the symmetry of the Hermitefunctions (Fig. 1). Note, for example, that reflection of thecoordinate system across the horizontal axis inverts thepolarity of some stimulus patterns, but leaves otherspreserved. Thus, when a given receptive field shape isrepresented as a vector, the sign assigned to somecoordinates depends on the (arbitrary) choice of whichhorizontal direction is “positive”, while the sign assigned toother coordinates does not have this dependence. Conse-quently, any apparent linear relationship between theinverting and non-inverting coordinates must be due tochance. A similar argument holds for reflection across thevertical axis. Thus, we can restrict the search for rotationsto those that do not violate these parity rules. Thiseliminates rotations that mix basis functions of even andodd ranks, or that mix basis functions in even and oddpositions within ranks (Fig. 1). This procedure has another
<0 0.0 0.1 0.2 0.3 0.4 0.5 0.6 0.7 0.8 0.9 1.00
5
10
15
20
25
(a) (b)
correlation(Lcart;Lpolar )
num
ber
of cells
0.5<0 0.0 0.1 0.2 0.3 0.4 0.6 0.7 0.8 0.9 1.00
5
10
15
20
25
correlation(Mcart; Mpolar)
num
ber
of cells
Fig. 3 Distribution of correlation coefficients between receptive fieldsdetermined from Cartesian and polar stimulus sets. Left Stimulus-dependent changes in filters calculated by reverse correlation, rightstimulus-dependent changes in filters calculated by MID. For bothkinds of models, significant context-dependent changes (correlation
coefficients <1) are prevalent. Cells with no significant changes (p>0.05) are shown in white, those with significant changes in gray (0.01<p<0.05) and black (p<0.01). The abscissa labels indicate the filterswhose profiles are compared. Debiasing (see Methods and Supplemen-tary Material) can result in estimated correlation coefficients <0
J Comput Neurosci

(a) (b)
(d)(c)
(e)original RF
Lcart
Mcart
Mpolar
Lpola
rL
pola
r
Lcart
Mcart
Mpolar
0 1 2 3 4 5 6 70
1
2
3
4
5
6
7
0 1 2 3 4 5 6 70
1
2
3
4
5
6
7
0 1 2 3 4 5 6 70
1
2
3
4
5
6
7
0 1 2 3 4 5 6 70
1
2
3
4
5
6
7
-1.0 -0.5 0 0.5 1.0
Fig. 4 Comparison of receptivefields computed by the twomodels. Panels (a)–(b) pseudo-color display of the rotationmatrix that is the optimal trans-formation between receptivefields estimated by two methods(reverse correlation (L-filters)and MID (M-filters)) from oneset of stimuli. (a) Cartesianstimuli. (b) Polar stimuli. Panels(c) and (d) the same calcula-tions, augmented by adding re-ceptive fields reflected aroundhorizontal and vertical axes(panel e). The heavy lines inpanels (a)–(d) separate theranks, shown increasing from 0to 7. Within each rank, basiselements are ordered from mostcentrally-weighted (middle ofpyramid of Fig. 1, right) to mostperipherally-weighted (edges ofpyramid of Fig. 1, right). Colorscale covers the interval [−1, 1],with green indicating 0, red-brown indicating 1, and blueindicating −1. The matrices areall similar to the identity matrix,indicating close correspondencebetween receptive fields derivedby the two methods
J Comput Neurosci

interpretation [Fig. 4(e)]. It is equivalent to adding cells tothe dataset whose receptive fields are related by mirrorsymmetry to the cells actually recorded. The above analysiscorresponds to assuming that since these added cells havethe same relationship to the center and axes of the stimuli asreal recorded neurons, their responses will be the same.
As seen in Fig. 4(c,d), this refinement increases thesimilarity of the inferred rotation to the identity matrix.Thus, the results of Fig. 2 are not only corroborated, butalso extended: we do not identify any systematic differencebetween the L-filters and the M-filters obtained with thesame stimulus set (i.e., in the same context).
3.4 Context-dependence of a component depends on its sizeand symmetry
A qualitatively different result emerges when we use thisapproach to compare receptive fields measured in different
contexts (Cartesian vs. polar). Comparisons of the L-filtersderived from neural responses to Cartesian and polarstimulus sets are shown in Fig. 5(a), while those based onthe M-filters are shown in Fig. 5(b). Because there istypically some correlation between receptive field profilesderived from Cartesian and polar stimulation, we expectthat a component of the identity matrix will be present. Thisis indeed the case, but it is strongest for low-rankcoefficients, and becomes less pronounced as the rankincreases. Thus, higher-rank components, which have largerspatial extent (Fig. 1), are more subject to systematicstimulus-dependent changes than the lower-rank components.
The deviations of diagonal elements from unity measuresthe size of the systematic change of the correspondingcoordinates. In Fig. 5(e) we plot diagonal elements of thebest rotation matrices derived for L-filters (magenta) and M-filters (blue). In both cases, the amplitude of diagonalelements decreases with rank, indicating increasing devia-
(c) (d)0 1 2 3 4 5 6 7
012
3
4
5
6
7
0 1 2 3 4 5 6 7012
3
4
5
6
7
0 1 2 3 4 5 6 7012
3
4
5
6
7
Mcart
Mpola
r
(b)Lcart
Lpola
r
(a)0 1 2 3 4 5 6 7
012
3
4
5
6
7
rms of diagonal elements
0 2 4 60
0.2
0.4
0.6
0.8
1.0
M-filters
L-filters
rms of diagonal elements
0 2 4 60
0.2
0.4
0.6
0.8
1.0
M-filters
L-filters
(e)
(f)rms of receptive field components
(h)
0 2 4 60
0.1
0.2
0.3
0.4
0.5
Lcart
Mcart
rms of receptive field components
0 2 4 60
0.1
0.2
0.3
0.4
0.5
(g)
Mpolar
Lpolar
-1.0 -0.5 0 0.5 1.0
Lcart
Mcart
Mpola
r
Lpola
r
Fig. 5 Comparison of receptive fields derived from Cartesian andpolar stimuli. Panels (a)–(b) pseudocolor display of the rotation matrixthat is the optimal transformation between a set of receptive fieldsdetermined from responses to the two contexts (Cartesian vs. polar)with either modeling method: L-filters (panel a) or M-filters (panel b).Panels (c) and (d): The same calculations, augmented by addingreceptive fields reflected around the vertical and horizontal axes. Forboth models, rotation matrices show that odd-ranked coefficientschange more between Cartesian and polar stimuli than the even-ranked coefficients. Display details as in Fig. 4. (e) root-mean-square(rms) of rotation matrix diagonal elements at each rank, derived fromL-filters (magenta, based on panel a) and M-filters (blue, based onpanel b). (f) Shows the analogous rms values computed using the
symmetry-augmented datasets, taken from panels (c) and (d). Errorbars in panels (e) and (f) show standard errors of the mean within eachrank. The decrease in the amplitude of diagonal values is stronglynon-monotonic: odd ranks are further from the identity than evenranks, showing that odd ranks have a greater systematic context-dependence than even ranks. Panels (g) and (h) show the overallmagnitude of the receptive field components derived from responsesto Cartesian and polar stimuli. Error bars in panels (g) and (h) showstandard deviations across different cells and components within agiven rank. The difference between even and odd rank receptive fieldcomponents in (e) and (f) is not explained by the difference in theirmagnitude or estimation error, which changes monotonically
J Comput Neurosci

tions from the identity matrix. In other words, the higher therank of the receptive field component, the more it dependson context.
Applying the above symmetry argument removes someof the off-diagonal points of the matrix, but a significantdiscrepancy between the transformation matrix and theidentity persists [Fig. 5(c,d)]. The decrease in amplitude ofthe on-diagonal elements with increasing rank remainsevident [Fig. 5(f)]. Intriguingly, the odd-rank diagonalelements (ranks 3, 5, and 7) are significantly smaller thanthe even-rank elements (ranks 2, 4, and 6). Since theProcrustes matrix, by definition, is orthogonal, thesereductions in the on-diagonal components are accompaniedby nonzero components off the diagonal, in the cor-responding rows and columns. This, in turn, implies thatwhen odd-rank components are present in one context (e.g.,Cartesian), there is a significant tendency for other odd-rank components to be present in the alternative context(e.g., polar). That is, the odd-rank components of thereceptive fields profiles are modified in a systematic wayby context.
No comparable changes are seen in the even-rankcomponents. (For ranks 0 and 1, a comparison is notmeaningful, since Cartesian and polar stimuli are identicalat these ranks.)
These two findings—a decline in the responses on thediagonal as rank increases, and smaller on-diagonal valuesfor odd ranks than even ranks—are present both for theanalysis based on reverse correlation [Fig. 5(c)] and MID[Fig. 5(d)]. The diagonal elements are generally smaller inthe MID analysis [Fig. 5(f)]; this is likely due to greater
uncertainty in determination of the MID receptive fieldprofiles (Supplementary Fig. 3).
There are two ways that the above difference betweenodd and even components can be interpreted: Onepossibility is that only the odd-order components dependon context. The second possibility is that the even-ordercomponents also depend on context, but, this dependence isnot systematic—so that the best prediction for the size of aneven-order component in one context is its size in the othercontext. Our data indicate that the second alternative iscorrect.
To see this, we first examine the difference between theresponses in each of the two contexts, broken down byparity. As Fig. 6(a) shows, there is approximately the sameamount of context-dependent change in the odd- and theeven-order components. However, when we compare theactual responses in the polar context with the responsepredicted by the Procrustes transformation of the Cartesianresponse, we see a significant difference between odd- andeven-order responses. For the even-order responses, virtu-ally none of the context-dependent change is accounted forby the Procrustes transformation [(Fig. 6(b)], while for theodd-order responses, approximately half of the context-dependent change can be accounted for in this fashion[Fig. 6(c)]. After the Procrustes transformation, the meansquare difference per component was significantly smallerfor odd-rank than for even-rank components (p=0.008,Wilcoxon paired test). This was also evident from smallerslopes of the regression line between variance values beforeand after the Procrustes transformation in the case of oddcomponents (0.64) vs. even components (0.86).
0 0.02 0.04 0.06 0.080
0.02
0.04
0.06
0.08
before procrustes
afte
r pr
ocru
stes
even-rank components
0 0.02 0.04 0.06 0.080
0.02
0.04
0.06
0.08
before procrustes
afte
r pr
ocru
stes
odd-rank components
0 0.02 0.04 0.06 0.080
0.02
0.04
0.06
0.08
odd-rank components
even
-ran
k co
mpo
nent
s
before procrustes
(a) (c)(b)
Fig. 6 Analysis of context-dependent changes in receptive fieldsaccording to symmetry. Panel (a) shows the overall context-dependentchange in receptive fields broken down by the parity of the basiselement, and quantified as the mean square difference per basiselement computed between components of L-filters for Cartesian andpolar stimuli. Even and odd-parity components show an equal amountof overall context dependence. Panels (b) and (c) compare the overallcontext-dependent change (abscissa) to the context-dependent change
that is not accounted for by the Procrustes transformation. Comparisonis based on the mean square difference between components of L-filters for polar stimuli and those of L-filters for Cartesian stimuli afterthe Procrustes transformation. For even-parity components (panel b),the Procrustes transformation does not account for a substantialfraction of the variance, but for the odd-parity components (panel c), itaccounts for approximately half of the variance
J Comput Neurosci
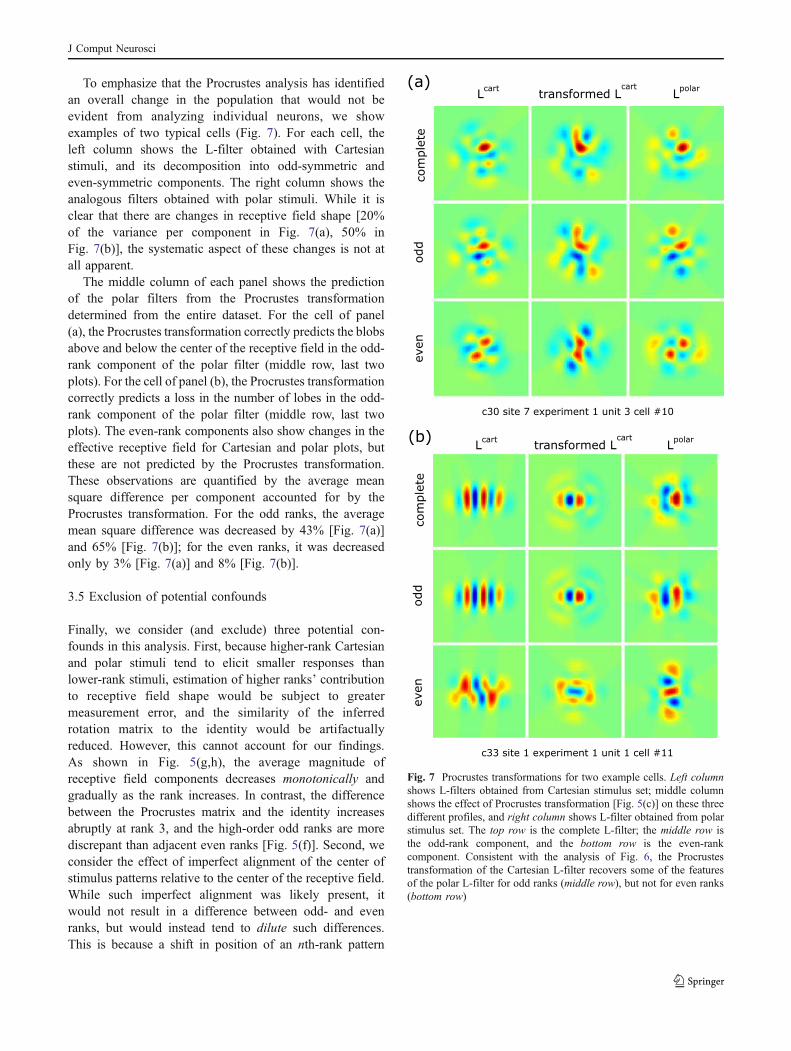
To emphasize that the Procrustes analysis has identifiedan overall change in the population that would not beevident from analyzing individual neurons, we showexamples of two typical cells (Fig. 7). For each cell, theleft column shows the L-filter obtained with Cartesianstimuli, and its decomposition into odd-symmetric andeven-symmetric components. The right column shows theanalogous filters obtained with polar stimuli. While it isclear that there are changes in receptive field shape [20%of the variance per component in Fig. 7(a), 50% inFig. 7(b)], the systematic aspect of these changes is not atall apparent.
The middle column of each panel shows the predictionof the polar filters from the Procrustes transformationdetermined from the entire dataset. For the cell of panel(a), the Procrustes transformation correctly predicts the blobsabove and below the center of the receptive field in the odd-rank component of the polar filter (middle row, last twoplots). For the cell of panel (b), the Procrustes transformationcorrectly predicts a loss in the number of lobes in the odd-rank component of the polar filter (middle row, last twoplots). The even-rank components also show changes in theeffective receptive field for Cartesian and polar plots, butthese are not predicted by the Procrustes transformation.These observations are quantified by the average meansquare difference per component accounted for by theProcrustes transformation. For the odd ranks, the averagemean square difference was decreased by 43% [Fig. 7(a)]and 65% [Fig. 7(b)]; for the even ranks, it was decreasedonly by 3% [Fig. 7(a)] and 8% [Fig. 7(b)].
3.5 Exclusion of potential confounds
Finally, we consider (and exclude) three potential con-founds in this analysis. First, because higher-rank Cartesianand polar stimuli tend to elicit smaller responses thanlower-rank stimuli, estimation of higher ranks’ contributionto receptive field shape would be subject to greatermeasurement error, and the similarity of the inferredrotation matrix to the identity would be artifactuallyreduced. However, this cannot account for our findings.As shown in Fig. 5(g,h), the average magnitude ofreceptive field components decreases monotonically andgradually as the rank increases. In contrast, the differencebetween the Procrustes matrix and the identity increasesabruptly at rank 3, and the high-order odd ranks are morediscrepant than adjacent even ranks [Fig. 5(f)]. Second, weconsider the effect of imperfect alignment of the center ofstimulus patterns relative to the center of the receptive field.While such imperfect alignment was likely present, itwould not result in a difference between odd- and evenranks, but would instead tend to dilute such differences.This is because a shift in position of an nth-rank pattern
Lpolar
Lcart
transformed Lcart
even
odd
(a)
(b)com
ple
tec30 site 7 experiment 1 unit 3 cell #10
even
odd
com
ple
te
Lpolar
Lcart
transformed Lcart
c33 site 1 experiment 1 unit 1 cell #11
Fig. 7 Procrustes transformations for two example cells. Left columnshows L-filters obtained from Cartesian stimulus set; middle columnshows the effect of Procrustes transformation [Fig. 5(c)] on these threedifferent profiles, and right column shows L-filter obtained from polarstimulus set. The top row is the complete L-filter; the middle row isthe odd-rank component, and the bottom row is the even-rankcomponent. Consistent with the analysis of Fig. 6, the Procrustestransformation of the Cartesian L-filter recovers some of the featuresof the polar L-filter for odd ranks (middle row), but not for even ranks(bottom row)
J Comput Neurosci

leads, in a first approximation, to addition of a smallamount of a pattern of rank n+1. Thus, any phenomenonthat would be confined to either even or odd ranks (if allcells were perfectly centered) would spread to the otherparity by misalignment. Thirdly, the fact that odd-rankcomponents show more stimulus-dependent changes is notdue to the dataset extension by symmetry (SupplementaryFig. 4).
3.6 Hypothesis: context-dependence arises from independentlocal perturbations with anti-symmetric profiles
Above we have shown that lability (context-dependence) ofreceptive field components (a) increases with their rank, i.e.spatial extent, and (b) is more systematic for the odd-symmetric components, than for the even-symmetric ones.We now turn to a consideration of possible explanations forthese findings. To begin, we make the general hypothesisthat the observed changes in the receptive field profileoccur as the net result of independent local perturbations atdifferent positions within the receptive field. The overallchange in the receptive field profile is the combined resultfrom all of these separate perturbations. At a circuit level,these local perturbations could correspond to perturbationsaffecting the strength of synapses from neurons that arepresynaptic to the neuron under study, or the intrinsicsensitivities of these presynaptic neurons. (Note we use theterm “perturbation” is to refer to an elementary physiologicprocess that affects the receptive field, but the term“receptive field component” to a basis function used todescribe or measure the receptive field profile.) As we nowshow, the observation that the changes in the odd-symmetric components are more systematic than the evenones has implications both for the spatial profiles of theseperturbations, and their distribution. Our reasoning isqualitative, and relies on an observation concerning theinterpretation of the Procrustes matrix elements. Thisobservation, which is formalized in the Appendix, is asfollows: for a sufficiently diverse set of receptive fields, amatrix element of the Procrustes transformation will deviatefrom the identity if, on average across the population,perturbations of individual neurons’ receptive fields arespatially correlated with their expression of that basiselement.
As a simple example, consider a scenario in whichperturbations are Gaussian blobs placed randomly withinthe receptive field, and of random polarity (ON or OFF).Because of their random nature, they will not be correlatedwith the receptive field. Thus, they will not lead to adeviation of the Procrustes matrix from the identity. Putanother way, although these perturbations might stronglyaffect each cell’s receptive field, there is no systematic wayof predicting how they will change the receptive field from
the Cartesian to the polar context—because they arerandom. So the best prediction of the polar receptive fieldis that it is equal to the Cartesian receptive field, i.e., theProcrustes transformation is the identity.
Now suppose that these Gaussian blobs tend to becentered in the receptive field. We further suppose that thesign of the perturbation is correlated with the sign of thereceptive field at that location—e.g., a localized ON-perturbation tends to lie in an ON-portion of the receptivefield. The even-rank basis elements would in turn tend to becorrelated with these perturbations, since they either peak inthe receptive center or are zero in the receptive field centerbut have adjacent flanks of the same sign. Thus, the even-rank Procrustes matrix elements would be expected todeviate from the identity. The odd-rank receptive fieldcomponents would not be expected to change, because thedot-product of an odd-rank (antisymmetric) componentwith an even-rank (symmetric) perturbation is zero. Asimilar argument holds if the perturbations were some othereven-symmetric profile, such as a circular center-surroundpatch, or an oriented bar with antagonistic flankers, or acosine Gabor. So in the scenario of even-symmetric, centrally-located perturbations, we would expect that only the even-rank receptive field components would change, resulting ineven-rank matrix elements of the Procrustes transformationthat deviate from the identity. This is contrary to ourobservations: we find that both even and odd-rank compo-nents are labile, and it is the odd components, not the evencomponents, that change systematically.
This motivates us to consider a contrasting situation, inwhich the perturbations are odd-symmetric. Examples ofodd-symmetric perturbations include a dyad of adjacent onand off regions, or a sine Gabor, or an idealized simple cellreceptive field. The symmetry argument now implies thatonly the odd rank components will change. Moreover,provided that these perturbations are correlated with thereceptive field profile, the changes will be systematic.The result will be deviations of the odd-rank elements ofthe Procrustes matrix from the identity, as we observe.
In addition to the systematic lability of the odd-rankcomponents, we also need to account for non-systematiclability of the even-rank components [Fig. 6(a)]. There areat least three factors that may contribute to changes in thereceptive field profiles that are not identified as systematicby the Procrustes analysis. First, if the On/Off perturbationsare not perfectly centered, then their effects will “leak” intothe even ranks. Since the sign of the effect will depend onexactly where the perturbations are placed in the receptivefield (i.e., how the lobes of the perturbation line up with thelobes of the basis element), this contribution will not besystematic. A scatter of perturbations throughout thereceptive field would also account for the greater labilityof the higher ranks, compared to the lower ranks. Second, if
J Comput Neurosci

the perturbations themselves have a random even-symmetriccomponent, this will lead to random changes in the even-rank basis elements. And finally, any measurement errorwould contribute to an apparent non-systematic variation ofthe receptive field components. But measurement error canbe no more than the variability of the odd-rank componentsthat is not explained by the Procrustes transformation[Fig. 6(c)].
We sum up the main points of our analysis. First,deviation of the Procrustes matrix from the identity impliesthat the perturbations of the receptive field are correlatedwith specific receptive field components. Second, assumingthat receptive field lability is a consequence of spatiallylocalized perturbations, our observation that primarily theodd-rank elements of the Procrustes matrix deviate from theidentity implies that these local perturbations tend to beodd-symmetric (like On/Off dyads).
4 Discussion
Stimulus-dependent changes in receptive fields have beenobserved in a variety of species and in both auditory (Riekeet al. 1995; Theunissen et al. 2000, 2001; Woolley et al.2006) and visual (Baccus and Meister 2002; Chander andChichilnisky 2001; David et al. 2004; Hosoya et al. 2005;Kim and Rieke 2001; Sharpee et al. 2006) neurons. It isoften difficult to go beyond stating that the receptive fieldsdepend on the stimulus set and to provide a parametricdescription of how receptive fields change between twodifferent stimulus sets. Recent reports point to changes ininhibitory components of visual receptive fields (David etal. 2004), with the strongest effects at low-to-mediumspatial frequencies (Sharpee et al. 2006). However, aunified picture of how neural receptive fields changebetween different stimulus ensembles remains elusive.
4.1 Summary of findings
Here we examine stimulus-dependent changes in V1receptive fields that occur when high-order statisticschange, but first- and second-order statistics (mean lumi-nance, contrast, spatial frequency composition) are heldconstant. We chose to study the effects of high-orderstatistics, since their presence distinguishes natural scenesfrom structureless noise. There are two ingredients in ouranalysis.
First, we used two complementary methods of receptivefield analysis to show that our measures of contextualmodulation did not depend on assumptions made incomputing receptive fields. Consistent results wereobtained with two different models. In one approach, weassumed that the gain function that relates stimulus
components along the receptive field to firing rate wasdescribed as a combination of a linear and full-rectifyingfunction (Victor et al. 2006). In the other approach, we useda nonlinear optimization method of maximally informativedimensions without introducing a parametric description forthe gain function. We found that both approaches producedreceptive fields that were consistent and exhibited similarcontext-dependent changes.
Second, we introduce a new approach to analyzing thesestimulus-dependent changes that seeks to identify consis-tent changes across a neural population. This analysisyields two findings: the lability of receptive field compo-nents increases with their spatial extent, and, perhapsunexpectedly, that odd-symmetric components of thereceptive field (i.e., those that are anti-symmetric withrespect to 180-degree rotation) change in a more consistentmanner across the neural population than even-symmetricones.
4.2 A mechanistic hypothesis
To explain these findings, we suggest a hypothesis based onthe idea that global changes in receptive fields arise as aresult of independent, local perturbations. Arguing primar-ily from symmetry considerations, our observation thatodd-rank components change in a more systematic fashionthan even-rank ones can be explained if we postulate thatthe individual perturbation profiles are predominantly odd-symmetric, such as sine-Gabor profiles or a pair of adjacentOn/Off subregions (Ringach 2004, 2007; Soodak 1987).The difference between odd- and even-rank componentswill depend on many factors, including the degree to whichthe perturbation profiles are clustered at the center of thereceptive field, the extent to which they are purely odd-symmetric, whether their occurrence is correlated with thesensitivity profile of the unperturbed receptive field, and theaccuracy with which the receptive field profiles can bemeasured. Our data are not sufficient to analyze thecontributions of these factors. However, point-like profiles,circularly-symmetric center-surround profiles, cosine Gabors,and random perturbation profiles will not account for ourobservation—since they would predict that even-rank recep-tive field profiles are systematically modified, opposite towhat we observe.
The proposition that a localized profile with a pair ofadjacent On/Off subregions can serve as a unit for receptivefield changes is a natural one, given the known propertiesof cortical circuitry. Recent theoretical models of primaryvisual cortex have shown that On/Off receptive fieldprofiles can arise during development simply as a resultof “haphazard sampling” from the discrete mosaic of retinalganglion cells (RGC; Ringach 2004, 2007; Soodak 1987).This argument works because nearest neighbors in the X-
J Comput Neurosci
cell RGC mosaic tend to be of similar size but opposite sign(Wassle et al. 1981): pooling inputs from a small area in thevisual field is likely to result in two displaced Gaussians ofopposite contrast. This “haphazard sampling” argument canaccount for many known experimental result on thedevelopment of visual cortex (Ringach 2007), includingthe early emergence of simple cells in layer 4 without aprior stage of substantial On/Off overlap and that blockingON-center RGC cells precludes the development oforientation tuning (Chapman and Godecke 2000). Herewe propose that in the adult cortex, the On/Off dyads thatare postulated to underlie orientation tuning also underliecontextual modulation—that is, contextual modulation ofreceptive fields involves adjustments at the level of theoutput of an On/Off dyad, rather than separate adjustmentsof its components.
Our analysis focused on changes in the spatial sensitivityprofile, and used only a specific, highly non-natural, set ofstimuli. But if our hypothesis is correct, then it shouldgeneralize. In particular, we would predict that perturba-tions similar to On/Off dyads, localized in space and time,would account for context-dependence of the temporalstructure of receptive fields (Chander and Chichilnisky2001; Hsu et al. 2004; Sharpee et al. 2006; Smirnakis et al.1997), since these temporal context-dependent changes arelikely governed by the same principles. We would alsopredict that the same proposed mechanism of context-dependent changes could also explain receptive fieldchanges under more natural conditions (David et al. 2004;Sharpee et al. 2006; Theunissen et al. 2000, 2001; Woolleyet al. 2006), for example between natural stimuli andcorrelated Gaussian noise with the same second-orderstructure (Felsen et al. 2005).
4.3 A method for studying receptive field transformations
Our analysis rests on a novel method for studying howreceptive fields change between two conditions. Althoughour two conditions (Cartesian and polar stimulus patches)are defined by highly structured statistics, this is by nomeans a prerequisite for the approach. The approach can beapplied without regard to the nature of the two conditions,which may include a change in the statistics of sensoryinputs, a behavioral manipulation such as modulation ofattention, or even a pharmacologic manipulation. The mainadvantages of this approach are that it (a) does not rely onpreconceived notions of what types of changes may bepresent and (b) can identify patterns that would not beapparent if each receptive field were studied independently.
The main prerequisites of the method are that the sameneurons are studied under both conditions, and that their
receptive fields can be represented as vectors in a finite-dimensional space. Here, we described receptive fields by36-dimensional vectors of weights with respect to Hermitefunctions, but other basis sets could be used, includingspatiotemporal basis functions or Fourier components.Once the basis set is chosen, the receptive fields measuredunder each condition (context) correspond to a set ofvectors, one vector for each neuron. The final, crucial stepis to find a rotation matrix that most closely transforms theset of vectors measured under one set of conditions into theset of vectors measured under the other set of conditions.To do so, we use an algorithm that was first developed incrystallography (Kabsch 1976).
At this stage, it is important that the number of neurons(or receptive-field pairs under the two different conditions)is larger than the number of dimensions in which the besttransformation is sought. Otherwise, the problem ofidentifying the optimal rotation would be underdetermined.
Since we were interested in changes in shape but notoverall sensitivity (which, here, would be absorbed into thenonlinear stage, and was previously analyzed, Victor et al.2006), we did not allow for a dilation following therotation. However, the method can be readily extendedallow for dilations that follow the rotation matrix, or to lookfor general linear transformations between the two sets ofvectors—thus providing an analysis of increases or decreasesin sensitivity.
5 Conclusion
Our analysis of how V1 receptive fields respond to changes inhigher-order stimulus statistics shows that stability of recep-tive field components depends on both their spatial extent andsymmetry properties. Qualitatively, this finding can beexplained by a simple, physiologically plausible mechanismbased on the idea that receptive fields change as a result ofindependent local perturbation events. To account for our data,local perturbation profiles must be predominantly anti-symmetric, e.g., constructed from a pair of adjacent On/Offsubregions. Recent theoretical models of cortical developmentargue that such a profile can result just from local pooling inspace of a small number of RGC cells and is sufficient forseeding the formation of cortical circuits. Perhaps themechanisms based on On/Off pairs that guide the develop-ment of visual cortex continue to shape neural receptive fieldsin the adulthood. Our approach can be used to determinewhether similar mechanisms underlie changes in spatiotem-poral receptive fields, and adaptation to context driven bynatural scene statistics.
J Comput Neurosci
Note added in proof: An analysis of an additional 57 macaque V1neurons showed results comparable to those presented here.
Acknowledgements This research was supported by the Center forTheoretical Biological Physics (NSF PHY-0822283), a grant from theSwartz Foundation and the Mentored Quantitative Career DevelopmentAward MH068904 to TS from NIMH, and EY9314 to JDV. Computingresources were provided by the National Science Foundation throughPartnerships for Advanced Computational Infrastructure at the DistributedTerascale Facility and Terascale Extensions.
Appendix
Relationship between Procrustes matrix and receptive fielddifferences
In order to understand possible mechanisms that mightexplain the observed difference in context-dependentchanges for even- and odd-rank components, we analyzethe relationship between the elements of the Procrustesmatrix and receptive field changes. The Procrustes trans-formation implemented in Figs. 4, 5, 6, 7 determines thebest rotation matrix between the two sets of receptive fieldsobtained in the two stimulus contexts. We will work in theapproximation where changes in the stimulus componentsare small compared to the magnitude of stimulus compo-nents. This approximation implies that the best rotationmatrix will also be close to the best linear transformationthat includes both rotation and scaling, because scalingfactor will be close to 1. This significantly simplifiesanalysis, making the relationship between elements of theProcrustes matrix and changes in receptive field compo-nents more transparent. In this approximation, the elementsCnk of the matrix given by the difference between theProcrustes matrix and the unit matrix can be found byminimizing mean square error:
Xn:i
da ið Þn � Cnka
ið Þk
� �2
where a ið Þk represents the kth component of receptive field of
the ith neuron obtained from the first, for example Cartesian,stimulus set. We denote the difference between receptivefield coefficients for the two stimulus sets by da ið Þ
k , which weassume to be small, so that the sum of identity matrix and Cis nearly orthogonal. The optimal matrix elements Cnk can befound from the following equation:Xk
Cnk a ið Þk a ið Þ
j
D Ei¼ da ið Þ
n a ið Þj
D Ei: ð3Þ
Here all averages are computed across the population ofcells.
If we first assume that receptive fields are sufficientlydiverse so that receptive field components are uncorrelated,the expression for matrix C can be simplified:
Cnk ¼da ið Þ
n a ið Þk
D Ei
a ið Þ2k
D Ei
: ð4Þ
Thus, for small context dependent changes da ið Þk in
receptive fields, the deviations of the Procrustes matrixfrom the unit matrix are determined the average productbetween kth receptive field components and the change inthe nth receptive field component, normalized by theaverage magnitude of kth component across all receptivefields. The assumption of uncorrelation is clearly a strongone, but a weaker assumption—namely, that there are nocorrelations between even and odd components see[Fig. 4(e)]—suffices to support the analysis in the maintext. That is, Eq. (3) shows that odd-parity elements of theProcrustes matrix imply correlations of the perturbationswith odd-order basis elements.
References
Baccus, S. A., &Meister, M. (2002). Fast and slow contrast adaptation inretinal circuitry. Neuron, 36, 909–919. doi:10.1016/S0896-6273(02)01050-4.
Bonds, A. B. (1989). Role of inhibition in the specification oforientation selectivity of cells in the cat striate cortex. VisualNeuroscience, 2, 41–55.
Carandini, M., Heeger, D. J., & Movshon, J. A. (1997). Linearity andnormalization in simple cells of the macaque primary visualcortex. The Journal of Neuroscience, 17, 8621–8644.
Carandini, M., Heeger, D. J., & Senn, W. (2002). A synapticexplanation of suppression in visual cortex. The Journal ofNeuroscience, 22, 10053–10065.
Chander, D., & Chichilnisky, E. J. (2001). Adaptation to temporalcontrast in primate and salamander retina. The Journal ofNeuroscience, 21, 9904–9916.
Chapman, B., & Godecke, I. (2000). Cortical cell orientation selectivityfails to develop in the absence of ON-center retinal ganglion cellactivity. The Journal of Neuroscience, 20, 1922–1930.
Cox, T. F., & Cox, M. A. A.(2000). Multidimensional scaling, Secondedn: Chapman and Hall).
Das, A., & Gilbert, C. D. (1999). Topography of contextualmodulations mediated by short-range interactions in primaryvisual cortex. Nature, 399, 655–661. doi:10.1038/21371.
David, S. V., Vinje, W. E., & Gallant, J. L. (2004). Natural stimulusstatistics alter the receptive field structure of V1 neurons. The Journalof Neuroscience, 24, 6991–7006. doi:10.1523/JNEUROSCI.1422-04.2004.
de Boer, E., & Kuyper, P. (1968). Triggered correlation. IEEETransactions on Bio-Medical Engineering, 15, 169–179.doi:10.1109/TBME.1968.4502561.
De Valois, R. L., Albrecht, D. G., & Thorell, L. G. (1982a). Spatialfrequency selectivity of cells in macaque visual cortex. VisionResearch, 22, 545–559. doi:10.1016/0042-6989(82)90113-4.
J Comput Neurosci

De Valois, R. L., & Thorell, L. G. (1988). Spatial vision. New York:Oxford University Press.
De Valois, R. L., Yund, E. W., & Helper, N. (1982b). The orientationand direction selectivity of cells in macaque visual cortex. VisionResearch, 22, 531–544. doi:10.1016/0042-6989(82)90112-2.
Efron, B., & Tibshirani, R. J. (1998). An introduction to the bootstrap.London: Chapman and Hall/CRC.
Felsen, G., Touryan, J., Han, F., & Dan, Y. (2005). Cortical sensitivityto visual features in natural scenes. PLoS Biology, 3, e342.doi:10.1371/journal.pbio.0030342.
Freeman, T. C., Durand, S., Kiper, D. C., & Carandini, M. (2002).Suppression without inhibition in visual cortex. Neuron, 35, 759–771. doi:10.1016/S0896-6273(02)00819-X.
Heeger, D. J. (1992). Normalization of cell responses in cat striatecortex. Visual Neuroscience, 9, 181–198.
Hosoya, T., Baccus, S. A., & Meister, M. (2005). Dynamic predictivecoding by the retina. Nature, 436, 71–77. doi:10.1038/nature03689.
Hsu, A., Woolley, S. M., Fremouw, T. E., & Theunissen, F. E. (2004).Modulation power and phase spectrum of natural sounds enhanceneural encoding performed by single auditory neurons. The Journalof Neuroscience, 24, 9201–9211. doi:10.1523/JNEUROSCI.2449-04.2004.
Hubel, D. H., & Wiesel, T. N. (1959). Receptive fields of singleneurons in the cat's striate cortex. The Journal of Physiology,148, 574–591.
Hubel, D. H., & Wiesel, T. N. (1968). Receptive fields and functionalarchitecture of monkey striate cortex. The Journal of Physiology,195, 215–243.
Kabsch, W. (1976). A solution for the best rotation to relate two setsof vectors. Acta Crystallographica. Section A, 32, 922–923.doi:10.1107/S0567739476001873.
Kim, K. J., & Rieke, F. (2001). Temporal contrast adaptation in theinput and output signals of salamander retinal ganglion cells. TheJournal of Neuroscience, 21, 287–299.
Meister, M., & Berry, M. J. (1999). The neural code of the retina.Neuron, 22, 435–450. doi:10.1016/S0896-6273(00)80700-X.
Morrone, M. C., & Burr, D. C. (1988). Feature detection in humanvision: a phase-dependent energy model. Proceedings of the RoyalSociety of London—Series B: Biological Sciences, 235, 221–245.
Ohzawa, I., Sclar, G., & Freeman, R. D. (1985). Contrast gain control inthe cat's visual system. Journal of Neurophysiology, 54, 651–667.
Oppenheim, A. V., & Lim, J. S. (1981). The importance of phase insignals. Proceedings of the IEEE, 69, 529–541.
Priebe, N. J., & Ferster, D. (2006). Mechanisms underlying cross-orientation suppression in cat visual cortex. Nature Neuroscience,9, 552–561. doi:10.1038/nn1660.
Reich, D. S. (2001) PhD Thesis: Information encoding by individualneurons and groups of neurons in primary visual cortex, TheRockefeller University, New York.
Rieke, F., Bodnar, D. A., & Bialek, W. (1995). Naturalistic stimuliincrease the rate and efficiency of information transmission byprimary auditory afferents. Proceedings of the Royal Society ofLondon—Series B: Biological Sciences, 262, 259–265.doi:10.1098/rspb.1995.0204.
Ringach, D. L. (2004). Haphazard wiring of simple receptive fields andorientation columns in visual cortex. Journal of Neurophysiology,92, 468–476. doi:10.1152/jn.01202.2003.
Ringach, D. L. (2007). On the origin of the functional architecture of thecortex. PLoS ONE, 2, e251. doi:10.1371/journal.pone.0000251.
Ruderman, D. L., & Bialek, W. (1994). Statistics of natural images:Scaling in the woods. Physical Review Letters, 73, 814–817.doi:10.1103/PhysRevLett.73.814.
Schwartz, O., Pillow, J. W., Rust, N. C., & Simoncelli, E. P. (2006).Spike-triggered neural characterization. Journal of Vision(Charlottesville, Va.), 6, 484–507. doi:10.1167/6.4.13.
Shapley, R. M., & Victor, J. D. (1978). The effect of contrast on thetransfer properties of cat retinal ganglion cells. The Journal ofPhysiology, 285, 275–298.
Sharpee, T., Rust, N. C., &Bialek,W. (2004). Analyzing neural responsesto natural signals: maximally informative dimensions. NeuralComputation, 16, 223–250. doi:10.1162/089976604322742010.
Sharpee, T. O., Sugihara, H., Kurgansky, A. V., Rebrik, S. P., Stryker,M. P., & Miller, K. D. (2006). Adaptive filtering enhancesinformation transmission in visual cortex. Nature, 439, 936–942.doi:10.1038/nature04519.
Simoncelli, E. P., & Olshausen, B. A. (2001). Natural image statisticsand neural representation. Annual Review of Neuroscience, 24,1193–1216. doi:10.1146/annurev.neuro.24.1.1193.
Smirnakis, S. M., Berry, M. J., Warland, D. K., Bialek, W., & Meister,M. (1997). Adaptation of retinal processing to image contrast andspatial scale. Nature, 386, 69–73. doi:10.1038/386069a0.
Soodak, R. E. (1987). The retinal ganglion cell mosaic definesorientation columns in striate cortex. Proceedings of the NationalAcademy of Sciences of the United States of America, 84, 3936–3940. doi:10.1073/pnas.84.11.3936.
Theunissen, F. E., David, S. V., Singh, N. C., Hsu, A., Vinje, W. E., &Gallant, J. L. (2001). Estimating spatio-temporal receptive fieldsof auditory and visual neurons from their responses to naturalstimuli. Network, 12, 289–316.
Theunissen, F. E., Sen, K., & Doupe, A. J. (2000). Spectral–temporal receptive fields of nonlinear auditory neurons obtainedusing natural sounds. The Journal of Neuroscience, 20, 2315–2331.
Victor, J., & Shapley, R. (1980). A method of nonlinear analysis in thefrequency domain. Biophysical Journal, 29, 459–483.
Victor, J. D., Mechler, F., Repucci, M. A., Purpura, K. P., & Sharpee,T. (2006). Responses of V1 neurons to two-dimensional hermitefunctions. Journal of Neurophysiology, 95, 379–400.doi:10.1152/jn.00498.2005.
Vinje, W. E., & Gallant, J. L. (2000). Sparse coding and decorrelationin primary visual cortex during natural vision. Science, 287,1273–1276. doi:10.1126/science.287.5456.1273.
Vinje, W. E., & Gallant, J. L. (2002). Natural stimulation of thenonclassical receptive field increases information transmissionefficiency in V1. The Journal of Neuroscience, 22, 2904–2915.
Wassle, H., Boycott, B. B., & Illing, R. B. (1981). Morphology andmosaic of on- and off-beta cells in the cat retina and somefunctional considerations. Proceedings of the Royal Society ofLondon—Series B: Biological Sciences, 212, 177–195.
Woolley, S. M., Gill, P. R., & Theunissen, F. E. (2006). Stimulus-dependent auditory tuning results in synchronous populationcoding of vocalizations in the songbird midbrain. The Journal ofNeuroscience, 26, 2499–2512. doi:10.1523/JNEUROSCI.3731-05.2006.
J Comput Neurosci