contents certificate - prudential bsn takaful independent auditors’ report dear certificate ... of...
TRANSCRIPT


Contents2 CEO’s Message
5 Fund Objectives
6 Investment Review
13 Fund Performance
14 Investment Outlook
17 Financial Highlights
29 Statement of Assets and Liabilities
33 Statement of Changes in Net Asset Value
37 Statement of Income & Expenditure
41 Notes to the Accounts
44 Statement by Directors
45 Independent Auditors’ Report
Dear Certificate Holders,We have the pleasure in presenting to you the Takafulink Funds Report 2015 of Prudential BSN Takaful Berhad. This report is also available on our website at www.prubsn.com.my.


2 Takafulink Funds Report 2015
CEO’S MESSAGE
It is my pleasure and privilege to serve as the new CEO of the company and have this opportunity to share with you the latest edition of our Takafulink Funds Report. I am privileged to lead the country’s best Family Takaful Operator whose shareholders are fully committed in ensuring financial security is made accessible to all Malaysians and their families. I hope this report will be a useful guide as you plan for your long-term financial needs and goals.
The global market proved to be a challenging one in 2015 as global equities were impacted by both growth and policy uncertainty in key economies. Malaysia was not spared from the impact of political and economic instability which led to a sharp decline in the Malaysian Ringgit. Despite these external headwinds, Malaysia’s economy is expected between 4.5% to 5.5% in 2015 and 4.0% to 5.0% in 2016. Overall, we maintain a cautiously optimistic outlook on the market for 2016.
Dear valued investors,

3Takafulink Funds Report 2015
CEO’S MESSAGE
2015 was certainly an eventful year for us at PruBSN. We have delivered New Business growth on an Annual Contribution Equivalent (ACE)1 basis by 25.7% year-on-year to reach a record RM427.7 million and a market share of 36.8%2 as at 31 December 2015. This means we are still the Number One Family Takaful Operator in the country and we have retained the top spot for five consecutive years. We are also very pleased with our funds’ performance. In a comparison made by Lipper IM3
against peers in the industry, one of our flagship funds Takafulink Dana Urus, ranked first with a 46.1% return over a five-year period. You will find the full details of our fund performance in the following pages of this report.
We rolled out various initiatives and added market leading solutions to our impressive portfolio last year. We have introduced yet another innovative plan, PruBSN Platinum, providing greater savings through cash payouts, protection and investment opportunities which respond to the growing financial and protection needs of Malaysians today. We also developed a family bancatakaful plan, Giro Takaful Premier, which
introduces a new dimension into investment-linked propositions to offer comprehensive savings and protection features, flexibility and greater returns for our certificate holders. We followed this up with our new claims processing platform and our online-based agents recruitment tool called E-Smart Biz, which are both reflective of our efforts to harness technology in a way that can genuinely benefit our customers.
In August 2015, we successfully launched our non-profit charity conduit PruBSN Prihatin, which brings our community initiatives to a new strategic alignment and focus to maximise the impact of our efforts across Malaysia. PruBSN Prihatin aims to deliver economic and social benefits for the local communities by providing basic living needs, education continuity, health protection, disaster relief and environment preservation.
PruBSN was also part of Prudential’s regional effort in the post-disaster Relief & Rebuilding Mission where we build 14 homes within only a month for the community of Kampung Serasa in Dabong, Kelantan who were severely affected by the East Coast flood in 2014. As a further sign of our relentless determination, PruBSN is
1Annual Premium Equivalent (APE) or Annual Contribution Equivalent (ACE) is a global and widely accepted standard for measurement of new business performance of insurance and takaful companies. APE or ACE is the total amount of regular premiums from new business plus (+) 10% of the total amount of single premium on business written during the year.
2Source: Insurance Services Malaysia3Lipper IM is a Thomson Reuters company and a global leader dedicated to supplying mutual fund information, analytical tools and commentary that are widely recognised as the industry standard. Data retrieved on 7 January 2016.

4 Takafulink Funds Report 2015
now listed in the Malaysia Book of Records for its record breaking Longest Coastal Cleaning effort. With the help of 350 PruBSN volunteers, we surpassed the initial target distance, covering 33km in under 3 hours.
Our increasing focus and the disciplined execution of our core strategies have also seen us recognised locally and internationally. Last year we were awarded the Best Takaful Institution by The Asset Research & Publishing (Hong Kong), Best Takaful Provider by Islamic Finance News (Malaysia), Best Takaful Operator for Agency Family Takaful Business and Best Corporate Social Responsibility by the Malaysian Takaful Association, as well as Best Companies to Work for in Asia by HR Asia (Malaysia).
This year is especially exciting as we celebrate our 10th anniversary in the business of protecting the financial future of Malaysians. In tandem with this commemoration, we will be running a number of campaigns so do keep an eye out for these during the year.
I would like to end this note with my deepest appreciation for your loyalty and continued patronage in PruBSN. It is our commitment to continue doing more to improve our services to you. I wish you every success in 2016!
To find out more about our offerings, please go to prubsn.com.my or you may reach out to us at 03 2053 7188 or [email protected]. For more of PruBSN events and happenings, follow us on Facebook, Linkedin and YouTube.
With my very best wishes,
Aman ChowlaChief Executive OfficerPrudential BSN Takaful
CEO’S MESSAGE

5Takafulink Funds Report 2015
The Takafulink Dana Ekuiti Fund aims to maximise returns over medium-to-long term by investing in high quality Shariah-compliant equities listed on Bursa Malaysia.
The Takafulink Dana Bon Fund aims to provide medium-to-long term accumulation of capital by investing in selected sukuk and Islamic money market instruments.
The Takafulink Dana Urus Fund seeks to maximise returns over medium-to-long term by investing in Shariah-compliant equities, sukuk and Islamic money market instruments through Takafulink Dana Ekuiti and Takafulink Dana Bon, and in any other such Takafulink funds that may become available in the future.
The Takafulink Dana Ekuiti Dinasti Fund aims to provide long-term capital appreciation by investing in Shariah-compliant investments with exposure to the Greater China region.
FUND OBJECTIVES

6 Takafulink Funds Report 2015
INVESTMENT REVIEW
Equity Market
1Q2015 started off on a positive note regionally, with oil prices stabilising; however, Malaysian equity markets suffered from a sharp correction, on fears of what lower oil prices could potentially mean for the country’s fiscal deficit. The Malaysian government announced a revised 2015 Budget in light of the sharply lower oil prices and the weaker Malaysian Ringgit (MYR) against the US Dollar (USD). The 2015 fiscal deficit target was revised to 3.2% of Gross Domestic Product (GDP) from 3.0%, with no cut in development expenditure. Malaysian corporate earnings released during the quarter were generally in-line with market expectations. Malaysia ended 1Q2015 on a higher note, as crude oil prices trended up for most of the quarter.
2Q2015 continued its positive trend as China and Hong Kong equity markets rallied on the back of the commencement of the Shanghai-Hong Kong Connect, and the People’s Bank of China’s move to lower the reserve requirement ratio for all banks by 100 basis points. However global markets tumbled by end of 2Q2015 on United States (US) growth concerns, amid concerns over a possible “Grexit”. Domestically, the FTSE Bursa Malaysia KLCI (FBMKLCI) corrected below the 1,700 points psychological support
temporarily on the back of weak corporate results, heightened political concerns, the fear of a Fitch Ratings downgrade, and weak MYR. Big cap utility company, Tenaga Berhad was under selling pressure during the quarter, on speculation of Tenaga Berhad taking over 1Malaysia Development Berhad’s (1MDB) power assets. However, 2Q2015 closed with some unexpected good news as Fitch Ratings affirmed Malaysia’s long-term foreign currency Issuer Default Rating at “A-“ and upgraded the outlook to “Stable” from “Negative”.
3Q2015 started off on fairly firm footing following a resolution to the Greek crisis. However global equity markets corrected sharply mid-3Q2015 amid concerns over China’s weak economic growth, the Renminbi (RMB) devaluation, tepid global growth, weak commodity prices, and fears of a US Federal interest rate lift-off. Emerging market currencies were much weaker during the quarter, and were further exacerbated by the surprising RMB devaluation in August. Some stability returned to global equity markets by the end of the quarter after the US decided to hold rates steady. The FBMKLCI corrected sharply during the quarter as investors reacted to a confluence of negative factors such as the continued international media reports on 1MDB, increased political uncertainty, weak

7Takafulink Funds Report 2015
INVESTMENT REVIEW
crude oil prices, weak corporate earnings reporting, threat of US rate hikes, the sudden RMB devaluation, and the sharply lower MYR. The MYR depreciated by 16.5% quarter-on-quarter (q-o-q) against the USD to end the 3Q2015 at RM4.395/USD, levels not seen in more than 17 years since the Asian Financial Crisis of 1998. Towards the end of 3Q2015, the FBMKLCI rebounded on the announcement of economic measures by the government which included aims to shore up domestic investments by encouraging government linked companies to repatriate their overseas investments and re-invest locally, and the reactivation of the government equity investment firm ValueCap with an injection of RM20bil, to boost the stock market.
4Q2015 started off on a positive note with global equities rallying on signs of China’s economy stabilising, better US corporates’ earnings results and resilient economic data from the Eurozone. The International Monetary Fund’s (IMF) board announced that the RMB has been officially approved for inclusion in the Special Drawing Rights (SDR) effective 1 Oct 2016. Post the last meeting for the year, the US Federal Open Market Committee (FOMC) announced the long awaited lift-off, with the FOMC unanimously voting to increase the target range for the Fed Funds rate by 25bps
(to 0.25%-0.5%). In Malaysia the 2016 budgeted fiscal deficit was revised to 3.1%, only slightly lower than 2015 fiscal deficit of 3.2%, on the back of better than expected GST revenue collection amid declining investment income from Petronas. Investor sentiment improved with the announcement that 1MDB would sell its power assets under Edra Global Energy Bhd to unlisted China General Nuclear Power Corporation (CGN) for RM9.83bil. However, towards the end of the quarter, the Malaysian equity market corrected amid concerns of the sharply lower crude oil prices and the weaker China economy.
The FBM Emas Shariah (FBMS) Index closed the year under review at 12,800.65 points, up 2.35%. The broader FBM Emas (FBMEMAS) Index closed the period under review lower by 2.26%. The MSCI Asia Pacific ex-Japan Index declined by 11.97% in USD terms1.
1Source: Bloomberg: World indices

8 Takafulink Funds Report 2015
INVESTMENT REVIEW
Sukuk Market
Bank Negara Malaysia (BNM) maintained the Overnight Policy Rate (OPR) at 3.25% throughout the period under review. At the Monetary Policy Committee (MPC) meeting on 7 May 2015, BNM took note of the Goods and Services Tax (GST) which was implemented starting 1 April 2015. BNM expected that the GST would moderate private consumption but its effects would be mitigated by a steady rise in incomes and employment. Capital spending in export industries, services and infrastructure was expected to cushion the impact of likely lower oil and gas investment following the collapse in crude oil prices in 4Q2014.
At the MPC meeting on 11 September 2015, BNM stated that downside risks on growth had risen on greater global and domestic uncertainty, but Malaysia possessed diversified sources of growth, low unemployment, manageable external indebtedness and a well capitalised banking system. It also noted continued weakness in the ringgit, which has depreciated from RM3.50 to the US Dollar (USD) on 31 December 2014 to RM4.33 by 10 September 2015. However, BNM stated that it expected the currency to reflect underlying economic fundamentals when external and domestic uncertainties receded.
At the MPC meeting on 5 November 2015, BNM noted that the Malaysian economy was affected by the weak external environment. Domestic demand was the main driver of growth but private consumption was expected to moderate on the higher cost of living. Nevertheless, household spending was to be supported by wage growth and stable market conditions. The MPC stated that monetary policy remained accommodative but it continued to monitor heightened global economic and financial risks and their impact to the Malaysian economy.
Headline inflation eased from 2.7% year-on-year (y-o-y) in December 2014 to 2.6% y-o-y in November 2015. The drop was mainly driven by a fall in non-food inflation, which fell from 2.8% y-o-y in December 2014 to 1.9% y-o-y in November 2015. Among the components of non-food inflation, transport inflation stood out, plunging to -5.2% in November 2015 from 4.0% y-o-y in December 2014 on lower fuel prices. Food and non-alcoholic beverages inflation jumped from 2.4% y-o-y in December 2014 to 4.1% y-o-y in November 2015.
In his budget speech in October, the Prime Minister highlighted the likelihood of lower oil related government revenue due to the slump in oil prices. He said that the government’s oil related earnings were

9Takafulink Funds Report 2015
INVESTMENT REVIEW
estimated at RM62bil at a crude oil price of USD100 per barrel, and it would fall to RM32bil in 2016 on lower oil prices. Tighter government finances could affect perception of Malaysia’s sovereign credit quality. On 11 January 2016, Moody’s cut Malaysia’s rating outlook to stable from positive, citing changes in the external environment that have affected government revenue.
On 31 December 2015, 1Malaysia Development Berhad (1MDB) announced that it would sell a 60% stake in its Bandar Malaysia development project to a joint venture between Iskandar Waterfront Holdings and China Railway Construction Corp. The development was the latest step in the company’s rationalisation program to address the financial challenges imposed by the company’s debt of some RM 42 billion. Newsflows over 1MDB’s financial challenges had affected market sentiment in 2015, and further positive developments would be viewed favourably by investors.
For the period under review, the 3-year, 5-year and 10-year sovereign sukuk yields changed by -32bps, -13bps and +31bps to 3.35%, 3.85% and 4.52% respectively. In 1Q2015, Malaysian Government Securities (MGS) yields drifted lower after the sharp spike in December 2014 on the plunge in the price of crude oil and ringgit during that month. MGS yields spiked sharply in August 2015 on the falling price of crude oil, further depreciation in the ringgit and China’s currency devaluation. Shorter tenor MGS yields recovered towards the end of the year on the Federal Reserve’s long awaited rate hike which ended months of uncertainty, progress made by 1MDB on addressing the financial difficulties posed by its debt burden and increasing foreign holdings of MGS.
Corporate sukuk yields generally moved in tandem with sovereign sukuk yields, albeit at a lag. Activities in the corporate sukuk market were supported by ample liquidity and a stable credit environment.

10 Takafulink Funds Report 2015
INVESTMENT REVIEW
On the supply front, total outstanding Malaysian Ringgit (MYR) issuances at the end of December 2015 stood at about RM1,126bil, of which approximately 46% was conventional and 54% was Islamic. The proportion of corporate sukuk in the sukuk universe was higher at about 38% compared to the proportion of corporate bonds in the conventional bonds universe of about 26%. Major primary issuances were from the power, banking and government guaranteed sectors. Major issuances included RM8.98bil from Jimah East Power, RM6.6bil from Danainfra Nasional and RM3.9bil from Prasarana.
Asia-Pacific ex-Japan Markets
MSCI AC Asia Pacific ex Japan markets closed -9.1% in 2015 as all major Asian markets suffered losses. The year started brightly on the back of some positive corporate earnings and hopes of additional monetary stimulus from major central banks. Chinese equities also advanced as authorities eased monetary policy and encouraged stock buying in the first half of the year. Sentiment turned sharply in the second half as the sustained commodity rout threatened the growth and fiscal health of many emerging economies. The unexpected devaluation of the Renminbi (RMB) sparked a global selloff as serious concerns emerged over growth outlooks and the potential for competitive
devaluations across emerging markets amid a looming rate hike in the US. Market interventions by the Chinese government to prop up its equity markets only compounded the level of risk aversion. The fourth quarter brought some relief as strong US economic data convinced the Federal Reserve to raise rates while other central banks generally maintained accommodative policies.
A key theme for 2015 is the increasingly tight linkage between China and global financial markets. China’s slackening demand for key commodities sent prices to multi-year lows, hurting growth and corporate outlooks across the region. Consequently, many parts of region experienced sharp contractions in external trade and disinflationary pressures which further hampered growth.
Malaysia and Thailand were the worst performers for the year. Political uncertainty impacted confidence in Malaysia despite robust economic performance, leading to a sharp decline of the Ringgit that was exacerbated by crude oil’s rout. In Thailand, political constraints continue to hinder a sustained economic recovery as elections were postponed until at least 2017. The lack of political clarity has damaged business confidence in the country and blunted the impact of aggressive interest rate cuts by the Bank of Thailand.

11Takafulink Funds Report 2015
INVESTMENT REVIEW
Hong Kong markets outperformed its peers in USD terms, largely due to its currency peg to the greenback as regional currencies faltered. India also outperformed in 2015 as the acceleration of reforms across tax, labour and land sectors, as well as corporate and banking sector reforms, should ensure that its strong growth trajectory remains sustainable going forward.
Global Market
2015 proved to be an eventful year for global markets. The MSCI AC World index declined by more than 4% in USD terms as equities were roiled by both growth and policy uncertainties in key economies. Equities opened the year up with US markets reaching record highs in the first quarter but quickly lost steam as an anti-austerity government came into power in Greece, US corporate earnings disappointed and economic weakness in emerging economies became more apparent. These compounded anxiety and confusion over the US Federal Reserve’s policy stance which caused episodic selloffs and major currency and rates movements.
Much of the year’s volatility could be attributed to three main events. First, global markets struggled to digest the impact of the impending monetary policy divergence. The Fed went ahead with a rate hike just
before the year ended. Concurrently, the European Central Bank and Bank of Japan pledged to ease policies further if required. Although the USD gained significantly against the EUR, the JPY held its own due to strong haven demand in the second half of the year. Built-in expectations over the Fed’s move also had a profound impact on emerging market currencies throughout the year as capital outflows intensified on USD-denominated debt concerns. In Asia, the Malaysian Ringgit and Indonesian Rupiah were amongst the worst performers while key BRIC members Brazil and Russia also saw their currency depreciates significantly against the USD.
Second, the Chinese economy continued its slowdown as the government intensified reforms to reduce overinvestment and graft, while transiting the economy towards a more service-oriented structure. China’s clampdown on margin trading and its surprise devaluation of the RMB in the third quarter caused a massive spike in risk aversion. This led to a selloff in global equities as investors questioned the true extent of China’s slowdown and the possibility of competitive currency devaluations across emerging markets. Botched market interventions to stem equity market losses such as selling restrictions only exacerbated the panic.

12 Takafulink Funds Report 2015
INVESTMENT REVIEW
Third, commodities across the board plunged to multi-year lows on oversupply and weakening demand from China, driving losses across asset classes in commodity-reliant economies such as Australia and Malaysia. Oil prices ended the year at a decade-low as OPEC embarked on a price war to maintain its market share amid increasing competition from North American shale producers. Depressed oil prices decimated the balance sheets of energy companies and forced them to cut back on capital expenditure, as well as generating turmoil in the US high yield bond market.
Fixed income performance for the year was subdued as well. US and Japan government bonds eked out small gains for the year. Broad weakness in Asian currencies against the USD managed to outweigh gains in the local bond markets, resulting in an overall decline in USD terms. This weakness was due to a combination of a firmer US dollar, expectations for higher US rates, and weaker EM growth especially out of China. Global investment grade bonds1 lost almost 4% while US high yield2 was the worst performer, declining around 5%.
On the equity front, Japan outperformed in both USD and LCY terms for the year as corporate profits surprised positively alongside an economy which appears to be on firmer footing. Emerging markets equities suffered steep losses as investors sought safe havens. The MSCI Latin America index retreated around 30% for the year with Brazil, Chile and Colombia responsible for the largest declines. Emerging Asia was not spared as political and economic uncertainties coalesced in Thailand and Malaysia to head losses.
1Barclays Global Aggregate-Corporates2US HY: BofA/Merrill Lynch US HY Constrained

13Takafulink Funds Report 2015
FUND PERFORMANCE
Takafulink Dana Ekuiti
As at 31 December 2015, the Fund’s Net Asset Value per unit appreciated by 5.11% to RM2.1792 as compared to RM2.0732 as at 31 December 2014.
Since inception (1 December 2006), the Fund registered a positive return of 117.76%.
Takafulink Dana Bon
As at 31 December 2015, the Fund’s Net Asset Value per unit increased to RM1.4008 from RM1.3531 as at 31 December 2014, recording a return of 3.53% for the period under review.
Since inception (1 December 2006), the Fund registered a positive return of 40.04%.
Takafulink Dana Urus
As at 31 December 2015, the Net Asset Value per unit of the Takafulink Dana Urus was RM1.9938 compared to RM1.9028 as at 31 December 2014, recording a return of 4.78% for the period under review.
Since inception (1 December 2006), the Fund registered a positive return of 99.25%.
Takafulink Dana Ekuiti Dinasti
As at 31 December 2015, the Fund’s Net Asset Value per unit appreciated by 18.53% to RM1.4509 as compared to RM1.2241 as at 31 December 2014.
Since inception (5 April 2010), the Fund registered a positive return of 45.09%.

14 Takafulink Funds Report 2015
INVESTMENT OUTLOOK
Equity Market
We are expecting global monetary policy to remain in focus in 2016, and markets are likely to remain volatile with investors second guessing the timing of policy events as they did for most of 2015. With consensus expecting a gradual pace for the United States (US) rate hike for 2016, and firming US economy, the US Dollar (USD) should remain relatively strong, putting pressure on emerging market currencies. China’s weaker economic data will remain a concern. Commodity prices, in particular oil, are also expected to remain weak, as demand will take a while to catch up with the growing supply, given moderate global economic growth outlook, unless geo-political tensions escalate or severe weather disruptions create supply shocks.
On a macro level for Malaysia, we are relatively cautious as we expect a challenging environment for the Malaysian economy in 2016. Lower oil prices for a longer period will increase the risk of the government achieving their fiscal targets for 2016 and 2017, despite the lower reliance on oil related revenues. The Malaysian Ringgit (MYR) is also likely to remain relatively weak putting pressure on imported inflation, and adding to the increasing costs of living concerns the average Malaysian is facing now. The MYR could face further downward pressure if the Chinese Renminbi (RMB) continues to weaken against the USD. Corporate earnings forecasts for 2016 appear too optimistic with consensus expecting earnings to grow by 7.4% year-on-year (y-o-y), despite weaker consumer demand, increased risk of
rising non-performing loans, ongoing price pressures, potential profit margin and cash flow squeeze. The event risk that we are foreseeing for Malaysia in 1Q2016, is the handling of the succession of the Bank Negara Governor, who is due to retire in April 2016, from her post which she held for 16 years.
Despite the lack of macro catalysts, any correction in the market would serve as an opportunity to accumulate fundamentally strong stocks on weakness.
Sukuk Market
In its November monetary policy statement, Bank Negara Malaysia (BNM) stated that Malaysia’s economic growth should remain in the region of 4.5%-5.5% in 2015 and 4.0%-5.0% in 2016. For 2016, headline inflation is expected to peak in the first quarter and moderate thereafter on the base effect resulting from the GST, which came into force on 1 April 2015. With a manageable inflation outlook, we expect BNM to hold the Overnight Policy Rate (OPR) at 3.25% in 1H2016.
The revised budget deficit target of 3.2% of Gross Domestic Product (GDP) for 2015 is expected to be met. Moving into 2016, the budget deficit is expected to narrow further to 3.1% of GDP. The budget deficit trend is in line with the Government’s plan to achieve a budget within 0.6%-1.0% of GDP by 2020. As the path of fiscal consolidation appears intact, Budget 2016 was likely to be viewed by the international rating agencies as having a neutral impact to Malaysia’s sovereign credit rating.

15Takafulink Funds Report 2015
INVESTMENT OUTLOOK
Additionally, the budget implied that the net issuance of MGS/GII in 2016 should be marginally higher from 2015’s amount. The marginal increase as well as ample market liquidity should be supportive of the Malaysian ringgit government securities.
On 16 December 2015, the US Federal Reserve set the new target range for the federal funds rate at 0.25% to 0.5%, up from 0% to 0.25%. The hike was the first change since the rate was lowered to near zero in December 2008. The Fed forecast that the rate would rise to 1.375% by end 2016. Fed Chair Janet Yellen stated that the Fed expected that “gradual adjustments in the stance of monetary policy” would be accompanied by moderate economic expansion and strengthening labour market indicators.
We expect the fixed income market to be volatile in 2016. Ringgit performance, monetary policy normalisation by the Fed, commodity prices particularly Liquefied Natural Gas (LNG) and crude oil, and political developments are key influences on the MYR fixed income market in 2016.
Asia-Pacific ex-Japan Markets
We remain cognisant of the fear surrounding economic performance in Asia and the rest of the world but, being bottom up valuation focused, this can also give us many opportunities if we remain disciplined and focus on the medium term sustainable earnings of companies in which we look to invest.
China’s economic growth, equity market performance and currency are the focus of the world’s media and investors right now and the sentiment is clearly negative. However, not all is lost. China has the ability to stimulate its economy by cutting interest rates further, it can continue its increased fiscal spending, and reduce consumption taxes among others. The authorities are currently trying to stop the appreciation of the RMB seen over the last few years, however appear reluctant to allow an aggressive devaluation. In the near term that’s a concern to investors and will create equity volatility, however a more market-oriented currency over the medium term is a positive strategy to pursue.
Important supply side reforms such as reducing over-capacity, reducing housing inventory, simplifying taxes and State Own Enterprise (SOE) reform are still on the cards but have not progressed as quickly as most would like – but any progress is positive. The increase in local government bond issuance is also positive as it reduces costs and improves the quality of the existing debt burden. The government is also likely to continue to increase spending on infrastructure and social welfare as well as support house prices by reducing transaction taxes, as well as cut consumption taxes. So we must not forget there are several levers the Chinese authorities can pull to help them through any weakness.

16 Takafulink Funds Report 2015
INVESTMENT OUTLOOK
Elsewhere in Asia, Australia has come through a stiff adjustment to the mining downturn in surprisingly good health. Consumption levels are solid, the domestic housing market remains steady and interest rate cuts have been supportive for activity. However many stocks have been sold off aggressively on the back of the Australian dollar currency weakness and concerns over Chinese demand for Australian commodities. As such we have begun to see more stock specific opportunities in this mature, high quality, developed market.
As we always reiterate, the key is the price you pay. And MSCI Asia Pacific Ex Japan is currently trading at around 1.4x Price to Book (PB). This has historically proven to be a very attractive entry point for investing into Asian equities over the medium term. Also, within the market there is very significant dispersion between the cheaper names and more expensive names, which gives a bottom up approach more scope to add value.
Global Market
Heading into 2016, investors will focus on the pace of tightening by the US Fed and the transmission effects of the rate hikes. Markets will watch US data closely to anticipate signs of recession which could force the central bank to reverse on its tightening. In Asia, China’s growth outlook will continue to dominate but it is useful to note that the likes of India, Philippines, Indonesia and even Vietnam are likely to embark on a higher growth trajectory that could offer a good diversion. Geopolitics could play a big part in global markets too. The US presidential election, referendum on the UK’s EU membership and other leadership transitions will have material consequences while developments in North Korea, the South China Seas, the refugee crisis in Europe and terrorism-related activities could be potential black swan events.

17Takafulink Funds Report 2015
FINANCIAL HIGHLIGHTS
Comparative Performance Tablefor financial year ended 31 December 2015
Takafulink Dana Ekuiti
Description 2015 2014 2013 2012 2011 % % % % %
EquityAutomotive 2.02 4.03 4.04 – –Banking & Finance 3.81 2.00 2.81 – – Building Materials – – – 0.33 0.27 Conglomerates 10.10 10.12 8.74 6.29 5.93 Construction 3.20 4.37 5.45 4.59 5.09 Consumer Products 3.13 7.82 2.10 1.50 3.01 Health Care 10.19 – – – –Industrial – – – – 4.68 Takaful – 1.31 1.05 – –Manufacturing – 1.82 0.57 3.78 – Media – 0.10 – 0.32 – Motor – – – 1.56 – Oil & Gas 10.68 11.06 22.82 19.02 22.50 Plantation 5.49 8.07 10.04 7.04 10.39 Power 10.77 9.59 9.93 7.83 0.92 Property 6.36 6.71 4.09 5.70 3.38 Services – – – 2.49 – Technology 2.16 1.80 1.11 1.50 – Telecommunications 21.26 22.94 25.06 28.45 23.85 Transportation 5.50 3.34 0.85 – 3.82
94.67 95.08 98.66 90.40 83.84 Cash and Islamic Deposits 6.37 5.68 3.46 12.21 17.03 Other Assets 0.35 0.46 0.79 0.37 0.49 Total Liabilities (1.39) (1.22) (2.91) (2.98) (1.36)
Total 100.00 100.00 100.00 100.00 100.00

18 Takafulink Funds Report 2015
Comparative Performance Tablefor financial year ended 31 December 2015
Takafulink Dana Ekuiti
Description 2015 2014 2013 2012 2011 % % % % %
Total Net Asset Value (RM) 676,457,441 557,891,215 444,277,106 313,674,835 203,868,447Units in Circulation 310,420,558 269,098,535 216,923,836 176,298,428 133,612,489NAV Per Unit (RM) 2.179 2.073 2.048 1.779 1.526 Highest NAV per unit (RM) 2.236 2.141 2.054 1.779 1.526 Lowest NAV per unit (RM) 1.939 1.952 1.693 1.511 1.296 Total Return (+) – Capital Growth 5.11% 1.23% 15.11% 16.61% 8.49%
Average Annual Return – Fund (+)PeriodOne year 5.11% 1.23% 15.11% 16.61% 8.49%Three years 6.99% 10.76% 13.35% 14.19% 20.24%Five years 9.15% 11.65% 18.47% 5.55% 8.46% Average Annual Return – Benchmark:FTSE-Bursa Malaysia Emas Shariah Index (FBMSHA) PeriodOne year 2.35% (4.17%) 13.29% 11.85% 2.41%Three years 3.57% 6.68% 9.07% 10.63% 20.08%Five years 4.94% 8.01% 17.01% 1.81% 7.04%
FINANCIAL HIGHLIGHTS
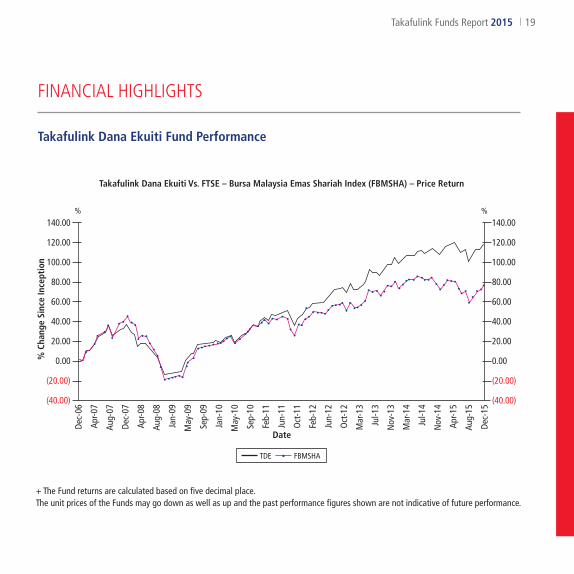
19Takafulink Funds Report 2015
Takafulink Dana Ekuiti Fund Performance
(40.00)
(20.00)
Dec-
06
Apr-0
7
Aug-
07
Dec-
07
Apr-0
8
Aug-
08
Jan-
09
May
-09
Sep-
09
Jan-
10
May
-10
Sep-
10
Feb-
11
Jun-
11
Oct
-11
Feb-
12
Jun-
12
Oct
-12
Mar
-13
Jul-1
3
Nov
-13
Mar
-14
Jul-1
4
Nov
-14
Apr-1
5
Aug-
15
Dec-
15
Date
% C
hang
e Si
nce
Ince
ptio
n
0.00
40.00
20.00
60.00
80.00
100.00
140.00
120.00
(40.00)
(20.00)
0.00
40.00
20.00
60.00
80.00
100.00
140.00
120.00
% %
Takafulink Dana Ekuiti Vs. FTSE – Bursa Malaysia Emas Shariah Index (FBMSHA) – Price Return
+ The Fund returns are calculated based on five decimal place.The unit prices of the Funds may go down as well as up and the past performance figures shown are not indicative of future performance.
TDE FBMSHA
FINANCIAL HIGHLIGHTS

20 Takafulink Funds Report 2015
Comparative Performance Tablefor financial year ended 31 December 2015
Takafulink Dana Bon
Description 2015 2014 2013 2012 2011 % % % % %
Sukuk: – Sukuk 91.22 88.84 89.97 83.00 66.88 – Government 1.72 1.92 2.59 5.14 13.28 – Quasi Government 4.14 4.71 6.04 7.92 7.56 Cash and Islamic Deposits 2.45 3.95 0.86 3.27 12.48 Other Assets 0.83 0.95 0.91 1.16 0.71 Total Liabilities (0.36) (0.37) (0.37) (0.49) (0.91)
Total 100.00 100.00 100.00 100.00 100.00
Total Net Asset Value (RM) 59,926,292 53,317,726 39,738,109 38,783,817 37,630,097Units in Circulation 42,779,802 39,403,968 30,454,959 29,789,395 30,549,422 NAV Per Unit (RM) 1.401 1.353 1.305 1.302 1.232 Highest NAV per unit (RM) 1.402 1.355 1.324 1.302 1.232 Lowest NAV per unit (RM) 1.353 1.301 1.288 1.232 1.175 Total Return (+) – Capital Growth 3.53% 3.70% 0.22% 5.70% 4.89%
FINANCIAL HIGHLIGHTS

21Takafulink Funds Report 2015
Comparative Performance Tablefor financial year ended 31 December 2015
Takafulink Dana Bon
Description 2015 2014 2013 2012 2011 % % % % %
Average Annual Return – Fund (+)PeriodOne year 3.53% 3.70% 0.22% 5.70% 4.89%Three years 2.76% 3.18% 3.58% 5.35% 5.12%Five years 3.59% 3.98% 4.24% 4.57% 3.89%
Average Annual Return – Benchmark: MBB 1 month Islamic Fixed Deposit-i ratePeriodOne year 3.09% 2.89% 2.75% 2.84% 2.93%Three years 2.91% 2.83% 2.84% 2.76% 2.52%Five years 2.90% 2.78% 2.63% 2.66% 2.68%
FINANCIAL HIGHLIGHTS

22 Takafulink Funds Report 2015
Takafulink Dana Bon Fund Performance
(10.00)
% C
hang
e Si
nce
Ince
ptio
n
%
Takafulink Dana Bon Vs. 1 Month Maybank Islamic Fixed Deposit-i Rate
+ The Fund returns are calculated based on five decimal place.The unit prices of the Funds may go down as well as up and the past performance figures shown are not indicative offuture performance.
TDB MBB 1 Month Islamic Fixed Deposit-i Rate
(5.00)
5.00
0.00
10.00
15.00
20.00
30.00
25.00
35.00
40.00
45.00
50.00
(10.00)
(5.00)
5.00
0.00
10.00
15.00
20.00
30.00
25.00
35.00
40.00
45.00
50.00
Dec-
06
Apr-0
7
Sep-
07
Jan-
08
Jun-
08
Oct
-09
Mar
-09
Jul-0
9
Dec-
09
Apr-1
0
Sep-
10
Jan-
11
Jun-
11
Oct
-11
Mar
-12
Jul-1
2
Dec-
12
Apr-1
3
Sep-
13
Jan-
13
Jun-
14
Oct
-14
Mar
-14
Jul-1
5
Dec-
15
Date
FINANCIAL HIGHLIGHTS

23Takafulink Funds Report 2015
Comparative Performance Tablefor financial year ended 31 December 2015
Takafulink Dana Urus
Description 2015 2014 2013 2012 2011 % % % % %
Investment in – Takafulink Dana Ekuiti Fund 79.11 77.32 77.43 82.48 71.71 Takafulink Dana Bon Fund 20.89 22.68 22.57 17.52 28.29 Cash and Islamic Deposits – – – – – Other Assets – – – 0.01 – Total Liabilities (0.00) (0.00) (0.00) (0.01) –
Total 100.00 100.00 100.00 100.00 100.00
Total Net Asset Value (RM) 195,840,723 166,801,352 127,408,086 90,908,575 61,186,502Units in Circulation 98,226,016 87,659,334 68,180,347 54,410,831 41,711,100NAV Per Unit (RM) 1.994 1.903 1.869 1.671 1.467 Highest NAV per unit (RM) 2.026 1.949 1.872 1.671 1.467 Lowest NAV per unit (RM) 1.818 1.801 1.607 1.457 1.302 Total Return (+) – Capital Growth 4.78% 1.82% 11.85% 13.90% 7.49%
FINANCIAL HIGHLIGHTS

24 Takafulink Funds Report 2015
Comparative Performance Tablefor financial year ended 31 December 2015
Takafulink Dana Urus
Description 2015 2014 2013 2012 2011 % % % % %
Average Annual Return – Fund (+)PeriodOne year 4.78% 1.82% 11.85% 13.90% 7.49%Three years 6.07% 9.06% 11.05% 12.21% 17.01%Five years 7.88% 9.98% 15.34% 5.27% 7.60%
Average Annual Return – Benchmark: 80% FBMSHA + 20% 1 Month Maybank Islamic Fixed Deposit-i ratePeriodOne year 2.61% (2.76%) 11.18% 10.05% 2.29%Three years 3.52% 5.96% 7.76% 8.98% 16.38%Five years 4.54% 6.95% 14.03% 2.12% 6.34%
FINANCIAL HIGHLIGHTS

25Takafulink Funds Report 2015
Takafulink Dana Urus Fund Performance
(20.00)
Date
% C
hang
e Si
nce
Ince
ptio
n
0.00
40.00
20.00
60.00
80.00
120.00
100.00
0.00
20.00
40.00
60.00
120.00
100.00
80.00
(20.00)
%%
Takafulink Dana Urus Vs. 80% FBMSHA + 20% 1 Month Maybank Islamic Fixed Deposit-i Rate
+ The Fund returns are calculated based on five decimal place.The unit prices of the Funds may go down as well as up and the past performance figures shown are not indicative of future performance.
TDU 80%FBMSHA & 20%1 MTH MBB Islamic Fixed Deposit-i Rate
Dec-
06
Apr-0
7
Sep-
07
Feb-
08
Jun-
08
Nov
-08
Apr-0
9
Aug-
09
Jan-
10
Oct
-10
Jun-
10
Mar
-11
Aug-
11
Jan-
12
May
-12
Oct
-12
Mar
-13
Jul-1
3
Dec-
13
May
-14
Sep-
14
Feb-
15
Jul-1
5
Dec-
15
FINANCIAL HIGHLIGHTS

26 Takafulink Funds Report 2015
Comparative Performance Tablefor financial year ended 31 December 2015
Takafulink Dana Ekuiti Dinasti
Description 2015 2014 2013 2012 2011 % % % % %
Investment in – Eastspring Investments Dinasti Equity Fund 100.76 100.38 102.23 99.27 98.54 Cash and Islamic Deposits 0.31 0.33 – 1.52 0.93 Other Assets 0.24 0.20 0.74 0.99 1.24 Total Liabilities (1.31) (0.91) (2.97) (1.78) (0.70)
Total 100.00 100.00 100.00 100.00 100.00
Total Net Asset Value (RM) 24,417,988 17,713,152 14,001,888 8,838,416 4,523,965Units in Circulation 16,829,444 14,470,661 11,866,743 8,242,370 4,663,788NAV Per Unit (RM) 1.451 1.224 1.180 1.072 0.970 Highest NAV per unit (RM) 1.535 1.234 1.188 1.073 1.148 Lowest NAV per unit (RM) 1.223 1.094 0.995 0.931 0.931 Total Return (+) – Capital Growth 18.53% 3.75% 10.03% 10.55% (11.34%)
FINANCIAL HIGHLIGHTS

27Takafulink Funds Report 2015
Comparative Performance Tablefor financial year ended 31 December 2015
Takafulink Dana Ekuiti Dinasti
Description 2015 2014 2013 2012 2011 % % % % %
Average Annual Return – Fund (+) Period One year 18.53% 3.75% 10.03% 10.55% (11.34%)Three years 10.60% 8.06% 2.55% n/a n/aFive years 5.81% n/a n/a n/a n/a
Average Annual Return – Benchmark: Dow Jones Islamic Market Greater China Index Period One year 16.97% 9.91% 18.04% 6.75% (16.48%)Three years 14.92% 12.83% 2.96% n/a n/aFive years 7.01% n/a n/a n/a n/a
FINANCIAL HIGHLIGHTS

28 Takafulink Funds Report 2015
Takafulink Dana Ekuiti Dinasti Fund Performance
(10.00)5.00
Date
% C
hang
e Si
nce
Ince
ptio
n
0.005.00
10.0015.0020.0025.0030.00
40.0045.0050.0055.0060.0065.00
35.00
(10.00)5.000.005.0010.0015.0020.0025.0030.00
40.0045.0050.0055.0060.0065.00
35.00
% %
Takafulink Dana Ekuiti Dinasti Vs. Dow Jones Islamic Market Greater China Index
+ The Fund returns are calculated based on five decimal place.The unit prices of the Funds may go down as well as up and the past performance figures shown are not indicative of future performance.
TDED Dow Jones Islamic Market Greater China Index
Apr-1
0
Sep-
10
Feb-
11
Jul-1
1
Dec-
11
Apr-1
2
Sep-
12
Feb-
13
Jul-1
3
Dec-
13
Feb-
15
Jul-1
5
Dec-
15
Sep-
14
Apr-1
4
FINANCIAL HIGHLIGHTS
29Takafulink Funds Report 2015
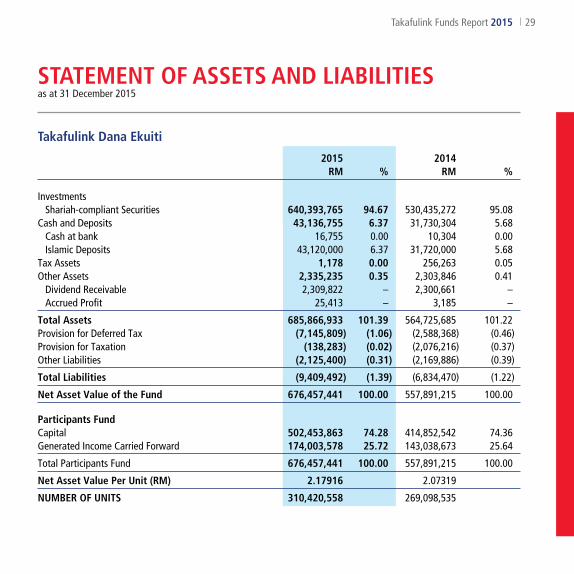
Takafulink Dana Ekuiti
2015 2014 RM % RM %
Investments Shariah-compliant Securities 640,393,765 94.67 530,435,272 95.08
Cash and Deposits 43,136,755 6.37 31,730,304 5.68Cash at bank 16,755 0.00 10,304 0.00Islamic Deposits 43,120,000 6.37 31,720,000 5.68
Tax Assets 1,178 0.00 256,263 0.05Other Assets 2,335,235 0.35 2,303,846 0.41
Dividend Receivable 2,309,822 – 2,300,661 –Accrued Profit 25,413 – 3,185 –
Total Assets 685,866,933 101.39 564,725,685 101.22Provision for Deferred Tax (7,145,809) (1.06) (2,588,368) (0.46)Provision for Taxation (138,283) (0.02) (2,076,216) (0.37)Other Liabilities (2,125,400) (0.31) (2,169,886) (0.39)
Total Liabilities (9,409,492) (1.39) (6,834,470) (1.22)
Net Asset Value of the Fund 676,457,441 100.00 557,891,215 100.00
Participants FundCapital 502,453,863 74.28 414,852,542 74.36Generated Income Carried Forward 174,003,578 25.72 143,038,673 25.64
Total Participants Fund 676,457,441 100.00 557,891,215 100.00
Net Asset Value Per Unit (RM) 2.17916 2.07319
NUMBER OF UNITS 310,420,558 269,098,535
STATEMENT OF ASSETS AND LIABILITIESas at 31 December 2015

30 Takafulink Funds Report 2015
STATEMENT OF ASSETS AND LIABILITIESas at 31 December 2015
Takafulink Dana Bon
2015 2014 RM % RM %
InvestmentsSukuk 58,165,426 97.08 50,899,980 95.47
Cash and Deposits 1,477,610 2.45 2,103,997 3.95Cash at bank 17,610 0.02 13,997 0.03Islamic Deposits 1,460,000 2.43 2,090,000 3.92
Other Assets 499,624 0.83 510,607 0.95
Total Assets 60,142,660 100.36 53,514,584 100.37Provision for Taxation (220,815) (0.36) (177,519) (0.33)Provision for Deferred Tax 29,595 0.04 2,737 0.00Other Liabilities (25,148) (0.04) (22,076) (0.04)
Total Liabilities (216,368) (0.36) (196,858) (0.37)
Net Asset Value of the Fund 59,926,292 100.00 53,317,726 100.00
Participants FundCapital 49,945,863 83.35 45,327,882 85.01Generated Income Carried Forward 9,980,429 16.65 7,989,844 14.99
Total Participants Fund 59,926,292 100.00 53,317,726 100.00
Net Asset Value Per Unit (RM) 1.40081 1.35311
NUMBER OF UNITS 42,779,802 39,403,968

31Takafulink Funds Report 2015
STATEMENT OF ASSETS AND LIABILITIESas at 31 December 2015
Takafulink Dana Urus
2015 2014 RM % RM %
Investments in Takafulink Dana Ekuiti Fund 154,928,117 79.11 128,974,462 77.32Takafulink Dana Bon Fund 40,914,978 20.89 37,831,421 22.68
Total Assets 195,843,095 100.00 166,805,883 100.00Other Liabilities (2,372) (0.00) (4,531) (0.00)
Total Liabilities (2,372) (0.00) (4,531) (0.00)
Net Asset Value of the Fund 195,840,723 100.00 166,801,352 100.00
Participants FundCapital 151,996,543 77.61 131,462,886 78.81Generated Income Carried Forward 43,844,180 22.39 35,338,466 21.19
Total Participants Fund 195,840,723 100.00 166,801,352 100.00
Net Asset Value Per Unit (RM) 1.99378 1.90284
NUMBER OF UNITS 98,226,016 87,659,334
32 Takafulink Funds Report 2015
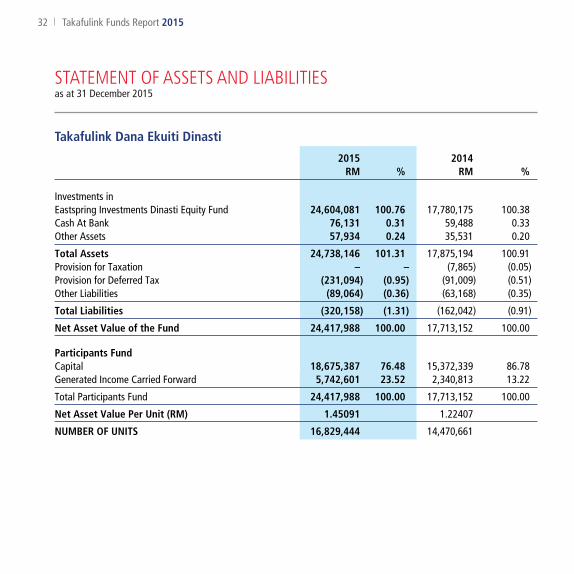
Takafulink Dana Ekuiti Dinasti
2015 2014 RM % RM %
Investments inEastspring Investments Dinasti Equity Fund 24,604,081 100.76 17,780,175 100.38Cash At Bank 76,131 0.31 59,488 0.33Other Assets 57,934 0.24 35,531 0.20
Total Assets 24,738,146 101.31 17,875,194 100.91Provision for Taxation – – (7,865) (0.05)Provision for Deferred Tax (231,094) (0.95) (91,009) (0.51)Other Liabilities (89,064) (0.36) (63,168) (0.35)
Total Liabilities (320,158) (1.31) (162,042) (0.91)
Net Asset Value of the Fund 24,417,988 100.00 17,713,152 100.00
Participants FundCapital 18,675,387 76.48 15,372,339 86.78Generated Income Carried Forward 5,742,601 23.52 2,340,813 13.22
Total Participants Fund 24,417,988 100.00 17,713,152 100.00
Net Asset Value Per Unit (RM) 1.45091 1.22407
NUMBER OF UNITS 16,829,444 14,470,661
STATEMENT OF ASSETS AND LIABILITIESas at 31 December 2015

33Takafulink Funds Report 2015
Takafulink Dana Ekuiti
2015 2014 RM RM
Net Asset Value at beginning of year 557,891,215 444,277,106
Amounts received from units created 535,038,418 415,464,855Amounts paid for units cancelled (447,437,097) (307,906,358)Excess of income over outgo 30,964,905 6,055,612
Value of fund at end of year 676,457,441 557,891,215
STATEMENT OF CHANGES IN NET ASSET VALUEfor the financial year ended 31 December 2015

34 Takafulink Funds Report 2015
STATEMENT OF CHANGES IN NET ASSET VALUEfor the financial year ended 31 December 2015
Takafulink Dana Bon
2015 2014 RM RM
Net Asset Value at beginning of year 53,317,726 39,738,109
Amounts received from units created 12,907,879 32,205,743Amounts paid for units cancelled (8,289,898) (20,400,830)Excess of Income over outgo 1,990,585 1,774,704
Value of fund at end of year 59,926,292 53,317,726

35Takafulink Funds Report 2015
STATEMENT OF CHANGES IN NET ASSET VALUEfor the financial year ended 31 December 2015
Takafulink Dana Urus
2015 2014 RM RM
Net Asset Value at beginning of year 166,801,352 127,408,086
Amounts received from units created 109,599,164 116,984,280Amounts paid for units cancelled (89,065,507) (80,210,593)Excess of Income over outgo 8,505,714 2,619,579
Value of fund at end of year 195,840,723 166,801,352

36 Takafulink Funds Report 2015
Takafulink Dana Ekuiti Dinasti
2015 2014 RM RM
Net Asset Value at beginning of year 17,713,152 14,001,888
Amounts received from units created 19,383,410 19,719,638Amounts paid for units cancelled (16,080,362) (16,722,843)Excess of Income over outgo 3,401,788 714,469
Value of fund at end of year 24,417,988 17,713,152
STATEMENT OF CHANGES IN NET ASSET VALUEfor the financial year ended 31 December 2015

37Takafulink Funds Report 2015
Takafulink Dana Ekuiti
2015 2014 RM RM
Net Shariah-compliant Investment Income 18,762,657 15,207,032Profit Income 851,536 902,900Dividend income 17,911,121 14,304,132
Profits on Disposal 7,644,621 31,948,418Shariah-compliant Securities 7,644,621 31,948,418
Unrealised Capital Gain 25,020,502 –
Total Income 51,427,780 47,155,450Investment Management Fees (9,163,509) (7,441,752)Loss on Disposal (6,767,620) (6,898,613)
Shariah-compliant Securities (6,767,620) (6,898,613)Unrealised Capital Loss – (26,403,719)Provision for taxation (4,507,139) (328,140)Other Outgo (24,607) (27,614)
Bank Charges (687) (747)Custodian Charges (23,018) (26,867)Good & Services Tax Charges (902) –
Total Outgo (20,462,875) (41,099,838)
Excess of Income over Outgo 30,964,905 6,055,612
Generated Income Brought Forward 143,038,673 136,983,061Amount Available for Distribution – –Generated Income Carried forward 174,003,578 143,038,673
STATEMENT OF INCOME & EXPENDITUREfor the financial year ended 31 December 2015
38 Takafulink Funds Report 2015
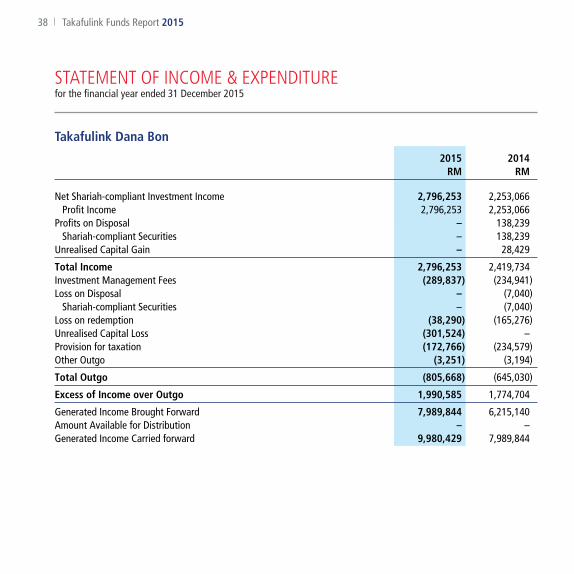
Takafulink Dana Bon
2015 2014 RM RM
Net Shariah-compliant Investment Income 2,796,253 2,253,066Profit Income 2,796,253 2,253,066
Profits on Disposal – 138,239Shariah-compliant Securities – 138,239
Unrealised Capital Gain – 28,429
Total Income 2,796,253 2,419,734Investment Management Fees (289,837) (234,941)Loss on Disposal – (7,040)
Shariah-compliant Securities – (7,040)Loss on redemption (38,290) (165,276)Unrealised Capital Loss (301,524) –Provision for taxation (172,766) (234,579)Other Outgo (3,251) (3,194)
Total Outgo (805,668) (645,030)
Excess of Income over Outgo 1,990,585 1,774,704
Generated Income Brought Forward 7,989,844 6,215,140Amount Available for Distribution – –Generated Income Carried forward 9,980,429 7,989,844
STATEMENT OF INCOME & EXPENDITUREfor the financial year ended 31 December 2015

39Takafulink Funds Report 2015
Takafulink Dana Urus
2015 2014 RM RM
Net Shariah-compliant Investment Income 2,317,132 1,841,450Profits on Disposal 6,707,798 8,350,895Unrealised Capital Gain 1,837,277 –
Total Income 10,862,207 10,192,345Investment Management Fees (2,356,493) (1,894,319)Unrealised Capital Loss – (5,678,447)
Total Outgo (2,356,493) (7,572,766)
Excess of Income over Outgo 8,505,714 2,619,579
Generated Income Brought Forward 35,338,466 32,718,887Amount Available for Distribution – –Generated Income Carried Forward 43,844,180 35,338,466
STATEMENT OF INCOME & EXPENDITUREfor the financial year ended 31 December 2015

40 Takafulink Funds Report 2015
Takafulink Dana Ekuiti Dinasti
2015 2014 RM RM
Net Shariah-compliant Investment Income 399,735 276,639Profit On Disposal – 98,313Unrealised Capital Gain 3,502,137 646,721
Total Income 3,901,872 1,021,673Investment Management Fees (327,762) (227,239)Provision for taxation (172,089) (79,680)Other Outgo (233) (285)
Total Outgo (500,084) (307,204)
Excess of Income over Outgo 3,401,788 714,469
Generated Income Brought Forward 2,340,813 1,626,344Amount Available for Distribution – –Generated Income Carried Forward 5,742,601 2,340,813
STATEMENT OF INCOME & EXPENDITUREfor the financial year ended 31 December 2015

41Takafulink Funds Report 2015
NOTES TO THE ACCOUNTS
1. Summary of Significant Accounting Policies
a. Basis of Accounting
The financial statements have been prepared in accordance with The Guidelines on Investment-Linked Insurance/Takaful Business (BNM/RH/GL 010-15) and the requirements of the certificate document, modified by the following:
(i) for the purpose of unit pricing, investments at market value are adjusted to include future cost of acquisitions. This is to ensure equitable unit pricing for incoming, outgoing and remaining unit-holders;
(ii) for the purpose of unit pricing, provision for deferred tax is recognised on taxable and deductible temporary differences using an actuarially calculated rate of 4% for Takafulink Dana Ekuiti Dinasti Fund and 8% for the remaining funds. The Board of Directors are of the opinion that since these temporary differences will only be realised in the future, the lower tax rate of 4% has been used for Takafulink Dana Ekuiti Dinasti to ensure equitable unit pricing for incoming, outgoing and remaining unit-holders; and
(iii) all deferred tax assets or liabilities arising from the temporary differences on unrealised gains or losses are recognised.
b. Shariah-compliant Investments
Quoted Shariah-compliant investments are valued at the closing market prices at the end of the financial year. Unquoted sukuk are valued at the prevailing prices quoted by financial institutions.
Net unrealised gains or losses in value of investments are credited or charged to the capital account.
c. Dividend Income
Dividend income is recognised when the right to receive payment is established.

42 Takafulink Funds Report 2015
d. Profit Income
Profit income is recognised on an accrual basis.
e. Gains/Losses on Disposal of Investments
Gains or losses arising from the disposal on investment are credited or charged to the capital account.
f. Investment Management Fees
Investment management fees are calculated in accordance with the provisions of the certificate document.
g. Fee Rebate
This relates to rebate of fees from the Fund Manager in respect of investment held in Takafulink Dana Ekuiti and Takafulink Dana Bon for the Takafulink Dana Urus.
h. Cash and Cash Equivalents
Cash and cash equivalents consists of cash in hand and balances with Islamic banks, excluding Islamic deposits.
NOTES TO THE ACCOUNTS

43Takafulink Funds Report 2015
2. Other Outgo comprises bank charges and custodian charges.
3. Rebates and Soft Commissions
The Fund Managers are restricted by regulations from receiving any rebate or share any commission from any broker/dealer. Accordingly, any rebate and share commission received from stockbrokers/dealers shall be directed to the Funds. However, soft commissions received in the form of goods and services which are of demonstrable benefit to unit-holders such as fundamental databases, financial wire services, technical analysis software and stock quotation system incidental to investment management of the Funds are retained by the Fund Manager.
4. At 31 December 2015, the Funds had no contingent liabilities or commitments.
5. All amounts are stated in Ringgit Malaysia.
NOTES TO THE ACCOUNTS

44 Takafulink Funds Report 2015
In the opinion of the Directors, the Takafulink Funds (‘Funds’) financial statements set out on pages 29 to 43, comprising the Statement of Assets and Liabilities as at 31 December 2015 and the related Statement of Income and Expenditure and Statement of Changes in Net Asset Value for the financial year ended 31 December 2015 together with the notes thereto, have been prepared, in all material respects in accordance with the accounting policies set out in Note 1 to the financial statements and Guidelines on Investment-Linked Insurance/Takaful Business (BNM/RH/GL 010-15) issued by Bank Negara Malaysia.
Signed in accordance with a resolution of the Directors:
Datuk Adinan bin Maning
Dato’ Ghazali bin Awang
Kuala Lumpur,24 March 2016
STATEMENT BY DIRECTORS

45Takafulink Funds Report 2015
Report on the Financial Statements
We have audited the financial statements of the Takafulink Funds of Prudential BSN Takaful Berhad, which comprise the Statement of Assets and Liabilities as at 31 December 2015, and the Statement of Income and Expenditure, Statement of Changes in Net Asset Value for the year then ended, and a summary of significant accounting policies and other explanatory information, as set out on pages 29 to 43.
Directors’ Responsibility for the Financial Statements
The Directors of the Company are responsible for the preparation of financial statements in accordance with the accounting policies set out in Note 1 to the financial statements and Guidelines on Investment-Linked Insurance/Takaful Business (BNM/RH/GL 010-15) and for such internal control as the directors determine are necessary to enable the preparation of financial statements that are free from material misstatement, whether due to fraud or error.
Auditors’ Responsibility
Our responsibility is to express an opinion on these financial statements based on our audit. We conducted our audit in accordance with approved standards on auditing in Malaysia. Those standards require that we comply with ethical requirements and plan and perform the audit to obtain reasonable assurance about whether the financial statements are free from material misstatement.
An audit involves performing procedures to obtain audit evidence about the amounts and disclosures in the financial statements. The procedures selected depend on our judgement, including the assessment of risks of material misstatement of the financial statements, whether due to fraud or error. In making those risk assessments, we consider internal control relevant to the entity’s preparation of financial statements in order to design audit procedures that are appropriate in the circumstances, but not for the purpose of expressing an opinion on the effectiveness of the entity’s internal control. An audit also includes evaluating the appropriateness of accounting policies used and the reasonableness of accounting estimates made by the directors, as well as evaluating the overall presentation of the financial statements.
We believe that the audit evidence we have obtained is sufficient and appropriate to provide a basis for our audit opinion.
INDEPENDENT AUDITORS’ REPORTto the unitholders of Takafulink Funds

46 Takafulink Funds Report 2015
Opinion
In our opinion, the financial statements as of 31 December 2015 and for the year then ended have been prepared, in all material respects in accordance with the accounting policies set out in Note 1 to the financial statements and Guidelines on Investment-Linked Insurance/Takaful Business (BNM/RH/GL 010-15).
Emphasis of Matter
Without qualifying our opinion, we wish to draw your attention to Note 1a (ii) to the accounts whereby a lower rate of tax was used for deferred taxation provision of Takafulink Dana Ekuiti Dinasti Fund. As fully explained in Note 1a (ii), the Directors of the Company are of the opinion that it is fairer to unitholders to use a lower rate than the statutory tax rate in the pricing of units.
Other Matter
This report is made solely to the unitholders of the Funds, as a body, and for no other purpose. We do not assume responsibility to any other person for the content of this report.
KPMGFirm Number: AF: 0758Chartered Accountants
Petaling Jaya,24 March 2016
INDEPENDENT AUDITORS’ REPORTto the unitholders of Takafulink Funds

Prudential BSN Takaful Berhad (740651-H)
Level 8A, Menara Prudential, No. 10, Jalan Sultan Ismail, 50250 Kuala Lumpur.E-mail: [email protected] SMS PruBSN and send to 33080
www.prubsn.com.my
www.facebook.com/prubsn
Prudential BSN Takaful Berhad is a registered Takaful Operator under the Islamic Financial Services Act 2013 and is regulated by Bank Negara Malaysia.