contents · acca-wwf pakistan, acca pakistan and wwf pakistan. epcl is constantly striving to...
TRANSCRIPT


CONTENTS
04 Mission Statement05 Statement of Best Practices06 Core Values07 Business Ethics08 Statement of Anti-Restrictive Trade Practices09 Company Information10 Organisation Structure Stakeholders Information12 Key Highlights and Major Events13 Awards and Achievements14 Investor Information For the Last Six Years15 Graphical Presentation16 Balance Sheet - Vertical and Horizontal Analysis17 Profit and Loss Account - Vertical and Horizontal Analysis18 Summary of Cash Flow Statement20 Notice of Annual General Meeting Corporate Governance22 Profile of Board of Directors24 Principal Board Committees25 Principal Operational Committees26 Corporate Governance
Directors’ Report30 Business Review33 Financial Review35 Safety, Health & Environment37 Corporate Social Responsibility40 Employees and Organisation Development42 Customer Focus42 Research and Development43 Information Systems43 Business Outlook44 Corporate Review Financial Statements55 Statement of Compliance with the Code of Corporate Governance57 Review Report to the Members on Statement of Compliance58 Auditors’ Report to the Members on Compliance with Employees Share Option Scheme59 Auditors’ Report to the Members on the Financial Statements60 Financial Statements Consolidated Financial Statements115 Auditors’ Report to the Members on the Consolidated Financial Statements116 Consolidated Financial Statements
Proxy Form
Annual Report 2009

ngro Polymer & Chemicals Limited is the only Company in Pakistanto have an integrated PVC facility. In 2007, the Company initiated anexpansion and back integration project. The Project was completedin 2009 and all plants except the VCM plant came into commercialoperation.
E
EPCL Project during different phases of construction
EPCL site on completion of Project
Annual Report 20092

Kick Off Meeting in ChinaMarch 18, 2007
With the back integration Project, new product lines have been addedwhich include Caustic soda, Sodium Hypo Chlorite and Ethylene DiChloride. PVC production capacity has been enhanced to 150K tonsper annum. The Project also includes a 60MW combined cycle powerplant.
Annual Report 20093

Our mission is to achieve innovativegrowth which creates value for ourstakeholders, customers and employees.
Our commitment is to maintain higherstandards of ethics, safety andenvironmental responsibility.
Mission Statement
4Annual Report 2009

5Annual Report 2009
� Overall, work towards creating an environment whichpromotes the realisation of our Vision and Values, by focusingon behavioural modification and systematic changes.
� Challenge the status quo by experimenting and takingreasonable and calculated risks.
� Think EPCL, by placing Company interest above individual,sectional, departmental interests.
� Collectively develop clear, concise and realistic goals,also agreeing on the process of achieving these beforeimplementing.
� Balance task, team and individual needs, by keeping thehelicopter view.
� Work through teams, by valuing all ideas and effectivelycommitting people through consensus building and activeinvolvement.
� Remind each other on the importance of using participatoryprocesses, just as much as emphasising attention on safety,quality and continuous improvement.
� Recognise individual needs and helping fulfil them.� Trust each other by delegating authority and decision
making to the lowest possible level.� Encourage sharing a clear, consistent and obtaining timely
feedback for learning and growth.� Give everyone a chance by listening patiently and thinking
before speaking.� Recognise team and individual efforts to change by
celebrating both lessons and successes.
Statement ofBest Practices

6Annual Report 2009

The policy of Engro Polymer & Chemicals Limited (EPCL) is one of the strictobservance of all laws applicable to its business.
Our policy does not stop there. Even where the law is permissive, EPCL choosesthe course of highest integrity. Local customs and traditions differ from placeto place, and this must be recognized. But honesty is not subject to criticismin any culture. Shades of dishonesty simply invite demoralising and reprehensiblejudgments. A well-founded reputation for scrupulous dealing is itself a pricelesscompany asset.
An overly-ambitious employee might have the mistaken idea that we do notcare how results are obtained, as long as he gets results. He might think it bestnot to tell higher management all that he is doing, not to record all transactionsaccurately in his books and records, and to deceive the Company’s internaland external auditors. He would be wrong on all counts.
We do care how we get results. We expect compliance with our standard ofintegrity throughout the organisation. We will not tolerate an employee whoachieves result at the cost of violation of laws or unscrupulous dealing. By thesame token, we support and we expect all employees to support, an employeewho passes up an opportunity or advantage which can only be secured at thesacrifice of principle.
Equally important, we expect candour from managers at all levels, and compliancewith accounting rules and controls. We don’t want employees to misrepresentfacts, whether they are misrepresenting in a mistaken effort to protect us or tomake themselves look good. One of the kinds of harm which results when amanager conceals information from higher management and the auditors isthat subordinates within his organisation think they are being given a signalthat company policies and rules, including accounting and control rules, can beignored whenever inconvenient. This can result in corruption and demoralisationof an organisation. Our system of management will not work without honesty,including honest book-keeping, honest budget proposals and honest economicevaluation of projects.
It has been, and continues to be, EPCL’s policy that all transactions shall beaccurately reflected in its books and records. This, of course, means thatfalsification of its books and records and any off-the-record bank accounts arestrictly prohibited.
Business Ethics
7Annual Report 2009

8Annual Report 2009
Engro Polymer & Chemicals Limited believes in fair trade and competition.Therefore, it is the policy of the Company that all of its directors and employeesshall, in carrying out their duties to the Company, comply with relevant laws.All employees are responsible for familiarising themselves with the requirementsof these laws as any violation may result in penalties and / or criminal offences.
No director or employee should assume that the Company’s interest everrequires otherwise. Moreover, no one in the Company has authority to give anyorder or direction that would result in a violation of this policy.
It is recognised that on occasion there may be legitimate doubt as to the properinterpretation of the law. In such circumstances, it is required that the employeerefers the case through appropriate channels to the Legal Department for anopinion.
Statement of Anti-RestrictiveTrade Practices
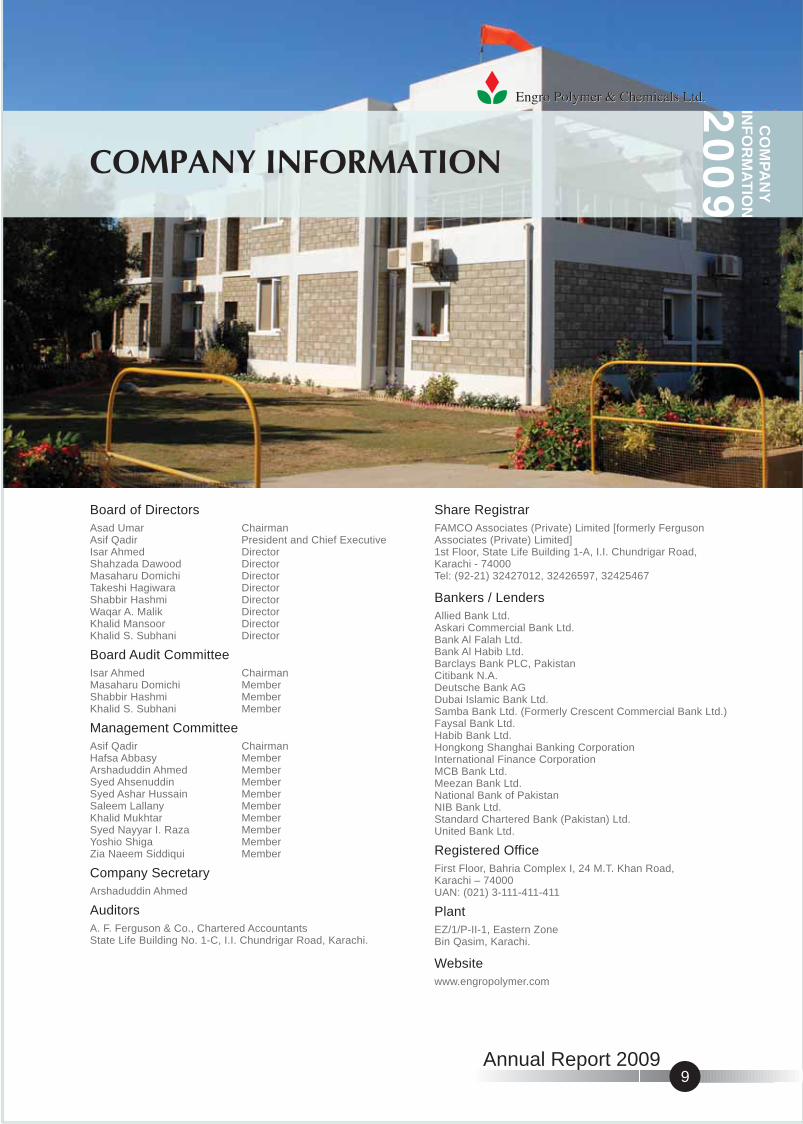
Board of DirectorsAsad Umar ChairmanAsif Qadir President and Chief ExecutiveIsar Ahmed DirectorShahzada Dawood DirectorMasaharu Domichi DirectorTakeshi Hagiwara DirectorShabbir Hashmi DirectorWaqar A. Malik DirectorKhalid Mansoor DirectorKhalid S. Subhani Director
Board Audit CommitteeIsar Ahmed ChairmanMasaharu Domichi MemberShabbir Hashmi MemberKhalid S. Subhani Member
Management CommitteeAsif Qadir ChairmanHafsa Abbasy MemberArshaduddin Ahmed MemberSyed Ahsenuddin MemberSyed Ashar Hussain MemberSaleem Lallany MemberKhalid Mukhtar MemberSyed Nayyar I. Raza MemberYoshio Shiga MemberZia Naeem Siddiqui Member
Company SecretaryArshaduddin Ahmed
AuditorsA. F. Ferguson & Co., Chartered AccountantsState Life Building No. 1-C, I.I. Chundrigar Road, Karachi.
Share RegistrarFAMCO Associates (Private) Limited [formerly FergusonAssociates (Private) Limited]1st Floor, State Life Building 1-A, I.I. Chundrigar Road,Karachi - 74000Tel: (92-21) 32427012, 32426597, 32425467
Bankers / LendersAllied Bank Ltd.Askari Commercial Bank Ltd.Bank Al Falah Ltd.Bank Al Habib Ltd.Barclays Bank PLC, PakistanCitibank N.A.Deutsche Bank AGDubai Islamic Bank Ltd.Samba Bank Ltd. (Formerly Crescent Commercial Bank Ltd.)Faysal Bank Ltd.Habib Bank Ltd.Hongkong Shanghai Banking CorporationInternational Finance CorporationMCB Bank Ltd.Meezan Bank Ltd.National Bank of PakistanNIB Bank Ltd.Standard Chartered Bank (Pakistan) Ltd.United Bank Ltd.
Registered OfficeFirst Floor, Bahria Complex I, 24 M.T. Khan Road,Karachi – 74000UAN: (021) 3-111-411-411
PlantEZ/1/P-II-1, Eastern ZoneBin Qasim, Karachi.
Websitewww.engropolymer.com
COMPANY INFORMATION
9Annual Report 2009
CO
MP
AN
YIN
FO
RM
AT
ION
10Annual Report 2009
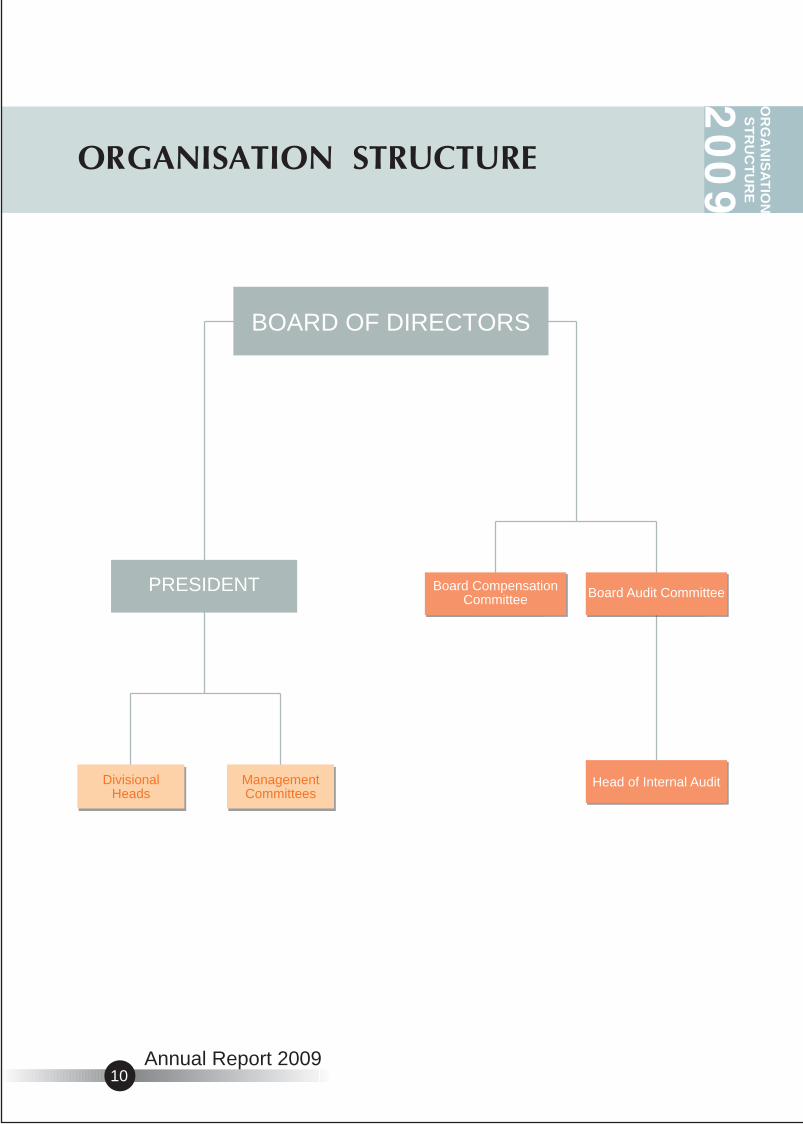
ORGANISATION STRUCTURE
PRESIDENT
DivisionalHeads
BOARD OF DIRECTORS
ManagementCommittees
Head of Internal Audit
OR
GA
NIS
AT
ION
ST
RU
CT
UR
E
Board Audit CommitteeBoard CompensationCommittee

STAKEHOLDERS INFORMATION
12 Key Highlights and Major Events
13 Awards and Achievements
14 Investor Information For the Last Six Years
15 Graphical Presentation
16 Balance Sheet - Vertical and Horizontal Analysis
17 Profit and Loss Account - Vertical andHorizontal Analysis
18 Summary of Cash Flow Statement
20 Notice of Annual General Meeting
STA
KE
HO
LD
ER
SIN
FO
RM
AT
ION

12Annual Report 2009
� Completion of 50 K ton PVC expansion project on January 1, 2009
� Commencement of commercial operations of Chlor-alkali, Ethylene Di Chloride & Power plants on August 1, 2009
� Caustic soda was launched in the domestic market
� Commencement of sale of surplus power to Karachi Electric Supply Company
� Highest ever domestic PVC sales of 119 K ton since inception of the Company
� Best ever PVC production of 116 K ton
� Commercial operation of VCM plant was delayed
� Fire incident occurred at the plant site which resulted in injury to one of the employees whoexpired twelve days later
� Rights issue at the rate of 27.5 percent at Rs. 10 per share was announced
� Listing on the Islamabad and Lahore Stock Exchanges in addition to previous listing on the Karachi Stock Exchange last year
� Spent Rs. 8.4 million towards Corporate Social Responsibility related activities
� Received for the third time ACCA-WWF Award for Environmental performance & transparency in reporting
Net revenue
Gross profit
Operating profit
(Loss) / Profit before tax
(Loss) / Profit after tax
(Loss) / Earnings per share
7,868
1,132
492
459
353
0.68
11,571
1,152
347
(249)
(232)
(0.45)
Rs. in million except (Loss) / Earnings per share
KEY HIGHLIGHTS AND MAJOR EVENTS
(Restated)2009 2008

STA
KE
HO
LD
ER
SIN
FO
RM
AT
ION
13Annual Report 2009
AWARDS AND ACHIEVEMENTS
Transparent environment reporting is now animportant part of corporate governance. It actuallyensures that stakeholders, financial institutions andpublic at large have access to standardized,comparable, consistent and verifiable environmentalinformation similar to corporate financial reporting.Social reporting allows us to address issues in anopen, credible and transparent manner. EPCL hasbeen consecutively publishing environment reportsince 2005. The publication and distribution of thesereports provided our stakeholders with the opportunityto comment on our progress. These are sincerecommitments on our part to demonstrate opennessand transparency. To top it all, this is also allowingour stakeholders to measure our progress througha set of performance indicators.
EPCL Environmental Performance Reports areconsecutive winners of ACCA-WWF EnvironmentReporting Awards for BEST ENVIRONMENTALREPORT on transparency in reporting. EPCL wasalso nominated on the panel of judges in the year2009 to judge the Environment Reports for the year
2008. EPCL has also won Annual EnvironmentExcellence Award from National Forum forEnvironment and Health (NFEH) for the fourth time
in 2009. This is our 3rd award in a row. In additionto this, our continuous efforts of environmentaltransparency in reporting have been appreciated by
ACCA-WWF Pakistan, ACCA Pakistan and WWFPakistan.
EPCL is constantly striving to improve its credibilityas an organization, both locally as well as when itcomes to meeting international standards. Our effortsfor sustainable development and transparency inreporting have been generally acknowledged by all,especially by different forums working for appreciatingand promoting environment-friendly initiatives in thecountry.

14Annual Report 2009
INVESTOR INFORMATIONFOR THE LAST SIX YEARS
Note (i) Company was listed during 2008Note (ii) Dividend paid during 2008 was the Final dividend declared during 2007
PROFIT AND LOSS
Net Sales
Gross Profit
Operating Profit
Profit / (Loss) before Tax
Profit / (Loss) after Tax
Property, Plant and Equipment
Intangibles, Investments, Loans & Advances
Current Assets
Current Liabilities
Long Term Liabilities
Share Capital
Shareholders Equity
Number of outstanding shares at year end
Earnings per Share - Basic and Diluted
Dividend per Share - Note (ii)Dividend Payout Ratio - Note (ii)Dividend Cover Ratio - Note (i)Price Earning Ratio - Note (i)Break up Value per share
Market Value per share (at the end of the year)
Market Value per share (highest during the year)
Market Value per share (lowest during the year)
Gross Profit / (Loss) to Sales
Net Profit / (Loss) to Sales
EBITDA
EBITDA to Sales
Interest Cover Ratio
Return on Equity
Return on Capital Employed
Long term Debt to Equity
Weighted average cost of debt
Current Ratio
Quick Ratio
Fixed Assets Turnover
Debtor Turnover
Inventory Turnover
Creditors Turnover
Operating cycle
Unit
Rs. in M
Rs. in M
Rs. in M
Rs. in M
Rs. in M
Rs. in M
Rs. in M
Rs. in M
Rs. in M
Rs. in M
Rs. in M
Rs. in M
%
%
Rs. in M
%
No. of Times
%
%
%
No. of Times
No. of Times
No. of Times
No. of days
No. of days
No. of days
No. of days
No. in M
Rs.
Rs.
%
No. of Times
No. of Times
Rs.
Rs.
Rs.
Rs.
2,391
59
1,646
1,464
763
1,780
1,871
2004
5,136
837
630
555
389
16.29
7.57
792
15.42
12.02
20.78
15.12
0.27
4.75
1.12
0.61
2.15
14.20
45.96
61.49
-1.33
178
2.18
0.50
23
4.37
-
10.51
2,278
60
1,435
1,246
532
1,780
1,996
2005
5,553
782
416
346
303
14.08
5.45
586
10.55
9.95
15.18
12.37
0.18
5.74
1.15
0.91
2.44
17.01
40.32
63.01
-5.68
178
1.70
1.00
59
1.70
-
11.21
2007
6,063
988
617
576
422
4,709
150
4,604
1,404
1,828
4,436
5,177
16.30
6.95
794
13.10
22.25
8.14
6.44
0.21
9.52
3.28
2.62
1.29
8.15
69.05
71.00
6.20
444
1.64
2.10
128
0.78
-
11.67
BALANCE SHEET
INVESTOR INFORMATION
Restated2008
7,868
1,132
492
459
353
16,135
167
1,977
2,705
9,008
5,204
6,566
14.39
4.49
670
8.51
25.32
5.38
2.43
0.55
14.72
0.73
0.30
0.494.77
56.32
49.99
11.10
520
0.68
0.54
79
1.26
4.66
12.63
14.58
28.31
12.66
19,361109
3,0864,681
11,5155,2046,360
2009
11,5711,152
347(249)(232)
9.96- 2.01
8607.431.44
- 3.65-1.330.64
11.510.660.320.605.37
48.4346.61
7.18
520- 0.45
---
- 2.5112.2317.9427.0012.11
2,443
65
1,756
1,748
468
1,780
2,048
2006
5,278
1,024
634
569
381
19.40
7.23
810
15.35
14.30
18.63
16.79
0.10
8.26
1.00
0.43
2.16
15.07
55.74
65.21
5.60
178
2.14
1.85
86
1.16
-
11.50

STA
KE
HO
LD
ER
SIN
FO
RM
AT
ION
GRAPHICAL PRESENTATION
Cash Generated from Operations
Dividend Per Share vs. EPS
Dividend Per Share Earnings Per Share
0
2,000
4,000
6,000
8,000
Shareholders’ Equity
200920082007200620052004
Total Long term Assets
0
4,000
8,000
12,000
16,000
20,000
200920082007200620052004
Break Up Value Per Share
Rs.
in M
Rs.
in M
Rs.
in M
Rs.
per
sh
are
Rs.
in M
Rs.
in M
Year
Year Year
Year
Sales Revenues
Year Year
Rs.
in M
15Annual Report 2009
0.00200920082007200620052004
2.00
4.00
6.00
8.00
10.00
12.00
14.00
200920082007200620052004
0.5 1.00
1.851.64 0.68
0.54
-0.45
Nil
1.70
2.14 2.12.18
0.0
1.0
2.0
3.0
4.0
0
4,000
8,000
10,000
12,000
200920082007200620052004
14,000
6,000
2,0000
200
400
600
800
200920082007200620052004
1,000
1,200
1,400
1,600

BALANCE SHEETVERTICAL AND HORIZONTAL ANALYSIS
16Annual Report 2009
ASSETS
Non-Current AssetsCurrent AssetsTotal Assets
EQUITY AND LIABILITIES
EquityAdvance against issue of share capitalNon-Current LiabilitiesCurrent LiabilitiesTotal Liabilities
Horizontal AnalysisYear on Year
ASSETS
Non-Current AssetsCurrent AssetsTotal Assets
EQUITY AND LIABILITIES
EquityAdvance against issue of share capitalNon-Current LiabilitiesCurrent LiabilitiesTotal Liabilities
200920082007200620052004
2005over2004
2006over2005
2007over2006
2008over2007
2009over2008
Amounts in Rs. M
ASSETS
Non-Current AssetsCurrent AssetsTotal Assets
EQUITY AND LIABILITIES
EquityAdvance against issue of share capitalNon-Current LiabilitiesCurrent LiabilitiesTotal Liabilities
2005 2006 2007 2008 2009Vertical Analysis% of Balance Sheet Total 2004
2,4521,6464,098
1,871-
7631,4644,098
60%40%
100%
46%0%
19%36%
100%
62%38%
100%
53%0%
14%33%
100%
2,3391,4353,774
1,996-
5321,2463,774
-5%-13%
-8%
7%-
-30%-15%
-8%
59%41%
100%
48%0%
11%41%
100%
2,5081,7564,264
2,048-
4681,7484,264
7%22%13%
3%-
-12%40%13%
51%49%
100%
55%11%19%15%
100%
4,8594,6049,463
5,1771,0541,8281,4049,463
94%162%122%
153%-
291%-20%122%
89%11%
100%
36%0%
49%15%
100%
16,3021,977
18,279
6,566-
9,0082,705
18,279
236%-57%93%
27%-100%393%
93%93%
86%14%
100%
28%0%
51%21%
100%
19,4703,086
22,556
6,360-
11,5154,681
22,556
19%56%23%
-3%-
28%73%23%

STA
KE
HO
LD
ER
SIN
FO
RM
AT
ION
17Annual Report 2009
PROFIT AND LOSS ACCOUNTVERTICAL AND HORIZONTAL ANALYSIS
2004 2005 2006 2007 2008 2009
Net salesCost of salesGross profitDistribution and marketing expensesAdministrative expensesOther operating expensesOther operating incomeOperating profitFinance costs(Loss) / Profit before taxationTaxation(Loss) / Profit after taxation
Restated
Horizontal AnalysisYear on Year
Net salesCost of salesGross profitDistribution and marketing expensesAdministrative expensesOther operating expensesOther operating incomeOperating profitFinance costs(Loss) / Profit before taxationTaxation(Loss) / Profit after taxation
Vertical Analysis% of Sales 2004 2005 2006 2007 2008 2009
Net salesCost of salesGross profitDistribution and marketing expensesAdministrative expensesOther operating expensesOther operating incomeOperating profitFinance costs(Loss) / Profit before taxationTaxation(Loss) / Profit after taxation
2005over2004
2006over2005
2007over2006
2008over2007
2009over2008
Amounts in Rs. M
11,571(10,419)
1152(469)(205)(231)
100347
(596)(249)
17(232)
47%55%
2%50%26%
-20%-19%-29%
1,706%-154%-116%-166%
100%-90%10%-4%-2%-2%1%3%
-5%-2%0%
-2%
7,868(6,736)
1,132(312)(163)(289)
124492(33)459
(106)353
30%33%15%21%24%
313%41%
-20%-20%-20%-31%-16%
100%-86%14%-4%-2%-4%2%6%0%6%
-1%4%
6,063(5,075)
988(258)(131)
(70)88
617(41)576
(154)422
15%19%-3%
-14%26%43%42%-3%
-37%-1%
-18%11%
100%-84%16%-4%-2%-1%1%
10%-1%10%-3%7%
5,278(4,254)
1,024(299)(104)
(49)62
634(65)569
(188)381
-5%-11%31%27%
7%-36%44%53%-7%65%
337%26%
100%-81%19%-6%-2%-1%1%
12%-1%11%-4%7%
5,553(4,771)
782(235)
(97)(77)
43416(70)346(43)303
8%11%-7%44%37%
133%-28%-34%
-7%-38%-74%-22%
100%-86%14%-4%-2%-1%1%7%
-1%6%
-1%5%
5,136(4,299)
837(163)
(71)(33)
60630(75)555
(166)389
100%-84%16%-3%-1%-1%1%
12%-1%11%-3%8%

SUMMARY OF CASH FLOW STATEMENT
18Annual Report 2009
2004 2005 2006 2007 2008 2009
Cash Generated from Operations -Direct Method
Cash flows from customers
Cash payment to suppliers and others
Cash generated from operation
(Restated)
Amounts in Rs.M
11,305
(9,815)
1,490
1,490
(561)
60
(11)
(290)
688
(3,746)
(553)
6
-
35
62
(4,196)
4,179
(130)
-
-
4,049
541
7,977
(7,312)
665
665
(354)
(10)
-
(184)
117
(11,165)
452
4
-
2,915
117
(7,677)
6,638
-
229
(253)
6,614
(946)
6,021
(5,141)
880
880
(37)
(84)
-
(45)
714
(2,453)
-
2
(3,272)
516
28
(5,179)
1,240
(229)
4,118
(422)
4,707
242
5,499
(4,945)
554
554
(67)
(4)
-
(19)
464
(345)
-
4
(97)
-
60
(378)
-
(166)
-
(281)
(447)
(361)
5,408
(4,678)
730
730
(66)
-
-
(48)
616
(87)
-
5
-
-
37
(45)
-
(268)
-
(267)
(535)
36
5,163
(4,680)
483
483
(77)
(4)
-
(14)
388
(12)
-
2
-
-
54
44
150
(556)
-
-
(406)
26
Cash generated from operations
Finance costs
Long term loans and advances
Retirement benefits paid
Income tax / Advance tax
Net cash flow from operating activities
Purchase of operating assets and intangibles
Retention money against Project payments
Proceeds from disposal of operating assets
Purchases of short term investments
Proceeds from sale of short term investments
Income on investments and bank deposits
Net cash flow from investing activities
Proceeds from long term borrowings
Repayment of long term borrowings
Issue of share capital
Dividend
Net cash flow from financing activities
Net cash flow
19Annual Report 2009
NOTICE OF ANNUAL GENERAL MEETING
STA
KE
HO
LD
ER
SIN
FO
RM
AT
ION

NOTICE IS HEREBY GIVEN that the Twelfth Annual General Meeting of Engro Polymer & Chemicals Limitedwill be held at DHA Golf Club, Phase VIII, Defence Housing Authority, Karachi on Friday, April 9, 2010 at10 a.m. to transact the following business:
A. ORDINARY BUSINESS
(1) To receive and consider the Audited Accounts for the year ended December 31, 2009 and the Directors' and Auditors' Reports thereon.
(2) To appoint Auditors and fix their remuneration.
By Order of the Board
Karachi ARSHADUDDIN AHMED
January 21, 2010 Company Secretary
N.B.:
(1) The share transfer books of the Company will be closed from Friday, March 26, 2010 to Friday, April 9, 2010(both days inclusive). Transfers received in order at the office of our Registrar, M/s. FAMCO Associates(Pvt) Limited, First Floor, State Life Building No.1-A, I. I. Chundrigar Road, Karachi-74000 by the close ofbusiness (5:00 p.m) on Thursday, March 25, 2010 will be treated as being in time for the purposes to attendthe meeting.
(2) A member entitled to attend and vote at this Meeting shall be entitled to appoint another person, as his/herproxy to attend, speak and vote instead of him/her, and a proxy so appointed shall have such rights, as
respects attending, speaking and voting at the Meeting as are available to a member. Proxies, in order to be effective, must be received by the Company not less than 48 hours before the Meeting. A proxy need
not be a member of the Company.
By Order of the Board
20Annual Report 2009
NOTICE OF ANNUAL GENERAL MEETING
Karachi
January 21, 2010ARSHADUDDIN AHMED
Company Secretary
STA
KE
HO
LD
ER
SIN
FO
RM
AT
ION

21Annual Report 2009
CORPORATE GOVERNANCE
22 Profile of Board of Directors
24 Principal Board Committees
25 Principal Operational Committees
26 Corporate Governance
CO
RP
OR
AT
EG
OV
ER
NA
NC
E

22Annual Report 2009
PROFILE OF BOARD OF DIRECTORS
is President of EngroCorporation Limited, ChiefExecutive Officer of EngroFertilizers Limited andChairman of all Engrosubsidiaries and jointventures. He has held keyassignments with theCompany and with ExxonChemical in Canada. Mr.Umar is also on the Board
of The Pakistan Business Council, Karachi EducationInitiative, Pakistan Institute of Corporate Governance,State Bank of Pakistan and Trustee of Lahore Universityof Management Sciences (LUMS). A Masters inBusiness Administration, he joined the Board in 1 9 9 7 .
is a Senior Vice Presidentof Engro Corporat ionLimited and Chief Executiveof Engro Polymer &C h e m i c a l s L i m i t e d ,Chai rman and Chie fExecutive of Engro PolymerTrading (Pvt.) Limited,D i r e c t o r o f E n g r oPowerGen Limited andChairman of the Board ofInbox Business Technologies (Pvt.) Limited and Unicol(Pvt.) Limited. He has held key assignments with theCompany and with Exxon Chemical Canada. AChemical Engineer by qualification, Mr Qadir joinedthe Board in 1999.
is Managing Director at TheDawood Group. He hasdiversified experience ofw o r k i n g i n s e n i o rmanagement positions inmultinational and largePakistani organisations,having served as FinanceDirector, Supply ChainDirector and Head ofBusiness Unit at Reckitt
Benckiser (previously Reckitt & Colman), ManagingDirector, Haleeb Foods (previously CDL Foods Limited),as well as having been the Financial Advisor at Indus
Motor Company Limited. He holds a Masters Degreein Economics and is a Chartered Accountant from theInstitute of Chartered Accountants of England & Wales.Mr. Ahmad joined the Board in 2007.
is the Chairman of DawoodLawrencepur Limited andChief Executive of DawoodHercules Chemicals Limited.He is also a Member of theBoard of Governors ofNat ional ManagementFoundation, the sponsoringBody of Lahore Universityof Management Sciences(LUMS). A Masters in GlobalTextile Marketing and an LLB, Mr. Shahzada Dawoodhas been on the Board since 2005.
is the General Manager ofMitsubishi Corporation’soperations in Pakistan andDirector of Tri-Pack FilmsLtd. He has a degree in Lawfrom the University of Tokyo,Japan and has been withMitsubishi Corporation for32 years. He has a diverseexperience in handlingindust r ia l machinery,
construction equipment and environment and projectdevelopment. He joined the EPCL Board in 2005.
is the General Manager forMitsubishi Corporation'sChlor Alkali Unit and has adegree in Economics fromthe Keio University, Japan.He has been with MitsubishiCorporation for 27 years andhas held several key positionsduring this time. He Joined
the EPCL Board in 2005.
Asad Umar
Asif QadirPresident and
Chief Executive
Masaharu Domichi Director
DirectorIsar AhmadDirectorTakeshi Hagiwara
Chairman
DirectorShahzada Dawood
23Annual Report 2009
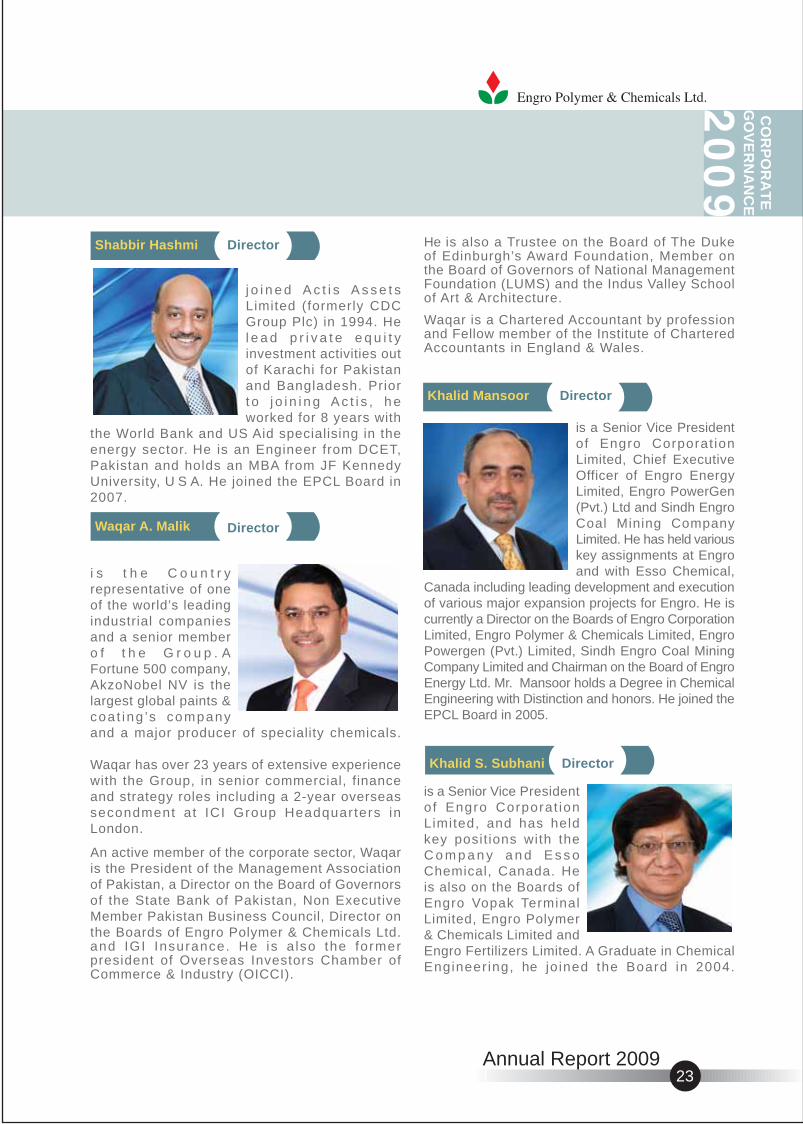
j o i n e d A c t i s A s s e t sLimited (formerly CDCGroup Plc) in 1994. Hel e a d p r i v a t e e q u i t yinvestment activities outof Karachi for Pakistanand Bangladesh. Priort o j o i n i n g A c t i s , h eworked for 8 years with
the World Bank and US Aid specialising in theenergy sector. He is an Engineer from DCET,Pakistan and holds an MBA from JF KennedyUniversity, U S A. He joined the EPCL Board in2007.
i s t h e C o u n t r yrepresentative of oneof the world’s leadingindustrial companiesand a senior membero f t h e G r o u p . AFortune 500 company,AkzoNobel NV is thelargest global paints &coa t ing ’s companyand a major producer of speciality chemicals.
Waqar has over 23 years of extensive experiencewith the Group, in senior commercial, financeand strategy roles including a 2-year overseassecondment at ICI Group Headquarters inLondon.
An active member of the corporate sector, Waqaris the President of the Management Associationof Pakistan, a Director on the Board of Governorsof the State Bank of Pakistan, Non ExecutiveMember Pakistan Business Council, Director onthe Boards of Engro Polymer & Chemicals Ltd.and IGI Insurance. He is a lso the formerpresident of Overseas Investors Chamber ofCommerce & Industry (OICCI).
He is also a Trustee on the Board of The Dukeof Edinburgh’s Award Foundation, Member onthe Board of Governors of National ManagementFoundation (LUMS) and the Indus Valley Schoolof Art & Architecture.
Waqar is a Chartered Accountant by professionand Fellow member of the Institute of CharteredAccountants in England & Wales.
is a Senior Vice Presidentof Engro Corporat ionLimited, Chief ExecutiveOfficer of Engro EnergyLimited, Engro PowerGen(Pvt.) Ltd and Sindh EngroCoal Mining CompanyLimited. He has held variouskey assignments at Engroand with Esso Chemical,
Canada including leading development and executionof various major expansion projects for Engro. He iscurrently a Director on the Boards of Engro CorporationLimited, Engro Polymer & Chemicals Limited, EngroPowergen (Pvt.) Limited, Sindh Engro Coal MiningCompany Limited and Chairman on the Board of EngroEnergy Ltd. Mr. Mansoor holds a Degree in ChemicalEngineering with Distinction and honors. He joined theEPCL Board in 2005.
is a Senior Vice Presidentof Engro Corporat ionLimited, and has heldkey posit ions with theC o m p a n y a n d E s s oChemical, Canada. Heis also on the Boards ofEngro Vopak TerminalLimited, Engro Polymer& Chemicals Limited andEngro Fertilizers Limited. A Graduate in ChemicalEngineer ing, he jo ined the Board in 2004.
Khalid Mansoor Director
Khalid S. Subhani Director
Waqar A. Malik Director
CO
RP
OR
AT
EG
OV
ER
NA
NC
E
DirectorShabbir Hashmi

24Annual Report 2009
PRINCIPAL BOARD COMMITTEES
Khalid Siraj SubhaniShabbir HashmiMasaharu DomichiIsar Ahmad (Chairman)
Board Audit Committee (BAC)
The BAC assists the Board in fulfilling its responsibilities, primarily in reviewing and reporting financial andnon-financial information to shareholders, system of internal control and risk management and the auditprocess. I t has the power to cal l for informat ion f rom management and to consul tdirectly with the external auditors or their advisors as considered appropriate.
The BAC comprises of non-executive Directors. The Chief Financial Officer, head of Internal Audit and arepresentative of the external auditors attend meetings of the Audit Committee at which issues relating toaccounts and audit are discussed. The Chief Executive Officer attends the meetings by invitation. TheCommittee also privately meets with the external auditors at least once a year. After each meeting theChairman of the Committee reports to the Board.
Members
The Secretary of the Committee is Saleem Lallany, Head of Internal Audit.
Board Compensation Committee (BCC)
The BCC is responsible for administering the compensation, organisation and employee development mattersrelating to the Company. It reviews the key human resource initiatives and organisational overview of theCompany.
The BCC consists of two independent non-executive directors, two non-executive directors and one executivedirector who is the CEO of the Company.
Members
Waqar A. MalikIsar AhmedAsif QadirAsad Umar (Chairman) Masaharu Domichi
The Secretary of the Committee is Hafsa Abbasy, Human Resource Manager.


CORPORATE GOVERNANCE
In recognition of the importance of good CorporateGovernance on the basis of proper managementpolicies, your Company pursues a policy of conformityto the accepted guidelines of all the stock exchangesof Pakistan and the Securities and ExchangeCommission of Pakistan (SECP). The Board ofDirectors is committed to honest, ethical,knowledgeable and comprehensive managementand to developing and implementing good CorporateGovernance as a means of achieving maximumsuccess and effectiveness. In short, good CorporateGovernance is a tool for enhancing the value of yourCompany and its sustainable growth.
The work of developing good Corporate Governanceis ongoing, and aims to incorporate standardsuniversally practiced. Improvements in goodCorporate Governance have been continuallyfocused upon.
The Structure of the Board of Directors
The Board of Directors consists of qualified individualspossessing knowledge, experience, and skill invarious professions, with the leadership and visionnecessary to act in the best interests of the Companyand its shareholders. The Board of Directors has amajor role to play in deciding corporate policy, andwith senior executives making plans for the short-term and long-term operations of the Company.
The Board of Directors presently comprises 10individuals, who are:
• Four independent non-executive directors, two of whom also represent minority interests• Five non-executive directors representing Engro
Corporation Limited, the majority shareholder; and• One executive director being the CEO of the Company.
Independent directors are qualified individuals withoutside experience who possess the attributesrequired by the SECP.
The Chairman of the Board is other than the CEO.
To further the efficient performance of its duties, theBoard of Directors appoints a number of sub-committees, namely the Board Audit Committee andthe Board Compensation Committee.
These and other committees have specialresponsibilities and make proposals to the Board ofDirectors for their consideration.
Each committee's rights and responsibilities arespecified in its own Terms of Reference.
Meetings of the Board of Directors
Meetings of the Board of Directors are held regularlyto take notice of the results of corporate operationsand their management and to make decisionsconcerning the Company's business activities.Meetings also take place to consider business trendsand mid-term operational plans of the Company andits subsidiary.
Various planning scenarios are deliberated on, aswell as the Company's annual business plan.
Asad UmarAsif QadirIsar AhmadShahzada DawoodMasaharu DomichiTakeshi HagiwaraKhalid MansoorKhalid S. SubhaniWaqar A. MalikShabbir Hashmi
Non-ExecutiveExecutiveNon-ExecutiveNon-ExecutiveIndependent / Non-ExecutiveIndependent / Non-ExecutiveNon-ExecutiveNon-ExecutiveIndependent / Non-ExecutiveIndependent / Non-Executive
26Annual Report 2009

27Annual Report 2009
Six Board meetings took place during the year.Attendance by each director is as follows:
No. of meetings attended
Asad Umar 5Asif Qadir 6Isar Ahmad 6Shahzada Dawood 5Masaharu Domichi 6Takeshi Hagiwara 6*Khalid Mansoor 5Khalid S. Subhani 5Waqar A. Malik 4Shabbir Hashmi 5
*Includes five meetings attended by AlternateDirectors
In all cases, complete minutes were taken andrecorded clearly in writing. Each meeting's minuteswere delivered to the Board of Directors forinformation and review.
Internal Control Framework
Your Company regards internal controls as animportant function, for which it has establishedsystems of international standards and modernizedthem to accord with the fast pace of change in thecontemporary business environment. Internal controlshave to do with the internal environment, controlactivities, information and communication systems,and monitoring to ensure both confidence andachievement of objectives.
The Internal Environment
Your Company has structured its organisation in away that corresponds well to its business plan andclearly assigned responsibilities to each department.High quality personnel are hired and all staff aregiven continuous chances to develop their knowledgeand competence and become good ethicalrepresentatives of the Company's commitment inpolicy to professional business standards.
Your Company also encourages staff to participatein and understand their work, while instilling in themthe responsibility of reducing risk. The work isconstantly being upgraded and improved andfashioned in such a way that internal controls are
an integral part of operations. Various operatingmanual have been produced to ensure efficiency ofoperations and avoid duplication of effort.
Risk Assessment
Your Company conducts its operations with a constantview of the risks involved, and has instituted measuresto control risk and ensures that it remains manageable.In this way, damage due to risk is minimized andstability is ensured. Long-term plans and annual plansare constructed in such a manner that concretemeasures of success can be obtained, and auditingoperations and insurance measures are also upgradedcontinuously with the help of various tools in the effortto reduce risk.
Control Activities
Your Company has determined a number of controlactivities that accord with the nature of its businessoperations, and assigned responsibilities in such away that mutual supervision is in effect.
Monitoring and Evaluation
Your Company continuously evaluates its owninternal control system and improves it to reflectchanging business conditions. New and moreaccurate knowledge is constantly being gatheredand disseminated to enhance the effectiveness ofthe system.
Internal Auditing
The Office of Internal Audit provides assurance tothe Audit Committee concerning the adequacy ofdisclosure, transparency of data, internal controls,and risk management. The emphasis is onpreventive, creative investigation and auditing thatconforms to international standards and goodCorporate Governance. The ultimate purpose is tofacilitate continuous development and a greaterawareness of the need for preventive measureswithin the organisation.
Validation of Corporate Governance
The Statement of Compliance with the Code ofCorporate Governance and the Review Report tothe Members on Statement of Compliance withbest practices of Code of Corporate Governancethereon are included in the Financial Statementssection.
CO
RP
OR
AT
EG
OV
ER
NA
NC
E

28Annual Report 2009
DIRECTORS» REPORT
30 Business Review33 Financial Review35 Safety, Health and Environment37 Corporate Social Responsibility40 Employees and Organisation Development42 Customer Focus42 Research and Development43 Information Systems43 Business Outlook44 Corporate Review
29Annual Report 2009
The Directors of Engro Polymer & ChemicalsLimited are pleased to present the audited accountsof the Company for the year ended December31, 2009.
PRINCIPAL ACTIVITIES
The pr incipal ac t iv i ty of the Company is tomanufacture, market and sell Chlor-Vinyl chemicalswhich include Poly Vinyl Chloride (PVC), VinylChloride Monomer (VCM), Ethylene Di Chloride(EDC), Caustic soda, Sodium Hypochlorite andother allied chemicals. The Company is listed ona l l t he t h ree s tock exchanges o f Pak i s t an .
DIR
EC
TO
RS
’R
EP
OR
T

REVIEW OF THE EXPANSION AND BACKINTEGRATION PROJECT
Expansion and back integration project wascompleted during the year for a total cost of US $255 million. All plants except the VCM plant cameinto commercial production during the year.Completion of VCM plant was delayed by threemonths. The initial start up attempt was unsuccessfulresulting in a delay till October. The plant was thenstarted up in end of October 2009 and VCM wasproduced in November. However, due to anunfortunate fire incident at the plant, onDecember 9, 2009, the plant had to be shutdown.PVC, EDC and Chlor-alkali plants were back in
operations by end of December 2009 while VCMplant is expected to come into commercial operationin first quarter 2010.
PRODUCTION AND SALES REVIEW
During the year, 116K tons (2008: 103K tons) ofPVC was produced against nameplate capacity of150K tons per annum. Capacity utilisation of PVCplants remained low due to limited availability ofVCM as a result of delayed in-house production.VCM shortfall was partially fulfilled by procuring onspot basis from international market, however, giventhe tight demand supply balance in the region, attimes, VCM could not be timely arranged resultingin lower operating rate of the PVC plants.
BUSINESS REVIEW
30Annual Report 2009

31Annual Report 2009
PVC domestic sales volume during the year was119K tons (2008: 98K tons) which is the highestever since inception of the Company. Growth ofmore than 20% in domestic sales, over last year,was mainly attributable to the strong demand comingout of Government projects, increased usage ofPVC pipes in agricultural sector and export of pipesand fittings to Afghanistan. The Company alsoexported 10K tons of PVC during the year throughits subsidiary, Engro Polymer Trading (Pvt.) Limited.
Chlor-alkali plant came into commercial operationfrom August 1, 2009. Caustic soda production duringthe year was 39K tons. Company successfullylaunched Caustic soda which was very well receivedby the customers and made quick inroads into thedomestic market. A total of 32K tons was sold in thedomestic market whereas 2K tons was exportedthrough its subsidiary. Successful launch of Causticsoda was mainly attributable to high product qualitysupported by competitive pricing and an efficientdistribution system.
EDC plant came into commercial operation fromAugust 1, 2009. During the year, 42K tons of EDCwas produced. Due to delay in commissioning ofVCM plant, EDC produced could not be fully utilizedto manufacture VCM therefore the Companyexported 32K tons of EDC through its subsidiary.A total of 6K tons of VCM was also produced duringthe year which was used in production of PVC.
In addit ion to above, 7K tons of SodiumHypochlorite was produced from Chlor-alkaliplant which was sold in the domestic market.
2000 2001 2002 2003 2004 2005 2006 2007 2008 2009
140120100
80604020To
ns
In ‘0
00
Production Sales
PVC Production and Sales Volume
Jun-09 Jul-09 Aug-09 Sep-09 Oct-09 Nov-09 Dec-09
80%
60%
40%
20%
0%
SouthNorth
Region Wise Caustic Sale
Sh
are
(%)
2008 PVC Sector Wise Sales5%4%7%
7%5%
5%
14%
54%
Pipes & Fittings Artificial Leather Rigid Sheet Twist/Shrink/Film
ShoesGarden Hose Compounding Others
Industry Wise Caustic Sale
67%
16%
17%
Textiles
Soaps and Detergents
Others
2009 PVC Sector Wise Sales
Pipes & Fittings Artificial Leather Rigid Sheet Twist/Shrink/Film
ShoesGarden Hose Compounding Others
3%4%8%
13%
5%1%
58%
8%
DIR
EC
TO
RS
’R
EP
OR
T

The Company also entered into a Power SupplyAgreement with Karachi Electric Supply Company(KESC) during the year to sell surplus power toKESC. The sale of power commenced from endof August and the Company sold an average of9MW power during the year. The Company hasan infrastructure to sell up to 18 MW to KESC.
PRICE TRENDS
International PVC prices staged a recoveryduring 2009. Prices increased from around US$ 600/ton in the beginning of the year to aroundUS $ 900/ton by August 2009. PVC pricesdropped slightly, on account of slow demand,in September to November 2009 period butsurged back to US $ 940 per ton in December.
Average international PVC-VCM margin in 2009,remained around US $ 150 per ton afterplummeting to an average of US $ 57 per tonin the fourth quarter 2008. Ethylene pricesshowed an upward trend in 2009, increasingfrom US $ 620 per ton in January to US $ 1,205per ton in December 2009. The increase inEthylene prices was attributable to high crude
oil prices coupled with supply-demand gap inthe region. High Ethylene prices also supportedhigher VCM and PVC prices.
MARKET SHARE
The Company remains the sole manufacturerof PVC in the country and according to ourestimate approximately 5K tons of PVC resinwas imported during the year.
32Annual Report 2009
International Price Trends - Vinyl Chain
BUSINESS REVIEW
Jan-10 Feb-10 Mar-10 Apr-10 May-10 Jun-10 Aug-10
1400
1200
1000
800
600
400
200
0Sep-10 Oct-10 Nov-10 Dec-10
EthyleneEDC VCMPVC
U$$
Jul-10

33Annual Report 2009
FINANCIAL REVIEW
Company made a loss after tax of Rs. 232 million ascompared to a profit after tax of Rs. 353 million last year.The consolidated loss after tax was Rs.194 million ascompared to consolidated profit after tax of Rs. 350 millionlast year. The main reasons for the loss are attributableto incremental costs related to depreciation, financialcharges and other fixed costs on account of expansionand back integration whereas full economic benefits of
the integrated facility could not be attained as VCM planthad not come into commercial production.
The total assets of the Company increased byRs. 4,277 million during the year mainly due to theexpansion and back integration project.
500
400
300
200
100-
(100)
(200)
(300)
(400)
2000 2001 2002 2003 2004 2005 2006 2007 2008 2009
Rs
M
Profit / (Loss) After Tax
Rs
M
2000 2001 2002 2003 2004 2005 2006 2007 2008 2009
12,000
10,000
8,000
6,000
4,000
2,000
Sales Revenue
DIR
EC
TO
RS
’R
EP
OR
T

Value Addition
Gross salesSupply of electricityExport salesOther incomeExport rebateCost of materialTOTAL
2009)
13,556,052)214,924)
72,015)100,262)
-) (9,704,309)
4,238,944)
2008)
9,449,462)24,177)79,223)
124,334)69)
(6,471,260)3,206,005)
Rs. in thousand
Value Distribution
Taxes and SEDEmployee remuneration and benefitsDonationsDividendsInterest expenseOther expensesRetained in the businessTOTAL
2009)
2,329,650)339,100)
7,527)-)
596,264)688,994)277,409)
4,238,944)
2008)
1,685,275)232,881)
1,527)252,896)
33,529)722,542)277,355)
3,206,005)
Statement of Value Addition and Distribution
34Annual Report 2009
55%
8%
14%
16%7%
Value Distributed 2009Value Added 2009
93%
5% 2%
Sales less Material Power Supply Other Income
Value Added 2008
95%
1% 4%
Sales less Material Power Supply Other Income
Value Distributed 2008
7%
53%
8%1%
22%
9%Taxes and SED
Dividends
Other expenses
Employee Remunerationand Benefits
Interest expense
Retained in the Business
Taxes and SED
Employee Remunerationand Benefits
Interest expense
Retained in the Business
Other expenses

DIR
EC
TO
RS
’R
EP
OR
TD
IRE
CT
OR
S’
RE
PO
RT
SAFETY, HEALTH & ENVIRONMENT
SAFETY
The Company is committed to the safe operationsof its facilities. Potential safety hazards aresystematically identified and the risks from thesehazards are managed in a way that employees,public and the environment are protected. Themanagement of risk is a continuous process; awritten Safety, Environment and Industrial Hygiene(SEIH) Policy exists and all employees are requiredto adhere to the outlined procedures and practices.The policy is regularly updated and all changes arepromptly communicated to the employees. Moreover,
an organised programme for hazard identification,evaluation and control is also in place. A number ofinternal and external audits and surveys, areconducted periodically to monitor compliance withthe requirements and standards, and provide thebasis for specific managerial/supervisory actions.As per Du-Pont standards, our safety managementhas been rated at 2.0.
Leading Indicators include 31 items which are beingmonitored at EPCL Plant site and results are sharedon monthly basis in Safe Operation Committee(SOC).
35Annual Report 2009

A dispensary equipped with a team of paramedicsand ambulance is also present at the Plant torespond to any emergency.
SAFETY INCIDENTS
During commissioning of VCM plant in June 2009,a safety incident had taken place which resultedin release of certain vapours. The plants weresafely shutdown and no one got injured in the
incident. In December 2009, a fire incident tookplace in the scrubbing area of the of VCM plant.Immediate action was taken and the fire wasbrought under control and contained fromspreading within a short period of time. All theplants were safely shutdown and damage waslimited to VCM scrubbers and part of the pipingsystem. All the plants remained safe and PVC,EDC and Chlor-alkali plants were back in operationby the end of December. The fire incident resultedin burn injuries to one of the Company employeeswho unfortunately expired after 12 days of medicaltreatment.
HEALTH
The Company has established policies regardingoccupational health which apply to all employeesat the time of recruitment and during service.Employees' occupational health involves twoelements; first, how work can influence health,and second, how health can affect work.
ENVIRONMENT
EPCL believes in protection and conservation ofenvironment while ensuring that all operations andactivities remain environment friendly. The Companyhas a comprehensive Environmental ManagementSystem (EMS), certified and regularly audited byISO 14001:2004. EMS provides�a framework formanaging environmental responsibilities in anefficient way that it is integrated into the overallmanufacturing operations.
All plant effluent has to pass through an AerobicBacteria based system of water treatment beforebeing disposed of. Plant effluent is tested regularlyagainst various parameters. Any deviation fromNEQS is recorded, investigated and actions aretaken to avoid recurrence. Three NEQS excursionswere recorded during the year, and were reported
to the relevantauthorities.
EPCL environmentalfootprints are basedon the performanceof:• effluent quality, quantity• emissions profile• waste generation• CFC venting• natural resource consumption (paper, water and electricity)• VCM venting and losses• NEQS excursion or any major or minor
environmental incident.
EPCL Environmental Performance Reports areconsecutive winners of ACCA-WWF EnvironmentalReporting Awards for BEST ENVIRONMENTALREPORT on transparency reporting. EPCL wasnominated in a panel of judges in year 2009 tojudge the Environment Reports for the year 2008.
36Annual Report 2009
SAFETY, HEALTH & ENVIRONMENT

DIR
EC
TO
RS
’R
EP
OR
T
CORPORATE SOCIAL RESPONSIBILITY
EPCL’s Corporate Social Responsibility (CSR)strategy focuses on Environment & Communityinvolvement in line with the Company’s CSRpolicy and Core Values. A total of Rs. 8.4 millionwas spent during the year whereby followingCSR initiatives were taken.
Forestry Projects
EPCL launched 100 hectares of plantation intwo different areas of Pakistan. The objectiveof this project is to contribute towards greenerPakistan and to show industrial participation in
working towards addressing the longer termimpact of carbon emission.
The Project was initiated in March 2009 afterdetailed review and correspondence with ForestDepartment of Punjab and facilitation by Ministryof Environment Pakistan. First 50 hectares werestarted in April 2009 at Changa Manga. Theproject is being monitored by WWF Pakistan.To date the success rate of plantation is 93%based on key performance indicators developedby WWF Pakistan.
37Annual Report 2009
38Annual Report 2009
CORPORATE SOCIAL RESPONSIBILITY
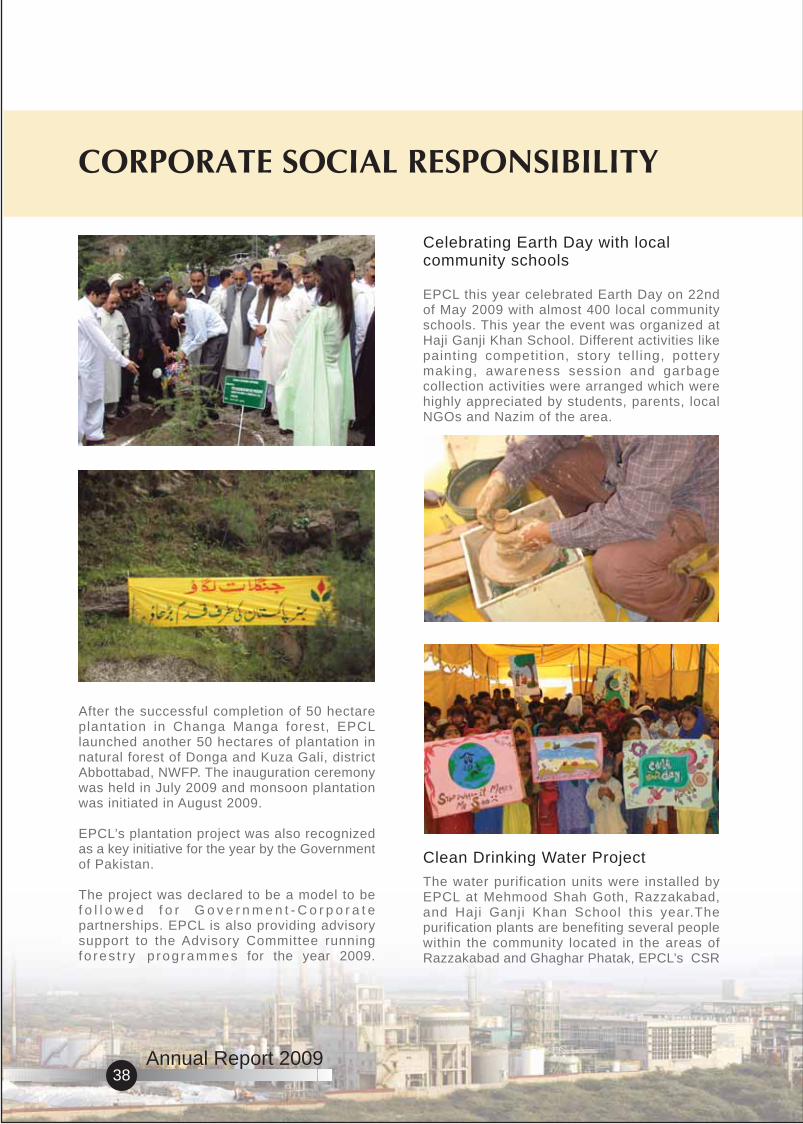
After the successful completion of 50 hectareplantation in Changa Manga forest, EPCLlaunched another 50 hectares of plantation innatural forest of Donga and Kuza Gali, districtAbbottabad, NWFP. The inauguration ceremonywas held in July 2009 and monsoon plantationwas initiated in August 2009.
EPCL’s plantation project was also recognizedas a key initiative for the year by the Governmentof Pakistan.
The project was declared to be a model to bef o l l o w e d f o r G o v e r n m e n t - C o r p o r a t epartnerships. EPCL is also providing advisorysupport to the Advisory Committee runningfo res t r y p rog rammes for the year 2009.
Celebrating Earth Day with localcommunity schools
EPCL this year celebrated Earth Day on 22ndof May 2009 with almost 400 local communityschools. This year the event was organized atHaji Ganji Khan School. Different activities likepainting competit ion, story tell ing, potterymaking, awareness session and garbagecollection activities were arranged which werehighly appreciated by students, parents, localNGOs and Nazim of the area.
Clean Drinking Water Project
The water purification units were installed byEPCL at Mehmood Shah Goth, Razzakabad,and Haji Ganji Khan School this year.Thepurification plants are benefiting several peoplewithin the community located in the areas ofRazzakabad and Ghaghar Phatak, EPCL’s CSR

DIR
EC
TO
RS
’R
EP
OR
T
39Annual Report 2009
Commi t tee t racks the pe r fo rmance o ffunctioning of the installed units and continuesto have frequent dialogues with the communityrepresentatives about the proper utilisation andbenefits of the units.
Promotion of Water Conservation
The Company continued its focus on promotingwater conservation particularly in the agriculturesector. Support to High Efficiency IrrigationSystems (HEIS) industry in Pakistan wascontinued with active support to a Governmentproject “Water Conservation & ProductivityEnhancement through High Efficiency IrrigationSystem”. Proposals for more than 10,000 acreshave been submitted and are awaiting approvals.Twenty five additional HEIS supply companieshave been short-listed in the project to expeditethe installation work which has increased thetotal number of supply companies to 45 now.EPCL, through its regional offices, is expandingits outreach to provide support to new entrantsin areas of system design, installation, manpowert ra in ing, and f ie ld ex tens ion act iv i t ies .
Use of PVC geo-membrane is being promotedin the non-governmental sector in various water-related projects. PVC geo-membrane has beensuccessfully used by various NGOs in rain waterand grey water harvesting projects. Companyhas started a pilot project on water conservationawareness in District Umerkot in partnershipwith an NGO. The project includes carrying outo f a ser ies o f d ia logues w i th var iousstakeholders. The Company also participatedin installation of Demand Based Irrigation Systemin Naran Mansehra District which has brought132 acres of rain-fed area under controlledirrigation.
EDUCATION
Supporting Community SchoolsEPCL has been supporting community schoolsfor last couple of years. This year three moreschools were identified for development work.Not only the focus is on improving quality ofeducation, but also several sessions wereconducted with teachers and parents for theirsuggest ions for improving the qual i ty ofeducat ion in the government schools ofRazzakabad and Ghaghar Phatak.
EPCL Scholarship Programmes
EPCL has been running a programme for thelast f ive years providing scholarships tostudents.The Company this year started anotherscholarship programme for the community schoolchildren including students from Ghaghar Phatakand Razzakabad .The programme is titled as“Engro Polymer & Chemicals ScholarshipProgram”. This programme is directed towardtechnical education and also includes Englishlanguage and Computer courses. The conceptof this programme is to technically equip youthfrom the local community to be able to earnlivelihood for themselves and their families.
Sponsoring Taleemi Mela
This year EPCL has sponsored the programmeof “TALEEMI MELA” held in May 2009 wherethe students of the nearby communit iesparticipated. The event was held to createawareness about the importance of educationfor children.
Donations & Sponsorships
EPCL also provided financial support to variousorganisations operating in the areas of Health,Education and Social uplift.

Valuing PeopleEPCL’s success is built on its workforce – a source ofpride for the Company. At the end of 2009, the Companyhad over 350 employees in a corporate family that hasalmost doubled in size in two years.
As a socially responsible employer, we respect ouremployees’ rights and endeavour to provide a safe andhealthy workplace, fair policies and procedures, freedom
of opinion and expression and open dialogue with ouremployees.
In addition to offering attractive and fair compensationand benefits, EPCL encourages and invests in itsemployees' lifelong learning and professionaldevelopment, and promotes a healthy balance betweenpersonal and professional lives.
40Annual Report 2009
EMPLOYEES & ORGANISATIONDEVELOPMENT
41Annual Report 2009
A demonstrated engagement in diversity, proactiveinclusion and equal opportunity is an investment in ourpeople and our future growth. Our commitment toprovide equal opportunity to all employees andapplicants for employment in accordance with allapplicable laws, directives and regulations isconstantly reaffirmed through our policies and best-in-class practices.
Human Resource Management provides policies,practices and tools that create a workplace capableof motivating, developing and rewarding employeesto achieve success.
The Company has been accredited with Investorsin People (IIP) certification which is an indicationof the open communication and alignment ofemployees’ objectives with those of the organisation.
Recruitment
The Company has a proactive recruitment strategyin place to ensure optimal manning for ongoingbusiness needs.In the year 2009, 122 (2008: 136)new employees joined the Company which was inline with the expansion/back integration recruitmentplan.
Compensation & Benefits
The Company is focused at rewarding employeesfor their level of performance which inculcates an
enthusiasm and spirit to set higher targets, anexample of which is the Employee Share OptionScheme.
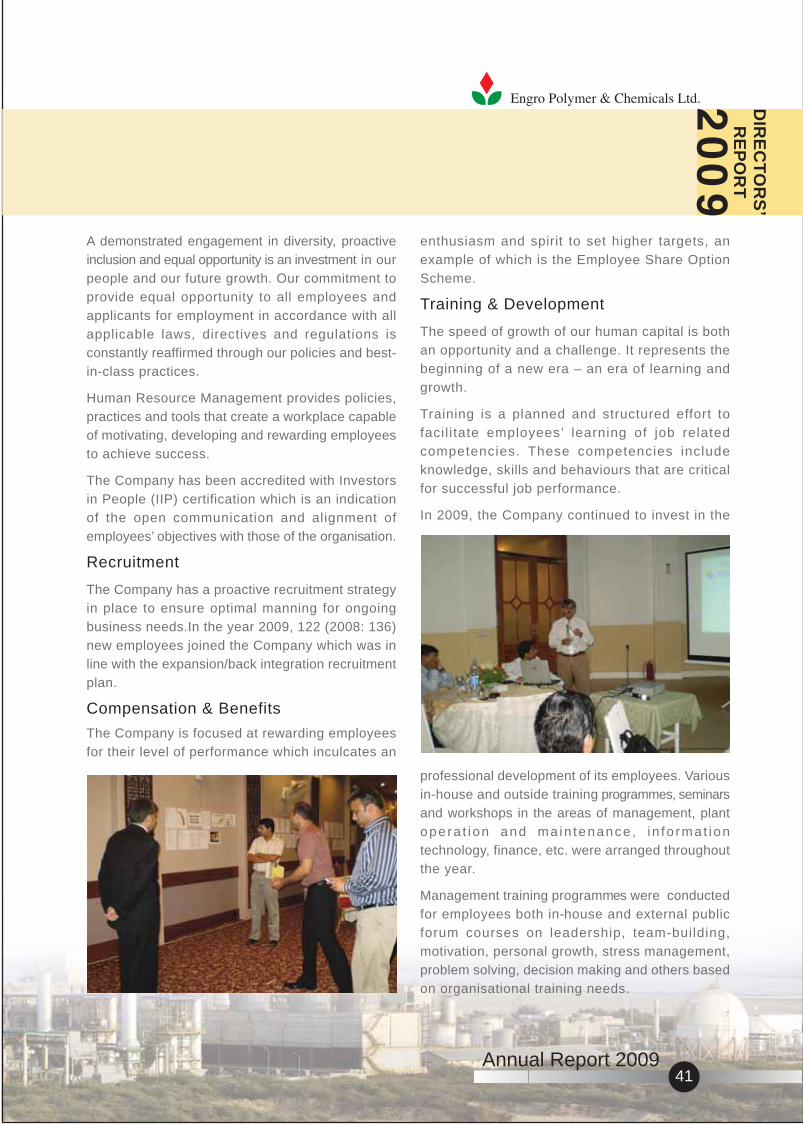
Training & Development
The speed of growth of our human capital is bothan opportunity and a challenge. It represents thebeginning of a new era – an era of learning andgrowth.
Training is a planned and structured effort tofacil i tate employees’ learning of job relatedcompetencies. These competencies includeknowledge, skills and behaviours that are criticalfor successful job performance.
In 2009, the Company continued to invest in the
professional development of its employees. Variousin-house and outside training programmes, seminarsand workshops in the areas of management, plantopera t ion and ma in tenance , in fo rmat iontechnology, finance, etc. were arranged throughoutthe year.
Management training programmes were conductedfor employees both in-house and external publicforum courses on leadership, team-building,motivation, personal growth, stress management,problem solving, decision making and others basedon organisational training needs.
DIR
EC
TO
RS
’R
EP
OR
T

42Annual Report 2009
CUSTOMER FOCUS
the focus was to help improve the productionprocesses, recipes, product quality andproduction output at the customer facilities.
On the Caustic soda front, the Company setup a state of the art distribution system. Alsoall vehicles are equipped with tracking devicesto ensure timely delivery to customers.
At EPCL, the belief is to build long termrelationships with our customers wherevalue added services can be provided tothe customers to help them maintain along term sustainable profitable growth. Anumber of formal and informal trainingsessions were conducted for the downstream PVC industry focusing mainlytowards enhancing the knowledge baseof the human resource at the customerend.
In addition to this sixteen (16) CustomerTechnical Audits were conducted by theTechnical Services team of EPCL where
During the year, the representatives ofEPCL locally developed a recipe for lead-free pipes for use in potable water systems,food grade geo-membrane for lining waterreservoirs, medical compound for I.V. setsand syringe gaskets.
RESEARCH AND DEVELOPMENT
DIR
EC
TO
RS
’R
EP
OR
T
43Annual Report 2009
PVC domestic sales are expected to showa growth in 2010 due to expected scrapconversion and continuation of Governmentsponsored projects. PVC-VCM margin isalso expected to improve next year oncethe VCM plant comes into commercialoperation in first quarter 2010. High oilprices and supply demand gap in Ethyleneare expected to maintain high Ethyleneprices during first half of 2010.
However, additional capacities arescheduled to come on line in second halfwhich should ease off some pressure andEthylene prices may decrease. This willhave a trickle down effect on the PVC andVCM prices.
BUSINESS OUTLOOK
INFORMATION SYSTEMS
Demand for Caustic soda is expected tobe strong and the Company is determinedto capture maximum market share byoffering value for money in terms of productquality and customer services. EPCL plansto continue to sell surplus power to KESC.Company’s strategy would continue tomaintain focus on domestic market andexport any surplus available product.
The Company is also studying utilisationof the Hydrogen which is available at siteand ways to grow both PVC and Causticsoda capacities to cater to growingdemand. It is expected that these studieswill be completed in 2010.
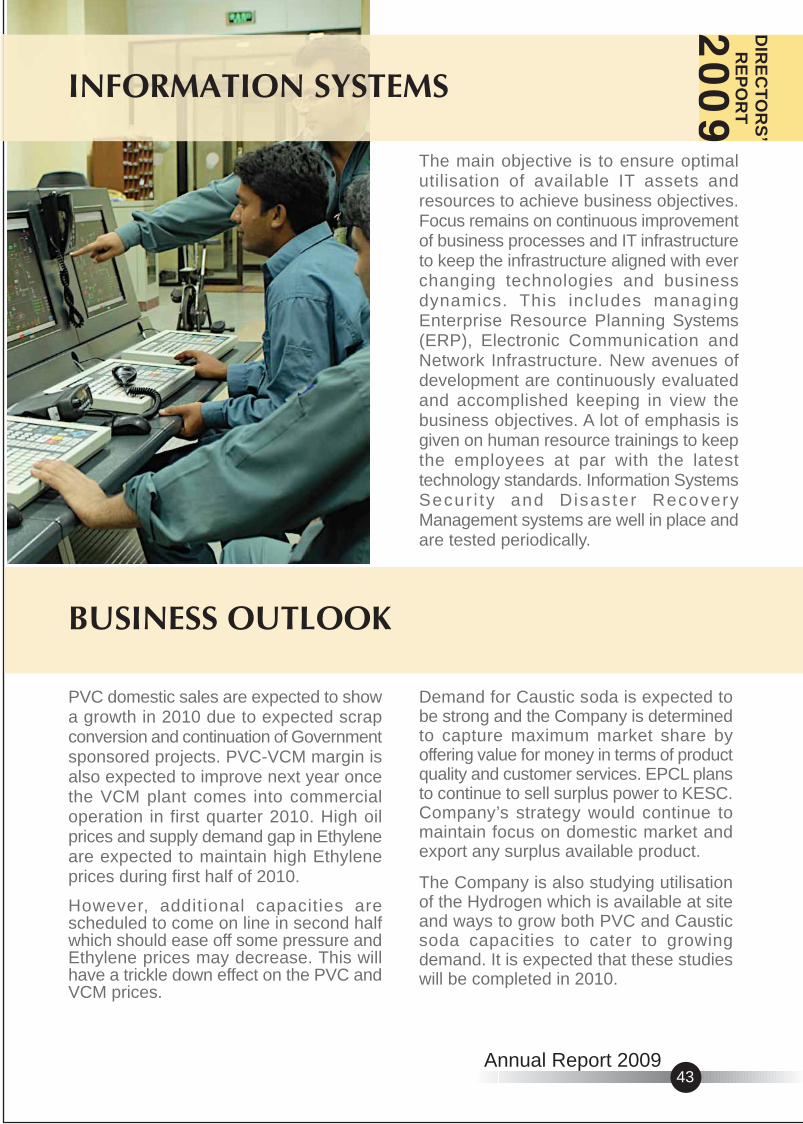
The main objective is to ensure optimalutilisation of available IT assets andresources to achieve business objectives.Focus remains on continuous improvementof business processes and IT infrastructureto keep the infrastructure aligned with everchanging technologies and businessdynamics. This includes managingEnterprise Resource Planning Systems(ERP), Electronic Communication andNetwork Infrastructure. New avenues ofdevelopment are continuously evaluatedand accomplished keeping in view thebusiness objectives. A lot of emphasis isgiven on human resource trainings to keepthe employees at par with the latesttechnology standards. Information SystemsSecur i ty and Disaster RecoveryManagement systems are well in place andare tested periodically.

44Annual Report 2009
CORPORATE REVIEW
56.214.611.03.51.20.90.1
12.5-
100.0
292,399,99276,200,00056,999,99818,000,000
6,483,2474,814,778
320,00065,149,652
10520,367,677
Engro Corporation Limited (Formerly Engro Chemical Pakistan Limited)International Finance CorporationMitsubishi CorporationEPCL Employees TrustBanks, Development Financial Institutions, Non-Banking Financial InstitutionsModarabas and Mutual FundsInsurance CompaniesIndividuals and othersDirectorsTotal
SHAREHOLDING OF THE COMPANYThe shareholding of the Company as at December 31, 2009:
No. of Shares Holding %

45Annual Report 2009
EMPLOYEES’ SHARE OPTION SCHEME
The employees' share option scheme (the Scheme)was originally approved by the shareholders at theirExtraordinary General Meeting (EGM) held onOctober 8, 2007. Under the scheme, employeeswho were considered critical to the businessoperations were granted options to purchase 5.3million newly issued ordinary shares at an exerciseprice of Rs. 22 per ordinary share. The number ofoptions granted was calculated by reference to thecriticality of an employee to the business and withthe approval of the Board Compensation Committee.The options carry neither right to dividends nor votingrights. Vesting period started from the ‘grant date’and ends on December 31, 2009, where after theoptions can be exercised within a period of twoyears.
During last year, the Company had proposed certainchanges relating to ‘grant date’ in the originallyapproved Scheme. These changes were approvedby the shareholders at their EGM held on June 27,2008, and subsequently by the Securities andExchange Commission of Pakistan on September25, 2008. As per the approved change to the Schemethe ‘grant date’ is the date of EGM held on October8, 2007, when the Scheme was originally approved.The effect of the change in the grant date aggregatingRs.1 million had been recognised last year.Movement of the Deferred Employee Compensationexpense for the year has been as follows:
The Company used Black Scholes pricing model tocalculate the fair value of share options at the grantdate. The fair value of the share options as per themodel and underlying assumptions are as follows:
- Total number of share options granted 5,300,000
- Fair value of the share options at grant date Rs. 1.86
- Share price at grant date Rs. 18- Exercise price per share Rs. 22- Annual volatility based
on historical pattern 15.13%- Risk free rate used 10.12%- Expected dividends Nil
Employee-wise detail of options granted to seniormanagement personnel is as follows:
Asif Qadir 1,192,858Syed Ahsenuddin 792,858Arshaduddin Ahmed 392,857Syed Nayyar I. Raza 242,857Zia Naeem Siddiqui 242,857Syed Ashar Hussain 142,857Saleem Lallany 67,857
During the year, 292,857 options lapsed on accountof resigned employees. Further, the average marketprice of the share remained below the exercise price,therefore, diluted earnings per share has not beencalculated.
MAJOR JUDGEMENT AREAS ANDESTIMATES
Infrastructure Cess
The Company, in the year 2003 along with othercompanies filed an appeal before the HonourableHigh Court of Sindh (High Court) against the levyof cess at the rate of 0.5% by the Government ofSindh (Excise and Taxation Officer) through theSindh Finance (Second Amendment) Ordinance,
(Rupees inthousand)
4,381
545
3,836
-
Balance as at January 1, 2009
Less: Options lapsed
Less: Amortization for the period
Balance as at December 31, 2009
DIR
EC
TO
RS
’R
EP
OR
T

2001, for special maintenance and development ofinfrastructure for movement of goods. During the lastyear, the High Court through its order dated September17, 2008 directed that the levy of cess imposed andcollected from December 28, 2006 is leviable and allimposition and collection before such date have beenrendered invalid. The Company has been accruing thesaid levy in the annexed financial statements, whichhas accumulated to Rs.263 million. However, taking aprudent approach, the accrual for the period prior toDecember 28, 2006 amounting to Rs.84 million has notbeen reversed in the annexed financial statements asthe matter is now pending before the Supreme Courtof Pakistan and also because the bank guaranteesamounting to Rs.270 million furnished by the Companyto the Government of Sindh (Excise and Taxation Officer)have not yet been released.
Special Federal Excise Duty
As at December 31, 2009, the Company had paid Rs.95 million on account of Special Excise Duty (SED) onimport of plant and machinery for the Project. Out ofthis amount the Company adjusted Rs. 58 million inthe monthly sales tax returns against SED on goodsproduced and sold by the Company. The Company hadapproached the Federal Board of Revenue to obtain aclarification in respect of the adjustment of SED madeby the Company in monthly sales tax returns. Pendingsuch clarification, the Company based on prudencehad made provision for the adjusted amount of Rs. 58million and for the balance remaining of Rs. 37 millionincluded in loans, advances, deposits, prepaymentsand other receivables.
During the year, the Company received Show causenotices from the Additional Collector (Adjudication) –Federal Board of Revenue, stating that the Company,by adjusting the aforementioned SED, has violated the
provisions of the Federal Excise Act, 2005 and theFederal Excise Rules, 2005 read with SRO 655(1)/2007and that the amount adjusted is recoverable from theCompany under the Federal Excise Act, 2005 alongwith default surcharge and penalty.
In response to these notices the Company has filed aConstitutional Petition before the Honourable HighCourt, Sindh, on May 18, 2009. The High Court is inthe process of evaluating the Constitutional Petition.The Company is confident that the ultimate outcomeof the matter will be in its favour, however, based onprudence is maintaining the aforementioned provision.Further, a provision of Rs. 13 million for surcharge andpenalty thereagainst upto December 31, 2009 has alsobeen made.
Custom Duty
The Collector of Customs in its order dated April 11,2008, decided the case against the Company in respectof refund application for duty paid on import of RawMaterial. The Company based on the advice of its taxconsultant, filed an appeal before the Collector ofCustoms (Appeals), Karachi dated May 31, 2008 againstthe aforementioned order. However, the Companybased on prudence made full provision amounting toRs.18 million, during 2008, against the aforementionedcustom duty refundable.
Hedging Reserve
The Company has entered into interest rate swapagreements with banks to hedge its interest rateexposure on floating rate borrowing from InternationalFinance Corporation (IFC) for an amount of US$ 40million. The swaps are effective for the period startingfrom December 15, 2008 and ending on June 15, 2017.The fair value of the interest rate swaps as at December31, 2009 amounted to Rs.20 million which has beendebited to equity, net of tax.
46Annual Report 2009
CORPORATE REVIEW

Risk Factors Mitigants
Reduction in domestic demand of PVC and Caustic soda EPCL’s annual production capacity of PVC is150K tons which is in the optimum range forPakistan market. Over the years the Companyhas also developed an export customer base inthe international market and is in a reasonablycomfortable position to export surplus quantities ofPVC.
Caustic soda was recently launched in thedomestic market and the product gained marketpenetration in a very short period of time.Production capacity of EPCL is sufficient onlyto cater to about one-third of the domesticdemand. In a scenario where demand is reducedEPCL would be in a position to maintain its salesvolume on account of its competitive advantage interms of more efficient operations and productquality. In addition to this EPCL also has thecapability to export Caustic soda.
Non availability of main raw materials for PVC In the integrated facility main raw material required toEPCL to produce PVC is Ethylene. The risk of nonavailability of Ethylene is very low as additionalEthylene capacities have and are coming onlinein the Middle East. Moreover, EPCL still has thecapacity to produce PVC by importing VCM andexporting EDC.
Increase in Crude oil prices resulting in increase The financials of the business are affected byof Ethylene prices PVC-Ethylene margins. As both PVC and Ethylene
are part of the Chlor Vinyl chain therefore increase inEthylene prices would also push PVC prices higher.
BUSINESS RISK AND CHALLENGES
Following risks are considered to be relevant in evaluating the overall outlook and business strategy of theCompany:
DIR
EC
TO
RS
’R
EP
OR
T
47Annual Report 2009

566566*5455
Asad UmarAsif QadirIsar AhmadShahzada DawoodMasaharu DomichiTakeshi HagiwaraShabbir HashmiWaqar A. MalikKhalid MansoorKhalid S. Subhani
48Annual Report 2009
FINANCIAL RISK MANAGEMENT
The treasury activities are controlled and are carriedout in accordance with the policies approved by theBoard. The risks managed by the treasury functionare funding risk, interest rate and currency risk. Thepurpose of the treasury policies is to ensure thatadequate cost-effective funding is available to theCompany at all times and that exposure to fundingrisk is minimized. The Company uses interest rateswaps and forward currency contracts keeping inview the exposure to related risks and regulatoryframework, to manage both interest and currencyrates on the underlying business activities.
COMPLIANCE WITH CORPORATEGOVERNANCE
The Board of Directors reviews all significant mattersof the Company. These include Company’s strategicdirection, annual business plans and targets, decisionon long term investments and borrowings. The Boardof Directors is committed to maintain high standardsof Corporate Governance.
The Board of Directors is pleased to report that:
• The financial statements prepared by the management present fairly its state of affairs, the
results of its operations, cash flows and changesin equity.
• Proper books of accounts have been maintained.
• Appropriate accounting policies have been consistently applied in preparation of financial statements and accounting estimates are based
on reasonable and prudent judgment.
• International Accounting Standards, as applicablein Pakistan, have been followed in preparation offinancial statements and any departure there fromhas been adequately disclosed.
• The system of internal control is sound in design
and has been effectively implemented and monitored.
• There are no significant doubts about Company’sability to continue as a going concern.
• There has been no material departure from the best practices of Corporate Governance.
• The fair value of investment of Provident fund, Pension fund and Gratuity fund based on their respective audited accounts for the year ended June 30, 2008 are as follows:
Rupees in million
Provident Fund 80.0
Pension Fund 66.6
Gratuity Fund 25.1
• Six Board meetings were held during 2009.
Attendance by each Director is as follows:
No.of meetings attended
*Includes five meetings attended by Alternate Directors
CORPORATE REVIEW
DIR
EC
TO
RS
’R
EP
OR
T
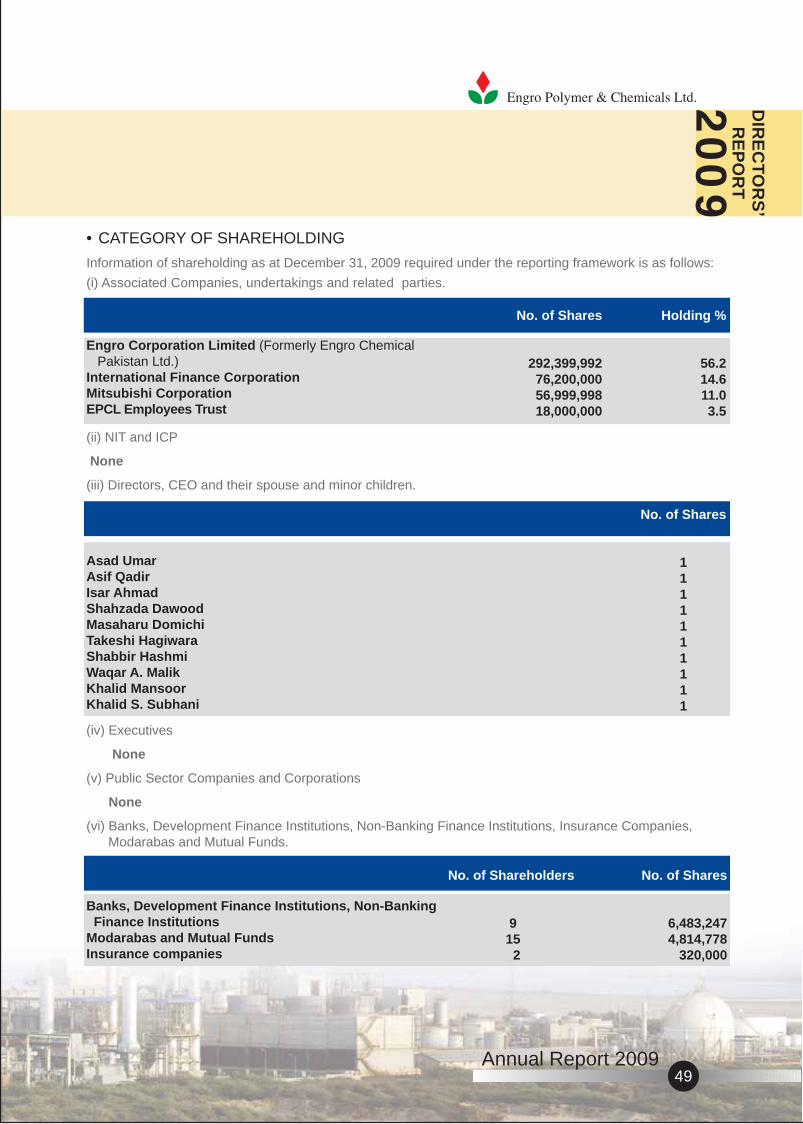
(ii) NIT and ICP
None
(iii) Directors, CEO and their spouse and minor children.
Banks, Development Finance Institutions, Non-Banking Finance InstitutionsModarabas and Mutual FundsInsurance companies
No. of Shareholders
9 15 2
No. of Shares
6,483,247 4,814,778
320,000
Asad UmarAsif QadirIsar AhmadShahzada DawoodMasaharu DomichiTakeshi HagiwaraShabbir HashmiWaqar A. MalikKhalid MansoorKhalid S. Subhani
No. of Shares
1111111111
Engro Corporation Limited (Formerly Engro Chemical Pakistan Ltd.)International Finance CorporationMitsubishi CorporationEPCL Employees Trust
No. of Shares
292,399,99276,200,00056,999,99818,000,000
Holding %
56.214.611.03.5
(i) Associated Companies, undertakings and related parties.
(iv) Executives
None
(v) Public Sector Companies and Corporations
None
(vi) Banks, Development Finance Institutions, Non-Banking Finance Institutions, Insurance Companies, Modarabas and Mutual Funds.
• CATEGORY OF SHAREHOLDING
Information of shareholding as at December 31, 2009 required under the reporting framework is as follows:
49Annual Report 2009

50Annual Report 2009
(vii) Shareholders holding ten percent or more voting interest in the listed Company.
(viii) Details of purchase/sale of shares by Directors/Company Secretary / Chief Financial Officer and their spouses / minor children during 2009.
None
• SUMMARISED CATEGORY OF SHAREHOLDING
Engro Corporation Limited (Formerly Engro Chemical Pakistan Limited)International Finance CorporationMitsubishi Corporation
No. of Shares
292,399,99276,200,00056,999,998
Holding %
56.214.611.0
S. Shareholders CategoryNo.
1 Joint stock companies2 Directors3 Individuals4 Trust5 Banks, Development Finance Institutions,
Non-Banking Finance Institutions6 Modarabas and Mutual Funds7 Insurance Companies8 International Finance Corporation
Total
No. ofShareholders
11510
41,2221
915
21
41,375
Holding %
71.3-
8.43.5
1.20.90.1
14.6100
No. ofShares
370,619,63710
43,930,00518,000,000
6,483,2474,814,778
320,00076,200,000
520,367,677
CORPORATE REVIEW
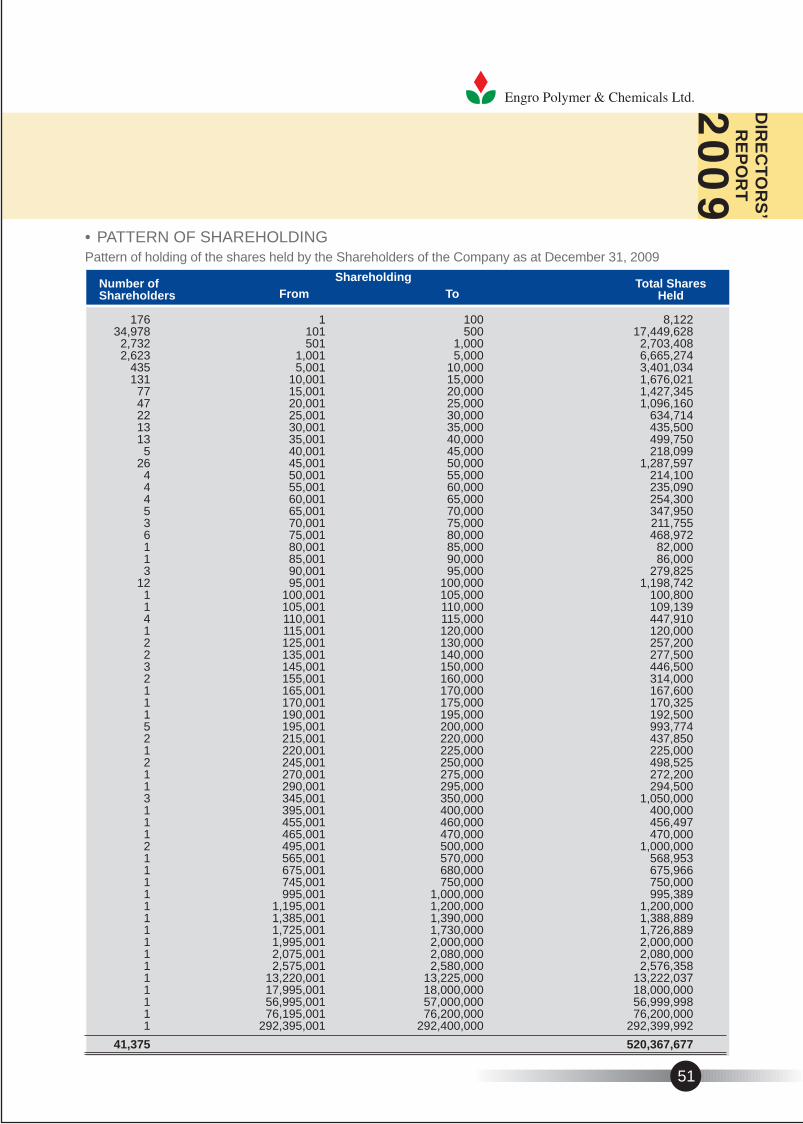
8,12217,449,628
2,703,4086,665,2743,401,0341,676,0211,427,3451,096,160
634,714435,500499,750218,099
1,287,597214,100235,090254,300347,950211,755468,972
82,00086,000
279,8251,198,742
100,800109,139447,910120,000257,200277,500446,500314,000167,600170,325192,500993,774437,850225,000498,525272,200294,500
1,050,000400,000456,497470,000
1,000,000568,953675,966750,000995,389
1,200,0001,388,8891,726,8892,000,0002,080,0002,576,358
13,222,03718,000,00056,999,99876,200,000
292,399,992
520,367,677
Pattern of holding of the shares held by the Shareholders of the Company as at December 31, 2009
17634,978
2,7322,623
435131
77472213135
26444536113
121141223211152121131112111111111111111
41,375
1101501
1,0015,001
10,00115,00120,00125,00130,00135,00140,00145,00150,00155,00160,00165,00170,00175,00180,00185,00190,00195,001
100,001105,001110,001115,001125,001135,001145,001155,001165,001170,001190,001195,001215,001220,001245,001270,001290,001345,001395,001455,001465,001495,001565,001675,001745,001995,001
1,195,0011,385,0011,725,0011,995,0012,075,0012,575,001
13,220,00117,995,00156,995,00176,195,001
292,395,001
100500
1,0005,000
10,00015,00020,00025,00030,00035,00040,00045,00050,00055,00060,00065,00070,00075,00080,00085,00090,00095,000
100,000105,000110,000115,000120,000130,000140,000150,000160,000170,000175,000195,000200,000220,000225,000250,000275,000295,000350,000400,000460,000470,000500,000570,000680,000750,000
1,000,0001,200,0001,390,0001,730,0002,000,0002,080,0002,580,000
13,225,00018,000,00057,000,00076,200,000
292,400,000
Number of Shareholders
ShareholdingFrom To
Total Shares Held
• PATTERN OF SHAREHOLDING
51
DIR
EC
TO
RS
’R
EP
OR
T

•• EARNING / (LOSS) PER SHARE
Loss per share for the year was Rs.0.45 whereas earning per share for last year was Rs.0.68.
•• DIVIDEND
In view of the loss made by the Company during the year and delay in VCM plant startup, the Board of Directors have decided not to announce any dividend.
•• SHARES TRADED AND AVERAGE PRICE
During the year 308 million shares of the Company were traded on Stock Exchanges. Average price of theCompany’s share, based on daily closing rates was Rs. 20.8.
•• AUDITORS
The present auditors, M/s. A. F. Ferguson and Company, retire and offer themselves for reappointment.
Wholly owned Subsidiary - Engro Polymer Trading (Private) Limited
EPTL is a wholly owned subsidiary of the Company and is involved in the trading business of Chemicals. Duringthe year, exports from EPTL amounted to Rs. 1,391 million which consist of PVC, EDC and Caustic soda. Theprofit after tax of EPTL for current year is Rs. 38 million in comparison to a loss of Rs. 3 million during 2008.
On behalf of the Board
Asif Qadir Masaharu Domichi
President & Chief Executive Director
KarachiJanuary 21, 2010
CORPORATE REVIEW
52Annual Report 2009

DIR
EC
TO
RS
’R
EP
OR
TD
IRE
CT
OR
S’
RE
PO
RT

FINANCIAL STATEMENTS
� Statement of Compliance with the Code ofCorporate Governance
� Review Report to the Members onStatement of Compliance
� Auditors’ Report to the Members onCompliance with EmployeesShare Option Scheme
� Auditors’ Report to the Members on theFinancial Statements
� Financial Statements

55Annual Report 2009
This statement is being presented to comply with the Code of Corporate Governance
contained in the listing regulations of Karachi, Lahore and Islamabad Stock Exchanges for
the purpose of establishing a framework of good governance, whereby a listed company
is managed in compliance with the best practices of Corporate Governance.
The Company has applied the principles contained in the Code in the following manner:
1. The Company encourages representation of independent non-executive directors and
directors representing minority interests on its Board of Directors. At present the Board
includes four independent non-executive directors, two of whom also represent minority
interests, along with five non-executive directors representing Engro Corporation Limited (Formerly
Engro Chemical Pakistan Limited), the majority shareholder, and one executive director, being the
CEO of the Company.
2. The directors have confirmed that none of them is serving as a director in more than ten
listed companies, including this Company.
3. All the resident directors of the Company are registered as taxpayers and none of them
has defaulted in payment of any loan to a banking company, a DFI or an NBFI or, being a
member of a stock exchange, has been declared as a defaulter by that stock exchange.
4. The Company has prepared a 'Statement of Ethics and Business Practices', which has
been signed by all the directors and employees of the Company.
5. The Company has developed a Mission Statement, overall corporate strategy and significant
policies of the Company. A complete record of particulars of significant policies along with
the dates on which these were enacted has been maintained.
6. All the powers of the Board have been duly exercised and decisions on material transactions,
including appointment and determination of remuneration and terms and conditions of
employment of the CEO, have been taken by the Board.
7. The meetings of the Board were presided over by the Chairman, and the Board met at least
once in every quarter. Written notices of the Board meetings, along with agenda and working
papers, were circulated at least seven days before the meetings. The minutes of the meetings
were appropriately recorded and circulated.
8. The Company conducted orientation for its directors to apprise them of their duties and
responsibilities.
9. The Board has approved appointment of CFO/Company Secretary and Head of Internal Audit,
including their remuneration and terms and conditions of employment as determined by the CEO.
STATEMENT OF COMPLIANCE WITH THECODE OF CORPORATE GOVERNANCE
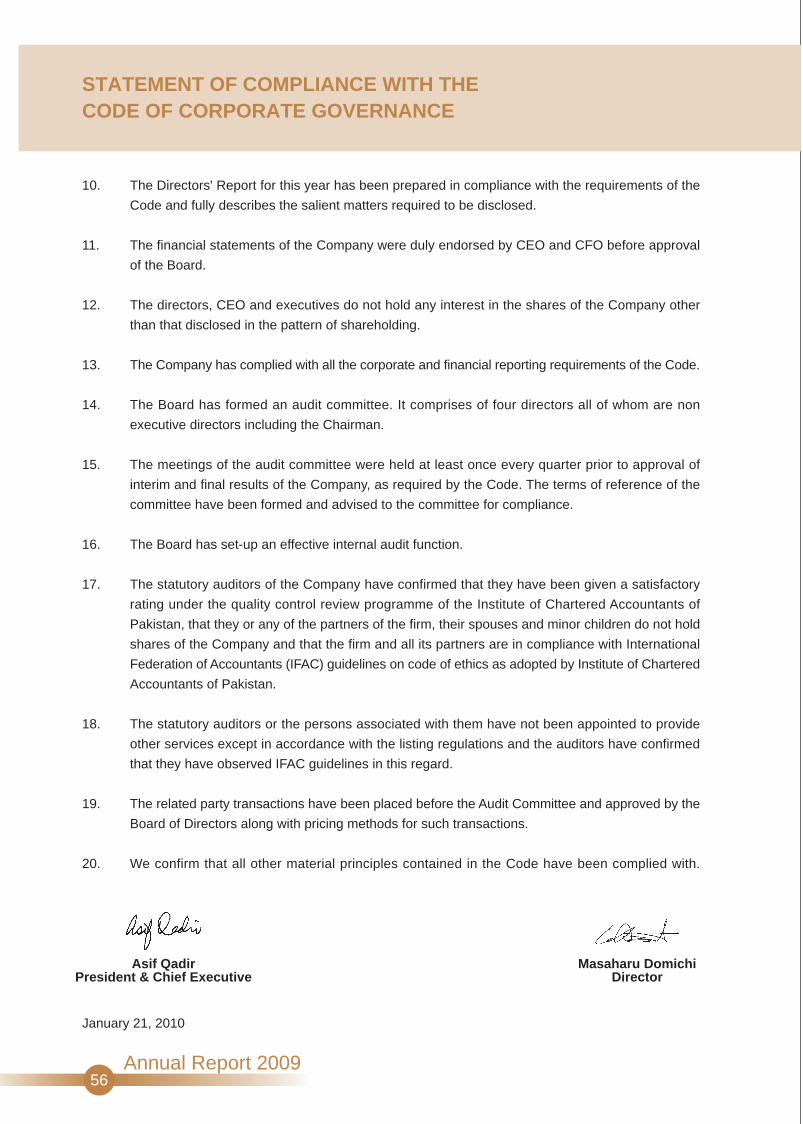
10. The Directors' Report for this year has been prepared in compliance with the requirements of the
Code and fully describes the salient matters required to be disclosed.
11. The financial statements of the Company were duly endorsed by CEO and CFO before approval
of the Board.
12. The directors, CEO and executives do not hold any interest in the shares of the Company other
than that disclosed in the pattern of shareholding.
13. The Company has complied with all the corporate and financial reporting requirements of the Code.
14. The Board has formed an audit committee. It comprises of four directors all of whom are non
executive directors including the Chairman.
15. The meetings of the audit committee were held at least once every quarter prior to approval of
interim and final results of the Company, as required by the Code. The terms of reference of the
committee have been formed and advised to the committee for compliance.
16. The Board has set-up an effective internal audit function.
17. The statutory auditors of the Company have confirmed that they have been given a satisfactory
rating under the quality control review programme of the Institute of Chartered Accountants of
Pakistan, that they or any of the partners of the firm, their spouses and minor children do not hold
shares of the Company and that the firm and all its partners are in compliance with International
Federation of Accountants (IFAC) guidelines on code of ethics as adopted by Institute of Chartered
Accountants of Pakistan.
18. The statutory auditors or the persons associated with them have not been appointed to provide
other services except in accordance with the listing regulations and the auditors have confirmed
that they have observed IFAC guidelines in this regard.
19. The related party transactions have been placed before the Audit Committee and approved by the
Board of Directors along with pricing methods for such transactions.
20. We confirm that all other material principles contained in the Code have been complied with.
January 21, 2010
STATEMENT OF COMPLIANCE WITH THECODE OF CORPORATE GOVERNANCE
56Annual Report 2009
Asif QadirPresident & Chief Executive
Masaharu DomichiDirector

57Annual Report 2009
REVIEW REPORT TO THE MEMBERS ON STATEMENT OF COMPLIANCE WITH BESTPRACTICES OF CODE OF CORPORATE GOVERNANCE
We have reviewed the Statement of Compliance with the best practices contained in the Code of CorporateGovernance for the year ended December 31, 2009 prepared by the Board of Directors of Engro Polymer andChemicals Limited to comply with the Listing Regulations of the Karachi, Lahore and Islamabad Stock Exchangeswhere the Company is listed.
The responsibility for compliance with the Code of Corporate Governance (the Code) is that of the Board of Directorsof the Company. Our responsibility is to review, to the extent where such compliance can be objectively verified,whether the Statement of Compliance reflects the status of the Company’s compliance with the provisions of theCode of Corporate Governance and report if it does not. A review is limited primarily to inquiries of the Companypersonnel and review of various documents prepared by the Company to comply with the Code.
As part of our audit of financial statements we are required to obtain an understanding of the accounting andinternal control systems sufficient to plan the audit and develop an effective audit approach. We are not requiredto consider whether the Board’s statement on internal control covers all risks and controls, or to form an opinionon the effectiveness of such internal controls, the Company’s corporate governance procedures and risks.
Further, Listing Regulations of the Karachi, Lahore and Islamabad Stock Exchanges require the Company to placebefore the Board of Directors for their consideration and approval, related party transactions distinguishing betweentransactions carried out on terms equivalent to those that prevail in arm’s length transactions and transactionswhich are not executed at arm’s length price, recording proper justification for using such alternate pricing mechanism.Further, all such transactions are also required to be separately placed before the audit committee. We are onlyrequired and have ensured compliance of requirement to the extent of approval of related party transactions bythe Board of Directors and placement of such transactions before the audit committee. We have not carried outany procedures to determine whether the related party transactions were undertaken at arm’s length price or not.
Based on our review, nothing has come to our attention which causes us to believe that the Statement of Compliancedoes not appropriately reflect the Company’s compliance, in all material respects, with the best practices containedin the Code of Corporate Governance.
Chartered AccountantsKarachiDate: January 27, 2010
Engagement partner: Sohail Hassan
Lahore Office: 505-509, 5th Floor, Alfalah Building, P.O.Box 39, Shahrah-e-Quaid-e-Azam, Lahore-54000, Pakistan. Tel: (92-42) 36285078-85 Fax: (92-42) 36285088Islamabad Office: PIA Building, 3rd Floor, 49 Blue Area, Fazl-ul-Haq Road, P.O. Box 3021, Islamabad-44000, Pakistan. Tel: (92-51) 2273457-60 Fax: (92-51) 2277924Kabul Office: House No. 4, Street No. 3, District 6, Road Karte-3, Kabul, Afghanistan. Tel: (93-799) 315320-203424
A.F. Ferguson & Co.Chartered AccountantsState Life Building No.1-CI.I. Chundrigar Road, P.O. Box 4716Karachi-74000, PakistanTelephone: (021) 32426682-6 / 32426711-5Facsimile: (021) 32415007 / 32427938
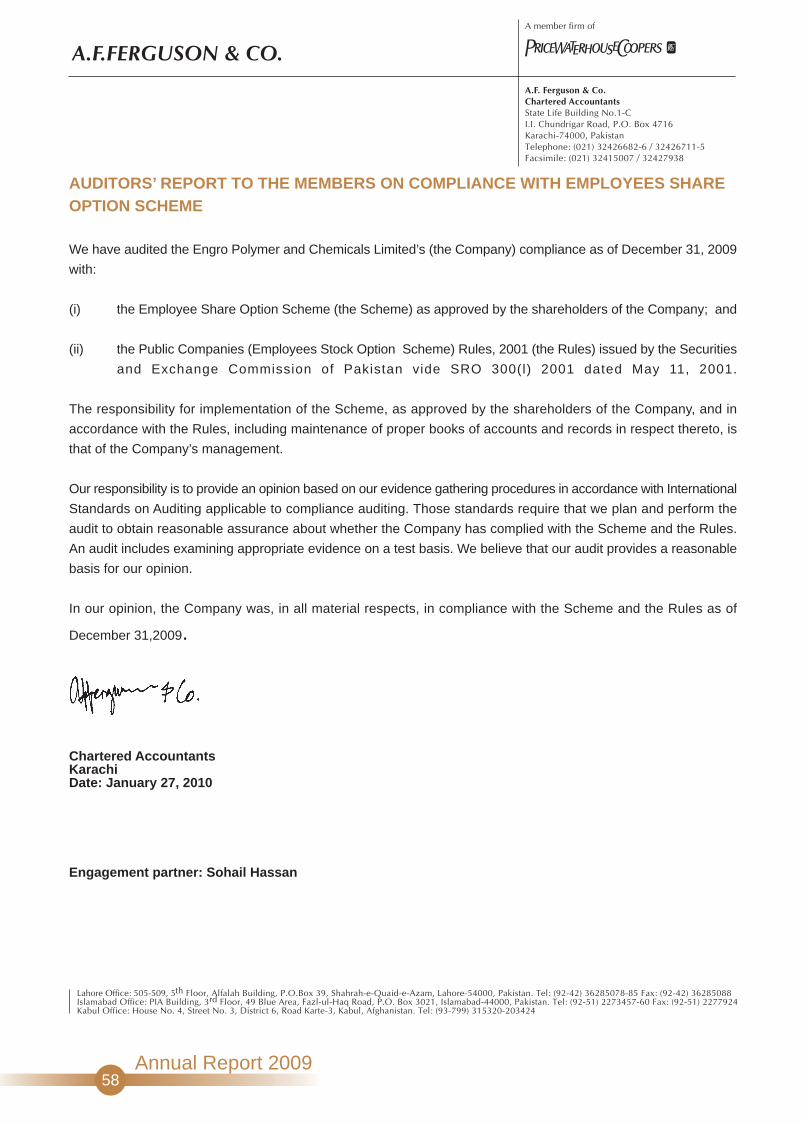
AUDITORS’ REPORT TO THE MEMBERS ON COMPLIANCE WITH EMPLOYEES SHAREOPTION SCHEME
We have audited the Engro Polymer and Chemicals Limited’s (the Company) compliance as of December 31, 2009
with:
(i) the Employee Share Option Scheme (the Scheme) as approved by the shareholders of the Company; and
(ii) the Public Companies (Employees Stock Option Scheme) Rules, 2001 (the Rules) issued by the Securities
and Exchange Commission of Pakistan vide SRO 300(l) 2001 dated May 11, 2001.
The responsibility for implementation of the Scheme, as approved by the shareholders of the Company, and in
accordance with the Rules, including maintenance of proper books of accounts and records in respect thereto, is
that of the Company’s management.
Our responsibility is to provide an opinion based on our evidence gathering procedures in accordance with International
Standards on Auditing applicable to compliance auditing. Those standards require that we plan and perform the
audit to obtain reasonable assurance about whether the Company has complied with the Scheme and the Rules.
An audit includes examining appropriate evidence on a test basis. We believe that our audit provides a reasonable
basis for our opinion.
In our opinion, the Company was, in all material respects, in compliance with the Scheme and the Rules as of
December 31,2009.
Chartered AccountantsKarachiDate: January 27, 2010
Engagement partner: Sohail Hassan
Lahore Office: 505-509, 5th Floor, Alfalah Building, P.O.Box 39, Shahrah-e-Quaid-e-Azam, Lahore-54000, Pakistan. Tel: (92-42) 36285078-85 Fax: (92-42) 36285088Islamabad Office: PIA Building, 3rd Floor, 49 Blue Area, Fazl-ul-Haq Road, P.O. Box 3021, Islamabad-44000, Pakistan. Tel: (92-51) 2273457-60 Fax: (92-51) 2277924Kabul Office: House No. 4, Street No. 3, District 6, Road Karte-3, Kabul, Afghanistan. Tel: (93-799) 315320-203424
A.F. Ferguson & Co.Chartered AccountantsState Life Building No.1-CI.I. Chundrigar Road, P.O. Box 4716Karachi-74000, PakistanTelephone: (021) 32426682-6 / 32426711-5Facsimile: (021) 32415007 / 32427938
58Annual Report 2009

59Annual Report 2009
AUDITORS’ REPORT TO THE MEMBERS
We have audited the annexed balance sheet of Engro Polymer and Chemicals Limited as at December 31, 2009and the related profit and loss account, statement of comprehensive income, statement of changes in equity andstatement of cash flows together with the notes forming part thereof, for the year then ended and we state thatwe have obtained all the information and explanations which, to the best of our knowledge and belief, werenecessary for the purposes of our audit.
It is the responsibility of the Company’s management to establish and maintain a system of internal control, andprepare and present the above said statements in conformity with the approved accounting standards and therequirements of the Companies Ordinance, 1984. Our responsibility is to express an opinion on these statementsbased on our audit.
We conducted our audit in accordance with the auditing standards as applicable in Pakistan. These standardsrequire that we plan and perform the audit to obtain reasonable assurance about whether the above said statementsare free of any material misstatement. An audit includes examining, on a test basis, evidence supporting theamounts and disclosures in the above said statements. An audit also includes assessing the accounting policiesand significant estimates made by management, as well as, evaluating the overall presentation of the above saidstatements. We believe that our audit provides a reasonable basis for our opinion and, after due verification, wereport that:
(a) in our opinion, proper books of account have been kept by the Company as required by the CompaniesOrdinance, 1984;
(b) in our opinion:
(i) the balance sheet and profit and loss account together with the notes thereon have been drawnup in conformity with the Companies Ordinance, 1984, and are in agreement with the books ofaccount and are further in accordance with accounting policies consistently applied, except forthe changes resulted on initial application of standards, amendments or interpretations to existingstandards, as stated in note 2.1.4 (a), with which we concur;
(ii) the expenditure incurred during the year was for the purpose of the Company’s business; and
(iii) the business conducted, investments made and the expenditure incurred during the year werein accordance with the objects of the Company;
(c) in our opinion and to the best of our information and according to the explanations given to us, the balancesheet, profit and loss account, statement of comprehensive income, statement of changes in equity andstatement of cash flows together with the notes forming part thereof conform with the approved accountingstandards as applicable in Pakistan, and give the information required by the Companies Ordinance, 1984,in the manner so required and respectively give a true and fair view of the state of the Company’s affairsas at December 31, 2009 and of the loss, its changes in equity and cash flows for the year then ended;and
(d) in our opinion, no Zakat was deductible at source under the Zakat and Ushr Ordinance, 1980 (XVIII of 1980).
Chartered AccountantsKarachiDate: January 27, 2010
Engagement Partner: Sohail Hassan
Lahore Office: 505-509, 5th Floor, Alfalah Building, P.O.Box 39, Shahrah-e-Quaid-e-Azam, Lahore-54000, Pakistan. Tel: (92-42) 36285078-85 Fax: (92-42) 36285088Islamabad Office: PIA Building, 3rd Floor, 49 Blue Area, Fazl-ul-Haq Road, P.O. Box 3021, Islamabad-44000, Pakistan. Tel: (92-51) 2273457-60 Fax: (92-51) 2277924Kabul Office: House No. 4, Street No. 3, District 6, Road Karte-3, Kabul, Afghanistan. Tel: (93-799) 315320-203424
A.F. Ferguson & Co.Chartered AccountantsState Life Building No.1-CI.I. Chundrigar Road, P.O. Box 4716Karachi-74000, PakistanTelephone: (021) 32426682-6 / 32426711-5Facsimile: (021) 32415007 / 32427938

60Annual Report 2009
BALANCE SHEETAS AT DECEMBER 31, 2009
(Amounts in thousand)
ASSETS
Non-Current Assets
Property, plant and equipmentIntangible assetsLong term investmentLong term loans and advances
Current Assets
Stores, spares and loose tools Stock-in-trade Trade debts - considered goodLoans, advances, deposits, prepayments and other receivables Taxes recoverable Deferred employee share compensation expenseCash and bank balances
TOTAL ASSETS
EQUITY AND LIABILITIES
Equity
Share capital Share premium Employee share compensation reserve Hedging reserveUnappropriated profit
Non-Current Liabilities
Long term borrowingsDerivative financial instruments Retention money against project payments Deferred income tax liabilitiesRetirement and other service benefit obligations
Current Liabilities
Current portion of long term borrowings Trade and other payablesAccrued interest / mark-upShort term borrowingsProvisions
Contingencies and Commitments
TOTAL EQUITY AND LIABILITIES
Note 2009 2008 Rupees
The annexed notes 1 to 45 form an integral part of these financial statements.
19,360,686 11,816 50,000 47,475
19,469,977
192,762 1,605,218
336,242 309,224 452,548
- 190,064
3,086,058
22,556,035
5,203,677 975,438
9,313 (12,958) 184,203
6,359,673
11,135,163 19,935
- 321,520
38,312 11,514,930
1,016,393 2,998,097
202,207 394,241
70,494 4,681,432
22,556,035
16,134,766 9,262
50,000 107,785
16,301,813
127,152 1,159,318
69,514 298,932 220,727
4,381 97,273
1,977,297
18,279,110
5,203,677 975,438
9,858 (39,100)
415,992 6,565,865
7,973,072 60,154
553,445 382,574
38,500 9,007,745
130,000 1,510,735
167,268 842,568
54,929 2,705,500
18,279,110
4567
89
1011
1412
13
14
1516171819
1520212223
24
Asif QadirPresident & Chief Executive
Masaharu DomichiDirector

PROFIT AND LOSS ACCOUNTFOR THE YEAR ENDED DECEMBER 31, 2009
61Annual Report 2009
Net revenue
Export rebate
Cost of sales
Gross profit
Distribution and marketing expenses
Administrative expenses
Other operating expenses
Other operating income
Operating profit
Finance costs
(Loss) / Profit before taxation
Taxation
(Loss) / Profit for the year
(Loss) / Earnings per share - basic and diluted
The annexed notes 1 to 45 form an integral part of these financial statements.
(Amounts in thousand except for (loss) / earnings per share)
Note Rupees
11,571,117
- 11,571,117
(10,418,657)
1,152,460
(468,512)
(205,389)
(231,701)
100,262
347,120
(596,264)
(249,144)
17,355
(231,789)
(0.45)
7,868,380
69 7,868,449
(6,736,218)
1,132,231
(311,640)
(163,040)
(289,828)
124,334
492,057
(33,529)
458,528
(105,243)
353,285
0.68
25
26
27
28
29
30
31
32
33
2008(Restated)
2009
Asif QadirPresident & Chief Executive
Masaharu DomichiDirector

62Annual Report 2009
STATEMENT OF COMPREHENSIVE INCOMEFOR THE YEAR ENDED DECEMBER 31, 2009
(Loss) / Profit for the year
Other comprehensive income:
Hedging reserve
(Loss) / Gain arising during the year
Less: - Reclassification adjustments for (gains) / losses included in profit and loss
- Adjustments for amounts transferred to initial carrying amount of hedged items
Income tax relating to hedging reserve
Other comprehensive income / (loss) for the year - net of tax
Total comprehensive (loss) / income for the year
The annexed notes 1 to 45 form an integral part of these financial statements.
(231,789)
(478)
22,557
18,140
(14,077)
26,142
(205,647)
(Amounts in thousand)
2009 2008 Rupees
353,285
257,573
(118,649)
(199,078)
21,054
(39,100)
314,185
Asif QadirPresident & Chief Executive
Masaharu DomichiDirector

STATEMENT OF CASH FLOWSFOR THE YEAR ENDED DECEMBER 31, 2009
63Annual Report 2009
CASH FLOWS FROM OPERATING ACTIVITIES
Cash generated from operations
Finance costs paid
Long term loans and advances
Retirement benefits paid
Income tax paid
Net cash generated from operating activities
CASH FLOWS FROM INVESTING ACTIVITIES
Purchases of:
- property, plant and equipment
- intangible assets
Retention money against Project payments
Proceeds from disposal of property, plant and equipment
Proceeds from sale of short term investments
Income on short term investments and bank deposits
Net cash utilized in investing activities
CASH FLOWS FROM FINANCING ACTIVITIES
Proceeds from long term borrowings
Repayments of long term borrowings
Proceeds from issue of share capital
Dividend paid
Net cash generated from financing activities
Net increase / (decrease) in cash and cash equivalents
Cash and cash equivalents at beginning of the year
Cash and cash equivalents at end of the year
1,490,418
(561,325)
60,310
(10,957)
(289,597)
688,849
(3,739,678)
(6,255)
(553,445)
6,179
35,168
61,816
(4,196,215)
4,178,484
(130,000)
-
-
4,048,484
541,118
(745,295)
(204,177)
665,784
(354,528)
(10,814)
-
(183,508)
116,934
(11,157,805)
(7,180)
452,485
3,971
2,914,504
117,077
(7,676,948)
6,637,643
-
229,128
(252,896)
6,613,875
(946,139)
200,844
(745,295)
36
37
(Amounts in thousand)
Note 2009 2008 Rupees
The annexed notes 1 to 45 form an integral part of these financial statements.
Asif QadirPresident & Chief Executive
Masaharu DomichiDirector

STATEMENT OF CHANGES IN EQUITY FOR THE YEAR ENDED DECEMBER 31, 2009
64Annual Report 2009
Balance as at January 1, 2008
Total comprehensive income for the year
Final dividend for the year endedDecember 31, 2007 - Re. 0.54 per share
Share options granted duringthe year - note 14
Share capital issued
Share issuance cost, net
Balance as at December 31, 2008
Total comprehensive loss for the year
Unvested share options lapsedduring the year - note 14.2.1
Balance as at December 31, 2009
The annexed notes 1 to 45 form an integral part of these financial statements.
4,436,000
-
-
-
767,677
-
5,203,677
-
-
5,203,677
425,216
-
-
-
614,141
(63,919)
975,438
-
-
975,438
-
-
-
9,858
-
-
9,858
-
(545)
9,313
-
(39,100)
-
-
-
-
(39,100)
26,142
-
(12,958)
315,603
353,285
(252,896)
-
-
-
415,992
(231,789)
-
184,203
5,176,819
314,185
(252,896)
9,858
1,381,818
(63,919)
6,565,865
(205,647)
(545)
6,359,673
Sharecapital
Sharepremium
Employeeshare
compensationreserve
Hedgingreserve
Unappropriatedprofit Total
(Amounts in thousand)
Rupees
Asif QadirPresident & Chief Executive
Masaharu DomichiDirector
(Amounts in thousand)
1. LEGAL STATUS AND OPERATIONS
1.1 Engro Polymer and Chemicals Limited (the Company) was incorporated in Pakistan in 1997 under the
Companies Ordinance, 1984. The Company was listed on Karachi Stock Exchange in 2008 and on
Islamabad and Lahore Stock Exchanges during the current year.
The Company is a subsidiary of Engro Chemical Pakistan Limited (ECPL) (renamed as Engro Corporation
Limited with effect from January 1, 2010). The address of its registered office is 1st floor, Bahria Complex I,
M. T. Khan Road, Karachi. The Company's principal activity is to manufacture, market and sell Poly Vinyl
Chloride (PVC), PVC compounds, Caustic soda and other related chemicals.
1.2 In 2006, the Company commenced work on its expansion and backward integration project comprising
setting up of a new PVC plant, Ethylene Di Chloride (EDC), Chlor-alkali, Vinyl Chloride Monomer (VCM)
and Power plants (the Project). The new PVC plant commenced commercial production on January 1,
2009. Further, on August 1, 2009, the Company commenced commercial operations of EDC, Chlor-alkali
and Power plants (Gas turbines). The VCM plant is still in the test production phase. These plants have
been set up adjacent to the Company's existing PVC facilities in the Port Qasim Industrial Area. Furthermore,
during the year, the Company has also commenced supply of surplus power generated from Power plants
to Karachi Electric Supply Company (KESC), under an agreement.
2. SUMMARY OF SIGNIFICANT ACCOUNTING POLICIES
The significant accounting policies applied in the preparation of these financial statements are set out
below. These policies have been consistently applied to all years presented, unless otherwise stated.
2.1 Basis of preparation
2.1.1 These financial statements have been prepared under the historical cost convention as modified byremeasurement of certain financial assets and financial liabilities (including derivative instruments) at fairvalue and recognition of certain staff retirement and other service benefits at present value.
2.1.2 These financial statements have been prepared in accordance with the requirements of the CompaniesOrdinance, 1984 (the Ordinance), directives issued by the Securities and Exchange Commission of Pakistan(SECP) and the approved financial reporting standards as applicable in Pakistan. Approved financialreporting standards comprise of such International Financial Reporting Standards (IFRS) issued by theInternational Accounting Standards Board as are notified under the provisions of the Ordinance. Wherever,the requirements of the Ordinance or directives issued by the SECP differ with the requirements of thesestandards, the requirements of the Ordinance or the requirements of the said directives have been followed.
2.1.3 The preparation of financial statements in conformity with the above requirements requires the use ofcertain critical accounting estimates. It also requires management to exercise its judgement in the process
of applying the Company’s accounting policies. The areas involving high degree of judgement or complexity, or areas where assumptions and estimates are significant to the financial statements are disclosed in
note 3.
NOTES TO THE FINANCIAL STATEMENTSFOR THE YEAR ENDED DECEMBER 31, 2009
65Annual Report 2009

66Annual Report 2009
NOTES TO THE FINANCIAL STATEMENTSFOR THE YEAR ENDED DECEMBER 31, 2009
(Amounts in thousand)
2.1.4 Initial application of a Standard, Amendment or an Interpretation to an existing Standard
a) Standards, amendments to published standards and interpretations effective in 2009 and relevant
- IAS 1 (Revised), 'Presentation of financial statements' (effective from January 1, 2009). The
revised standard prohibits the presentation of items of income and expenses (that is, 'non-
owner changes in equity') in the statement of changes in equity, requiring 'non-owner changes in
equity' to be presented separately from owner changes in equity in a statement of comprehensive
income. Entities can choose to present one statement of comprehensive income or two separate
statements (the profit and loss account and statement of comprehensive income).
The Company has elected to present two statements; a profit and loss account and a statement
of comprehensive income. As the change impacts only the presentation of financial statements
there is no impact on earnings per share.
- IAS 23 (Amendment), 'Borrowing costs' (effective from January 1, 2009). The amendment requires
an entity to capitalize borrowing costs directly attributable to the acquisition, construction or
production of a qualifying asset as part of the cost of that asset. The option of immediately expensing
those borrowing costs has been removed. The Company’s current accounting policy is in compliance
with this amendment, and therefore has no effect on the Company’s financial statements.
- IAS 28 (Amendment), 'Investments in associates' (and consequential amendments to IAS 32,
'Financial Instruments: Presentation' and IFRS 7, 'Financial instruments: Disclosures') (effective
from January 1, 2009). The amendment is part of the IASB's annual improvements project published
in May 2008. The amendment requires that an investment in associate including subsidiaries is
treated as a single asset for the purposes of impairment testing and any impairment loss is not
allocated to specific assets included within the investment, for example, goodwill. Reversals of
impairment are recorded as an adjustment to the investment balance to the extent that the
recoverable amount of the associate increases. This amendment has no impact on
the Company's financial statements as currently there is no indication of impairment in Company's
investment in subsidiary.
- IAS 39 (Amendment), 'Financial instruments: Recognition and measurement' (effective from January 1,
2009). The amendment is part of the IASB's annual improvements project published in May 2008.
- This amendment clarifies that it is possible for there to be movements into and out of the fair value
through profit or loss category where a derivative commences or ceases to qualify as a hedging
instrument in cash flow or net investment hedge.
- The definition of financial asset or financial liability at fair value through profit or loss as it relates
to items that are held for trading is also amended. This clarifies that a financial asset or liability
that is part of a portfolio of financial instruments managed together with evidence of an actual
recent pattern of short-term profit-taking is included in such a portfolio on initial recognition
NOTES TO THE FINANCIAL STATEMENTSFOR THE YEAR ENDED DECEMBER 31, 2009
(Amounts in thousand)
- When re-measuring the carrying amount of a debt instrument on cessation of fair value hedge
accounting, the amendment clarifies that a revised effective interest rate (calculated at the date fair
value hedge accounting ceases) is used.
This amendment has no material impact on the Company's financial statements.
- IFRS 2 (Amendment), 'Share-based payment' (effective from January 1, 2009). The amendment deals
with vesting conditions and cancellations. It clarifies that vesting conditions are service conditions and
performance conditions only. Other features of a share-based payment are not vesting conditions. As
such these features would need to be included in the grant date fair value for transactions with
employees and others providing similar services, that is, these features would not impact the number
of awards expected to vest or valuation thereof subsequent to grant date. All cancellations, whether
by the entity or by other parties, would have the same accounting treatment. The Company’s current
accounting policy for employees’ shares options is consistent with this amendment.
- The SECP vide S.R.O. 411 (1) / 2008 dated April 28, 2008 notified the adoption of IFRS 7 'Financial
Instruments: Disclosures'. IFRS 7 is mandatory for Company's accounting periods beginning on or
after the date of notification i.e. April 28, 2008. IFRS 7 has superseded IAS 30 and disclosure
requirements of IAS 32. The application of IFRS 7 has only resulted in additional disclosures in the
Company's financial statements.
- IFRS 8 'Operating Segments' (effective from January 1, 2009). IFRS 8 replaces IAS 14, 'Segment
reporting'. The new standard requires segment information to be presented on the same basis as that
used for internal reporting purposes, and introduces detailed disclosures regarding the reportable
segments and products. Application of IFRS 8 has resulted in additional disclosures in the Company's
financial statements.
b) Standards, amendments to published standards and interpretations effective in 2009 but not
relevant
The other new standards, amendments and interpretations that are mandatory for accounting periods
beginning on or after January 1, 2009 are considered not to be relevant or to have any significant effect
on the Company's financial reporting and operations.
c) Interpretation to existing standards that has been early adopted by the Company
- IFRIC 4, 'Determining whether an Arrangement contains a Lease' was adopted by SECP and was
applicable for all periods beginning on or after January 1, 2006. However, SECP vide Circular No.
D(CS)/34/2009 dated June 22, 2009 deferred the implementation of IFRIC 4 till June 30, 2010. The
Company has early adopted the Interpretation, which has only resulted in additional disclosures in
respect of certain arrangements of the Company being classified as operating leases
(note 26.3).
67Annual Report 2009

68Annual Report 2009
NOTES TO THE FINANCIAL STATEMENTSFOR THE YEAR ENDED DECEMBER 31, 2009
(Amounts in thousand)
d) Standards, amendments to published standards and interpretations that are not yet effective and
have not been early adopted by the Company
- IAS 1 (Amendment), 'Presentation of financial statements' (effective from January 1, 2010). The
amendment is part of the IASB's annual improvements project published in April 2009. The amendment
provides clarification that the potential settlement of a liability by the issue of equity is not relevant to
its classification as current or non current. By amending the definition of current liability, the amendment
permits a liability to be classified as non-current (provided that the entity has an unconditional right
to defer settlement by transfer of cash or other assets for at least 12 months after the accounting
period) notwithstanding the fact that the entity could be required by the counterparty to settle in shares
at any time. The Company will apply IAS 1 (Amendment) from January 1, 2010. It is not expected to
have a material impact on the Company's financial statements, on its initial application.
- IAS 39 (Amendment), 'Cash flow hedge accounting', (effective from July 1, 2010). This amendment
provides clarification when to recognize gains or losses on hedging instruments as a reclassification
adjustment in a cash flow hedge of a forecast transaction that results subsequently in the recognition
of a financial instrument. The amendment clarifies that gains or losses should be reclassified from
equity to profit or loss in the period in which the hedged forecast cash flow affects profit or loss. The
Company will apply IAS 39 (Amendment) from July 1, 2010. It is not expected to have a material impact
on the Company's financial statements, on its initial application.
- IFRS 8 (Amendment), 'Disclosure of information about segment assets' (effective from January 1,
2010). This amendment clarifies that an entity is required to disclose a measure of segment assets
only if that measure is regularly reported to the chief operating decision-maker. The new guidance is
not expected to have a material impact on the Company's financial statements.
- IAS 39 (Amendment), 'Treating loan pre-payment penalties as closely related derivatives' (effective
from January 1, 2010). This amendment clarifies pre-payment options, the exercise price of which
compensates the lender for loss of interest by reducing the economic loss from re-investment risk,
should be considered closely related to the host debt contract. The Company will apply IAS 39
(Amendment) from January 1, 2010.
There are a number of other minor amendments and interpretations to other published standards that are
not yet effective, and are also not relevant to the Company and therefore have not been presented here.
2.2 Property, plant and equipment
These are stated at cost less accumulated depreciation and impairment, if any, except Capital work-in-
progress. Cost in relation to fixed assets signifies historical cost. Historical cost includes expenditure that
is directly attributable to the acquisition of the items. Capital work-in-progress is stated at historical
cost less impairment, if any.

NOTES TO THE FINANCIAL STATEMENTSFOR THE YEAR ENDED DECEMBER 31, 2009
(Amounts in thousand)
Depreciation on assets is charged to income using the straight line method to allocate their cost to their
residual values over their estimated useful lives at rates given in note 4.1. Depreciation on additions is
charged from the month in which the asset is put to use and no depreciation is charged in the month of
disposal.
Subsequent costs are included in the asset's carrying amount or recognized as a separate asset, as
appropriate, only when it is probable that future economic benefits associated with the item will flow to the
Company and the cost of the item can be measured reliably. All other repairs and maintenance are charged
to income during the year in which these are incurred.
Assets residual values and useful lives are reviewed, and adjusted if appropriate, at each balance sheet
date. An asset's carrying amount is written down immediately to its recoverable amount if the asset's
carrying amount is greater than its estimated recoverable amount.
The gain or loss on disposal or retirement of an asset represented by the difference between the sale
proceeds and the carrying amount of the asset is recognized as an income or expense in the period of
disposal or retirement.
2.3 Intangible assets - Computer software
Costs associated with developing and maintaining computer software programmes are recognized as an
expense as incurred. Costs that are directly attributable to identifiable software and have probable economic
benefits exceeding one year, are recognized as an intangible asset. Direct costs include the purchase cost
of software and related overhead cost.
Expenditure, which enhances or extends the performance of computer software beyond its original
specification and useful life is recognized as a capital improvement and added to the original cost of the
software.
Computer software cost treated as intangible assets are amortized from the date the software is put to
use on straight-line basis over a period of 5 to 10 years. The carrying amount of the intangible assets is
reviewed for impairment whenever events or changes in circumstances indicate that the carrying amount
may not be recoverable. An impairment loss is recognized for the amount by which the assets carrying
amount exceeds its recoverable amount in income. Reversal of impairment losses are also recognized
in income.
2.4 Investments in subsidiaries
Investments in subsidiaries are stated at cost net of provision for impairment, if any. This investment is
classified as long term investments.
69Annual Report 2009

70Annual Report 2009
NOTES TO THE FINANCIAL STATEMENTSFOR THE YEAR ENDED DECEMBER 31, 2009
(Amounts in thousand)
2.5 Financial instruments
2.5.1 Financial assets
The Company classifies its financial assets in the following categories: at fair value through profit or loss,
loans and receivables, held to maturity and available for sale. The classification depends on the purpose
for which the financial assets were acquired. Management determines the classification of its financial
assets at initial recognition.
(a) Financial assets at fair value through profit or loss
Financial assets at fair value through profit or loss are financial assets held for trading. A financial
asset is classified in this category if acquired principally for the purpose of selling in the short-term.
Derivatives are also categorized as held for trading unless they are designated as hedges. Assets
in this category are classified as current assets.
(b) Loans and receivables
Loans and receivables are non-derivative financial assets with fixed or determinable payments
that are not quoted in an active market. They are included in current assets, except for maturities
greater than 12 months after the balance sheet date. These are classified as non-current assets.
The Company's loans and receivables comprise 'trade debts and other receivables' and 'cash and
cash equivalents' in the balance sheet (note 2.8 and 2.9).
(c) Held to maturity financial assets
Held to maturity financial assets are non-derivative financial assets with fixed or determinable
payments and fixed maturity with a positive intention to hold to maturity.
(d) Available-for-sale financial assets
Available-for-sale financial assets are non-derivatives that are either designated in this category
or not classified in any of the other categories. They are included in non-current assets unless
management intends to dispose of the investment within 12 months of the balance sheet date.
Regular purchases and sales of financial assets are recognized on the trade date - the date on
which the Company commits to purchase or sell the asset. Investments are initially recognized
at fair value plus transaction costs for all financial assets not carried at fair value through profit
or loss. Financial assets carried at fair value through profit or loss are initially recognized at fair
value and transaction costs are expensed in the profit and loss account. Financial assets are
derecognized when the rights to receive cash flows from the investments have expired or have
been transferred and the Company has transferred substantially all risks and rewards of ownership.
Available-for-sale financial assets and financial assets at fair value through profit or loss are
subsequently carried at fair value.

(Amounts in thousand)
Loans and receivables and held to maturity financial assets are carried at amortized cost using
the effective interest method.
Gains or losses arising from changes in the fair value of the 'financial assets at fair value through
profit or loss' category are presented in the profit or loss account within 'other operating
income/expenses' in the period in which they arise. Dividend income from financial assets at fair
value through profit or loss is recognized in the profit and loss account as part of other income
when the Company's right to receive payments is established.
When securities classified as available for sale are sold or impaired, the accumulated fair value
adjustments recognized in other comprehensive income are included in the profit or loss account
as 'gains and losses from investment securities'. Interest on available-for-sale securities calculated
using the effective interest method is recognized in the profit and loss account as part of other
income. Dividends on available-for-sale equity instruments are recognized in the profit and loss
account as part of other income when the Company's right to receive payments is established.
The fair values of quoted investments are based on current bid prices. If the market for a financial
asset is not active (and for unlisted securities), the Company establishes fair value by using
valuation techniques. These include the use of recent arm's length transactions, reference to other
instruments that are substantially the same, discounted cash flow analysis, and option pricing
models making maximum use of market inputs and relying as little as possible on entity-specific
inputs.
The Company assesses at each balance sheet date whether there is objective evidence that a
financial asset or a Group of financial assets is impaired. In the case of equity securities classified
as available for sale, a significant or prolonged decline in the fair value of the security below its
cost is considered as an indicator that the securities are impaired. If any such evidence exists for
available-for-sale financial assets, the cumulative loss - measured as the difference between the
acquisition cost and the current fair value, less any impairment loss on that financial asset previously
recognized in profit or loss - is removed from equity and recognized in the profit and loss account.
Impairment losses recognized in the profit and loss account on equity instruments are not reversed
through the profit and loss account. Impairment testing of trade receivables is described in note 2.8.
2.5.2 Financial liabilities
All financial liabilities are recognized at the time when the Company becomes a party to the contractual
provisions of the instrument.
A financial liability is derecognized when the obligation under the liability is discharged or cancelled or
expired. Where an existing financial liability is replaced by another from the same lender on
substantially different terms, or the terms of an existing liability are substantially modified, such an exchange
or modification is treated as a derecognition of the original liability and the recognition of a new liability,
and the difference in respective carrying amounts is recognized in the profit and loss account
71Annual Report 2009
NOTES TO THE FINANCIAL STATEMENTSFOR THE YEAR ENDED DECEMBER 31, 2009

72Annual Report 2009
NOTES TO THE FINANCIAL STATEMENTSFOR THE YEAR ENDED DECEMBER 31, 2009
(Amounts in thousand)
2.5.3 Offsetting of financial assets and liabilities
A financial asset and a financial liability are offset and the net amount is reported in the balance sheet if
the Company has a legally enforceable right to set-off the recognized amounts and intends either to settle
on a net basis or to realize the asset and settle the liability simultaneously.
2.6 Stores and spares
These are valued at weighted average cost except for items in transit which are stated at invoice value
plus other charges paid thereon till the balance sheet date. Provision is made for slow moving items, as
per policy and is recognized in the profit and loss account.
2.7 Stock-in-trade
These are valued at the lower of cost and net realizable value. Cost in relation to raw materials represent
the weighted average cost and in relation to finished goods and work-in-progress represents weighted
average cost comprising direct materials, labour and related manufacturing overheads.
Cost of stock-in-transit represents the invoice value plus other charges incurred thereon till the balance
sheet date.
Net realizable value signifies the estimated selling price in the ordinary course of business less cost of
completion and costs necessarily to be incurred in order to make the sales. Provision is made for slow
moving stocks where considered necessary.
2.8 Trade debts and other receivables
Trade debts and other receivables are recognized initially at fair value and subsequently measured at
amortized cost using the effective interest rate method, less provision for impairment. A provision for
impairment is established when there is objective evidence that the Company will not be able to collect
all amounts due according to the original terms of receivables. The amount of the provision is charged to
income. Trade debts and other receivables considered irrecoverable are written-off.
Exchange gains and losses arising on translation in respect of trade debts and other receivables in foreign
currency are added to the carrying amount of the respective receivables.
2.9 Cash and cash equivalents
Cash and cash equivalents in the cash flow statement include cash in hand and in transit, balance with
banks, deposits held at call with banks, other short-term highly liquid investments with original maturities
of three months or less and short term finances. Short term finances on the balance sheet are shown as
part of current liabilities.

(Amounts in thousand)
2.10 Share capital
Ordinary shares are classified as equity and recognized at their face value. Incremental costs, if any,
directly attributable to the issue of new shares or options are recognized in equity as a deduction, net of
tax, from the proceeds.
2.11 Employees' Share Option Scheme
The grant date fair value of equity settled share based payments to employees is initially recognized in
the balance sheet as deferred share employee compensation expense with a consequent credit to equity
as employee share compensation reserve.
The fair value determined at the grant date of the equity settled share based payments is recognized as
an employee compensation expense on a straight line basis over the vesting period.
When an unvested option lapses by virtue of an employee not conforming to the vesting conditions after
recognition of an employee compensation expense in profit or loss, employee compensation expense in
profit or loss is reversed equal to the amortized portion with a corresponding effect to deferred employee
compensation reserve in the balance sheet.
When a vested option lapses on expiry of the exercise period, employee compensation expense already
recognized in the profit or loss is reversed with a corresponding reduction to deferred employee compensation
reserve in the balance sheet.
When the options are exercised, deferred employee compensation reserve relating to these options is
transferred to share capital and share premium account. An amount equivalent to the face value of related
shares is transferred to share capital, and any amount over and above the share capital is transferred to
share premium account.
2.12 Borrowings
Borrowings are recognized initially at fair value, net of transaction costs incurred and are subsequently
measured at amortized cost using the effective interest method.
Borrowings are classified as current liabilities unless the Company has an unconditional / contractual right
to defer settlement of the liability for at least twelve months after the balance sheet date.
2.13 Retirement and other service benefit obligation
2.13.1 Pension Scheme
The Company operates an approved defined benefit pension scheme for its management employees.
The scheme is funded and provides for pension based on the employees' last drawn salary. Pensions
are payable, after retirement or on optional retirement, for life and thereafter to surviving spouses and
ependant children.
73Annual Report 2009
NOTES TO THE FINANCIAL STATEMENTSFOR THE YEAR ENDED DECEMBER 31, 2009

NOTES TO THE FINANCIAL STATEMENTSFOR THE YEAR ENDED DECEMBER 31, 2009
(Amounts in thousand)
2.13.2 Gratuity Scheme
The Company operates an approved funded defined benefit gratuity scheme for its management
employees. The scheme provides gratuity based on the employees' last drawn salary. Gratuity is
payable on retirement, separation or death to ex-employees, or their spouses thereafter.
Contributions are made annually to these funds on the basis of the actuarial valuations and in line
with the provisions of the Income Tax Ordinance, 2001.
2.13.3 Additional Death Gratuity Scheme
The Company also operates an approved death gratuity scheme for its permanent employees. The
scheme is unfunded and provides for additional death gratuity which is payable on death of employee
to surviving spouses and dependent children.
Actuarial valuation of these schemes is carried out at least once in every three years. The most recent
actuarial valuation was carried out as of December 31, 2008 using the 'Projected Unit Credit Method'.
The amount recognized in the balance sheet represents the present value of defined benefit obligations
as adjusted for unrecognized actuarial gains and losses and unrecognized past service costs, if any,
as reduced by the fair value of plan assets.
Cumulative unrecognized actuarial gains and losses at the end of the previous year which exceeds
10% of the greater of the present value of the Company's defined benefit obligations and the fair value
of plan assets are amortized over the expected average remaining working lives of the employees.
2.13.4 Provident fund
The Company operates a defined contribution provident fund for its permanent management employees.
Equal monthly contributions are made both by the Company and the employees to the fund at the rate of
10% of basic salary. Annual contribution by the Company is charged to income.
2.13.5 Compensated absences
Accrual is made for employees compensated absences on the basis of accumulated leaves and the last
drawn pay.
2.13.6 Other benefits
Provision is made under a service incentive plan for certain category of experienced employees to continuein the Company's employment. The provision is made on the basis of management's estimates of incentivesto be paid to employees on fulfilment of criteria given in the incentive plan.
2.14 Trade and other payables
These are recognized initially at fair value and subsequently measured at amortized cost using the effectiveinterest rate method. Exchange gains and losses arising on translation in respect of liabilities in foreigncurrency are added to the carrying amount of the respective liabilities.
74Annual Report 2009

NOTES TO THE FINANCIAL STATEMENTSFOR THE YEAR ENDED DECEMBER 31, 2009
(Amounts in thousand)
2.15 Provisions
Provisions are recognized when the Company has a legal or constructive obligation as a result of past
events, and it is probable that outflow of resources embodying economic benefits will be required to settle
the obligation and a reliable estimate can be made of the amount of obligation. Provisions are reviewed
at each balance sheet date and adjusted to reflect current best estimate.
2.16 Taxation
2.16.1 Current
Provision for current taxation is based on the taxable income for the year, determined in accordance with
the prevailing law for taxation on income, using prevailing tax rates. The charge for current tax also includes
tax credits and adjustments, where considered necessary, for prior years determined during the year or
otherwise considered necessary for such years.
2.16.2 Deferred
Deferred income tax is provided using the liability method on all temporary differences arising between
the tax bases of assets and liabilities and their carrying amounts in the financial statements. Deferred tax
liabilities are generally recognized for all taxable temporary differences and deferred tax assets are
recognized to the extent that it is probable that taxable profits will be available against which the deductible
temporary differences, unused tax losses and tax credits can be utilized.
Deferred income tax is determined using tax rates that have been enacted or substantially enacted by the
balance sheet date and are expected to apply when the related deferred income tax asset is realized or
the deferred income tax liability is settled. Deferred tax is charged or credited in the profit and loss account.
2.17 Foreign currency transactions and translation
These financial statements are presented in Pakistani Rupees, which is the Company's functional currency.
Foreign currency transactions are translated into the functional currency using the exchange rates prevailing
at the dates of the transactions. Foreign exchange gains and losses resulting from the settlement of such
transactions and from the translation at year-end exchange rates of monetary assets and liabilities
denominated in foreign currencies are recognized in income.
2.18 Derivatives financial instruments and hedging activities
Derivatives are initially recognized at fair value on the date a derivative contract is entered into and are
subsequently re-measured at their fair value. The method of recognizing the resulting gain or loss depends
on whether the derivative is designated as a hedging instrument, and if so, the nature of the item being
hedged. The Company designates certain derivatives as either:
(a) hedges of the fair value of recognized assets or liabilities or a firm commitment (fair value hedge); or
(b) hedges of a particular risk associated with a recognized asset or liability or a highly probable forecast
transaction (cash flow hedge).
75Annual Report 2009

NOTES TO THE FINANCIAL STATEMENTSFOR THE YEAR ENDED DECEMBER 31, 2009
76Annual Report 2009
(Amounts in thousand)
The overall risk management strategy includes reasons for undertaking hedge transactions and entering
into derivatives. The objectives of this strategy are to:
- minimize foreign currency exposure's impact on the Company's financial performance; and
- protect the Company's cash flow from adverse movements in foreign currency exchange rates.
(a) Fair value hedge
Changes in the fair value of derivatives that are designated and qualify as fair value hedges are recorded
in the profit and loss account, together with any changes in the fair value of the hedged asset or liability
that are attributable to the hedged risk.
(b) Cash flow hedge
On an ongoing basis, the Company assesses whether each derivative continues to be highly effective in
offsetting changes in the cash flows of hedged items. If and when a derivative is no longer expected to
be highly effective, hedge accounting is discontinued.
The effective portion of changes in the fair value of derivatives that are designated and qualify as cash
flow hedges is recognized in other comprehensive income. The gain or loss relating to the ineffective
portion is recognized immediately in the profit and loss account.
Amounts accumulated in comprehensive income are reclassified to the profit and loss account in the
periods when the hedged item affects profit or loss account i.e. when the transaction occurs. The gain or
loss relating to the effective portion of interest rate swaps hedging variable rate borrowings is recognized
in the profit and loss account or the cost of the related asset for which the borrowing is being utilized.
However, when the forecast transaction that is hedged results in the recognition of a non-financial asset
(for e.g. inventory or fixed assets) the gains and losses previously deferred in equity are transferred from
equity and included in the initial measurement of the cost of the asset. The deferred amounts are ultimately
recognized in cost of goods sold in case of inventory or in depreciation in case of fixed assets.
When a hedging instrument expires or is sold, or when a hedge no longer meets the criteria for hedge
accounting, any cumulative gain or loss existing in equity at that time remains in equity and is recognized
when the forecast transaction is ultimately recognized in the profit and loss account or the cost of the
related non-financial asset (for e.g. inventory or fixed assets) as applicable. When a forecast transaction
is no longer expected to occur, the cumulative gain or loss that was reported in equity is immediately
transferred to the profit and loss account.
The fair values of various derivative instruments used for hedging purposes are disclosed in note 16.
Movements on the hedging reserve are shown in statement of comprehensive income. The full fair value
of a hedging derivative is classified as a non-current asset or liability when the remaining maturity of hedged
item is more than 12 months, and as a current asset or liability when the remaining maturity of the hedged
item is less than 12 months. Trading derivatives are classified as a current asset or liability.

(Amounts in thousand)
2.19 Revenue recognition
Revenue is recognized to the extent it is probable that the economic benefits will flow to the Company and
the revenue can be measured reliably. Revenue is measured at the fair value of the consideration received
or receivable, and is recognized on the following basis:
- sales are recognized when the product is dispatched to customers;
- revenue from the supply of electricity is recorded based upon the output delivered;
- dividend income is recognized when the Company's right to receive the payment is established; and
- return on deposits is recognized using the effective interest rate method.
2.20 Borrowing costs
Borrowing costs are recognized as an expense in the period in which they are incurred except where such
costs are directly attributable to the acquisition, construction or production of a qualifying asset in which
such costs are capitalized as part of the cost of that asset. Borrowing costs includes exchange differences
arising from foreign currency borrowings to the extent these are regarded as an adjustment to borrowing
costs.
2.21 Segment reporting
Operating segments are reported in a manner consistent with the internal reporting.
2.22 Dividend and appropriation to reserves
Dividend and appropriation to reserves are recognized in the financial statements in the period in which
these are approved.
3. CRITICAL ACCOUNTING ESTIMATES AND JUDGEMENTS
Estimates and judgments are continually evaluated and are based on historical experience and otherfactors, including expectations of future events that are believed to be reasonable under the circumstances.The Company makes estimates and assumptions concerning the future. The resulting accounting estimateswill, by definition, seldom equal the related actual results. The estimates and assumptions that have asignificant risk of causing a material adjustment to the carrying amounts of assets and liabilities within thenext financial year are as follows:
3.1 Property, plant and equipment
The Company reviews appropriateness of the rate of depreciation, useful life and residual value used inthe calculation of depreciation. Further where applicable, an estimate of recoverable amount of assets ismade for possible impairment on an annual basis.
3.2 Impairment of investments in subsidiaries
In making an estimate of future cash flows from the Company's financial assets including investment insubsidiaries, the management considers future dividend stream and an estimate of the terminal value ofthese investments.
77Annual Report 2009
NOTES TO THE FINANCIAL STATEMENTSFOR THE YEAR ENDED DECEMBER 31, 2009

NOTES TO THE FINANCIAL STATEMENTSFOR THE YEAR ENDED DECEMBER 31, 2009
78Annual Report 2009
2009 2008Rupees
(Amounts in thousand)
3.3 Derivative hedging financial instruments designated as cash flow hedges
The Company reviews the changes in fair values of the derivative hedging financial instruments at each
reporting date based on the valuations received from the contracting banks. These valuations represent
estimated fluctuations in the relevant currencies / interest rates over the reporting period and other relevant
variables signifying currency and interest rate risks.
3.4 Stock-in-trade
The Company reviews the net realizable value of stock-in-trade to assess any diminution in the respective
carrying values. Net realizable value is determined with reference to estimated selling price less estimated
expenditures to make the sales.
3.5 Income taxes
In making the estimates for income taxes payable by the Company, the management looks at the applicable
law and the decisions of appellate authorities on certain issues in the past.
3.6 Fair value of employee share options
The management has determined the fair value of options issued under the Employee Share Option Scheme
at the grant date using the Black Scholes pricing model. The fair value of these options and the underlying
assumptions are disclosed in note 14.
3.7 Provision for retirement and other service benefits obligations
The present value of these obligations depends on a number of factors that are determined on actuarial
basis using a number of assumptions. Any changes in these assumptions will impact the carrying amount
of these obligations. The present values of these obligations and the underlying assumptions are disclosed
in notes 34.2 and 34.7 respectively.
4. PROPERTY, PLANT AND EQUIPMENT
Operating assets (note 4.1) 14,112,080 1,987,643
Capital work in progress (note 4.4) 5,248,606 14,147,123
19,360,686 16,134,766

NOTES TO THE FINANCIAL STATEMENTSFOR THE YEAR ENDED DECEMBER 31, 2009
79Annual Report 2009
(Amounts in thousand)
4.1 Operating assets
Water VCM Ethylene Gas
As at January 1, 2008
Cost 190,779 227,102 2,732,433 119,280 26,122 - 1,691 77,604 66,242 3,441,253
(9,480) (46,686) (1,111,931) (48,350) (10,611) - (689) (47,004) (33,449) (1,308,200)
181,299 180,416 1,620,502 70,930 15,511 - 1,002 30,600 32,793 2,133,053
Year ended December 31, 2008
Opening net book value 181,299 180,416 1,620,502 70,930 15,511 - 1,002 30,600 32,793 2,133,053
3,348 - - - - - - 19,940 20,384 43,672
- Cost - - - - - - - (3,353) (6,583) (9,936)
- Accumulated depreciation - - - - - - - 2,749 3,565 6,314
Net book value - - - - - - - (604) (3,018) (3,622)
- Cost - - (5,889) - - - - - 5,889 -
- Accumulated depreciation - - 2,984 - - - - - (2,984) -
Net book value - - (2,905) - - - - - 2,905 -
(3,870) (5,827) (145,761) (5,964) (1,306) - (85) (9,985) (12,662) (185,460)
180,777 174,589 1,471,836 64,966 14,205 - 917 39,951 40,402 1,987,643
As at January 1, 2009
Cost 194,127 227,102 2,726,544 119,280 26,122 - 1,691 94,191 85,932 3,474,989
(13,350) (52,513) (1,254,708) (54,314) (11,917) - (774) (54,240) (45,530) (1,487,346)
180,777 174,589 1,471,836 64,966 14,205 - 917 39,951 40,402 1,987,643
Year ended December 31, 2009
Opening net book value 180,777 174,589 1,471,836 64,966 14,205 - 917 39,951 40,402 1,987,643
- 168,221 12,076,638 275,128 - 50,023 32,158 ` 16,820 29,811 12,648,799
- Cost - - - - - - - (133) (13,458) (13,591)
- Accumulated depreciation - - - - - - - 74 8,957 9,031
Net book value - - - - - - - (59) (4,501) (4,560)
(3,934) (10,033) (466,383) (11,696) (1,306) (1,042) (754) (12,920) (11,734) (519,802)
176,843 332,777 13,082,091 328,398 12,899 48,981 32,321 43,792 53,978 14,112,080
As at December 31, 2009
194,127 395,323 14,803,182 394,408 26,122 50,023 33,849 110,878 102,285 16,110,197
(17,284) (62,546) (1,721,091) (66,010) (13,223) (1,042) (1,528) (67,086) (48,307) (1,998,117)
176,843 332,777 13,082,091 328,398 12,899 48,981 32,321 43,792 53,978 14,112,080
Annual Rate of
Depreciation (%) 2 to 2.14 2.5 to 10 5 to 16.67 5 5 5 5 5 to 33 20 to 25
Net book value
Depreciation charge - note 4.2
Closing net book value
Cost
Accumulated depreciation
Net book value
Additions
Disposals - note 4.3
Reclassification
Depreciation charge - note 4.2
Closing net book value
Accumulated depreciation
Accumulated depreciation
Net book value
Additions
Disposals / write off - note 4.3
Furniture,fixtures andequipment Vehicles Total
Rupees
Leaseholdland
Building onleasehold land
Plant andMachinery
Pipelines

NOTES TO THE FINANCIAL STATEMENTSFOR THE YEAR ENDED DECEMBER 31, 2009
80Annual Report 2009
(Amounts in thousand)
4.2 Depreciation charge has been allocated as follows:
Cost of sales - note 26 502,452 167,626
Distribution and marketing expenses - note 27 3,371 4,255
Administrative expenses - note 28 3,375 5,085
Capital work-in-progress 10,604 8,494
519,802 185,460
4.3 The details of operating assets disposed / written off during the year are as follows:
2009 2008Rupees
Cost Accumulated Net Sale Mode of Particulars ofdepreciation book value proceeds disposal purchaser
Vehicle 780 780 - 185 Mr. Muhammad Naveed" 1,328 1,015 313 332 Mr. Syed Ahsenuddin" 782 782 - 185 Mr. Syed Ali Akber" 900 366 534 520 Mr. Farooq Fasih" 900 436 464 464 Mr. Imran Hashmi" 900 422 478 478 Mr. Mati ur Rab Siddiqui" 1,500 831 669 609 Mr. M. Imran Farookhi" 1,269 59 1,210 991 Mr. M. Sarmad" 859 683 176 322 Mr. Asif Rasul Khan" 900 449 451 422 Mr. Syed Zubair Ahmed" 900 694 206 338 Mr. Younus Ali Siddiqui
" 407 407 - 138 Mr. Noman Hassan Khan
" 1,034 1,034 - 550 A-908, Block 123, F. B." 999 999 - 539 Area, Gulburg, Karachi
Furniture, fixtures andequipment 90 34 56 76 Insurance claim Adamjee Insurance
Company Limited
Aggregate amount ofassets having net bookvalue less thanRs. 50 each 43 40 3 30
13,591 9,031 4,560 6,179
2008 9,936 6,314 3,622 3,971
___________________ Rupees ___________________
By Companypolicy to existing
/ separatingexecutives
By auction

NOTES TO THE FINANCIAL STATEMENTSFOR THE YEAR ENDED DECEMBER 31, 2009
81Annual Report 2009
(Amounts in thousand)
4.4 Capital work-in-progress
Year ended December 31, 2008
Balance as at January 1, 2008
Additions during the year
Transferred to operating assets
Balance as at December 31, 2008
Year ended December 31, 2009
Balance as at January 1, 2009
Additions during the year
Transferred to operating assets(note 4.4.1)
Balance as at December 31, 2009
1,925,402 109,671 30,251 168,293 7,386 2,922 331,783 2,575,708
10,597,655 53,630 31,235 64,723 31,724 24,325 808,447 11,611,739
- - - - (19,940) (20,384) - (40,324)
12,523,057 163,301 61,486 233,016 19,170 6,863 1,140,230 14,147,123
12,523,057 163,301 61,486 233,016 19,170 6,863 1,140,230 14,147,123
1,830,574 31,717 2,395 15,860 3,129 31,263 1,827,684 3,742,622
(10,608,848) (162,008) (63,589) (246,083) (16,820) (29,811) (1,513,980) (12,641,139)
3,744,783 33,010 292 2,793 5,479 8,315 1,453,934 5,248,606
Rupees
4.4.1 As referred to in note 1.2, the Company commenced work on the expansion Project in 2006, and the
Capital work-in-progress relates to the cost of this expansion Project. During the year, the Company has
commenced commercial production from the new PVC plant and declared commercial operations of
Ethylene Di Chloride (EDC), Chlor-alkali and Power plants (Gas turbines) and transferred the related costs
of these plants to operating assets. However, the Vinyl Chloride Monomer (VCM) plant is currently in the
test production phase.
4.4.2 The ancillary costs, directly attributable to the Project, comprise:
Salaries, wages and benefits 213,879 315,240Training and travelling expenses 45,051 74,439Borrowing costs, including mark-up on finances
using capitalization rate of 12.08% - net(2008: 13.45% - net) 591,810 591,713
Legal and professional charges 31,860 43,103Depreciation 15,053 13,763Storage and handling 481,667 -
Others 74,614 101,972
1,453,934 1,140,230
TotalOther ancillary
costs(note 4.4.2)
Furniture,fixture andequipment
Water andgas
pipelines
Ethylenepipeline and
power cables
Building onleasehold
land
Plant andmachinery
Advancesfor vehicles
2009 2008Rupees

NOTES TO THE FINANCIAL STATEMENTSFOR THE YEAR ENDED DECEMBER 31, 2009
82Annual Report 2009
(Amounts in thousand)
5. INTANGIBLE ASSETS – Computer software
As at January 1, 2008Cost 6,416Accumulated amortization (3,585)Net book value 2,831
Year ended December 31, 2008Opening net book value 2,831Additions at cost 7,180Amortization charge - note 28 (749)Closing net book value 9,262
As at January 1, 2009Cost 13,596Accumulated amortization (4,334)Net book value 9,262
Year ended December 31, 2009Opening net book value 9,262Additions at cost 6,255Amortization charge - note 28 (3,701)Closing net book value 11,816
As at December 31, 2009Cost 19,851Accumulated amortization (8,035)Net book value 11,816
5.1 The cost is being amortized over a period of 5 to 10 years.
6. LONG TERM INVESTMENT
Subsidiary - at cost Engro Polymer Trading (Private) Limited 5,000,000 (2008: 5,000,000) ordinary shares of Rs. 10 each 50,000 50,000
Rupees
2009 2008Rupees
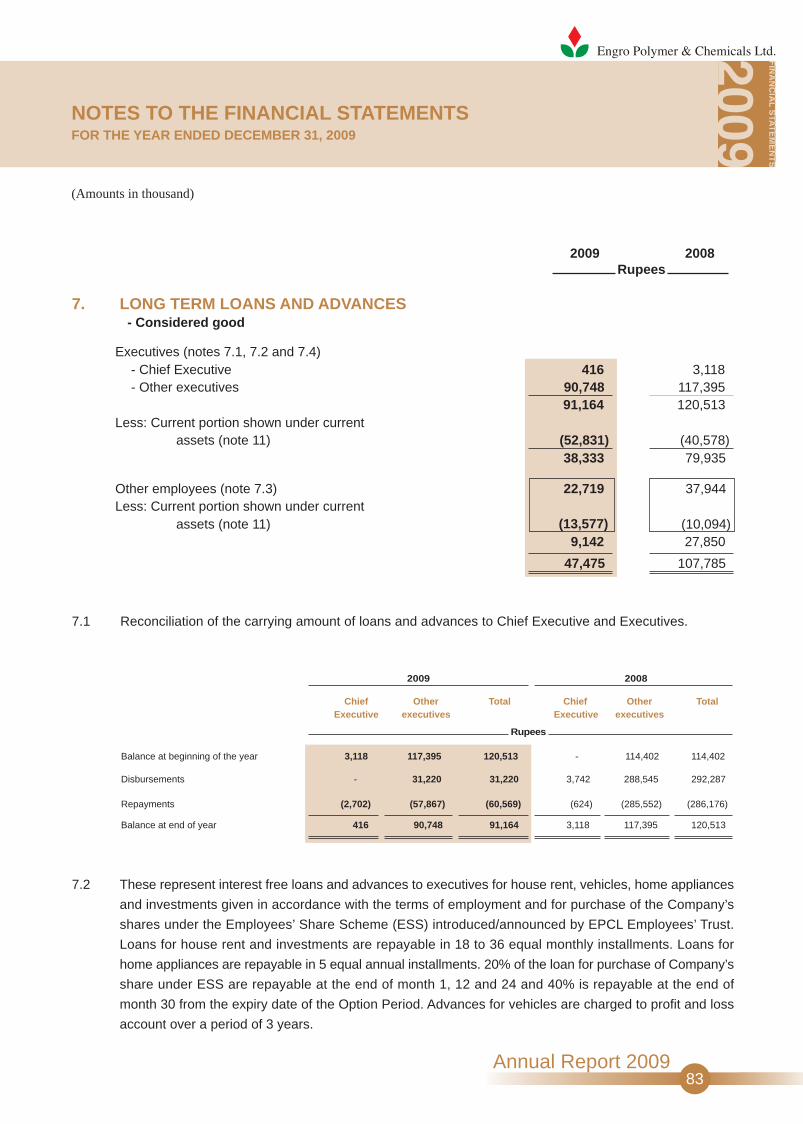
NOTES TO THE FINANCIAL STATEMENTSFOR THE YEAR ENDED DECEMBER 31, 2009
83Annual Report 2009
(Amounts in thousand)
7.2 These represent interest free loans and advances to executives for house rent, vehicles, home appliances
and investments given in accordance with the terms of employment and for purchase of the Company’s
shares under the Employees’ Share Scheme (ESS) introduced/announced by EPCL Employees’ Trust.
Loans for house rent and investments are repayable in 18 to 36 equal monthly installments. Loans for
home appliances are repayable in 5 equal annual installments. 20% of the loan for purchase of Company’s
share under ESS are repayable at the end of month 1, 12 and 24 and 40% is repayable at the end of
month 30 from the expiry date of the Option Period. Advances for vehicles are charged to profit and loss
account over a period of 3 years.
7. LONG TERM LOANS AND ADVANCES- Considered good
Executives (notes 7.1, 7.2 and 7.4) - Chief Executive 416 3,118 - Other executives 90,748 117,395
91,164 120,513Less: Current portion shown under current
assets (note 11) (52,831) (40,578)38,333 79,935
Other employees (note 7.3) 22,719 37,944Less: Current portion shown under current
assets (note 11) (13,577) (10,094)9,142 27,850
47,475 107,785
Balance at beginning of the year
Disbursements
Repayments
Balance at end of year
Chief Other Total Chief OtherExecutive executives Executive executives
3,118 117,395 120,513 - 114,402
- 31,220 31,220 3,742 288,545
(2,702) (57,867) (60,569) (624) (285,552)
416 90,748 91,164 3,118 117,395
2009 2008
Rupees
7.1 Reconciliation of the carrying amount of loans and advances to Chief Executive and Executives.
114,402
292,287
(286,176)
120,513
Total
2009 2008Rupees

NOTES TO THE FINANCIAL STATEMENTSFOR THE YEAR ENDED DECEMBER 31, 2009
84Annual Report 2009
(Amounts in thousand)
7.3 These represent interest free loans to employees for home appliances and investments, given in accordance
with the terms of employment and for purchase of the Company’s shares under the Employees’ Share
Scheme (ESS) introduced/announced by EPCL Employees’ Trust. Loans are repayable in accordance
with the terms stated in note 7.2.
7.4 The maximum aggregate amount due from Chief Executive and executives at the end of any month during
the year was Rs. 111,540 (2008: Rs. 130,000).
7.5 The carrying values of these financial assets are neither past due nor impaired. The credit quality of these
financial assets can be assessed with reference to no defaults in recent history.
8. STORES, SPARES AND LOOSE TOOLS
Consumable stores 20,194
Spares 176,435 113,407
196,629 127,152
Less: Provision for slow moving stores
and spares - note 26 (3,867)
192,762 127,152
9. STOCK-IN-TRADE
Raw and packing materials - note 9.1 1,168,171 327,670Work-in-process 17,579
Finished goods- own manufactured product - note 9.2 410,653 810,355
- purchased product 8,815
419,468 810,355
1,605,218 1,159,318
13,745
21,293
-
-
2009 2008Rupees

85Annual Report 2009
NOTES TO THE FINANCIAL STATEMENTSFOR THE YEAR ENDED DECEMBER 31, 2009
9.1 This includes stocks-in-transit amounting to Rs. 248,065 (2008: Rs. 155,925) and stocks held at the storage
facilities of the following related parties:
- Engro Vopak Terminal Limited 595,104 22,148- Dawood Hercules Chemicals Limited 1,635 -
596,739 22,148
(Amounts in thousand)
9.2 This represents carrying value of PVC resin, net of realizable value reduction of Rs. 21,084 (2008: Rs. 6,791).
10. TRADE DEBTS, considered good
Secured (note 10.1) 256,730 69,514Unsecured (note 10.2) 79,512
336,242 69,514
10.1 These debts are secured by way of bank guarantees and letters of credit from customers.
10.2 Includes due from following related parties:
- Engro Chemical Pakistan Limited 1,070 -- Engro Polymer Trading (Private) Limited 60,565 -
61,635 -
10.3 The carrying values of these financial assets are neither past due nor impaired. The credit quality of these
financial assets can be assessed with reference to no defaults in recent history.
-
2009 2008Rupees
2009 2008Rupees
2009 2008Rupees

NOTES TO THE FINANCIAL STATEMENTSFOR THE YEAR ENDED DECEMBER 31, 2009
86Annual Report 2009
(Amounts in thousand)
11. LOANS, ADVANCES, DEPOSITS, PREPAYMENTSAND OTHER RECEIVABLES
Considered good
Current portion of long term loans andadvances - note 7- executives 52,831 40,578- employees 13,577 10,094
66,408 50,672
Advances to employees for reimburseable expenses 824 4,201Advances to suppliers and others 59,818 24,307Deposits 23,145 43,131Prepayments 65,036 26,030Receivable from Government
- sales tax refundable 89,252 150,171- octroi/duty claims 152 152
89,404 150,323
Accrued return on investments 92 30Receivable from ECPL, Holding Company 1,318 153Other receivables 3,179 85
309,224 298,932Considered doubtful
Custom duty claims refundable 18,043 18,043Less: Provision for impairment - note 11.1 (18,043) (18,043)
- -
Special Excise Duty (SED) refundable 36,687 36,687Less: Provision for impairment - note 23 (36,687) (36,687)
- -
309,224 298,932
11.1 The Collector of Customs through his order dated April 11, 2008, disposed off the refund applications filed
by the Company for the refund of custom duty paid at import stage on import of Vinyl Chloride Monomer.
The Company based on the advice of its tax consultant, has filed an appeal before the Collector of Customs
(Appeals), Karachi dated May 31, 2008 against the aforementioned order on which no progress has been
made. However, the Company based on prudence carries full provision against the aforementioned custom
duty refundable in the financial statements.
2009 2008Rupees

87Annual Report 2009
(Amounts in thousand)
11.2 As at December 31, 2009 receivables aggregating to Rs. 54,730 (2008: Rs. 54,730) were deemed to be
impaired and have been provided for fully in these financial statements based on prudence. The remaining
balance of loans, advances, deposits, prepayments and other receivables are neither past due nor impaired.
13.1 As at December 31, 2009, Engro Chemical Pakistan Limited (ECPL) – the Holding Company holds
292,400,000 (2008: 292,400,000) ordinary shares of Rs. 10 each.
13. SHARE CAPITAL
Authorized capital
700,000,000 (2008: 700,000,000) ordinary sharesof Rs. 10 each 7,000,000 7,000,000
Issued, subscribed and paid-upcapital
520,367,677 (2008: 520,367,677) ordinary sharesof Rs. 10 each, fully paid in cash 5,203,677 5,203,677
12.1 Includes Rs. 23,718 (2008: Rs. 2,671) kept in a separate bank account in respect of security deposits.
12.2 These deposits matured during the year and carried mark-up at the rates ranging from 1% to 4.7% per
annum
12. CASH AND BANK BALANCES
Cash in hand 970
Cash at bank- on current accounts 121,621- on saving accounts - note 12.1 67,473
189,094Short term deposits - note 12.2 -
190,064
4,8753,217
8,092
97,273
88,246
935
NOTES TO THE FINANCIAL STATEMENTSFOR THE YEAR ENDED DECEMBER 31, 2009
2009 2008Rupees
2009 2008Rupees

NOTES TO THE FINANCIAL STATEMENTSFOR THE YEAR ENDED DECEMBER 31, 2009
88Annual Report 2009
(Amounts in thousand)
14. EMPLOYEES' SHARE OPTION SCHEME
14.1 The employees' share option scheme (the Scheme) was originally approved by the shareholders in their
Extraordinary General Meeting (EGM) held on October 8, 2007. Under the Scheme, senior employees
who were considered critical to the business operations were granted options to purchase 5.3 million newly
issued ordinary shares at an exercise price of Rs. 22 per ordinary share. The number of options granted
was calculated by reference to how critical an employee was considered to the business and his abilities,
subject to approval by the Compensation Committee. The options carry neither right to dividends nor voting
rights. Vesting period started from the ‘grant date’ and ends on December 31, 2009, whereafter the options
can be exercised within a period of two years. Further, employees who joined the Company by October
31, 2008 and those promoted to the eligible employee grade by the same date have also been granted
options on similar terms.
Last year, the Company proposed certain changes relating to ‘grant date’ in the originally approved Scheme.
These changes were approved by the shareholders in their EGM held on June 27, 2008, and subsequently
by the SECP on September 25, 2008. As per the approved change to the Scheme the ‘grant date’ is the
date of EGM held on October 8, 2007, when the Scheme was originally approved.
14.2 The amounts recognized in these financial statements in respect of the Scheme are as follows:
14.2.1 Employee share compensation reserve
9,858Unvested share options lapsed during the year (545)
9,313
14.2.2 Deferred employee share compensation expense
4,381Unvested share options lapsed during the year (545)Amortization for the year/period (3,836)
-Balance at end of the year
Balance at beginning of the year/recognized on
Balance at end of the year
Balance at beginning of the year /recognized on
the date of grant
the date of grant
9,858
9,858
-
-
9,858
(5,477)
4,381
14.3 The Company used Black Scholes pricing model to calculate the fair value of share options atthe grant date. The fair value of the share options as per the model and underlying assumptions are asfollows:
2009 2008Rupees

NOTES TO THE FINANCIAL STATEMENTSFOR THE YEAR ENDED DECEMBER 31, 2009
89Annual Report 2009
15.1 During the year, the Company entered into a Syndicate Term Finance Agreement with a consortium
of local banks for Rs. 1,500,000. The facility, in addition to the mark-up, also carries a monitoring fee of
Rs. 300 for the first year and Rs. 500 per annum, thereafter. Commitment fee at rate of
0.15% per annum is also payable on that part of the finance that has not been drawn down.
During the year, the entire facility has been drawn down.
15.2 During the year, the Company has drawn down the remaining balance of US $ 30,000 against
the loan agreement / facility with International Finance Corporation (IFC).
15.3 The above finances are secured by:
(i) a first mortgage by deposit of title deeds over Project Properties ranking pari passu with
facilities against LCs referred to in note 22.2;
(ii) a first mortgage by deposit of title deeds over leasehold land (30 acres) of the Project
together with the buildings, plant, machinery and other equipment thereon ranking pari
passu with the facilities referred to in note 22.2; and
.
(Amounts in thousand)
Total number of share options issued 5,300,000Fair value of the share options at grant date Rs. 1.86Share price at grant dateExercise priceAnnual volatility based on historical patternRisk free rate usedExpected dividends
Rs. 18Rs. 22
15.13%10.12%
Nil
15. LONG TERM BORROWINGS, Secured
Mark - up rateper annum Number
2009 2008
Syndicated term finance I 13 half yearly November 2010 5,655,127 5,648,525
Morabaha finance 8 half yearly September 2009 - 100,000
Long term finance utilized undermark-up arrangements 5 half yearly June 2007 - 30,000
Syndicated term finance II (note 15.1) 13 half yearly June 2010 1,485,599 -
International Finance
Corporation (IFC) (note 15.2) 15 half yearly June 2010 5,010,830 2,324,547
12,151,556 8,103,072
Less: Current portion shown under current liabilities (1,016,393) (130,000)
11,135,163 7,973,072
6 months LIBOR + 2.6 to 3%
Rupees
Installments
6 months KIBOR + 2.25%
Commencing from
6 months KIBOR + 0.5%
6 months KIBOR + 3%
6 months KIBOR + 0.5%

NOTES TO THE FINANCIAL STATEMENTSFOR THE YEAR ENDED DECEMBER 31, 2009
90Annual Report 2009
(Amounts in thousand)
(iii) hypothecation by way of:
- a first charge over all Project Assets, ranking pari passu with facilities referred to in note 22.2; and
- a first charge over all present and future moveable fixed assets other than Project Assets
16. DERIVATIVE FINANCIAL INSTRUMENTS
The Company has entered into interest rate swap agreements for notional amounts aggregating to US $
40,000, with banks to hedge its interest rate exposure on floating rate foreign currency borrowings from
International Finance Corporation (IFC). Under the swap agreements, the Company would receive six
month USD-LIBOR on respective notional amounts and will pay fix rates, which will be settled semi annually.
Details of the swap agreements are as follows:
15,000 December 15, 2008 June 15, 2017 3.385 23,770 5,000 June 15, 2009 June 15, 2017 3.005 1,838 15,000 June 15, 2009 June 15, 2017 2.795 (4,570) 5,000 June 15, 2009 June 15, 2017 2.800 (1,103)
40,000 19,935 60,154
NotionalAmounts
US $
Effective Date
TerminationDate
Fixed Rate%
Fair values
60,154---
17.1 This represents amounts retained from progress payments made to contractors/suppliers against work
completed on the Project, referred to in note 1.2.
17. RETENTION MONEY AGAINST PROJECT PAYMENTS
Amounts retained as at December 31 - note 17.1 801,718 792,478
Less: Current portion shown under currentliabilities - note 20 (801,718) (239,033)
- 553,445
2009 2008Rupees
2009 2008Rupees

91Annual Report 2009
(Amounts in thousand)
18. DEFERRED INCOME TAX LIABILITIES
Credit balances arising due to:
- accelerated tax depreciation 3,061,376 548,080
- net borrowing costs capitalized 207,133 160,0543,268,509 708,134
Debit balances arising due to:
- recoupable carried forwardtax losses - note 18.1 (2,725,269) (153,887)
- unrealized foreign exchange losses, unpaidliabilities and provision for retirement andother service benefits (46,581) (25,243)
- provision against custom duty andSED refundable (6,454)
- provision for slow moving stores and spares (1,353)
- fair value of hedging instrument (6,977) (21,054)
- share issuance cost, net to equity (51,566) (51,566)
- recoupable minimum turnover tax (108,789) (67,356)
(2,946,989) (325,560)
321,520 382,574
18.1 Deferred income tax asset is recognized for tax losses available for carry-forward to the extent that the
realization of the related tax benefit through future taxable profits is probable. The aggregate tax losses
available for carry-forward at December 31, 2009 amount to Rs. 7,786,483 (2008: Rs. 439,677), on which
the deferred income tax asset has been recognized.
19. RETIREMENT AND OTHER SERVICEBENEFIT OBLIGATIONS
Service incentive plan 34,172 35,524Additional death gratuity - note 34 4,140 2,976
38,312 38,500
-
(6,454)
NOTES TO THE FINANCIAL STATEMENTSFOR THE YEAR ENDED DECEMBER 31, 2009
2009 2008Rupees
2009 2008Rupees

NOTES TO THE FINANCIAL STATEMENTSFOR THE YEAR ENDED DECEMBER 31, 2009
92Annual Report 2009
20. TRADE AND OTHER PAYABLES
Trade and other creditors - note 20.1 1,221,829 797,208Accrued liabilities 521,500 317,536Advances from customers 399,002 118,173Current portion of retention money - note 17 801,718 239,033Security deposits 23,610 2,510Workers' profits participation fund - note 20.2 28,659 24,625Workers' welfare fund - 9,357Others 1,779 2,293
2,998,097 1,510,735
20.1 Includes amount due to following related parties:
- Mitsubishi Corporation 1,150,769 740,811- Engro Vopak Terminal Limited 77,045 15,046
1,227,814 755,857
20.2 Workers' profits participation fund
Balance as at January 1 24,625 30,988Add: Allocation for the year - note 29 - 24,625Add: Interest thereon - note 31 4,034 -
28,659 55,613
Less: Payments made during the year - (30,988)
Balance as at December 31 28,659 24,625
21. ACCRUED INTEREST / MARK-UP
Finance cost accrued on:- long term borrowings 196,483 157,678- short term borrowings 5,724 9,590
202,207 167,268
(Amounts in thousand)
2008Rupees
2009
22. SHORT TERM BORROWINGS
Running finance utilized under mark-up arrangements - note 22.1 394,241 717,568
Short term finance - 125,000
394,241 842,568

NOTES TO THE FINANCIAL STATEMENTSFOR THE YEAR ENDED DECEMBER 31, 2009
93Annual Report 2009
(Amounts in thousand)
22.1 The aggregate facilities for running finance available from various banks, represents the sales price of
all mark-up arrangements, amount to Rs. 2,000,000 (2008: Rs. 1,275,000). The corresponding purchase
price is payable on various dates during the ensuing year. Mark-up is chargeable at rates net of prompt
payment rebate, ranging from relevant period KIBOR plus 0.9% to relevant period KIBOR plus 3% (2008:
relevant period KIBOR plus 1.25% to relevant period KIBOR plus 3%). During the year, the mark-up rates,
net of prompt payment rebate, ranged from 12.39% to 17.37% per annum (2008: 10.37% to 17.6% per
annum).
22.2 The facility for opening letters of credit as at December 31, 2009 aggregate to Rs. 4,794,000 (2008:
Rs. 9,468,000). The amount utilized at December 31, 2009 was Rs. 1,933,000 (2008: Rs. 1,232,000). The
facilities carry commission at the rate of 0.05% per quarter.
23. PROVISIONS
Balance at beginning of the year 54,929 -
Add: Recognized during the year 2,995 54,929
57,924 54,929Add: Provision for surcharge thereon 12,570 -
Balance at end of the year 70,494 54,929
As at December 31, 2009, the Company had paid Rs. 94,611 (2008: Rs. 91,616) on account of Special
Excise Duty (SED) on import of plant and machinery for the Project. Out of this amount the Company has
adjusted Rs. 57,924 (2008: Rs. 54,929) in the monthly sales tax returns against SED on goods produced
and sold by the Company. The Company had approached the Federal Board of Revenue to obtain a
clarification in respect of the adjustment of SED made by the Company in monthly sales tax returns.
Pending such clarification the Company based on prudence had made provision for the adjusted amount
of Rs. 57,924 and for the balance remaining of Rs. 36,687 included in loans, advances, deposits,
prepayments and other receivables. However, during the year, the Company received show cause notices
from the Additional Collector (Adjudication) – Federal Board of Revenue, stating that the Company, by
adjusting the aforementioned SED, has violated the provisions of the Federal Excise Act, 2005 and the
Federal Excise Rules, 2005 read with SRO 655(1)/2007 and that the amount adjusted is recoverable from
the Company under the Federal Excise Act, 2005 along with default surcharge and penalty. In response
to these notices the Company has filed a Constitutional Petition before the Honourable High Court, Sindh,
on May 18, 2009. The High Court is in the process of evaluating the Constitutional Petition. The Company
is confident that the ultimate outcome of the matter will be in its favour, however, based on prudence is
maintaining the aforementioned provision. Further, a provision of Rs. 12,570 for surcharge and penalty
there against upto December 31, 2009 has also been made.
2009 2008Rupees
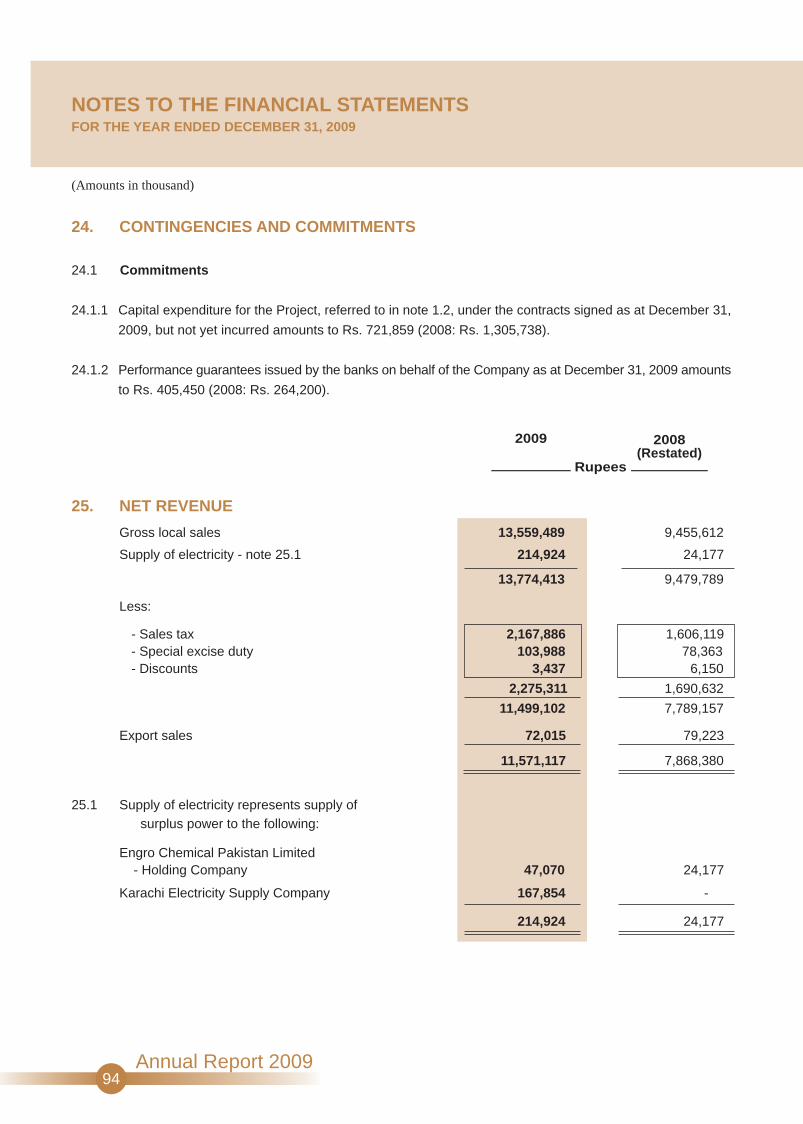
NOTES TO THE FINANCIAL STATEMENTSFOR THE YEAR ENDED DECEMBER 31, 2009
94Annual Report 2009
(Amounts in thousand)
24. CONTINGENCIES AND COMMITMENTS
24.1 Commitments
24.1.1 Capital expenditure for the Project, referred to in note 1.2, under the contracts signed as at December 31,
2009, but not yet incurred amounts to Rs. 721,859 (2008: Rs. 1,305,738).
24.1.2 Performance guarantees issued by the banks on behalf of the Company as at December 31, 2009 amounts
to Rs. 405,450 (2008: Rs. 264,200).
25. NET REVENUE
Gross local sales 13,559,489 9,455,612
Supply of electricity - note 25.1 214,924 24,177
13,774,413 9,479,789
Less:
- Sales tax 2,167,886 1,606,119- Special excise duty 103,988 78,363- Discounts 3,437 6,150
2,275,311 1,690,632
11,499,102 7,789,157
Export sales 72,015 79,223
11,571,117 7,868,380
2008(Restated)
Rupees
2009
25.1
Engro Chemical Pakistan Limited - Holding Company 47,070 24,177
Karachi Electricity Supply Company 167,854 -
214,924 24,177
Supply of electricity represents supply ofsurplus power to the following:

NOTES TO THE FINANCIAL STATEMENTSFOR THE YEAR ENDED DECEMBER 31, 2009
95Annual Report 2009
(Amounts in thousand)
2008Rupees
2009
26. COST OF SALES
Opening stock of work-in-progress 21,293 22,861
Raw and packing materials consumed 7,904,707 6,254,555
Salaries, wages and staff welfare - note 26.2 211,896 97,332
Fuel, power and gas 771,237 158,437
Repairs and maintenance 49,292 10,797
Depreciation - note 4.2 502,452 167,626
Consumable stores 91,649 21,310
Purchased services 54,458 25,082
Storage and handling - note 26.3 339,425 139,405
Training and travelling expenses 5,943 11,185
Communication, stationery and other
office expenses 2,971 2,211
Insurance 51,050 10,597
Provision for slow moving stores and spares - note 8 3,867 -
Other expenses 18,558 5,061
10,007,505 6,903,598
Closing stock of work-in-progress - note 9 (17,579) (21,293)
Cost of goods manufactured 10,011,219 6,905,166
Opening stock of finished goods 810,355 640,170Closing stock of finished goods - note 9 (410,653) (810,355)
399,702 (170,185)
Cost of sales - own manufactured product 10,410,921 6,734,981Cost of goo ld - purchased product - note 26.1 7,736 1,237
10,418,657 6,736,218
26.1 Cost of sales - purchased product
Opening stock - 147Add: Purchases 16,551 1,090Less: Closing stock - note 9 (8,815) -
7,736 1,237
26.2 This includes Rs. 11,441 (2008: Rs. 5,648), in respect of staff retirement and benefits referred to in note 34.

NOTES TO THE FINANCIAL STATEMENTSFOR THE YEAR ENDED DECEMBER 31, 2009
96Annual Report 2009
(Amounts in thousand)
26.3 The Company has entered into operating lease arrangements with Al-Rahim Trading Terminal and Dawood
Hercules Chemicals Limited – a related party, for storage and handling of Ethylene Di Chloride and Caustic soda
respectively. The total lease rentals due under these lease arrangements are payable in periodic monthly
installments till July 31, 2019.
The future aggregate lease payments under these arrangements are as follows:
2008Rupees
2009
Not later than 1 year 43,398 -
Later than 1 year and not later than 5 years 57,600 -
Later than 5 years 64,800 -
165,798 -
27.1 This includes Rs. 3,228 (2008: Rs. 2,613), in respect of staff retirement and benefits, referred to in note 34.
27. DISTRIBUTION AND MARKETING EXPENSES
Salaries, wages and staff welfare - note 27.1 50,641 42,535Advertising, sales promotion and entertainment 50,921 30,669Product transportation and handling 344,667 202,208Rent, rates and taxes 3,625 5,524Purchased services 3,367 9,695Insurance 1,002 919Depreciation - note 4.2 3,371 4,255Training and travelling expenses 6,473 7,872Communication, stationery and other
office expenses 2,041 2,709Other expenses 2,404 5,254
468,512 311,640
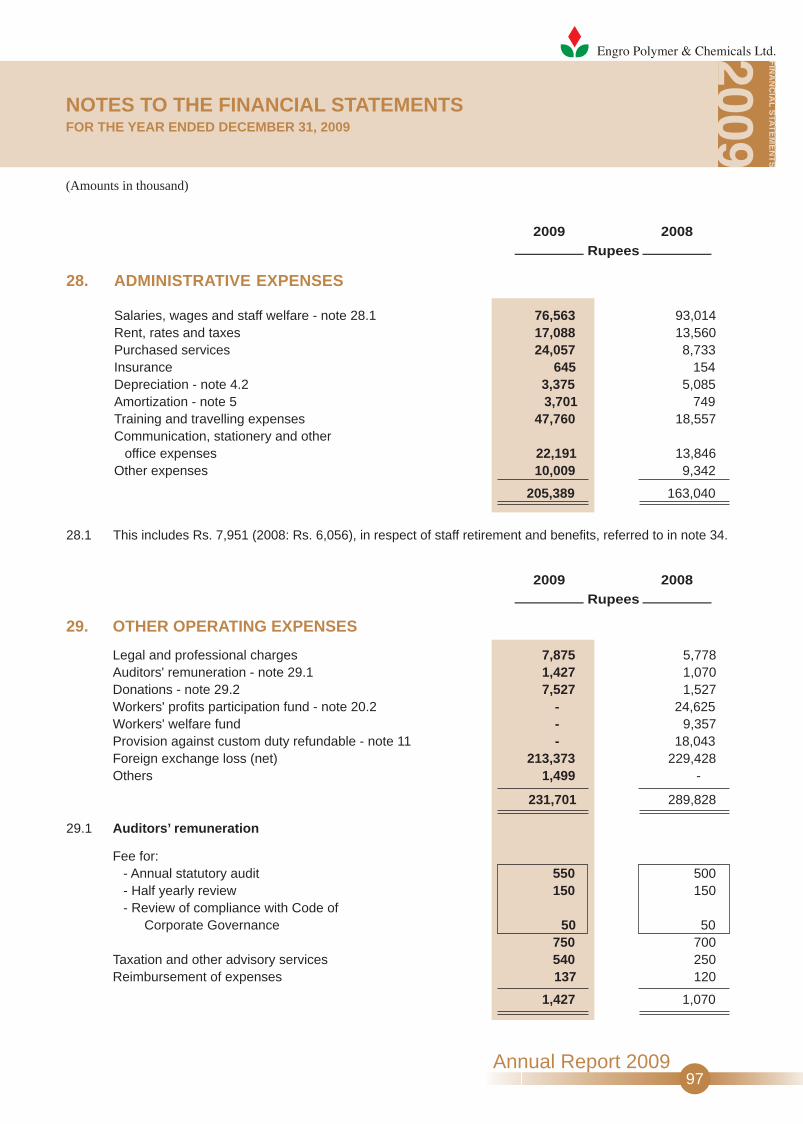
NOTES TO THE FINANCIAL STATEMENTSFOR THE YEAR ENDED DECEMBER 31, 2009
97Annual Report 2009
(Amounts in thousand)
29. OTHER OPERATING EXPENSES
Legal and professional charges 7,875 5,778Auditors' remuneration - note 29.1 1,427 1,070Donations - note 29.2 7,527 1,527Workers' profits participation fund - note 20.2 - 24,625Workers' welfare fund - 9,357Provision against custom duty refundable - note 11 - 18,043Foreign exchange loss (net) 213,373 229,428Others 1,499 -
231,701 289,828
29.1 Auditors’ remuneration
Fee for:- Annual statutory audit 550 500- Half yearly review 150 150- Review of compliance with Code of
Corporate Governance 50 50750 700
Taxation and other advisory services 540 250Reimbursement of expenses 137 120
1,427 1,070
2008Rupees
2009
28. ADMINISTRATIVE EXPENSES
Salaries, wages and staff welfare - note 28.1 76,563 93,014Rent, rates and taxes 17,088 13,560Purchased services 24,057 8,733Insurance 645 154Depreciation - note 4.2 3,375 5,085Amortization - note 5 3,701 749Training and travelling expenses 47,760 18,557Communication, stationery and other
office expenses 22,191 13,846Other expenses 10,009 9,342
205,389 163,040
2008Rupees
2009
28.1 This includes Rs. 7,951 (2008: Rs. 6,056), in respect of staff retirement and benefits, referred to in note 34.

NOTES TO THE FINANCIAL STATEMENTSFOR THE YEAR ENDED DECEMBER 31, 2009
98Annual Report 2009
(Amounts in thousand)
29.2 The recipients of donations for the year do not include any donee in whom a director or his spouse had
any interest.
30. OTHER OPERATING INCOMEOn financial assets
Income on short term investment and bank deposit 61,878 46,310Gain on sale of short term investments 35,168 69,879
On non-financial assets
Profit on disposal of property, plant and equipment 1,619 349Scrap sales 1,448 814Others 149 6,982
100,262 124,334
31. FINANCE COSTS
Interest / Mark-up on:- long term borrowings 554,898 18,212- short term borrowings 23,757 8,244
Accrued interest on payable to Workers' ProfitsParticipation Fund - note 20.2 4,034 -
Guarantee commission 2,096 979Bank charges and others 11,479 6,094
596,264 33,529
32. TAXATION
Current- for the year - note 32.1 57,873 793- for prior years (97) -
57,776 793Deferred - for the year (75,131) 104,450
(17,355) 105,243
32.1 Current year charge represents minimum tax at the rate of 0.5% of the turnover, in accordance with section
113 of the Income Tax Ordinance, 2001, inserted through Finance Act, 2009.
2008(Restated)
Rupees
2009
2008Rupees
2009
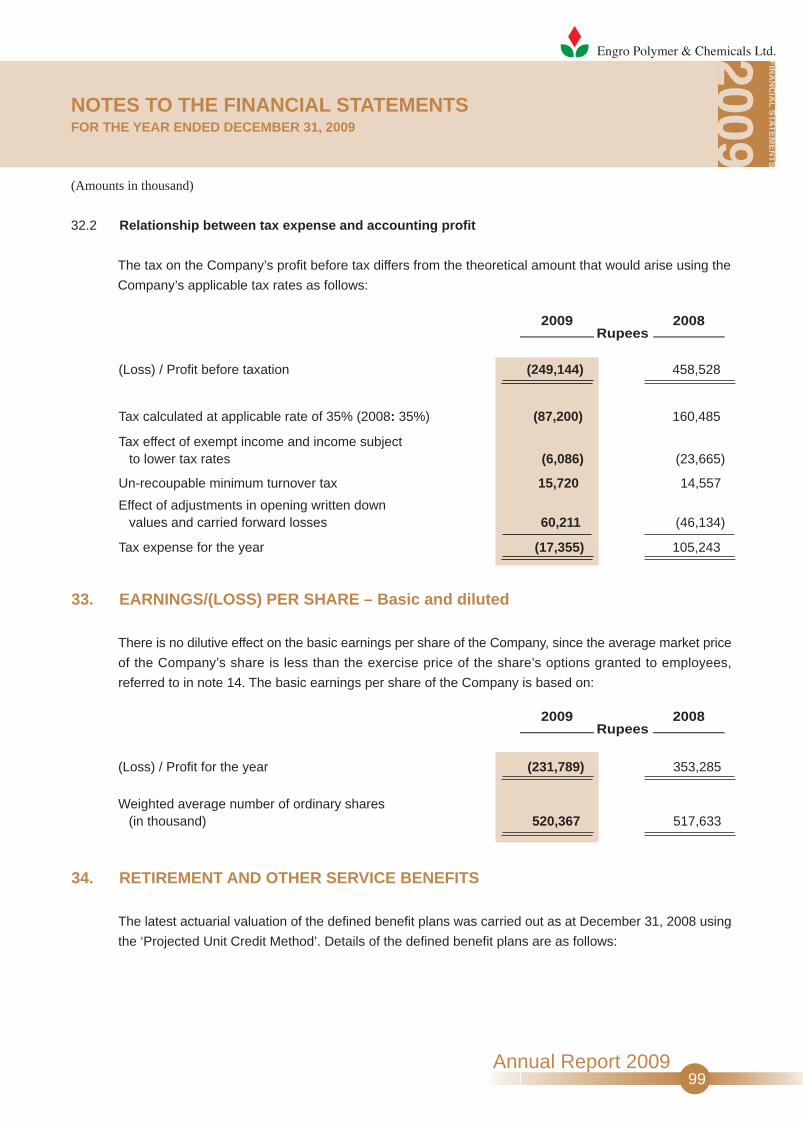
NOTES TO THE FINANCIAL STATEMENTSFOR THE YEAR ENDED DECEMBER 31, 2009
99Annual Report 2009
(Amounts in thousand)
32.2 Relationship between tax expense and accounting profit
The tax on the Company’s profit before tax differs from the theoretical amount that would arise using the
Company’s applicable tax rates as follows:
2008Rupees
2009
(Loss) / Profit before taxation (249,144) 458,528
Tax calculated at applicable rate of 35% (2008: 35%) (87,200) 160,485
Tax effect of exempt income and income subjectto lower tax rates (6,086) (23,665)
Un-recoupable minimum turnover tax 15,720 14,557
Effect of adjustments in opening written downvalues and carried forward losses 60,211 (46,134)
Tax expense for the year (17,355) 105,243
33. EARNINGS/(LOSS) PER SHARE – Basic and diluted
There is no dilutive effect on the basic earnings per share of the Company, since the average market price
of the Company’s share is less than the exercise price of the share’s options granted to employees,
referred to in note 14. The basic earnings per share of the Company is based on:
(Loss) / Profit for the year (231,789) 353,285
Weighted average number of ordinary shares(in thousand) 520,367 517,633
34. RETIREMENT AND OTHER SERVICE BENEFITS
The latest actuarial valuation of the defined benefit plans was carried out as at December 31, 2008 using
the ‘Projected Unit Credit Method’. Details of the defined benefit plans are as follows:
2008Rupees
2009

NOTES TO THE FINANCIAL STATEMENTSFOR THE YEAR ENDED DECEMBER 31, 2009
100Annual Report 2009
(Amounts in thousand)
2009 2008 2009 2008 2009 2008Rupees
34.1 Balance sheet reconciliation
Present value of definedbenefit obligations 78,994 68,644 26,048 22,888 - -
Fair value of plan assets (88,607) (73,582) (27,618) (21,821) - -(Surplus) / Deficit (9,613) (4,938) (1,570) 1,067 - -Present value of unfunded
obligations - - - - 4,523 3,359Unrecognized net actuarial
gains / (losses) 9,613 4,938 1,570 (1,067) (383) (383)
Net liability at the end of the year - - - - 4,140 2,976
34.2 Movement in the definedbenefit obligations
Obligation as at January 1 68,644 53,267 22,888 19,600 3,359 2,429Current service cost 6,841 5,525 3,270 2,223 680 413
Interest cost 9,704 5,603 3,300 2,049 481 246Actuarial losses / (gains) - 4,754 - 4,280 3 271
Benefits paid (6,195) (505) (3,410) (5,264) - -Obligation as at December 31 78,994 68,644 26,048 22,888 4,523 3,359
34.3 Movement in the fair value
of plan assets
Fair value as at January 1 73,582 62,237 21,821 21,742 - -
Expected return on plan assets 10,350 6,449 3,160 2,253 - -
Actuarial gains - 905 - 1,071 - -
Employer contributions 6,195 4,496 3,410 2,019 - -
Benefits paid (1,520) (505) (773) (5,264) - -
Fair value as at December 31 88,607 73,582 27,618 21,821 - -
34.4 The amounts recognized in
the profit and lossaccount are as follows:
Current service cost 6,841 5,525 3,270 2,223 680 413
Interest cost 9,704 5,603 3,300 2,049 481 246
Expected return on plan assets (10,350) (6,449) (3,160) (2,253) - -
Recognition of actuarial(gains) / losses - (183) - - 3 -
Expense 6,195 4,496 3,410 2,019 1,164 659
34.5 Actual return on plan assets (3,867) 2,461 (222) 827 - -
Pension Fund Gratuity Fund Additional Death GratuityScheme

NOTES TO THE FINANCIAL STATEMENTSFOR THE YEAR ENDED DECEMBER 31, 2009
101Annual Report 2009
(Amounts in thousand)
34.6 Expected future costs for the year ending December 31, 2010:
2009 2008 2009 2008
Discount rate 14% 14% 14% 14%Expected rate of return per annum
on plan assets 14% 14% 14% 14%Expected rate of increase per annum
in future salaries 13% 13% 13% 13%
Pension Fund Gratuity Fund
34.8 Plan assets comprise of following:
2009 2008 2008
Equity 36,329 25,754 11,323 14,402Debt 47,848 25,754 13,809 6,110Others 4,430 22,074 2,486 1,309
88,607 73,582 27,618 21,821
Pension Fund Gratuity Fund
Rupees
34.9 The expected return on plan assets was determined by considering the expected returns available on the
assets underlying the current investment policy. Expected yields on fixed interest investments are based
on gross redemption yields as at the balance sheet date.
34.7 Principal assumptions used in the actuarial valuation:
Rupees
- Pension Fund 6,266- Gratuity Fund 3,444- Additional Death Gratuity Scheme 1,254
10,964
2009
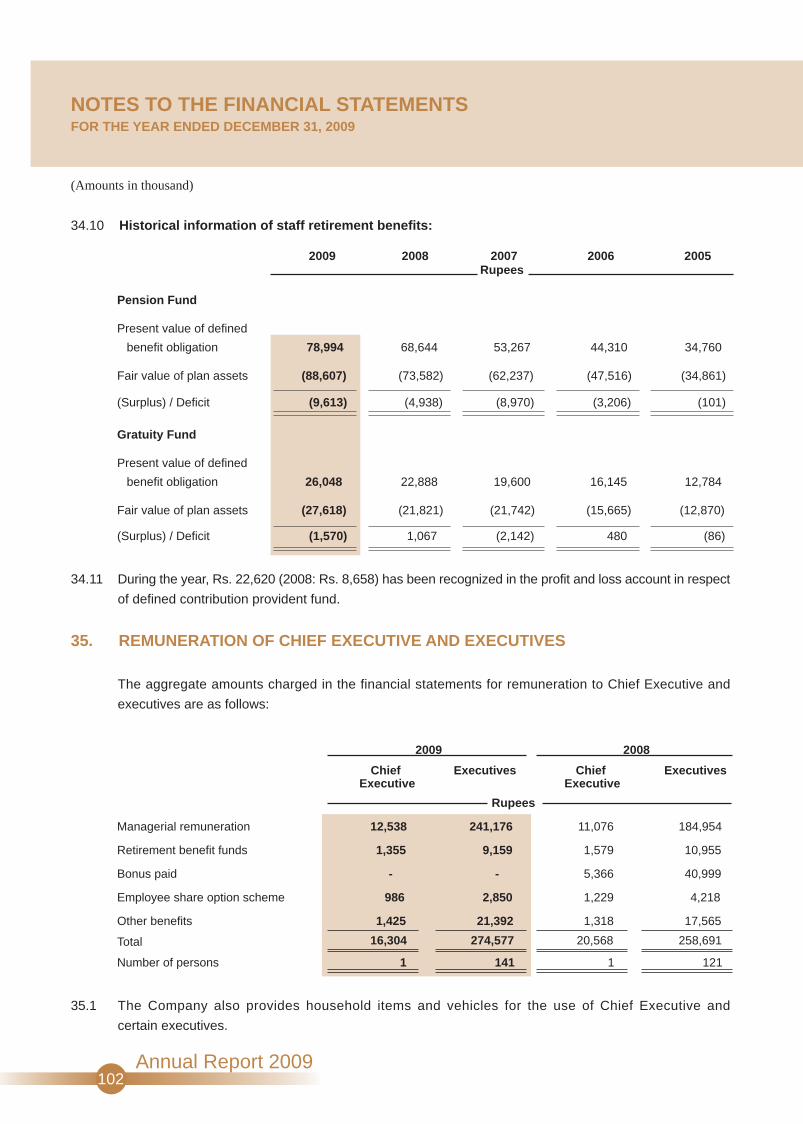
NOTES TO THE FINANCIAL STATEMENTSFOR THE YEAR ENDED DECEMBER 31, 2009
102Annual Report 2009
(Amounts in thousand)
2009 2008 2007 2006 2005
Pension Fund
Present value of defined
benefit obligation 78,994 68,644 53,267 44,310 34,760
Fair value of plan assets (88,607) (73,582) (62,237) (47,516) (34,861)
(Surplus) / Deficit (9,613) (4,938) (8,970) (3,206) (101)
Gratuity Fund
Present value of defined
benefit obligation 26,048 22,888 19,600 16,145 12,784
Fair value of plan assets (27,618) (21,821) (21,742) (15,665) (12,870)
(Surplus) / Deficit (1,570) 1,067 (2,142) 480 (86)
Rupees
34.10 Historical information of staff retirement benefits:
34.11 During the year, Rs. 22,620 (2008: Rs. 8,658) has been recognized in the profit and loss account in respect
of defined contribution provident fund.
35. REMUNERATION OF CHIEF EXECUTIVE AND EXECUTIVES
The aggregate amounts charged in the financial statements for remuneration to Chief Executive and
executives are as follows:
Chief Executives Chief ExecutivesExecutive Executive
Managerial remuneration 12,538 241,176 11,076 184,954
Retirement benefit funds 1,355 9,159 1,579 10,955
Bonus paid - - 5,366 40,999
Employee share option scheme 986 2,850 1,229 4,218
Other benefits 1,425 21,392 1,318 17,565
Total 16,304 274,577 20,568 258,691
Number of persons 1 141 1 121
2009 2008
Rupees
35.1 The Company also provides household items and vehicles for the use of Chief Executive and
certain executives.

NOTES TO THE FINANCIAL STATEMENTSFOR THE YEAR ENDED DECEMBER 31, 2009
103Annual Report 2009
(Amounts in thousand)
36. CASH GENERATED FROM OPERATIONS
(Loss) / Profit before taxation (249,144) 458,528
Adjustments for non cash charges and other items:
Provision for staff retirement andother service benefits 10,769 14,898
Provision against custom duty refundable - 18,043 Depreciation 509,198 185,460
Amortization 3,701 749Amortization of deferred employee share
compensation expense 3,836 5,477Provision for slow moving stores and spares 3,867 -Income on short term investments and bank deposits (61,878) (46,310)Gain realized on sale of short term investments (35,168) (69,879)Provision against SED 15,565 91,616Finance costs 596,264 33,529Interest accrued on Workers' Profits
Participation Fund 4,034 -Profit on disposal of operating assets (1,619) (349)
1,048,569 233,234Working capital changes - note 36.1 690,993 (25,978)
1,490,418 665,784
36.1 Working capital changes
(Increase) / Decrease in current assets
Stores and spares (69,477) (31,433) Stock-in-trade (445,900) (239,863) Trade debts (266,728) 108,958
Loans, advances, deposits, prepaymentsand other receivables (net) (10,230) (97,106)
(792,335) (259,444)
Increase in current liabilities
Trade and other payables 1,483,328 233,466
690,993 (25,978)
2008
Rupees
2009(Restated)

NOTES TO THE FINANCIAL STATEMENTSFOR THE YEAR ENDED DECEMBER 31, 2009
104Annual Report 2009
(Amounts in thousand)
2008Rupees
2009
38. FINANCIAL INSTRUMENTS BY CATEGORY
38.1 Financial assets as per balance sheet
Loans and receivablesLong term loans and advances 47,475 107,785Trade debts - considered good 336,242 69,514Loans, advances, deposits, and other receivables 94,142 94,071Cash and bank balances 190,064 97,273
667,923 368,643
38.2 Financial liabilities as per balance sheet
Financial liabilities measured atamortized cost
Long term borrowings 11,135,163 7,973,072Derivative financial instruments 19,935 60,154Retention money against project payments - 553,445Retirement and other service benefit obligations 38,312 38,500Current portion of long term borrowings 1,016,393 130,000Trade and other payables 2,570,436 1,358,580Accrued interest/mark-up 202,207 167,268Short term borrowings 394,241 842,568
15,376,687 11,123,587
38.3 Fair values of financial assets and liabilities
Fair value is the amount for which an asset could be exchanged, or a liability settled, between knowledgeable
willing parties in an arms length transaction.
The carrying values of all financial assets and liabilities reflected in the financial statements approximate
their fair values.
37. CASH AND CASH EQUIVALENTS
Cash and bank balances - note 12 190,064 97,273Short term borrowings - note 22 (394,241) (842,568)
(204,177) (745,295)

NOTES TO THE FINANCIAL STATEMENTSFOR THE YEAR ENDED DECEMBER 31, 2009
(Amounts in thousand)
39. FINANCIAL RISK MANAGEMENT OBJECTIVES AND POLICIES
39.1 Financial risk factors
The Company’s activities expose it to a variety of financial risks including market risk (currency risk, interest
rate risk and price risk), credit risk and liquidity risk. The Company’s risk management program focuses
on the unpredictability of financial markets and seeks to minimize the potential adverse effects on the
Company’s financial performance. The Company uses derivative financial instruments to hedge certain
risk factors. Risk management is carried out by the Company’s finance department under guidance of the
Company’s Board of Directors.
a) Market risk
i) Currency risk
Currency risk represents the risk that the fair values or future cash flows of financial instruments will
fluctuate because of changes in foreign currency rates. The Company is exposed to foreign exchange
risk arising from currency exposures primarily with respect to US Dollars. The risk arises from outstanding
payments for imports, recognized assets and liabilities in foreign currency and future commercial
transactions. In the current economic environment, the Company is significantly exposed to currency
risk because of the expected volatility in exchange rates. The Company used to manage the currency
risk through forward exchange contracts, however, since last year is unable to hedge its foreign
exchange risk exposure due to restriction on forward-covers imposed by the State Bank of Pakistan.
Currently, the Company manages the foreign currency risk through close monitoring of currency market.
At December 31, 2009 the financial assets and liabilities exposed to foreign exchange risk amount
to Rs. 84,095 (2008: Rs. 88,276) and Rs. 7,007,487 (2008: Rs. 3,117,025) respectively.
At December 31, 2009, if the Pakistani Rupee had weakened/strengthened by 5% against the US
Dollar with all other variables held constant, post-tax loss/profit for the year would have been higher/lower
by Rs. 225,010 (2008: Rs. 98,434), mainly as a result of foreign exchange losses/gains on translation
of US Dollar-denominated liabilities. However, this change in profitability would have been offset by
a corresponding change in margins as bulk of revenues is linked with movements in exchange rates.
ii) Interest rate risk
Interest rate risk represents the risk that the fair value or future cash flows of financial instruments
will fluctuate because of changes in market interest rates. The Company is exposed to interest rate
risk arising from long and short term borrowings. Borrowing at variable rates exposes the Company
to cash flow interest rate risk, whereas, borrowing at fixed rate expose the Company to fair value
interest rate risk.
To manage its cash flow interest rate risk, the Company has entered into floating to fixed rate interest
swaps on its foreign currency borrowings. Such interest rate swaps have the economic effect of
converting floating rates to fixed rates. Under the interest rate swap agreement, the Company has
agreed with the banks to exchange, at half yearly intervals, the difference between fixed contracted
rates and the floating rate interest amounts calculated by reference to the agreed notional amounts.
105Annual Report 2009

NOTES TO THE FINANCIAL STATEMENTSFOR THE YEAR ENDED DECEMBER 31, 2009
106Annual Report 2009
(Amounts in thousand)
At December 31, 2009, if interest rate on Company’s borrowings had been 1% higher/lower with all
other variables held constant, post tax loss/profit for the year would have been higher/lower by Rs.
34,759 (2008: Rs. 1,453) mainly as a result of higher/lower interest exposure on variable rate borrowings.
iii) Other price risk
Price risk represents the risk that the fair value or future cash flows of financial instruments will fluctuate
because of changes in market prices (other then those arising from currency risk or interest rate risk),
whether those changes are caused by factors specific to the individual financial instruments or its
issuer or factors affecting all similar financial instruments traded in the market. The Company is not
exposed to equity securities price risk as currently the Company has no investments in listed securities.
b) Credit risk
Credit risk represents the risk of financial loss being caused if counter parties fail to discharge their
obligations.
Credit risk arises from deposits with banks and financial institutions, trade debts, loans, advances,
deposits and other receivables. The maximum exposure to credit risk is equal to the carrying amount
of financial assets.
The Company is not materially exposed to credit risk as unsecured credit is provided to selected parties
with no history of default. Moreover, major part of trade debts are secured by bank guarantees and
letters of credit from customers. Further, credit risk on liquid funds is limited because the counter
parties are banks with reasonably high credit ratings.
The Company monitors the credit quality of its financial assets with reference to historical performance
of such assets and available external credit ratings. The carrying values of financial assets which are
neither past due nor impaired are as follows:
2008Rupees
2009
Long term loan and advances 47,475 107,785Trade debts - considered good 336,242 69,514Loan, advances, deposits and other receivables 94,142 94,071Cash and bank balances 190,064 97,273
667,923 368,643

NOTES TO THE FINANCIAL STATEMENTSFOR THE YEAR ENDED DECEMBER 31, 2009
107Annual Report 2009
(Amounts in thousand)
The credit quality of receivables can be assessed with reference to their historical performance with no defaults
in recent history. The credit quality of the Company’s liquid funds can be assessed with reference to external
credit ratings of banks as follows:
BankShort term Long term
Allied Bank Limited AA A1+Askari Commercial Bank Limited AA A1+Bank AlFalah Limited AA A1+Bank AlHabib AA A1+Barclays Bank A1+ AA+Citibank A1+ AA+Deutsche Bank A2 ADubai Islamic Bank Pakistan Limited AA A1+Faysal Bank Limited AA A1+Habib Bank Limited AA+ A1+HSBC Bank Middle East Limited A1+ AAMCB Bank Limited AA+ A1+Meezan Bank Limited A+ A1National Bank of Pakistan AA+ A1+NIB Bank Limited AA- A1+Samba Bank Limited A AStandard Chartered Bank (Pakistan) AAA A1+United Bank Limited AA+ A1+
Rating
c) Liquidity risk
Liquidity risk represents the risk that the Company will encounter difficulties in meeting obligationsassociated with financial liabilities. The Company’s liquidity management involves maintaining sufficient cashand marketable securities, the availability of funds through an adequate amount of credit facilities and throughits ability to close out market positions. Due to the dynamic nature of the business, the Company aims at
maintaining flexibility in funding by keeping committed credit lines available.
The table below analyses how management monitors net liquidity based on details of the remainingcontractual maturities of financial assets and liabilities. The amounts disclosed in the table are thecontractual undiscounted cash flows:
Financial liabilities
Long term borrowings 1,016,393 11,135,163 12,151,556 130,000 7,973,072 8,103,072Derivative financial instruments - 19,935 19,935 - 60,154 60,154Retention money against project
payments 801,718 - 801,718 239,033 553,445 792,478Retirement and other service
benefit obligations - 38,312 38,312 - 38,500 38,500Trade and other payables 1,768,718 - 1,768,718 1,119,547 - 1,119,547Accrued interest / mark-up 202,207 - 202,207 167,268 - 167,268Short term borrowings 394,241 - 394,241 842,568 - 842,568
4,183,277 11,193,410 15,376,687 2,498,416 8,625,171 11,123,587
2009 2008
Rupees
Maturity upto one year
Total TotalMaturity after one year
Maturity upto one year
Maturity after one year
Rating agency
PACRAPACRAPACRAPACRAS & PS & PS & PPACRAPACRAPACRAS & PPACRAPACRAPACRAPACRAPACRAS & PPACRA
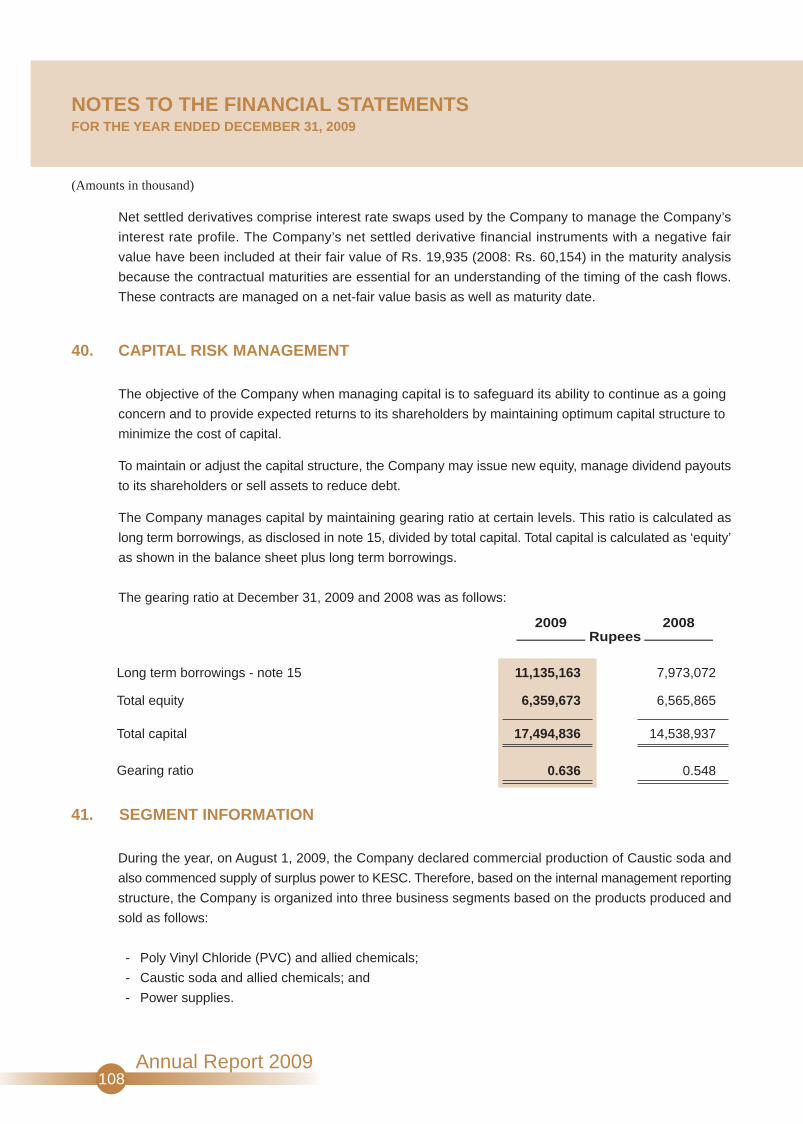
NOTES TO THE FINANCIAL STATEMENTSFOR THE YEAR ENDED DECEMBER 31, 2009
108Annual Report 2009
(Amounts in thousand)
Net settled derivatives comprise interest rate swaps used by the Company to manage the Company’s
interest rate profile. The Company’s net settled derivative financial instruments with a negative fair
value have been included at their fair value of Rs. 19,935 (2008: Rs. 60,154) in the maturity analysis
because the contractual maturities are essential for an understanding of the timing of the cash flows.
These contracts are managed on a net-fair value basis as well as maturity date.
40. CAPITAL RISK MANAGEMENT
The objective of the Company when managing capital is to safeguard its ability to continue as a going
concern and to provide expected returns to its shareholders by maintaining optimum capital structure to
minimize the cost of capital.
To maintain or adjust the capital structure, the Company may issue new equity, manage dividend payouts
to its shareholders or sell assets to reduce debt.
The Company manages capital by maintaining gearing ratio at certain levels. This ratio is calculated as
long term borrowings, as disclosed in note 15, divided by total capital. Total capital is calculated as ‘equity’
as shown in the balance sheet plus long term borrowings.
The gearing ratio at December 31, 2009 and 2008 was as follows:
41. SEGMENT INFORMATION
During the year, on August 1, 2009, the Company declared commercial production of Caustic soda and
also commenced supply of surplus power to KESC. Therefore, based on the internal management reporting
structure, the Company is organized into three business segments based on the products produced and
sold as follows:
- Poly Vinyl Chloride (PVC) and allied chemicals;
- Caustic soda and allied chemicals; and
- Power supplies.
2008Rupees
2009
Long term borrowings - note 15 11,135,163 7,973,072
Total equity 6,359,673 6,565,865
Total capital 17,494,836 14,538,937
Gearing ratio 0.636 0.548

NOTES TO THE FINANCIAL STATEMENTSFOR THE YEAR ENDED DECEMBER 31, 2009
109Annual Report 2009
(Amounts in thousand)
Management monitors the operating results of abovementioned segments separately for the purpose of
making decisions about resources to be allocated and of assessing performance. Segment performance
is evaluated based on operating profit or loss which in certain respects, as explained in table below, is
measured differently from profit or loss in the financial statements. Segment results and assets include
items directly attributable to a segment as well as those that can be allocated on a reasonable basis.
Finance cost, other operating income and expenses, and taxation are managed at Company level. Further,
unallocated assets include long term investment, long term loan and advances, loans, advances, prepayments
and other receivables, taxes recoverable, deferred employee share compensation expense, short term
investments, and cash and bank balances.
The following table presents the profit or loss and total assets for the operating segments of the Company:
Poly Vinyl Caustic Power
Chloride (PVC) soda and supply Total
and allied allied
chemicals chemicals
Revenue 10,495,567 890,271 185,279 11,571,117
Profit or loss before
unallocated expenses 460,255 154,552 69,141 683,948
Unallocated expenses
Administrative expenses (205,389)
Other operating expenses (231,701)
Other operating income 100,262
Finance costs (596,264)
Taxation 17,355
Loss after taxation (231,789)
Total segment assets 13,190,511 6,368,873 132,333 19,691,717
Unallocated assets 2,864,318
Total assets as per the balance sheet 22,556,035
2009

NOTES TO THE FINANCIAL STATEMENTSFOR THE YEAR ENDED DECEMBER 31, 2009
110Annual Report 2009
(Amounts in thousand)
42. TRANSACTIONS WITH RELATED PARTIES
42.1 Transactions with related parties other than those which have been disclosed elsewhere in these financial
statements are as follows:
Nature of relationship Nature of transactions
Holding Company
- Engro Chemical Pakistan Limited Purchase of servicesSale of goodsSale of servicesSale of steam and electricityUse of operating assetsPension fund contributionProvident fund contributionMedical contributionGratuity fund contribution
Subsidiary Company
- Engro Polymer Trading (Pvt) Purchase of goodsLimited Sale of goods
Sale of services
Associated Company
- Mitsubishi Corporation Purchase of goodsSale of goods
Related parties by virtue of
common directorship
- Engro Vopak Terminal Limited Purchase of servicesSale of services
- Engro PowerGen Limited Sale of services
- Engro Foods Limited Sale of goods
- Central Insurance Company Limited Insurance
- ICI Pakistan Limited Directors feePurchase of goods
- IGI Pakistan Limited Purchase of services
- Dawood Hercules Chemicals Ltd. Sales of servicesPurchase of servicesReimbursement
- Indus Valley School of Art and Purchase of servicesArchitecture
- Lahore University of Management Purchase of servicesSciences
- Management Association of Purchase of services and Annual subscriptionPakistan
- Port Qasim Authority Purchase of servicesPurchase of goods
- Overseas Investors Chambers of Advertisement (Purchase of services)Commerce & Industry Annual Subscription
Training Course (Purchase of services)
2008Rupees
2009
17,309 9,8243,195 -3,313 2,807
51,736 28,8594,139 2,6854,119 2,2083,036 3,322
88 74252 -
- 1,0901,330,435 -
353 23
7,941,021 6,191,979106,941 78,648
1,564,559 142,2931,614 1,219
424 -
301 -
4,701 458
10 1513,016 4,102
2,304 -
- 375,745 -
- 71
- 100
156 248
24 120
300 11,0955,138 -
- 27- 165- 5

111Annual Report 2009
(Amounts in thousand)
Nature of relationship Nature of transactions
Related parties by virtue of
common directorship
- Pakistan Institute of Corporate Purchase of services 80 -Governance
- Inbox Business Technologies Purchase of goods - 785
(Pvt) Ltd. Setup of software 150 150
- Avanceon Limited Purchase of goods 2,470 -
Purchase of services 575 409
- Actis Assets Ltd. Directors fee - 5
- UBL Funds Investments in liquidity funds 100,000 -
Directors fee 175 -
Key management personnel Managerial remuneration 52,181 47,046
Retirement benefit funds 3,963 4,177
Bonus - 18,052
Employee share option scheme 2,542 2,577
Other benefits 4,381 4,155
2008Rupees
2009
42.2 Sales, purchases and other transactions with related parties are carried out on commercial terms and
conditions.
42.3 The related party status of outstanding balances as at December 31, 2009 are disclosed in the respective
notes.
43. PRODUCTION CAPACITY
43.1 Commencement of commercial production of the new PVC plant was from January 1, 2009 and that of
Chlor-alkali plant was from August 1, 2009.
2009 2008 2009 2008
PVC resin 150,000 100,000 115,620 98,660
Caustic soda 106,000 - 38,739 - Note - 43.1
Designed ActualProduction Remarks
Metric tons
Annual Capacity
Production planned asper market demand
NOTES TO THE FINANCIAL STATEMENTSFOR THE YEAR ENDED DECEMBER 31, 2009
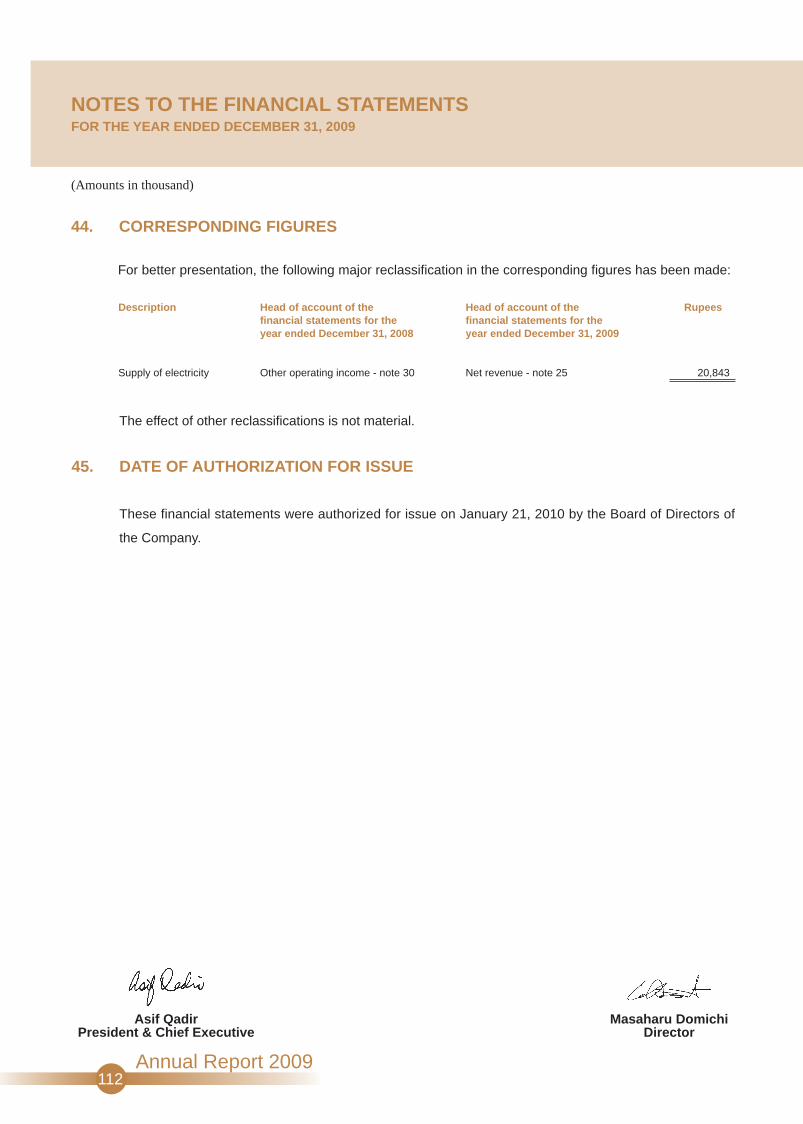
112Annual Report 2009
NOTES TO THE FINANCIAL STATEMENTSFOR THE YEAR ENDED DECEMBER 31, 2009
(Amounts in thousand)
44. CORRESPONDING FIGURES
For better presentation, the following major reclassification in the corresponding figures has been made:
Head of account of thefinancial statements for theyear ended December 31, 2009
Net revenue - note 25
Head of account of thefinancial statements for theyear ended December 31, 2008
Other operating income - note 30
Description
Supply of electricity
Rupees
20,843
The effect of other reclassifications is not material.
45. DATE OF AUTHORIZATION FOR ISSUE
These financial statements were authorized for issue on January 21, 2010 by the Board of Directors of
the Company.
Asif QadirPresident & Chief Executive
Masaharu DomichiDirector

� Auditors’ Report to the Members on theConsolidated Financial Statements
� Consolidated Financial Statements
CONSOLIDATED FINANCIALSTATEMENTS

115Annual Report 2009
AUDITORS’ REPORT TO THE MEMBERS
We have audited the annexed consolidated financial statements comprising consolidated balance sheet of Engro
Polymer and Chemicals Limited (the holding company) and its subsidiary company, Engro Polymer Trading (Private)
Limited as at December 31, 2009 and the related consolidated profit and loss account, consolidated statement
of comprehensive income, consolidated statement of changes in equity and consolidated statement of cash flows
together with the notes forming part thereof, for the year then ended. We have also expressed separate opinions
on the financial statements of Engro Polymer and Chemicals Limited and Engro Polymer Trading (Private) Limited.
These financial statements are the responsibility of the holding company’s management. Our responsibility is to
express an opinion on these financial statements based on our audit.
Our audit was conducted in accordance with the International Standards on Auditing and accordingly included
such tests of accounting records and such other auditing procedures as we considered necessary in the
circumstances.
In our opinion the consolidated financial statements present fairly the financial position of Engro Polymer and
Chemicals Limited and its subsidiary company, Engro Polymer Trading (Private) Limited, as at December 31, 2009
and the results of their operations, changes in equity and cash flows for the year then ended.
As stated in note 2.1.4 (a) to the financial statements, the Company has changed its accounting policies on initial
application of standards, amendments or interpretations to existing standards, with which we concur.
Chartered AccountantsKarachiDate: January 27, 2010
Engagement Partner: Sohail Hassan
Lahore Office: 505-509, 5th Floor, Alfalah Building, P.O.Box 39, Shahrah-e-Quaid-e-Azam, Lahore-54000, Pakistan. Tel: (92-42) 36285078-85 Fax: (92-42) 36285088Islamabad Office: PIA Building, 3rd Floor, 49 Blue Area, Fazl-ul-Haq Road, P.O. Box 3021, Islamabad-44000, Pakistan. Tel: (92-51) 2273457-60 Fax: (92-51) 2277924Kabul Office: House No. 4, Street No. 3, District 6, Road Karte-3, Kabul, Afghanistan. Tel: (93-799) 315320-203424
A.F. Ferguson & Co.Chartered AccountantsState Life Building No.1-CI.I. Chundrigar Road, P.O. Box 4716Karachi-74000, PakistanTelephone: (021) 32426682-6 / 32426711-5Facsimile: (021) 32415007 / 32427938

CONSOLIDATED BALANCE SHEETAS AT DECEMBER 31, 2009
116Annual Report 2009
ASSETS
Non-Current Assets
Property, plant and equipmentIntangible assetsLong term loans and advances
Current Assets
Stores, spares and loose tools Stock-in-trade Trade debts - considered goodLoans, advances, deposits, prepayments and other receivables Taxes recoverable Deferred employee share compensation expenseShort term investmentsCash and bank balances
TOTAL ASSETS
EQUITY AND LIABILITIES
Share Capital and Reserves
Share capital Share premium Employee share compensation reserve Hedging reserveUnappropriated profit
Non-Current Liabilities
Long term borrowingsDerivative financial instruments Retention money against project payments Deferred income tax liabilitiesRetirement and other service benefit obligations
Current Liabilities
Current portion of long term borrowings Trade and other payablesAccrued interest / mark-upShort term borrowingsProvisions
Contingencies and Commitments
TOTAL EQUITY AND LIABILITIES
The annexed notes 1 to 45 form an integral part of these financial statements.
19,360,686 11,816 47,475
19,419,977
192,762 1,605,438
439,905 410,881 451,603
- 61,398
217,531 3,379,518
22,799,495
5,203,677 975,438
9,313 (12,958) 220,173
6,395,643
11,135,163 19,935
- 321,520
38,312 11,514,930
1,016,393 3,002,022
205,772 594,241
70,494 4,888,922
22,799,495
16,134,766 9,262
107,785 16,251,813
127,152 1,159,473
69,514 300,959 220,901
4,381 43,648 99,385
2,025,413
18,277,226
5,203,677 975,438
9,858 (39,100) 413,869
6,563,742
7,973,072 60,154
553,445 382,574
38,500 9,007,745
130,000 1,510,974
167,268 842,568
54,929 2,705,739
18,277,226
456
789
10
141112
13
14
1516171819
1520212223
24
(Amounts in thousand)
Note 2009 2008 Rupees
Asif QadirPresident & Chief Executive
Masaharu DomichiDirector

CONSOLIDATED PROFIT AND LOSS ACCOUNTFOR THE YEAR ENDED DECEMBER 31, 2009
117Annual Report 2009
7,868,380
69 7,868,449
(6,735,658)
1,132,791
(311,640)
(163,182)
(293,787)
124,945
489,127
(33,531)
455,596
(105,243)
350,353
0.68
Net revenue
Export rebate
Cost of sales
Gross profit
Distribution and marketing expenses
Administrative expenses
Other operating expenses
Other operating income
Operating profit
Finance costs
(Loss) / Profit before taxation
Taxation
(Loss) / Profit for the year
(Loss) / Earnings per share - basic and diluted
The annexed notes 1 to 45 form an integral part of these financial statements.
25
26
27
28
29
30
31
32
33
(Amounts in thousand except for (loss) / earnings per share)Note
11,632,108
66711,632,775
(10,418,592)
1,214,183
(483,814)
(205,742)
(232,011)
116,422
409,038
(606,175)
(197,137)
3,441
(193,696)
(0.37)
Rupees
2008(Restated)
2009
Asif QadirPresident & Chief Executive
Masaharu DomichiDirector

118Annual Report 2009
CONSOLIDATED STATEMENT OF COMPREHENSIVE INCOMEFOR THE YEAR ENDED DECEMBER 31, 2009
(Loss) / Profit for the year
Other comprehensive income:
Hedging reserve
(Loss) / Gain arising during the year
Less: - Reclassification adjustments for (gains) / losses included in profit and loss
- Adjustments for amounts transferred to initial carrying amount of hedged items
Income tax relating to hedging reserve
Other comprehensive income / (loss) for the year - net of tax
Total comprehensive (loss) / income for the year
The annexed notes 1 to 45 form an integral part of these financial statements.
(193,696)
(478)
22,557
18,140
(14,077)
26,142
(167,554)
(Amounts in thousand)
2009 2008 Rupees
350,353
257,573
(118,649)
(199,078)
21,054
(39,100)
311,253
Asif QadirPresident & Chief Executive
Masaharu DomichiDirector

CONSOLIDATED STATEMENT OF CASH FLOWSFOR THE YEAR ENDED DECEMBER 31, 2009
119Annual Report 2009
CASH FLOWS FROM OPERATING ACTIVITIES
Cash generated from operations
Finance costs paid
Long term loans and advances
Retirement benefits paid
Income tax paid
Net cash generated from operating activities
CASH FLOWS FROM INVESTING ACTIVITIES
Purchases of
- property, plant and equipment
- intangible assets
Proceeds from disposal of property, plant and equipment
Retention money from Project payments
Purchases of short term investments
Proceeds from sale of short term investments
Income on short term investments and bank deposits
Net cash utilized in investing activities
CASH FLOWS FROM FINANCING ACTIVITIES
Proceeds from long term borrowings
Repayments of long term borrowings
Proceeds from issue of share capital
Dividend paid
Net cash generated from financing activities
Net increase / (decrease) in cash and cash equivalents
Cash and cash equivalents at beginning of the year
Cash and cash equivalents at end of the year
The annexed notes 1 to 45 form an integral part of these financial statements.
36
37
1,542,650
(563,637)
60,310
(10,957)
(302,392)
725,974
(3,739,678)
(6,255)
6,179
(553,445)
(156,627)
178,034
63,807
(4,207,985)
4,178,484
(130,000)
-
-
4,048,484
566,473
(743,183)
(176,710)
660,146
(354,530)
(10,814)
-
(183,783)
111,019
(11,150,853)
(7,180)
3,971
452,485
(46,000)
2,914,504
117,410
(7,715,663)
6,637,643
-
229,128
(252,896)
6,613,875
(990,769)
247,586
(743,183)
(Amounts in thousand)
Note 2009 2008 Rupees
Asif QadirPresident & Chief Executive
Masaharu DomichiDirector
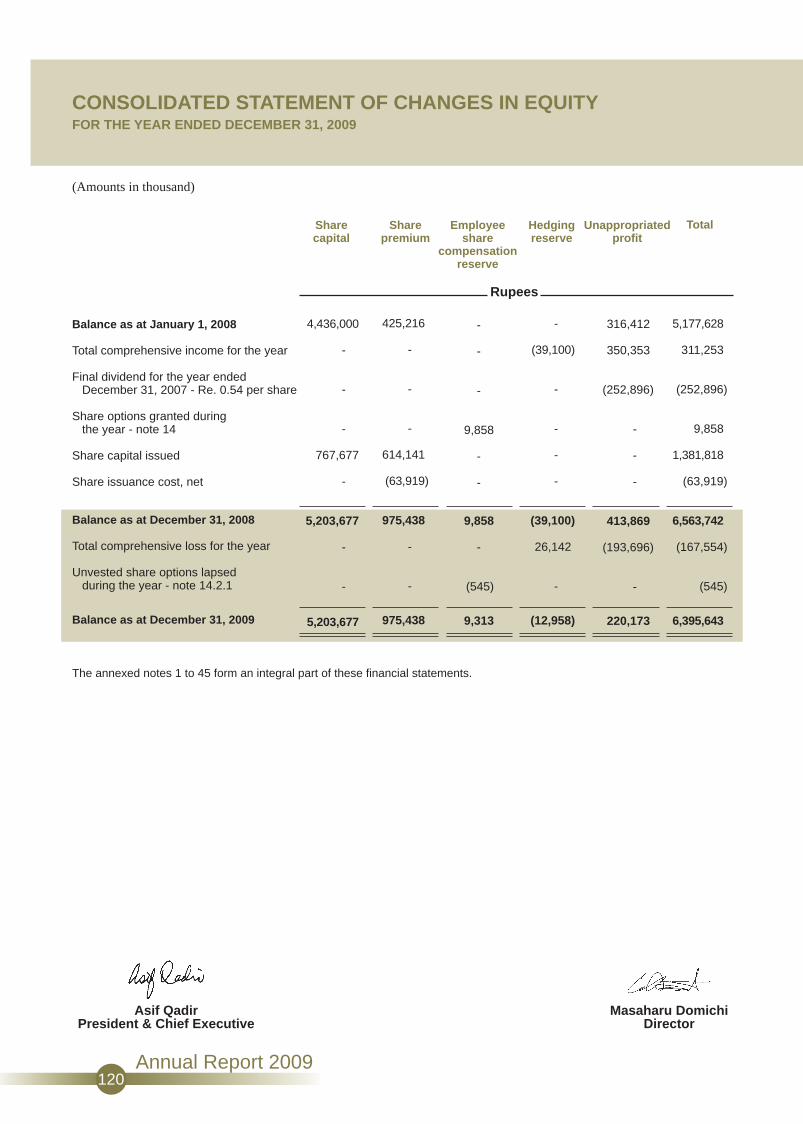
CONSOLIDATED STATEMENT OF CHANGES IN EQUITYFOR THE YEAR ENDED DECEMBER 31, 2009
120Annual Report 2009
Balance as at January 1, 2008
Total comprehensive income for the year
Final dividend for the year ended December 31, 2007 - Re. 0.54 per share
Share options granted during the year - note 14
Share capital issued
Share issuance cost, net
Balance as at December 31, 2008
Total comprehensive loss for the year
Unvested share options lapsed during the year - note 14.2.1
Balance as at December 31, 2009
The annexed notes 1 to 45 form an integral part of these financial statements.
4,436,000
-
-
-
767,677
-
5,203,677
-
-
5,203,677
425,216
-
-
-
614,141
(63,919)
975,438
-
-
975,438
-
-
-
9,858
-
-
9,858
-
(545)
9,313
-
(39,100)
-
-
-
-
(39,100)
26,142
-
(12,958)
316,412
350,353
(252,896)
-
-
-
413,869
(193,696)
-
220,173
5,177,628
311,253
(252,896)
9,858
1,381,818
(63,919)
6,563,742
(167,554)
(545)
6,395,643
Sharecapital
Sharepremium
Employeeshare
compensationreserve
Hedgingreserve
Unappropriatedprofit
Total
(Amounts in thousand)
Rupees
Asif QadirPresident & Chief Executive
Masaharu DomichiDirector

NOTES TO THE CONSOLIDATED FINANCIAL STATEMENTSFOR THE YEAR ENDED DECEMBER 31, 2009
121Annual Report 2009
(Amounts in thousand)
1. LEGAL STATUS AND OPERATIONS
1.1 The Group consists of Engro Polymer and Chemicals Limited (the Company) and it’s wholly ownedsubsidiary company, Engro Polymer Trading (Private) Limited.
The Company was incorporated in Pakistan in 1997 under the Companies Ordinance, 1984. The Companywas listed on Karachi Stock Exchange in 2008 and on Islamabad and Lahore Stock Exchanges duringthe current year.
The Company is a subsidiary of Engro Chemical Pakistan Limited (ECPL) (renamed as Engro CorporationLimited with effect from January 1, 2010). The address of its registered office is 1st floor, Bahria Complex I,M. T. Khan Road, Karachi. The Company's principal activity is to manufacture, market and sell Poly VinylChloride (PVC), PVC compounds, Caustic soda and other related chemicals.
1.2 In 2006, the Company commenced work on its expansion and backward integration project comprisingsetting up of a new PVC plant, Ethylene Di Chloride (EDC), Chlor-alkali, Vinyl Chloride Monomer (VCM)and Power plants (the Project). The new PVC plant commenced commercial production on January 1,2009. Further, on August 1, 2009, the Company commenced commercial operations of EDC, Chlor-alkaliand Power plants (Gas turbines). The VCM plant is still in the test production phase. These plants havebeen set up adjacent to the Company's existing PVC facilities in the Port Qasim Industrial Area. Furthermore,during the year, the Company has also commenced supply of surplus power generated from Power plantsto Karachi Electric Supply Company (KESC), under an agreement.
2. SUMMARY OF SIGNIFICANT ACCOUNTING POLICIES
The significant accounting policies applied in the preparation of these financial statements are set out below.
These policies have been consistently applied to all years presented, unless otherwise stated.
2.1 Basis of preparation
2.1.1 These financial statements have been prepared under the historical cost convention as modified byremeasurement of certain financial assets and financial liabilities (including derivative instruments) at fairvalue and recognition of certain staff retirement and other service benefits at present value.
2.1.2 These financial statements have been prepared in accordance with the requirements of the CompaniesOrdinance, 1984 (the Ordinance), directives issued by the Securities and Exchange Commission of Pakistan(SECP) and the approved financial reporting standards as applicable in Pakistan. Approved financialreporting standards comprise of such International Financial Reporting Standards (IFRS) issued by theInternational Accounting Standards Board as are notified under the provisions of the Ordinance. Wherever,the requirements of the Ordinance or directives issued by the SECP differ with the requirements of thesestandards, the requirements of the Ordinance or the requirements of the said directives have been followed.
2.1.3. The preparation of financial statements in conformity with the above requirements requires the use of certain critical accounting estimates. It also requires management to exercise its judgment in the processof applying the Company’s accounting policies. The areas involving high degree of judgment or complexity,
or areas where assumptions and estimates are significant to the financial statements are disclosed innote 3.
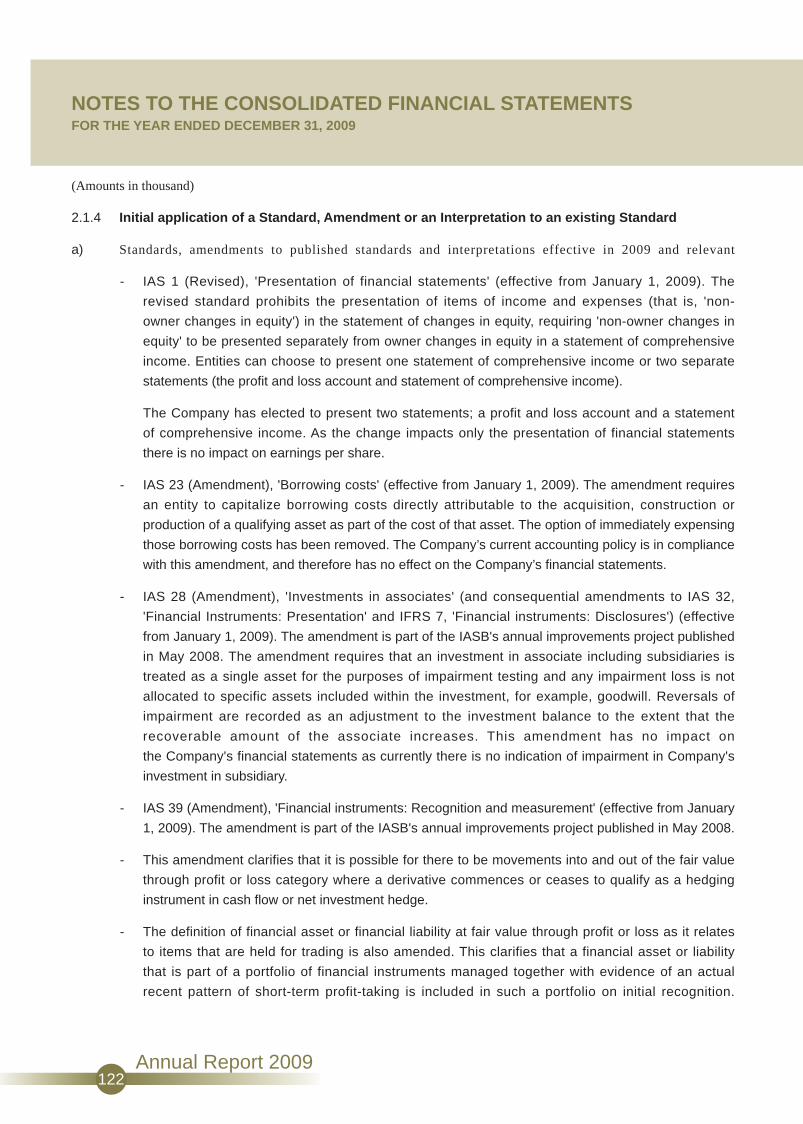
NOTES TO THE CONSOLIDATED FINANCIAL STATEMENTSFOR THE YEAR ENDED DECEMBER 31, 2009
122Annual Report 2009
(Amounts in thousand)
2.1.4 Initial application of a Standard, Amendment or an Interpretation to an existing Standard
a) Standards, amendments to published standards and interpretations effective in 2009 and relevant
- IAS 1 (Revised), 'Presentation of financial statements' (effective from January 1, 2009). The
revised standard prohibits the presentation of items of income and expenses (that is, 'non-
owner changes in equity') in the statement of changes in equity, requiring 'non-owner changes in
equity' to be presented separately from owner changes in equity in a statement of comprehensive
income. Entities can choose to present one statement of comprehensive income or two separate
statements (the profit and loss account and statement of comprehensive income).
The Company has elected to present two statements; a profit and loss account and a statement
of comprehensive income. As the change impacts only the presentation of financial statements
there is no impact on earnings per share.
- IAS 23 (Amendment), 'Borrowing costs' (effective from January 1, 2009). The amendment requires
an entity to capitalize borrowing costs directly attributable to the acquisition, construction or
production of a qualifying asset as part of the cost of that asset. The option of immediately expensing
those borrowing costs has been removed. The Company’s current accounting policy is in compliance
with this amendment, and therefore has no effect on the Company’s financial statements.
- IAS 28 (Amendment), 'Investments in associates' (and consequential amendments to IAS 32,
'Financial Instruments: Presentation' and IFRS 7, 'Financial instruments: Disclosures') (effective
from January 1, 2009). The amendment is part of the IASB's annual improvements project published
in May 2008. The amendment requires that an investment in associate including subsidiaries is
treated as a single asset for the purposes of impairment testing and any impairment loss is not
allocated to specific assets included within the investment, for example, goodwill. Reversals of
impairment are recorded as an adjustment to the investment balance to the extent that the
recoverable amount of the associate increases. This amendment has no impact on
the Company's financial statements as currently there is no indication of impairment in Company's
investment in subsidiary.
- IAS 39 (Amendment), 'Financial instruments: Recognition and measurement' (effective from January
1, 2009). The amendment is part of the IASB's annual improvements project published in May 2008.
- This amendment clarifies that it is possible for there to be movements into and out of the fair value
through profit or loss category where a derivative commences or ceases to qualify as a hedging
instrument in cash flow or net investment hedge.
- The definition of financial asset or financial liability at fair value through profit or loss as it relates
to items that are held for trading is also amended. This clarifies that a financial asset or liability
that is part of a portfolio of financial instruments managed together with evidence of an actual
recent pattern of short-term profit-taking is included in such a portfolio on initial recognition.

NOTES TO THE CONSOLIDATED FINANCIAL STATEMENTSFOR THE YEAR ENDED DECEMBER 31, 2009
123Annual Report 2009
(Amounts in thousand)
- When re-measuring the carrying amount of a debt instrument on cessation of fair value hedge
accounting, the amendment clarifies that a revised effective interest rate (calculated at the date
fair value hedge accounting ceases) are used.
This amendment has no material impact on the Company's financial statements.
- IFRS 2 (Amendment), 'Share-based payment' (effective from January 1, 2009). The amendment deals
with vesting conditions and cancellations. It clarifies that vesting conditions are service conditions and
performance conditions only. Other features of a share-based payment are not vesting conditions. As
such these features would need to be included in the grant date fair value for transactions with
employees and others providing similar services, that is, these features would not impact the number
of awards expected to vest or valuation thereof subsequent to grant date. All cancellations, whether
by the entity or by other parties, would have the same accounting treatment. The Company’s current
accounting policy for employees’ shares options is consistent with this amendment.
- The SECP vide S.R.O. 411 (1) / 2008 dated April 28, 2008 notified the adoption of IFRS 7 'Financial
Instruments: Disclosures'. IFRS 7 is mandatory for Company's accounting periods beginning on or
after the date of notification i.e. April 28, 2008. IFRS 7 has superseded IAS 30 and disclosure
requirements of IAS 32. The application of IFRS 7 has only resulted in additional disclosures in the
Company's financial statements.
- IFRS 8 'Operating Segments' (effective from January 1, 2009). IFRS 8 replaces IAS 14, 'Segment
reporting'. The new standard requires segment information to be presented on the same basis as that
used for internal reporting purposes, and introduces detailed disclosures regarding the reportable
segments and products. Application of IFRS 8 has resulted in additional disclosures in the Company's
financial statements.
b) Standards, amendments to published standards and interpretations effective in 2009 but not
relevant
The other new standards, amendments and interpretations that are mandatory for accounting periods
beginning on or after January 1, 2009 are considered not to be relevant or to have any significant effect
on the Company's financial reporting and operations.
c) Interpretation to existing standards that has been early adopted by the Company
- IFRIC 4, 'Determining whether an Arrangement contains a Lease' was adopted by SECP and was
applicable for all periods beginning on or after January 1, 2006. However, SECP vide Circular No.
D(CS)/34/2009 dated June 22, 2009 deferred the implementation of IFRIC 4 till June 30, 2010. The
Company has early adopted the Interpretation, which has only resulted in additional disclosures in
respect of certain arrangements of the Company being classified as operating leases
(note 26.3).

NOTES TO THE CONSOLIDATED FINANCIAL STATEMENTSFOR THE YEAR ENDED DECEMBER 31, 2009
124Annual Report 2009
(Amounts in thousand)
d) Standards, amendments to published standards and interpretations that are not yet effective andhave not been early adopted by the Company
- IAS 1 (Amendment), 'Presentation of financial statements' (effective from January 1, 2010). Theamendment is part of the IASB's annual improvements project published in April 2009. The amendmentprovides clarification that the potential settlement of a liability by the issue of equity is not relevant toits classification as current or non current. By amending the definition of current liability, the amendmentpermits a liability to be classified as non-current (provided that the entity has an unconditional rightto defer settlement by transfer of cash or other assets for at least 12 months after the accountingperiod) notwithstanding the fact that the entity could be required by the counterparty to settle in sharesat any time. The Company will apply IAS 1 (Amendment) from July 1, 2010. It is not expected tohave a material impact on the Company's financial statements, on its initial application.
- IAS 39 (Amendment), 'Cash flow hedge accounting', (effective from July 1, 2010). This amendmentprovides clarification when to recognize gains or losses on hedging instruments as a reclassificationadjustment in a cash flow hedge of a forecast transaction that results subsequently in the recognitionof a financial instrument. The amendment clarifies that gains or losses should be reclassified fromequity to profit or loss in the period in which the hedged forecast cash flow affects profit or loss. TheCompany will apply IAS 39 (Amendment) from July 1, 2010. It is not expected to have a material impacton the Company's financial statements, on its initial application.
- IFRS 8 (Amendment), 'Disclosure of information about segment assets' (effective from January 1,2010). This amendment clarifies that an entity is required to disclose a measure of segment assetsonly if that measure is regularly reported to the chief operating decision-maker. The new guidance isnot expected to have a material impact on the Company's financial statements.
- IAS 39 (Amendment), 'Treating loan pre-payment penalties as closely related derivatives' (effectivefrom January 1, 2010). This amendment clarifies pre-payment options, the exercise price of whichcompensates the lender for loss of interest by reducing the economic loss from re-investment risk,should be considered closely related to the host debt contract. The Company will apply IAS 39(Amendment) from January 1, 2010.
There are a number of other minor amendments and interpretations to other published standards that arenot yet effective, and are also not relevant to the Company and therefore have not been presented here.
2.2 Property, plant and equipment
These are stated at cost less accumulated depreciation and impairment, if any, except Capital work-in-progress. Cost in relation to fixed assets signifies historical cost. Historical cost includes expenditure thatis directly attributable to the acquisition of the items. Capital work-in-progress is stated at historicalcost less impairment, if any.
NOTES TO THE CONSOLIDATED FINANCIAL STATEMENTSFOR THE YEAR ENDED DECEMBER 31, 2009
125Annual Report 2009
(Amounts in thousand)
Depreciation on assets is charged to income using the straight line method to allocate their cost to their
residual values over their estimated useful lives at rates given in note 4.1. Depreciation on additions is
charged from the month in which the asset is put to use and no depreciation is charged in the month of
disposal.
Subsequent costs are included in the asset's carrying amount or recognized as a separate asset, as
appropriate, only when it is probable that future economic benefits associated with the item will flow to the
Company and the cost of the item can be measured reliably. All other repairs and maintenance are charged
to income during the year in which these are incurred.
Assets residual values and useful lives are reviewed, and adjusted if appropriate, at each balance sheet
date. An asset's carrying amount is written down immediately to its recoverable amount if the asset's
carrying amount is greater than its estimated recoverable amount.
The gain or loss on disposal or retirement of an asset represented by the difference between the sale
proceeds and the carrying amount of the asset is recognized as an income or expense in the period of
disposal or retirement.
2.3 Intangible assets - Computer software
Costs associated with developing and maintaining computer software programmes are recognized as an
expense as incurred. Costs that are directly attributable to identifiable software and have probable economic
benefits exceeding one year, are recognized as an intangible asset. Direct costs include the purchase cost
of software and related overhead cost.
Expenditure, which enhances or extends the performance of computer software beyond its original
specification and useful life is recognized as a capital improvement and added to the original cost of the
software.
Computer software cost treated as intangible assets are amortized from the date the software is put to
use on straight-line basis over a period of 5 to 10 years. The carrying amount of the intangible assets is
reviewed for impairment whenever events or changes in circumstances indicate that the carrying amount
may not be recoverable. An impairment loss is recognized for the amount by which the assets carrying
amount exceeds its recoverable amount in income. Reversal of impairment losses are also recognized
in income.
2.4 Investments in subsidiaries
Investments in subsidiaries are stated at cost net of provision for impairment, if any. This investment is
classified as long term investments.

NOTES TO THE CONSOLIDATED FINANCIAL STATEMENTSFOR THE YEAR ENDED DECEMBER 31, 2009
126Annual Report 2009
(Amounts in thousand)
2.5 Financial instruments
2.5.1 Financial assets
The Company classifies its financial assets in the following categories: at fair value through profit or loss,
loans and receivables, held to maturity and available for sale. The classification depends on the purpose
for which the financial assets were acquired. Management determines the classification of its financial
as sets at initial recognition.
(a) Financial assets at fair value through profit or loss
Financial assets at fair value through profit or loss are financial assets held for trading. A financial
asset is classified in this category if acquired principally for the purpose of selling in the short-term.
Derivatives are also categorized as held for trading unless they are designated
as hedges. Assets in this category are classified as current assets.
(b) Loans and receivables
Loans and receivables are non-derivative financial assets with fixed or determinable payments
that are not quoted in an active market. They are included in current assets, except for maturities
greater than 12 months after the balance sheet date. These are classified as non-current assets.
The Company's loans and receivables comprise 'trade debts and other receivables' and 'cash and
cash equivalents' in the balance sheet (note 2.8 and 2.9).
(c) Held to maturity financial assets
Held to maturity financial assets are non-derivative financial assets with fixed or determinable
payments and fixed maturity with a positive intention to hold to maturity.
(d) Available-for-sale financial assets
Available-for-sale financial assets are non-derivatives that are either designated in this category
or not classified in any of the other categories. They are included in non-current assets unless
management intends to dispose of the investment within 12 months of the balance sheet date.
Regular purchases and sales of financial assets are recognized on the trade date - the date on
which the Company commits to purchase or sell the asset. Investments are initially recognized
at fair value plus transaction costs for all financial assets not carried at fair value through profit
or loss. Financial assets carried at fair value through profit or loss are initially recognized at fair
value and transaction costs are expensed in the profit and loss account. Financial assets are
derecognized when the rights to receive cash flows from the investments have expired or have
been transferred and the Company has transferred substantially all risks and rewards of ownership.
Available-for-sale financial assets and financial assets at fair value through profit or loss are
subsequently carried at fair value.

NOTES TO THE CONSOLIDATED FINANCIAL STATEMENTSFOR THE YEAR ENDED DECEMBER 31, 2009
127Annual Report 2009
(Amounts in thousand)
Loans and receivables and held to maturity financial assets are carried at amortized cost using
the effective interest method.
Gains or losses arising from changes in the fair value of the 'financial assets at fair value through
profit or loss' category are presented in the profit or loss account within 'other operating
income/expenses' in the period in which they arise. Dividend income from financial assets at fair
value through profit or loss is recognized in the profit and loss account as part of other income
when the Company's right to receive payments is established.
When securities classified as available for sale are sold or impaired, the accumulated fair value
adjustments recognized in other comprehensive income are included in the profit or loss account
as 'gains and losses from investment securities'. Interest on available-for-sale securities calculated
using the effective interest method is recognized in the profit and loss account as part of other
income. Dividends on available-for-sale equity instruments are recognized in the profit and loss
account as part of other income when the Company's right to receive payments is established.
The fair values of quoted investments are based on current bid prices. If the market for a financial
asset is not active (and for unlisted securities), the Company establishes fair value by using
valuation techniques. These include the use of recent arm's length transactions, reference to other
instruments that are substantially the same, discounted cash flow analysis, and option pricing
models making maximum use of market inputs and relying as little as possible on entity-specific
inputs.
The Company assesses at each balance sheet date whether there is objective evidence that a financial
asset or a Group of financial assets is impaired. In the case of equity securities classified as available for
sale, a significant or prolonged decline in the fair value of the security below its cost is considered as an
indicator that the securities are impaired. If any such evidence exists for available-for-sale financial assets,
the cumulative loss - measured as the difference between the acquisition cost and the current fair value,
less any impairment loss on that financial asset previously recognized in profit or loss - is removed from
equity and recognized in the profit and loss account. Impairment losses recognized in the profit and loss
account on equity instruments are not reversed through the profit and loss account. Impairment testing
of trade receivables is described in note 2.8.
2.5.2 Financial liabilities
All financial liabilities are recognized at the time when the Company becomes a party to the contractual
provisions of the instrument.
A financial liability is derecognized when the obligation under the liability is discharged or cancelled or
expired. Where an existing financial liability is replaced by another from the same lender on
substantially different terms, or the terms of an existing liability are substantially modified, such an exchange
or modification is treated as a derecognition of the original liability and the recognition of a new liability,
and the difference in respective carrying amounts is recognized in the profit and loss account.

NOTES TO THE CONSOLIDATED FINANCIAL STATEMENTSFOR THE YEAR ENDED DECEMBER 31, 2009
128Annual Report 2009
(Amounts in thousand)
2.5.3 Offsetting of financial assets and liabilities
A financial asset and a financial liability are offset and the net amount is reported in the balance sheet if
the Company has a legally enforceable right to set-off the recognized amounts and intends either to settle
on a net basis or to realize the asset and settle the liability simultaneously.
2.6 Stores and spares
These are valued at weighted average cost except for items in transit which are stated at invoice value
plus other charges paid thereon till the balance sheet date. Provision is made for slow moving items, as
per policy and is recognized in the profit and loss account.
2.7 Stock-in-trade
These are valued at the lower of cost and net realizable value. Cost in relation to raw materials represent
the weighted average cost and in relation to finished goods and work-in-progress represents weighted average
cost comprising direct materials, labour and related manufacturing overheads.
Cost of stock-in-transit represents the invoice value plus other charges incurred thereon till the balance
sheet date.
Net realizable value signifies the estimated selling price in the ordinary course of business less cost of
completion and costs necessarily to be incurred in order to make the sales. Provision is made for slow
moving stocks where considered necessary.
2.8 Trade debts and other receivables
Trade debts and other receivables are recognized initially at fair value and subsequently measured at
amortized cost using the effective interest rate method, less provision for impairment. A provision for
impairment is established when there is objective evidence that the Company will not be able to collect
all amounts due according to the original terms of receivables. The amount of the provision is charged to
income. Trade debts and other receivables considered irrecoverable are written-off.
Exchange gains and losses arising on translation in respect of trade debts and other receivables in foreign
currency are added to the carrying amount of the respective receivables.
2.9 Cash and cash equivalents
Cash and cash equivalents in the cash flow statement include cash in hand and in transit, balance with
banks, deposits held at call with banks, other short-term highly liquid investments with original maturities
of three months or less and short term finances. Short term finances on the balance sheet are shown as
part of current liabilities.

NOTES TO THE CONSOLIDATED FINANCIAL STATEMENTSFOR THE YEAR ENDED DECEMBER 31, 2009
129Annual Report 2009
(Amounts in thousand)
2.10 Share capital
Ordinary shares are classified as equity and recognized at their face value. Incremental costs, if any,
directly attributable to the issue of new shares or options are recognized in equity as a deduction, net of
tax, from the proceeds.
2.11 Employees' Share Option Scheme
The grant date fair value of equity settled share based payments to employees is initially recognized in
the balance sheet as deferred share employee compensation expense with a consequent credit to equity
as employee share compensation reserve.
The fair value determined at the grant date of the equity settled share based payments is recognized as
an employee compensation expense on a straight line basis over the vesting period.
When an unvested option lapses by virtue of an employee not conforming to the vesting conditions after
recognition of an employee compensation expense in profit or loss, employee compensation expense in
profit or loss is reversed equal to the amortized portion with a corresponding effect to deferred employee
compensation reserve in the balance sheet.
When a vested option lapses on expiry of the exercise period, employee compensation expense already
recognized in the profit or loss is reversed with a corresponding reduction to deferred employee compensation
reserve in the balance sheet.
When the options are exercised, deferred employee compensation reserve relating to these options is
transferred to share capital and share premium account. An amount equivalent to the face value of related
shares is transferred to share capital, and any amount over and above the share capital is transferred to
share premium account.
2.12 Borrowings
Borrowings are recognized initially at fair value, net of transaction costs incurred and are subsequently
measured at amortized cost using the effective interest method.
Borrowings are classified as current liabilities unless the Company has an unconditional / contractual right
to defer settlement of the liability for at least twelve months after the balance sheet date.
2.13 Retirement and other service benefit obligation
2.13.1 Pension Scheme
The Company operates an approved defined benefit pension scheme for its management employees.
The scheme is funded and provides for pension based on the employees' last drawn salary. Pensions
are payable, after retirement or on optional retirement, for life and thereafter to surviving spouses and
dependent children.

NOTES TO THE CONSOLIDATED FINANCIAL STATEMENTSFOR THE YEAR ENDED DECEMBER 31, 2009
130Annual Report 2009
(Amounts in thousand)
2.13.2 Gratuity Scheme
The Company operates an approved funded defined benefit gratuity scheme for its management
employees.The scheme provides gratuity based on the employees' last drawn salary. Gratuity is
payable on retirement, separation or death to ex-employees, or their spouses thereafter.
Contributions are made annually to these funds on the basis of the actuarial valuations and in line with
the provisions of the Income Tax Ordinance, 2001.
2.13.3 Additional Death Gratuity Scheme
The Company also operates an approved death gratuity scheme for its permanent employees. The
scheme is unfunded and provides for additional death gratuity which is payable on death of employee
to surviving spouses and dependent children.
Actuarial valuation of these schemes is carried out at least once in every three years. The most recent
actuarial valuation was carried out as of December 31, 2008 using the 'Projected Unit Credit Meth
The amount recognized in the balance sheet represents the present value of defined benefit obligations
as adjusted for unrecognized actuarial gains and losses and unrecognized past service costs, if any, as
reduced by the fair value of plan assets.
Cumulative unrecognized actuarial gains and losses at the end of the previous year which exceeds 10%
of the greater of the present value of the Company's defined benefit obligations and the fair value of
plan assets are amortized over the expected average remaining working lives of the employees.
2.13.4 Provident fund
The Company operates a defined contribution provident fund for its permanent management employees.
Equal monthly contributions are made both by the Company and the employees to the fund at the rate of
10% of basic salary. Annual contribution by the Company is charged to income.
2.13.5 Compensated absences
Accrual is made for employees compensated absences on the basis of accumulated leaves and the last
drawn pay.
2.13.6 Other benefits
Provision is made under a service incentive plan for certain category of experienced employees to continuein the Company's employment. The provision is made on the basis of management's estimates of incentivesto be paid to employees on fulfilment of criteria given in the incentive plan.
2.14 Trade and other payables
These are recognized initially at fair value and subsequently measured at amortized cost using the effectiveinterest rate method. Exchange gains and losses arising on translation in respect of liabilities in foreigncurrency are added to the carrying amount of the respective liabilities.
NOTES TO THE CONSOLIDATED FINANCIAL STATEMENTSFOR THE YEAR ENDED DECEMBER 31, 2009
131Annual Report 2009
(Amounts in thousand)
2.15 Provisions
Provisions are recognized when the Company has a legal or constructive obligation as a result of past
events, and it is probable that outflow of resources embodying economic benefits will be required to settle
the obligation and a reliable estimate can be made of the amount of obligation. Provisions are reviewed
at each balance sheet date and adjusted to reflect current best estimate.
2.16 Taxation
2.16.1 Current
Provision for current taxation is based on the taxable income for the year, determined in accordance with
the prevailing law for taxation on income, using prevailing tax rates. The charge for current tax also includes
tax credits and adjustments, where considered necessary, for prior years determined during the year or
otherwise considered necessary for such years.
2.16.2 Deferred
Deferred income tax is provided using the liability method on all temporary differences arising between
the tax bases of assets and liabilities and their carrying amounts in the financial statements. Deferred tax
liabilities are generally recognized for all taxable temporary differences and deferred tax assets are
recognized to the extent that it is probable that taxable profits will be available against which the deductible
temporary differences, unused tax losses and tax credits can be utilized.
Deferred income tax is determined using tax rates that have been enacted or substantially enacted by the
balance sheet date and are expected to apply when the related deferred income tax asset is realized or
the deferred income tax liability is settled. Deferred tax is charged or credited in the profit and loss account.
2.17 Foreign currency transactions and translation
These financial statements are presented in Pakistani Rupees, which is the Company's functional currency.
Foreign currency transactions are translated into the functional currency using the exchange rates prevailing
at the dates of the transactions. Foreign exchange gains and losses resulting from the settlement of such
transactions and from the translation at year-end exchange rates of monetary assets and liabilities
denominated in foreign currencies are recognized in income.
2.18 Derivatives financial instruments and hedging activities
Derivatives are initially recognized at fair value on the date a derivative contract is entered into and are
subsequently re-measured at their fair value. The method of recognizing the resulting gain or loss depends
on whether the derivative is designated as a hedging instrument, and if so, the nature of the item being
hedged. The Company designates certain derivatives as either:
(a) hedges of the fair value of recognized assets or liabilities or a firm commitment (fair value hedge); or
(b) hedges of a particular risk associated with a recognized asset or liability or a highly probable
forecast transaction (cash flow hedge).

NOTES TO THE CONSOLIDATED FINANCIAL STATEMENTSFOR THE YEAR ENDED DECEMBER 31, 2009
132Annual Report 2009
(Amounts in thousand)
The overall risk management strategy includes reasons for undertaking hedge transactions and entering
into derivatives. The objectives of this strategy are to:
- minimize foreign currency exposure's impact on the Company's financial performance; and
- protect the Company's cash flow from adverse movements in foreign currency exchange rates.
(a) Fair value hedge
Changes in the fair value of derivatives that are designated and qualify as fair value hedges are recorded
in the profit and loss account, together with any changes in the fair value of the hedged asset or liability
that are attributable to the hedged risk.
(b) Cash flow hedge
On an ongoing basis, the Company assesses whether each derivative continues to be highly effective in
offsetting changes in the cash flows of hedged items. If and when a derivative is no longer expected to
be highly effective, hedge accounting is discontinued.
The effective portion of changes in the fair value of derivatives that are designated and qualify as cash
flow hedges is recognized in other comprehensive income. The gain or loss relating to the ineffective
portion is recognized immediately in the profit and loss account.
Amounts accumulated in comprehensive income are reclassified to the profit and loss account in the
periods when the hedged item affects profit or loss account i.e. when the transaction occurs. The gain or
loss relating to the effective portion of interest rate swaps hedging variable rate borrowings is recognized
in the profit and loss account or the cost of the related asset for which the borrowing is being utilized.
However, when the forecast transaction that is hedged results in the recognition of a non-financial asset
(for e.g. inventory or fixed assets) the gains and losses previously deferred in equity are transferred from
equity and included in the initial measurement of the cost of the asset. The deferred amounts are ultimately
recognized in cost of goods sold in case of inventory or in depreciation in case of fixed assets.
When a hedging instrument expires or is sold, or when a hedge no longer meets the criteria for hedge
accounting, any cumulative gain or loss existing in equity at that time remains in equity and is recognized
when the forecast transaction is ultimately recognized in the profit and loss account or the cost of the
related non-financial asset (for e.g. inventory or fixed assets) as applicable. When a forecast transaction
is no longer expected to occur, the cumulative gain or loss that was reported in equity is immediately
transferred to the profit and loss account.
The fair values of various derivative instruments used for hedging purposes are disclosed in note 16.
Movements on the hedging reserve are shown in statement of comprehensive income. The full fair value
of a hedging derivative is classified as a non-current asset or liability when the remaining maturity of hedged
item is more than 12 months, and as a current asset or liability when the remaining maturity of the hedged
item is less than 12 months. Trading derivatives are classified as a current asset or liability.

NOTES TO THE CONSOLIDATED FINANCIAL STATEMENTSFOR THE YEAR ENDED DECEMBER 31, 2009
133Annual Report 2009
(Amounts in thousand)
2.19 Revenue recognition
Revenue is recognized to the extent it is probable that the economic benefits will flow to the Company and
the revenue can be measured reliably. Revenue is measured at the fair value of the consideration received
or receivable, and is recognized on the following basis:
- sales are recognized when the product is dispatched to customers;
- revenue from the supply of electricity is recorded based upon the output delivered;
- dividend income is recognized when the Company's right to receive the payment is established; and
- return on deposits is recognized using the effective interest rate method.
2.20 Borrowing costs
Borrowing costs are recognized as an expense in the period in which they are incurred except where such
costs are directly attributable to the acquisition, construction or production of a qualifying asset in which
such costs are capitalized as part of the cost of that asset. Borrowing costs includes exchange differences
arising from foreign currency borrowings to the extent these are regarded as an adjustment to borrowing
costs.
2.21 Segment reporting
Operating segments are reported in a manner consistent with the internal reporting.
2.22 Dividend and appropriation to reserves
Dividend and appropriation to reserves are recognized in the financial statements in the period in which
these are approved.
3. CRITICAL ACCOUNTING ESTIMATES AND JUDGEMENTS
Estimates and judgements are continually evaluated and are based on historical experience and otherfactors, including expectations of future events that are believed to be reasonable under the circumstances.The Company makes estimates and assumptions concerning the future. The resulting accounting estimateswill, by definition, seldom equal the related actual results. The estimates and assumptions that have asignificant risk of causing a material adjustment to the carrying amounts of assets and liabilities within the
next financial year are as follows:
3.1 Property, plant and equipment
The Company reviews appropriateness of the rate of depreciation, useful life and residual value used inthe calculation of depreciation. Further where applicable, an estimate of recoverable amount of assets ismade for possible impairment on an annual basis.
3.2 Impairment of investments in subsidiaries
In making an estimate of future cash flows from the Company's financial assets including investment insubsidiaries, the management considers future dividend stream and an estimate of the terminal value ofthese investments.

NOTES TO THE CONSOLIDATED FINANCIAL STATEMENTSFOR THE YEAR ENDED DECEMBER 31, 2009
134Annual Report 2009
(Amounts in thousand)
3.3 Derivative hedging financial instruments designated as cash flow hedges
The Company reviews the changes in fair values of the derivative hedging financial instruments at each
reporting date based on the valuations received from the contracting banks. These valuations represent
estimated fluctuations in the relevant currencies / interest rates over the reporting period and other relevant
variables signifying currency and interest rate risks.
3.4 Stock-in-trade
The Company reviews the net realizable value of stock-in-trade to assess any diminution in the respective
carrying values. Net realizable value is determined with reference to estimated selling price less estimated
expenditures to make the sales.
3.5 Income taxes
In making the estimates for income taxes payable by the Company, the management looks at the applicable
law and the decisions of appellate authorities on certain issues in the past.
3.6 Fair value of employee share options
The management has determined the fair value of options issued under the Employee Share Option
Scheme at the grant date using the Black Scholes pricing model. The fair value of these options and the
underlying assumptions are disclosed in note 14.
3.7 Provision for retirement and other service benefits obligations
The present value of these obligations depends on a number of factors that are determined on actuarial
basis using a number of assumptions. Any changes in these assumptions will impact the carrying amount
of these obligations. The present values of these obligations and the underlying assumptions are disclosed
in notes 34.2 and 34.7 respectively.
4. PROPERTY, PLANT AND EQUIPMENT
Operating assets (note 4.1) 14,112,080 1,987,643
Capital work in progress (note 4.4) 5,248,606 14,147,123
19,360,686 16,134,766
2008Rupees
2009

NOTES TO THE CONSOLIDATED FINANCIAL STATEMENTSFOR THE YEAR ENDED DECEMBER 31, 2009
135Annual Report 2009
(Amounts in thousand)
4.1 Operating assets
Water VCM Ethylene Gas
As at January 1, 2008
Cost 190,779 227,102 2,732,433 119,280 26,122 - 1,691 77,604 66,242 3,441,253
(9,480) (46,686) (1,111,931) (48,350) (10,611) - (689) (47,004) (33,449) (1,308,200)
181,299 180,416 1,620,502 70,930 15,511 - 1,002 30,600 32,793 2,133,053
Year ended December 31, 2008
Opening net book value 181,299 180,416 1,620,502 70,930 15,511 - 1,002 30,600 32,793 2,133,053
3,348 - - - - - - 19,940 20,384 43,672
- Cost - - - - - - - (3,353) (6,583) (9,936)
- Accumulated depreciation - - - - - - - 2,749 3,565 6,314
Net book value - - - - - - - (604) (3,018) (3,622)
- Cost - - (5,889) - - - - - 5,889 -
- Accumulated depreciation - - 2,984 - - - - - (2,984) -
Net book value - - (2,905) - - - - - 2,905 -
(3,870) (5,827) (145,761) (5,964) (1,306) - (85) (9,985) (12,662) (185,460)
180,777 174,589 1,471,836 64,966 14,205 - 917 39,951 40,402 1,987,643
As at January 1, 2009
Cost 194,127 227,102 2,726,544 119,280 26,122 - 1,691 94,191 85,932 3,474,989
(13,350) (52,513) (1,254,708) (54,314) (11,917) - (774) (54,240) (45,530) (1,487,346)
180,777 174,589 1,471,836 64,966 14,205 - 917 39,951 40,402 1,987,643
Year ended December 31, 2009
Opening net book value 180,777 174,589 1,471,836 64,966 14,205 - 917 39,951 40,402 1,987,643
- 168,221 12,076,638 275,128 - 50,023 32,158 ` 16,820 29,811 12,648,799
- Cost - - - - - - - (133) (13,458) (13,591)
- Accumulated depreciation - - - - - - - 74 8,957 9,031
Net book value - - - - - - - (59) (4,501) (4,560)
(3,934) (10,033) (466,383) (11,696) (1,306) (1,042) (754) (12,920) (11,734) (519,802)
176,843 332,777 13,082,091 328,398 12,899 48,981 32,321 43,792 53,978 14,112,080
As at December 31, 2009
194,127 395,323 14,803,182 394,408 26,122 50,023 33,849 110,878 102,285 16,110,197
(17,284) (62,546) (1,721,091) (66,010) (13,223) (1,042) (1,528) (67,086) (48,307) (1,998,117)
176,843 332,777 13,082,091 328,398 12,899 48,981 32,321 43,792 53,978 14,112,080
Annual Rate of
Depreciation (%) 2 to 2.14 2.5 to 10 5 to 16.67 5 5 5 5 5 to 33 20 to 25
Net book value
Depreciation charge - note 4.2
Closing net book value
Cost
Accumulated depreciation
Net book value
Additions
Disposals - note 4.3
Reclassification
Depreciation charge - note 4.2
Closing net book value
Accumulated depreciation
Accumulated depreciation
Net book value
Additions
Disposals / write off - note 4.3
Furniture,fixtures andequipment Vehicles Total
Rupees
Leaseholdland
Building onleasehold land
Plant andMachinery
Pipelines
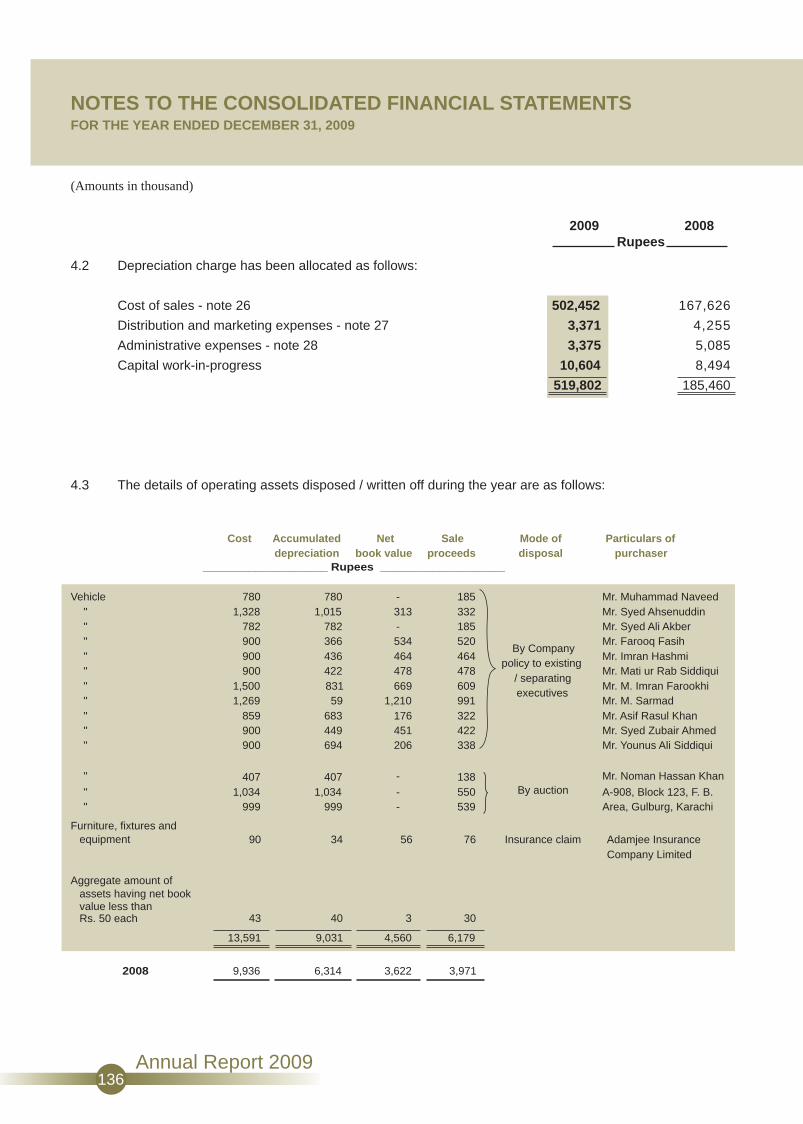
NOTES TO THE CONSOLIDATED FINANCIAL STATEMENTSFOR THE YEAR ENDED DECEMBER 31, 2009
136Annual Report 2009
(Amounts in thousand)
4.2 Depreciation charge has been allocated as follows:
Cost of sales - note 26 502,452 167,626
Distribution and marketing expenses - note 27 3,371 4,255
Administrative expenses - note 28 3,375 5,085
Capital work-in-progress 10,604 8,494
519,802 185,460
4.3 The details of operating assets disposed / written off during the year are as follows:
2009 2008Rupees
Cost Accumulated Net Sale Mode of Particulars ofdepreciation book value proceeds disposal purchaser
Vehicle 780 780 - 185 Mr. Muhammad Naveed" 1,328 1,015 313 332 Mr. Syed Ahsenuddin" 782 782 - 185 Mr. Syed Ali Akber" 900 366 534 520 Mr. Farooq Fasih" 900 436 464 464 Mr. Imran Hashmi" 900 422 478 478 Mr. Mati ur Rab Siddiqui" 1,500 831 669 609 Mr. M. Imran Farookhi" 1,269 59 1,210 991 Mr. M. Sarmad" 859 683 176 322 Mr. Asif Rasul Khan" 900 449 451 422 Mr. Syed Zubair Ahmed" 900 694 206 338 Mr. Younus Ali Siddiqui
" 407 407 - 138 Mr. Noman Hassan Khan
" 1,034 1,034 - 550 A-908, Block 123, F. B." 999 999 - 539 Area, Gulburg, Karachi
Furniture, fixtures andequipment 90 34 56 76 Insurance claim Adamjee Insurance
Company Limited
Aggregate amount ofassets having net bookvalue less thanRs. 50 each 43 40 3 30
13,591 9,031 4,560 6,179
2008 9,936 6,314 3,622 3,971
___________________ Rupees ___________________
By Companypolicy to existing
/ separatingexecutives
By auction

NOTES TO THE CONSOLIDATED FINANCIAL STATEMENTSFOR THE YEAR ENDED DECEMBER 31, 2009
137Annual Report 2009
(Amounts in thousand)
4.4 Capital work-in-progress
Year ended December 31, 2008
Balance as at January 1, 2008
Additions during the year
Transferred to operating assets
Balance as at December 31, 2008
Year ended December 31, 2009
Balance as at January 1, 2009
Additions during the year
Transferred to operating assets(note 4.4.1)
Balance as at December 31, 2009
1,925,402 109,671 30,251 168,293 7,386 2,922 331,783 2,575,708
10,597,655 53,630 31,235 64,723 31,724 24,325 808,447 11,611,739
- - - - (19,940) (20,384) - (40,324)
12,523,057 163,301 61,486 233,016 19,170 6,863 1,140,230 14,147,123
12,523,057 163,301 61,486 233,016 19,170 6,863 1,140,230 14,147,123
1,830,574 31,717 2,395 15,860 3,129 31,263 1,827,684 3,742,622
(10,608,848) (162,008) (63,589) (246,083) (16,820) (29,811) (1,513,980) (12,641,139)
3,744,783 33,010 292 2,793 5,479 8,315 1,453,934 5,248,606
Rupees
4.4.1 As referred to in note 1.2, the Company commenced work on the expansion Project in 2006, and the
Capital work-in-progress relates to the cost of this expansion Project. During the year, the Company has
commenced commercial production from the new PVC plant and declared commercial operations of
Ethylene Di Chloride (EDC), Chlor-alkali and Power plants (Gas turbines) and transferred the related costs
of these plants to operating assets. However, the Vinyl Chloride Monomer (VCM) plant is currently in the
test production phase.
4.4.2 The ancillary costs, directly attributable to the Project, comprise:
TotalOther ancillarycosts
(note 4.4.2)
Furniturefixture andequipment
Water andgas
pipelines
Ethylenepipeline and
power cables
Building onleasehold
land
Plant andmachinery
Advancesfor vehicles
Salaries, wages and benefits 213,879 315,240Training and travelling expenses 45,051 74,439Borrowing costs, including mark-up on finances
using capitalization rate of 12.08% - net
(2008: 13.45% - net) 591,810 591,713Legal and professional charges 31,860 43,103Depreciation 15,053 13,763Storage and handling 481,667 -
Others 74,614 101,972
1,453,934 1,140,230
2009 2008Rupees
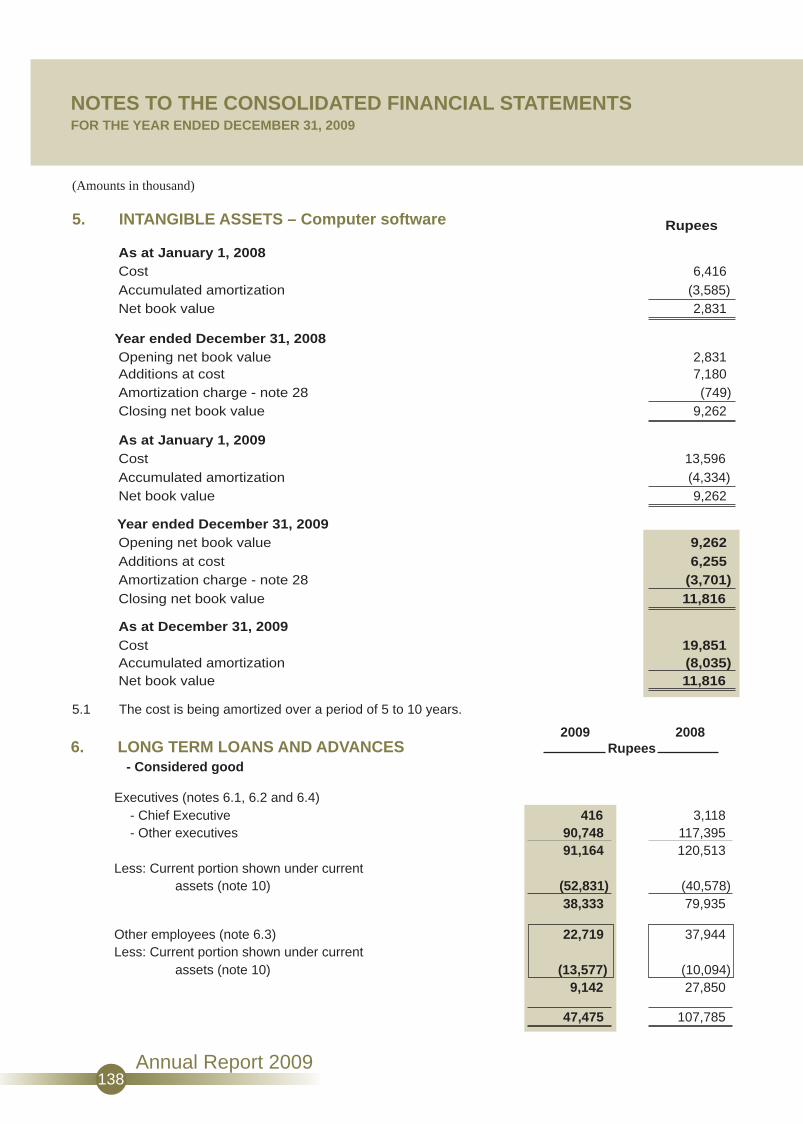
NOTES TO THE CONSOLIDATED FINANCIAL STATEMENTSFOR THE YEAR ENDED DECEMBER 31, 2009
138Annual Report 2009
(Amounts in thousand)
5. INTANGIBLE ASSETS – Computer software
As at January 1, 2008Cost 6,416Accumulated amortization (3,585)Net book value 2,831
Year ended December 31, 2008Opening net book value 2,831Additions at cost 7,180Amortization charge - note 28 (749)Closing net book value 9,262
As at January 1, 2009Cost 13,596Accumulated amortization (4,334)Net book value 9,262
Year ended December 31, 2009Opening net book value 9,262Additions at cost 6,255Amortization charge - note 28 (3,701)Closing net book value 11,816
As at December 31, 2009Cost 19,851Accumulated amortization (8,035)Net book value 11,816
5.1 The cost is being amortized over a period of 5 to 10 years.
Rupees
6. LONG TERM LOANS AND ADVANCES- Considered good
Executives (notes 6.1, 6.2 and 6.4) - Chief Executive 416 3,118 - Other executives 90,748 117,395
91,164 120,513Less: Current portion shown under current
assets (note 10) (52,831) (40,578)38,333 79,935
Other employees (note 6.3) 22,719 37,944Less: Current portion shown under current
assets (note 10) (13,577) (10,094)9,142 27,850
47,475 107,785
2009 2008Rupees

NOTES TO THE CONSOLIDATED FINANCIAL STATEMENTSFOR THE YEAR ENDED DECEMBER 31, 2009
139Annual Report 2009
(Amounts in thousand)
6.1 Reconciliation of the carrying amount of loans and advances to Chief Executive and Executives.
6.2 These represent interest free loans and advances to executives for house rent, vehicles, home appliances
and investments given in accordance with the terms of employment and for purchase of the Company’s
shares under the Employees’ Share Scheme (ESS) introduced/announced by EPCL Employees’ Trust.
Loans for house rent and investments are repayable in 18 to 36 equal monthly installments. Loans for
home appliances are repayable in 5 equal annual installments. 20% of the loan for purchase of Company’s
share under ESS are repayable at the end of month 1, 12 and 24 and 40% is repayable at the end of
month 30 from the expiry date of the Option Period. Advances for vehicles are charged to profit and loss
account over a period of 3 years.
6.3 These represent interest free loans to employees for home appliances and investments, given in accordance
with the terms of employment and for purchase of the Company’s shares under the Employees’ Share
Scheme (ESS) introduced/announced by EPCL Employees’ Trust. Loans are repayable in accordance
with the terms stated in note 6.2.
6.4 The maximum aggregate amount due from Chief Executive and executives at the end of any month during
the year was Rs. 111,540 (2008: Rs. 130,000).
6.5 The carrying values of these financial assets are neither past due nor impaired. The credit quality of these
financial assets can be assessed with reference to no defaults in recent history.
Balance at beginning of the year
Disbursements
Repayments
Balance at end of year
Chief Other Total Chief OtherExecutive executives Executive executives
3,118 117,395 120,513 - 114,402
- 31,220 31,220 3,742 288,545
(2,702) (57,867) (60,569) (624) (285,552)
416 90,748 91,164 3,118 117,395
2009 2008
114,402
292,287
(286,176)
120,513
Total
Rupees
7. STORES, SPARES AND LOOSE TOOLS
Consumable stores 20,194
Spares 176,435 113,407
196,629 127,152
Less: Provision for slow moving stores
and spares - note 26 (3,867)
192,762 127,152
13,745
-
2009 2008Rupees
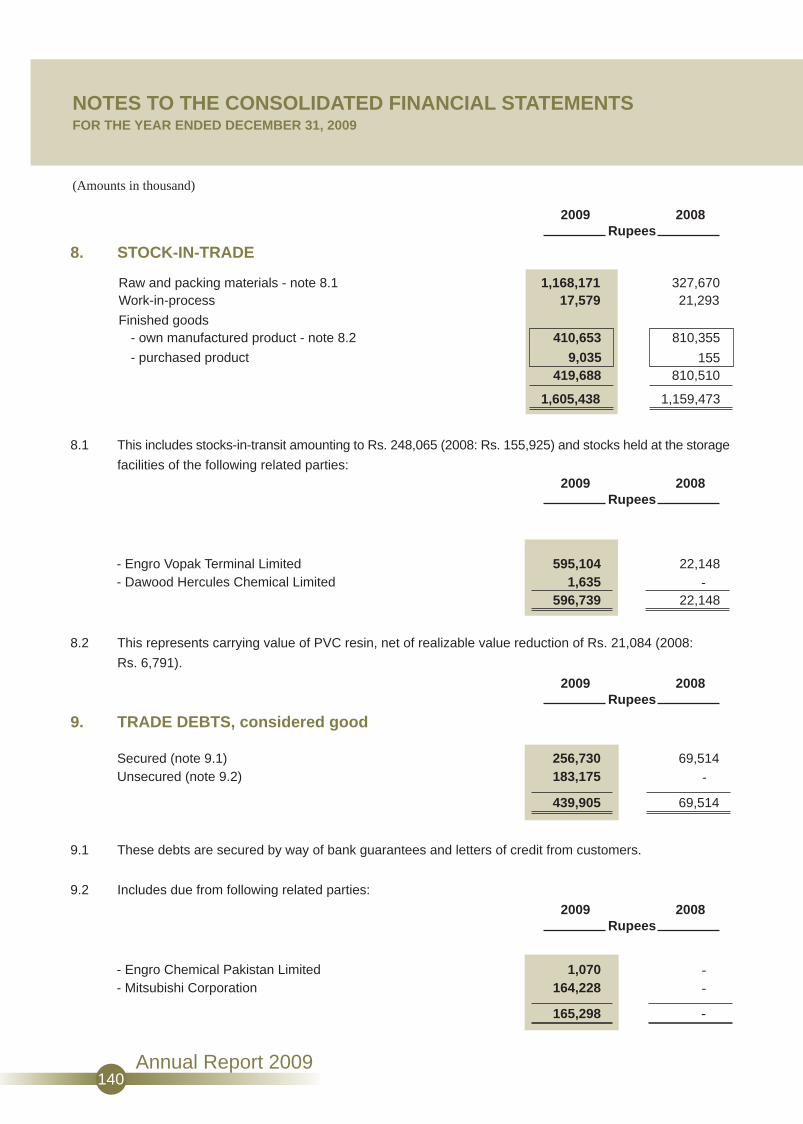
NOTES TO THE CONSOLIDATED FINANCIAL STATEMENTSFOR THE YEAR ENDED DECEMBER 31, 2009
140Annual Report 2009
(Amounts in thousand)
8.1 This includes stocks-in-transit amounting to Rs. 248,065 (2008: Rs. 155,925) and stocks held at the storage
facilities of the following related parties:
8.2 This represents carrying value of PVC resin, net of realizable value reduction of Rs. 21,084 (2008:
Rs. 6,791).
8. STOCK-IN-TRADE
Raw and packing materials - note 8.1 1,168,171 327,670Work-in-process 17,579
Finished goods- own manufactured product - note 8.2 410,653 810,355
155- purchased product 9,035419,688 810,510
1,605,438 1,159,473
21,293
- Engro Vopak Terminal Limited- Dawood Hercules Chemical Limited
595,104 22,1481,635 -
596,739 22,148
9. TRADE DEBTS, considered good
Secured (note 9.1) 256,730 69,514Unsecured (note 9.2) 183,175
439,905 69,514
-
9.1 These debts are secured by way of bank guarantees and letters of credit from customers.
9.2 Includes due from following related parties:
- Engro Chemical Pakistan Limited 1,070 -- Mitsubishi Corporation 164,228 -
165,298 -
2009 2008Rupees
2009 2008Rupees
2009 2008Rupees
2009 2008Rupees
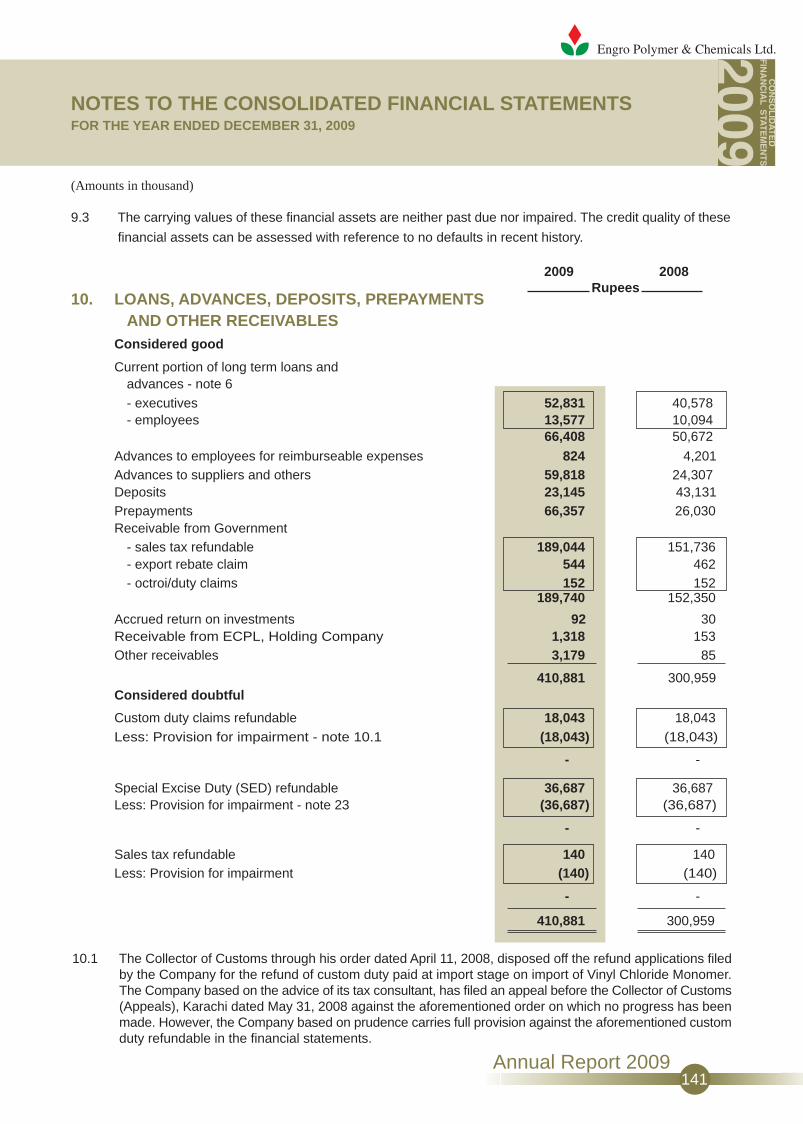
NOTES TO THE CONSOLIDATED FINANCIAL STATEMENTSFOR THE YEAR ENDED DECEMBER 31, 2009
141Annual Report 2009
(Amounts in thousand)
9.3 The carrying values of these financial assets are neither past due nor impaired. The credit quality of these
financial assets can be assessed with reference to no defaults in recent history.
10.1 The Collector of Customs through his order dated April 11, 2008, disposed off the refund applications filed by the Company for the refund of custom duty paid at import stage on import of Vinyl Chloride Monomer. The Company based on the advice of its tax consultant, has filed an appeal before the Collector of Customs
(Appeals), Karachi dated May 31, 2008 against the aforementioned order on which no progress has been made. However, the Company based on prudence carries full provision against the aforementioned custom duty refundable in the financial statements.
10. LOANS, ADVANCES, DEPOSITS, PREPAYMENTSAND OTHER RECEIVABLES
Considered good
Current portion of long term loans andadvances - note 6- executives 52,831 40,578- employees 13,577 10,094
66,408 50,672
Advances to employees for reimburseable expenses 824 4,201Advances to suppliers and others 59,818 24,307Deposits 23,145 43,131Prepayments 66,357 26,030Receivable from Government
- sales tax refundable 189,044 151,736- export rebate claim 544 462- octroi/duty claims 152 152
189,740 152,350
Accrued return on investments 92 30Receivable from ECPL, Holding Company 1,318 153Other receivables 3,179 85
410,881 300,959Considered doubtful
Custom duty claims refundable 18,043 18,043Less: Provision for impairment - note 10.1 (18,043) (18,043)
- -
Special Excise Duty (SED) refundable 36,687 36,687Less: Provision for impairment - note 23 (36,687) (36,687)
- -
Sales tax refundable 140 140Less: Provision for impairment (140) (140)
- -
410,881 300,959
2009 2008Rupees

NOTES TO THE CONSOLIDATED FINANCIAL STATEMENTSFOR THE YEAR ENDED DECEMBER 31, 2009
142Annual Report 2009
(Amounts in thousand)
10.2 As at December 31, 2009 receivables aggregating to Rs. 54,870 (2008: Rs. 54,870) were deemed to be
impaired and have been provided for fully in these financial statements based on prudence. The remaining
balance of loans, advances, deposits, prepayments and other receivables are neither past due nor impaired.
61,398 43,648
11. SHORT TERM INVESTMENTS
- At fair value through profit or loss
Mutual fund securities - note 11.1
11.1 These represent investments in open end mutual funds and are valued at their respective redemption price
as at the balance sheet date.
13. SHARE CAPITAL
Authorized capital
700,000,000 (2008: 700,000,000) ordinary sharesof Rs. 10 each 7,000,000 7,000,000
Issued, subscribed and paid-upcapital
520,367,677 (2008: 520,367,677) ordinary sharesof Rs. 10 each, fully paid in cash 5,203,677 5,203,677
12.1 Includes Rs. 23,718 (2008: Rs. 2,671) kept in a separate bank account in respect of security deposits.
12.2 This deposit has a maturity of one month and carries mark-up at the rate of 8% per annum.
12. CASH AND BANK BALANCES
Cash in hand 970
Cash at bank- on current accounts 129,269- on saving accounts - note 12.1 68,292
197,56119,000Short term deposits - note 12.2
217,531
4,9315,273
10,204
99,385
88,246
935
2009 2008Rupees
2009 2008Rupees
2009 2008Rupees

NOTES TO THE CONSOLIDATED FINANCIAL STATEMENTSFOR THE YEAR ENDED DECEMBER 31, 2009
143Annual Report 2009
(Amounts in thousand)
13.1 As at December 31, 2009, Engro Chemical Pakistan Limited (ECPL) – the Holding Company holds
292,400,000 (2008: 292,400,000) ordinary shares of Rs. 10 each.
14. EMPLOYEES' SHARE OPTION SCHEME
14.1 The employees' share option scheme (the Scheme) was originally approved by the shareholders in their
Extraordinary General Meeting (EGM) held on October 8, 2007. Under the Scheme, senior employees
who were considered critical to the business operations were granted options to purchase 5.3 million newly
issued ordinary shares at an exercise price of Rs. 22 per ordinary share. The number of options granted
was calculated by reference to how critical an employee was considered to the business and his abilities,
subject to approval by the Compensation Committee. The options carry neither right to dividends nor voting
rights. Vesting period started from the ‘grant date’ and ends on December 31, 2009, whereafter the options
can be exercised within a period of two years. Further, employees who joined the Company by October
31, 2008 and those promoted to the eligible employee grade by the same date have also been granted
options on similar terms.
Last year, the Company proposed certain changes relating to ‘grant date’ in the originally approved Scheme.
These changes were approved by the shareholders in their EGM held on June 27, 2008, and subsequently
by the SECP on September 25, 2008. As per the approved change to the Scheme the ‘grant date’ is the
date of EGM held on October 8, 2007, when the Scheme was originally approved.
14.2 The amounts recognized in these financial statements in respect of the Scheme are as follows:
14.2.1 Employee share compensation reserve
9,858Unvested share options lapsed during the year (545)
9,313
14.2.2 Deferred employee share compensation expense
4,381Unvested share options lapsed during the year (545)Amortization for the year/period (3,836)
-Balance at end of the year
Balance at beginning of the year/recognized on
Balance at end of the year
Balance at beginning of the year/recognized on
the date of grant
the date of grant
9,858
9,858-
-
9,858
(5,477)4,381
2009 2008Rupees

NOTES TO THE CONSOLIDATED FINANCIAL STATEMENTSFOR THE YEAR ENDED DECEMBER 31, 2009
144Annual Report 2009
15.1 During the year, the Company entered into a Syndicate Term Finance Agreement with a consortium
of local banks for Rs. 1,500,000. The facility, in addition to the mark-up, also carries a monitoring fee of
Rs. 300 for the first year and Rs. 500 per annum, thereafter. Commitment fee at rate of
0.15% per annum is also payable on that part of the finance that has not been drawn down.
During the year, the entire facility has been drawn down.
15.2 During the year, the Company has drawn down the remaining balance of US $ 30,000 against
the loan agreement / facility with International Finance Corporation (IFC).
15.3 The above finances are secured by:
(i) a first mortgage by deposit of title deeds over Project Properties ranking pari passu with
facilities against LCs referred to in note 22.3;
(ii) a first mortgage by deposit of title deeds over leasehold land (30 acres) of the Project
together with the buildings, plant, machinery and other equipment thereon ranking pari
passu with the facilities referred to in note 22.3; and
(Amounts in thousand)
14.3 The Company used Black Scholes pricing model to calculate the fair value of share options atthe grant date. The fair value of the share options as per the model and underlying assumptions are asfollows:
Total number of share options issued 5,300,000Fair value of the share options at grant date Rs. 1.86Share price at grant dateExercise priceAnnual volatility based on historical patternRisk free rate usedExpected dividends
Rs. 18Rs. 22
15.13%10.12%
Nil
15. LONG TERM BORROWINGS, Secured
Mark - up rateper annum Number
2009 2008
Syndicated term finance I 13 half yearly November 2010 5,655,127 5,648,525
Morabaha finance 8 half yearly September 2009 - 100,000
Long term finance utilized undermark-up arrangements 5 half yearly June 2007 - 30,000
Syndicated term finance II (note 15.1) 13 half yearly June 2010 1,485,599 -
International Finance
Corporation (IFC) (note 15.2) 15 half yearly June 2010 5,010,830 2,324,547
12,151,556 8,103,072
Less: Current portion shown under current liabilities (1,016,393) (130,000)
11,135,163 7,973,072
6 months LIBOR + 2.6 to 3%
Rupees
Installments
6 months KIBOR + 2.25%
Commencing from
6 months KIBOR + 0.5%
6 months KIBOR + 3%
6 months KIBOR + 0.5%

NOTES TO THE CONSOLIDATED FINANCIAL STATEMENTSFOR THE YEAR ENDED DECEMBER 31, 2009
145Annual Report 2009
17.1 This represents amounts retained from progress payments made to contractors/suppliers against work
completed on the Project, referred to in note 1.2.
(Amounts in thousand)
(iii) hypothecation by way of:
- a first charge over all Project Assets, ranking pari passu with facilities referred to in note 22.3; and
- a first charge over all present and future moveable fixed assets other than Project Assets.
16. DERIVATIVE FINANCIAL INSTRUMENTS
The Company has entered into interest rate swap agreements for notional amounts aggregating to US$
40,000, with banks to hedge its interest rate exposure on floating rate foreign currency borrowings from
International Finance Corporation (IFC). Under the swap agreements, the Company would receive six
month USD-LIBOR on respective notional amounts and will pay fix rates, which will be settled semi annually.
Details of the swap agreements are as follows:
17. RETENTION MONEY AGAINST PROJECT PAYMENTS
Amounts retained as at December 31 - note 17.1 801,718 792,478
Less: Current portion shown under currentliabilities - note 20 (801,718) (239,033)
- 553,445
NotionalAmounts
US $
Effective Date
TerminationDate
Fixed Rate%
Fair values
15,000 December 15, 2008 June 15, 2017 3.385 23,770 5,000 June 15, 2009 June 15, 2017 3.005 1,838 15,000 June 15, 2009 June 15, 2017 2.795 (4,570) 5,000 June 15, 2009 June 15, 2017 2.800 (1,103)
40,000 19,935 60,154
60,154---
2009 2008Rupees
2009 2008Rupees

NOTES TO THE CONSOLIDATED FINANCIAL STATEMENTSFOR THE YEAR ENDED DECEMBER 31, 2009
146Annual Report 2009
(Amounts in thousand)
18. DEFERRED INCOME TAX LIABILITIES
Credit balances arising due to:
- accelerated tax depreciation 3,061,376 548,080
- net borrowing costs capitalized 207,133 160,0543,268,509 708,134
Debit balances arising due to:
- recoupable carried forwardtax losses - note 18.1 (2,725,269) (153,887)
- unrealized foreign exchange losses, unpaidliabilities and provision for retirement andother service benefits (46,581) (25,243)
- provision against custom duty andSED refundable (6,454)
- provision for slow moving stores and spares (1,353)
- fair value of hedging instrument (6,977) (21,054)
- share issuance cost, net to equity (51,566) (51,566)
- recoupable minimum turnover tax (108,789) (67,356)(2,946,989) (325,560)
321,520 382,574
18.1 Deferred income tax asset is recognized for tax losses available for carry-forward to the extent that the
realization of the related tax benefit through future taxable profits is probable. The aggregate tax losses
available for carry-forward at December 31, 2009 amount to Rs. 7,786,483 (2008: Rs. 439,677), on which
the deferred income tax asset has been recognized.
(6,454)
-
19. RETIREMENT AND OTHER SERVICEBENEFIT OBLIGATIONS
Service incentive plan 34,172 35,524Additional death gratuity - note 34 4,140 2,976
38,312 38,500
2009 2008Rupees
2009 2008Rupees

NOTES TO THE CONSOLIDATED FINANCIAL STATEMENTSFOR THE YEAR ENDED DECEMBER 31, 2009
147Annual Report 2009
20. TRADE AND OTHER PAYABLES
Trade and other creditors - note 20.1 1,223,536 797,211Accrued liabilities 523,718 317,713Advances from customers 399,002 118,232Current portion of retention money - note 17 801,718 239,033Security deposits 23,610 2,510Workers' profits participation fund - note 20.2 28,659 24,625Workers' welfare fund - 9,357Others 1,779 2,293
3,002,022 1,510,974
20.1 Includes amount due to following related parties:
- Mitsubishi Corporation 1,152,402 740,811- Engro Vopak Terminal Limited 77,045 15,046
1,229,447 755,857
20.2 Workers' profits participation fund
Balance as at January 1 24,625 30,988Add: Allocation for the year - note 29 - 24,625Add: Interest thereon - note 31 4,034 -
28,659 55,613
Less: Payments made during the year - (30,988)
Balance as at December 31 28,659 24,625
21. ACCRUED INTEREST / MARK-UP
Finance cost accrued on:- long term borrowings 196,483 157,678- short term borrowings 9,289 9,590
205,772 167,268
(Amounts in thousand)
22. SHORT TERM BORROWINGS
Running finance utilized under mark-up arrangements - note 22.1 394,241 717,568
Short term finance - note 22.2 125,000
594,241 842,568
200,000
2008Rupees
2009

NOTES TO THE CONSOLIDATED FINANCIAL STATEMENTSFOR THE YEAR ENDED DECEMBER 31, 2009
148Annual Report 2009
(Amounts in thousand)
22.1 The aggregate facilities for running finance available from various banks, represents the sales price of
all mark-up arrangements, amount to Rs. 2,200,000 (2008: Rs. 1,275,000). The corresponding purchase
price is payable on various dates during the ensuing year. Mark-up is chargeable at rates net of prompt
payment rebate, ranging from relevant period KIBOR plus 0.9% to relevant period KIBOR plus 3% (2008:
relevant period KIBOR plus 1.25% to relevant period KIBOR plus 3%). During the year, the mark-up rates,
net of prompt payment rebate, ranged from 12.39% to 17.37% per annum (2008: 10.37% to 17.6% per
annum).
22.2 During the year, the Company entered into a short term financing arrangement of Rs. 200,000 with a local
bank to obtain export refinance available at concessionary rate. The finance carries mark-up at the
equivalent State Bank of Pakistan rate plus 1% per annum. The finance is secured by a floating charge of
Rs. 250,000 upon all present and future current assets of the Company. The principal amount of the
facility is payable in lump sum at maturity on April 30, 2010.
22.3 The facility for opening letters of credit as at December 31, 2009 aggregate to Rs. 4,794,000 (2008:
Rs. 9,468,000). The amount utilized at December 31, 2009 was Rs. 1,933,000 (2008: Rs. 1,232,000). The
facilities carry commission at the rate of 0.05% per quarter.
As at December 31, 2009, the Company had paid Rs. 94,611 (2008: Rs. 91,616) on account of Special
Excise Duty (SED) on import of plant and machinery for the Project. Out of this amount the Company has
adjusted Rs. 57,924 (2008: Rs. 54,929) in the monthly sales tax returns against SED on goods produced
and sold by the Company. The Company had approached the Federal Board of Revenue to obtain a
clarification in respect of the adjustment of SED made by the Company in monthly sales tax returns.
Pending such clarification the Company based on prudence had made provision for the adjusted amount
of Rs. 57,924 and for the balance remaining of Rs. 36,687 included in loans, advance, deposits, prepayments
and other receivables. However, during the year, the Company received show cause notices from the
Additional Collector (Adjudication) – Federal Board of Revenue, stating that the Company, by adjusting
the aforementioned SED, has violated the provisions of the Federal Excise Act, 2005 and the Federal
Excise Rules, 2005 read with SRO 655(1)/2007 and that the amount adjusted is recoverable from the
23. PROVISIONS
Balance at beginning of the year 54,929 -Add: Recognized during the year 2,995 54,929
57,924 54,929Add: Provision for surcharge thereon 12,570 -
Balance at end of the year 70,494 54,929
2008Rupees
2009

NOTES TO THE CONSOLIDATED FINANCIAL STATEMENTSFOR THE YEAR ENDED DECEMBER 31, 2009
149Annual Report 2009
(Amounts in thousand)
Company under the Federal Excise Act, 2005 along with default surcharge and penalty. In response to
these notices the Company has filed a Constitutional Petition before the Honourable High Court, Sindh,
on May 18, 2009. The High Court is in the process of evaluating the Constitutional Petition. The Company
is confident that the ultimate outcome of the matter will be in its favour, however, based on prudence is
maintaining the aforementioned provision. Further, a provision of Rs. 12,570 for surcharge and penalty
there against upto December 31, 2009 has also been made.
24. CONTINGENCIES AND COMMITMENTS
24.1 Commitments
24.1.1 Capital expenditure for the Project, referred to in note 1.2, under the contracts signed as at December
31, 2009, but not yet incurred amounts to Rs. 721,859 (2008: Rs. 1,305,738).
24.1.2 Performance guarantees issued by the banks on behalf of the Company as at December 31, 2009 amounts
to Rs. 581,111 (2008: Rs. 264,200).
25. NET REVENUE
Gross local sales 12,226,263 9,455,612
Supply of electricity - note 25.1 214,924 24,177
12,441,187 9,479,789
Less:
- Sales tax 2,165,095 1,606,119- Special excise duty 103,988 78,363- Discounts 3,437 6,150
2,272,520 1,690,63210,168,667 7,789,157
Export sales 1,463,441 79,223
11,632,108 7,868,380
25.1
Engro Chemical Pakistan Limited - Holding Company 47,070 24,177
Karachi Electricity Supply Company 167,854 -
214,924 24,177
Supply of electricity represents supply ofsurplus power to the following:
(Restated)2008
Rupees
2009

NOTES TO THE CONSOLIDATED FINANCIAL STATEMENTSFOR THE YEAR ENDED DECEMBER 31, 2009
150Annual Report 2009
(Amounts in thousand)
26. COST OF SALES
Opening stock of work-in-progress 21,293 22,861
Raw and packing materials consumed 7,904,707 6,254,555
Salaries, wages and staff welfare - note 26.2 211,896 97,332
Fuel, power and gas 771,237 158,437
Repairs and maintenance 49,292 10,797
Depreciation - note 4.2 502,452 167,626
Consumable stores 91,649 21,310
Purchased services 54,458-
Storage and handling - note 26.3 339,425 139,405Training and travelling expenses 5,943 11,185Communication, stationery and other office expenses 2,971 2,211Insurance 51,050 10,597Other expenses 18,558 5,061
10,007,505 6,903,598
Closing stock of work-in-progress - note 8 (17,579) (21,293)
Cost of goods manufactured 10,011,219 6,905,166
Opening stock of finished goods 810,355 640,170Closing stock of finished goods - note 8 (410,653) (810,355)
399,702 (170,185)
Cost of sales - own manufactured product 10,410,921 6,734,981Cost of goo ld - purchased product - note 26.1 7,671 677
10,418,592 6,735,658
26.1 Cost of sales - purchased product
Opening stock 155 147Add: Purchases 16,551 685Less: Closing stock - note 8 (9,035) (155)
7,671 677
26.2 This includes Rs. 11,441 (2008: Rs. 5,648), in respect of staff retirement and benefits referred to in note 34.
Provision for slow moving stores and spares - note 7 3,86725,082
2008Rupees
2009

NOTES TO THE CONSOLIDATED FINANCIAL STATEMENTSFOR THE YEAR ENDED DECEMBER 31, 2009
151Annual Report 2009
(Amounts in thousand)
26.3 The Company has entered into operating lease arrangements with Al-Rahim Trading Terminal and Dawood
Hercules Chemicals Limited – a related party, for storage and handling of Ethylene Di Chloride and Caustic
soda, respectively. The total lease rentals due under these lease arrangements are payable in periodic
monthly installments till July 31, 2019.
The future aggregate lease payments under these arrangements are as follows:
Not later than 1 year 43,398 -
Later than 1 year and not later than 5 years 57,600 -
Later than 5 years 64,800 -
165,798 -
27.1 This includes Rs. 3,228 (2008: Rs. 2,613), in respect of staff retirement and benefits, referred to in note 34.
27. DISTRIBUTION AND MARKETING EXPENSES
Salaries, wages and staff welfare - note 27.1 50,641 42,535Advertising, sales promotion and entertainment 50,921 30,669Product transportation and handling 359,969 202,208Rent, rates and taxes 3,625 5,524Purchased services 3,367 9,695Insurance 1,002 919Depreciation - note 4.2 3,371 4,255Training and travelling expenses 6,473 7,872Communication, stationery and other
office expenses 2,041 2,709Other expenses 2,404 5,254
483,814 311,640
2008Rupees
2009

NOTES TO THE CONSOLIDATED FINANCIAL STATEMENTSFOR THE YEAR ENDED DECEMBER 31, 2009
152Annual Report 2009
(Amounts in thousand)
28. ADMINISTRATIVE EXPENSES
Salaries, wages and staff welfare - note 28.1 76,563 93,014Rent, rates and taxes 17,088 13,560Purchased services 24,057 8,733Insurance 645 154Depreciation - note 4.2 3,375 5,085Amortization - note 5 3,701 749Training and travelling expenses 47,760 18,557Communication, stationery and other
office expenses 22,191 13,846Other expenses 10,362 9,484
205,742 163,182
28.1 This includes Rs. 7,951 (2008: Rs. 6,056), in respect of staff retirement and benefits, referred to in
note 34.
29. OTHER OPERATING EXPENSES
Legal and professional charges 8,030 5,804Auditors' remuneration - note 29.1 1,582 1,239Donations - note 29.2 7,527 1,527Unrealized fair value loss on short term investments - 2,352Security deposit written-off - 217Export rebate claim written-off - 1,195Workers' profits participation fund - note 20.2 - 24,625Workers' welfare fund - 9,357Provision against custom duty refundable - note 10 - 18,043Foreign exchange loss (net) 213,373 229,428Others 1,499 -
232,011 293,78729.1 Auditors’ remuneration
Fee for:- Annual statutory audit 580 530- Half yearly review 175 150- Review of compliance with Code of
Corporate Governance 50 50805 730
Taxation and other advisory services 640 389Reimbursement of expenses 137 120
1,582 1,239
2008Rupees
2009
2008Rupees
2009

NOTES TO THE CONSOLIDATED FINANCIAL STATEMENTSFOR THE YEAR ENDED DECEMBER 31, 2009
153Annual Report 2009
(Amounts in thousand)
29.2 The recipients of donations for the year do not include any donee in whom a director or his spouse had
any interest.
30. OTHER OPERATING INCOME
On financial assets
Income on short term investment and bank deposit 63,869 46,643Gain on sale of short term investments 36,693 69,879Unrealized fair value gain on short term investments 2,464 -Foreign exchange gain - net 10,180 -Others 149 7,260
On non-financial assets
Profit on disposal of property, plant and equipment 1,619 349Scrap sales 1,448 814
116,422 124,945
31. FINANCE COSTS
Interest /Mark-up on:- long term borrowings 554,898 18,212- short term borrowings 28,000 8,244
Accrued interest on payable to Workers' ProfitsParticipation Fund - note 20.2 4,034 -
Guarantee commission 2,511 979Bank charges and others 16,732 6,096
606,175 33,531
32. TAXATION
Current- for the year - note 32.1 71,787 793- for prior years (97) -
71,690 793Deferred - for the year (75,131) 104,450
(3,441) 105,243
32.1 Current year charge represents minimum tax at the rate of 0.5% of the turnover, in accordance with section
113 of the Income Tax Ordinance, 2001, inserted through Finance Act, 2009 and tax under presumptive
tax regime on export sales.
2008
Rupees
2009(Restated)
2008
Rupees
2009

NOTES TO THE CONSOLIDATED FINANCIAL STATEMENTSFOR THE YEAR ENDED DECEMBER 31, 2009
154Annual Report 2009
(Amounts in thousand)
32.2 Relationship between tax expense and accounting profit
The tax on the Company’s profit before tax differs from the theoretical amount that would arise using the
Company’s applicable tax rates as follows:
2008Rupees
2009
(Loss) / Profit before taxation (197,137) 455,596
Tax calculated at applicable rate of 35% (2008: 35%) (68,998) 159,459
Tax effect of exempt income and income subjectto lower tax rates (10,374) (23,665)
Un-recoupable minimum turnover tax 15,720 14,557
Effect of adjustments in opening written downvalues and carried forward losses 60,211 (45,108)
Tax expense for the year (3,441) 105,243
33. EARNINGS / (LOSS) PER SHARE – Basic and diluted
There is no dilutive effect on the basic earnings per share of the Company, since the average market price
of the Company’s share is less then the exercise price of the share’s options granted to employees,
referred to in note 14. The basic earnings per share of the Company is based on:
2009 2008
(Loss) / Profit for the year (193,696) 350,353
Weighted average number of ordinary shares(in thousand) 520,367 517,633
34. RETIREMENT AND OTHER SERVICE BENEFITS
The latest actuarial valuation of the defined benefit plans was carried out as at December 31, 2008 using
the ‘Projected Unit Credit Method’. Details of the defined benefit plans are as follows:

NOTES TO THE CONSOLIDATED FINANCIAL STATEMENTSFOR THE YEAR ENDED DECEMBER 31, 2009
155Annual Report 2009
(Amounts in thousand)
2009 2008 2009 2008 2009 2008Rupees
Pension Fund Gratuity Fund Additional Death GratuityScheme
34.1 Balance sheet reconciliation
Present value of definedbenefit obligations 78,994 68,644 26,048 22,888 - -
Fair value of plan assets (88,607) (73,582) (27,618) (21,821) - -(Surplus) / Deficit (9,613) (4,938) (1,570) 1,067 - -Present value of unfunded
obligations - - - - 4,523 3,359Unrecognized net actuarial
gains / (losses) 9,613 4,938 1,570 (1,067) (383) (383)Net liability at the end of the year - - - - 4,140 2,976
34.2 Movement in the definedbenefit obligations
Obligation as at January 1 68,644 53,267 22,888 19,600 3,359 2,429Current service cost 6,841 5,525 3,270 2,223 680 413Interest cost 9,704 5,603 3,300 2,049 481 246Actuarial losses / (gains) - 4,754 - 4,280 3 271Benefits paid (6,195) (505) (3,410) (5,264) - -Obligation as at December 31 78,994 68,644 26,048 22,888 4,523 3,359
34.3 Movement in the fair valueof plan assets
Fair value as at January 1 73,582 62,237 21,821 21,742 - -Expected return on plan assets 10,350 6,449 3,160 2,253 - -Actuarial gains - 905 - 1,071 - -Employer contributions 6,195 4,496 3,410 2,019 - -Benefits paid (1,520) (505) (773) (5,264) - -Fair value as at December 31 88,607 73,582 27,618 21,821 - -
34.4 The amounts recognized inthe profit and lossaccount are as follows:
Current service cost 6,841 5,525 3,270 2,223 680 413Interest cost 9,704 5,603 3,300 2,049 481 246Expected return on plan assets (10,350) (6,449) (3,160) (2,253) - -Recognition of actuarial
(gains) / losses - (183) - - 3 -Expense 6,195 4,496 3,410 2,019 1,164 659
34.5 Actual return on plan assets (3,867) 2,461 (222) 827 - -
34.6 Expected future costs for the year ending December 31, 2010:
Rupees
- Pension Fund 6,266- Gratuity Fund 3,444- Additional Death Gratuity Scheme 1,254
10,964

NOTES TO THE CONSOLIDATED FINANCIAL STATEMENTSFOR THE YEAR ENDED DECEMBER 31, 2009
156Annual Report 2009
(Amounts in thousand)
34.7 Principal assumptions used in the actuarial valuation:
2009 2008 2009 2008
Discount rate 14% 14% 14% 14%Expected rate of return per annum
on plan assets 14% 14% 14% 14%Expected rate of increase per annum
on future salaries 13% 13% 13% 13%
Pension Fund Gratuity Fund
34.8 Plan assets comprise of following:
2009 2008 2009 2008
Equity 36,329 25,754 11,323 14,402Debt 47,848 25,754 13,809 6,110Others 4,430 22,074 2,486 1,309
88,607 73,582 27,618 21,821
Pension Fund Gratuity Fund
Rupees
34.9 The expected return on plan assets was determined by considering the expected returns available on theassets underlying the current investment policy. Expected yields on fixed interest investments are basedon gross redemption yields as at the balance sheet date.
2009 2008 2007 2006 2005
Pension Fund
Present value of defined
benefit obligation 78,994 68,644 53,267 44,310 34,760
Fair value of plan assets (88,607) (73,582) (62,237) (47,516) (34,861)
(Surplus) / Deficit (9,613) (4,938) (8,970) (3,206) (101)
Gratuity Fund
Present value of defined
benefit obligation 26,048 22,888 19,600 16,145 12,784
Fair value of plan assets (27,618) (21,821) (21,742) (15,665) (12,870)
(Surplus) / Deficit (1,570) 1,067 (2,142) 480 (86)
Rupees
34.10 Historical information of staff retirement benefits:

NOTES TO THE CONSOLIDATED FINANCIAL STATEMENTSFOR THE YEAR ENDED DECEMBER 31, 2009
157Annual Report 2009
(Amounts in thousand)
34.11 During the year, Rs. 22,620 (2008: Rs. 8,658) has been recognized in the profit and loss account in respect
of defined contribution provident fund.
35. REMUNERATION OF CHIEF EXECUTIVE AND EXECUTIVES
The aggregate amounts charged in the financial statements for remuneration to Chief Executive andexecutives are as follows:
Chief Executives Chief ExecutivesExecutive Executive
Managerial remuneration 12,538 241,176 11,076 184,954
Retirement benefit funds 1,355 9,159 1,579 10,955
Bonus paid - - 5,366 40,999
Employee share option scheme 986 2,850 1,229 4,218
Other benefits 1,425 21,392 1,318 17,565
Total 16,304 274,577 20,568 258,691
Number of persons 1 141 1 121
2009 2008
Rupees
35.1 The Company also provides household items and vehicles for the use of Chief Executive andcertain executives.
36. CASH GENERATED FROM OPERATIONS
(Loss) / Profit before taxation (197,137) 455,596Adjustments for non cash charges
and other items:Provision for staff retirement and
other service benefits 10,769 14,898Provision against custom duty refundable - 18,043
Depreciation 509,198 185,460Amortization 3,701 749Amortization of deferred employee share
compensation expense 3,836 5,477Provision for slow moving stores and spares 3,867 -Income on short term investments and bank deposits (63,869) (46,643)Gain realized on sale of short term investments (36,693) (69,879)Provision against SED 15,565 91,616Finance costs 602,141 33,532Interest accrued on Workers' Profits
Unrealized gain4,034 -
Profit on disposal of operating assets (1,619)1,048,466
Working capital changes - note 36.1 691,321
1,542,650
Participation Fund(2,464)
(349)235,257(30,707)
660,146
2,353
2008
Rupees
2009(Restated)

NOTES TO THE CONSOLIDATED FINANCIAL STATEMENTSFOR THE YEAR ENDED DECEMBER 31, 2009
158Annual Report 2009
(Amounts in thousand)
2008Rupees
2009
38.2 Financial liabilities as per balance sheet
Financial liabilities measured atamortized cost
Long term borrowings 11,135,163 7,973,072Derivative financial instruments 19,935 60,154Retention money against project payments - 553,445Retirement and other service benefit obligations 38,312 38,500Current portion of long term borrowings 1,016,393 130,000Trade and other payables 2,574,361 1,358,760Accrued interest/mark-up 205,772 167,268Short term borrowings 594,241 842,568
15,584,177 11,123,767
38.
38.1
FINANCIAL INSTRUMENTS BY CATEGORY
Financial assets as per balance sheet
At fair value through profit and lossShort term investments 61,398 43,648
Loans and receivablesLong term loans and advances 47,475 107,785Trade debts - considered good 439,905 69,514Loans, advances, deposits, and other receivables 94,142 94,071Cash and bank balances 217,531 99,385
860,451 414,403
36.1 Working capital changes
(Increase) / Decrease in current assets
Stores and spares (69,477) (31,433) Stock-in-trade (445,965) (239,334) Trade debts (370,391) 108,958
Loans, advances, deposits, prepaymentsand other receivables (net) (109,860) (95,550)
(795,693) (257,359)Increase in current liabilities
Trade and other payables 1,487,014 226,652
691,321 (30,707)
37. CASH AND CASH EQUIVALENTS
Cash and bank balances - note 12 217,531 99,385Short term borrowings - note 22 (394,241) (842,568)
(176,710) (743,183)
Short term finance 200,000 -
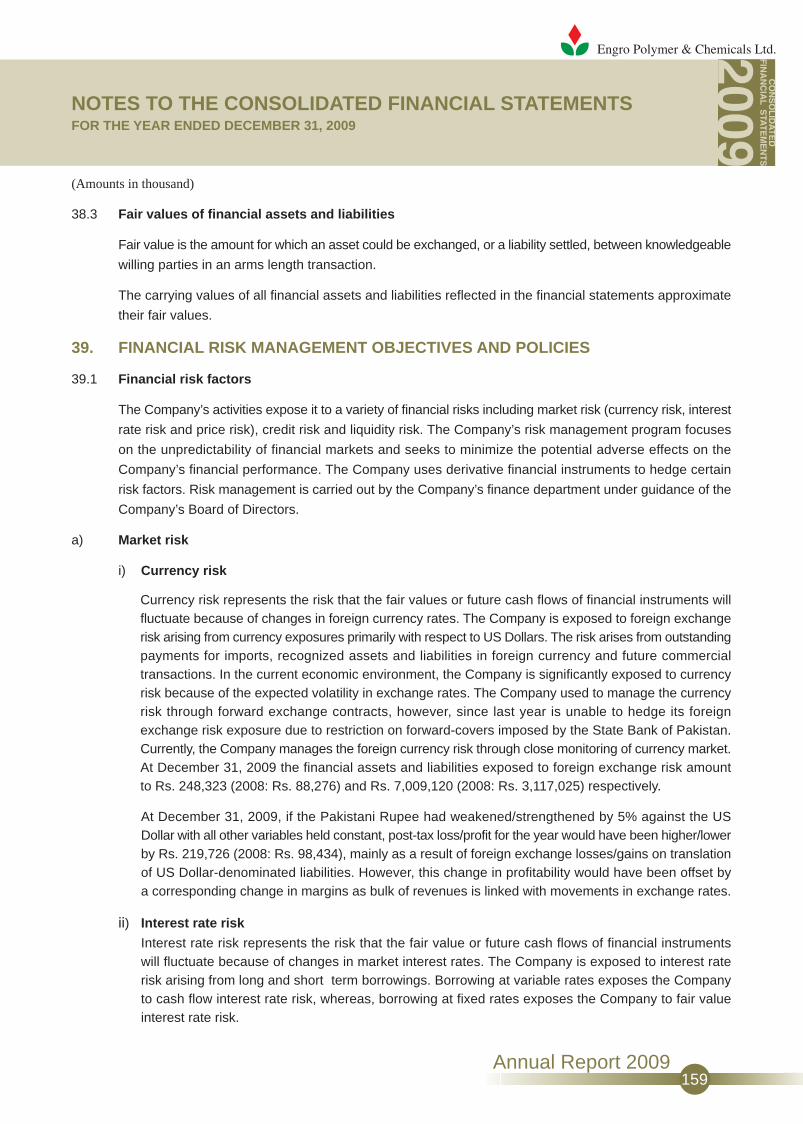
NOTES TO THE CONSOLIDATED FINANCIAL STATEMENTSFOR THE YEAR ENDED DECEMBER 31, 2009
159Annual Report 2009
(Amounts in thousand)
38.3 Fair values of financial assets and liabilities
Fair value is the amount for which an asset could be exchanged, or a liability settled, between knowledgeable
willing parties in an arms length transaction.
The carrying values of all financial assets and liabilities reflected in the financial statements approximate
their fair values.
39. FINANCIAL RISK MANAGEMENT OBJECTIVES AND POLICIES
39.1 Financial risk factors
The Company’s activities expose it to a variety of financial risks including market risk (currency risk, interest
rate risk and price risk), credit risk and liquidity risk. The Company’s risk management program focuses
on the unpredictability of financial markets and seeks to minimize the potential adverse effects on the
Company’s financial performance. The Company uses derivative financial instruments to hedge certain
risk factors. Risk management is carried out by the Company’s finance department under guidance of the
Company’s Board of Directors.
a) Market risk
i) Currency risk
Currency risk represents the risk that the fair values or future cash flows of financial instruments willfluctuate because of changes in foreign currency rates. The Company is exposed to foreign exchangerisk arising from currency exposures primarily with respect to US Dollars. The risk arises from outstandingpayments for imports, recognized assets and liabilities in foreign currency and future commercialtransactions. In the current economic environment, the Company is significantly exposed to currencyrisk because of the expected volatility in exchange rates. The Company used to manage the currencyrisk through forward exchange contracts, however, since last year is unable to hedge its foreignexchange risk exposure due to restriction on forward-covers imposed by the State Bank of Pakistan.Currently, the Company manages the foreign currency risk through close monitoring of currency market.At December 31, 2009 the financial assets and liabilities exposed to foreign exchange risk amountto Rs. 248,323 (2008: Rs. 88,276) and Rs. 7,009,120 (2008: Rs. 3,117,025) respectively.
At December 31, 2009, if the Pakistani Rupee had weakened/strengthened by 5% against the USDollar with all other variables held constant, post-tax loss/profit for the year would have been higher/lower
by Rs. 219,726 (2008: Rs. 98,434), mainly as a result of foreign exchange losses/gains on translationof US Dollar-denominated liabilities. However, this change in profitability would have been offset bya corresponding change in margins as bulk of revenues is linked with movements in exchange rates.
ii) Interest rate risk
Interest rate risk represents the risk that the fair value or future cash flows of financial instrumentswill fluctuate because of changes in market interest rates. The Company is exposed to interest raterisk arising from long and short term borrowings. Borrowing at variable rates exposes the Companyto cash flow interest rate risk, whereas, borrowing at fixed rates exposes the Company to fair valueinterest rate risk.
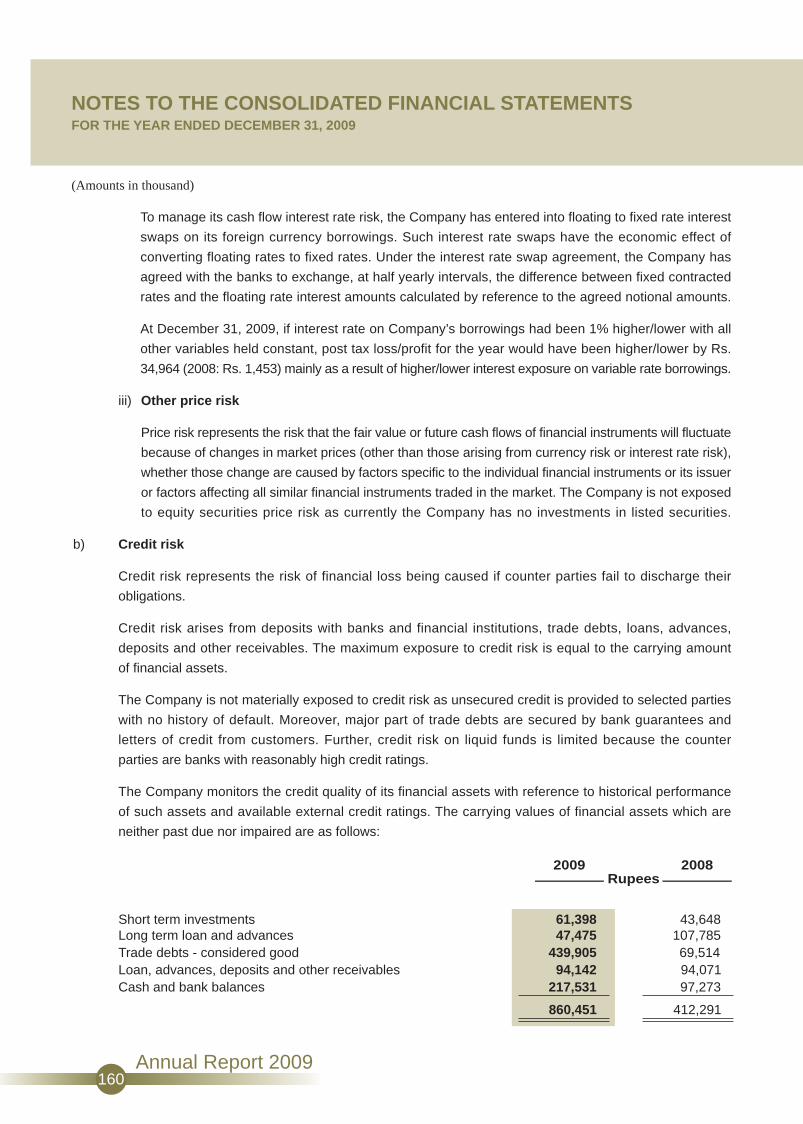
NOTES TO THE CONSOLIDATED FINANCIAL STATEMENTSFOR THE YEAR ENDED DECEMBER 31, 2009
160Annual Report 2009
(Amounts in thousand)
To manage its cash flow interest rate risk, the Company has entered into floating to fixed rate interest
swaps on its foreign currency borrowings. Such interest rate swaps have the economic effect of
converting floating rates to fixed rates. Under the interest rate swap agreement, the Company has
agreed with the banks to exchange, at half yearly intervals, the difference between fixed contracted
rates and the floating rate interest amounts calculated by reference to the agreed notional amounts.
At December 31, 2009, if interest rate on Company’s borrowings had been 1% higher/lower with all
other variables held constant, post tax loss/profit for the year would have been higher/lower by Rs.
34,964 (2008: Rs. 1,453) mainly as a result of higher/lower interest exposure on variable rate borrowings.
iii) Other price risk
Price risk represents the risk that the fair value or future cash flows of financial instruments will fluctuate
because of changes in market prices (other than those arising from currency risk or interest rate risk),
whether those change are caused by factors specific to the individual financial instruments or its issuer
or factors affecting all similar financial instruments traded in the market. The Company is not exposed
to equity securities price risk as currently the Company has no investments in listed securities.
b) Credit risk
Credit risk represents the risk of financial loss being caused if counter parties fail to discharge their
obligations.
Credit risk arises from deposits with banks and financial institutions, trade debts, loans, advances,
deposits and other receivables. The maximum exposure to credit risk is equal to the carrying amount
of financial assets.
The Company is not materially exposed to credit risk as unsecured credit is provided to selected parties
with no history of default. Moreover, major part of trade debts are secured by bank guarantees and
letters of credit from customers. Further, credit risk on liquid funds is limited because the counter
parties are banks with reasonably high credit ratings.
The Company monitors the credit quality of its financial assets with reference to historical performance
of such assets and available external credit ratings. The carrying values of financial assets which are
neither past due nor impaired are as follows:
2008Rupees
2009
Long term loan and advances 47,475 107,785Trade debts - considered good 439,905 69,514Loan, advances, deposits and other receivables 94,142 94,071Cash and bank balances 217,531 97,273
860,451 412,291
Short term investments 61,398 43,648

NOTES TO THE CONSOLIDATED FINANCIAL STATEMENTSFOR THE YEAR ENDED DECEMBER 31, 2009
161Annual Report 2009
(Amounts in thousand)
The credit quality of receivables can be assessed with reference to their historical performance with
no defaults in recent history. The credit quality of the Company’s liquid funds can be assessed with
reference to external credit ratings of banks as follows:
BankShort term Long term
Allied Bank Limited AA A1+Askari Commercial Bank Limited AA A1+Bank AlFalah Limited AA A1+Bank AlHabib AA A1+Barclays Bank A1+ AA+Citibank A1+ AA+Deutsche Bank A2 ADubai Islamic Bank Pakistan Limited AA A1+Faysal Bank Limited AA A1+Habib Bank Limited AA+ A1+HSBC Bank Middle East Limited A1+ AAMCB Bank Limited AA+ A1+Meezan Bank Limited A+ A1National Bank of Pakistan AA+ A1+NIB Bank Limited AA- A1+Samba Bank Limited A AStandard Chartered Bank (Pakistan) AAA A1+United Bank Limited AA+ A1+
Rating
c) Liquidity risk
Liquidity risk represents the risk that the Company will encounter difficulties in meeting obligationsassociated with financial liabilities. The Company’s liquidity management involves maintaining sufficient cashand marketable securities, the availability of funds through an adequate amount of credit facilities and throughits ability to close out market positions. Due to the dynamic nature of the business, the Company aims at
maintaining flexibility in funding by keeping committed credit lines available.
The table below analyses how management monitors net liquidity based on details of the remainingcontractual maturities of financial assets and liabilities. The amounts disclosed in the table are thecontractual undiscounted cash flows:
Financial liabilities
Long term borrowings 1,016,393 11,135,163 12,151,556 130,000 7,973,072 8,103,072Derivative financial instruments - 19,935 19,935 - 60,154 60,154Retention money against project
payments 801,718 - 801,718 239,033 553,445 792,478Retirement and other service
benefit obligations - 38,312 38,312 - 38,500 38,500Trade and other payables 1,772,643 - 1,772,643 1,119,727 - 1,119,727Accrued interest / mark-up 205,772 - 205,772 167,268 - 167,268Short term borrowings 594,241 - 594,241 842,568 - 842,568
4,390,767 11,193,410 15,584,177 2,498,596 8,625,171 11,123,767
2009 2008
Rupees
Maturity upto one year
Total TotalMaturity after one year
Maturity upto one year
Maturity after one year
Rating agency
PACRAPACRAPACRAPACRAS & PS & PS & PPACRAPACRAPACRAS & PPACRAPACRAPACRAPACRAPACRAS & PPACRA

NOTES TO THE CONSOLIDATED FINANCIAL STATEMENTSFOR THE YEAR ENDED DECEMBER 31, 2009
162Annual Report 2009
(Amounts in thousand)
Net settled derivatives comprise interest rate swaps used by the Company to manage the Company’s
interest rate profile. The Company’s net settled derivative financial instruments with a negative fair value
have been included at their fair value of Rs. 19,935 (2008: Rs. 60,154) in the maturity analysis because
the contractual maturities are essential for an understanding of the timing of the cash flows. These contracts
are managed on a net-fair value basis as well as maturity date.
40. CAPITAL RISK MANAGEMENT
The objective of the Company when managing capital is to safeguard its ability to continue as a going
concern and to provide expected returns to its shareholders by maintaining optimum capital structure to
minimize the cost of capital.
To maintain or adjust the capital structure, the Company may issue new equity, manage dividend payouts
to its shareholders or sell assets to reduce debt.
The Company manages capital by maintaining gearing ratio at certain levels. This ratio is calculated as
long term borrowings, as disclosed in note 15, divided by total capital. Total capital is calculated as ‘equity’
as shown in the balance sheet plus long term borrowings.
The gearing ratio at December 31, 2008 and 2009 was as follows:
2008Rupees
2009
Long term borrowings - note 15 11,135,163 7,973,072
Total equity 6,395,643 6,563,742
Total capital 17,530,806 14,536,814
Gearing ratio 0.635 0.548
41. SEGMENT INFORMATION
During the year, on August 1, 2009, the Company declared commercial production of Caustic soda and
also commenced supply of surplus power to KESC. Therefore, based on the internal management reporting
structure, the Company is organized into three business segments based on the products produced and
sold as follows:
- Poly Vinyl Chloride (PVC) and allied chemicals;
- Caustic soda and allied chemicals; and
- Power supplies.

NOTES TO THE CONSOLIDATED FINANCIAL STATEMENTSFOR THE YEAR ENDED DECEMBER 31, 2009
163Annual Report 2009
(Amounts in thousand)
Management monitors the operating results of abovementioned segments separately for the purpose of
making decisions about resources to be allocated and of assessing performance. Segment performance
is evaluated based on operating profit or loss which in certain respects, as explained in table below, is
measured differently from profit or loss in the financial statements. Segment results and assets include
items directly attributable to a segment as well as those that can be allocated on a reasonable basis.
Finance cost, other operating income and expenses, and taxation are managed at Company level. Further,
unallocated assets include long term investment, long term loan and advances, loans, advances, prepayments
and other receivables, taxes recoverable, deferred employee share compensation expense, short term
investments, and cash and bank balances.
The following table presents the profit or loss and total assets for the operating segments of the Company:
Poly Vinyl Caustic Power
Chloride (PVC) soda and supply
Total
and allied allied
chemicals chemicals
Revenue 10,518,301 928,528 185,279 11,632,108
Profit or loss before
unallocated expenses 468,403 192,809 69,158 730,370
Unallocated expenses
Administrative expenses (205,742)
Other operating expenses (232,011)
Other operating income 116,422
Finance costs (606,175)
Taxation 3,441
Loss after taxation (193,695)
Total segment assets 13,190,511 6,368,873 132,333 19,691,717
Unallocated assets 3,107,778
Total assets as per the balance sheet 22,799,495
2009
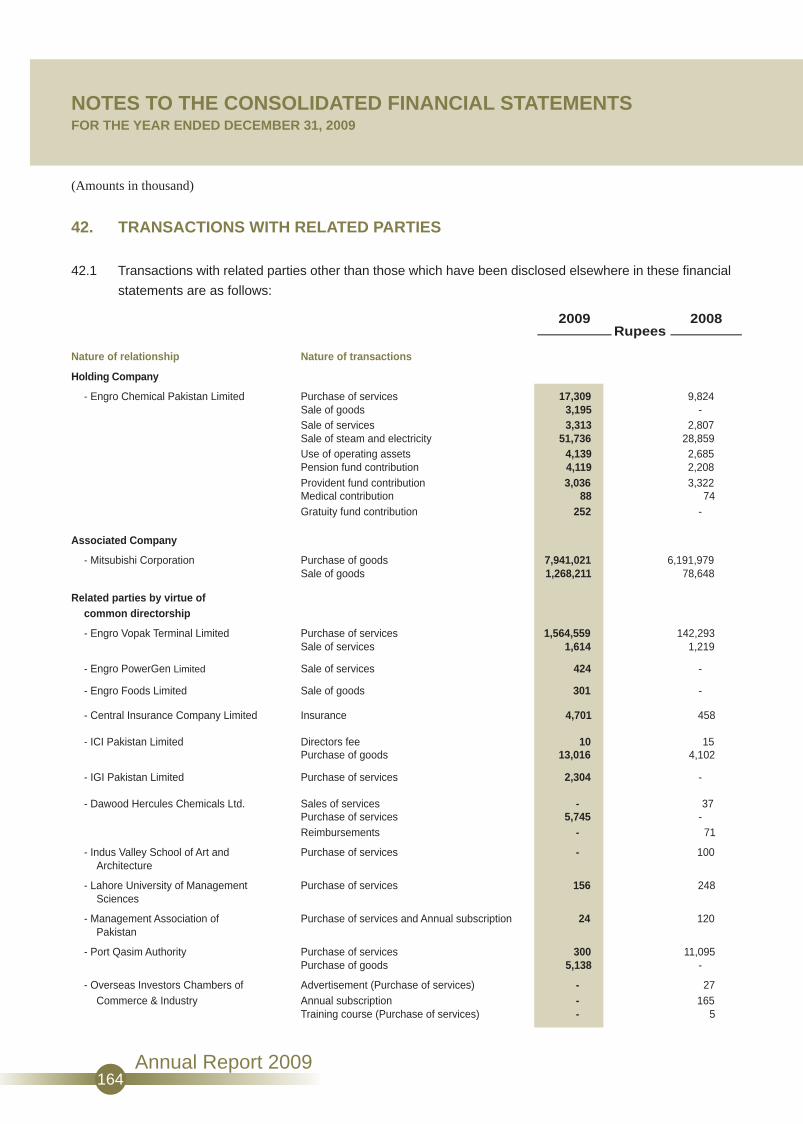
NOTES TO THE CONSOLIDATED FINANCIAL STATEMENTSFOR THE YEAR ENDED DECEMBER 31, 2009
164Annual Report 2009
(Amounts in thousand)
42. TRANSACTIONS WITH RELATED PARTIES
42.1 Transactions with related parties other than those which have been disclosed elsewhere in these financial
statements are as follows:
Nature of relationship Nature of transactions
Holding Company
- Engro Chemical Pakistan Limited Purchase of services 17,309 9,824Sale of goods 3,195 -Sale of services 3,313 2,807Sale of steam and electricity 51,736 28,859Use of operating assets 4,139 2,685Pension fund contribution 4,119 2,208Provident fund contribution 3,036 3,322Medical contribution 88 74Gratuity fund contribution 252 -
Associated Company
- Mitsubishi Corporation Purchase of goods 7,941,021 6,191,979Sale of goods 1,268,211 78,648
Related parties by virtue ofcommon directorship
- Engro Vopak Terminal Limited Purchase of services 1,564,559 142,293Sale of services 1,614 1,219
- Engro PowerGen Limited Sale of services 424 -
- Engro Foods Limited Sale of goods 301 -
- Central Insurance Company Limited Insurance 4,701 458
- ICI Pakistan Limited Directors fee 10 15Purchase of goods 13,016 4,102
- IGI Pakistan Limited Purchase of services 2,304 -
- Dawood Hercules Chemicals Ltd. Sales of services - 37Purchase of services 5,745 -Reimbursements - 71
- Indus Valley School of Art and Purchase of services - 100Architecture
- Lahore University of Management Purchase of services 156 248Sciences
- Management Association of Purchase of services and Annual subscription 24 120Pakistan
- Port Qasim Authority Purchase of services 300 11,095Purchase of goods 5,138 -
- Overseas Investors Chambers of Advertisement (Purchase of services) - 27Commerce & Industry Annual subscription - 165
Training course (Purchase of services) - 5
2008Rupees
2009

NOTES TO THE CONSOLIDATED FINANCIAL STATEMENTSFOR THE YEAR ENDED DECEMBER 31, 2009
165Annual Report 2009
(Amounts in thousand)
Nature of relationship Nature of transactions
Related parties by virtue of
common directorship
- Pakistan Institute of Corporate Purchase of services 80 -Governance
- Inbox Business Technologies Purchase of goods - 785(Pvt) Ltd Setup of software 150 150
- Avanceon Limited Purchase of goods 2,470 -Purchase of services 575 409
- Actis Assets Ltd. Directors fee - 5
- UBL Funds Investments in liquidity funds 100,000 -
Directors fee 175 -
Key management personnel Managerial remuneration 52,181 47,046Retirement benefit funds 3,963 4,177Bonus - 18,052Employee share option scheme 2,542 2,577Other benefits 4,381 4,155
42.2 Sales, purchases and other transactions with related parties are carried out on commercial terms and
conditions.
42.3 The related party status of outstanding balances as at December 31, 2009 are disclosed in the respective
notes.
43. PRODUCTION CAPACITY
43.1 Commencement of commercial production of the new PVC plant was from January 1, 2009 and that of
Chlor-alkali plant was from August 1, 2009.
2009 2008 2009 2008
PVC resin 150,000 100,000 115,620 98,660
Caustic soda 106,000 - 38,739 - Note - 43.1
Designed ActualProduction Remarks
Metric tons
Annual Capacity
Production planned asper market demand
2008Rupees
2009

NOTES TO THE CONSOLIDATED FINANCIAL STATEMENTSFOR THE YEAR ENDED DECEMBER 31, 2009
166Annual Report 2009
(Amounts in thousand)
44. CORRESPONDING FIGURES
For better presentation, the following major reclassification in the corresponding figures has been made:
Head of account in thefinancial statements for theyear ended December 31, 2009
Net revenue - note 25
Head of account in thefinancial statements for theyear ended December 31, 2008
Other operating income - note 30
Description
Supply of electricity
Rupees
20,843
The effect of other reclassifications is not material.
45. DATE OF AUTHORIZATION FOR ISSUE
These financial statements were authorized for issue on January 21, 2010 by the Board of Directors of
the Company.
Asif QadirPresident & Chief Executive
Masaharu DomichiDirector

Proxy Form
(Signature should agree with the specimen
signature registered with the Company)
Notes:
i) Proxies in order to be effective, must be received by the Company not less than 48 hours before the Meeting. AProxy need not be a member of the Company.
ii) CDC Shareholders and their Proxies are each requested to attach an attested photocopy of their ComputerizedNational Identity Card or Passport with this proxy before submission to the Company.
iii) The proxy shall produce his original CNIC or original passport at the time of the meeting.
iv) In case of corporate entity, the Board of Directors resolution / power of attorney with specimen signature shall be submitted (unless it has been provided earlier) along with proxy form to the Company.
CNIC or
Passport No.
2. Signature
Name
Address
RevenueStampSignature
1. Signature
Name
Address
CNIC or
Passport No.
I/We
of being a member of Engro Polymer & Chemicals Ltd.
and holder of Ordinary Shares as per Share(Number of Shares)
Register Folio No. and/or CDC Participant I. D. No. and Sub Account No.
hereby appoint of
or failing him
of
as my proxy to vote for me and on my behalf at the Annual General Meeting of the Company to be held on the
9th day of April, 2010 and at any adjournment thereof.
Signed this day of 2010.
WITNESSES:
