contents€¦ · 1 deselection criteria for existing priority substances based on ste assessment...
TRANSCRIPT

1
Deselection criteria for existing Priority Substances based on STE assessment method
Contents 1. Data quality required for the deselection of existing priority substances.................................................................. 2
2. Criteria for deselection ............................................................................................................................................... 2
3. Identification of priority substances fulfilling criteria 1 .............................................................................................. 4
4. List of priority substances that could be proposed for deselection ........................................................................... 6
5. Detailed analysis for the substances that fulfil the deselection criteria ..................................................................... 7
5.1. Simazine .................................................................................................................................................................. 8
5.2. Alachlor ................................................................................................................................................................. 13
5.3. Chlorfenvinphos .................................................................................................................................................... 17
6. Questions to the WG Chemicals ............................................................................................................................... 22
Annex .................................................................................................................................................................................... 23
7. Comments on the criteria for deselection ................................................................................................................ 23
8. Examples of PS (or "other pollutants") with very low STE score which do not fulfil criteria 2 or 3 ......................... 26
8.1. Atrazine ................................................................................................................................................................. 26
8.2. Benzene ................................................................................................................................................................. 29
8.3. 1,2-Dichloroethane ............................................................................................................................................... 32
8.4. Diuron ................................................................................................................................................................... 35
8.5. Isoproturon ........................................................................................................................................................... 38
8.6. Trichlorobenzenes ................................................................................................................................................. 41
8.7. Carbon tetrachloride (tetrachloromethane) ......................................................................................................... 43
8.8. Tetrachloroethylene ............................................................................................................................................. 46
8.9. Trichloroethylene .................................................................................................................................................. 49

2
1. Data quality required for the deselection of existing priority substances
It is important to base the deselection of an existing priority substance (PS) on a comprehensive dataset, to avoid
overlooking ongoing issues in certain Member States. In this regard, the data gathered by the JRC for the review of the
list of priority substances1 may need to be complemented for certain substances, for which monitoring data are missing
for several Member States.
2. Criteria for deselection
The substances are considered for deselection if they belong to the list of priority substances (and 8 "other pollutants")
identified by Directive 2008/105/EC, to be monitored preferentially in water according to Directive 2013/39/EU.
The following substances will not be considered for deselection, as the full picture of contamination at EU level, in the
relevant matrix, will only be available at the end of the second or third river-basin management plan:
- Priority substances recently added to the list by Directive 2013/39/EU,
- Priority substances listed under Directive 2008/105/EC, for which the preferred monitoring matrix in Directive
2013/39/EU is biota,
- Priority hazardous substances (PHS). For PHS, the objectives of the WFD include not only reaching good status, but also
phasing out emissions, discharges and losses. More information would be needed to check whether this last
requirement has been fulfilled, before PHS can be considered for deselection.
Priority substances will be considered for deselection if they do not pose a significant risk at EU level, and if the risk they
pose is not likely to increase significantly as a result of their deselection. This is reflected in the criteria below.
Priority Substances could be considered for deselection if they fulfil all of the following criteria:
1. STE score is below 0.6 (see Table 1) according to the STE run for Scenario2–PNEC-QC for whole water for
organic substances or dissolved phase for metals. A STE score of < 0.6 is taken to indicate a very low risk
to/via the aquatic environment2. Before calculating the STE score, a check should be made of whether the
EQS needs to be revised, and the STE score should be implemented based on the updated EQS.3
2. The substance is measured in more than (≥) 20 countries (Scenario2-PNEC-QC) and the number of countries
with observed EQS exceedances is equal or less than (≤) 4.
1 In the course of gathering data for the selection of new priority substances, the JRC asked MS for data on existing priority substances; these data were used e.g. to test the methodology for the prioritisation. 2 See document summarising the monitoring and modelling methodologies, or full report : Raquel Negrão Carvalho, Dimitar Marinov, Robert Loos, Dorota Napierska, Nicola Chirico, Teresa Lettieri. “Monitoring-based Exercise: Second Review of the Priority Substances List under the Water Framework Directive”. Report: https://circabc.europa.eu/w/browse/52c8d8d3-906c-48b5-a75e-53013702b20a 3 After a comparison of the RQ and STE score for non-PS, it appeared that in some rare cases, the RQ can be above one while the STE score is below 0.6. Obviously we wouldn't want to deselect PS with a RQ above one so the JRC checked and concluded that for all substances considered here, when the STE score was below 0.6, the RQ was also below 1.

3
3. The substance is banned in the EU, and the ban is not likely to be lifted soon. The substance shows a
temporal decrease in measured mean concentrations or at least no upward trend neither in mean
concentrations nor in the number of exceedances.
Table 1. Risk classification based on STE score (Carvalho, et al. 2016, draft report on Monitoring based exercise).
STE score Risk classification Risk rank
≥ 2.4 and ≤3 Very high 1
≥ 1.8 and < 2.4 High 2
≥ 1.2 and < 1.8 Intermediate 3
≥ 0.6 and < 1.2 Low 4
< 0.6 Very low 5
In some cases, there might still be illegal use of banned substances in some European countries, which could be shown
by almost stable concentrations (for instance annual means) in the monitoring data. Even banned substances that are no
longer used may still be circulating in the environment, and measures to avoid their continued circulation/emission from
one compartment to another (e.g. sediments, soils, groundwater) might be implementable. It may still be necessary to
list/retain such substances to ensure that such measures are taken, including decontamination if necessary. This more
in-depth assessment can only be done once the criteria above have been implemented.
Limitations in trend analysis :
The observed trend in annual mean concentrations could be influenced by the variability in the number of samples,
stations, and countries per year inherent to the dataset. However, it was not possible to identify a clear link between the
number of samples and the mean concentration (see examples provided in section 5 and the annex), nor to detect an
impact of the other factors.
In addition to this, the rainfall can impact the concentrations found in the environment, and thus the observed trend,
by :
- increasing river discharge leading to more dilution (and vice versa)
- increasing or decreasing the amount released to the environment (e.g. for pesticides).
During the 5th SG-R meeting, the experts suggested not to consider the rainfall due to the difficulties to collect the data overall Europe. In this document, for two of the substances proposed for deselection, the data of the annual mean precipitation are shown, however no the correlation with the mean concentration was observed.
When deciding on the deselection of a substance, it is also necessary to assess whether the substance has been
monitored with analytical methods with appropriate LOQs. If not, the monitoring data will not show a full picture of the
risk linked to the substance.

4
3. Identification of priority substances fulfilling criteria 1
In accordance with section 2, the PS and groups of PS considered below are substances to be monitored in the water
compartment, that have not been added by Directive 2013/39/EU, and that are not PHS. This section identifies the PS
and groups of PS fulfilling criteria 1 (STE score <0.6) in the inland whole water compartment. Additional information is
also given on whether the substance is approved or not.
Inland whole water
Table 1: Identification of priority substances from compartment inland whole water with a very low STE score < 0.6
based on the 95th percentile (P95) concentrations (i.e. fulfilling criteria 1). The table shows also: EQS (µg/L), number of
countries with exceedances (by P95 and max concentration), total number of countries with measurements (Sc2-
PNECQC and Sc2) and RQ(P95).
CAS Substance
# in the list of PS STE
EQS (µg/L) Use status
# Countries with exceedances (P95)
# Countries with exceedances (max)
# Countries (Sc2-PNECQC)
# Countries (Sc2)
RQ (P95)
#15972-60-8 Alachlor 1 0.122 0.3
Not approved in Europe since 2012 1 4 20 21 0.05
#1912-24-9 Atrazine 3 0.274 0.6
Not approved in Europe since 2008 1 11 24 24 0.05
#71-43-2 Benzene 4 0.000 10 Approved 0 1 20 20 0.05
#470-90-6 Chlorfenvinphos 8 0.000 0.1
Not approved in Europe since 2013; also banned in the US 0 5 22 23 0.13
#2921-88-2 Chlorpyrifos/Chlorpyrifos ethyl 9 0.286 0.03 Approved 1 10 21 23 0.50
#107-06-2 1,2-Dichloroethane 10 0.000 10 Approved 0 5 21 21 0.05
#75-09-2 Dichloromethane 11 0.061 20 Approved 1 8 21 21 0.15
#330-54-1 Diuron 13 0.000 0.2 Approved 0 12 23 24 0.27
#34123-59-6 Isoproturon 19 0.069 0.3
Not approved in Europe since 2014 1 12 24 24 0.21
#140-66-9 Octylphenols 25 0.065 0.1 Approved 1 10 17 17 0.5
#122-34-9 Simazine 29 0.000 1
Not approved in Europe since 2012 0 4 24 24 0.03
#12002-48-1 Trichlorobenzenes 31 0.000 0.4 Approved 0 9 20 20 0.63
#67-66-3 Trichlorometane (Chloroform) 32 0.143 2.5 Approved 1 14 21 21 0.2
#56-23-5 Carbon tetrachloride (Tetrachloromethane) 6a 0.000 12 Approved 0 0 20 20 0.04
#309-00-2 Aldrin 9a 0.000 0.01
Not approved in Europe since 2004 0 10 23 23 0.50
#465-73-6 Isodrin 9a 0.000 0.01
Not approved in Europe since 2004 0 9 19 19 1.00
#789-02-6 o,p'-DDT 9b 0.461 0.01
Not approved in Europe since 1992 1 3 14 14 0.50
#72-54-8 p,p'-DDD 9b 0.538 0.01
Not approved in Europe since 1992 1 8 14 14 0.50
#72-55-9 p,p'-DDE 9b 0.571 0.01
Not approved in Europe since 1992 1 5 16 16 0.50
#127-18-4 Tetrachloroethylene 29a 0.000 10 Approved 0 5 20 20 0.05
#79-01-6 Trichloroethylene 29a 0.000 10 Approved 0 3 21 21 0.05

5
Notes:
1. For cyclodiene pesticides (indicated as “other pollutants” in Directive 2013/39/EU under the number 9a of the PS list),
the EQS refers to the sum of the concentrations of aldrin, dieldrin, isodrin and endrin. However, in the dataset, the
concentrations of the 4 pesticides were often not available at the same station in the same moment of sampling. Thus,
so far the STE has been run for individual concentrations of these pesticides, applying the EQS intended for the sum of
concentrations. This underestimates the risk linked to the presence of the 4 pesticides. The JRC has looked again in the
dataset to see if a subset of the stations can be identified, for which the concentrations of the 4 pesticides are reported
together, however, such stations were not found. This assessment is thus not sufficient to justify a deselection of these
substances. Endrin and dieldrin have a STE score > 0.6.
2. The considerations mentioned in point 1 above also apply to o,p'DDT and p,p'-DDD (indicated as “other pollutants” in
Directive 2013/39/EU under the number 9b of the PS list); p-p’-DDT has a STE score of 0.615.
Discussion on the criteria
Some members of the SG-R suggested to consider an increase of the number of MS with exceedances (an increase from
4 to 8 was mentioned by one of the SG-R experts). A test of this proposal showed that it did not lead to the identification
of more substances for deselection so this proposal was not considered further.
Some members of the SG-R suggested using a percentile rather than the max concentration in criteria 2. A test was run
to identify the substances for which the 95th percentile concentration exceeds the EQS in more than 4MS. In addition to
the fact that the 95th percentile could be seen as overly permissive, experts highlighted, during the 6th SG-R meeting,
that more work would be needed before a decision can be made on whether it is relevant to consider these substances
for deselection. This includes a review of the status (PS/PHS) for DDT and for the cyclodiene pesticides, but also
gathering the monitoring data necessary to calculate the STE for the sum of these pesticides, and for the sum of DDT
congeners, in order to apply the group EQS as set in the EQSD. Consequently, at this stage, the SG-R proposes to focus
on the substances identified through the implementation of the criteria "the number of countries with observed EQS
exceedances is equal or less than (≤) 4".
Inland dissolved water
Table 2: Identification of of priority substances from compartment Inland water dissolved fraction with a very low STE
score < 0.6 (i.e. fulfilling criterion 1). The table also shows: EQS (µg/L), number of countries with exceedances (by P95
and max concentration), total number of countries with measurements (Sc2-PNECQC and Sc2) and RQ(P95).
CAS Substance
# in the list of PS STE
EQS (µg/L) Use status
# Countries with exceedances (P95)
# Countries with exceedances (max)
# Countries (Sc2-PNECQC)
# Countries (Sc2)
RQ (P95)
#7439-92-1 Lead and its compounds 20 0.446 1.2 Approved 7 16 21 21 1.17
#7440-02-0 Nickel and its compounds 23 0.519 4 Approved 10 16 20 20 1.25
Note: Apparently no substance from the inland dissolved could be considered for deselection since none of them fulfil
criteria 2 and 3.
6
4. List of priority substances that could be proposed for deselection
Table 3 lists the substances from inland whole water compartment which fulfil all criteria, namely:
- not added recently to Directive 2013/39/EU, not to be evaluated in biota compartment, not PHS
and
- criteria 1-3: low STE score (below 0.6); number of countries with exceedances is ≤ 4; the substance is measured in more
than (≥) 20 countries (Scenario2-PNEC-QC); the substance is banned in the EU, and the ban is not likely to be lifted soon;
the substance shows a temporal decrease in measured concentrations or at least no upward trend neither in median
concentrations nor in the number of exceedances.
Alachlor, chlorfenvinphos and simazine are banned in Europe.
Alachlor and simazine show EQS exceedances in 4 countries when considering the maximum concentrations; the
number of countries with monitoring data in sc2-PNEC-QC is 20 for alachlor and 24 for simazine.
For chlorfenvinphos, EQS exceedances were found in 5 countries. If an exception is made to this criteria it would be
possible to consider also chlorfenvinphos for deselection, because 3 of the 5 countries have only a single exceedance.
Groundwater data collected from SoE were analysed by the JRC for the three substances. For simazine, 217 groundwater
monitoring measurements (out of 71718 records in total; 0.30 %) above the groundwater limit value of 0.1 µg/L (max
1.96 µg/L) were found in the disaggregated data set of EEA from 8 countries (years 2006 – 2012). However, only 2
measurements are > 1 µg/L (and six are equal 1 µg/L). For alachlor, 8 groundwater monitoring measurements above 0.1
µg/L (max. 4 µg/L) out of 46315 monitoring records which is 0.02 % of all records, were found from two different
countries. For chlorfenvinphos only one measurements above 0.1 µg/L (0.138 µg/L ) out of 41609 monitoring records
which is 0.002 % of all records.
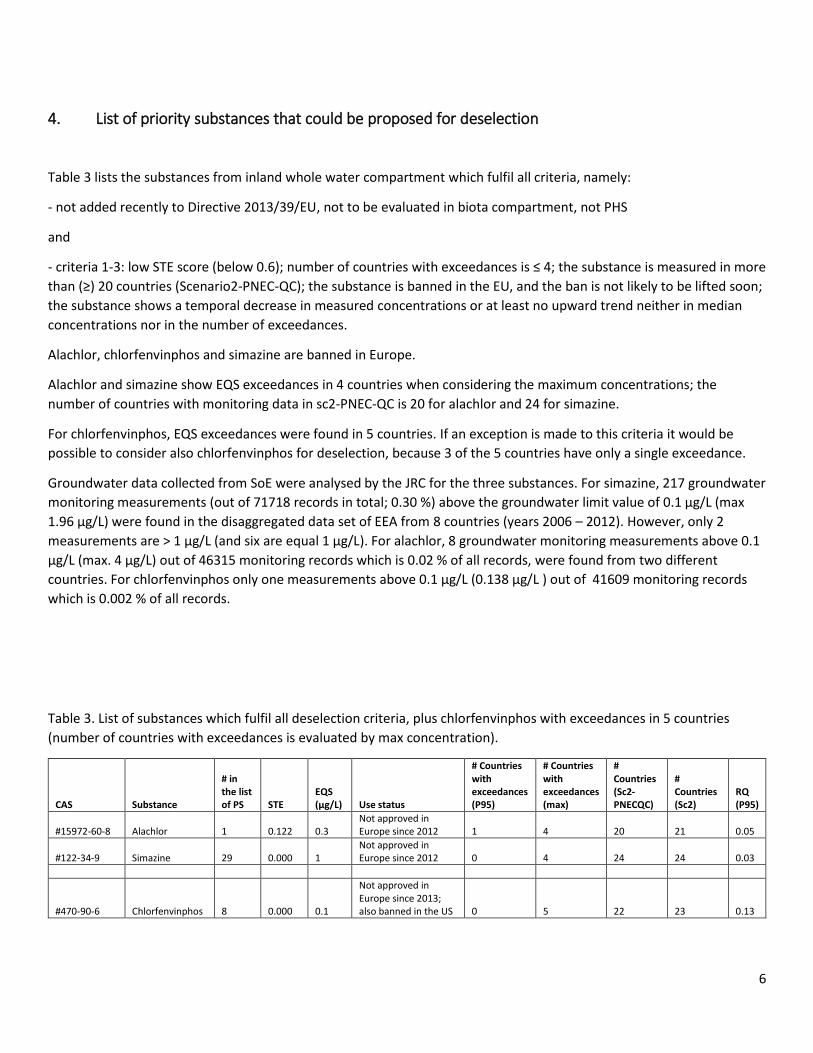
Table 3. List of substances which fulfil all deselection criteria, plus chlorfenvinphos with exceedances in 5 countries
(number of countries with exceedances is evaluated by max concentration).
CAS Substance
# in the list of PS STE
EQS (µg/L) Use status
# Countries with exceedances (P95)
# Countries with exceedances (max)
# Countries (Sc2-PNECQC)
# Countries (Sc2)
RQ (P95)
#15972-60-8 Alachlor 1 0.122 0.3 Not approved in Europe since 2012 1 4 20 21 0.05
#122-34-9 Simazine 29 0.000 1 Not approved in Europe since 2012 0 4 24 24 0.03
#470-90-6 Chlorfenvinphos 8 0.000 0.1
Not approved in Europe since 2013; also banned in the US 0 5 22 23 0.13

7
Addidtional monitoring data from missing Member States
For the proposed substances alachlor, simazine and chlorfenvinphos the JRC tried to collect additional monitoring data
from missing EU member states. The monitoring data from EEA (waterbase water quality) were again downloaded in
November 2016 (including the disaggregated csv data files this time) from the web site:
http://www.eea.europa.eu/data-and-maps/data/waterbase-water-quality.
The data for alachlor, simazine and chlorfenvinphos were extracted with the help of R software. For simazine and
chlorfenvinphos aggregated monitoring data were found for one additional country and no exceedance was reported for
simazine, while for chlorfenvinphos one EQS exceedance was present for one lake monitoring station, with a maximum
concentration of 0.13 µg/L in 2010. Data for chlorfenvinphos are shown below.
Year 2010
# of samples 3
Min concentration (µg/L) 0.0033
Mean value (µg/L) 0.0455
Max concentration (µg/L) 0.13
Monitoring data were not available for certain countries. It order to finalise a decision on the deselection of these
substances, it would be necessary to understand first the reason for this lack of data available to the JRC (was the
monitoring data not reported to the EEA, nor to the JRC? Was the substance deemed not relevant in the country – and
on which basis - and thus not monitored? Were there other reasons?).
5. Detailed analysis for the substances that fulfil the deselection criteria
A detailed analysis was performed for the substances that fulfil the criteria 1-3 for the monitoring data from inland
whole water.
In descriptive statistics, a box-plot is a convenient way of graphically depicting groups of numerical data through their
quartiles. Box-plots may also have lines extending vertically from the boxes (whiskers) indicating variability outside the
upper and lower quartiles, hence the terms box-and-whisker plot and box-and-whisker diagram. Outliers may be plotted
as individual points. The spacings between the different parts of the box indicate the degree of dispersion (spread) and
skewness in the data, and show outliers. The bottom and top of the box are always the first and third quartiles, and the
band inside the box is always the second quartile (the median) ( McGill, Robert; et al. 1978)
Note: Attention should be paid to the fact that for some substances the Fspatial (spatial factor in STE method) could
become null since the country term of exceedances based on 95-percentile of concentrations is zero. In addition,
following the decisions of the 5th meeting of the SG-R (June 2016), the Temporal and Extent STE factors are synchronized
with Fspatial (when Fspat=0 then automatically Ftemp=0 and Fext=0). For this reason, some exceedances may exist
occasionaly, while the STE score is equal to 0. The boxplots in this document show all data for Inland Whole water Sc2-
PNECQC (including max concentrations; without any data filtering).

8
5.1. Simazine
The results shown below refer to data for inland whole water in Scenario 2 – PNECQC (indicated as InlWh_Sc2-PNECQC).
STE assessment results: spatial, temporal and extent factors, STE score, risk rank, and AA-EQS (µg/L).
STE additional information: Fspatial (site and country frequency of exceedances found by P95 and max concentration),
Fextent (extent of exceedance by Risk Quotient P95) and Frequency of samples with exceedances (from total number of
samples).
Data statistics: Number of countries with measurements, number of sites with measurements, total number of samples,
number of samples with concentration below LOD, number of samples with concentration below LOQ, and aggregate
percentage of quantified records (> LOD/Q).
Countries Sites Samples Samples < LOD Samples < LOQ % quantified
Sc2-PNEC-QC 24 4598 104126 5347 94484 4.12
Sc2 24 4667 105476 6139 95042 4.07
Statistics for concentrations of all measurements: min, average (mean), standard deviation (SD), median, percentiles (25,
75, 90, 95, 99) and max (µg/L).
min mean SD median P25 P75 P90 P95 P99 max
0.000005 0.01105 0.03820 0.005 0.005 0.01 0.0139 0.025 0.15 6.3
The range of LODs in sc2-PNEC-QC is from 0.001 to 0.75 µg/L (average 0.107 µg/L) :
The range of LOQs in sc2-PNEC-QC is from 0.00001 to 1 µg/L (average 0.0652 µg/L):
CAS Fspat Ftemp Fext STE score Risk Substance # in the PS list PNEC
#122-34-9 0 0 0 0 5 Simazine 29 1
site_freq_P95 site_freq_max country_freq_P95 country_freq_max EXC_extent EXC_samples_freq
8.70E-04 1.96E-03 0.00E+00 1.67E-01 6.03E-02 8.64E-05
0.001 0.0015 0.002 0.0025 0.003 0.004 0.00425 0.005 0.006 0.008 0.01 0.018 0.02 0.025 0.03 0.05 0.1 0.5 0.6 0.75
Range of LOD (µg/L)
1.00E-05 5.00E-04 0.001 0.00125 0.0015 0.002 0.0025 0.003 0.00325 0.0035 0.004 0.00447 0.005 0.0051 0.0052 0.0058 0.006
0.0067 0.0068 0.00694 0.007 0.008 0.0083 0.0089 0.009 0.0098 0.01 0.0105 0.015 0.018 0.02 0.0225 0.025 0.03
0.035 0.04 0.045 0.05 0.06 0.08 0.09 0.1 0.11 0.12 0.19 0.2 0.3 0.5 1
Range of LOQ (µg/L)

9
The boxplot displaying concentrations per year shows variable concentrations (medians) but it seems that there is a
slight decrease in the measured concentrations across Europe. The number of samples per year is given in a separate
table. Due to the low number of exceedance, no temporal trend in this number of exceedances is observed.
Year 2006 2007 2008 2009 2010 2011 2012 2013 2014 2015
# samples 14593 13367 8339 16459 10689 13868 23480 2831 499 1
Although the annual mean concentrations tend to vary over time (2015 was excluded since there is only one sample),
the trend-line based on the mean concentrations per year shows a slight downward tendency. In addition an inverse
correlation with the annual mean precipitation (probably with a lag up to one year) could be expected (see the figure
below). However, this is not enough to explain the observed variability of the annual mean concentrations.

10
Annual mean rain found by the aggregation of yearly precipitation data for the countries abundant of chemical samples
taking into account an appropriate weighting according to the countries’ territory. However this information should be
carefully considered because no clear correlation is observed.
Boxplot of concentrations of all measurements per country (the table below indicates the number of samples per
country). There is a low number of countries with a few EQS exceedances (4 out of 24) in line with its zero Fspatial
factor.
0
0.002
0.004
0.006
0.008
0.01
0.012
0.014
0.016
0.018
0.02
2005 2006 2007 2008 2009 2010 2011 2012 2013 2014 2015
Simazine: annual mean concentration (µg/L)
650
700
750
800
850
2004 2005 2006 2007 2008 2009 2010 2011 2012 2013 2014 2015
Annual mean precipitation (mm/year)

11
Country #01 #02 #03 #04 #05 #06 #07 #08 #11 #12 #13 #15
# samples 5675 474 116 421 257 8563 4861 397 298 62931 3697 771
Country #16 #17 #19 #20 #21 #24 #26 #27 #28 #29 #30 #31
# samples 222 2572 7024 455 308 2548 1005 92 171 454 255 559
JRC has performed an additional test considering data for Inland whole water in Scenario 1 (inland whole water). The
exercise has confirmed the low STE score obtained by Sc2-PNECQC (inland whole water). The next tables show
information about: STE scores, frequency of exceedances, statistics of measurements, and statistic on concentrations.
CAS Fspat Ftemp Fext STE score Risk Substance # in the PS list PNEC
#122-34-9 0 0 0 0 5 Simazine 29 1
site_freq_P95 site_freq_max country_freq_P95 country_freq_max EXC_extent EXC_samples_freq
5.60E-03 8.40E-03 0.00E+00 1.90E-01 2.75E-01 2.10E-03
CAS countries sites samples #samples<lod #samples<loq Substance # in the PS list
#122-34-9 21 1071 4295 0 0 Simazine 29
CAS min mean SD median P25 P75 P90 P95 P99 max Substance # in the PS list
#122-34-9 1.00E-05 0.048176 0.153059 0.02 0.01 0.046 0.098 0.1593 0.40778 6.3 Simazine 29

12
JRC has performed another additional test considering the precautionary drinking water limit value of 0.1 µg/L (following
a request by the drinking water suppliers, to give an indication on whether it could be relevant for MS to consider the
substance under article 7) and data for inland whole water in Scenario 1. The exercise has confirmed the low STE score
previously obtained by Sc2-PNECQC and Sc1 (inland whole water) with EQS=1 µg/L. The next tables show information
about: STE scores, and frequency of exceedances (the statistics of measurements and concentrations are same as in
Scenario 1)
Groundwater concentrations > 0.1 µg/L (from SoE)
The disaggregated data set of EEA contains 71718 monitoring records for simazine in groundwater in 16 countries; 217
groundwater monitoring measurements from 8 countries are above the groundwater limit value of 0.1 µg/L (max 1.96
µg/L) (years 2006 – 2012), which is 0.30 % of all records. However, only 2 measurements are > 1 µg/L (and six are equal
1 µg/L).
Conclusion
Simazine could be a potential candidate for deselection according to all of the the proposed criteria. Although Simazine
has been banned in the EU and in Switzerland since 2012, it is still used in other countries (US, China, Turkey) and was
reregistrated in the US by the US EPA in 2006.
CAS Fspat Ftemp Fext STE score Risk Substance # in the PS list PNEC
#122-34-9 0.084123 0.30989 0.07 0.464012 5 Simazine 29 0.1
site_freq_P95 site_freq_max country_freq_P95 country_freq_max EXC_extent EXC_samples_freq
1.61E-01 1.71E-01 5.24E-01 6.19E-01 2.75E+00 8.08E-02

13
5.2. Alachlor
The results shown below refer to data for inland whole water in Scenario 2 – PNECQC (indicated as InlWh_Sc2-PNECQC).
STE assessment results: spatial, temporal and extent factors, STE score, risk rank, and AA-EQS (µg/L).
STE additional information: Fspatial (site and country frequency of exceedances found by P95 and max concentration),
Fextent (extent of exceedance by Risk Quotient_P95) and Frequency of samples with exceedances (from total number
of samples).
Data statistics: Number of countries with measurements, number of sites with measurements, total number of samples,
number of samples with concentration below LOD, number of samples with concentration below LOQ, and aggregate
percentage of quantified records (> LOD/Q).
Countries Sites Samples Samples < LOD Samples < LOQ % quantified
Sc2-PNEC-QC 20 4155 97593 3612 92330 1.69
Sc2 21 4160 97665 3612 92402 1.69
Statistics for concentrations of all measurements: min, average (mean), standard deviation (SD), median, percentiles (25,
75, 90, 95, 99) and max (µg/L).
min mean SD median P25 P75 P90 P95 P99 max
0.00025 0.00934 0.02372 0.005 0.0025 0.01 0.015 0.015 0.05 2.2
The range of LODs in sc2-PNEC-QC is from 0.002 to 0.1 µg/L (average 0.021 µg/L):
The range of LOQs in sc2-PNEC-QC is from 0.00005 to 0.5 µg/L (average 0.065 µg/L):
CAS Fspat Ftemp Fext STE score Risk Substance # in the PS list PNEC
#15972-60-8 0.000205 0.121483 0 0.121688 5 Alachlor 1 0.3
site_freq_P95 site_freq_max country_freq_P95 country_freq_max EXC_extent EXC_samples_freq
4.09E-03 1.06E-02 5.00E-02 2.00E-01 1.67E-01 8.61E-04
0.002 0.0025 0.003 0.0035 0.005 0.006 0.01 0.015 0.017 0.02 0.025 0.03 0.05 0.1
Range of LOD (µg/L)
5.00E-04 0.001 0.0015 0.002 0.0025 0.003 0.004 0.005 0.007 0.008 0.0085 0.01 0.011 0.012 0.0125 0.015
0.02 0.0225 0.025 0.03 0.035 0.04 0.045 0.05 0.07 0.09 0.1 0.11 0.2 0.25 0.4 0.5
Range of LOQ (µg/L)

14
The boxplot displaying concentrations per year shows variable concentrations (medians and means) but seems that
recently there is a slight decrease in the measured concentrations across Europe. The number of samples per year is
given below in a separate table. Due to the low number of exceedance, no temporal trend in this number of
exceedances is observed.
Year 2006 2007 2008 2009 2010 2011 2012 2013 2014 2015
# samples 12300 13592 7136 16912 10010 12522 21869 2796 455 1

15
The annual mean concentrations (2015 was excluded since there is only one sample) tend to vary over time but the
trend-line based on the mean concentrations per year does not show a downward tendency although the decrease in
the recent years. Possible explanation for the missing trend is that an inverse correlation with the annual mean
precipitation seems to be relevant. However, this is not enough to explain the observed variability of the annual mean
concentrations.
Annual mean rain is found by the aggregation of yearly precipitation data for the countries abundant of chemical
samples taking into account an appropriate weighting according to the countries’ territoty.
0
0.002
0.004
0.006
0.008
0.01
0.012
0.014
0.016
2005 2006 2007 2008 2009 2010 2011 2012 2013 2014 2015
Alachlor: annual mean concentration (µg/L)
650
700
750
800
850
2004 2005 2006 2007 2008 2009 2010 2011 2012 2013 2014 2015
Annual mean precipitation (mm/year)

16
Boxplot of concentrations of all measurements per country (the table below indicates the number of samples per
country). There is a low number of countries with EQS exceedances: 4 out of 20.
Country #01 #02 #04 #05 #06 #07 #08 #10 #11 #12 #15
# samples 5508 474 421 308 8616 3651 397 370 298 63702 820
Country #16 #17 #19 #21 #24 #26 #28 #29 #30 #31
# samples 218 853 6974 444 2572 966 106 454 279 559
JRC performed an additional test considering data for Scenario 1. The exercise has confirmed the low STE score obtained
by InlWh_Sc2-PNECQC. The next tables show information about: STE scores, frequency of exceedances, statistics of
measurements, and statistic on concentrations.
CAS Fspat Ftemp Fext STE score Risk Substance # in the PS list PNEC
#15972-60-8 0.011419 0.337392 0.04 0.388811 5 Alachlor 1 0.3
site_freq_P95 site_freq_max country_freq_P95 country_freq_max EXC_extent EXC_samples_freq
6.85E-02 7.18E-02 1.67E-01 3.33E-01 1.36E+00 5.09E-02
CAS countries sites samples #samples<lod #samples<loq Substance # in the PS list
#15972-60-8 12 613 1651 0 0 Alachlor 1

17
JRC has performed another additional test considering the precautionary drinking water limit value of 0.1 µg/L (request
by the drinking water suppliers to give an indication on whether it could be relevant for MS to consider the substance
under article 7) and data for Inland whole water in Scenario 1. The exercise has showed a slight increase of the STE score
obtained by Sc1 (inland whole water) and EQS=0.3 µg/L. The next tables show information about: STE scores, and
frequency of exceedances (the statistics of measurements and concentrations are same as in Scenario 1) .
Groundwater concentrations > 0.1 µg/L (from SoE)
The disaggregated data set of EEA contains 46315 monitoring records for alachlor in groundwater in 12 countries; 8
groundwater monitoring measurements from 2 countries are above the groundwater limit value of 0.1 µg/L (max 4 µg/L)
(years 2006 – 2012), which is 0.02 % of all records. However, only 2 measurements are > 0.3 µg/L.
Conclusion
Alachlor could be a potential candidate for deselection.
Alachlor has been banned in the EU since 2006 (Off. J. Europ. Comm. L397/28; 30.12.2006). In Switzerland it has been
banned since 2012 (https://de.wikipedia.org/wiki/Alachlor).
5.3. Chlorfenvinphos
The results shown below refer to data for inland whole water in Scenario 2 – PNECQC (indicated as InlWh_Sc2-PNECQC).
STE assessment results: spatial, temporal and extent factors, STE score, risk rank, and AA-EQS (µg/L).
STE additional information: Fspatial (site and country frequency of exceedances found by P95 and max concentration),
Fextent (extent of exceedance by Risk Quotient_P95) and Frequency of samples with exceedances (from total number
of samples).
CAS min mean SD median P25 P75 P90 P95 P99 max Substance # in the PS list
#15972-60-8 1.60E-03 0.078133 0.159198 0.025 0.01 0.1 0.2 0.31 0.635 2.2 Alachlor 1
CAS Fspat Ftemp Fext STE score Risk Substance # in the PS list PNEC
#15972-60-8 0.063622 0.519016 0.07 0.652637 4 Alachlor 1 0.1
site_freq_P95 site_freq_max country_freq_P95 country_freq_max EXC_extent EXC_samples_freq
1.91E-01 1.97E-01 3.33E-01 5.00E-01 4.08E+00 1.69E-01
CAS Fspat Ftemp Fext STE score Risk Substance # in the PS list PNEC
#470-90-6 0 0 0 0 5 Chlorfenvinphos 8 0.1
site_freq_P95 site_freq_max country_freq_P95 country_freq_max EXC_extent EXC_samples_freq
1.45E-03 2.90E-03 0.00E+00 2.27E-01 3.80E-01 1.15E-04

18
Data statistics: Number of countries with measurements, number of sites with measurements, total number of samples,
number of samples with concentration below LOD, number of samples with concentration below LOQ, and aggregate
percentage of quantified records (> LOD/Q).
Countries Sites Samples Samples < LOD Samples < LOQ % quantified
Sc2-PNEC-QC 22 3446 86942 2857 83637 0.52
Sc2 23 3562 88652 3690 84514 0.51
Statistics for concentrations of all measurements: min, average (mean), standard deviation (SD), median, percentiles (25,
75, 90, 95, 99) and max (µg/L).
min mean SD median P25 P75 P90 P95 P99 max
0.000015 0.00882 0.2560 0.005 0.005 0.01 0.01 0.0125 0.025 54
The range of LODs in sc2-PNEC-QC is from 0.00003 to 0.1 µg/L (average 0.0086 µg/L):
The range of LOQs in sc2-PNEC-QC is from 0.0005 to 0.2 µg/L (average 0.026 µg/L):
3.00E-05 4.50E-05 5.00E-05 1.00E-04 0.00015 0.00025 3.00E-04 0.00035 0.00045 5.00E-04 0.001 0.0015 0.002 0.0025 0.003 0.0045 0.005 0.01 0.02 0.03 0.1
Range of LOD (µg/L)
0.0005 0.001 0.00125 0.0015 0.002 0.0025 0.003 0.004 0.005 0.006 0.007 0.008 0.01 0.011
0.012 0.013 0.015 0.02 0.022 0.023 0.024 0.025 0.03 0.035 0.05 0.09 0.1 0.2
Range of LOQ (µg/L)

19
The boxplot displaying concentrations per year shows variable concentrations (medians) but seems that recently there is
a slight decrease in the measured concentrations across Europe. The number of samples per year is given in a separate
table. Due to the low number of exceedance, no temporal trend in this number of exceedances is observed.
Year 2006 2007 2008 2009 2010 2011 2012 2013 2014 2015
# samples 6333 12843 7345 16284 9775 12410 19161 2301 489 1
The annual mean concentrations show a low varibiality except for 2013 (for this year the very high annual mean
concentrations resulted from 3 samples that are maybe outliers). Thus, the upward trend-line based on the mean
concentrations per year is not justifiable.
0
0.01
0.02
0.03
0.04
0.05
0.06
2005 2006 2007 2008 2009 2010 2011 2012 2013 2014 2015
Chlorfenvinphos: annual mean concentration (µg/L)

20
Boxplot of concentrations of all measurements per country (the table below indicates the number of samples per
country). There is a low number of countries with a few EQS exceedances 5 out of 22 (but there are 3 MS with only a
single exceedance, so, we can consider that the criterion 2 is fulfiled) in line with its low Fspatial factor.
Country #02 #03 #04 #05 #06 #07 #11 #12 #13 #14 #15 #16 #17
# samples 97 37 421 135 5529 3916 298 63048 2428 107 513 217 1755
Country #19 #21 #24 #26 #27 #28 #29 #30 #31
# samples 3923 440 2461 500 85 27 452 255 298
JRC performed an additional test considering data for Scenario 1. The exercise has confirmed the low STE score obtained
by InlWh_Sc2-PNECQC. The next tables show information about: STE scores, frequency of exceedances, statistics of
measurements, and statistic on concentrations.
CAS Fspat Ftemp Fext STE score Risk Substance # in the PS list PNEC
#470-90-6 0.006868 0.277778 0.04 0.324646 5 Chlorfenvinphos 8 0.1
site_freq_P95 site_freq_max country_freq_P95 country_freq_max EXC_extent EXC_samples_freq
4.46E-02 4.46E-02 1.54E-01 3.85E-01 4.00E-02 2.23E-02
CAS countries sites samples #samples<lod #samples<loq Substance # in the PS list
#470-90-6 13 224 448 0 0 Chlorfenvinphos 8

21
No need to be performed another additional test considering the precautionary drinking water limit value 0.1 µg/L
(request by the drinking water suppliers to give an indication on whether it could be relevant for MS to consider the
substance under article 7) since EQS is equal to 0.1 µg/L.
Aggregated data from EEA for missing Member States
The aggregated monitoring data for chlorfenvinphos was extracted and found from one additional country with an EQS
exceedance for a lake monitoring station, with a maximum concentration of 0.13 µg/L in 2010 as reported below. This
country is then added to the 5 countries from the STE run.
Year 2010
# of samples 3
Min concentration (µg/L) 0.0033
Mean value (µg/L) 0.0455
Max concentration (µg/L) 0.13
Groundwater concentrations > 0.1 µg/L (from SoE)
The disaggregated data set of EEA contains 41609 monitoring records for chlorfenvinphos in groundwater in 12
countries; only one groundwater monitoring measurement is above the groundwater limit value of 0.1 µg/L (0.138 µg/L)
(years 2006 – 2012), which is 0.002 % of all records.
Conclusion
Chlorfenvinphos could be a potential candidate for deselection. Chlorfenvinphos has been banned in the EU since 2012. For chlorfenvinphos, the EQS exceedances criteria is not totally fulfilled because exceedances were found in 5 countries,
plus one additional country found in the aggregated data from EEA. Exceedence is reported in 2010. If an exception is
made to this criteria it would be possible to consider also chlorfenvinphos for deselection, because 3 of the 5 countries
have only a single exceedance. However from aggregated data we could not conclude if it is only one exceedance,
reported in 2010.
CAS min mean SD median P25 P75 P90 P95 P99 max Substance # in the PS list
#470-90-6 6.14E-04 0.357871 3.552947 0.013 0.011 0.05 0.1 0.1 0.6127 54 Chlorfenvinphos 8

22
6. Questions to the WG Chemicals
- Do you have comments on the criteria outlined in section 2 and on the substances identified as potential candidates for
deselection ?

23
Annex
7. Comments on the criteria for deselection
Eurometaux association comments on the PS deselection criteria:
The STE score limit below 0.6 seems very low and arbitrary. We suggest to derive a limit fixing the STE score
below a certain percentile of STE scores of all investigated chemicals in the exercise.
When determining the STE for metals where the EQS is bioavailability-based, the exceedance needs to be
defined within the bioavailability context. That is, an exceedance is defined as a situation where dissolved
ambient concentrations exceed the bioavailability normalized PNEC. Importantly, ambient dissolved
concentrations that are greater than the reference EQS should not automatically be interpreted as an
exceedance.
When observing the exceedances, the 95th or even 99th percentile should be considered; using the maximal
value is too sensitive to outliers (e.g. unit mistakes).
It seems more sensible to consider a temporal decrease in the number of exceedances, rather than the
average/median concentrations. Average/median concentrations are typically insensitive to reductions of
exceedances because exceedances are usually only in a small fraction of all water samples.
The “banned” criterion is not relevant for metals which occur naturally. A full ban on metals is not appropriate,
because:
under annex X of the WFD, the metals figure as a “metal group” e.g. “Nickel and Nickel compounds”, not as
a single substance (e.g. “NiO”). As such, all different substances (the metal and all its chemical salts) and all
different uses and applications are comprised in the one entry under Annex X. It is highly unlikely that there
would be a general ban on all forms and compounds of a given metal.
metals are natural elements and as such always present in all environmental compartments, including the
water. So they will always be measured in monitoring programmes. At some locations influenced by local
metalliferous geology, the natural background concentrations will be higher, and may exceed the EQS
because of natural occurrence.
metals are present as trace elements in many natural basic products such as fossil fuels and coal. The
industrial process using such basic materials will result in emissions that have nothing to do with the use of
the metals as such, but the emissions will influence water concentrations
Answers to Eurometaux' comments on the PS deselection criteria
The concept for deselection is looking the susbtances that pose very low concern. According to the agreed method
for assessment in the monitoring exercise, an STE score ≤0.6 is taken to represent to very low concern. Currently,
substances showing STE score below 0.6 are 21% (excluding those in biota matrix or being recently added) of the all
substance which have been considered in this exercise while represents the 50% of the not approved PS .
JRC admits that the metals have to be evaluated considering the bioavailability and background concentrations.
However, the data reported by MS don’t provide records neither for the parameters (at same location and time)
needed to calculated the bioavailable factor nor for the background.
JRC considers the procedure for treatment of outliers as suffiently robust to cleaned “obvious” outliers from the
dataset, so, there is not need for further filtering of data
JRC took into account the temporal aspect of the number of exceedances when evaluating the time-trends. We
found unstable (oscilating) number of exceedances per year that cannot be used for a time trend analyses.
JRC agrees that the condition for banning is not applicable for naturally occurring substances (for instance metals).

24
Comments from RIVM (NL) on the criteria for deselection:
1. Data quality for deselection. MS that have found PS below the EQS for a number of years (3?) can reduce the monitoring frequency. It is possible that monitoring data are not available for that reason.4 A reduced monitoring frequency in a number of MS may in itself also be a valid reason for deselection and this should be taken into account when evaluating the monitoring data for PS.
2. We are not in favor of asking MS to provide addition information for PS. This information was already reported by MS.
3. The criterium 1. Is not relevant for deselection and should be left out. 4. One of the criteria for deselection is the STE score. The STE scoring method has changed (or should be changed)
because of the comments we gave in the last SG-R meeting (jun 9-10) This may influence the outcome of the deselection procedure
5. Number of countries with observed EQS exceedance below 4: this is the criterion use for inclusion of compounds in a list of new PS. This was chosen as a very precautionary value not to miss possibly relevant compounds. I suggest to consider the following: number of countries with observed EQS exceedance below 8 (= 30% of the MS) AND a decreasing trend.
6. Suggest NOT all of the listed criteria should be fulfilled: a substance that is not banned but is below EQS in all MS should also be deselected!
Suggested criteria:
- Substance with observed EQS exceedance in less than 8 countries and decreasing trend OR
- Substance banned, observed EQS exceedance in less than 8 countries and decreasing trend 7. Not in favor of including the criterion substance is banned also in import products. I think this criterion is beyond
the scope of the WFD
Answers to RIVM’s comments:
JRC agrees that the certain MSs may have not monitored a priority substance because it was deemed not relevant in
the MS (e.g. not discharged). If a substance is proposed for deselection, the JRC will make sure with the
corresponding MSs that this is the reason for the lack of monitoring data. If the substance was actually monitored in
several MS that did not send the corresponding data, the JRC may need to request these MSs to provide monitoring
data, to confirm the deselection of the substance (and avoid deselecting a substance that would cause a risk in
several MSs)
The criterion related to the ban of substances will be discussed with the experts from SG-R. Because of the
requirement to phase out emissions, discharges and losses of PHS (in addition to the requirement to reach good
status for these substances), PHS will not be proposed for deselection from the list.
Former criteria 1 was redundant with the introductory sentences to the section and it has been removed.
The criteria with observed EQS exceedances in equal or less than four countries has been proposed for precaution.
We can take into account the proposed criteria by NL (EQS exceedances in less than 8 countries (= 30% of the MS))
and will evaluate and compare the difference (see section 3 of this document) .
The suggestion (comment #6) could be considered at later stage and it should be verified one by one substance
since as we mentioned already the available monitoring data are not from all MS, so in case it is not banned and no
exceedance is only reported from some MS, this would not be enough as deselection criteria. It is also necessary to
make sure that deselecting the substance would not lead to the suppression of the measures put in place to control
4 According to Annex V 1.3.1, the frequency of monitoring can be reduced when "the previous surveillance monitoring exercise showed that the body concerned reached good status and there is no evidence from the review of impact of human activity in Annex II that the impacts on the body have changed."

25
the emissions and that it would not lead to an increase in the risk linked to the substance. At this stage of the
process, it is thus proposed to focus on banned substances for which we are sure that no increase in emissions
would occur following deselection.
Cooment # 7 has been taken into account in the updated version.
Comments from Umweltbundesamt GmbH (AT) on the criteria for deselection
It is questioned, whether the ban of a substance should be a requirement for such a delisting. If concentrations in
European rivers are shown to decrease and no EQS exceeding’s are reported by MS in the RBMPs, substances might be
deselected from the list of priority substances although no ban is established for those substances. Monitoring data for
an evaluation should be available. A requirement for the listing of priority substances is their relevance at European level
with regard to potential risks. The single occurrence/presence of a substance in a water body is not a selection criterion.
Following this reasoning, substances for which risk management measures were implemented and due to this measures
the concentrations decreased under the EQS values, no justification for listing these compounds further as priority
substances can be deduced. It is different for priority hazardous substances, as for these compounds also a phase out is
required. For these substances a reduced monitoring obligation could be discussed.
Answers to Umweltbundesamt GmbH comments:
If we were to deselect a PS still in use, it would be necessary to make sure that deselecting the substance would not
lead to the suppression of the measures put in place to control emissions and that it would not lead to an increase in
the risk linked to the substance. At this stage of the process, it is thus proposed to focus on banned substances for
which we are sure that no increase in emissions would occur following deselection.

26
8. Examples of PS (or "other pollutants") with very low STE score which do not fulfil criteria 2 or 3
Note: Attention should be paid to the fact that for some substances the Fspatial (spatial factor in STE method) could
become null since the country term of exceedances based on 95-percentile of concentrations is zero. . In addition,
following the decisions of the 5th meeting of the SG-R (June 2016), the Temporal and Extent STE factors are synchronized
with Fspatial (when Fspat=0 then automatically Ftemp=0 and Fext=0). Some exceedances may exist while the STE score
is equal to zero.The boxplots in this document show all data for Inland Whole water Sc2-PNECQC (including max
concentrations; without any data filtering).
8.1. Atrazine
STE assessment results: spatial, temporal and extent factors, STE score, risk rank, and AA-EQS (µg/L).
CAS Fspat Ftemp Fext STE score Risk Substance EQS
#1912-24-9 0.0003111 0.2732298 0 0.274 5 Atrazine 0.6
STE additional information: Fspatial (site and country frequency of exceedances found by P95 and max concentration),
and Fextent (extent of exceedance by Risk Quotient_P95).
site_freq_P95 site_freq_max country_freq_P95 country_freq_max EXCextent
7.47E-03 1.31E-02 4.17E-02 4.58E-01 1.00E-01
Data statistics: Number of countries with measurements, number of sites with measurements, total number of samples,
number of samples with concentration below LOD, number of samples with concentration below LOQ, and aggregate
percentage of quantified records (> LOD/Q).
countries sites samples samples < LOD samples < LOQ % quantified
24 4822 106323 5275 86502 13.68
Statistics for concentrations of all measurements: min, average (mean), standard deviation (SD), median, percentiles (25,
75, 90, 95, 99) and max (µg/L).
min mean SD median P25 P75 P90 P95 P99 max
0.000005 0.3923832 46.720111 0.007 0.005 0.0125 0.02 0.03 0.1 10000

27
The boxplot displaying concentrations per year shows variable concentrations (medians and means) but seems that
recently there is a slight decrease in the measured concentrations across Europe. The number of samples per year is
given below in a separate table (AA-EQS=0.6 µg/L).
Year 2006 2007 2008 2009 2010 2011 2012 2013 2014 2015
# samples 15986 14106 8489 16449 10693 13923 23222 2945 509 1
Although the annual mean concentrations tend to vary over time the trend-line based on the mean concentrations per
year shows a downward tendency. In addition it seems that an inverse correlation with the annual mean precipitation
could be expected (see the figure below).
-0.2
0
0.2
0.4
0.6
0.8
1
1.2
1.4
1.6
2005 2007 2009 2011 2013 2015
Atrazine: mean annual concentration (µg/L)

28
Annual mean rain is found by the aggregation of yearly precipitation data for the countries abundant of chemical
samples taking into account an appropriate weighting according to the countries’ territoty.
Boxplot of concentrations of all measurements per country (the table below indicates the number of samples per
country). Atrazine concentrations still exceed the EQS in 11 out of 24 countries.
650
700
750
800
850
2004 2005 2006 2007 2008 2009 2010 2011 2012 2013 2014 2015
Annual mean precipitation (mm/year)

29
Country #01 #02 #03 #04 #05 #06 #07 #08 #11 #12 #13 #15 #16 #17
# samples
5602 474 281 421 252 8553 4836 397 298 62879 3739 1150 853 2569
Country #19 #20 #21 #24 #26 #27 #28 #29 #30 #31
# samples 8309 455 388 2546 941 96 235 453 255 341
Conclusion
Atrazine is not a candidate for deselection because it does not fulfil criterion 2 (number of countries with observed EQS
exceedances ≥ 4). Despite its EU ban in 2004, atrazine can still be found in surface waters, maybe due to illegal use or
resuspension/elution from soil or sediment.
8.2. Benzene
STE assessment results: spatial, temporal and extent factors, STE score, risk rank, and AA-EQS (µg/L). The temporal and
extent factors are harmonised with Fspatial (when Fspat=0 then automatically Ftemp=0 and Fext=0).
CAS Fspat Ftemp Fext STE score Risk Substance EQS
#71-43-2 0 0 0 0.000 5 Benzene 10
STE additional information: Fspatial (site and country frequency of exceedances found by P95 and max concentration)
and Fextent (extent of exceedance by Risk Quotient_P95).
site_freq_P95 site_freq_max country_freq_P95 country_freq_max EXCextent
0.00E+00 2.85E-04 0.00E+00 5.00E-02 1.00E-01
Data statistics: Number of countries with measurements, number of sites with measurements, total number of samples,
number of samples with concentration below LOD, number of samples with concentration below LOQ, and aggregate
percentage of quantified records (> LOD/Q).
countries sites samples samples < LOD samples < LOQ % quantified
20 3504 73050 2352 68620 2.84
Statistics for concentrations of all measurements: min, average (mean), standard deviation (SD), median, percentiles (25,
75, 90, 95, 99) and max (µg/L).
min mean SD median P25 P75 P90 P95 P99 max
0.0005 0.179499 0.2418178 0.125 0.05 0.25 0.25 0.5 1 15.8

30
The boxplot displaying concentrations per year shows variable concentrations (including medians) but seems that
recently there is a tendency of decrease in the measured concentrations across Europe. The number of samples per year
is given in a separate table.=
Year 2006 2007 2008 2009 2010 2011 2012 2013 2014
# samples 7169 13942 4909 12791 7682 10642 14048 1765 102
Although the annual mean concentrations tend to vary over time the trend-line based on the mean concentrations per
year shows a downward tendency in particular in the recent years. In addition, an inverse correlation with the annual
mean precipitation (probably with a lag up to one year) could be expected (see the figure below). However, this is not
enough to explain the observed variability of the annual mean concentrations.
0
0.05
0.1
0.15
0.2
0.25
0.3
2005 2006 2007 2008 2009 2010 2011 2012 2013 2014 2015
Benzene: annual mean concentration (µg/L)

31
Annual mean rain found by the aggregation of yearly precipitation data for the countries abundant of chemical samples
taking into account an appropriate weighting according to the countries’ territoty.
Boxplot of concentrations considering all measurements per country (the table below indicates the number of samples
per country). There is just one country with a single exceedance: 1 out of 20.
Country #02 #04 #05 #06 #07 #10 #12 #13 #14 #15 #16 #17
# samples 469 366 175 7797 977 745 49980 3467 107 748 860 1028
Country #19 #20 #21 #24 #26 #28 #30 #31
650
700
750
800
850
2004 2005 2006 2007 2008 2009 2010 2011 2012 2013 2014 2015
Annual mean precipitation (mm/year)

32
# samples 1459 816 444 2098 865 53 210 386
Conclusion
Benzene could not be a candidate for deselection according to the proposed criteria since it is approved for use.
8.3. 1,2-Dichloroethane
STE assessment results: spatial, temporal and extent factors, STE score, risk rank, and AA-EQS (µg/L). The temporal and
extent factors are harmonised with Fspatial (when Fspat=0 then automatically Ftemp=0 and Fext=0).
CAS Fspat Ftemp Fext STE score Risk Substance EQS
#107-06-2 0 0 0 0.000 5 1,2-Dichloroethane 10
STE additional information: Fspatial (site and country frequency of exceedances found by P95 and max concentration),
and Fextent (extent of exceedance by Risk Quotient_P95) .
site_freq_P95 site_freq_max country_freq_P95 country_freq_max EXCextent
8.62E-04 3.45E-03 0.00E+00 2.38E-01 1.50E-01
Data statistics: Number of countries with measurements, number of sites with measurements, total number of samples,
number of samples with concentration below LOD, number of samples with concentration below LOQ, and aggregate
percentage of quantified records (> LOD/Q).
countries sites samples samples < LOD samples < LOQ % quantified
21 3479 75575 1803 72258 2.00
Statistics for concentrations of all measurements: min, average (mean), standard deviation (SD), median, percentiles (25,
75, 90, 95, 99) and max (µg/L).
min mean SD median P25 P75 P90 P95 P99 max
0.00025 0.3324958 0.7984303 0.25 0.05 0.25 0.5 0.512 6.25 51

33
The boxplot displaying concentrations per year shows variable concentrations (including medians) but seems that there
is a downward tendency in the measured concentrations across Europe in the recent years. The number of samples per
year is given in a separate table.
The trend-line based on the mean concentrations per year shows a clear downward tendency.
0
0.1
0.2
0.3
0.4
0.5
0.6
0.7
0.8
0.9
2005 2006 2007 2008 2009 2010 2011 2012 2013 2014 2015
1,2-Dichloroethane: annual mean concentration (µg/L)

34
Boxplot of concentrations considering all measurements per country (the table below indicates the number of samples
per country). There is a low number of countries with EQS exceedances 5 out of 21 but 3 MS showed just a single
exceedance, therefore we consider that criterion 2 is fulfilled.
Country #01 #02 #04 #05 #06 #07 #10 #12 #13 #14 #15 #16
# samples 120 466 366 177 7787 1333 675 50237 3983 107 56 191
Country #17 #19 #20 #21 #24 #26 #28 #30 #31
# samples 961 3812 814 408 2107 1309 51 210 405
Conclusion
Although the number of countries with exceedances is 5 (there are really a very small number of samples that exceed EQS). 1,2-Dichloroethane could not be a candidate for deselection according to the proposed criteria since it is approved for use.

35
8.4. Diuron
STE assessment results: spatial, temporal and extent factors, STE score, risk rank, and AA-EQS (µg/L). The temporal and
extent factors are harmonised with Fspatial (when Fspat=0 then automatically Ftemp=0 and Fext=0).
CAS Fspat Ftemp Fext STE score Risk Substance EQS
#330-54-1 0 0 0 0.000 5 Diuron 0.2
STE additional information: Fspatial (site and country frequency of exceedances found by P95 and max concentration),
and Fextent (extent of exceedance by Risk Quotient_P95.
site_freq_P95 site_freq_max country_freq_P95 country_freq_max EXCextent
3.55E-02 1.06E-01 0.00E+00 5.22E-01 7.30E-01
Data statistics: Number of countries with measurements, number of sites with measurements, total number of samples,
number of samples with concentration below LOD, number of samples with concentration below LOQ, and aggregate
percentage of quantified records (> LOD/Q).
countries sites samples samples < LOD samples < LOQ % quantified
23 4511 96730 5970 74217 17.10
Statistics for concentrations of all measurements: min, average (mean), standard deviation (SD), median, percentiles (25,
75, 90, 95, 99) and max (µg/L).
min mean SD median P25 P75 P90 P95 P99 max
0.000005 0.0555838 7.8439278 0.01 0.005 0.015 0.03 0.054 0.21 2186
The boxplot displaying concentrations per year shows variable concentrations (medians) but seems that there is not a
tendency of decrease in the measured concentrations across Europe. The number of samples per year is given in a
separate table.

36
Year 2006 2007 2008 2009 2010 2011 2012 2013 2014 2015
# samples 7566 14104 8642 17121 11434 14340 20100 2901 521 1
The annual mean concentrations show a considerable decrease after 2007 followed by an stabilisation. Although the
trend-line based on the mean concentrations per year shows a down tendency it is not possible to consider a clear
downward trend recently.
-0.05
0
0.05
0.1
0.15
0.2
0.25
0.3
2005 2006 2007 2008 2009 2010 2011 2012 2013 2014 2015
Diuron: annual mean concentration (µg/L)

37
Boxplot of concentrations considering all measurements per country (the table below indicates the number of samples
per country). There is a lot of countries with EQS exceedances: 12 out of 23.
Country #01 #02 #03 #04 #05 #06 #07 #08 #11 #12 #13 #15 #16 #17
# samples 97 474 10 81 66 5806 4746 397 294 63104 2907 532 245 2571
Country #19 #20 #21 #24 #26 #28 #29 #30 #31
# samples 4116 40 36 7649 564 101 454 210 2230
Conclusion
Diuron cannot be a candidate for deselection according to the proposed criterion 2 (12 countries with EQS exceedances), and it is still approved.

38
8.5. Isoproturon
STE assessment results: spatial, temporal and extent factors, STE score, risk rank, and AA-EQS (µg/L).
CAS Fspat Ftemp Fext STE score Risk Substance EQS
#34123-59-6 0.0015588 0.067214 0 0.070 5 Isoproturon 0.3
STE additional information: Fspatial (site and country frequency of exceedances found by P95 and max concentration),
and Fextent (extent of exceedance by Risk Quotient_P95.
site_freq_P95 site_freq_max country_freq_P95 country_freq_max EXCextent
3.74E-02 1.24E-01 4.17E-02 5.00E-01 8.33E-01
Data statistics: Number of countries with measurements, number of sites with measurements, total number of samples,
number of samples with concentration below LOD, number of samples with concentration below LOQ, and aggregate
percentage of quantified records (> LOD/Q).
countries sites samples samples < LOD samples < LOQ % quantified
24 3368 87866 1352 74004 14.24
Statistics for concentrations of all measurements: min, average (mean), standard deviation (SD), median, percentiles (25,
75, 90, 95, 99) and max (µg/L).
min mean SD median P25 P75 P90 P95 P99 max
0.000005 0.0230768 0.1436225 0.01 0.005 0.01 0.029 0.062 0.29 20
The boxplot displaying concentrations per year shows variable concentrations (medians) but seems that recently there is
not decrease in the measured concentrations across Europe. The number of samples per year is given below in a
separate table. The AA-EQS of Isoproturon is 0.3 µg/L.

39
Year 2006 2007 2008 2009 2010 2011 2012 2013 2014 2015
# samples 5909 13049 6940 16194 9917 12883 19589 2853 531 1
The annual mean concentrations tend to vary over time and there is not any time-trend (even there is an upward
tendendency in the recent years).
Boxplot of concentrations of all measurements per country (the table below indicates the number of samples per
country). There are a lot of EQS exceedances for isoproturon in many countries: 12 out of 24.
0
0.005
0.01
0.015
0.02
0.025
0.03
0.035
0.04
0.045
2005 2006 2007 2008 2009 2010 2011 2012 2013 2014 2015
Isoproturon: annual mean concentration (µg/L)

40
Country #01 #02 #03 #04 #05 #06 #07 #08 #11 #12 #13
# samples 90 474 5 81 66 5940 4714 397 294 62898 2538
Country #14 #15 #16 #17 #19 #20 #21 #24 #26 #28 #29 #30 #31
# samples 107 528 236 1668 3337 40 388 2235 522 86 463 210 549
Conclusion
Isoproturon cannot be considered for deselection even though it has a very low STE score of 0.07, because it doesn’t
fulfil criteria 2 and 3.
Isoproturon is approved as a PPP in the EU. However, its renewal application has not been approved, therefore it will
expire end June 2016, with a delay for using up stocks.
http://ec.europa.eu/food/plant/pesticides/eu-pesticides-
database/public/?event=activesubstance.detail&language=EN&selectedID=1495

41
8.6. Trichlorobenzenes
STE assessment results: spatial, temporal and extent factors, STE score, risk rank, and AA-EQS (µg/L). The temporal and
extent factors are harmonised with Fspatial (when Fspat=0 then automatically Ftemp=0 and Fext=0).
CAS Fspat Ftemp Fext STE score Risk Substance EQS
#12002-48-1 0 0 0 0.000 5 Trichlorobenzenes 0.4
STE additional information: Fspatial (site and country frequency of exceedances found by P95 and max concentration),
and Fextent (extent of exceedance by Risk Quotient_P95.
site_freq_P95 site_freq_max country_freq_P95 country_freq_max EXCextent
2.65E-03 0.007419
0.00E+00 4.50E-01 6.25E-01
Data statistics: Number of countries with measurements, number of sites with measurements, total number of samples,
number of samples with concentration below LOD, number of samples with concentration below LOQ, and aggregate
percentage of quantified records (> LOD/Q).
countries sites samples samples < LOD samples < LOQ % quantified
20 3774 119972 5505 111151 2.76
Statistics for concentrations of all measurements: min, average (mean), standard deviation (SD), median, percentiles (25,
75, 90, 95, 99) and max (µg/L).
min mean SD median P25 P75 P90 P95 P99 max
0.00001 0.0873758 6.4821933 0.025 0.005 0.0625 0.25 0.25 0.25 2000
The boxplot displaying concentrations per year shows variable concentrations (medians) but seems that there is a slight
decrease in the measured concentrations across Europe. The number of samples per year is given in a separate table.

42
Year 2006 2007 2008 2009 2010 2011 2012 2013 2014
# samples 23930 48674 13269 3506 6716 7376 10084 5168 1249
The annual mean concentrations show a considerable decrease after 2008 followed by an stabilisation. The trend-line
based on the mean concentrations per year seems to present a downward tendency.
-0.05
0
0.05
0.1
0.15
0.2
2005 2006 2007 2008 2009 2010 2011 2012 2013 2014 2015
Trichlorobenzenes: annual mean concentration (µg/L)

43
Boxplot of concentrations of all measurements per country (the table below indicates the number of samples per
country). There is a lot of countries with EQS exceedances: 9 out of 20.
Conclusion
Trichlorobenzenes cannot be a candidate for deselection according to the proposed criterion 3 since is still approved for
use.
8.7. Carbon tetrachloride (tetrachloromethane)
STE assessment results: spatial, temporal and extent factors, STE score, risk rank, and AA-EQS (µg/L). The temporal and
extent factors are harmonised with Fspatial (when Fspat=0 then automatically Ftemp=0 and Fext=0).
CAS Fspat Ftemp Fext STE score Risk Substance EQS
#56-23-5 0 0 0 0.000 5 Carbon tetrachloride 12
STE additional information: Fspatial (site and country frequency of exceedances found by P95 and max concentration),
and Fextent (extent of exceedance by Risk Quotient_P95).
site_freq_P95 site_freq_max country_freq_P95 country_freq_max EXCextent
0.00E+00 0.00E+00 0.00E+00 0.00E+00 4.17E-02

44
Data statistics: Number of countries with measurements, number of sites with measurements, total number of samples,
number of samples with concentration below LOD, number of samples with concentration below LOQ, and aggregate
percentage of quantified records (> LOD/Q).
countries sites samples samples < LOD samples < LOQ % quantified
20 5128 106464 4926 99829 1.61
Statistics for concentrations of all measurements: min, average (mean), standard deviation (SD), median, percentiles (25,
75, 90, 95, 99) and max (µg/L).
min mean SD median P25 P75 P90 P95 P99 max
0.000001 0.1584862 0.2313956 0.05 0.05 0.25 0.25 0.5 0.5 7
The boxplot displaying concentrations per year shows variable concentrations (including medians) but seems that
recently there is a decrease in the measured concentrations across Europe. The number of samples per year is given in a
separate table.
Year 2006 2007 2008 2009 2010 2011 2012 2013 2014
# samples 13366 25760 4409 18224 9094 12936 20282 1970 423

45
Although the annual mean concentrations tend to vary over time the trend-line based on the mean concentrations per
year shows recently a downward tendency.
Boxplot of concentrations of all measurements per country (the table below indicates the number of samples per
country). There is no countries with EQS exceedances (0 out of 20).
Country #01 #02 #04 #05 #06 #07 #10 #12 #13 #14 #15 #16 #17
# samples 72 458 366 215 6371 1334 750 77854 5408 107 933 227 1014
0
0.05
0.1
0.15
0.2
0.25
2005 2006 2007 2008 2009 2010 2011 2012 2013 2014 2015
Carbon tetrachloride : annual mean concentration (µg/L)

46
Country #19 #20 #21 #24 #26 #28 #31
# samples 3373 812 444 3566 1263 12 1885
Conclusion
Carbon tetrachloride (tetrachloromethane) is not a potential candidate for deselection since it is still approved for use.
8.8. Tetrachloroethylene
Tetrachloroethylene is not a priority substance, but one of the “other pollutants” with an EQS originally laid down in
older legislation.
STE assessment results: spatial, temporal and extent factors, STE score, risk rank, and AA-EQS (µg/L).
CAS Fspat Ftemp Fext STE score Risk Substance EQS
#127-18-4 0 0 0 0.000 5 Tetrachloroethylene 10
STE additional information: Fspatial (site and country frequency of exceedances found by P95 and max concentration),
and Fextent (extent of exceedance by Risk Quotient_P95).
site_freq_P95 site_freq_max country_freq_P95 country_freq_max EXCextent
1.77E-03 3.03E-03 0.00E+00 2.50E-01 2.00E-01
Data statistics: Number of countries with measurements, number of sites with measurements, total number of samples,
number of samples with concentration below LOD, number of samples with concentration below LOQ, and aggregate
percentage of quantified records (> LOD/Q).
countries sites samples samples < LOD samples < LOQ % quantified
20 3966 93292 2758 86780 4.02
Statistics for concentrations of all measurements: min, average (mean), standard deviation (SD), median, percentiles (25,
75, 90, 95, 99) and max (µg/L).
min mean SD median P25 P75 P90 P95 P99 max
0.000001 0.2256092 0.4976644 0.125 0.05 0.25 0.26 0.5 2.5 50
The boxplot displaying concentrations per year shows variable concentrations (including medians) but seems that
recently there is a slight decrease in the measured concentrations across Europe. The number of samples per year is
given below in a separate table.

47
Year 2006 2007 2008 2009 2010 2011 2012 2013 2014
# samples 13772 25275 4743 13009 8770 10995 13860 2445 423
The graph of annual mean concentrations shows variable concentrations and no clear temporal trend. (Maybe the
increased concentration in 2013 could be explaned with the reduced number of sampleas for this particular year).
0
0.05
0.1
0.15
0.2
0.25
0.3
0.35
0.4
2005 2006 2007 2008 2009 2010 2011 2012 2013 2014 2015
Tetrachloroethylene: annual mean concentration (µg/L)

48
Boxplot of concentrations of all measurements per country (the table below indicates the number of samples per
country). There is a very low number of countries with exceedances - 5 out of 20, but 2 MS showed just a single
exceedance, so, practically the criterion 2 could be considered as fulfilled.
Country #01 #02 #04 #05 #06 #07 #10 #12 #13 #15 #16 #17
# samples 72 444 366 104 6291 1448 4138 68756 3614 620 227 737
Country #19 #20 #21 #24 #26 #28 #30 #31
# samples 1496 819 444 2106 1244 52 210 104
Conclusion
Tetrachloroethylene is not a potential candidate for deselection since it does not fulfil the crtieria 3 (it is approved for
use).

49
8.9. Trichloroethylene
STE assessment results: spatial, temporal and extent factors, STE score, risk rank, and AA-EQS (µg/L). The temporal and
extent factors are harmonised with Fspatial (when Fspat=0 then automatically Ftemp=0 and Fext=0).
CAS Fspat Ftemp Fext STE score Risk Substance EQS
#79-01-6 0 0 0 0.000 5 Trichloroethylene 10
STE additional information: Fspatial (site and country frequency of exceedances found by P95 and max concentration),
and Fextent (extent of exceedance by Risk Quotient_P95).
site_freq_P95 site_freq_max country_freq_P95 country_freq_max EXCextent
2.10E-03 2.87E-03 0.00E+00 1.43E-01 9.30E-02
Data statistics: Number of countries with measurements, number of sites with measurements, total number of samples,
number of samples with concentration below LOD, number of samples with concentration below LOQ, and aggregate
percentage of quantified records (> LOD/Q).
countries sites samples samples < LOD samples < LOQ % quantified
21 5228 94952 2939 89615 2.53
Statistics for concentrations of all measurements: min, average (mean), standard deviation (SD), median, percentiles (25,
75, 90, 95, 99) and max (µg/L).
min mean SD median P25 P75 P90 P95 P99 max
0.000001 0.3562854 13.842418 0.125 0.05 0.25 0.5 0.5 2.5 2750
The boxplot displaying concentrations per year shows variable concentrations (including medians) but seems that
recently there is a decrease in the measured concentrations across Europe. The number of samples per year is given in a
separate table.

50
Year 2006 2007 2008 2009 2010 2011 2012 2013 2014
# samples 14987 25619 5093 13053 8840 10887 13587 2463 423
Although the annual mean concentrations tend to vary over time, the trend-line based on the mean concentrations per
year shows a recent downward tendency.
0
0.2
0.4
0.6
0.8
1
1.2
2005 2006 2007 2008 2009 2010 2011 2012 2013 2014 2015
Trichloroethylene : annual mean concentration (µg/L)

51
Boxplot of concentrations of all measurements per country (the table below indicates the number of samples per
country). There is a low number of countries withEQS exceedances (3 out of 21) in line with its zero Fspatial factor
Actually only one country showed a lot of exceedances).
Country #01 #02 #05 #06 #07 #08 #10 #12 #13 #14 #15 #16 #17
# samples
72 461 104 6371 1448 58 3982 69068 4281 107 620 228 399
Country #19 #20 #21 #24 #26 #28 #30 #31
# samples 2407 817 444 2108 1280 52 210 435
Conclusion
Trichloroethylene is not a candidate for deselection since it is still approved for use.