content · 5financial community . financial highlights . 1) before amortisation of acquisition...
TRANSCRIPT


2 Financial community – 17 January 2013
B
USI
NES
S O
VER
VIEW
CONTENT
FINANCIAL HIGHLIGHTS 2012 Highlights
Revenue Analysis
Operating Income Analysis
Cash Flows
Currency Analysis
Second Half 2012
BUSINESS OVERVIEW
FI
NAN
CIA
L H
IGH
LIG
HTS

3 Financial community – 17 January 2012

4
HIGHLIGHTS
Revenue growth of 16.3% to CHF 5.6 billion (historical rates) • 14.5% (constant currency)
Organic revenue growth of 10.2% (constant currency)
Adjusted Operating Income(1) up 12.9% (constant currency) to CHF 941 million resulting in a margin of 16.9%
Adjusted Net Income(1) up 10.5% (constant currency) to CHF 630 million
Restructuring costs net of tax of CHF 47 million
Net Income for the period of CHF 556 million
Basic EPS of CHF 72.97 per share
Proposed dividend to shareholders of CHF 58 per share • Ordinary dividend of CHF 30 per share • Additional dividend of CHF 28 per share
Financial community – 17 January 2013 1) Before amortisation of acquisition intangibles, restructuring, transaction and integration-related costs

5
FINANCIAL HIGHLIGHTS
1) Before amortisation of acquisition intangibles, restructuring, transaction and integration-related costs 2) Constant currency basis
Financial community – 17 January 2013
CHF million 2012December
2011December
2011December
Pro-forma(2) PublishedRevenue 5,578 4,874 4,797 Change in % 14.5 % 16.3 %
Adjusted Operating Income(1) 941 833 815 Change in % 12.9 % 15.4 %
Adjusted Operating Income Margin (1) 16.9 % 17.1 % 17.0 %
Operating Income (EBIT) 843 808 790 Change in % 4.3 % 6.7 %
Adjusted Net Income(1) 630 570 557 Change in % 10.5 % 13.1 %
Net Income 556 548 534 Change in % 1.5 % 4.1 %
Adjusted Basic EPS(1) (CHF) 82.65 73.53 75.24 Basic EPS (CHF) 72.97 72.23 70.52

6 Financial community – 17 January 2013
SERVICE PORTFOLIO
1) Before amortisation of acquisition intangibles, restructuring, transaction and integration-related costs
AGRI6.5%
MIN17.4%
OGC14.8%
LIFE1.8%
CTS24.8%
SSC7.8%
IND10.7%
ENVI3.6%
AUTO6.7%
GIS5.9%
ADJUSTED OPERATING INCOME(1)AGRI
6.6%
MIN15.6%
OGC18.7%
LIFE3.6%CTS
16.8%
SSC7.1%
IND16.1%
ENVI5.8%
AUTO5.1%
GIS4.6%
REVENUE
EUROPE / AFRICA /
MIDDLE EAST47.1%
AMERICAS24.4%
ASIA PACIFIC28.5%
REVENUE REGION

7

8 Financial community – 17 January 2013
REVENUE GROWTH COMPOSITION
RevenuesDecember 11 Organic Acquisitions Disposals
Currencyimpact
RevenuesDecember 12
4,797
495
209
77
5,578
10.2% 4.3% 0.0% 1.8% 16.3%
Constant currency growth: 14.5%

9 Financial community – 17 January 2013
LOCAL CURRENCY GROWTH BY BUSINESS
10.2%
17.3%
4.6%
6.6%
9.5%
6.2%
10.8%
0.9%
11.6%
13.8%
11.0%
4.3%
1.8%
6.6%
10.7%
2.1%
2.9%
0.6%
10.4%
1.3%
TOTAL
GIS
AUTO
ENVI
IND
SSC
CTS
LIFE
OGC
MIN
AGRI
Organic Acquisition Disposal
12.3%
24.2%
12.2%
3.8%
12.9%
6.2%
20.2%
13.2%
6.4%
17.3%
14.5%

10 Financial community – 17 January 2013
REVENUE GROWTH AND HEADCOUNT CHANGE BY REGION
10.2%
10.7%
12.6%
8.8%
4.3%
0.9%
15.5%
1.3%
TOTAL GROUP
Asia / Pacific
Americas
Europe / Africa & Middle East
Organic Acquisition Disposal
10.1%
28.1%
11.6%
14.5%
Δ in EOP headcount 2012December
2011December
Δ
Group Headcount 79,268 71,220 8,048
Organic Business Growth 4,738
Acquisitions 3,310
Disposals -
Increase in Group Headcount 8,048
By Region Headcount Δ
Headcount Δ%
Revenues Δ%
Europe / Africa / Middle East 1,465 4.7 % 10.1 %
Americas 4,436 30.9 % 28.1 %
Asia / Pacific 2,147 8.3 % 11.6 %
TOTAL 8,048 11.3% 14.5%

11

12 Financial community – 17 January 2013
ADJUSTED OPERATING INCOME(1) GROWTH
1) Before amortisation of acquisition intangibles, restructuring, transaction and integration-related costs
Op. IncomeDecember 11 Organic Acquisitions Disposals
Currencyimpact
Op. IncomeDecember 12
815
80 28
18
941
9.5% 3.4% 0.0% 2.5% 15.4%
Constant currency growth: 12.9%

13 Financial community – 17 January 2013
HISTORICAL MARGIN PROGRESSION
1) Before amortisation of acquisition intangibles, restructuring, transaction and integration-related costs
5.0%
10.0%
15.0%
20.0%
25.0%
Adjusted EBITDA MARGIN(1)
DEC 08 DEC 09 DEC 10 DEC 11 DEC 12
21.3% 22.0% 22.4% 21.3% 21.4% -
5.0%
10.0%
15.0%
20.0%
Adjusted OPERATING MARGIN(1)
DEC 08 DEC 09 DEC 10 DEC 11 DEC 12
17.0% 17.4% 17.8% 17.0% 16.9%

14 Financial community – 17 January 2013
ADJUSTED OPERATING MARGIN(1) BY BUSINESS
1) Before amortisation of acquisition intangibles, restructuring, transaction and integration-related costs
15.7
%
19.4
%
13.5
%
10.8
%
25.3
%
18.7
%
10.7
%
9.4%
21.9
%
23.4
%
16.6
%
18.8
%
13.3
%
8.7%
24.9
%
18.7
%
11.2
%
10.6
%
22.1
%
21.5
%
5.0%
10.0%
15.0%
20.0%
25.0%
30.0%
AGRI
MIN
OG
C
LIFE
CTS
SSC
IND
ENV
AUTO GIS
December 11 December 12

15
RESTRUCTURING COSTS
Financial community – 17 January 2013
AGRI1.0% MIN
7.1%
OGC10.3%
LIFE41.5%
CTS6.3%
SSC4.6%
IND12.8%
ENVI13.2%
AUTO3.2%
RESTRUCTURING BY BUSINESS
ACTIVITY CLOSURES
5.3%
LOCATION CLOSURES
51.2%
COST OPTIMISATION
43.5%
RESTRUCTURING BY TYPE
EUROPE / AFRICA /
MIDDLE EAST83.9%
AMERICAS13.2%
ASIA PACIFIC2.9%
RESTRUCTURING 2012 BY REGION

16
CASH FLOW
Financial community – 17 January 2013
CHF million Dec 12 Dec 11
PROFIT FOR THE PERIOD 590 561 Non-cash items 493 433
Depreciation, amortisation and impairment 281 225 Share based payments 14 15 Tax 218 203 Other (20) (10)
(Increase)/decrease in working capital (73) (84) Taxes paid (210) (220)
OPERATING CASH FLOW 800 690 Net (purchase)/sale of fixed assets (377) (337) Acquisition of businesses (182) (112) Other from investing activities - 6
CASH FLOW FROM INVESTING ACTIVITIES (559) (443) Dividend paid to equity holders of SGS SA (497) (494) Dividend paid to non-controlling interests (24) (16) Acquisition of non-controlling interests - (2) Net cash received/(paid) on treasury shares 76 (50) Interest paid (46) (21) Net flows on interest rate swaps 37 - (Decrease)/increase in borrowings (12) 716
CASH FLOW FROM FINANCING ACTIVITIES (466) 133 Currency translations (5) 16
INCREASE/(DECREASE) IN CASH AND CASH EQUIVALENTS (230) 396

17 Financial community – 17 January 2013
CAPITAL EXPENDITURE AGRI5.9%
MIN23.3%
OGC19.6%
LIFE4.9%
CTS21.2%
SSC1.3%
IND8.3%
ENVI5.4%
AUTO2.6%
GIS7.5%
CAPEX BUSINESS
EUROPE / AFRICA /
MIDDLE EAST43.4%
AMERICAS22.0%
ASIA PACIFIC34.6%
CAPEX REGION
100
200
300
400
Capital Expenditure Depreciation & amortisation
2007 2008 2009 2010 2011 2012
ANNUAL CAPEXCHF million

18 Financial community – 17 January 2013
FOREIGN CURRENCY REVENUES 2012
2012 2011 ChangeEUR 1.2055 1.2334 (2.3)% USD 0.9380 0.8868 5.8 % CNY 0.1487 0.1372 8.4 % AUD 0.9712 0.9144 6.2 % CAD 0.9384 0.8968 4.6 % GBP 1.4863 1.4210 4.6 % TWD 0.0317 0.0302 5.1 % CLP 0.0019 0.0018 5.1 % HKD 0.1209 0.1139 6.1 % BRL 0.4819 0.5306 (9.2)%
AVERAGE RATES
EUR28.4%
USD14.3%
CNY9.8%
AUD5.8%
CAD4.7%
GBP3.0%
TWD2.8%
CLP2.8%
HKD2.5%
Other25.9%

19 Financial community – 17 January 2013
FOREIGN CURRENCY SENSITIVITY ANALYSIS
EURO 1.17 1.21 1.24
Revenues (47) 0 45Income (4) 0 4
USD 0.91 0.94 0.97
Revenues (24) 0 27Income (2) 0 2
CNY 0.14 0.15 0.16
Revenues (32) 0 42Income (10) 0 13

20

21 Financial community – 17 January 2013
FINANCIAL HIGHLIGHTS (H2)
1) Before amortisation of acquisition intangibles, restructuring, transaction and integration-related costs 2) Constant currency basis
CHF million 2012H2
2011H2
2011H2
Pro-forma(2) PublishedRevenue 2,927 2,571 2,452 Change in % 13.9 % 19.3 %
Adjusted Operating Income(1) 528 465 441 Change in % 13.5 % 19.7 %
Adjusted Operating Income Margin (1) 18.0 % 18.1 % 18.0 %
Operating Income (EBIT) 470 451 427 Change in % 4.2 % 10.1 %
Adjusted Net Income(1) 354 319 301 Change in % 11.0 % 17.6 %
Net income 311 307 288 Change in % 1.3 % 8.0 %

22 Financial community – 17 January 2013
LOCAL CURRENCY GROWTH BY BUSINESS (H2)
9.3%
14.5%
3.9%
7.5%
9.9%
6.3%
10.3%
4.4%
12.0%
8.1%
9.1%
4.6%
0.5%
7.2%
11.8%
2.5%
4.7%
0.6%
9.9%
1.7%
TOTAL
GIS
AUTO
ENVI
IND
SSC
CTS
LIFE
OGC
MIN
AGRI
Organic Acquisition Disposal
10.8%
18.0%
12.6%
9.1%
12.8%
6.3%
21.7%
14.7%
4.4%
14.5%
13.9%
23 Financial community – 17 January 2013
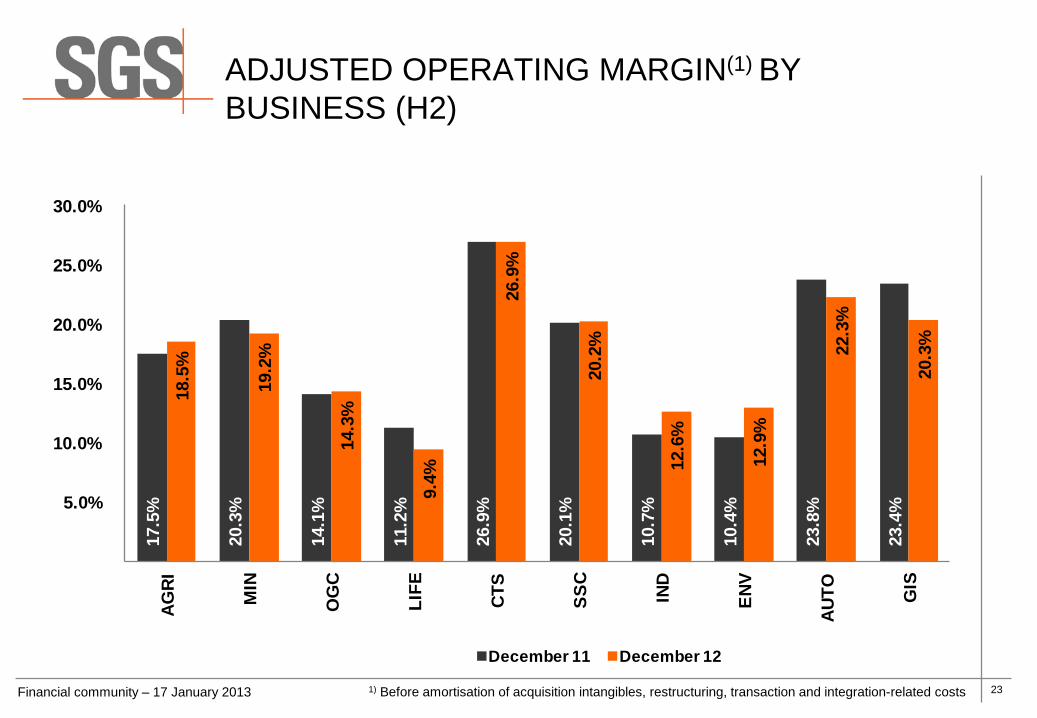
ADJUSTED OPERATING MARGIN(1) BY BUSINESS (H2)
17.5
%
20.3
%
14.1
%
11.2
%
26.9
%
20.1
%
10.7
%
10.4
%
23.8
%
23.4
%
18.5
%
19.2
%
14.3
%
9.4%
26.9
%
20.2
%
12.6
%
12.9
%
22.3
%
20.3
%
5.0%
10.0%
15.0%
20.0%
25.0%
30.0%
AGRI
MIN
OG
C
LIFE
CTS
SSC
IND
ENV
AUTO GIS
December 11 December 12
1) Before amortisation of acquisition intangibles, restructuring, transaction and integration-related costs

24

25
AGRICULTURAL SERVICES (AGRI)
Overview 2012 • Strong organic growth of 11.0%, driven by positive
markets for Trade Services; including grain exports from Eastern Europe, India and Latin America.
• Additional growth from full year impact of 2011 acquisitions plus WareCare (Pest Management) and Gravena (Contract Research) closed in 2012.
• Almost 30% growth in seed and crop services, supported by acquired expertise and geographical replication throughout the network.
• Successful commissioning of our flagship Food Safety and Cold Chain facility in India. Client uptake and market feedback positive.
Outlook • Black Sea export volumes lower in H1, partially
offset by other origins. Crop forecasts indicate recovery in H2.
• Double digit growth for seed and crop, especially precision farming and contract research. Expansion focused on South America, Africa and Asia Pacific.
• New revenues from support services to farming projects in Africa. Investments in Food Safety facilities and technical services for plant breeding.
CHF million December2012
December2011
December2011
Pro-forma2 Published
Revenue 369.5 329.0 327.1 Change in % 12.3 13.0
Adj. Operating Inc.(1) 61.3 51.8 51.2 Change in % 18.3 19.7
Margin %1 16.6 15.7 15.7
(2) Constant currency basis
(1) Before amortisation of acquisition intangibles, restructuring, transaction and integration-related costs
Financial community – 17 January 2013

26
MINERALS SERVICES (MIN)
Overview 2012 • Strong markets and focused sales activity resulted
in 24.2% revenue growth (13.8% organic). • CIMM integration well underway and margin
improvements ahead of plan. • Exceptional growth in Africa, Asia and the Americas. • All segments of the service portfolio delivered strong
organic growth. • Slowdown in coal and iron ore impacted mainly
Australia in H2. • Key project wins include
– Nui Phao on-site laboratory (Vietnam) – Base Resources on-site laboratory (Kenya)
Outlook • Integration of E&S Engineering Solutions acquisition. • Expect some slowdown in certain commodity
markets. • 9 new onsite lab and 3 commercial labs will
commence operations in 2013. • Financing for greenfield exploration projects will be
difficult in the early part of the year. • Continued focus on sales process, quality and back-
office efficiencies.
CHF million December2012
December2011
December2011
Pro-forma2 Published
Revenue 868.0 698.7 677.7 Change in % 24.2 28.1
Adj. Operating Inc.(1) 163.3 135.5 131.2 Change in % 20.5 24.5
Margin %1 18.8 19.4 19.4
(2) Constant currency basis
(1) Before amortisation of acquisition intangibles, restructuring, transaction and integration-related costs
Financial community – 17 January 2013

27
OIL, GAS & CHEMICALS SERVICES (OGC)
Overview 2012 • Strong organic growth of 11.6% sustained by solid
trade related services with both volume increases and market share gains.
• Outstanding growth in Upstream Services from Australia and Papua New Guinea onshore market and subsurface consultancy / reserves validation.
• Exceptional growth in Plant & Terminal Operations and Cargo Treatment Services, specifically in North America, largely offsetting reduced volumes in Europe due to terminal and refinery closures.
• Margin impacted by lower volumes in Europe and the Caribbean.
Outlook • Difficult trade market in Europe and the Caribbean to
remain, offset by growth in Asia and Middle East. • Continued growth in Upstream from unconventional
resources segment (shale oil and gas, biogas, tight gas, coal bed methane), Metering and Allocation projects, as well as Cased Hole Services.
• Increased gas production leading to strong growth in SGS GasPro™ Solutions and synergies with Environmental, Minerals and Industrial services.
CHF million December2012
December2011
December2011
Pro-forma2 Published
Revenue 1,046.0 932.0 911.7 Change in % 12.2 14.7
Adj. Operating Inc.(1) 139.2 126.0 123.3 Change in % 10.5 12.9
Margin %1 13.3 13.5 13.5
(2) Constant currency basis
(1) Before amortisation of acquisition intangibles, restructuring, transaction and integration-related costs
Financial community – 17 January 2013

28
LIFE SCIENCE SERVICES (LIFE)
Overview 2012 • Double-digit organic revenue growth in laboratory
services offset by weak Clinical Research results. • Laboratory growth driven by expansion in:
– Europe, led by the UK biologics laboratories – North America, with fully renovated QC facilities – Asia, with new state-of-art Mumbai laboratory
• Full integration of Vitrology completes the Biologics service offering, adding Biosafety and synergies with M-Scan.
• Weak results in early phase Clinical Research due to limited number of molecules reaching trial stage.
Outlook • Early phase clinical research market expected to
remain weak resulting in the intended closure of the Paris clinic.
• Expansion of the global key account strategy to address the needs of large pharmaceutical companies.
• Further synergies expected from the integration of newly acquired biopharmaceutical service offerings.
CHF million December2012
December2011
December2011
Pro-forma2 Published
Revenue 199.3 192.1 192.0 Change in % 3.7 3.8
Adj. Operating Inc.(1) 17.3 20.8 20.7 Change in % (16.8) (16.4)
Margin %1 8.7 10.8 10.8
(2) Constant currency basis
(1) Before amortisation of acquisition intangibles, restructuring, transaction and integration-related costs
Financial community – 17 January 2013

29
CONSUMER TESTING SERVICES (CTS)
Overview 2012 • Strong organic revenue growth of 10.8% driven by
Asia, South America, Eastern Europe and Middle East across the portfolio of activities.
• Major contributors are Softlines, E&E and Food thanks to further development of strategic accounts, market share gains and capacity expansion in new geographies to align with client strategies.
• Margin below prior year reflecting some labour cost increases in Asia as well as continued investments in new market segments and acquisitions not yet performing to expectations.
Outlook • Expanded capabilities in developing market
segments (E&E, Auto) and new segments of activity will drive growth in 2013.
• Continued strong growth in South America and Asia expected to continue at current pace.
• Western Europe expected to grow but at a lower rate due to current economic conditions.
• Focus on productivity efficiency programmes.
CHF million December2012
December2011
December2011
Pro-forma2 Published
Revenue 936.2 829.1 802.0 Change in % 12.9 16.7
Adj. Operating Inc.(1) 233.0 213.3 202.7 Change in % 9.2 14.9
Margin %1 24.9 25.7 25.3
(2) Constant currency basis
(1) Before amortisation of acquisition intangibles, restructuring, transaction and integration-related costs
Financial community – 17 January 2013

30
SYSTEMS & SERVICES CERTIFICATION (SSC)
Overview 2012 • Strong organic growth in China, South America,
Africa and Eastern Europe, partly offset by difficult European markets, particularly in Spain and Italy.
• Ongoing focus on efficiency improvements in response to an increasingly competitive environment.
• Weak performance in Australia due to the loss of an important contract within the mining industry.
• New developments in training and second party audit services becoming an increasing source of revenue.
Outlook • Expect solid growth across most markets,
particularly in Asia, Eastern Europe and the Americas, while Europe expected to remain weak.
• Further diversification of service portfolio within the training and second party audit segments.
• Cost optimisation with development of new IT platform to better respond to market needs.
• Improved performance of Italy and Australia thanks to 2012 restructuring.
CHF million December2012
December2011
December2011
Pro-forma2 Published
Revenue 394.9 372.0 364.0 Change in % 6.2 8.5
Adj. Operating Inc.(1) 73.7 70.3 68.2 Change in % 4.8 8.1
Margin %1 18.7 18.9 18.7
(2) Constant currency basis
(1) Before amortisation of acquisition intangibles, restructuring, transaction and integration-related costs
Financial community – 17 January 2013

31
INDUSTRIAL SERVICES (IND)
Overview 2012 • Strong organic growth of 9.5%, driven by Asia,
Australasia, Middle East and Africa. • Margin stabilised despite pressure in Europe as
investment projects are delayed. • Continued restructuring to align organisational
structure to the new market conditions in Europe. • Five acquisitions closed in 2012, mainly benefitting
the South American and African regions. • New organisation based on 4 strategic business
units: Oil & Gas; Power & Utilities; Infrastructure & Building; Transport, Equipment & Machinery.
Outlook • Limited organic growth expected in Europe while
other regions perform well (Americas, Asia and Africa).
• Growth in the Oil & Gas segment expected mainly in North America while growth in the Infrastructure & Building segment expected in South America.
• Investments in materials testing capabilities will become operational in 2013.
• Focus on margin improvements remains key.
CHF million December2012
December2011
December2011
Pro-forma2 Published
Revenue 898.6 747.8 747.0 Change in % 20.2 20.3
Adj. Operating Inc.(1) 100.3 80.1 80.0 Change in % 25.2 25.4
Margin %1 11.2 10.7 10.7
(2) Constant currency basis
(1) Before amortisation of acquisition intangibles, restructuring, transaction and integration-related costs
Financial community – 17 January 2013
32
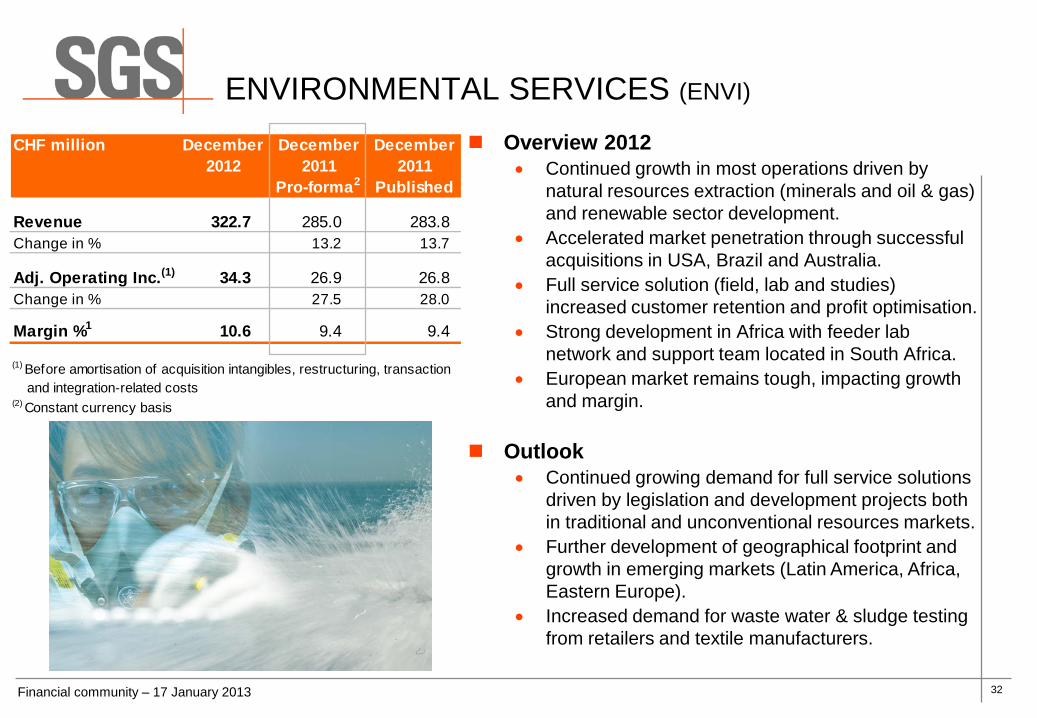
ENVIRONMENTAL SERVICES (ENVI)
Overview 2012 • Continued growth in most operations driven by
natural resources extraction (minerals and oil & gas) and renewable sector development.
• Accelerated market penetration through successful acquisitions in USA, Brazil and Australia.
• Full service solution (field, lab and studies) increased customer retention and profit optimisation.
• Strong development in Africa with feeder lab network and support team located in South Africa.
• European market remains tough, impacting growth and margin.
Outlook • Continued growing demand for full service solutions
driven by legislation and development projects both in traditional and unconventional resources markets.
• Further development of geographical footprint and growth in emerging markets (Latin America, Africa, Eastern Europe).
• Increased demand for waste water & sludge testing from retailers and textile manufacturers.
CHF million December2012
December2011
December2011
Pro-forma2 Published
Revenue 322.7 285.0 283.8 Change in % 13.2 13.7
Adj. Operating Inc.(1) 34.3 26.9 26.8 Change in % 27.5 28.0
Margin %1 10.6 9.4 9.4
(2) Constant currency basis
(1) Before amortisation of acquisition intangibles, restructuring, transaction and integration-related costs
Financial community – 17 January 2013

33
AUTOMOTIVE SERVICES (AUTO)
Overview 2012 • Statutory business provided solid results in Western
Europe, Africa, North and South America. New Road Safety related services rolled out in Kenya.
• As anticipated, commercial activities in the USA negatively impacted by significantly lower volumes.
• Certified-Pre-Owned audits extended for Volvo and Ford.
• Secured tender for Identity Authentication Services as part of the driver’s license programme in Ireland.
• Strong engine testing results in the USA with vehicle testing picking up in Q4.
Outlook • Statutory business will continue to provide solid
results. • Commercial inspection volumes expected to pick up
in 2013 with further increase in 2014. • Several opportunities being pursued in the statutory
field in Asia, Africa, North and South America. • Expanding Road Safety services and commercial
audit activities.
CHF million December2012
December2011
December2011
Pro-forma2 Published
Revenue 286.9 269.7 270.2 Change in % 6.4 6.2
Adj. Operating Inc.(1) 63.4 58.5 59.3 Change in % 8.4 6.9
Margin %1 22.1 21.7 21.9
(2) Constant currency basis
(1) Before amortisation of acquisition intangibles, restructuring, transaction and integration-related costs
Financial community – 17 January 2013

34
GOVERNMENTS AND INSTITUTIONS SERVICES (GIS)
Overview 2012 • Very strong organic growth of 17.3% driven by the
increasing scale of Product Conformity Assessment (PCA) programmes.
• Pre-Shipment Inspection volumes remained solid and stable on all programmes, including a renewed programme for Haiti.
• Strong performance for TradeNet in Ghana and Madagascar and excellent start for Mozambique.
• First ever Forestry monitoring programme with scanners implemented in Democratic Republic of Congo (DRC).
• New Telecom Monitoring in Rwanda and Uganda. Outlook
• Continued growth from PCA programmes. • Termination of Nigeria Destination Inspection
contract with limited impact on operating income. • Complete deployment of TradeNet in Mozambique. • Complete implementation of new mandates:
• DRC and Congo (Forestry), • Ghana (Ghana Revenue Authority).
• New contracts for cargo tracking and telecoms monitoring.
CHF million December2012
December2011
December2011
Pro-forma2 Published
Revenue 256.0 218.3 221.7 Change in % 17.3 15.5
Adj. Operating Inc.(1) 55.1 50.0 51.8 Change in % 10.2 6.4
Margin %1 21.5 22.9 23.4
(2) Constant currency basis
(1) Before amortisation of acquisition intangibles, restructuring, transaction and integration-related costs
Financial community – 17 January 2013

35
2013 INVESTOR HIGHLIGHTS
Financial community – 17 January 2013

36
WWW.SGS.COM
© SG
S SA
2013
. ALL
RIG
HTS
RESE
RVED
.