contamination of surface waters by the former …supervisor: andrés calizaya terceros, phd....
TRANSCRIPT

Faculty Science and Technology
Campus Schoonmeersen Valentin Vaerwyck weg 1 9000 Gent
Internship: Hydraulic and Hydrology Institute – IHH - University San Andres; Engineering Faculty. Promoter: Karla Berckmoes, PhD. Supervisor: Andrés Calizaya Terceros, PhD.
Contamination of surface waters by the former
mining industry in the Milluni Valley (Cordillera
Real, Bolivia) and the application of the water
planning model WEAP
Thesis nominated to obtain the degree of
Bachelor in chemistry
by Kim Driesen
Academic year 2011-2012

Contamination of surface waters by the former
mining industry in the Milluni Valley (Cordillera
Real, Bolivia) and the application of the water
planning model WEAP

Abstract As an internship for the University College of Ghent, a study was done at the University Mayor de San
Andres in La Paz, Bolivia. This study concerns the Milluni-valley in the Cordillera Real, about 20
kilometers North of the capital city La Paz. This area experiences a large contamination problem due
to the waste water deriving from the Milluni-mine, which was active until 1990.
Melting water from glaciers in the mountain Huayna Potosi and water deriving from precipitation
was captured and continuously used inside the mines to transport and to extract the minerals won
by the miners. During the process, a lot of chemical reagents were used to improve the separation of
the minerals. Finally, the waste water of the extracting process has been discharged again in the
water basin of Milluni, containing remains of heavy metals and chemical reagents.
This discharged water mixes with the clear water deriving from Pata Khota, a basin where the
precipitation water and the melting water from the glaciers is collected. The mixture, consisting of a
large amount of contaminated water, flows by a canal to the water treatment plant Achachicala.
High costs are done to neutralize the water and to convert it to drinking water.
A sampling took place to analyze anions, cations and heavy metals in 9 sampling points. The results
of these analyses are discussed in this thesis.
This thesis also describes a software program called WEAP: Water Evaluation And Planning system.
The possibilities of the software are presented by applying the model WEAP to the area of Milluni.
After defining the current situation, a reference scenario can be developed which can represent what
will happen in the future if the current conditions (like population growth, precipitation level…) stays
the same. Next, a scenario can be made based on the reference scenario, to observe what will
happen if certain parameters change in the future. Concerning the Milluni-valley, scenarios where
developed, researching what will happen in the future if the population growth rate increases and if
the precipitation level alters.


Acknowledgements To complete the “Professional Bachelor of Chemistry – Environmental Technology” at the University
College of Ghent, Belgium, I accomplished an internship of eleven weeks at the University Mayor de
San Andres of La Paz, Bolivia. I was accompanied by Andres Calizaya Terceros, professor at the
University Mayor de San Andres. My Belgian promoter was Karla Berckmoes and my co-promoter
was Christine Van der Heyden.
Before I start describing the situation, I would like to express my gratitude to people who helped me
to complete this thesis.
First, I would like to thank my mother and her friend, for supporting me psychologically and
financially at all times when I spent 4 months in La Paz, Bolivia. Also I would like to thank them for
rereading this thesis for errors.
I thank Prof. Andres Calizaya Terceros for giving me this opportunity to work at the Milluni-project,
for getting me into contact with a lot of interesting people to help me understand the WEAP-
software and to support me during my stay in La Paz.
Also I would like to thank my good friend Eva Horemans for correcting errors in this thesis.
I would like to thank the University College of Ghent to give me the opportunity of doing my
internship abroad and to enlarge my knowledge about environmental problems in the world. I also
thank my promoter and co-promoter to help me find an internship and to support me during the my
time in La Paz.
In the end I thank VLIR-UOS, for giving students the opportunity to go and work on a project in a
developing country by supporting them financially.
Thanks to all these people, I experienced an amazing way to learn about my study field and to enrich
my view of other cultures.

1 Contents Abstract .....................................................................................................................................................
Acknowledgements ...................................................................................................................................
List of Figures .............................................................................................................................................
List of Tables ..............................................................................................................................................
Introduction ............................................................................................................................................. 1
1 Theoretical description of WEAP ..................................................................................................... 3
1.1 Introduction ............................................................................................................................. 3
1.2 Description .............................................................................................................................. 3
2 Description of the study area Milluni .............................................................................................. 6
2.1 Physical description of the study area .................................................................................... 6
2.1.1 Geographical situation .................................................................................................... 6
2.1.2 Geology ............................................................................................................................ 8
2.1.3 Climatology ...................................................................................................................... 9
2.1.4 Hydrology ........................................................................................................................ 9
2.2 Socio-economical description ............................................................................................... 11
2.2.1 Population ..................................................................................................................... 11
2.2.2 Economy ........................................................................................................................ 13
2.3 The contamination problem in the Milluni Valley ................................................................. 14
2.3.1 Water use for the treatment of minerals ...................................................................... 14
2.3.2 Types of contamination ................................................................................................. 15
3 Physicochemical study of the Milluni Valley ................................................................................. 17
3.1 Selection of the sampling points ........................................................................................... 17
3.2 Physicochemical analyses ...................................................................................................... 18
3.2.1 In Situ ............................................................................................................................. 18
3.2.2 Anions ............................................................................................................................ 19
3.2.3 Cations ........................................................................................................................... 21
3.2.4 Heavy Metals ................................................................................................................. 22
3.3 Discussion of the water quality ............................................................................................. 23
3.3.1 Comparison of the permissible limits of Bolivia and Belgium ....................................... 23
3.3.2 Physical characteristics of the water ............................................................................. 23
3.3.3 Chemical characteristics of the water ........................................................................... 23

4 Application of the WEAP model in the study area ........................................................................ 25
4.1 Discussion of the map ........................................................................................................... 25
4.2 Current Accounts ................................................................................................................... 26
4.3 Reference Scenario ................................................................................................................ 29
4.3.1 Population Growth ........................................................................................................ 29
4.3.2 Water Year Method ....................................................................................................... 31
4.4 What-if Scenarios .................................................................................................................. 32
4.4.1 Scenario: High Population Growth ................................................................................ 33
4.4.2 Extended Dry Climate .................................................................................................... 34
4.4.3 Influence of scenarios at each other. ............................................................................ 35
4.4.4 Priority Changes............................................................................................................. 36
5 Results and discussion ................................................................................................................... 39
5.1 Water Quality ........................................................................................................................ 39
5.2 WEAP ..................................................................................................................................... 39
6 Conclusions and recommendations .............................................................................................. 41
6.1 Conclusions ............................................................................................................................ 41
6.2 Recommendations................................................................................................................. 41
References ............................................................................................................................................. 43
Appendices ............................................................................................................................................ 45

List of Figures Figure 1: Google maps print screen: The contamination of the Milluni-lake (Google Maps, 2012,
https://maps.google.be/) ........................................................................................................................ 7
Figure 2: Milluni Chico ............................................................................................................................. 8
Figure 3: Leak of the dam at Milluni Chico – Llamas walking through and drinking the water ........ 8
Figure 4: Google maps 3D print screen (Google maps 3D, 2012, https://maps.google.be/) .................. 8
Figure 5: The rising clouds ....................................................................................................................... 9
Figure 7: Flow (m³/s) and Depth (mm) chart of the Milluni basin (Calizaya, A., 2010, Hidrologia) ...... 10
Figure 6: Monthly Average Precipitation Milluni basin (mm/day) (Calizaya, A., 2010, Hidrologia)...... 10
Figure 8: Coverage of demand – only 92,75 % of the population has availability to drinking water
(ANESAPA, 2011, www.anesapa.org) .................................................................................................... 11
Figure 9: Minerals inside the mines of Potosi ....................................................................................... 12
Figure 10: Mine workers inside the mines of Potosi ............................................................................. 13
Figure 11: Milluni Chico ......................................................................................................................... 13
Figure 12: Water treatment plant Achachicala (2012, http://www.talis-group.com) .......................... 14
Figure 13: Adding of chemical reagents to extract the minerals from the Potosi-mines ..................... 15
Figure 14: Canal Mina: the canal deriving from the Milluni-mine ........................................................ 16
Figure 15: Contamination by solid waste in the Milluni-valley ............................................................. 16
Figure 16: ArcGIS-map of the Milluni-valley The blue dots are sample points of 2012. ....................... 17
Figure 17: Portable Multiparameter for Water Quality HI 9828 – Hanna Instruments ........................ 18
Figure 18: WEAP-model: Map water resources .................................................................................... 25
Figure 19: WEAP-model – data view – Current Accounts – annual activity level ................................. 26
Figure 20: Results – Water demand La Paz and El Alto ......................................................................... 27
Figure 21: WEAP-model – Current Accounts – All other reservoirs – Headflow – Monthly data ......... 28
Figure 22: Key assumption – Population Growth Rate ......................................................................... 29
Figure 23: Population Growth: Result – Water Demand ...................................................................... 30
Figure 24: Population Growth: Result – Unmet Demand ..................................................................... 30
Figure 25: WEAP-model – Data – Hydrology - Water Year Method...................................................... 31
Figure 26: Water Year Type in the Reference Scenario ........................................................................ 31
Figure 27: WEAP-model: Data - Water Year Method ............................................................................ 32
Figure 28: Manage Scenarios-window .................................................................................................. 32
Figure 29: High Population Growth Scenario: 5,0% .............................................................................. 33
Figure 30: High Population Growth Scenario: Water Demand ............................................................. 33
Figure 31: High Population Growth Scenario: Unmet Demand ............................................................ 34
Figure 32: Extended Dry Climate Scenario – Water Year Method ........................................................ 34
Figure 33: Extended Dry Climate Scenario – Unmet Demand .............................................................. 35
Figure 34: Manage Scenarios ................................................................................................................ 35
Figure 35: Results – Comparing Scenarios ............................................................................................ 36
Figure 36: Results – Priority Changes compared to the Reference Scenario ........................................ 36
Figure 37: Map of Orientations – Milluni-basin .................................................................................... 47
Figure 38: Map of Slopes – Milluni-basin .............................................................................................. 48
Figure 39: Treatment plant of Achachicala (EPSAS, 2012) .................................................................... 50
Figure 40: Total map of the Milluni-valley displayed with WEAP ......................................................... 52
Figure 41: Result – Comparing Scenarios .............................................................................................. 54

List of Tables Tabel 1: Sampling points in the Milluni-valley ...................................................................................... 18
Tabel 2: In situ Measurements .............................................................................................................. 18
Tabel 3: Anions results .......................................................................................................................... 19
Tabel 4: Carbonate and bicarbonate results ......................................................................................... 20
Tabel 5: Cations results ......................................................................................................................... 21
Tabel 6: Heavy metals results ................................................................................................................ 22
Tabel 7: Heavy metals R², slope and min. detection limit ..................................................................... 22
Tabel 8: Import necessary data to simulate scenarios (INE, 2010) ....................................................... 26
Tabel 9: Head flow Pata Khota .............................................................................................................. 27
Tabel 10: Information of Milluni and Pata Khota (EPSAS, 2010) ........................................................... 46
Tabel 12: Physiological characteristics – Milluni-basin (Calizaya, 2012) ............................................... 49
Tabel 13: Comparison Permissible Limits Belgium and Bolivia “G:” stands for “Guideline” ................ 51
Tabel 11: Monthly Flow 2000-2010 Milluni-basin (Calizaya, 2010) ...................................................... 53


1
Introduction To complete the ‘professional bachelor of chemistry – environmental studies’ at the University
College of Ghent, I accomplished an internship of eleven weeks at the University Mayor de San
Andres of La Paz, Bolivia. During the internship I examined a certain water basin which was
contaminated by heavy metals due to waste water of the mine Milluni. I took samples at 9 effluents
of the lakes located in the Milluni-valley. Except for the In-Situ-measurements, all analyses were
done at the laboratory of the “Instituto de Investigaciones Quimica” of the University Mayor de San
Andres (IIQ-UMSA) in La Paz.
In this thesis, I have described the current situation and I have tried to give a view of the conditions
the inhabitants suffer from. Afterwards I have made a map with a Water, Evaluation And Planning
model (WEAP). With this map, I try to indicate the problem and to estimate what can happen if the
current situation stays the same. Hopefully, this map can be used to present the problem to certain
organizations, f.e. the Inter-American Development Bank, to ask for support to eliminate the
contamination in the Milluni-valley.
This thesis is divided into four chapters. The first chapter contains the description of the WEAP,
which is used to develop scenarios about the study area. In the second chapter, a full description of
all aspects of the area is displayed. The third chapter is dedicated to present the current water
quality of the basin. In this chapter I discuss the results of the analyses. Finally, scenarios concerning
the Milluni-basin are calculated in the fourth chapter. These scenarios give an estimation of what will
happen in the future when certain conditions change (f.e. precipitation, population…).
While writing this thesis I experienced some difficulties finding the right information. Most
information about the Milluni-valley is only known from theses. However not every thesis contains
the same information and some theses were old and don’t correspond with the results I have
witnessed during the sampling.

2

3
1 Theoretical description of WEAP
1.1 Introduction For a well integrated management of water resources, the development of a system for water
planning is required.
WEAP is a software program, developed by the Stockholm Environment Institute, which makes an
integral approach of the planning of water resources. The abbreviation WEAP stands for “Water
Evaluation And Planning”. The institute gives free licenses for the software to non-governmental
organizations, government agencies, and academic institutions in developing countries. About 50
projects around the world are using the software for mapping water systems. The university Mayor
de San Andres from La Paz in Bolivia meets the requirements to obtain a free license. (Universidad
Ángela Salinas Villafañe, 2009)
Many regions all over the world experience challenges to preserve a well-working freshwater
management. These challenges can occur as limited water resources, environmental quality goals
and policies for sustainable water use. Global warming is thought to be an important underlying
cause of many of those issues. As a forecasting tool, the software simulates water demand, supply,
flows, storage, pollution, treatment and discharge. For political analysis, WEAP can take multiple and
competing uses of water systems into account. The main purpose of the software is to give a realistic
view of the distribution of the available water resources. (Stockholm Environment Institute, 2012)
To represent this image, the software is required to take different hydrological systems like
superficial, subterranean, saturated zones and non-saturated zones into account.
WEAP is a mathematical model of which the representation is based on mathematical symbols,
containing variables, parameters and relations like equations or inequalities. Its aim is to incorporate
water demand and water supply into a practical tool for water resources planning. As a demand side
water use patterns, re-use, prices, hydropower energy demand… can be observed. Supply sides can
describe the stream flow, groundwater, reservoirs and water transfers. WEAP places those two sides
on an equal footing in the equation. (Universidad Ángela Salinas Villafañe, 2009)
A model of a certain area is no more than just a formal representation of the reality that is tried to be
described, analyzed and understood. The model is used to study, plan, design or verify a prototype
by using certain data that predict what will happen at another place or time. In most cases, a WEAP-
model can reduce costs, risks and time.
The software is applied to the Milluni-area to verify the compatibility of the software, the projects
and the plans in the area for the development of the water sources. The application can verify if a
realistic image of the distribution of the available water resources in the Milluni-area can be
represented and if future scenarios can be predicted concerning the quality and quantity of water.
1.2 Description The use of WEAP includes usually several steps (Universidad Ángela Salinas Villafañe, 2009):
Determination of the study: this includes defining the time frame, special limits and the
structure of the problem.

4
Current Accounts: the Current Accounts represent the basic definition of the water system as
it currently exists and forms the foundation of all scenarios analysis. It represents the actual
water demand, load of pollutants and the sources and resources for the system. This can be
perceived as the calibration step in the development of the application.
Scenarios: Scenarios are story-lines of how a system might evolve in time in particular
conditions. These conditions can be set by changing the socio-economic setting or the policy
or technology conditions. The scenarios represent an image of the system of what will
happen in the future with the water demand and the water supply after changing conditions
like costs, future politics, climate… These alternative scenarios can be compared to each
other. The comparison can be a very useful guideline to develop policies for water systems
from local to regional scales.
Evaluation: The scenarios will be evaluated taking certain aspects into account like the
availability of water, the costs and the profit, the environmental aspect and the sensitivity to
uncertainty in the key variables.
The scenarios can cause a range of "what if" questions. For instance: What will happen if population
growth and economic development patterns change? What if reservoir operating rules are changed?
What if the permissible limits for surface water are tightened? What if new sources of water
pollution are added? What if a more efficient irrigation technique is added? What if the precipitation
level increases or the temperature rises due to global warming? These scenarios can be viewed
simultaneously in the results to compare their effects on the water system or to present a realistic
image of what may happen in the future.
The software works according to priorities. Therefore three forms of water consumption can be
distinguished (Universidad Ángela Salinas Villafañe, 2009):
I. Consumed water: the water disappears. For example irrigation. An important part of the
irrigated water disappears due to evapotranspiration from the vegetation. Another large part
of the water is getting stored in the vegetation. Only a small part returns in his original
shape. This discharged water is usually highly contaminated by nutrients and agro toxics.
Also human consumption is an example. The efficiency is about 80%.
II. The use of water without change of the available amount. For example in an hydroelectric
power. The water can be diverted in a section of the river and be returned in the same
conditions several kilometers downstream.
III. The use of water without the change of quantity but with change of quality. For example:
refrigerant cooling water or diluents.
In general WEAP uses the following scale of priorities (Stockholm Environment Institute, 2012):
1. Human consumption: f.e. drinking water
2. Irrigation
3. Hydroelectric power
4. Industrial and mining use
5. Dilution for pollutants

5

6
2 Description of the study area Milluni
2.1 Physical description of the study area
2.1.1 Geographical situation
Bolivia is a country located in the middle of South America, divided into 9 departments including the
department of La Paz. In the department of La Paz, the city La Paz and the city El Alto are situated
next to each other. La Paz is located on the slopes of the Andes, while El Alto is located at the flat
area on top of the Altiplano Highlands. La Paz is considered to be the administrative capital city and
also the largest city of Bolivia. With the altitude of 3650 meters, La Paz also contains the title of
highest located capital city all over the world. (Encyclopedia Bolivia, 2012)
El Alto is considered to be the suburb of La Paz. Today, it is one of Bolivia’s largest and fastest-
growing urban centers. With a population of 649 958 in 2001, the city’s population increased to
nearly 900 000 in 2010, and this increase is not downsizing yet as the average age is only about 20
years old. Part of the increase of population derives from migration of people from the countryside,
who claim that farming becomes too hard due to the effects of global warming. (Instituto Nacional
de Estadística, 2012)
The Cordillera Real is a mountain range in the Andes in the South American Altiplano of Bolivia with a
lot of lakes at a high altitude. Most lakes are located in four glacial valleys in the provinces
Omasuyos, los Andes and Murillo, in the department of La Paz. The names of the valleys arrive from
the names of the biggest lake present in the area: Hichu Khota, Ovejuyo, Tunicondoriri and Milluni.
(Chavez Apaza, 1991)
The Milluni-area is situated at an altitude of 4600 meters above sea level in the North of the province
of Murillo, canton Achocalla, about 20 kilometers North of the capital city La Paz. It has the typical
geomorphologic U-shape, characteristic of glacier regression, and exists of several small lakes and
their effluents elongated over 30 km. The area is situated on the Southern latitude 16°08 – 16°10 and
the Western longitude 68°17 – 68°21. The surface of the biggest lake, Milluni Grande, is 237 hectares
and the profundity is about 4 meters. (Rios, 1985)

7
Figure 1: Google maps print screen: The contamination of the Milluni-lake (Google Maps, 2012, https://maps.google.be/)
According to the contamination, four different types of lakes can be observed which all four are
connected (Rios, 1985):
- Pata Khota at 4670 meters (not contaminated)
- Jankho Khota at 4575 meters (slightly contaminated)
- Milluni Chico at 4540 meters (heavily contaminated)
- Milluni Grande at 4530 meters above sea level (heavily contaminated)
The principal head flow of the Milluni-basin consists of water coming from the glaciers of Huayna
Potosí (6088 m), one of the most important mountains of the Cordillera Real, and the affluent of the
lake that is located more above.
The highest located lake is Pata Khota. This lake has a chemical composition that characterizes a
natural lake on a high altitude in the mountains. The water of the Pata Khota-lake flows to the
Jankho Khota-lake. This lake experiences an acidification in the North-Southern direction due to
ancient water discharges of the mine-activity of the company COMSUR at the Southern side of the
lake. Until 1990 COMSUR used water from the Milluni-flow to cool down machinery and to transport
and segregate ores to the outside (Rios, 1985). The remainder of the waste water was discharged
back into the Milluni-flow. Nowadays the waste water of the mines is getting discharged by a canal
that flows into a separate lake; Milluni Chico. This lake exists of highly concentrated contaminated
water coming straight from the mines. A dam was built, but due to large leaks, the heavily
contaminated water deriving from the mines flows straight into the water basin Milluni Grande. Over
here the water mixes with the pure and clean water that comes via a by-pass canal from the glaciers.
The mixed water still has a high conductivity, is extremely acid, has a high concentration on metallic
ions and contains a large presence of heavy metals. Because of the contamination, Milluni Chico and
consequently also Milluni Grande are colored red.

8
2.1.2 Geology
Northerly of the area the mountain Huayna Potosi is situated. The peaks consist of a rocky structure
and reach an altitude of 6000 meters and more. In the South the depression of the Altiplano is filled
with sediments. The Milluni-area is located between those two regions. The area is dominated by
wide U-shaped valleys with a glacial character and with relatively small slopes (Salvarredy-Aranguren,
2008).
The Milluni Valley is part of the Bolivian Tin Belt. Because of this natural resource Bolivia became the
biggest tin-producer in the world for almost all of the 20st century. The Milluni Mine, also known as
“La Mina Fabulosa”, operated between 1940 and 1990 by the company COMSUR. The most
important extracted minerals where Sn and Zn. Since the beginning of the mining activities, a variety
of potentially harmful elements (PHEs) have been drained into the Milluni reservoir. A large volume
of sulphate-rich mine waste has been deposited in the area of Milluni until the nineties. (Rios, 1985)
This reservoir used to be one of the principal reservoirs of drinking water for the population of the
city La Paz. Between 1940 and 1987 the reservoir provided water for the central and the north part
of the city (Rios, 1985). The contamination with PHEs consists of a high content of Fe, Mn, Zn, As, Cd,
Cu and Sn in the reservoir.
Figure 4: Google maps 3D print screen (Google maps 3D, 2012, https://maps.google.be/)
Figure 3: Leak of the dam at Milluni Chico – Llamas walking through and drinking the water
Figure 2: Milluni Chico

9
In the North, a granitic terrain partially covered by glaciers can be observed. Going further down to
the South, the Milluni Valley consists of fine-grained sandstone. The main ore minerals in the region
are pyrite, marcasite, sphalerite, arsenopyrite and cassiterite (Salvarredy-Aranguren, 2008).
However the mining happened underground, a large amount of mining waste was discharged in the
Milluni Chico-lake.
2.1.3 Climatology
The Andes Mountains are a strong climatic barrier. The Northern-orientated slope is moister than the
Southern-orientated one because it receives the moisture winds from the Amazonian basin. On the
Northern side the clouds experience the phenomena of “the Rising Clouds” or “Relief Rainfall”. When
the wind blows the clouds up against the high mountains of the Cordillera Real, they cool down and
can cause a heavy snow or rainfall. Another possibility is the rise of humid air at areas with high
temperatures. Again heavy clouds can be formed which can cause snow or rainfall. This can be
observed like the clouds are climbing over the mountains.
The study Area Milluni experiences a tropical climate of high mountains which most part of the year
are covered with snow or ice. The hydrological and climatic characteristics of the Milluni basin can be
considered as similar to those of the nearby Zongo valley. At this area, the annual average
precipitation level amounts to 800 mm and the annual average temperature amounts to 5,4°C at
4310 meters above sea level (Rios, 1985).
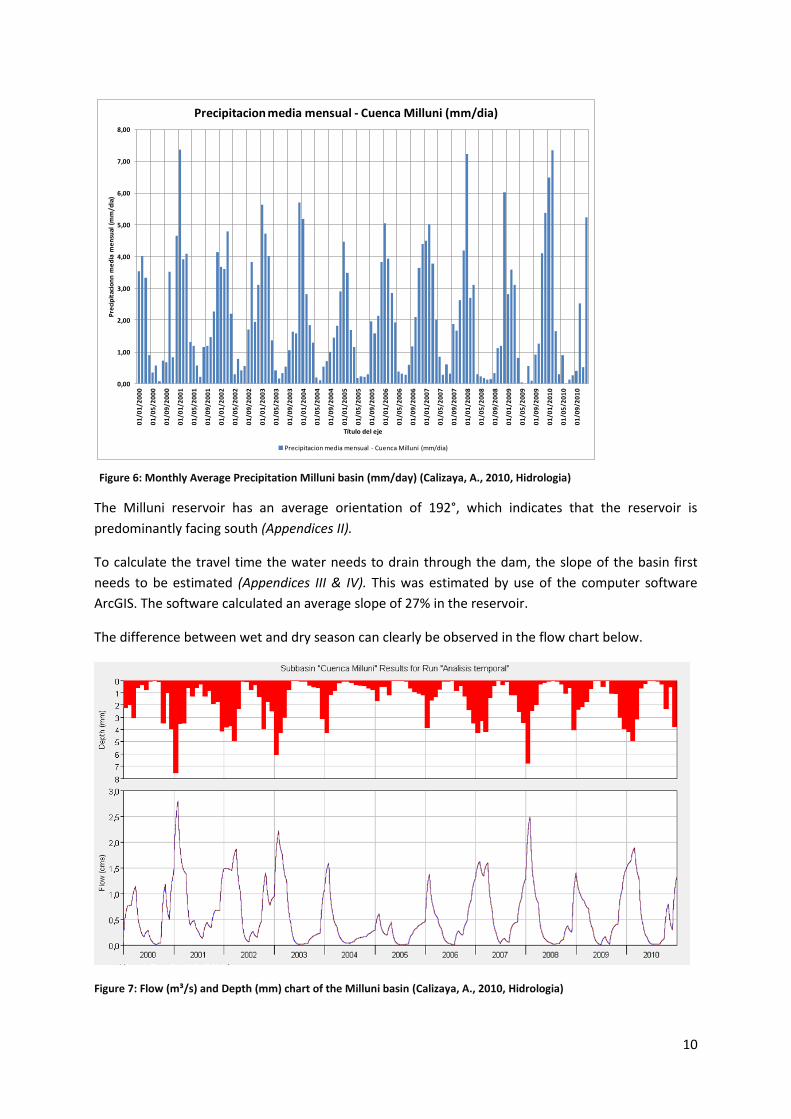
2.1.4 Hydrology
The hydrological characteristics of the Milluni basin (Appendices I) can be considered to be similar to
those of the nearby Zongo valley: a dry season and a wet season. The dry season occurs from April to
September, while the wet season covers October to March. (Calizaya, 2010)
There is an increase of precipitation during the wet season with a maximum in March. This causes an
increase in head flow during the wet season.
Figure 5: The rising clouds
10
The Milluni reservoir has an average orientation of 192°, which indicates that the reservoir is
predominantly facing south (Appendices II).
To calculate the travel time the water needs to drain through the dam, the slope of the basin first
needs to be estimated (Appendices III & IV). This was estimated by use of the computer software
ArcGIS. The software calculated an average slope of 27% in the reservoir.
The difference between wet and dry season can clearly be observed in the flow chart below.
Figure 7: Flow (m³/s) and Depth (mm) chart of the Milluni basin (Calizaya, A., 2010, Hidrologia)
0,00
1,00
2,00
3,00
4,00
5,00
6,00
7,00
8,000
1/0
1/2
00
0
01
/05
/20
00
01
/09
/20
00
01
/01
/20
01
01
/05
/20
01
01
/09
/20
01
01
/01
/20
02
01
/05
/20
02
01
/09
/20
02
01
/01
/20
03
01
/05
/20
03
01
/09
/20
03
01
/01
/20
04
01
/05
/20
04
01
/09
/20
04
01
/01
/20
05
01
/05
/20
05
01
/09
/20
05
01
/01
/20
06
01
/05
/20
06
01
/09
/20
06
01
/01
/20
07
01
/05
/20
07
01
/09
/20
07
01
/01
/20
08
01
/05
/20
08
01
/09
/20
08
01
/01
/20
09
01
/05
/20
09
01
/09
/20
09
01
/01
/20
10
01
/05
/20
10
01
/09
/20
10
Pre
cip
itac
ion
n m
ed
ia m
en
sual
(m
m/d
ia)
Título del eje
Precipitacion media mensual - Cuenca Milluni (mm/dia)
Precipitacion media mensual - Cuenca Milluni (mm/dia)
Figure 6: Monthly Average Precipitation Milluni basin (mm/day) (Calizaya, A., 2010, Hidrologia)

11
In 1989, a bypass canal was built to drain the waters of Jankho Khota down to the North of the
Milluni-lake to improve the physical conditions of the lakes. This goal was not succeeded, because of
presence of sediments that were still contaminated. Later on, the canal was extended to the South of
the Milluni-lake, trying to avoid the contamination of the clear waters by the sediments in the
Milluni-lake. However, the mixture of both waters still ended up highly contamined. (Chavez Apaza,
1991)
2.2 Socio-economical description
2.2.1 Population
The cities La Paz and El Alto are provided with
drinking water by four water supply plants: El Alto,
Pampahasi, Tilata and Achachicala. These supply
plants don’t have the capacity to deliver sufficient
safe water to the entire population of the cities
(ANESAPA, 2011). Specifically in El Alto and in the
North-Eastern hillsides of La Paz, the water supply
often reaches a shortage (ANESAPA, 2011). The
municipal government and the water companies are
struggling to provide enough drinking water. If the
water problems remain unsolved, about 20% of the
total population of La Paz city will see their access to
safe water drop and poverty levels will further
increase. To top this, the increased melting of the
glaciers during the last decades presents a
fundamental problem for the water supply in the
future (Condóm & Escobar, 2011).
The most important water supply arrives from the treatment plant Achachicala. In 1970, the
treatment plant already was extended from a production capacity of 400 l/s to 1000 l/s due to the
increasing demand. (Erhard, 2012)
Since the nineties the municipal water and sewerage company of La Paz, SAMAPA, adds large
quantities of calcium and sulphate to the water that enters the treatment plant of Achachicala to
eliminate the high proportions of iron, manganese and zinc. These high doses have a significant
impact on the treatment costs for the purification of the contaminated water.
If this problem can be solved, a lot of money will become available to invest in other improvements
to increase the supply of safe water for the population of La Paz and El Alto.
Figure 8: Coverage of demand – only 92,75 % of the population has availability to drinking water (ANESAPA, 2011, www.anesapa.org)

12
Milluni used to be a thriving mining town with a population of 4000 people, until the mineral prices
decreased in the eighties. The 4600 meters high located city became a ghost town, leaving nothing
behind except for dilapidated buildings and heavily contaminated lakes. (Rios, 1985)
Nowadays the Milluni mines are closed. But the problem continues to exist in other parts of South
American countries. Even in Bolivia, where the government already witnesses the result of the water
contamination by mining, there is still a very active mine contaminating the water supplies: El Cerro
Rico. El Cerro Rico in Potosi gives the perfect example for the conditions in the mines, similar to what
used to happen in the Milluni Mines.
Since the discovery of silver in 1546 in the mountain Cerro Rico, the city Potosi was settled at the
more than 4000 meters high Altiplano. This height, and the cold arising from it, made the city
unbearable to live in. However, the city grew and even reached a population of 200 000 in 1672,
making it one of the largest and wealthiest cities all over the world. Today, there are still over 150
000 inhabitants in Potosi. Those people prefer a short life of exhausting work above the life of
poverty. One once said: “With all the silver from the Cerro Rico, one can build a bridge from Potosí to
Madrid. But one can build that same bridge, and a second one next to it, with the bones of all the
people who died in the mines.” (Rough Guide, 2010)
For the inhabitants, the money they earn by working in the mines is far more important than the
damage that the working conditions do to their health or nature. It’s not hard to imagine that the
environmental aspect is not even considered. Even today, the chemicals and the mineral residues are
still abundant present in the waste water. This waste water is being deposited somewhere where no
tourist can see it and it keeps on contaminating the area, the wildlife and consequently also the
people.
Figure 9: Minerals inside the mines of Potosi

13
Figure 10: Mine workers inside the mines of Potosi
2.2.2 Economy
The Bolivian economy depends on the mining industry. Nowadays the production of minerals is
decreased, but Bolivia still remains the biggest world producer of tin and still plays an important role
in the production of other minerals like lead, copper, silver and others. Because of tin being the
country’s most important source of wealth, the mining industry was favored with very gentle laws for
the exploitation of minerals (Rios, 1985). Consequently a lot of damage was done caused by the
discharge of the mining waste water, which contained deposits in an inadequate form, straight into
the surface water.
The area of the lakes Milluni Grande and Milluni Chico looks like they have been totally covered with
a red-colored soil, consisting of a high concentration of iron. This is the result of a 40-year during
accumulation of sediments discharged by the Milluni-mines.
Figure 11: Milluni Chico
The lakes in the area of Milluni are water reservoirs created for the storage of surface water that is
meant to be used as drinking water supply for La Paz. Because of the large amount of water and the
high acidity, the costs for treatment to become drinking water are very high.

14
The treatment plant of Achachicala is located in the upper part of the La Paz valley. The water is
treated in the following manner: (Appendices V) (EPSAS, 2012)
1. Pre-sedimentation followed by decantation
2. Addition of chlorine to prevent the growth of algae
3. Addition of lime and aluminum sulphate for neutralization and flocculation
4. Sedimentation and removal of flocks
5. Filtering through sand beds
6. Disinfection by chlorine
The water deriving from Milluni, needs to be neutralized in order to achieve a pH above 7 and to
precipitate metal ions. To achieve this, about 10 tons of lime per day is being consumed at a cost of
32,6 € per ton, equals to 119 000 € per year. (Chavez Apaza, 1991)
In Bolivia, the minimum price for one cubic meter is 0,2985 € (ANESAPA, 2012). In the Belgian water
company Pidpa, the water price is 0,003 € per cubic liter (PIDPA, 2012). Belgium has a minimal salary
of 1472 € (Armoedebestrijding, 2012). In Bolivia the minimal salary is only 107 € (EABolivia, 2010). If
you look at the proportion between the minimal salary and the price for clear water, problems can
be predicted for the people in Bolivia who earn the minimal salary.
Up until the nineties, the water passed a small hydro-electric plant before entering the water
treatment plant Achachicala. This hydro-electric plant provided a power of 3-4 MW for the city of La
Paz. Results showed that the acid composition of the raw water was causing problems in the turbines
of the plant. Nowadays, the hydro-electric plant is out of use. (SAMAPA, 2012)
Figure 12: Water treatment plant Achachicala (2012, http://www.talis-group.com)
2.3 The contamination problem in the Milluni Valley
2.3.1 Water use for the treatment of minerals
One of the biggest causes of contamination of the water in the Milluni-valley is one of the
procedures of the mining company COMSUR. It was a common practice to capture water deriving
from precipitation and from the melting glaciers around this valley. Later on, this water was used in
the concentration process of tin in the processing plant. This however lead to various environmental
problems. (Chavez Apaza, 1991)

15
First, the minerals were reduced into little pieces of rocks. These parts were subjected to a breaking
process by special rotating machines. Afterwards they were further reduced by a mill. Next the
vibration table of concentrations separated for example cassiterite (SnO2), based on specific gravity.
For this separation, a large amount of water was used. (Chavez Apaza, 1991)
The second step in the process is based on the use of reagents. In the process, mainly 3 reagents
were used (Chavez Apaza, 1991):
Zantato (Na- or K- hydrocarbons) - 0,16 Kg/ton minerals bruto
Dofroth 250 – 0,15 Kg/ton minerals gross: to enforce a foam based on alcohol
Copper sulfate (CuSO4)
These reagents change the physical condition of the minerals. The minerals were coated mono-, bi-
or polyvalent and separated by laws of gravity. In their turn, the reagents cause an extreme and
inevitable contamination of the water. (Chavez Apaza, 1991)
The minerals can form sulfur compounds during extraction. These compounds on their turn can form
sulfuric acid with water by the process of oxidation.
2.3.2 Types of contamination
The pollution by mining waste has a direct impact on the water quality of the lakes Jankho Khota and
Milluni Chico. The impact can be seen first in the alteration of the aquatic ecosystems. Three
different sources of contamination can be distinguished. Continuously, the impact can be witnessed
in the lake of Milluni Grande. (Chavez Apaza, 1991)
2.3.2.1 Contamination by mineral extraction
COMSUR captured water derived from precipitation or from the melting of glaciers. This water was
used to separate the minerals by specific gravity on the vibration table of concentration. Here the
water gets largely contaminated with the minerals. Further during the process a solution of water
and reagents is used to coat the minerals and separate them again on the basis of gravity. Afterwards
this water was discharged into the Milluni Valley again by a bypass canal, without making any
changes in the concentration of contaminants. (Chavez Apaza, 1991)
Figure 13: Adding of chemical reagents to extract the minerals from the Potosi-mines

16
Most ores exploited in the Cordillera and the Altiplano regions of Bolivia contain sulfidic minerals,
which oxidize and produce acidic waters with high heavy metal contents. This is the most serious
pollution problem in the Bolivian mining industry. Research during the last few years regarding
chemical and biological effects of mining in the area showed that the contamination has not only
totally destroyed the natural ecosystem of the Milluni-lake, but also affected parts of the Jankho
Khota lake. A large contrast can be observed with the abundant aquatic fauna and flora of the not
contaminated Pata Khota-lake. (Chavez Apaza, 1991)
Figure 14: Canal Mina: the canal deriving from the Milluni-mine
2.3.2.2 Natural contamination
The geographical characteristics indicate a yellow colored soil (ferrous sulphate). This natural
contamination is carried down in small amounts by rivers during the rainy season. This contamination
can only be observed in a limited degree and will not cause problems if it occurs without the
contamination of the mine. (Chavez Apaza, 1991)
2.3.2.3 Contamination by solid waste
Around the Jankho Khota-lake you can find a lot of old and decayed products that were used during
the exploitation of the mines. For example: old machinery and a lot of light meters. These devices
also have a small contribution to the contamination of the water of the Milluni Valley because they
also contribute harmful toxic elements to the aquatic life.
Figure 15: Contamination by solid waste in the Milluni-valley

17
3 Physicochemical study of the Milluni Valley
3.1 Selection of the sampling points The selection of sampling points is done based on results of earlier analyses. In total, 9 samples were
analyzed. These sampling points are stretched out over the inflows and outflows of the most
important lakes in the valley of Milluni.
During the sampling, geographical coordinates of the sample point were taken by GPS. These
coordinates were integrated in the map with the software ArcGIS. The map of the Milluni-area is
made based on the geographical coordinate system WGS1984 so that every length, curve and point is
exactly into proportion with the reality.
Figure 16: ArcGIS-map of the Milluni-valley The blue dots are sample points of 2012.

18
Tabel 1: Sampling points in the Milluni-valley
The 9 samples were taken in the end of March 2012. This month is still part of the rain season. The
sampling took more or less 4 hours due to the large distance between every sampling point and the
walking up and down the slopes. Another difficulty for foreign researchers is the height of 4600
meters above sea level. When not used to these heights, breathing is difficult and intensive activities
are discouraged. An air temperature of 5,8 °C, the cold winds and the low water temperatures also
complicated the sampling.
3.2 Physicochemical analyses All analyses were done at the laboratory of the “Instituto de Investigaciones Quimica” of the
University Mayor de San Andres (IIQ-UMSA) in La Paz, Bolivia. Except for the in situ measurements,
the surface waters were all filtered over “Cellulose Nitrate Filters with a pore size of 0,45 µm”.
One half of each sample was conserved in their original condition to analyze the anions. The other
half was acidified with HNO3 65% for cation and heavy metal analysis.
3.2.1 In Situ
The measuring of the water temperature, the
conductivity, the oxygen content, the acidity, the
concentration of salts, the total dissolved solids-content
and the oxidation reduction potential all happened in
situ. Therefore the Portable Multiparameter for Water
Quality HI 9828 of Hanna Instruments was used.
Tabel 2: In situ Measurements
Number of sample Name of sample Description
1 Hielo Water ; not contaminated
1.5 Mezcla 1 x 2 Salida Mixture of 1 and Outflow of the Milluni lake
2 Milluni Salida Outflow of the Milluni lake
3 Mina Deriving from La Mina Fabulosa
4 JK Out Jankho Khota outflow
5 JK In Jankho Khota inflow
6 Pk Out Pata Khota Outflow
7 Pk In West Pata Khota Inflow West
8 Pk in East Pata Khota Inflow East
Figure 17: Portable Multiparameter for Water Quality HI 9828 – Hanna Instruments

19
Number of sample Time pH T (°C)
C (µS/cm)
TDS (ppm) DO%
DO (mg/l)
ORP (mV) Sal %
1 16:14 8,66 8,65 76 38 22,6 1,7 218,9 0,04
1.5 16:39 3,43 8,63 426 213 21,5 1,47 535,6 0,21
2 16:29 2,87 8,56 950 475 18,7 1,28 536,6 0,47
3 14:10 3,17 8,84 2349 1175 4 0,27 397,4 1,22
4 14:00 8 8,48 64 32 16,3 1,12 83,5 0,03
5 12:50 8,05 7,79 32 16 14,1 0,98 50,4 0,01
6 12:34 7,89 8,81 34 17 18,7 1,3 91,1 0,01
7 12:05 7,65 11,91 28 14 16,7 1,08 74,5 0,01
8 12:20 7,92 4,85 64 32 19,2 1,39 84,5 0,03
3.2.2 Anions
The anions were analyzed by spectrofotometry, volumetry or argentometry.
Tabel 3: Anions results
Number of sample Name of sample
CO32-
(ppm) HCO3
- (ppm)
NO3-
(ppm) SO4
2- (ppm) Cl- (ppm)
1 Hielo 31,2 0 3,1 28 0,392
1.5 Mezcla 1 x 2 Salida 0 0 18,8 250 < 0,32
2 Milluni Salida 0 0 92,5 500 0,4752
3 Mina 0 0 217,5 2150 0,5968
4 JK Out 31,2 0 4,6 25 7,445
5 JK In 26,4 0 3,2 8 7,268
6 Pk Out 0 39,04 3,5 8 6,647
7 Pk In West 0 34,16 4,2 5 7,268
8 Pk in East 0 39,04 3,6 21 5,85
3.2.2.1 CO32- and HCO3-
Carbonate and bicarbonate are both salts of carbonic acid. The carbonate and bicarbonate content
were analyzed by volumetry with 0,012 N standardized HCl and an indicator that is a mixture of
methyl orange and indigo carmine which has a color change from yellow to orange.
Carbonate only occurs in waters with a pH between 8 and 10.
2 H+ + CO32- H2CO3
Bicarbonate only occurs in waters with a pH between 6 and 8.
H+ + HCO3- H2CO3
Samples 1,5; 2 and 3 have an very acidic pH through which can be presumed that there is no
carbonate or bicarbonate present in these samples.

20
Tabel 4: Carbonate and bicarbonate results
Number of sample Name of sample pH
CO32-
(ppm) HCO3
-
(ppm)
1 Hielo 8,66 31,2 0
1.5 Mezcla 1 x 2 Salida 3,43 0 0
2 Milluni Salida 2,87 0 0
3 Mina 3,17 0 0
4 JK Out 8 31,2 0
5 JK In 8,05 26,4 0
6 Pk Out 7,89 0 39,04
7 Pk In West 7,65 0 34,16
8 Pk in East 7,92 0 39,04
3.2.2.2 NO3-
The nitrate content was analyzed by spectrofotometry “Cadmium Reduction Method” of HACH
programs. Cadmium metal reduces nitrates in the sample to nitrite. The nitrite ion reacts in an acidic
medium with sulfanilic acid to form diazonium salt. The salt forms with gentisic acid an amber
colored solution. Test results are measured at 500 nm. The detection area is located between 0,3 and
30,0 mg/L NO3--N. For sample 1.5 and sample 2, a dilution had to be made.
3.2.2.3 SO42-
The sulphate content was analyzed by spectrofotometry “Sulfaver 4 Method” of HACH programs.
Sulfate ions in the sample react with barium in the SulfaVer 4 and form barium sulfate. The turbidity
formed is proportional to the sulfate concentration. Test results are measured at 450 nm. The
detection area is located between 2 and 70 mg SO42-/L. For sample 1.5, sample 2 and sample 3, a
dilution had to be made.
3.2.2.4 Cl-
The chloride content was analyzed by argentometry. The Mohr’s method uses 5 % K2CrO4 as an
indicator in the titration of chloride ions with a silver nitrate standard solution. The color changed
from yellow to red.
The color change though was not very visible for the samples with the highest concentration. These
samples were analyzed again with spectrofotometry in the present of ammonium iron (II) sulfate,
mercury (II) thiocyanate and nitric acid 10 %.

21
3.2.3 Cations
The cations where analyzed by atomic absorption spectrofotometry (AAnalyst 200, Perkin-Elmer).
Tabel 5: Cations results
Number of sample Name of sample Na (ppm) K (ppm) Ca (ppm) Mg (ppm)
1 Hielo 2,15 0,58 11,74 2,03
1.5 Mezcla 1 x 2 Salida 3,55 0,62 14,26 6,1
2 Milluni Salida 1,775 0,685 16,45 11,75
3 Mina 2,175 0,714 59,1 61
4 JK Out 2,025 0,487 11,56 1,08
5 JK In 0,76 0,276 7,26 0,29
6 Pk Out 0,88 0,272 6,44 0,25
7 Pk In West 0,45 0,173 6,03 0,21
8 Pk in East 0,94 0,272 12,63 0,44
3.2.3.1 Na and K
Sodium en potassium are analyzed in the presence of lithium by AAS.
The coefficients of determination and the slopes concerning the calibration curves are:
Na:
R² = 0,973948
Slope = 0,38589
K:
R² = 0,978255
Slope = 0,28448
3.2.3.2 Ca and Mg
Calcium and magnesium are analyzed in the presence of strontium by AAS.
The coefficients of determination and the slopes concerning the calibration curves are:
Ca:
R² = 0,997144
Slope = 0,0,08469
Mg:
R² = 0,9949
Slope = 0,0435

22
3.2.4 Heavy Metals
The heavy metals where analyzed by atomic absorption spectrofotometry (AAnalyst 200, Perkin-
Elmer).
Tabel 6: Heavy metals results
Number of sample Name of sample
Cu (ppm)
Fe (ppm)
Pb (ppm)
Zn (ppm)
Mn (ppm)
Cd (ppm)
As (ppm)
1 Hielo < 0,10 0,035 < 0,80 0,015 < 0,07 < 0,03 3,762
1.5 Mezcla 1 x 2 Salida 0,122 11,1 < 0,80 9,275 1,5 < 0,03 3,851
2 Milluni Salida 0,341 58,95 < 0,80 22,575 4,5 0,034 4,045
3 Mina 2,75 446,4 < 0,80 182,2 30,05 0,698 4,619
4 JK Out < 0,10 < 0,10 < 0,80 0,047 < 0,07 < 0,03 3,563
5 JK In < 0,10 < 0,10 < 0,80 < 0,02 < 0,07 < 0,03 < 0,007
6 Pk Out < 0,10 < 0,10 < 0,80 < 0,02 < 0,07 < 0,03 < 0,007
7 Pk In West < 0,10 0,179 < 0,80 < 0,02 < 0,07 < 0,03 < 0,007
8 Pk in East < 0,10 < 0,10 < 0,80 < 0,02 < 0,07 < 0,03 < 0,007
The coefficients of determination and the slopes concerning the calibration curves are:
Tabel 7: Heavy metals R², slope and min. detection limit
R² Slope Min. Detection limit (in ppm)
Cu 0,99972 0,06926 0,100
Fe 0,99966 0,04221 0,100
Pb 0,99759 0,00815 0,800
Zn 0,99898 0,29261 0,020
Mn 0,99999 0,09677 0,070
Cd 0,99992 0,18052 0,030
As 0,97230 0,00580 0,007

23
3.3 Discussion of the water quality When the concentration of certain elements is too high, they can induce physical, chemical and
eventually ecological transformations, which can damage the aquatic ecosystems.
Rivers are less sensitive to the contamination because of their relatively high self-cleaning capacity.
On the contrary, lakes assimilate the pollution.
3.3.1 Comparison of the permissible limits of Bolivia and Belgium
When Belgian and Bolivian permissible limits are compared (appendices VI), one can witness that the
Bolivian permissible limits are less strict than the Belgian ones. In contrary with the Belgian law, the
Bolivian law was once set in 1992 and has never become stricter (Ley del Medio Ambiente – Class B,
1992). In the previous tables, all values displayed in bold, are values that exceed the Bolivian
permissible limits. Especially the canal arriving from the mine and the final mixture are more
contaminated than allowed by Bolivian law.
3.3.2 Physical characteristics of the water
Temperature is an important ecological factor in most aquatic environments because it coordinates
the physiological and biological activity and the behavior of the water organisms. During the
sampling at the end of March 2012, the water temperature in the Milluni-valley takes an average of
8,54 °C and is lower during dry season and higher during wet season. The temperatures measured in
the study area are typical temperatures for regions located high in the Andes, with periodical
changes during dry and wet season (Chavez Apaza, 1991).
The clear water lakes have a low conductivity. In contrary, the water waste from the mine has a high
conductivity of 2349 µS/cm during the sampling. The conductivity is related to the removal of
minerals and it varies during dry and wet season because of the dilution that takes place during the
wet season.
The pH is important because it indicates the acidity or the alkalinity of the water. The average values
of the study area present different levels of acidity, varying between 2,87 and 3,43 for the
contaminated effluents and between 7,65 and 8,66 for the natural effluents. The waters deriving
from the mine are extremely acid. In the water treatment plant this is neutralized by adding lime to
the water.
3.3.3 Chemical characteristics of the water
Many studies show a large and dangerous presence of high concentrations of metallic ions like iron,
manganese and zinc, similar to this study of the Milluni-valley. Also because of the absence of
bicarbonate and the extreme acidity, researchers have indicated that the damage done by the mining
company COMSUR is irreversible (Chavez Apaza, 1991).
The amount of iron and other heavy metals founded in the Pata Khota-lake was very low. This is
explained by the low natural contamination. The water deriving from the mine contains a large
contamination by iron and by other metals. These values exceed the permissible limits of Bolivia. The
iron causes the red color in the canal deriving from the mines, Milluni Chico-lake, Milluni Grande, and
the canal from Milluni to the water treatment plant Achachicala. The present Cadmium
concentrations are in general very low. However, Cadmium is highly toxic even at low concentrations
24
so the waters deriving from the mine still exceed the permissible limits. Copper only exceeds the
permissible limits in the canal deriving directly from the mine and in Milluni Chico. After the mixture
with the clear water canal, the water is diluted and the copper-content decreases per cubic meter.
Arsenic is a by-product of mining activities. It is present in extremely high concentrations in the
waters deriving from the Milluni-mine. Also the Zinc- and Manganese-concentration is very high and
exceed the permissible limits.
Calcium and magnesium are at all sampling points under the permissible limits of Bolivia. The
concentration of chlorides is very low and has no importance for the discussion of the water quality.
In general, all the water deriving from the melting of glaciers and precipitation belongs to the
bicarbonate type with a low concentration of iron and magnesium and salt. The water deriving from
the mine and the mixture of clear water with the mine waste water belongs to a different type: the
ferric sulphate. This type experiences the absence of bicarbonates due to the extreme acidity of
these waters. The water contains a lot of sulphate (Chavez Apaza, 1991).
The lakes in the Milluni-valley experience a different type according to their contamination level. The
Pata Khota-lake is from the carbonate type as well as other lakes situated in other glacial valleys in
the Cordillera Real. Water from the mining sector is characterized by a low pH and alkalinity and an
increase in SO42- concentrations. Where the contaminated waste water from the mine mixes with
the clear water deriving from Pata Khota, an increase of the concentration of sulphate and a
decrease of the concentration of bicarbonate occur. (Chavez Apaza, 1991).
In the wet season, the concentration of ions is lower because of dilution with precipitation and
snowmelt. The chemical characteristics of the lakes are tightly related to the rainfall patterns and the
contribution of pollutants from the mine.

25
4 Application of the WEAP model in the study area
4.1 Discussion of the map
Figure 18: WEAP-model: Map water resources
(Appendices VII: enlarged map of the total Milluni-valley)
On the right top of the map the catchment “Milluni Valley” can be found with the largest lake Milluni
Grande that mixes up at the end with the bypass canal Hielo 3. The first green arrow is a transmission
link that takes 100% volume of the supply to the village of Milluni. Because there are no inhabitants
left since the mining activity stopped, the population of the village was set to zero. The water
continues flowing to the water treatment plant Achachicala. This treatment plant changes the water
quality of the mining waste water to potable water.
On the left of the map the supply “All other reservoirs” can be observed. This is the water deriving
from other water catchment areas in the Cordillera Real, which takes part in the supply for the cities
La Paz and El Alto. The green arrow is the transmission link that brings the water from the
catchments to the red dot: all other reservoirs (1). This dot represents the people who take use of
the water before the water enters the treatment plant. This information is unknown, so the
population of this demand site is also set to zero. Next, a red arrow, the return flow, takes the water
to a treatment plant and thereafter the water merges with the cleared water deriving from the
treatment plant Achachicala.
Further downstream a beginning of two green arrows can be observed. These transmission links take
the water to the demand sites of La Paz and El Alto. La Paz, as the wealthiest part of the Metropolis,
takes the priority to make their demand covered. Remaining supply is taken to El Alto. Finally, two
return flows take the waste water to the treatment plant of EPSAS in La Paz.

26
4.2 Current Accounts In WEAP the typical scenario modeling effort consists of three steps. First, there is the “Current
Accounts” year. This year is chosen to serve as the base year of the model. Concerning the Milluni
Valley, the base year was set on 2010 because it is the last year from which recent data is published
by the INE1.
Tabel 8: Import necessary data to simulate scenarios (INE, 2010)
2010
Population Growth Factor 1,48
Life Expectancy 66
Children per woman 3,2
Population Bolivia 10 227 300
Population La Paz 835 361
Population El Alto 953 253
First, the data concerning population of the two big cities must be entered under Current Accounts in
the “data-view” for the base year. Under the Water-Use tab, 4 sub taps can be found. Annual Activity
Level can represent the population. Important is not to forget to set the unit to ‘people’. For both
demand sites, the population can be entered under the base year 2010. Also the “Priority” tab can be
found under the demand sites.
Figure 19: WEAP-model – data view – Current Accounts – annual activity level
Next, the second tap: the Annual Water Use Rate, must be set. This is the amount of water each
person living in the cities uses. UNESCO2 estimated that the average person in developed countries
uses 300 m³ per year. The average person in developing countries is estimated at 20 m³ per year.
1 INE: Instituto Nacional de Estadística de Bolivia (National Insitute of Statistics of Bolivia)
2 UNESCO: United Nations Educational, Scientific and Cultural Organization
27
Last decades the water supply didn’t cover all the demand in La Paz and El Alto. To represent this in
the WEAP-model, the water use rate can be estimated by showing the results and adjusting the
water use rate until a realistic representation of the coverage problem is displayed. This was
obtained at a water use rate of 40 m³/person and 20 m³/person, respectively for La Paz and El Alto
(Komives & Cowen, 1998). These data look realistic, compared to the situation in both cities, whereas
La Paz has more wealth then the unbearable conditions in El Alto. In El Alto, where the inhabitants
are mainly poor, 50 % of the water they receive is being consumed. In La Paz, only 30% of the
received water is used for pure consumption, whereas the remaining water is used for the cleaning
of houses, cars, watering plants…
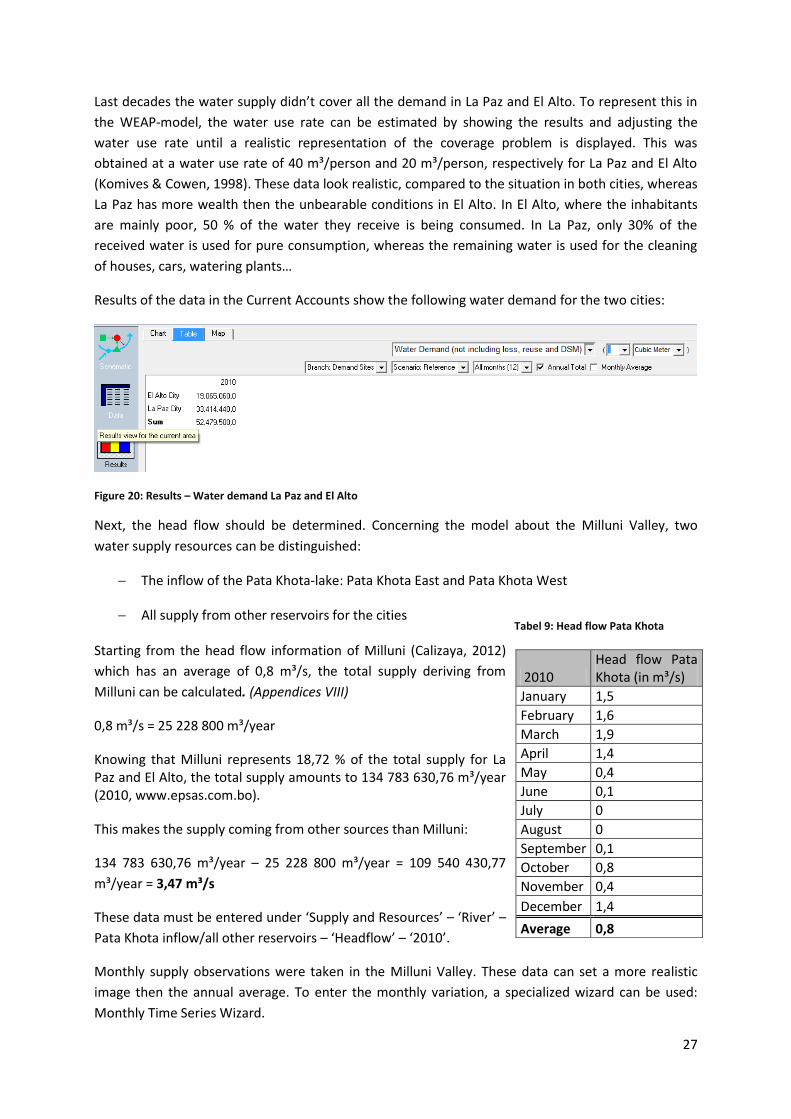
Results of the data in the Current Accounts show the following water demand for the two cities:
Figure 20: Results – Water demand La Paz and El Alto
Next, the head flow should be determined. Concerning the model about the Milluni Valley, two
water supply resources can be distinguished:
The inflow of the Pata Khota-lake: Pata Khota East and Pata Khota West
All supply from other reservoirs for the cities
Starting from the head flow information of Milluni (Calizaya, 2012)
which has an average of 0,8 m³/s, the total supply deriving from
Milluni can be calculated. (Appendices VIII)
0,8 m³/s = 25 228 800 m³/year
Knowing that Milluni represents 18,72 % of the total supply for La Paz and El Alto, the total supply amounts to 134 783 630,76 m³/year (2010, www.epsas.com.bo).
This makes the supply coming from other sources than Milluni:
134 783 630,76 m³/year – 25 228 800 m³/year = 109 540 430,77
m³/year = 3,47 m³/s
These data must be entered under ‘Supply and Resources’ – ‘River’ –
Pata Khota inflow/all other reservoirs – ‘Headflow’ – ‘2010’.
Monthly supply observations were taken in the Milluni Valley. These data can set a more realistic
image then the annual average. To enter the monthly variation, a specialized wizard can be used:
Monthly Time Series Wizard.
2010 Head flow Pata Khota (in m³/s)
January 1,5
February 1,6
March 1,9
April 1,4
May 0,4
June 0,1
July 0
August 0
September 0,1
October 0,8
November 0,4
December 1,4
Average 0,8
Tabel 9: Head flow Pata Khota

28
The wizard gives the ability to enter monthly data. Consequently, the supply of the Milluni Valley
alters every month and wet or dry seasons can be taken into account.
Concerning the supply of the other reservoirs, monthly variation is unknown, so the calculated value
3,47 m³/s is entered as an annual average under “Supply and Resources – River – All other
reservoirs”. To indicate the unit m³/s, the software uses the unit CMS, which stands for Cubic Meter
per Second.
Figure 21: WEAP-model – Current Accounts – All other reservoirs – Headflow – Monthly data
At the moment the supply and the demand information are set. This is the first step to create a water
planning model.

29
4.3 Reference Scenario A Reference scenario is established from the Current Accounts to simulate likely evolution of the
system without intervention.
In Current Accounts, the base year was set to 2010. Now the time zone for the scenarios must be set.
Concerning the Milluni Valley was decided to work in a time zone of 20 years in the future. All the
scenarios will be simulated from 2011 until 2030 to look at the estimates for the near future.
4.3.1 Population Growth
In the reference scenario, the population growth continues at the 2000-2010 rate: 1,48. The
population growth rate is set as a key assumption, this is a variable where can be referenced to
elsewhere in the model.
Figure 22: Key assumption – Population Growth Rate
Next the population of the cities in the reference scenario (2011-2030) must be set with the
Expression Builder. This is a Wizard where you can form certain formulas. In case of the growth rate,
the formula has to be:
Growth(Key\Population Growth Rate[%]/100)
This makes the population grow every year by the assumption key ‘Population Growth Rate’.
By running the result, a chart is given where the growth of the cities can be observed.
The demand grows as the population increases over the years. However the supply stays the same.
Consequently, over the years the supply always covers less of the demand.
Next the results are run for Water Demand and for Unmet Demand:
Water Demand: The demand for water of all the inhabitants in the city, taken the annual
water use rate and the consumption rate into account.
Unmet Demand: The demand that is not fulfilled after the distribution of the water.

30
Running the result for Water Demand:
Figure 23: Population Growth: Result – Water Demand
Running the result for Unmet Demand:
Figure 24: Population Growth: Result – Unmet Demand

31
4.3.2 Water Year Method
Population Growth only shows a variation in demand, not in supply. Water Year Method is a way to
represent a variation of the supply. For example: natural variation in climate data (stream flow,
rainfall etc.).
The method first involves defining how different climate regimes (e.g., very dry, dry, very wet)
compare relative to a normal year, which is given a value of 1. Dry years have a value less than 1,
very wet years have a value larger than 1.
First, the definitions of the wet and dry years have to be set in de reference scenarios under
Hydrology – Water Year Method.
Figure 25: WEAP-model – Data – Hydrology - Water Year Method
Next, the sequence has to be defined.
In the Reference Scenario, the following is assumed:
Figure 26: Water Year Type in the Reference Scenario

32
The head flow of the Milluni Valley has to be changed from Expression Builder to Water Year Method
to take the variation of the years into account.
Figure 27: WEAP-model: Data - Water Year Method
4.4 What-if Scenarios What-if scenarios can be created to alter the reference scenario and evaluate the effects of changes
in policies and/or technologies.
In the “Manage Scenarios”-window all scenarios can be observed and new one’s can be added.
Figure 28: Manage Scenarios-window

33
4.4.1 Scenario: High Population Growth
This scenario is created to evaluate the impact of a population growth rate for La Paz and El Alto
higher than 1,48% for the period 2011-2030.
First the new scenario is added in the “Manage Scenarios”-window. It is based on the Reference
Scenario, so the changes can be compared to time zone with a normal growth rate of 1,48.
Working in the High Population Growth Scenario, the rate is changed to 5,0 %
Figure 29: High Population Growth Scenario: 5,0%
Changes made compared to the Reference Scenario, will automatically be displayed in red.
When the population grows very fast, the demand increases even faster. Over the years the supply always covers less of the demand.
Running the result for Water Demand:
Figure 30: High Population Growth Scenario: Water Demand

34
Running the result for Unmet Demand:
Figure 31: High Population Growth Scenario: Unmet Demand
4.4.2 Extended Dry Climate
In the “Manage Scenarios”-window a new scenario is added, called Extended Dry Climate.
This scenario represents the impact of several dry and very dry years between 2011 and 2030. There
for, the Sequence of the Water Year Method was changed while the scenario was set to Extended
Dry Climate.
Figure 32: Extended Dry Climate Scenario – Water Year Method

35
The result shows the influence that the altering of the supply has on the Unmet Demand. The Unmet
Demand is bigger in dry years and smaller in wet years. Of course, the Water Demand stays the same
as the Reference period because the Population Growth Rate stays 1,48.
Figure 33: Extended Dry Climate Scenario – Unmet Demand
4.4.3 Influence of scenarios at each other.
By placing a new scenario underneath the Water Year Method scenario and by changing the
Population Growth Rate of the new scenario to 5 %, a scenario can be created that takes the increase
of growth rate and the variable climate into account. The results can be shown with changing
demand and changing supply. This would be an example of a more advanced scenario because of the
influence of one scenario at the other scenario.
Figure 34: Manage Scenarios

36
The population of La Paz and El Alto increasing by 5,0 % and the altering of the water supply every
year will give the following result for the Unmet Demand of the Milluni Valley:
Figure 35: Results – Comparing Scenarios
4.4.4 Priority Changes
Scenarios can also be developed by changing the priorities of demand sites (Universidad Ángela
Salinas Villafañe, 2009). The result can be displayed of what will happen with the water supply for La
Paz, if El Alto takes the first priority because of the higher population rate.
Below, you can see a flow chart of the Unmet Demand from each demand site, compared to the
Unmet Demand in the Reference Scenario.
Figure 36: Results – Priority Changes compared to the Reference Scenario
The yellow line shows the Reference Scenario where La Paz takes the priority of the supply. The
green line represents the Unmet Demand of the city La Paz in the Scenario of Changed Priorities. This
graph shows that the unmet demand of the city La Paz is about 3 500 000 m³ bigger when El Alto
takes the priority than the unmet demand in the Reference Scenario.

37
The red line represents the Unmet Demand of the city El Alto in the Scenario of Changed Priorities.
Now that the city of El Alto takes the first priority for the water supply, a decrease of unmet demand
can be observed compared to the Reference Scenario.

38

39
5 Results and discussion
5.1 Water Quality The Pata Khota-lake represents an ecological intact environment. This lake has low constant
temperatures during the dry season, with a neutral pH and a low conductivity. The lake belongs to
the bicarbonate type and has low concentrations of ions. The Pata Khota-lake is similar to other lakes
situated in other glacial valleys in the Cordillera Real. The quality of the water is very good.
The Milluni-lake represents a contaminated lake after mixture of the clear water of Pata Khota with
the waste water of the mine Milluni. It characterizes itself with an extremely acid pH and high
conductivity content because of the large presence of heavy metals. This lake belongs to the type
ferric sulphate type. Consequently, the water of this lake has a poor quality.
5.2 WEAP 4 graphs can be observed: (An enlarged image of the Unmet Demand in Appendices IX)
Purple: The Reference Scenario. This is a scenario with a Population Growth Rate of 1,48 %
and takes variable climate into account thanks to the Water Year Method. Other scenarios
are based on this reference.
Red: The Extended Dry Climate Sequence Scenario. This is a scenario evaluates the Unmet
Demand in a time zone with several dry or very dry years. Compared to the Reference
Scenario, some changes can be observed. For example, the Unmet Demand is bigger in dry
periods.
Green: The High Population Growth Scenario. This is a scenario with a Population Growth
Rate of 5,0 %. The Unmet Demand enlarges in the future.
Blue: The Higher Population Growth and Variable Climate Scenario. This is a scenario with a
Population Growth Rate of 5,0 % where the cities La Paz and El Alto experience several dry or
very dry years between 2011 and 2030.

40

41
6 Conclusions and recommendations
6.1 Conclusions The water shortage for cities located in the mountain range of the Andes depends of several
parameters. If one of these parameters changes, it can have a major impact on the coverage of
drinking water for all inhabitants.
The results of this study give an image of the consequences in the future. Nowadays, only 92,75 % of
the population of La Paz and El Alto has access to clean drinking water. If the population will keep on
growing or/and if the precipitation level decreases due to global warming, this shortage will only
increase in the future. This problem does not only represent itself in La Paz, but also occurs in other
South-American cities located in the mountain range of the Andes, f.e. Quito, Ecuador and Bogota,
Colombia.
This thesis could be used to represent the problem to organizations that might have an impact on
policy or may contribute with financial support to bring a water purification project into reality. Also,
this thesis denounces the irresponsible behavior of the mining companies. Hopefully some changes
will be made in their policies which will make them purify the waste water before discharging it in
the water basins.
A proper operation of the purification of the mining waste waters deriving from the Milluni-mine will
save money that in turn can be spend on the development of sustainable technologies to
economically cope with water or to create a bigger supply.
6.2 Recommendations Finally, I represent a few recommendations:
The contamination in the Milluni-lake can be stopped spreading by eliminating the effluent of
the mines. The canal deriving from the mines should be guided, separated from the clear
water canal, to a water treatment plant that is able to purify a high contaminated water flow.
Eventually also the sediments will stop contaminating the clear water deriving from the Pata
Khota and the Jankho Khota-lake.
All solid wastes and dump must be removed to prevent the contamination of the water.
A solution must be found to prevent the contaminated sediments to mix with the water.
o One way could be by planting certain macrophytes which have the ability of
decontaminating water flows.
o Another solution could be to remove all the sediments of the Milluni-lake and to
recover some metals by a bacterial leaching method.
Force the mining sector to develop a way to prevent contamination by waste water or to
purify the waste water before discharging it in the valleys. Require them to build a water
treatment plant.
Make laws concerning solid waste more strict.
42
Make the permissible limits stricter for surface water that is meant to be treated for drinking
water.
Make sure these laws are complied in all the country by regular inspections from the
“Dirección Nacional de Saneamiento Ambiental”.
Make SAMAPA clear the water canal from Milluni to Achachicala to prevent further
contamination.
Represent the result of these thesis to the Inter-American Development Bank (IDB) in hope
they can contribute with financial support to bring a water purification project into reality.

43
References ANESAPA. (2012). Consulted on the 10th of August, 2012, of
http://www.anesapa.org/soc_cosmol.php
Armoedebestrijding. (2012). Consulted on the 10th of August, 2012, of
http://www.armoedebestrijding.be/cijfers_minimum_uitkeringen.htm
Banco Interamericano de Desarrollo (1994). Plan Maestro del Sistema de Agua Potable [estudio del
Impacto Ambiental]. Ministerio de Hacienda y Desarrollo Económico.
Calizaya, A. (2010). Hydrology – Cuenca Milluni. La Paz : Universidad Mayor de San Andres.
Condom, T., Escobar, M., Purkey, D., Pouget, J.C., Suarez, W., Ramos, C., et al. (2011). Modeling the
hydrologic role of glacier within a Water Evaluation and Planning System (WEAP): a case study in the
Rio Santa watershed (Peru). Lima: Institute for the Research and the Development (IRD).
Chavez Apaza, R. (1991). Incidencia de una contaminacion por efluentes mineros sobre la fauna
bentica en un complejo fluvio-lacustre altoandino. La Paz : Universidad Mayor de San Andres.
EABolivia. (2010). Consulted on the 10th of August, 2012, of
http://www.eabolivia.com/economia/12535-salario-minimo-nacional-en-bolivia.html
Encyclopedia Bolivia. (2012). Consulted on the 5th of april, 2012, of
http://www.encyclopedia.com/topic/Bolivia.aspx
Erhard. Water supply on a high level. Consulted on the 21st of June, 2012, of
http://erhard.de/index.php?WaterSupplyonahighLevel
Lic. Espinoza Huanca, G. (2000). Estudio de investigacion en la cuenca Milluni [perfil de proyecto de
investigacion]. Universidad Mayor de San Andres, Facultad de Ingenieria, Carrera Ingenieria Civil.
Fraser, B. (2009). Glaciers go, leaving drought, conflict and tension in Andes. Consulted on the 2th of
August, 2012, of http://wwwp.dailyclimate.org/tdc-newsroom/2009/05/glaciers-go-leaving-drought-
conflict-and-tension
Institute for Global Environmental Strategies. Consulted on the 4th of August, 2012, of
http://www.iges.or.jp/
Instituto Nacional de Estadística. Consulted on the 6th of August, 2012, of www.ine.gob.bo
International Finance Corporation. (1998). Environmental Review Summary (ERS). Consulted on the
17th of June, 2012, of http://www.ifc.org/ifcext/spiwebsite1.nsf/ProjectDisplay/DataConversion8738
Komives, K., & Cowen, P. (1998). Expanding Water and Sanitation Services tolow-Income Households:
The case of the La Paz–El Alto concession. Private Sector, 178. Fetched on the 7th of June, 2012, of
http://rru.worldbank.org/documents/publicpolicyjournal/178komiv.pdf
Oxfam International. (2009). Bolivia: Climate change,poverty and adaptation. La Paz: Oxfam

44
PIDPA. (2012). Consulted on the 10th of August, 2012, of
http://www.pidpa.be/nl/overwater/drinkwater/kwbetaalbaar.htm
Reuther, R. (1993). Sectoral environmental assessment of the mining and industrial sectors in Bolivia.
La Paz: Swedish Environmental Systems.
Ricaldi, R., Carlos Flores, M., Leonardo Anaya, J. (1992). Los recursos hidricos en Bolivia y su
dimension ambiental.
Rios, C. (1985). Estudio de la Contaminación Ambiental por las Descargas Mineras de Comsur en la
Represa Milluni [masterproef]. Universidad Mayor de San Andres, Facultad de Ingenieria, Carrera
Ingenieria Civil.
Rough Guide. (2010). Bolivia. Rough Guide
Sacaca, S., Iñiguez, V., & Roulet, M. (2009). Diversidad y distribución de bacterias sulfato reductoras
en sedimentos de lagunas de la cuenca Milluni contaminada por desechos mineros. La Paz : Biofarbo.
Sacaca, S., Iñiguez, V., & Roulet, M. (2009). Diversity and distribution of sulfate-reducing bacteria at
Milluni lakes sediments contaminated with acid mine drainages. La Paz : Biofarbo.
Salvarredy-Aranguren, M., Probst, A., Roulet, M., & Isaure, M. (2008). Contamination of surface
waters by mining wastes in the Milluni Valley (Cordillera Real, Bolivia): Mineralogical and hydrological
influences [masterproef]. Université Paul Sabatier.
Salvarredy-Aranguren, M., Probst, A., & Roulet, M. (2009). Evidencias sedimentarias y geoquímícas de
la pegueña edad de hielo en el lago Milluni del Altiplano Boliviano. Buenos Aires : Asociación
Geológica Argentina.
Sara Shahriari. (2012). Urban population boom threatens Lake Titicaca. Consulted on the 6th of June,
2012, of http://www.guardian.co.uk/environment/2012/jan/12/urban-population-boom-lake-
titicaca
Shukman, D., (2009). Glacier threat to Bolivia capital. Consulted on the 12th of August, 2012, of
http://news.bbc.co.uk/2/hi/8394324.stm
Stockholm Environment Institute. (2012). Consulted on the 10th of Februari, 2012, of
http://www.weap21.org/
Universidad Ángela Salinas Villafañe (2009). Aplicación del modelo de planificación hídrica WEAP al
proyecto: aducción de recursos hídricos Mururata. Universidad Mayour de San Andrés, Facultad de
Ingenieria, carrera de Ingenieria Civil.

45
Appendices
I. Basic characteristics from the basins
II. Map of orientations – Milluni basin
III. Map of slopes – Milluni basin
IV. Physiological characteristics – Milluni-basin
V. Drinkwater production in the treatment plant of Achachicala
VI. Comparison permissible limits Belgium and Bolivia
VII. Total map of the Milluni-valley displayed with WEAP
VIII. Monthly Flow 2000-2010: Milluni-basin
IX. Result of the scenarios in a flow chart
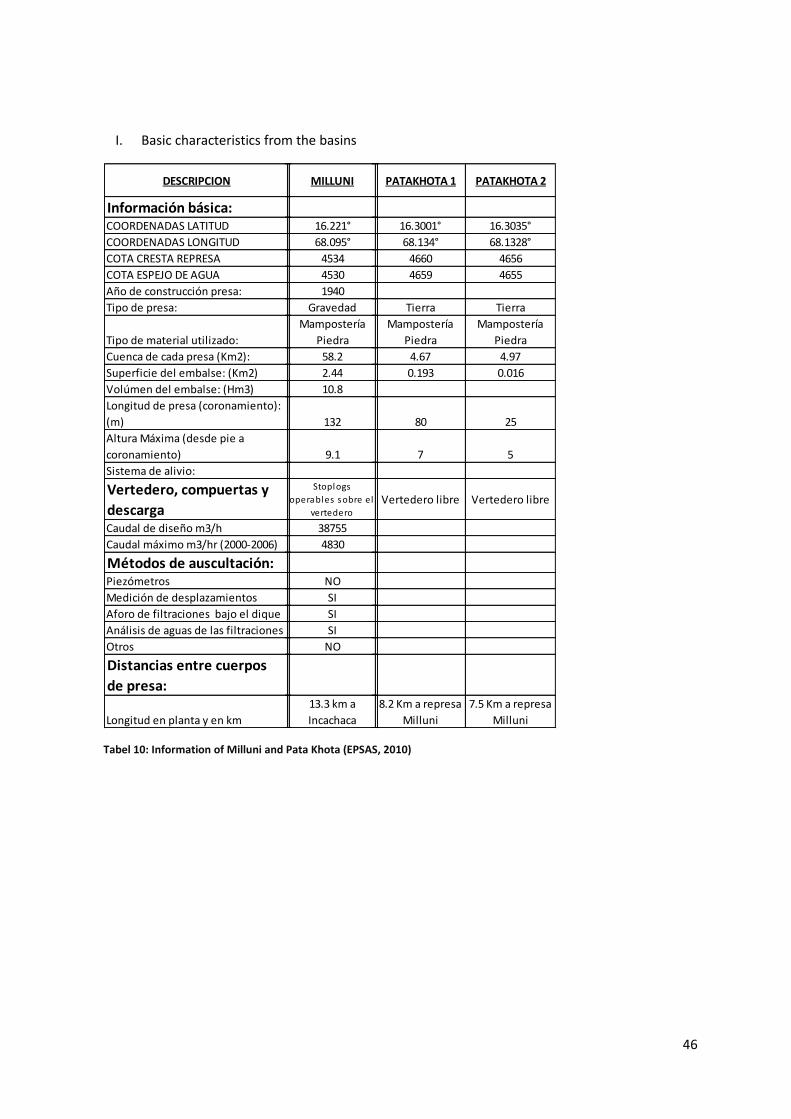
46
DESCRIPCION TUNI MILLUNI CONDORIRI VESUBIO CHULUMANI VENTANANI PATAKHOTA 1 PATAKHOTA 2
Información básica:COORDENADAS LATITUD 16.144° 16.221° 16.123° 16.3413° 16.3432° 16.3345° 16.3001° 16.3035°
COORDENADAS LONGITUD 68.152° 68.095° 68.152° 68.1598° 68.1459° 68.1387° 68.134° 68.1328°
COTA CRESTA REPRESA 4437 4534 4461 4567 4556 4729 4660 4656
COTA ESPEJO DE AGUA 4432 4530 4458 4565 4554 4723 4659 4655
Año de construcción presa: 1978 1940 1977
Tipo de presa: Tierra Gravedad Gravedad Tierra Tierra Tierra Tierra Tierra
Tipo de material utilizado:
Escollera con
nucleo de arcilla
Mampostería
Piedrade tierra
Mampostería
Piedra
Mampostería
Piedra
Mampostería
Piedra
Mampostería
Piedra
Mampostería
Piedra
Cuenca de cada presa (Km2): 16.6 58.2 3.8 44.47 1.53 3.16 4.67 4.97
Superficie del embalse: (Km2) 2.45 2.44 0.55 0.46 0.015 0.097 0.193 0.016
Volúmen del embalse: (Hm3) 21.5 10.8 0.23
Longitud de presa (coronamiento):
(m) 110 132 37 50 25 40 80 25
Altura Máxima (desde pie a
coronamiento) 18.5 9.1 5 7 5 7 7 5
Sistema de alivio:
Vertedero, compuertas y
descargaVertedero libre
Stoplogs
operables sobre el
vertedero
Stoplogs
operables sobre el
vertederoVertedero libre Vertedero libre Vertedero libre Vertedero libre Vertedero libre
Caudal de diseño m3/h 49900 38755 20856
Caudal máximo m3/hr (2000-2006) 8613 4830 3600
Métodos de auscultación:Piezómetros SI NO SI
Medición de desplazamientos SI SI SI
Aforo de filtraciones bajo el dique NO SI NO
Análisis de aguas de las filtraciones NO SI NO
Otros NO NO NO
Distancias entre cuerpos
de presa:
Longitud en planta y en km15.7 km a Milluni
13.3 km a
Incachaca
2 km a represa
Tuni
2.3 Km a represa
Milluni
3.5 Km a represa
Milluni
4.5 Km a represa
Milluni
8.2 Km a represa
Milluni
7.5 Km a represa
Milluni
I. Basic characteristics from the basins
Tabel 10: Information of Milluni and Pata Khota (EPSAS, 2010)
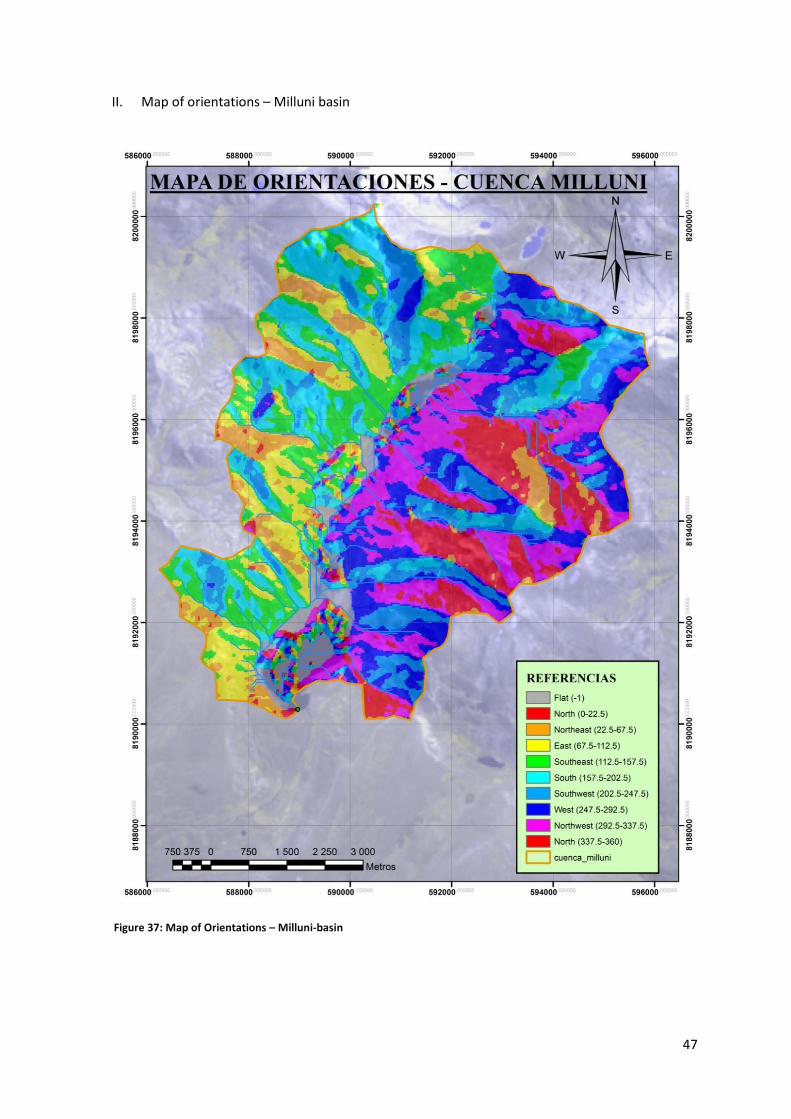
47
II. Map of orientations – Milluni basin
Figure 37: Map of Orientations – Milluni-basin

48
III. Map of slopes – Milluni basin
Figure 38: Map of Slopes – Milluni-basin

49
IV. Physiological
characteristics – Milluni-
b
a
s
i
n
Características Fisiográficas Cuenca - Milluni
Estación Hidrométrica para control de caudal Milluni (Presa de regulación Milluni)
Coordenadas de la cuenca (centro) 590997.202 , 8195102.13
Rango Altitudinal (msnm) 4451 - 5669
Elevación media (msnm) 4807,473071
Superficie (km2) 59,477
Perímetro (km) 38,037
Exposición general Sur (193.84)
Pendiente media (%) 26,79%
Longitud del cauce principal (Km) 11,430
Longitud de la red de drenaje (km) 109,970
Coeficiente de compacidad 1,357
Factor de forma 0,457
Densidad de drenaje (km/km2) 1,842
Tiempo de concentración (h) 0,702
Tiempo de almacenamiento (h) 0,456
Tabel 11: Physiological characteristics – Milluni-basin (Calizaya, 2012)

50
V. Drinkwater production in the treatment plant of Achachicala
Figure 39: Treatment plant of Achachicala (EPSAS, 2012)

51
VI. Comparison permissible limits Belgium and Bolivia
Parameters Eenheden Permissible limits Belgium
Permissible limits Bolivia - Class B
pH 5,5-9 5,5-9,5
Zwevende stoffen mg/l G: 50 1500
Temperatuur °C 25(0)
Soortelijk geleidingsvermogen
µS/cm à 20°C G: 1000
Opgelost ijzer mg/l Fe G: 0,2 2
Mangaan mg/l Mn G: 1 2
Koper mg/l Cu G: 1 2
Zink mg/l Zn 5 15
Arsenicum mg/l As 0,1 0,05
Cadmium mg/l Cd 0,005 0,2
Lood mg/l Pb 0,05 0,1
Kwik mg/l Hg 0,001 0,01
Cyanide mg/l CN 0,05
Sulfaten mg/l SO4 250(0) 600
Chloriden mg/l Cl G: 200 700
Fosfaten mg/l P2O5 G: 0,7
Verzadigingspercentage O2 % O2 G: > 30 > 60%
NMP/100 ml. (Numéro Maís Provával)
NMP/100 ml.
< 10.000 < 2.000 en 80 %
Magnesium mg/l 300
Calcium mg/l 400 Tabel 12: Comparison Permissible Limits Belgium and Bolivia “G:” stands for “Guideline”

52
VII. Total map of the Milluni-valley displayed with WEAP
Figure 40: Total map of the Milluni-valley displayed with WEAP

53
VIII. Monthly Flow 2000-2010:
Milluni-basin
Monthly Flow 2000-2010 Cuenca Milluni
2000 2001 2002 2003 2004 2005 2006 2007 2008 2009 2010
januari 0,3 2 1,5 1,2 1,4 0,4 0,5 1,4 1,5 1,4 1,5
februari 0,7 2,8 1,45 2,2 1,6 0,6 1,4 1,6 2,5 0,9 1,6
maart 0,75 1,4 1,85 1,7 1,3 0,4 0,9 1,4 1,5 0,7 1,9
april 1,2 0,45 1,1 1,4 0,4 0,3 0,6 1,6 0,9 0,4 1,4
mei 0,5 0,5 0,4 0,1 0,3 0,25 0,4 0,7 0,2 0,1 0,4
juni 0,2 0,35 0,1 0,05 0,1 0,45 0,1 0,4 0,05 0 0,1
juli 0,3 0,2 0,3 0,05 0,1 0,3 0,05 0,05 0,05 0,2 0
augustus 0 0,4 0,2 0,1 0,2 0,05 0 0,1 0,1 0 0
september 0,05 0,35 0,5 0,2 0,25 0,05 0,25 0,05 0,4 0,4 0,1
oktober 1,2 0,7 1,4 0,3 0,3 0,2 0,2 0,4 0,3 0,5 0,8
november 0,5 0,7 0,8 0,6 0,35 0,35 0,5 0,9 0,9 1,2 0,4
december 1,4 1,5 0,9 1,1 0,4 0,5 1,4 1,3 1,4 1,5 1,4
Tabel 13: Monthly Flow 2000-2010 Milluni-basin (Calizaya, 2010)

54
IX. Result of
the
scenarios in a flow chart
Figure 41: Result – Comparing Scenarios