contamination investigation report fairbanks...
TRANSCRIPT
CONTAMINATION INVESTIGATION REPORT Fairbanks Townsite, Block 2
Prepared for:
City of Fairbanks
Engineering Department 800 Cushman Street
Fairbanks, AK 99701-4615
September 13, 2002
Prepared by:
NORTECH Environmental & Engineering Consultants
2400 College Road Fairbanks, AK 99709
(907) 452-5688 Fax: (907) 452-5694
ENVIRONMENTAL & ENGINEERING CONSULTANTS NORTECH Fairbanks: 2400 College Rd, 99709 907.452.5688 Fax: 907.452.5694
Anchorage: 206 E. Fireweed Ln, Suite 200, 99503 907.222.2445 Fax: 907.222.0915 [email protected] www.nortechengr.com
F:\0Jobs\2002 \188 City Blk 2 Delineation\188.1 CONTAMINANT DELINEATION\Reports\Drafts\CI Report (v3).doc
1
September 13, 2002 City of Fairbanks Engineering Department 800 Cushman Street Fairbanks, AK 99701-4615 ATTN: Chris Haigh, PE RE: Contamination Investigation Report
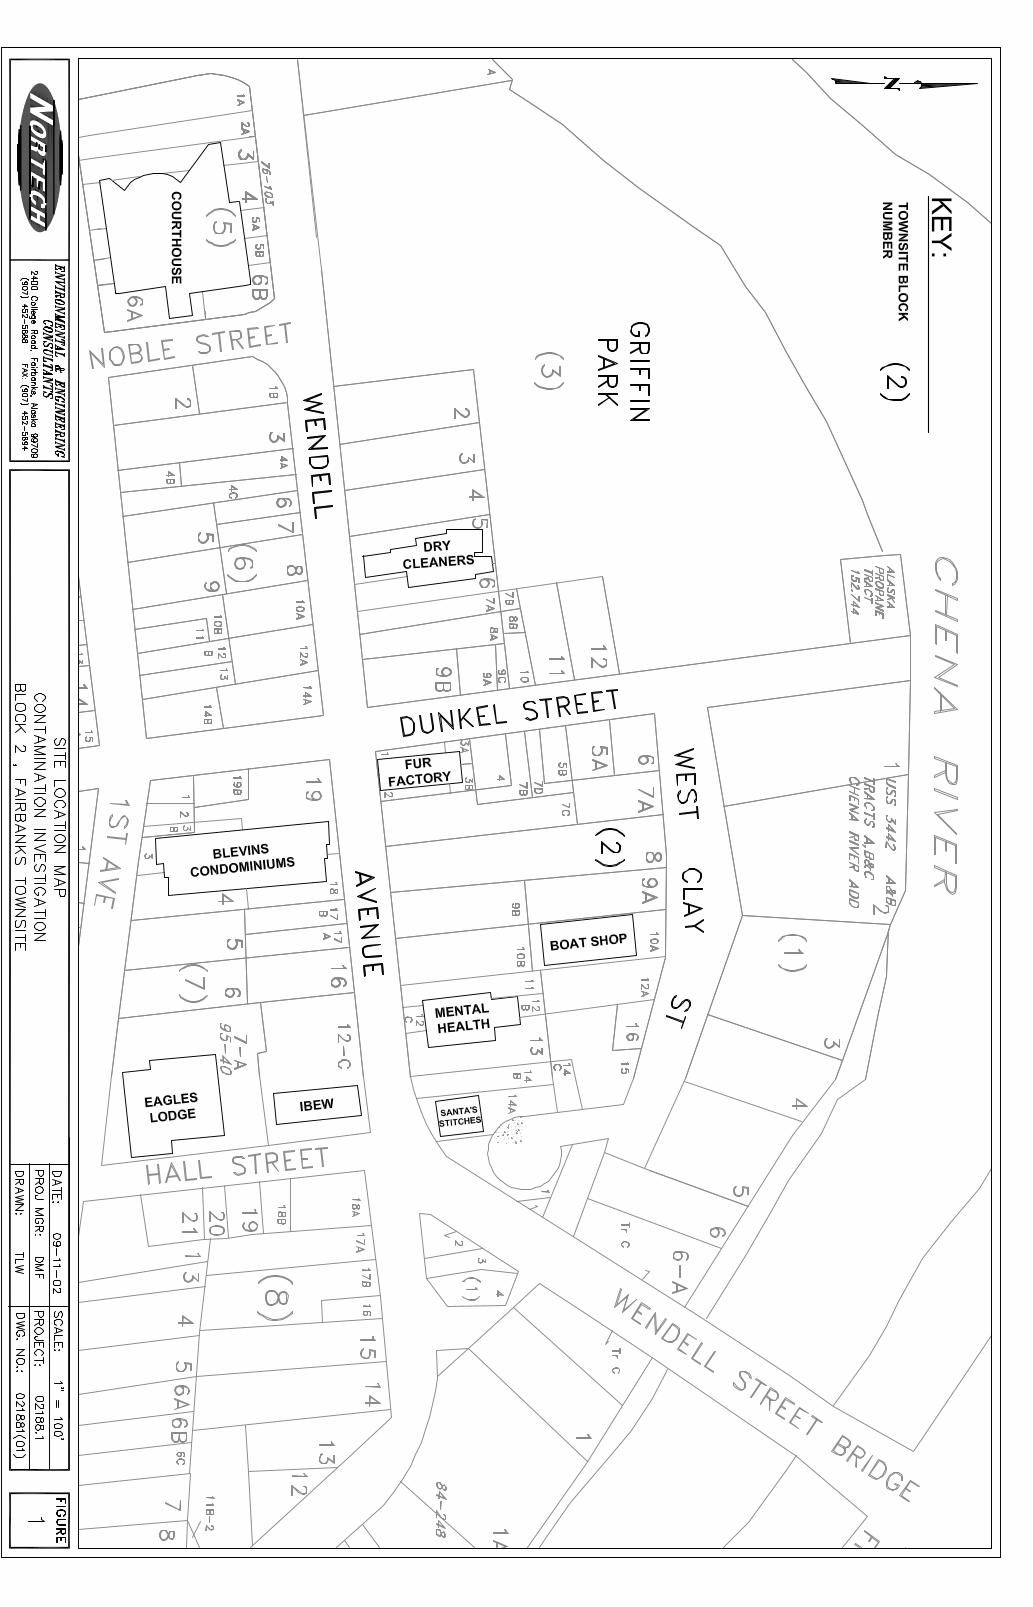
City of Fairbanks Townsite, Block 2 Dear Mr. Haigh: NORTECH Environmental and Engineering Consultants, Inc. (NORTECH) is pleased to present you with this contamination investigation report describing our work and findings at and around Block 2, Fairbanks Townsite. Block 2 comprises those properties located between West Clay Street and Wendell Avenue, and Dunkel Street and the Wendell Street Bridge’s southern access (Figure 1). The subject area refers to Block 2 and immediately neighboring lands. The objective of the contamination investigation was to locate the source(s) and general distribution of tetrachloroethene (PCE) and trichloroethene (TCE) groundwater contamination, discovered through our Phase II Environmental Site Assessment (ESA) of the Wendell Avenue area in spring 2001. This work was performed in accordance with our proposal dated June 28, 2002, as Amendment 1 to the City of Fairbanks Professional Services Contract FB—02-06, which was authorized by the City of Fairbanks on July 3, 2002. BACKGROUND During 2001, NORTECH performed a Phase I ESA and subsequent Phase II ESA soil and groundwater sampling activities in the Wendell Avenue area. The specific Phase II ESA soil boring and sampling work was based on environmental concerns related to our Phase I ESA findings and ESA information reported by others for nearby properties. More specifically, NORTECH performed three soil borings and sampled three temporary groundwater monitoring wells (identified as B-1, B-2 and B-3 herein) on or adjacent to Blocks 2 and 3 of downtown Fairbanks. Results gathered from the soil and groundwater analyses indicated chlorinated compounds (PCE and TCE) above State of Alaska cleanup levels in off-site soil and area groundwater. A long-established commercial dry-cleaning operation at Lots 5 & 6, Block 3, Fairbanks Townsite was tentatively identified as a suspected source. A wood-stave sewer line running beneath Wendell Avenue appeared to have conveyed contamination up-gradient or cross-gradient of the general groundwater flow direction (southeast to northwest). Please refer to NORTECH’s Phase II Environmental Site Assessment, Wendell Avenue Area, Blocks 2 and 7, Fairbanks Townsite, Fairbanks, Alaska, dated May 30, 2001 for further discussion related to the earlier contamination findings.
Contamination Investigation Report Block 2, Fairbanks Townsite
City of Fairbanks September 13, 2002
F:\0Jobs\2002 \188 City Blk 2 Delineation\188.1 CONTAMINANT DELINEATION\Reports\Drafts\CI Report (v3).doc
2
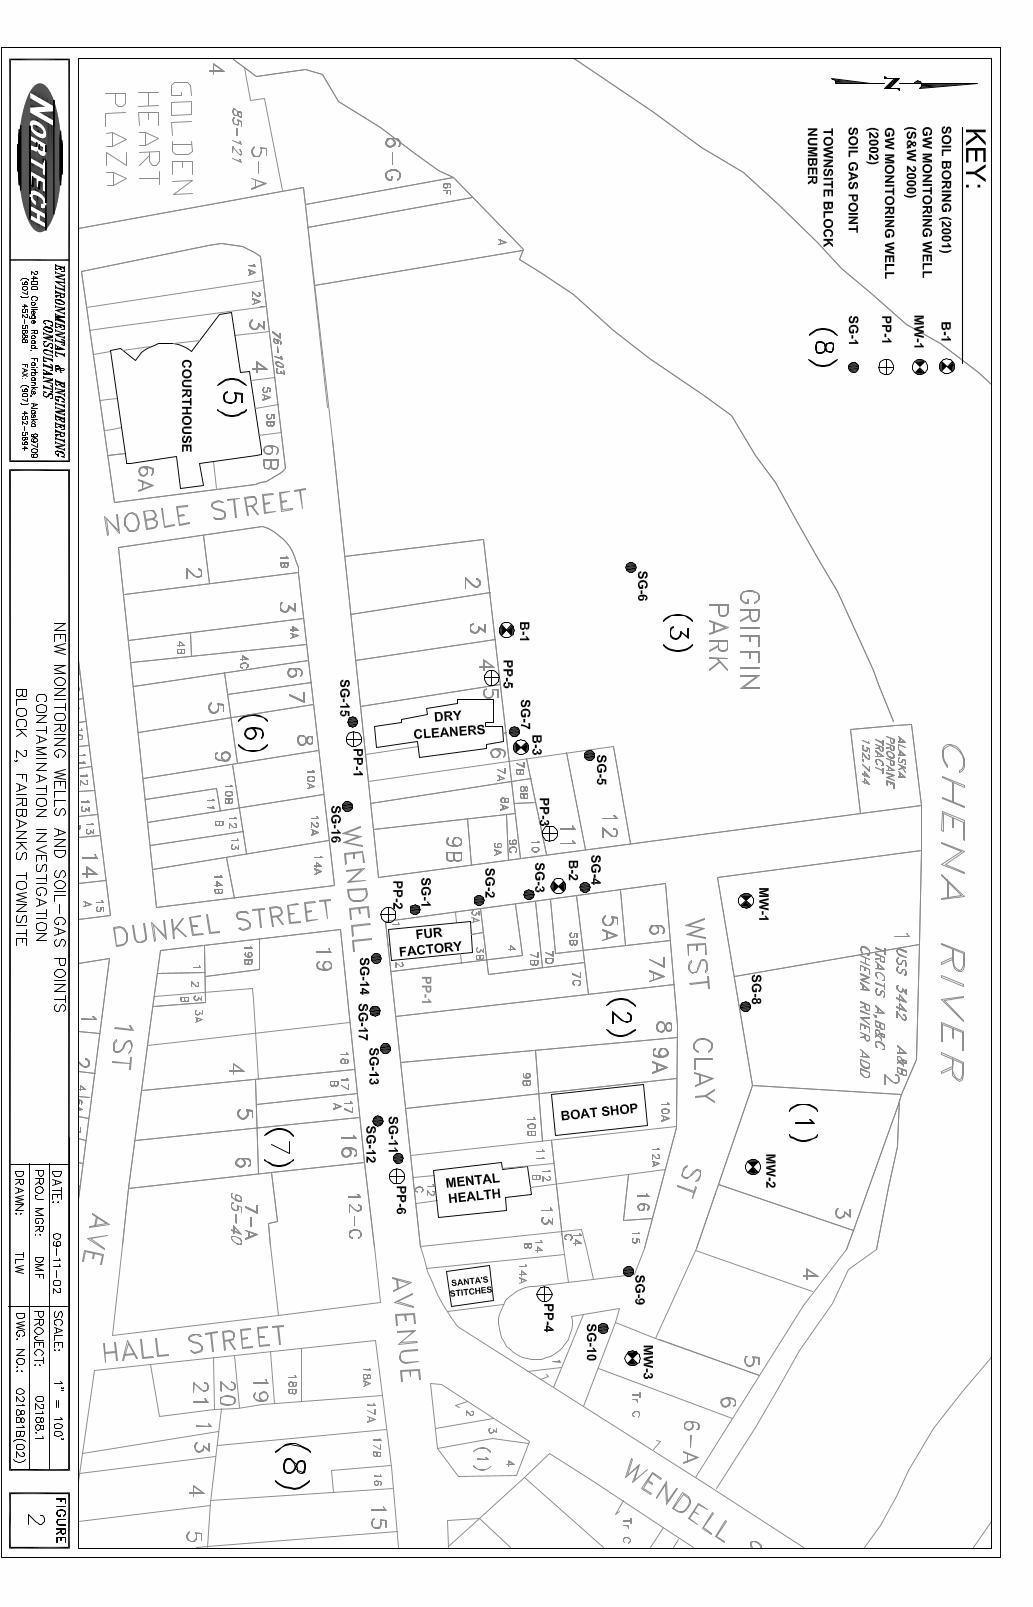
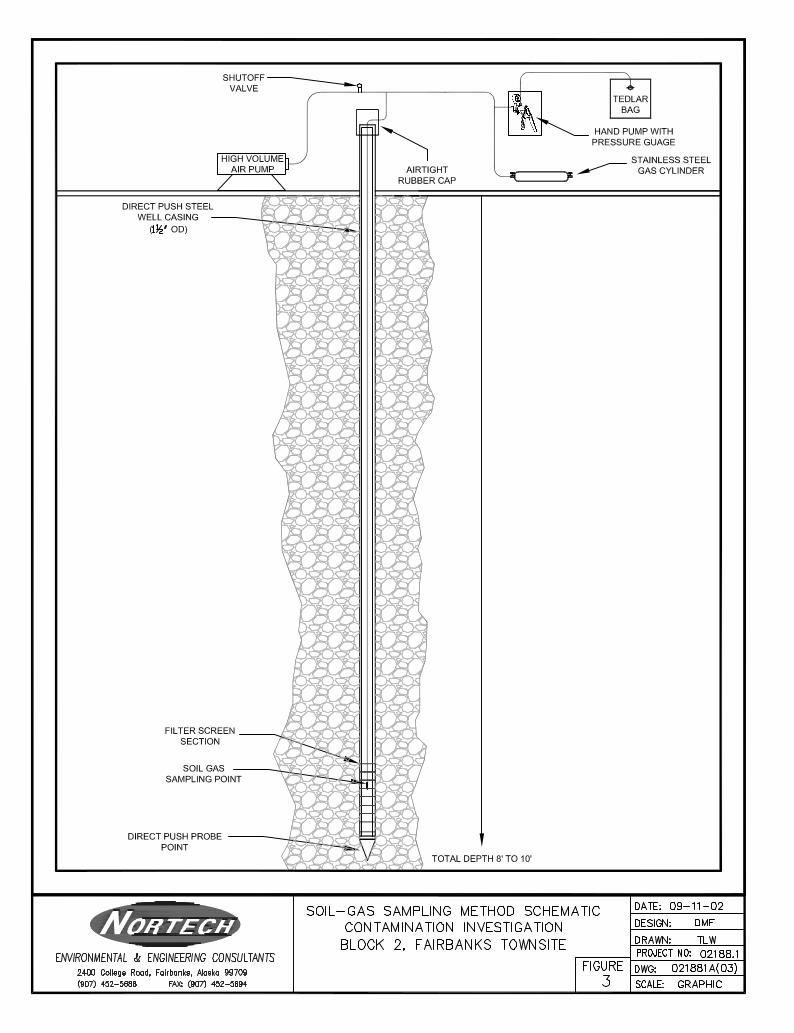
FIELD ACTIVITIES Field activities for this contamination investigation included Block 2 reconnaissance, a limited soil-gas survey, installation of monitoring wells, and sampling and testing for investigative purposes relative to known groundwater contamination in the subject area. Each of these field tasks is described herein. Reconnaissance Clay Baldwin and Toos Omtzigt, Staff Professionals with NORTECH, coordinated utility locates and canvassed the Block 2 property owners and residents asking permission to drill on various private properties. Authorization for property access was not obtained from any of the Block 2 property owners. Access was obtained and permission to drill given by the owners of MC Commercial dry cleaners (Block 3, Lot 5) and the Midnight Mine Bar (Block 3, Lots 11 and 12), and for the City of Fairbanks street rights-of way (ROW). We mistakenly failed to gain approval from the Fairbanks North Star Borough (Griffin Park). A traffic plan was submitted to the City Engineering Department prior to drilling. Traffic signs, barricades and cones were used in accordance with the traffic plan at each ROW drilling location. Limited Soil-Gas Survey Clay Baldwin performed a limited soil-gas survey of Block 2 on July 22 and 23, 2002. Soils Alaska, Incorporated (SA) was subcontracted to accomplish direct-push (DP) drilling of the soil-gas points. Seventeen soil-gas points were driven to various depths above the water table within Block 2 street ROWs, Block 3, Lot 12, and Griffin Park (Figure 2). Soil-gas points driven along Wendell Avenue, Dunkel Street, and West Clay Street were strategically located to investigate a suspect underground sewer mainline and portions of Block 3 where access permission was made available. Soil-gas points SG-5, SG-7 and SG-15 were located to substantiate earlier findings relative to known groundwater contamination in the Block 3 area. Figure 3 illustrates the soil-gas sampling methodology. The above-ground piping stick-up of the temporary soil-gas points was retrofitted with a rubber seal configured with poly-tube insert for vacuuming and sampling. After the sampling tube is sealed, a vacuum pump applied to the well created negative pressure inside the well. This procedure removed stagnant air inside the well chamber, allowing it to refill with soil gas from the screened interval depth. At the sampling port, a hand pump and Tedlar® bag were used to collect a field-screening sample. An RAE PGM-7240 ppb-VOC gas monitor was used to measure total volatile organics in the field-screened soil gas samples. For analytical samples, silicon tubing was connected to one side of a stainless steel gas cylinder and the vacuum pump to the other side for drawing soil gas into the cylinder from a well. The gas cylinders were sealed with stop-cock valves at both ends; labels were attached for sample identification and logging. Soil-gas samples were listed on a Chain-of-Custody form and routed through CT&E Environmental Services, Inc (CT&E) to Air Toxics, Limited (AT), a certified NELAP (National Environmental Laboratory Accreditation Program) laboratory in Folsom, California.
Contamination Investigation Report Block 2, Fairbanks Townsite
City of Fairbanks September 13, 2002
F:\0Jobs\2002 \188 City Blk 2 Delineation\188.1 CONTAMINANT DELINEATION\Reports\Drafts\CI Report (v3).doc
3
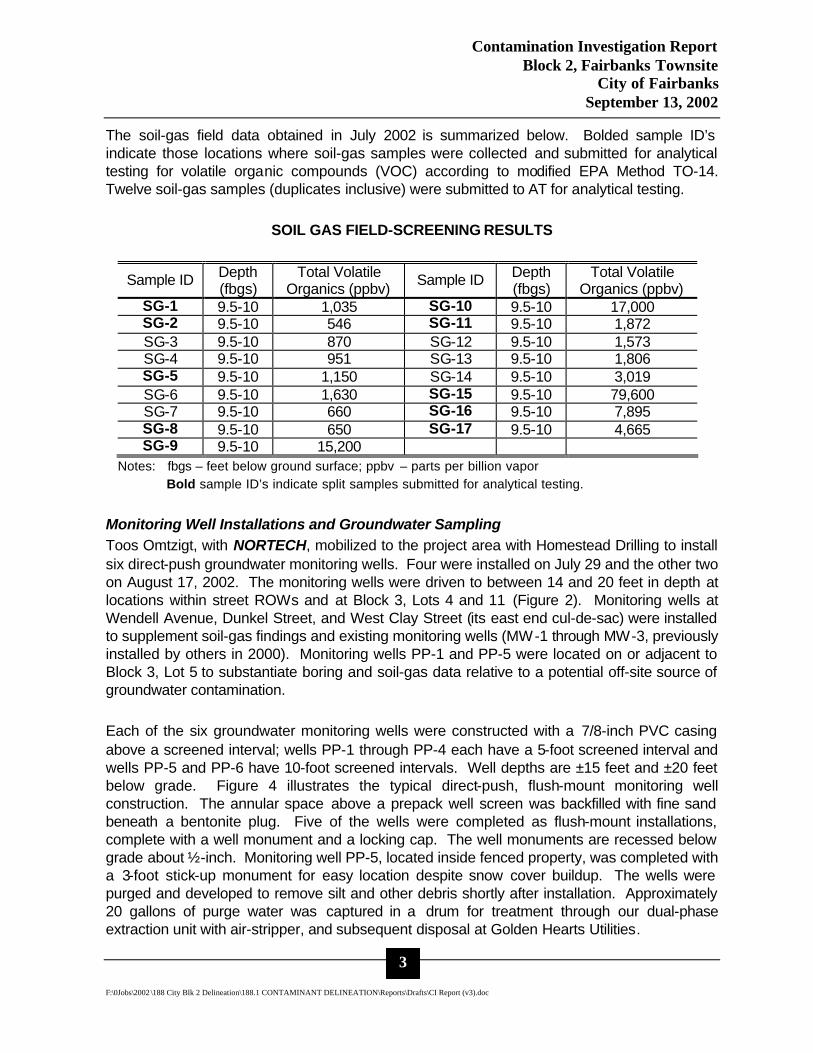
The soil-gas field data obtained in July 2002 is summarized below. Bolded sample ID’s indicate those locations where soil-gas samples were collected and submitted for analytical testing for volatile organic compounds (VOC) according to modified EPA Method TO-14. Twelve soil-gas samples (duplicates inclusive) were submitted to AT for analytical testing.
SOIL GAS FIELD-SCREENING RESULTS
Sample ID Depth (fbgs)
Total Volatile Organics (ppbv) Sample ID Depth
(fbgs) Total Volatile
Organics (ppbv) SG-1 9.5-10 1,035 SG-10 9.5-10 17,000 SG-2 9.5-10 546 SG-11 9.5-10 1,872 SG-3 9.5-10 870 SG-12 9.5-10 1,573 SG-4 9.5-10 951 SG-13 9.5-10 1,806 SG-5 9.5-10 1,150 SG-14 9.5-10 3,019 SG-6 9.5-10 1,630 SG-15 9.5-10 79,600 SG-7 9.5-10 660 SG-16 9.5-10 7,895 SG-8 9.5-10 650 SG-17 9.5-10 4,665 SG-9 9.5-10 15,200
Notes: fbgs – feet below ground surface; ppbv – parts per billion vapor Bold sample ID’s indicate split samples submitted for analytical testing.
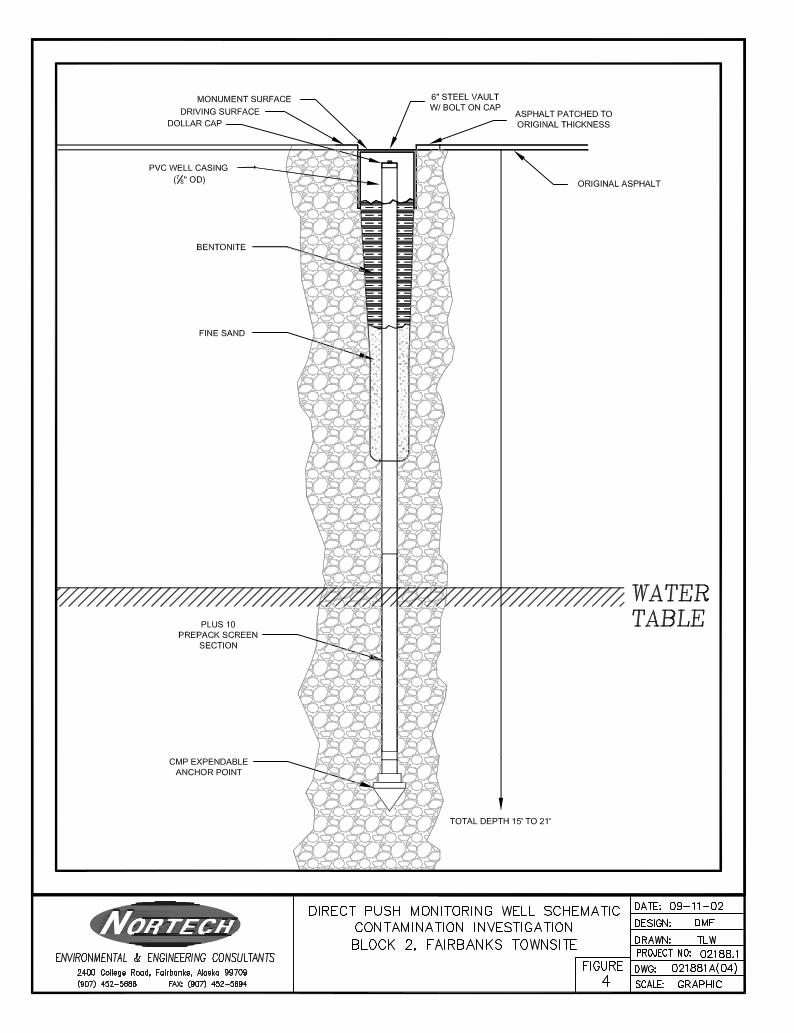
Monitoring Well Installations and Groundwater Sampling Toos Omtzigt, with NORTECH, mobilized to the project area with Homestead Drilling to install six direct-push groundwater monitoring wells. Four were installed on July 29 and the other two on August 17, 2002. The monitoring wells were driven to between 14 and 20 feet in depth at locations within street ROWs and at Block 3, Lots 4 and 11 (Figure 2). Monitoring wells at Wendell Avenue, Dunkel Street, and West Clay Street (its east end cul-de-sac) were installed to supplement soil-gas findings and existing monitoring wells (MW-1 through MW-3, previously installed by others in 2000). Monitoring wells PP-1 and PP-5 were located on or adjacent to Block 3, Lot 5 to substantiate boring and soil-gas data relative to a potential off-site source of groundwater contamination. Each of the six groundwater monitoring wells were constructed with a 7/8-inch PVC casing above a screened interval; wells PP-1 through PP-4 each have a 5-foot screened interval and wells PP-5 and PP-6 have 10-foot screened intervals. Well depths are ±15 feet and ±20 feet below grade. Figure 4 illustrates the typical direct-push, flush-mount monitoring well construction. The annular space above a prepack well screen was backfilled with fine sand beneath a bentonite plug. Five of the wells were completed as flush-mount installations, complete with a well monument and a locking cap. The well monuments are recessed below grade about ½-inch. Monitoring well PP-5, located inside fenced property, was completed with a 3-foot stick-up monument for easy location despite snow cover buildup. The wells were purged and developed to remove silt and other debris shortly after installation. Approximately 20 gallons of purge water was captured in a drum for treatment through our dual-phase extraction unit with air-stripper, and subsequent disposal at Golden Hearts Utilities.
Contamination Investigation Report Block 2, Fairbanks Townsite
City of Fairbanks September 13, 2002
F:\0Jobs\2002 \188 City Blk 2 Delineation\188.1 CONTAMINANT DELINEATION\Reports\Drafts\CI Report (v3).doc
4
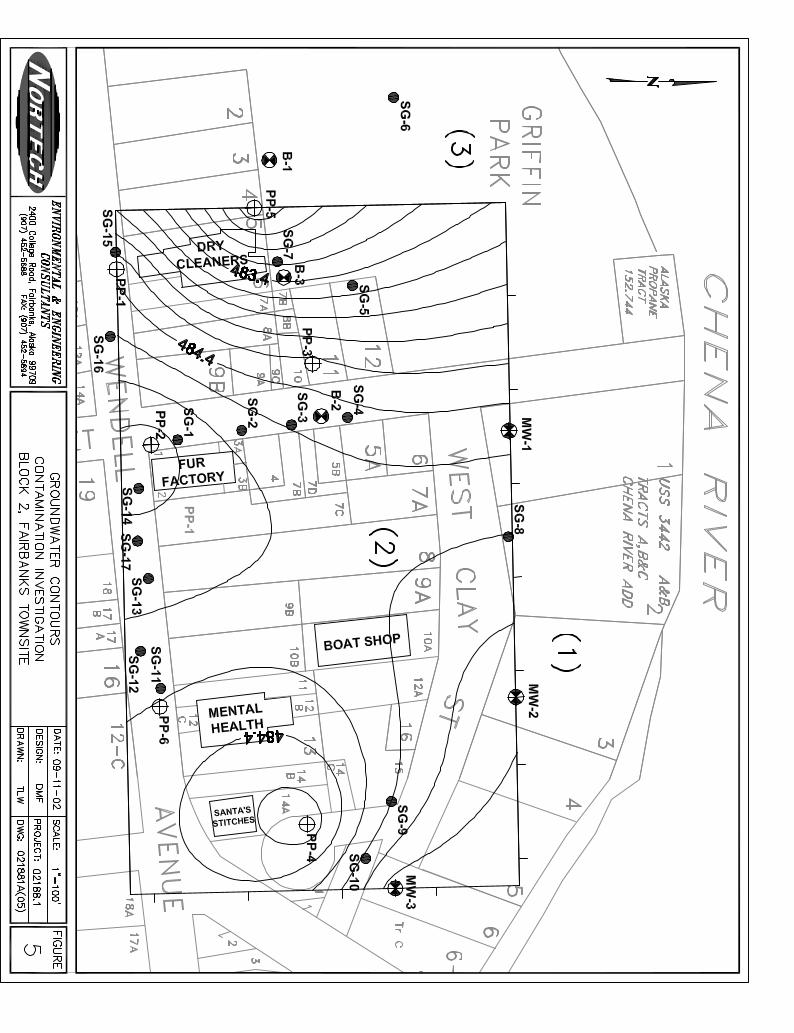
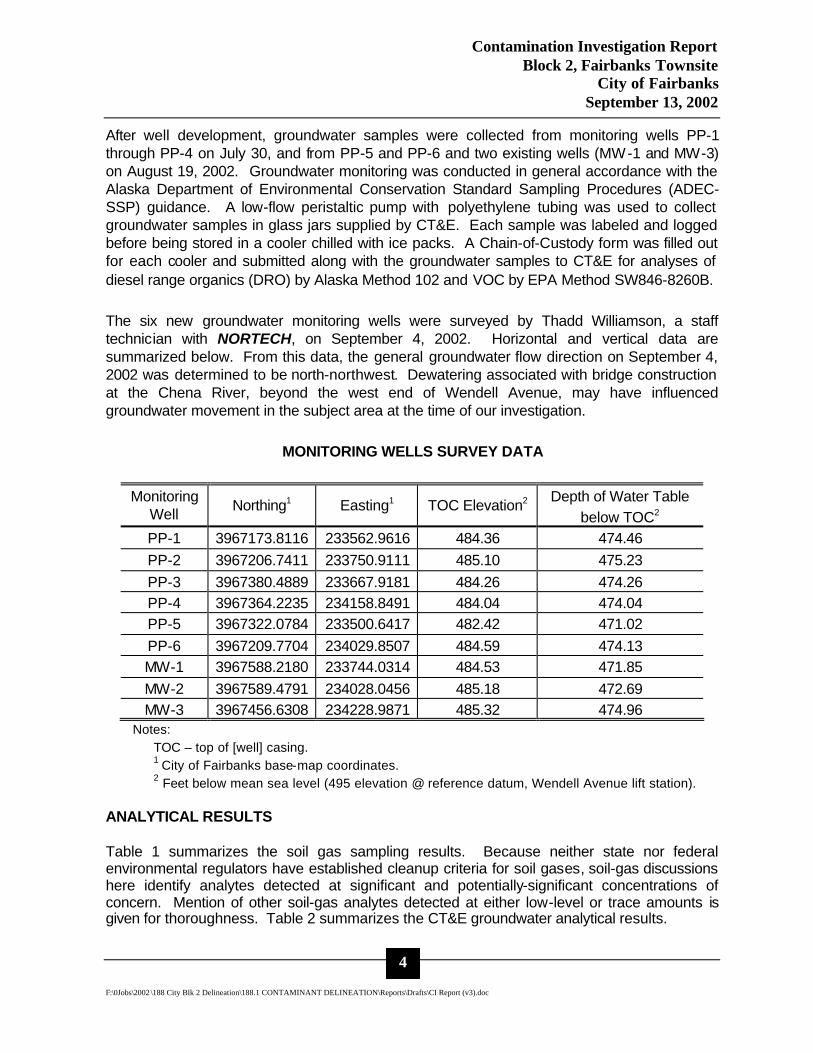
After well development, groundwater samples were collected from monitoring wells PP-1 through PP-4 on July 30, and from PP-5 and PP-6 and two existing wells (MW-1 and MW-3) on August 19, 2002. Groundwater monitoring was conducted in general accordance with the Alaska Department of Environmental Conservation Standard Sampling Procedures (ADEC-SSP) guidance. A low-flow peristaltic pump with polyethylene tubing was used to collect groundwater samples in glass jars supplied by CT&E. Each sample was labeled and logged before being stored in a cooler chilled with ice packs. A Chain-of-Custody form was filled out for each cooler and submitted along with the groundwater samples to CT&E for analyses of diesel range organics (DRO) by Alaska Method 102 and VOC by EPA Method SW846-8260B. The six new groundwater monitoring wells were surveyed by Thadd Williamson, a staff technician with NORTECH, on September 4, 2002. Horizontal and vertical data are summarized below. From this data, the general groundwater flow direction on September 4, 2002 was determined to be north-northwest. Dewatering associated with bridge construction at the Chena River, beyond the west end of Wendell Avenue, may have influenced groundwater movement in the subject area at the time of our investigation.
MONITORING WELLS SURVEY DATA
Monitoring Well Northing1 Easting1 TOC Elevation2 Depth of Water Table
below TOC2 PP-1 3967173.8116 233562.9616 484.36 474.46 PP-2 3967206.7411 233750.9111 485.10 475.23 PP-3 3967380.4889 233667.9181 484.26 474.26 PP-4 3967364.2235 234158.8491 484.04 474.04 PP-5 3967322.0784 233500.6417 482.42 471.02 PP-6 3967209.7704 234029.8507 484.59 474.13 MW-1 3967588.2180 233744.0314 484.53 471.85 MW-2 3967589.4791 234028.0456 485.18 472.69 MW-3 3967456.6308 234228.9871 485.32 474.96
Notes: TOC – top of [well] casing.
1 City of Fairbanks base-map coordinates. 2 Feet below mean sea level (495 elevation @ reference datum, Wendell Avenue lift station).
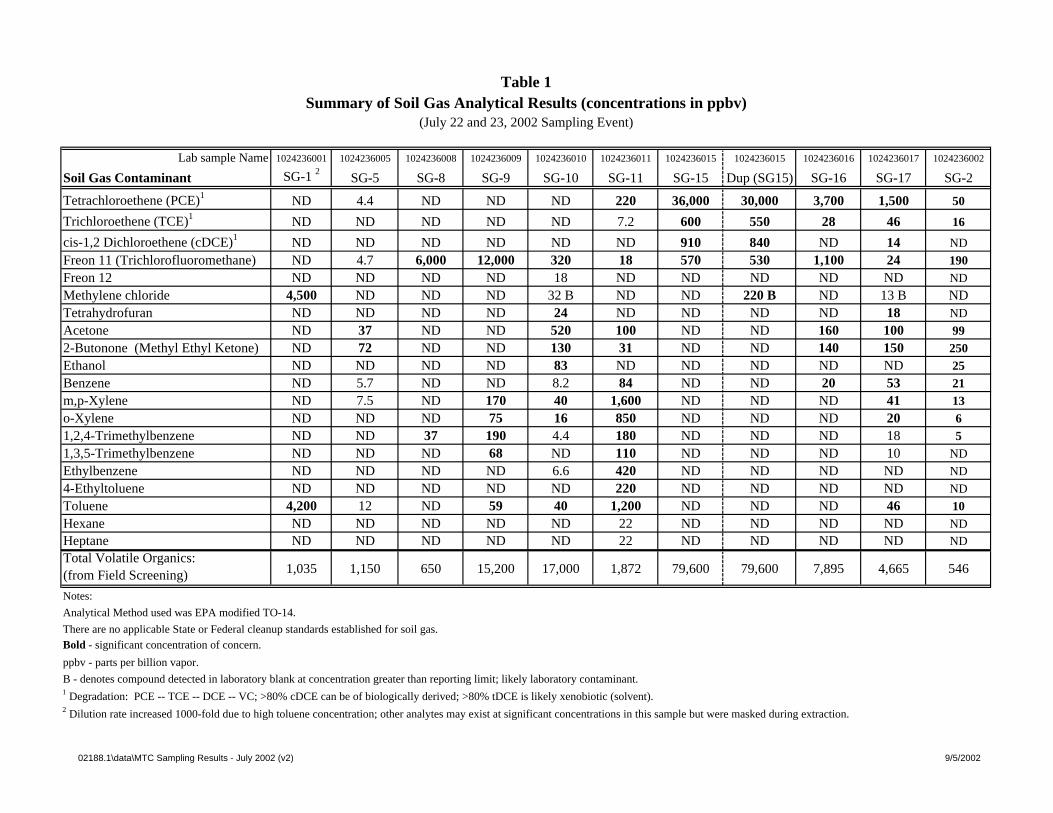
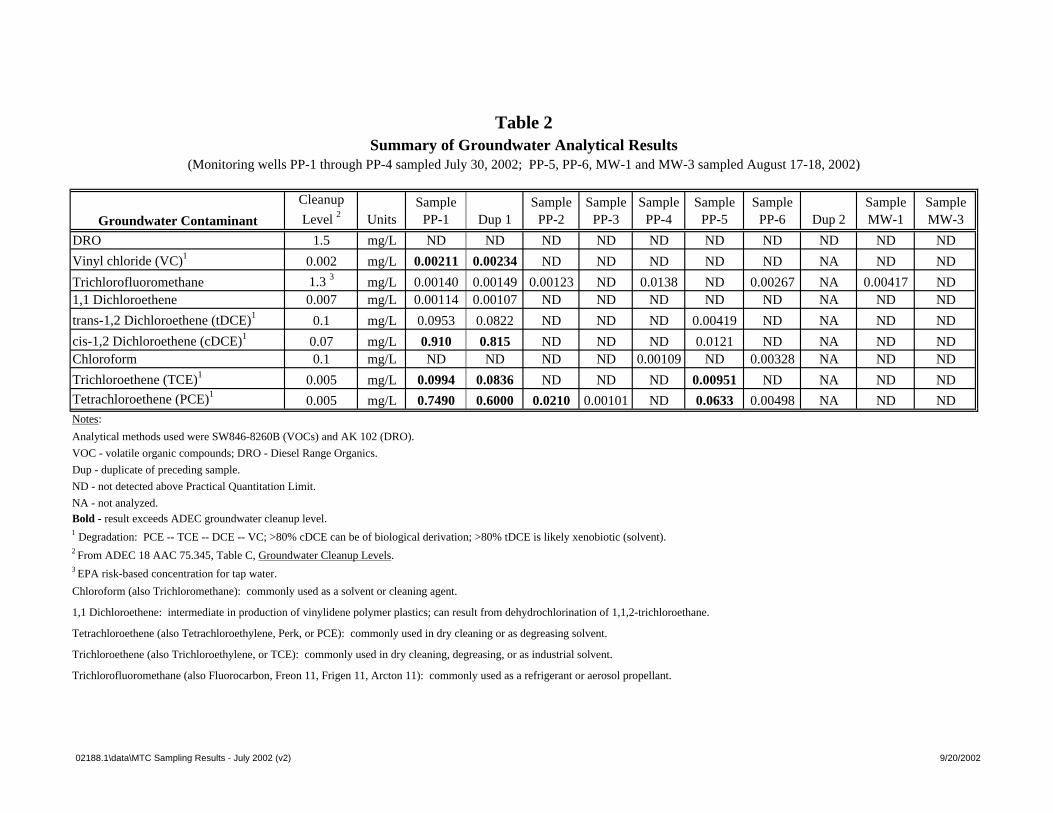
ANALYTICAL RESULTS Table 1 summarizes the soil gas sampling results. Because neither state nor federal environmental regulators have established cleanup criteria for soil gases, soil-gas discussions here identify analytes detected at significant and potentially-significant concentrations of concern. Mention of other soil-gas analytes detected at either low-level or trace amounts is given for thoroughness. Table 2 summarizes the CT&E groundwater analytical results.
Contamination Investigation Report Block 2, Fairbanks Townsite
City of Fairbanks September 13, 2002
F:\0Jobs\2002 \188 City Blk 2 Delineation\188.1 CONTAMINANT DELINEATION\Reports\Drafts\CI Report (v3).doc
5
Methylene chloride and toluene vapors in soil were detected in significant concentrations at 4,500 parts-per-billion vapor (ppbv) and 4,200 ppbv, respectively in the SG-1 sample. Because of the elevated toluene concentration, the laboratory’s dilution rate was increased 1000-fold to protect the gas chromatograph equipment from damage. A consequence of increased dilution during analysis resulted in the potential masking of other contaminants that might have been present in the sample. Soil gas from SG-2 reportedly contained potentially significant concentrations of PCE (50 ppbv), trichlorofluoromethane, or Freon 11 (190 ppbv), 2-butanone (250 ppbv), and acetone (99 ppbv), low levels of ethanol (25 ppbv) and benzene (21 ppbv), and trace levels of 1,2,4-trimethylbenzene, toluene and xylenes. Low levels of acetone (37 ppbv), 2-butonone (72 ppbv), and traces of PCE, Freon 11 and petroleum analytes benzene, xylenes, and toluene were detected in soil gas drawn from SG-5. Freon 11 was detected at 6,000 and 12,000 ppbv in the respective SG-8 and SG-9 soil-gas samples. Low-level petroleum hydrocarbons (e.g., 1,2,4-trimethylbenzene 1,3,5-trimethylbenzene, toluene and xylenes) were also detected in these two samples. Freon 11, acetone, and 2-butanone were detected at potentially-significant concentrations of 320, 520 and 130 ppbv, respectively, in the SG-10 soil-gas sample. Otherwise, low levels of ethanol, xylenes and toluene, and traces of Freon 12, tetrahydrofuran, benzene, 1,2,4-trimethylbenzene, and ethylbenzene were detected in SG-10 soil gas. Significant and potentially-significant concentrations of PCE and daughter compounds TCE and cis-1,2 dichloroethene (cDCE) were detected in SG-11, SG-15, SG-16 and SG-17 soil-gas samples. The reported concentrations of PCE and TCE in the SG-11 sample were 220 and 7.2 ppbv, respectively. The highest reported concentrations of PCE, TCE and cDCE in the SG-15 sample were 36,000, 600, and 910 ppbv, respectively. Respective concentrations of PCE and TCE in the SG-16 sample were 3,700 and 28 ppbv. PCE, TCE and cDCE were detected in the SG-17 sample at 1,500, 46, and 14 ppbv, respectively. Freon 11 was reported at 570 and 1,100 ppbv in the respective SG-15 and SG-16 samples; low levels of the refrigerant were detected in the SG-11 and SG-17 samples also. Other VOCs were detected in the SG-11 soil-gas sample; namely acetone, 2-butanone, benzene, total xylenes, 1,2,4- trimethylbenzene, 1,3,5-trimethybenzene, ethylbenzene, toluene, and 4-ethyltoluene were detected at 100, 31, 84, 2,450, 180, 110, 420, 1,200, and 220 ppbv, respectively. Referring to the Table 2 groundwater results, PCE and daughter products were detected above ADEC 18 AAC 75.345, Table C Groundwater Cleanup Levels in monitoring wells PP-1, PP-2, and PP-5. The reported concentrations of PCE, TCE, cDCE and vinyl chloride (VC) in the PP-1 groundwater sample were 0.749, 0.0994, 0.910 and 0.00211 mg/L water, respectively. Other analytes detected below cleanup levels at this location were trans-1,2 dichloroethene (tDCE), 1,1 dichloroethene and trichlorofluoromethane. PCE in excess of the State’s GW cleanup level and trace trichlorofluoromethane were reported at 0.0210 and 0.00123 mg/L water, respectively, in the PP-2 groundwater sample. PCE was reported below the State’s GW cleanup level, at 0.00101 mg/L in the PP-3 groundwater sample. Trace amounts of chloroform and trichlorofluoromethane were detected in groundwater at monitoring well PP-4. PCE and TCE were reported in excess of State’s GW cleanup levels at 0.0633 and 0.00951 mg/L respectively, in monitoring well PP-5 groundwater; trace concentrations of cDCE and tDCE were also reported. PCE, chloroform and trichlorofluoromethane were detected in concentrations below the State’s GW cleanup levels in PP-6 groundwater.
Contamination Investigation Report Block 2, Fairbanks Townsite
City of Fairbanks September 13, 2002
F:\0Jobs\2002 \188 City Blk 2 Delineation\188.1 CONTAMINANT DELINEATION\Reports\Drafts\CI Report (v3).doc
6
Trichlorofluoromethane was detected at a level below the State’s GW cleanup level in MW-1‘s groundwater. No VOC analytes were detected above practical quantitation limits (PQLs) in the groundwater from MW-3. QA/QC SUMMARY Quality Assurance/Quality Control (QA/QC) procedures are useful for evaluating the quality of analytical data. QA used to evaluate the results included sample duplication, precision, detection limits, and other quantifiable indicators. QC is provided by the laboratories in analyzing trip and lab blanks, and laboratory control samples (LCS) to verify proper analyses. Furthermore, we use the ADEC-SSP for guidance on sampling and precision of results. Table 3 summarizes the QA/QC results for this contamination investigation project. A full screen duplicate soil-gas sample was collected from soil-gas point SG-15 at the same time as its counterpart, and the sample pair was analyzed for VOCs. A duplicate groundwater sample was also collected from monitoring well PP-1 at the same time as its counterpart, and both were analyzed for VOCs (DRO was non-detect above PQL in both samples). The duplication frequency for groundwater sampling thus exceeds the ADEC requirement of one field-duplicate per ten groundwater samples collected, or ten percent. Although not regulated, the duplication frequency for soil-gas was twenty percent, or two field duplicates for the ten samples submitted for analytical testing. The duplicate pairs are identified in Table 3 and evaluated for precision. Precision, expressed as the relative percentage difference (RPD) between comparable analyte concentrations is an indication of sampling consistency. RPD is calculated as the difference between the field and duplicate sample results divided by the average of the two values, multiplied by 100 to convert to a percentage. RPD is not calculable for non-detect analytes. The ADEC SSP guidance for precision is ±50 percent. From Table 3, the RPDs for all comparable analytes were calculated between 6 and 27 percent, meeting the precision objective for this project. Laboratory precision and accuracy parameters for all soil-gas and groundwater samples, groundwater trip blanks, a method blank, LCS samples, and three of the lab blanks were acceptable. Trace methylene chloride was detected in one LCS sample (Lab Blank 10C), an indication that a laboratory contaminant was introduced during its analysis. This anomaly does not compromise the quality of the analytical results. CONCLUSIONS AND RECOMMENDATIONS A distinction between off-site and on-site environmental concerns is made here with respect to findings of this contamination investigation. Off-site concerns imply that likely sources of contamination lie beyond the bounds of Block 2, Fairbanks Townsite; where PCE and TCE from an apparent off-site source have impacted area groundwater. Concerns cited about Freon and petroleum constituents in soil are directly related to the Block 2 properties.
Contamination Investigation Report Block 2, Fairbanks Townsite
City of Fairbanks September 13, 2002
F:\0Jobs\2002 \188 City Blk 2 Delineation\188.1 CONTAMINANT DELINEATION\Reports\Drafts\CI Report (v3).doc
7
Off-Site Concerns PCE is a simple organic molecule with a specific gravity heavier than that of water. It is classified as a dense, non-aqueous-phase chlorinated aliphatic hydrocarbon. Aerobic biodegradation of PCE in groundwater is a function of oxygen and temperature, and the rate of kinetic transformation into daughter products (e.g., TCE, cDCE and VC) is governed by availability of electron acceptors. Previous local experience has indicated that natural attenuation of PCE and TCE in Fairbanks/North Pole area groundwater is rather slow, taking years, perhaps decades, to progress under depressed aerobic conditions (e.g., in cold water with low dissolved oxygen) and slow kinetic transformation. Soil-gas results from SG-11, SG-15, SG-16 and SG-17, and groundwater results from monitoring wells PP-1, PP-2 and PP-6 substantiate our suspicion about the underground wood-stave, sewer mainline along Wendell Avenue having carried chemical contaminants. There is good correlation between the field soil-gas data and soil-gas analytical results, and between soil-gas and groundwater analytical results. The seven soil-gas points driven in this street were staggered on both sides of the sewer pipeline in an attempt to assess the sewer line as a potential migration pathway for VOC leakage to groundwater. Of the four samples submitted for VOC analysis from beneath Wendell Avenue, a consistent, descending trend in the magnitudes of PCE, TCE and cDCE is noted as the well locations move eastward from SG-15 to SG-11. SG-15 was located quite near the junction of the sewer service connection to the MC Commercial dry cleaners (Block 3, Lot 5 & 6; in Figure 2). This is in the same proximity as groundwater monitoring well PP-1, where significant concentrations of PCE, TCE, cDCE and VC (vinyl chloride) were detected in groundwater in excess of the ADEC 18 AAC 75.345 GW cleanup levels. For comparison, the magnitude of PCE in groundwater at monitoring well PP-2, located about 175 feet up-gradient of PP-1, was 35 times less. PCE and TCE contamination in groundwater at monitoring well PP-5 (Block 3, Lot 4; in Figure 2) is similarly an order of magnitude less than that encountered in monitoring well PP-1. In the presence of a small or shallow groundwater gradient (or for low-rate groundwater movement) over time, the highest PCE concentrations in groundwater can be expected beneath a source, with depth. Lateral migration in groundwater would generally be down-gradient. However, groundwater reversals (consequence of flooding, ice jamming, or local dewatering events) or transport through a wood-stave sewer pipeline in this case, can lead to PCE detection in groundwater up-gradient of a source. In our opinion, the collective soil gas and groundwater results support the hypothesis that the MC Commercial sewer outfall has been a likely source for VOC contamination of the local groundwater. We have used the words “has been” because the clear presence of PCE daughter products and their reported concentrations in groundwater suggests old or weathered PCE contamination. This does not preclude VOC saturation of the wood-stave pipeline and gradual release of new contamination. Regardless, the ultimate source of the encountered VOC contamination in groundwater is apparently off-site and west (down-gradient) of Block 2. The concentrations of methylene chloride and toluene detected in the SG-1 soil-gas sample were significant enough to warrant analytical testing of the SG-2 sample. The significant and potentially-significant VOC analytes detected in SG-2’s soil gas sample were similar in kind, but lower in magnitude than those reportedly associated with SG-5. There is no apparent correlation between the SG-1 and SG-2 soil gas results. Groundwater results determined for
Contamination Investigation Report Block 2, Fairbanks Townsite
City of Fairbanks September 13, 2002
F:\0Jobs\2002 \188 City Blk 2 Delineation\188.1 CONTAMINANT DELINEATION\Reports\Drafts\CI Report (v3).doc
8
monitoring well PP-2, installed adjacent to soil-gas point SG-1, do not reflect these same contaminants. We suspect that a small, localized spill or release area with exotic contaminants in soil above the water table may exist beneath Dunkel Street, immediately west of the Fur Factory. The combined SG-1, SG-2 soil gas and monitoring well PP-2 groundwater results are not indicative of a potential problem with the visible presence of an old fuel dispenser located at the exterior northwest corner of the Fur Factory building. PCE in excess of the ADEC’s groundwater cleanup level at PP-2 likely emanates from the sewer line at the off-site dry cleaning facility to the west of Block 2. Similarly, the SG-5 soil-gas results suggest the presence of possible contaminants in soil at the west end of Lot 12, of Block 3. However, the results from monitoring well PP-3, located nearby on adjacent Lot 11, do not indicate any groundwater contamination. Consequently, concerns identified at or along Dunkel Street and Block 3, Lot 12 are probably soil related and have a low potential for negative impact to Block 2 properties. ADEC is investigating VOC groundwater contamination in the area. We recommend sharing findings in this report with ADEC in support of its efforts to delineate local groundwater contamination. Block 2 Concerns Significant concentrations of Freon 11 were detected in the SG-8 and SG-9 soil-gas sample analyses, as were potentially-significant concentrations of other VOC and petroleum analytes in the SG-9 and SG-10 soil-gas sample analyses. However, neither Freon 11 nor other VOCs were detected above ADEC’s cleanup levels in the groundwater collected from monitoring wells MW-1, MW-3 or PP-4. Collectively, these results do not indicate a current groundwater problem from the analytes detected. However, these widely spread soil-gas results as well as three years of groundwater results from MW-1 and MW-2 suggest the possibility of Freon 11, and possibly other VOCs, being present in the vadose zone (soils above the groundwater table) along West Clay Street. NORTECH confirmed that another antiquated, wood-stave sewer line exists somewhere under West Clay Street. The existence of this wood-stave sewer line and the elevated SG-8 and SG-9 soil-gas results (6,000 and 12,000 ppbv) present a soil scenario not unlike that encountered along Wendell Avenue. Given the apparent accuracy and usefulness of the soil gas results for indicating contaminant problems, we believe the potential for Freon-contaminated soil above the EPA-recommended Risk-Based Concentration level (1.1 mg/kg) bears further investigation. Even though the groundwater sample results for Freon 11 at MW-1 appear to have diminished by at least a factor of 100 since March 2000, it is possible that an unknown quantity of Freon 11-contaminated soils within the West Clay Street ROW needs to be delineated, removed and remediated. At a minimum, we recommend a focused historical review of the users of the properties along West Clay Street, determination of the sewer line location and depth, and a limited investigation of vadose zone soils in the West Clay Street area to properly assess the potential of Freon 11 contamination in this portion of Block 2. We recognize that a number of buried heating oil tanks exist now and have existed in the past on Block 2 properties. However, the Table 2 groundwater analytical data does not indicate DRO or BTEX (benzene, toluene, ethylbenzene, and xylenes) contamination of the Block 2 area’s groundwater. Potential environmental concerns associated with these tanks are likely to be soil related.
Contamination Investigation Report Block 2, Fairbanks Townsite
City of Fairbanks September 13, 2002
F:\0Jobs\2002 \188 City Blk 2 Delineation\188.1 CONTAMINANT DELINEATION\Reports\Drafts\CI Report (v3).doc
9
LIMITATIONS
NORTECH provides a level of service that is performed within the standard of care and competence found within this practice and the engineering profession. It must be recognized that limitations existed for this investigation relative to property access constraints. This contamination investigation report is based on only those locations where samples were able to be collected and the various analyses performed. We cannot attest to subsurface environmental conditions on or within the Block 2 properties that we did not have access to, nor can we preclude the presence of other contaminants not tested for.
The opinions presented in this report are made in the client’s best interest in identifying off-site and on-site (Block 2) environmental concerns. Conditions discussed herein should be considered representative of the time of our field work during which the samples were collected and analyzed. Changes in conditions at the subject area and local groundwater can occur with the passing of time, due to natural processes and/or from human activities. NORTECH has performed our contamination investigation, summarized findings, and discussed conclusions and recommendations herein in accordance with generally accepted professional environmental engineering practice.
If you have any questions or comments, please contact Dennis Filler, PE or Clark Milne, PE. We look forward to the opportunity to work with you on this project and appreciate your confidence in our firm. Sincerely,
NORTECH
Dennis M Filler, PE Clark Milne, PE Senior Engineer Senior Engineer
Attachments: Table 1: Summary of Soil Gas Analytical Results Table 2: Summary of Groundwater Analytical Results Table 3: QA/QC Summary
Figure 1: Site Location Map Figure 2: New Monitoring Wells and Soil-Gas Points Figure 3: Soil-Gas Sampling Method Schematic Figure 4: Direct-Push Monitoring Well Schematic Figure 5: Groundwater Contours CT&E and AT Laboratory Reports
APPENDIX A
TABLES
Lab sample Name 1024236001 1024236005 1024236008 1024236009 1024236010 1024236011 1024236015 1024236015 1024236016 1024236017 1024236002
Soil Gas Contaminant SG-1 2 SG-5 SG-8 SG-9 SG-10 SG-11 SG-15 Dup (SG15) SG-16 SG-17 SG-2
Tetrachloroethene (PCE)1 ND 4.4 ND ND ND 220 36,000 30,000 3,700 1,500 50
Trichloroethene (TCE)1 ND ND ND ND ND 7.2 600 550 28 46 16
cis-1,2 Dichloroethene (cDCE)1 ND ND ND ND ND ND 910 840 ND 14 NDFreon 11 (Trichlorofluoromethane) ND 4.7 6,000 12,000 320 18 570 530 1,100 24 190Freon 12 ND ND ND ND 18 ND ND ND ND ND NDMethylene chloride 4,500 ND ND ND 32 B ND ND 220 B ND 13 B NDTetrahydrofuran ND ND ND ND 24 ND ND ND ND 18 NDAcetone ND 37 ND ND 520 100 ND ND 160 100 992-Butonone (Methyl Ethyl Ketone) ND 72 ND ND 130 31 ND ND 140 150 250Ethanol ND ND ND ND 83 ND ND ND ND ND 25Benzene ND 5.7 ND ND 8.2 84 ND ND 20 53 21m,p-Xylene ND 7.5 ND 170 40 1,600 ND ND ND 41 13o-Xylene ND ND ND 75 16 850 ND ND ND 20 61,2,4-Trimethylbenzene ND ND 37 190 4.4 180 ND ND ND 18 51,3,5-Trimethylbenzene ND ND ND 68 ND 110 ND ND ND 10 NDEthylbenzene ND ND ND ND 6.6 420 ND ND ND ND ND4-Ethyltoluene ND ND ND ND ND 220 ND ND ND ND NDToluene 4,200 12 ND 59 40 1,200 ND ND ND 46 10Hexane ND ND ND ND ND 22 ND ND ND ND NDHeptane ND ND ND ND ND 22 ND ND ND ND NDTotal Volatile Organics: (from Field Screening) 1,035 1,150 650 15,200 17,000 1,872 79,600 79,600 7,895 4,665 546
Notes:Analytical Method used was EPA modified TO-14.There are no applicable State or Federal cleanup standards established for soil gas. Bold - significant concentration of concern.
ppbv - parts per billion vapor.B - denotes compound detected in laboratory blank at concentration greater than reporting limit; likely laboratory contaminant.1 Degradation: PCE -- TCE -- DCE -- VC; >80% cDCE can be of biologically derived; >80% tDCE is likely xenobiotic (solvent).2 Dilution rate increased 1000-fold due to high toluene concentration; other analytes may exist at significant concentrations in this sample but were masked during extraction.
Table 1Summary of Soil Gas Analytical Results (concentrations in ppbv)
(July 22 and 23, 2002 Sampling Event)
02188.1\data\MTC Sampling Results - July 2002 (v2) 9/5/2002
Groundwater Contaminant
Cleanup Level 2 Units
Sample PP-1 Dup 1
Sample PP-2
Sample PP-3
Sample PP-4
Sample PP-5
Sample PP-6 Dup 2
Sample MW-1
Sample MW-3
DRO 1.5 mg/L ND ND ND ND ND ND ND ND ND NDVinyl chloride (VC)1 0.002 mg/L 0.00211 0.00234 ND ND ND ND ND NA ND ND
Trichlorofluoromethane 1.3 3 mg/L 0.00140 0.00149 0.00123 ND 0.0138 ND 0.00267 NA 0.00417 ND1,1 Dichloroethene 0.007 mg/L 0.00114 0.00107 ND ND ND ND ND NA ND NDtrans-1,2 Dichloroethene (tDCE)1 0.1 mg/L 0.0953 0.0822 ND ND ND 0.00419 ND NA ND NDcis-1,2 Dichloroethene (cDCE)1 0.07 mg/L 0.910 0.815 ND ND ND 0.0121 ND NA ND NDChloroform 0.1 mg/L ND ND ND ND 0.00109 ND 0.00328 NA ND NDTrichloroethene (TCE)1 0.005 mg/L 0.0994 0.0836 ND ND ND 0.00951 ND NA ND NDTetrachloroethene (PCE)1 0.005 mg/L 0.7490 0.6000 0.0210 0.00101 ND 0.0633 0.00498 NA ND NDNotes:
Analytical methods used were SW846-8260B (VOCs) and AK 102 (DRO).VOC - volatile organic compounds; DRO - Diesel Range Organics.Dup - duplicate of preceding sample. ND - not detected above Practical Quantitation Limit.NA - not analyzed.Bold - result exceeds ADEC groundwater cleanup level.1 Degradation: PCE -- TCE -- DCE -- VC; >80% cDCE can be of biological derivation; >80% tDCE is likely xenobiotic (solvent).2 From ADEC 18 AAC 75.345, Table C, Groundwater Cleanup Levels.3 EPA risk-based concentration for tap water.
Chloroform (also Trichloromethane): commonly used as a solvent or cleaning agent.
1,1 Dichloroethene: intermediate in production of vinylidene polymer plastics; can result from dehydrochlorination of 1,1,2-trichloroethane.
Tetrachloroethene (also Tetrachloroethylene, Perk, or PCE): commonly used in dry cleaning or as degreasing solvent.
Trichloroethene (also Trichloroethylene, or TCE): commonly used in dry cleaning, degreasing, or as industrial solvent.
Trichlorofluoromethane (also Fluorocarbon, Freon 11, Frigen 11, Arcton 11): commonly used as a refrigerant or aerosol propellant.
(Monitoring wells PP-1 through PP-4 sampled July 30, 2002; PP-5, PP-6, MW-1 and MW-3 sampled August 17-18, 2002)Summary of Groundwater Analytical Results
Table 2
02188.1\data\MTC Sampling Results - July 2002 (v2) 9/20/2002
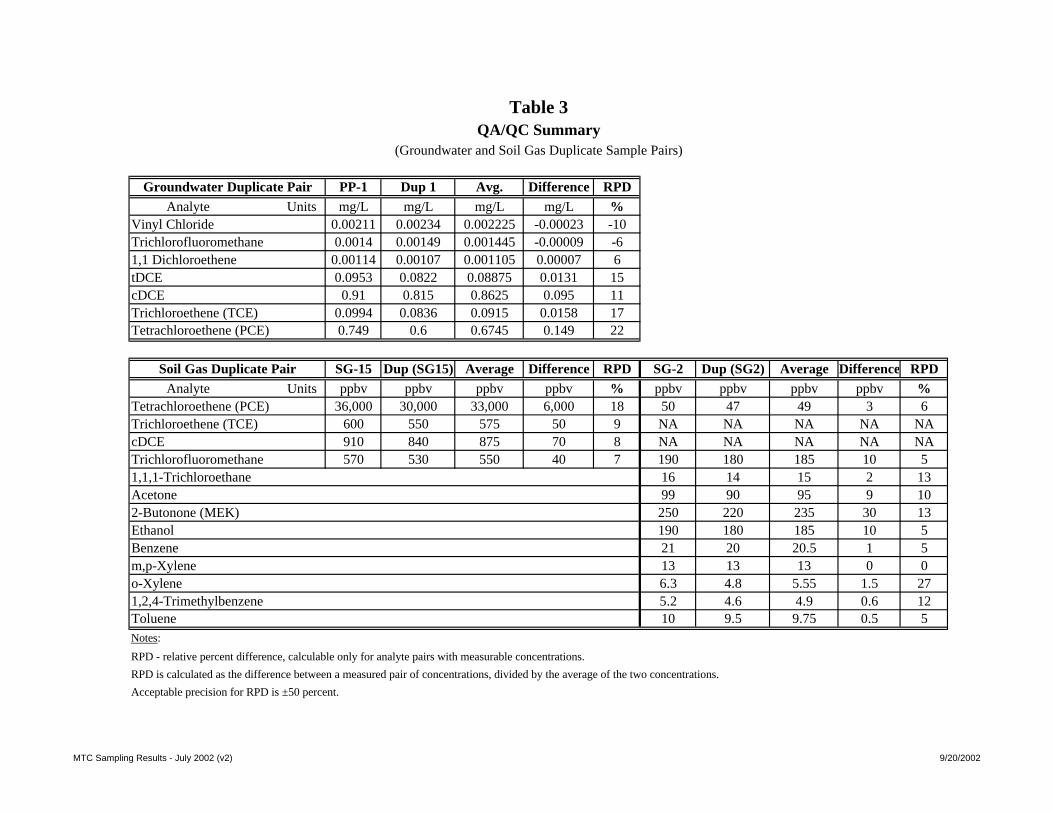
Groundwater Duplicate Pair PP-1 Dup 1 Avg. Difference RPD Analyte Units mg/L mg/L mg/L mg/L %Vinyl Chloride 0.00211 0.00234 0.002225 -0.00023 -10Trichlorofluoromethane 0.0014 0.00149 0.001445 -0.00009 -61,1 Dichloroethene 0.00114 0.00107 0.001105 0.00007 6tDCE 0.0953 0.0822 0.08875 0.0131 15cDCE 0.91 0.815 0.8625 0.095 11Trichloroethene (TCE) 0.0994 0.0836 0.0915 0.0158 17Tetrachloroethene (PCE) 0.749 0.6 0.6745 0.149 22
Soil Gas Duplicate Pair SG-15 Dup (SG15) Average Difference RPD SG-2 Dup (SG2) Average Difference RPD Analyte Units ppbv ppbv ppbv ppbv % ppbv ppbv ppbv ppbv %Tetrachloroethene (PCE) 36,000 30,000 33,000 6,000 18 50 47 49 3 6Trichloroethene (TCE) 600 550 575 50 9 NA NA NA NA NAcDCE 910 840 875 70 8 NA NA NA NA NATrichlorofluoromethane 570 530 550 40 7 190 180 185 10 51,1,1-Trichloroethane 16 14 15 2 13Acetone 99 90 95 9 102-Butonone (MEK) 250 220 235 30 13Ethanol 190 180 185 10 5Benzene 21 20 20.5 1 5m,p-Xylene 13 13 13 0 0o-Xylene 6.3 4.8 5.55 1.5 271,2,4-Trimethylbenzene 5.2 4.6 4.9 0.6 12Toluene 10 9.5 9.75 0.5 5Notes:
RPD - relative percent difference, calculable only for analyte pairs with measurable concentrations.
RPD is calculated as the difference between a measured pair of concentrations, divided by the average of the two concentrations.
Acceptable precision for RPD is ±50 percent.
Table 3QA/QC Summary
(Groundwater and Soil Gas Duplicate Sample Pairs)
MTC Sampling Results - July 2002 (v2) 9/20/2002
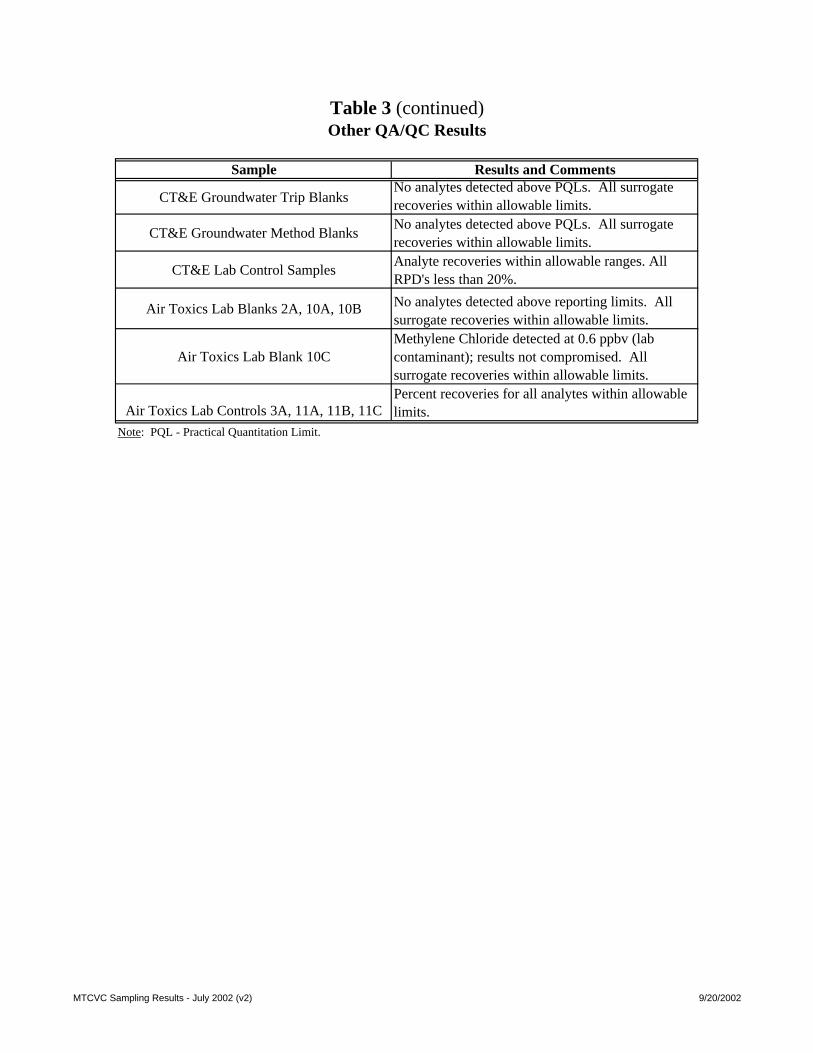
Sample
CT&E Groundwater Trip Blanks
CT&E Groundwater Method Blanks
CT&E Lab Control Samples
Air Toxics Lab Blanks 2A, 10A, 10B
Air Toxics Lab Blank 10C
Air Toxics Lab Controls 3A, 11A, 11B, 11CNote: PQL - Practical Quantitation Limit.
Percent recoveries for all analytes within allowable limits.
Results and CommentsNo analytes detected above PQLs. All surrogate recoveries within allowable limits.No analytes detected above PQLs. All surrogate recoveries within allowable limits.Analyte recoveries within allowable ranges. All RPD's less than 20%.
No analytes detected above reporting limits. All surrogate recoveries within allowable limits.
Table 3 (continued)Other QA/QC Results
Methylene Chloride detected at 0.6 ppbv (lab contaminant); results not compromised. All surrogate recoveries within allowable limits.
MTCVC Sampling Results - July 2002 (v2) 9/20/2002

MTC Sampling Results - July 2002 (v2) 9/20/2002

APPENDIX B
FIGURES