container port capacity study - savethecape.orgsavethecape.org/stcwp1/wp-content/uploads/pdfs/port...
TRANSCRIPT

The Tioga Group, Inc. 288 Rheem Blvd. Moraga, CA 94556 Phone 925.631.0742 Fax 925.631.7936
CONTAINER PORT CAPACITY STUDY
The Tioga Group, Inc.
Prepared for:
CDM/IWR
December 2, 2010

Page i
Tioga
Contents
I. SUMMARY 1
II. BACKGROUND AND APPROACH 8
III. NORTH ATLANTIC PORTS 24
IV. SOUTH ATLANTIC PORTS 65
V. GULF PORTS 104
VI. APPENDIX: SECONDARY CONTAINER PORTS 125

Page ii
Tioga
Exhibits
Exhibit 1: Major Ports Analyzed .................................................................................................................... 1
Exhibit 2: 2008 Port Utilization Summary ...................................................................................................... 2
Exhibit 3: Reserve Container Port Capacity by Coast .................................................................................. 3
Exhibit 4: Terminal Space and CY Utilization ............................................................................................... 3
Exhibit 5: 2008 TEU and CY TEU Capacity .................................................................................................. 4
Exhibit 6: Average TEU Slots per CY Acre ................................................................................................... 5
Exhibit 7: Container Cranes and Utilization .................................................................................................. 5
Exhibit 8: Berth and Vessel Capacity and Utilization .................................................................................... 6
Exhibit 9: Major Ports Analyzed .................................................................................................................. 10
Exhibit 10: Five "Dimensions" of Container Terminal Capacity .................................................................. 11
Exhibit 11: Container Vessel DWT vs. TEU Capacity ................................................................................. 13
Exhibit 12: Reported vs. Estimated Container Vessel TEU ........................................................................ 14
Exhibit 13: DWT vs. Draft ............................................................................................................................ 14
Exhibit 14: USACE Guidance on Cargo Capacity as a Percentage of DWT .............................................. 15
Exhibit 15: Maximum vs. Average Vessel Capacity - TEU ......................................................................... 15
Exhibit 16: Vessel Size and Load Comparison ........................................................................................... 16
Exhibit 17: Berth Capacity - Maximum Vessel Basis Example ................................................................... 17
Exhibit 18: Berth Capacity Estimate- Vessel Call Basis Example .............................................................. 17
Exhibit 19: Container Yard Handling Equipment Types .............................................................................. 18
Exhibit 20: Progression of Terminal Handling Methods .............................................................................. 18
Exhibit 21: Wheeled Containers on RTG Layout ........................................................................................ 19
Exhibit 22: Typical CY Storage Densities ................................................................................................... 20
Exhibit 23: CY Acreage Example: Port of New Orleans ............................................................................. 20
Exhibit 24: CY Capacity Example: Port of New Orleans ............................................................................. 21
Exhibit 25: Typical Two-Berth/Four-Crane Terminal ................................................................................... 23
Exhibit 26: Container Cranes and Utilization .............................................................................................. 23
Exhibit 27: North Atlantic Capacity and Utilization Summary ..................................................................... 24
Exhibit 28: North Atlantic Drafts and Vessel Data ...................................................................................... 25
Exhibit 29: Port of Boston Conley Container Terminal ............................................................................... 25
Exhibit 30: Conley Container Terminal Profile ............................................................................................ 26
Exhibit 31: Conley Terminal Land Use ........................................................................................................ 27

Page iii
Tioga
Exhibit 32: Conley Terminal Near Term CY Capacity ................................................................................. 27
Exhibit 33: Conley Terminal Near Term Crane Capacity ............................................................................ 28
Exhibit 34: Boston Near Term Berth Capacity Maximum Vessel Basis ...................................................... 29
Exhibit 35: Conley 2007 Berth Capacity Vessel Call Basis ........................................................................ 29
Exhibit 36: Conley Terminal Near Term Capacity and Productivity Summary ........................................... 30
Exhibit 37: Port of New York and New Jersey ............................................................................................ 31
Exhibit 38: Red Hook Marine Terminal ....................................................................................................... 32
Exhibit 39: Global Marine Terminal ............................................................................................................. 33
Exhibit 40: Port Newark Container Terminal (PNCT) ................................................................................. 34
Exhibit 41: Maher Terminal ......................................................................................................................... 35
Exhibit 42: APM Elizabeth Marine Terminal ................................................................................................ 36
Exhibit 43: New York Container Terminal ................................................................................................... 37
Exhibit 44: Port of New York and New Jersey Land Use ............................................................................ 38
Exhibit 45: Port of New York and New Jersey Near Term CY Storage Capacity ....................................... 38
Exhibit 46: Port of New York and New Jersey Near-term Crane Capacity ................................................. 39
Exhibit 47: Port of New York and New Jersey Near Term Berth Capacity Maximum Vessel Basis ........... 39
Exhibit 48: Port of New York and New Jersey Berth Capacity Vessel Call Basis ...................................... 40
Exhibit 49: Port of New York and New Jersey Near Term Capacity and Productivity Summary ............... 41
Exhibit 50: Packer Marine Terminal ............................................................................................................ 42
Exhibit 51: Packer Marine Terminal, Philadelphia ...................................................................................... 43
Exhibit 52 Wilmington Marine Terminal ...................................................................................................... 44
Exhibit 53: Wilmington Marine Terminal, Wilmington, DE .......................................................................... 45
Exhibit 54: Delaware River Ports Land Use ................................................................................................ 45
Exhibit 55: Delaware River Ports Near Term CY Storage Capacity ........................................................... 46
Exhibit 56: Delaware River Ports Near-term Crane Capacity ..................................................................... 46
Exhibit 57: Delaware River Ports Near Term Berth Capacity Maximum Vessel Basis ............................... 47
Exhibit 58: Delaware River Ports Berth Capacity Vessel Call Basis........................................................... 47
Exhibit 59: Delaware River Ports Near Term Capacity and Productivity Summary .................................... 48
Exhibit 60: Port of Baltimore........................................................................................................................ 49
Exhibit 61: Dundalk Marine Terminal .......................................................................................................... 50
Exhibit 62: Seagirt Marine Terminal ............................................................................................................ 51
Exhibit 63: Port of Baltimore Land Use ....................................................................................................... 52

Page iv
Tioga
Exhibit 64: Port of Baltimore Near Term CY Storage Capacity .................................................................. 52
Exhibit 65: Port of Baltimore Near-term Crane Capacity ............................................................................ 53
Exhibit 66: Port of Baltimore Near Term Berth Capacity Maximum Vessel Basis ...................................... 54
Exhibit 67: Port of Baltimore Berth Capacity Vessel Call Basis .................................................................. 54
Exhibit 68: Port of Baltimore Near Term Capacity and Productivity Summary ........................................... 55
Exhibit 69: Port of Hampton Roads ............................................................................................................. 56
Exhibit 70: Norfolk International Terminal ................................................................................................... 57
Exhibit 71: Portsmouth Marine Terminal ..................................................................................................... 58
Exhibit 72: Newport News Marine Terminal (NNMT) .................................................................................. 59
Exhibit 73: APM Terminals Virginia ............................................................................................................. 60
Exhibit 74: Port of Virginia Land Use .......................................................................................................... 61
Exhibit 75: Port of Virginia Near Term CY Storage Capacity ...................................................................... 61
Exhibit 76: Port of Virginia Near-term Crane Capacity ............................................................................... 62
Exhibit 77: Port of Virginia Near Term Berth Capacity Maximum Vessel Basis ......................................... 62
Exhibit 78: Port of Virginia Berth Capacity Vessel Call Basis ..................................................................... 63
Exhibit 79: Port of Hampton Roads Near Term Capacity and Productivity Summary ................................ 64
Exhibit 80: South Atlantic Capacity and Utilization Summary ..................................................................... 65
Exhibit 81: South Atlantic Drafts and Vessels ............................................................................................. 66
Exhibit 82: Port of Charleston ..................................................................................................................... 67
Exhibit 83: Wando Welch Terminal ............................................................................................................. 68
Exhibit 84: North Charleston Terminal Profile ............................................................................................. 69
Exhibit 85: North Charleston Terminal Drawing .......................................................................................... 70
Exhibit 86: Columbus Street Terminal ........................................................................................................ 70
Exhibit 87: Columbus Street Terminal Profile ............................................................................................. 71
Exhibit 88: Port of Charleston Land Use ..................................................................................................... 71
Exhibit 89: Port of Charleston Near Term CY Storage Capacity ................................................................ 72
Exhibit 90: Port of Charleston Near Term Crane Capacity ......................................................................... 72
Exhibit 91: Port of Charleston Near Term Berth Capacity Maximum Vessel Basis .................................... 73
Exhibit 92: Charleston 2007 Berth Capacity Vessel Call Basis .................................................................. 73
Exhibit 93: Port of Charleston Near Term Capacity and Productivity Summary ......................................... 75
Exhibit 94: Garden City Container Terminal ............................................................................................... 76
Exhibit 95: Garden City Terminal Profile ..................................................................................................... 77
Page v
Tioga
Exhibit 96: Garden City Land Use ............................................................................................................... 78
Exhibit 97: Garden City Near Term CY Storage Capacity .......................................................................... 78
Exhibit 98: Garden City Terminal Near Term Crane Capacity .................................................................... 79
Exhibit 99: Garden City Terminal Near Term Berth Capacity Max Vessel Basis ....................................... 79
Exhibit 100: Garden City 2007 Berth Capacity Vessel Call Basis .............................................................. 80
Exhibit 101: Garden City Near Term Capacity Summary ........................................................................... 81
Exhibit 102: Port of Jacksonville Marine Terminals .................................................................................... 82
Exhibit 103: Blount Island Terminal Profile ................................................................................................. 83
Exhibit 104: Talleyrand Marine Terminal .................................................................................................... 84
Exhibit 105: Dames Point Container Terminal ............................................................................................ 85
Exhibit 106: Port of Jacksonville Land Use ................................................................................................. 86
Exhibit 107: Port of Jacksonville CY Storage Capacity .............................................................................. 86
Exhibit 108: Port of Jacksonville Near Term Crane Capacity ..................................................................... 87
Exhibit 109: Port of Jacksonville Near Term Berth Capacity Max Vessel Basis ......................................... 88
Exhibit 110: Port of Jacksonville 2009 Berth Capacity Vessel Call Basis .................................................. 88
Exhibit 111: Port of Jacksonville Near Term Capacity and Productivity Summary..................................... 89
Exhibit 112: Port Everglades Container Terminals ..................................................................................... 90
Exhibit 113: Port Everglades Container Terminal Profile ............................................................................ 91
Exhibit 114: Midport Terminal Area ............................................................................................................. 92
Exhibit 115: Port Everglades Land Use ...................................................................................................... 92
Exhibit 116: Port Everglades Near Term CY Capacity ............................................................................... 93
Exhibit 117: Port Everglades Near Term Crane Capacity .......................................................................... 93
Exhibit 118: Port Everglades Near Term Berth Capacity Maximum Vessel Basis ..................................... 94
Exhibit 119: Port Everglades 2007 Berth Capacity Vessel Call Basis ........................................................ 94
Exhibit 120: Port Everglades Near Term Capacity and Productivity Summary .......................................... 95
Exhibit 121: Port of Miami Container Terminals.......................................................................................... 96
Exhibit 122: Miami Tunnel Project .............................................................................................................. 96
Exhibit 123: South Florida Container Terminal Profile ................................................................................ 97
Exhibit 124: Port of Miami Terminal Operating Company Terminal (POMTOC) ........................................ 98
Exhibit 125: Seaboard Marine Terminal ...................................................................................................... 99
Exhibit 126: Port of Miami Land Use ......................................................................................................... 100
Exhibit 127: Port of Miami CY Storage Capacity ...................................................................................... 100
Page vi
Tioga
Exhibit 128: Port of Miami Near Term Crane Capacity ............................................................................. 101
Exhibit 129: Port of Miami Near Term Berth Capacity Maximum Vessel Basis ........................................ 101
Exhibit 130: Port of Miami 2007 Berth Capacity Vessel Call Basis .......................................................... 102
Exhibit 131: Port of Miami Near Term Capacity and Productivity Summary ............................................ 103
Exhibit 132: Gulf Coast Capacity and Utilization Summary ...................................................................... 105
Exhibit 133: Gulf Coast Draft and Vessel Data ......................................................................................... 106
Exhibit 134: Mobile Container Terminal (MCT) ......................................................................................... 106
Exhibit 135: Mobile Pier Two - Container and General Cargo Terminal ................................................... 107
Exhibit 136: Mobile Container Terminal Profile ......................................................................................... 107
Exhibit 137: Pier Two Terminal Profile ...................................................................................................... 108
Exhibit 138: Port of Mobile Land Use ........................................................................................................ 109
Exhibit 139: Port of Mobile Near Term CY Storage Capacity ................................................................... 109
Exhibit 140: Port of Mobile Near Term Crane Capacity ............................................................................ 110
Exhibit 141: Port of Mobile Near Term Berth Capacity Maximum Vessel Basis ....................................... 111
Exhibit 142: Port of Mobile Berth Capacity Vessel Call Basis .................................................................. 111
Exhibit 143: Port of Mobile Near Term Capacity and Productivity Summary ........................................... 112
Exhibit 144: Port of New Orleans Napoleon Avenue Terminal ................................................................. 113
Exhibit 145: Napoleon Avenue Terminal Profile ....................................................................................... 114
Exhibit 146: Port of New Orleans Land Use ............................................................................................. 114
Exhibit 147: Port of New Orleans Near Term Storage Capacity ............................................................... 115
Exhibit 148: Port of New Orleans Near Term Crane Capacity .................................................................. 115
Exhibit 149: Port of New Orleans Near Term Berth Capacity Maximum Vessel Basis ............................ 116
Exhibit 150: Port of New Orleans 2007 Berth Capacity Vessel Call Basis ............................................... 116
Exhibit 151: Port of New Orleans Near Term Capacity and Productivity Summary ................................. 117
Exhibit 152: Port of Houston Terminals .................................................................................................... 118
Exhibit 153: Barbours Cut Terminal .......................................................................................................... 119
Exhibit 154: Bayport Terminal ................................................................................................................... 120
Exhibit 155: Port of Houston Land Use ..................................................................................................... 121
Exhibit 156: Port of Houston Near Term CY Storage Capacity ................................................................ 121
Exhibit 157: Port of Houston Near Term Crane Capacity ......................................................................... 122
Exhibit 158: Port of Houston Near Term Berth Capacity Maximum Vessel Basis .................................... 122
Exhibit 159: Port of Houston 2007 Berth Capacity Vessel Call Basis....................................................... 123
Page vii
Tioga
Exhibit 160: Port of Houston Near Term Capacity and Productivity Summary ......................................... 124
Exhibit 161: Wilmington, NC ..................................................................................................................... 125
Exhibit 162: Port of Palm Beach - Riviera Beach Terminal ...................................................................... 126
Exhibit 163: Port of Tampa........................................................................................................................ 127
Exhibit 164: Port of Gulfport ...................................................................................................................... 128
Exhibit 165: Freeport, TX .......................................................................................................................... 129
Exhibit 166: Additional Texas Ports .......................................................................................................... 130

Page 1
Tioga
I. Summary
U.S. container port capacity is the single most critical factor in the nation’s ability to participate
in containerized trade. Within this port network the Corps of Engineers’ primary focus is on
navigation improvements – developing and maintaining the channels, berths, and other aids that
give container ships access to port terminals. The facilities, equipment, systems, and manpower
needed for container terminals are all costly. There is an inherent tension between having
enough capacity for trade peaks and expected growth and creating excess capacity that ties up
valuable resources.
This study was initiated to obtain a broad overview of East Coast and Gulf Coast container port
capacity as an input to the Corps’ planning and as a supplement to the many documents and
studies produced in the course of project feasibility studies. The study team attempted to address
the following questions.
What are the near-term and long-term capacities of the major East Coast and Gulf
Coast container ports?
What factors constrain the capacities of those ports?
How well is capacity currently utilized?
How well are the major ports prepared to handle larger vessels?
How do the smaller container ports or terminals fit into the picture?
There is a particular concern over capacity at East Coast (North Atlantic and South Atlantic) and
Gulf Coast ports. Before the recession, emergence of multi-coast import strategies shifted
market share and volume from the West Coast to the East and Gulf Coasts. The planned opening
of the new, higher-capacity Panama Canal locks in 2014 will permit carriers to deploy larger,
more economical vessels in Asia-East Coast and Asia-Gulf services.
The study team analyzed the following major container ports (Exhibit 9).
Exhibit 1: Major Ports Analyzed
North Atlantic South Atlantic Gulf
Boston Charleston Mobile
New York/New Jersey Savannah New Orleans
Philadelphia Jacksonville Houston
Wilmington Port Everglades
Baltimore Miami
Virginia
Exhibit 2 display five measures of estimated 2008 utilization for these major North Atlantic,
South Atlantic, and Gulf ports, and for the East Coast and Gulf total. With the exception of high
estimated berth utilization at some South Atlantic ports, the data in Exhibit 1 indicate substantial
reserve capacity. North Atlantic ports, notable the Port Authority of New York and New Jersey

Page 2
Tioga
(PANYNJ) are relatively tight on container yard (CY) capacity. Gulf ports have higher vessel
utilization (e.g. are discharging and loading a higher percentage of vessel capacity), largely due
to draft restrictions at Houston that hold down maximum vessel size.
Exhibit 2: 2008 Port Utilization Summary
55%
34%
46%
42%
30%
37%
34% 33%
42%39%
57%
42%
39%
54%
42%
49%
42%
83%
44%
53%
0%
10%
20%
30%
40%
50%
60%
70%
80%
90%
N. Atlantic Ports* S. Atlantic Ports Gulf Ports East & Gulf Coast Ports
CY Utilization
Crane Utilization
Avg. Vessel Ute. - % Discharge/Load
Berth Utilization - Vessel Call Basis
Berth Utilization - Avg. Vessel Basis
Utilization estimates for the combined East Coast and Gulf ports are near or below 50%. On
average, these ports are using:
42% of their CY storage capacity given existing land uses;
33% of the two-shift capacity of their container cranes;
49% of the berth capacity for vessel calls;
42% of the vessel capacity for cargo discharge and load; and
53% of the berth TEU throughput capability using the maximum vessel sizes.
Many ports have annual volume peaks that can strain capacity for a short period. The figures in
Exhibit 2 and throughput the report are based on an annual capability of 80% of the theoretical
maximum to allow for peaking and sustainable service quality.
Volume figures used throughout this report are compared to 2008 volumes reported to the
American Association of Port Authorities (AAPA). As has been widely reported, 2009 cargo
volumes were down 10%-30% from 2008, so using 2009 volumes would artificially inflate
estimates of reserve capacity. It is also likely, however, that the major container ports will have
somewhat more reserve capacity than was estimated herein until the trade recovers.

Page 3
Tioga
Exhibit 3 summarizes the implied reserve container port capacity by coast and for the East and
Gulf port total. Generally speaking, the system as a whole could handle roughly double the 2008
volume before hitting CY or berth capacity constraints. That result would obtain, however, only
if the increased trade were distributed according to the available capacity – an unlikely outcome.
It is far more likely that some ports and terminals would see a disproportionate share of the cargo
growth and hit capacity constraints while other ports and terminals remained underutilized.
Exhibit 3: Reserve Container Port Capacity by Coast
MetricN. Atlantic
Ports*
S. Atlantic
PortsGulf Ports
East & Gulf Coast
Ports
2008 TEU 8,744,838 6,676,245 2,229,877 17,650,961
Reserve CY Capacity - TEU 10,612,402 13,869,035 2,669,003 25,491,439
Reserve Crane Capacity - TEU 20,895,164 12,501,742 4,423,466 37,820,372
Reserve Berth Capacity - Vessel Calls 8884 4189 1555 12024
Reserve Berth Capacity - Avg. Vessel Basis 11,832,051 1,922,907 2,799,609 16,554,568
Reserve Berth Capacity - Max. Vessel Basis 29,332,298 3,193,986 2,554,332 35,080,616
Exhibit 4 provides key measures of terminal space and CY utilization. The North and South
Atlantic ports taken together are about 10 times the size of the Gulf ports and have about 90% of
the CY capacity. In 2008 these ports averaged about 2,307 TEU per gross acre. This sort of
relatively low density is often compared to much higher throughput per acre achieved in Asia
and Europe. Asian and European terminals, however, typically devote almost all their terminal
space to CY functions and rarely have on-dock rail, chassis storage, warehousing, or other
functions in the terminal acreage. As Exhibit 4 shows, however, East and Gulf Coast terminals
devote an average of only 48% of the gross acres to CY functions. The average throughput for
actual CY space was 4,842 TEU per acre, a more accurate basis of comparison.
Exhibit 4: Terminal Space and CY Utilization
MetricN. Atlantic
Ports*
S. Atlantic
PortsGulf Ports
East & Gulf Coast
Ports
2008 TEU 8,744,838 6,676,245 2,229,877 17,650,961
Gross Acres 3,227 3,839 717 7,783
CY Acres 1,542 1,715 442 3698.5
CY/Gross Ratio 48% 45% 62% 48%
Annual CY Capacity - TEU 17,698,240 20,545,280 4,898,880 43,142,400
Reserve CY Capacity - TEU 10,612,402 13,869,035 2,669,003 25,491,439
Annual TEU/Gross Acre 2,918 1,739 3,109 2,268
Annual TEU/CY Acre 5,973 3,893 5,045 4,772
Est. CY TEU Slots 267,620 366,880 84,360 718,860
Avg. CY Slots/ Acre - Density 174 214 191 194
Avg. Annual TEU/CY Slot (Turns) 36 18 26 25
CY Utilization 55% 32% 46% 41%
Exhibit 5 compares 2008 TEU and estimated CY TEU capacity. Reserve capacity is greatest at
NYNJ, Charleston, and Savannah. This chart, however, does not take into account current and
announced terminal expansion projects in Mobile, Houston, and elsewhere. terms of shear size
PANYNJ, Charleston, Savannah, and Jacksonville are the largest ports. The Delaware River
Ports include Philadelphia and Wilmington, DE. The Port of Virginia includes Norfolk, Newport

Page 4
Tioga
News, and Portsmouth terminals. The APM Portsmouth terminal is new and not part of the Port
of Virginia and is therefore shown separately.
Exhibit 5: 2008 TEU and CY TEU Capacity
0
5,000,000
10,000,000
15,000,000
20,000,000
25,000,000
30,000,000
35,000,000
40,000,000
45,000,000
Bost
on
NYNJ
Del
awar
e Riv
er
Bal
timore
VPA
APM
Port
smouth
N. A
tlantic
Port
s*
Char
lest
on
Savan
nah
Jack
sonvi
lle
Port E
verg
lades
Mia
mi
S. Atla
ntic P
orts
Mobile
New
Orlea
ns
Houst
on
Gulf
Ports
East &
Gulf
Coas
t Port
s
Reserve CY Capacity - TEU
2008 TEU
Exhibit 6 compares CY storage densities. Those terminals with the largest shares of land set up
for RTG operations, such as Boston, Baltimore, Charleston, and Savannah show the highest slot
densities, although not all those slots are regularly occupied. The highest density is at the APM
Portsmouth terminal, which is the only U.S. terminal using RMGs. The available TEU “slots”
were estimated by applying rule-of-thumb storage densities to the acreage used for wheeled,
stacked, straddle carrier, RTG, or RMG handling. Annual throughput capacity is therefore a
function of TEU slots and annual turnover per slot. The ports analyzed averaged 194 TEU slots
per acre against a rough maximum of 300 for all-RTG storage. As the data suggest, almost all
the terminals examined use a mix of storage types and densities. The East and Gulf Coast ports
averaged an estimated 25 annual turns per slot against a benchmark maximum of 70. Annual
turns per slot are noticeably higher in the North Atlantic (largely due to PANYNJ and the Ports
of Virginia).

Page 5
Tioga
Exhibit 6: Average TEU Slots per CY Acre
243
160
125
206
124
306
174
260 261
153 155166
214
176
158
205191 194
-
50
100
150
200
250
300
350
Bost
on
NYNJ
Del
awar
e Riv
er
Bal
timore
VPA
APM
Port
smouth
N. A
tlantic
Port
s*
Char
lest
on
Sav
annah
Jack
sonvi
lle
Port
Eve
rgla
des
Mia
mi
S. A
tlantic
Port
s
Mobile
New
Orlea
ns
Houst
on
Gulf
Port
s
Eas
t & G
ulf Coas
t Port
s
As Exhibit 7 shows, crane utilization in terms of annual TEU is relatively low, averaging 33%
This relatively low utilization might imply an excess of crane capacity. Yet the primary purpose
of crane capacity is to turn vessels quickly. Whether there is one vessel per week or five, each
vessel will need two or more cranes. Not coincidently, the terminals surveyed averaged two
cranes per berth. Crane utilization is therefore co-determined with berth and vessel utilization.
Exhibit 7: Container Cranes and Utilization
Container CranesN. Atlantic
Ports*
S. Atlantic
PortsGulf Ports
East & Gulf Coast
Ports
Cranes 120 77 27 224
Cranes per Berth 2.1 1.8 2.1 2.0
Annual Crane Capacity - TEU 29,640,002 19,177,987 6,653,344 55,471,333
Reserve Crane Capacity - TEU 20,895,164 12,501,742 4,423,466 37,820,372
Annual TEU/Crane 76,709 86,704 82,588 78,799
Annual Moves/Crane 43,140 48,739 47,017 45,532
Crane Utilization 30% 35% 34% 32%
Berth and vessel utilization, shown in Exhibit 8, are tightly linked. In 2007, the ports and
terminals averaged 103 annual vessel calls per berth – roughly two per week. The average was
higher in the South Atlantic. Against a benchmark maximum of 260 calls per year (one each
week day) and a rule-of-thumb sustainable maximum of 208 (80%), the average of 103 calls
implies 49% utilization. In practical terms, berths that are handling two vessels per week could
probably handle four. This conclusion, however, depends on vessel size and the total cargo
discharged and loaded. The vessels calling at these ports in 2007 had an average capacity of
3,710 TEU (estimated from DWT data). The average discharge and load was 9,553 TEU, or
42% of vessel capacity. The theoretical maximum is actually 200% of capacity – 100%
CY Storage TEU Slots per Acre
Wheeled Chassis 80
Grounded Straddle Carrier 160
Grounded Stacked 200
Grounded RTG 300
Grounded RMG 360

Page 6
Tioga
discharged and 100% loaded. That only 49% of the capacity is discharged and loaded implies
that the vessels themselves are not sailing full or that the capacity is shared between multiple port
calls, or most likely, both.
Exhibit 8: Berth and Vessel Capacity and Utilization
Berths and VesselsN. Atlantic
Ports*
S. Atlantic
PortsGulf Ports
East & Gulf Coast
Ports
Berths 57 44 13 114
Berth Feet 58,200 38,608 12,900 109,708
Annual Vessel Calls (2007) 5,576 4,963 1,149 11,688
Annual Vessel Calls per Berth (2007) 80 113 88 103
Berth Utilization - Vessel Call Basis 39% 54% 42% 49%
Reserve Berth Capacity - Vessel Calls 8884 4189 1555 12024
Annual TEU per Berth 164,997 151,733 171,529 154,833
Annual TEU/Foot of Berth 159 173 173 161
Average Vessel Capacity - TEU 3,762 3,727 3,387 3,710
Average TEU per Vessel (2007) 1,568 1,345 1,941 1,510
Avg. Vessel Ute. - % Discharge/Load 42% 36% 57% 41%
Berth Capacity - Avg. Vessel Basis 20,576,889 8,599,152 5,029,487 34,205,528
Berth Utilization - Avg. Vessel Basis 42% 78% 44% 52%
Reserve Berth Capacity - Avg. Vessel Basis 11,832,051 1,922,907 2,799,609 16,554,568
Reserve Berth Capacity - Max. Vessel Basis 29,332,298 3,193,986 2,554,332 35,080,616
The average vessel capacities shown in Exhibit 8 are low compared to the maximum vessel sizes
that ports say that they can accommodate with the available draft. Ports typically receive few if
any calls from the maximum size vessels, so most calls are made by a mix of smaller container
ships.
Throughput could be increased by using larger vessels for the same number of calls, making
more calls with the same vessels, discharging and loading more of the vessel capacity at each
call, or any combination of these changes. In each case more container cranes and/or crane time
would be required to handle the increased cargo while keeping the vessel on schedule. The crane
capacity estimates are based on availability for two shifts per day, 250 days per year (4,000
annual hours). The cranes are, in fact, available 24 hours per day if the terminal operator needs
the additional shifts to turn the vessel on schedule and is willing to pay for overtime.
The study team also briefly reviewed the capabilities of the secondary East Coast and Gulf Ports,
detailed in the Appendix.
Wilmington, NC
Palm Beach, FL
Tampa, FL
Gulfport, MS
Freeport, TX
Beaumont, TX
Port Arthur, TX
Texas City, TX
Galveston, TX
Corpus Christi, TX.
Generally speaking, the secondary ports supplement the capacity of the major ports and handle
trades and cargoes that do not fit in well with the large, dedicated container terminals. These

Page 7
Tioga
ports handle a mix of containerized, bulk, and break-bulk shipments, so their container capacities
are difficult to determine with precision. This mix of capabilities, does however, provide
flexibility, particularly for project cargoes and other limited-duration needs. While these ports
handle relatively small volumes of containers, several have specific importance to the imported
fruit trade (e.g. bananas) and other niche markets. Some, such as Wilmington and Beaumont, are
part of larger complexes that include major military shipping points. Tampa, Gulfport, Freeport,
and Corpus Christi have expansion plans in various stages of progress.
Overall, the North Atlantic, South Atlantic, and Gulf ports have substantial inherent capacity for
near-term growth. That growth can be achieved through more intensive use of existing
terminals, cranes, and berths. The existence of aggregate reserve capacity does not preclude slot
shortages at ports and terminals that receive more than their share of growth.
Page 8
Tioga
II. Background and Approach
Background
The capacity of U.S. container ports is the single most critical factor in the nation’s ability to
participate in containerized trade. Beginning in the 1950s and accelerating in the decades that
followed, containerization transformed both international merchandise trade and the ports that
serve it. Efficient handling of containerized trade requires far more than just dockside space and
labor – it requires sophisticated facilities, equipment, and systems manned by trained operators.
The facilities, equipment, systems, and manpower needed for container terminals are all costly.
There is an inherent tension between having enough capacity for trade peaks and expected
growth and creating excess capacity that ties up valuable resources.
Within this port network the Corps of Engineers’ primary focus is on navigation improvements –
developing and maintaining the channels, berths, and other aids that give container ships access
to port terminals. That responsibility is also a balancing act. Dredging and related activities are
costly and time consuming, and have serious environmental implications. Moreover, in an era of
limited resources, the Corps cannot meet every port’s desire for unlimited vessel access. There
is little benefit to providing deeper channels if terminals do not have capacity to match, or to
expanding terminals if channels become a bottleneck.
There are few, if any, concerns over container port capacity for the immediate future. The global
recession has drastically eroded containerized trade, with most ports seeing 2009 volumes 10-30
percent below the 2006-2007 peaks. Trade began to recover its momentum in early 2010 as this
report was being prepared, but it will likely take 5-7 years to regain 2006-2007 volumes.
At those 2006-2007 peaks, however, there were legitimate concerns over the capacity of U.S.
container ports to accommodate foreseeable long-term growth. The San Pedro Bay ports were
severely congested during the 2004 peak shipping season. Spot capacity shortages have
developed from time to time at many ports (and have persisted in some cases despite the
recession). Given the high cost and long lead times required to expand container terminal
capacity, it is reasonable to ask whether the capacity will be available when it is eventually
needed.
There is a particular concern over capacity at East Coast (North Atlantic and South Atlantic) and
Gulf Coast ports. Before the recession, growth and maturation of supply chains had led major
importers to diversity their routings away from the past concentration in Southern California.
The emergence of multi-coast import strategies shifted market share and volume from the West
Coast to the East and Gulf Coasts. Concern over potential congestion and cost increases in
Southern California added impetus to this trend. Some East Coast ports have also been very
successful in attracting new distribution centers to their region, in sync with the diversification of
import supply chains.

Page 9
Tioga
The planned opening of the new, higher-capacity Panama Canal locks in 2014 will permit
carriers to deploy larger, more economical vessels in Asia-East Coast and Asia-Gulf services.
The increase in vessel sizes is likely to be gradual for several reasons.
While the new locks will accommodate vessels of 12,000-13,000 TEU, such
vessels are presently dedicated to the Asia-Europe trade. The vessel fleet required
to provide 12,000+ TEU capacity in trans-Panama service does not yet exist.
Given the drastic decline in container vessel orders, it is unlikely that such a fleet
will exist in 2014. Carriers are more likely to use smaller vessels presently laid
up.
The recession has led to a fall-off in trans-Panama trades and a withdrawal of
some all-water services. The volume needed to support a tripling of pre-recession
capacity (from 4,000 TEU vessels to 12,000 TEU vessels) is unlikely to emerge
by 2014.
Consolidation of services through vessel-sharing agreements may achieve some
economies of scale, but is unlikely to fill 12,000 TEU vessels at the same service
frequency as the 3,000-4,000 TEU vessels now deployed.
While a more gradual increase in the size of trans-Panama container vessels will likely give the
ports and the Corps more time to respond, the response will still be necessary. Moreover, the
East Coast and Gulf ports also serve the trans-Atlantic and round-the-world (RTW) trades in
which vessel sizes are also increasing.
This study was initiated to obtain a broad overview of East Coast and Gulf Coast container port
capacity as an input to the Corps’ planning and as a supplement to the many documents and
studies produced in the course of project feasibility studies. The study team attempted to address
the following questions.
What are the near-term and long-term capacities of the major East Coast and Gulf
Coast container ports?
What factors constrain the capacities of those ports?
How well is capacity currently utilized?
How well are the major ports prepared to handle larger vessels?
How do the smaller container ports or terminals fit into the picture?
This report does not address the capacity of highways, railroads, and intermodal connector to
move containers to and from the ports. Trade growth through 2006-2007 was creating concern
among local, regional, and state transportation officials regarding impacts on road and rail
infrastructure. The recession has provided a multi-year reprieve, but the issue will eventually
return.
This report likewise does not address the supply of drayage trucks and drivers needed to pick up
and deliver more containers. The drayage tractor supply can be increased as required, although

Page 10
Tioga
meeting stringent emissions requirements will add to the cost. The supply of drivers may be
more problematical. Until the recession, motor carriers nationwide were experiencing a
persistent driver shortage. Some Southern California drayage firms were offering signing
bonuses for new drivers. TWIC requirements have further reduced the pool of drivers eligible
for port drayage. As trade recovers, there could be a shortage of drayage drivers.
Finally, this study does not address the need for trained personnel to operate expanded terminals.
Labor supply cannot be taken for granted. A major contributor to the 2004 peak season
congestion in Southern California was a Longshore labor shortage. The pool of Longshore labor
has since expanded, but has shrunk somewhat as longshoremen idled by the recession have
moved to other jobs.
Overall Approach
The study team analyzed the following major container ports (Exhibit 9).
Exhibit 9: Major Ports Analyzed
North Atlantic South Atlantic Gulf
Boston Charleston Mobile
New York/New Jersey Savannah New Orleans
Philadelphia Jacksonville Houston
Wilmington Port Everglades
Baltimore Miami
Virginia
No two container terminals are exactly alike, despite having a great deal in common. Port
planners and terminal operators have preferences for different operating types and
configurations, and those preferences change over time. Moreover, each terminal design must be
adapted to its site.
These differences are particularly apparent in the definition and configuration of the container
yard (CY). There are frequently disparities between what they port lists as CY acreage and what
the consultant team identified as working CY acreage from aerial photos. Depending on local
practice, land used for chassis storage, land used for equipment maintenance, or land not
presently used at all may or may not be included as CY acreage. The study team focused on land
being used for container storage, so the figures in this report tend to be conservative.
There are several possible ways to estimate container port capacity. All rely heavily on industry
rules of thumb and a variety of assumptions as well as quantifiable engineering relationships.
The general approach used in this study was chosen primarily to suit the readily available port
and terminal data elements. More precise estimates are possible, but would require a much
greater investment in data collection and analysis and would change frequently as ports and
terminals change their facilities and operations.
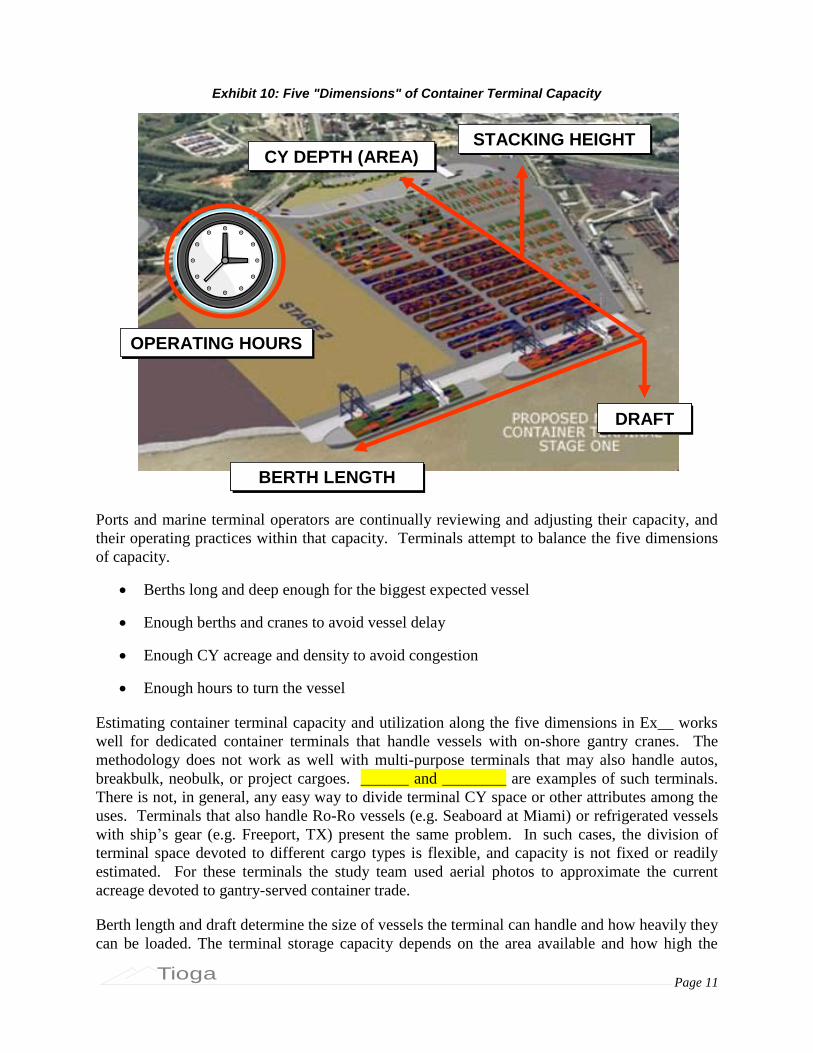
Marine container terminal capacity has five long-term constraints or dimensions, as illustrated in
Exhibit 10.
Page 11
Tioga
Exhibit 10: Five "Dimensions" of Container Terminal Capacity
DRAFTDRAFT
BERTH LENGTHBERTH LENGTH
STACKING HEIGHTSTACKING HEIGHTCY DEPTH (AREA)CY DEPTH (AREA)
OPERATING HOURSOPERATING HOURS
DRAFTDRAFT
BERTH LENGTHBERTH LENGTH
STACKING HEIGHTSTACKING HEIGHTCY DEPTH (AREA)CY DEPTH (AREA)
OPERATING HOURSOPERATING HOURS
Ports and marine terminal operators are continually reviewing and adjusting their capacity, and
their operating practices within that capacity. Terminals attempt to balance the five dimensions
of capacity.
Berths long and deep enough for the biggest expected vessel
Enough berths and cranes to avoid vessel delay
Enough CY acreage and density to avoid congestion
Enough hours to turn the vessel
Estimating container terminal capacity and utilization along the five dimensions in Ex__ works
well for dedicated container terminals that handle vessels with on-shore gantry cranes. The
methodology does not work as well with multi-purpose terminals that may also handle autos,
breakbulk, neobulk, or project cargoes. ______ and ________ are examples of such terminals.
There is not, in general, any easy way to divide terminal CY space or other attributes among the
uses. Terminals that also handle Ro-Ro vessels (e.g. Seaboard at Miami) or refrigerated vessels
with ship’s gear (e.g. Freeport, TX) present the same problem. In such cases, the division of
terminal space devoted to different cargo types is flexible, and capacity is not fixed or readily
estimated. For these terminals the study team used aerial photos to approximate the current
acreage devoted to gantry-served container trade.
Berth length and draft determine the size of vessels the terminal can handle and how heavily they
can be loaded. The terminal storage capacity depends on the area available and how high the

Page 12
Tioga
container can be stacked. The other variable is operating hours. Most terminals will operate a
second shift as required to turn the vessel, but second shifts are expensive and third shifts are still
more expensive. Most terminals still open the gates for just one shift.
Port authorities are commonly charged by their communities, regions, or states with promoting
growth of trade, economic development, and jobs. To do so, port and terminal operators attempt
to build and maintain sufficient capacity for foreseeable and attainable growth. Most container
terminal parameters, however, can only be adjusted in large, costly, and time-consuming
commitments. Development of new terminals, expansion of berths, and dredging are multi-year,
multi-million dollar projects. Expansion of existing terminal space can be undertaken more
easily and inexpensively, but can still take months or years in congested seaport areas.
In the shorter term, ports and terminals can add container cranes at a cost of $5-$10 million each,
with a lead time of multiple months rather than multiple years.
In the very short term ports and container terminals can adjust capacity along two dimensions:
container yard stacking density and operating hours. These are also ordinarily the only means by
which container terminals reduce capacity. Except in rare circumstances, terminal areas do not
shrink, berths do not get shorter, channels do not become shallower, and the number of cranes
does not decline. During seasonal or economic trade downturns, however, marine terminal
operators can reduce operating hours, reduce manning during operating hours, and revert to low-
density, low-cost container yard operations.
Berth Length
Berth length is published in many places. Berth length also tends to remain stable over long
periods, so the sources tend to be accurate. Container terminal berths are typically 600-1,000
feet. At many ports, however, the berth face is continuous across multiple berths or even across
multiple terminals (need example). Two 1,000-foot berths on a 2,000-foot face, therefore, can
accommodate vessels longer than 1,000 feet although not two at a time.
As most container vessels in service are less than 1,000 feet long and 1,000-foot berths are
common, berth length per se has seldom been a limiting factor. That will eventually change as
Post-Panamax and Super-Post-Panamax vessels become more common on the East and Gulf
Coasts.
The “Panamax” length limit is 965 feet and the width limit is 105 feet. Vessels
that transit the Canal can be as large as 5000 TEU, although most are much
smaller.
Typical “Post-Panamax” vessels are 1000+ feet long and 130+ feet wide.
Capacities range up to 10,000 TEU. These are the vessels targeted by the Panama
Canal expansion.
The largest “super-post-Panamax” vessels now being built in the 13,000-15,000
TEU range such as the Maersk E-Class, however, are 184 feet wide and 1300+
feet long.

Page 13
Tioga
Draft (Berth Depth)
Berth depth (and the depth of the channel required to reach the berth) is also commonly
published. It is seldom clear, however, whether the published figure is the authorized depth
(which may or may not have been fully maintained) or a measured and maintained depth. Given
the long-term outlook of the capacity estimates, it was assumed that the published depths would
be maintained.
It should be noted that the current draft limit for the Panama Canal is 39.5 feet, which is more
restrictive than most East Coast and Gulf ports. The new Canal locks are expected to allow
vessel with drafts if up to 60 feet, widths of up to 180 feet, and lengths of up to 1400 feet transit
the Canal.
Ports and terminal operators can provide capacity, but throughput is limited by the capacity of
the vessels than call and the percentage of that capacity that is discharged and loaded.
Berth depth was used to estimate the maximum vessel size that each port could accommodate.
The relationship between vessel design or maximum draft and size measured in deadweight tons
(DWT) or twenty-foot equivalent units (TEU) varies considerably, especially in very large
vessels (e.g. over 8,000 TEU). To develop a working relationship the study team assembled a
database of 350+ container vessels. A regression analysis yielded the relationship shown in
Exhibit 11.
Exhibit 11: Container Vessel DWT vs. TEU Capacity
Container Ship TEU vs. DWT
y = 0.0838x - 253.39
R2 = 0.9599
-
2,000
4,000
6,000
8,000
10,000
12,000
14,000
16,000
- 20,000 40,000 60,000 80,000 100,000 120,000 140,000 160,000 180,000
DWT
TE
U
N=353
This analysis is likely to be most reliable where there is the most data available, which is the
range of 20,000 to 80,000 DWT or 2,000 to 6,000 TEU. At the upper end of the range there are
fewer data available. It appears, moreover, that vessel designers have kept maximum drafts
within boundaries, and that the largest vessels are becoming wider rather than deeper.
Exhibit 12 compares the reported versus estimated TEU capacities where available. Significant
differences in reported and estimate TEU capacities should be expected because there are
substantial variations in the way the carriers themselves rate vessel capacity. A vessel can hold

Page 14
Tioga
more containers if they are light or empty, so a TEU capacity based on an illustrative average of
12 metric tons per TEU will be higher than an estimate for the same vessel at 13 or 14 metric
tons per TEU. These variations account for much of the disparity between vessels of similar size
and tonnage but different TEU capacities.
Exhibit 12: Reported vs. Estimated Container Vessel TEU
-
1,000
2,000
3,000
4,000
5,000
6,000
7,000
8,000
9,000
10,000
Reported TEU
Est TEU
Exhibit 13 shows the relationship between DWT and draft, where both data items were available
for a given vessel.
Exhibit 13: DWT vs. Draft
y = 939e0.0972x
R2 = 0.9559
0
20,000
40,000
60,000
80,000
100,000
120,000
140,000
160,000
180,000
20 25 30 35 40 45 50 55
DW
T
Draft (ft)
N=119
Vessels rarely sail at their full design draft. To do so would entail a full load of loaded
containers, which is uncommon. USACE guidance (Exhibit 14) suggests that maximum
effective cargo capacity is typically about 95% of DWT. Applying this ratio to design draft
versus sailing draft suggests that a vessel designed for 50 feet draft would, for example, usually

Page 15
Tioga
sail at a maximum of 47.5 feet. While not a precise relationship, this guideline was adopted for
the capacity analysis.
Exhibit 14: USACE Guidance on Cargo Capacity as a Percentage of DWT TABLE 28
Adjustments for Estimating Actual Vessel Capacity
Short Tons of Cargo as a Percentage of Vessel DWT
Vessel DWT % Cargo to DWT
<20,000 90%
20,000 to 70,000 92%
70,000 to 120,000 95%
>120,000 97%
Source: IWR Report 91-R-13, National Economic Development
Procedures Manual, Deep-Drat Navigation, November 1991, p. 77.
Likewise, vessels rarely use the full channel depth. For safety reasons, pilot rules and common
practice typically require a minimum of 3 feet under keel. This rule is sometimes “bent”, and it
is common at some ports to “ride the tide” to gain additional clearance. Taking the long-term
view again, the capacity analysis incorporates the 3-foot minimum.
Together, these guidelines imply that a vessel with a 50-foot design draft would have a
maximum sailing draft of 47.5 feet and would need a channel depth of 50.5 feet to maintain a 3-
foot underkeel clearance.
This series of relationships was used to estimate the largest vessel size in TEU that could be
accommodated at each port, and the corresponding berth requirements for length and beam.
Exhibit 15 shows the estimated maximum vessel size for each port and the reported average
container vessel size for 2007. Most major ports receive a mix of vessels whose average size is
well below the maximum.
Exhibit 15: Maximum vs. Average Vessel Capacity - TEU
-
1,000
2,000
3,000
4,000
5,000
6,000
7,000
8,000
Bost
on
NYNJ
Del
awar
e Riv
er
Bal
timore
VPA
Char
lest
on
Savan
nah
Jack
sonvi
lle
Port E
verg
lades
Mia
mi
Mobile
New
Orlea
ns
Houst
on
Avg. 2007 Vessel TEU Capacity
Est. Max Vessel TEU Capacity
Page 16
Tioga
A comparison between the estimated maximum vessel size and the record of vessel calls
revealed some cases where the reported average vessel size was greater than the estimated
maximum. These cases include ports with serious draft restrictions, such as the Delaware River
(39’, and Houston (40’). Larger vessels can call at these ports by riding the tide or through light-
loading.
(Note – some of the estimates need to be double-checked)
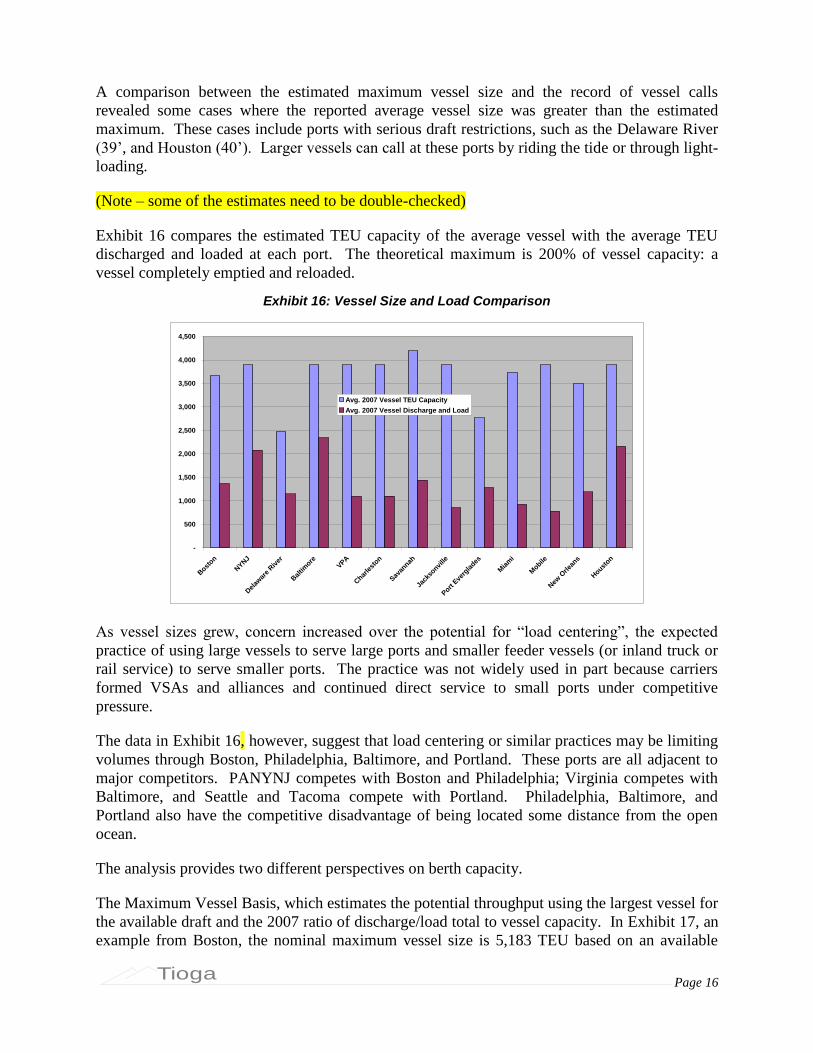
Exhibit 16 compares the estimated TEU capacity of the average vessel with the average TEU
discharged and loaded at each port. The theoretical maximum is 200% of vessel capacity: a
vessel completely emptied and reloaded.
Exhibit 16: Vessel Size and Load Comparison
-
500
1,000
1,500
2,000
2,500
3,000
3,500
4,000
4,500
Bost
on
NYNJ
Del
awar
e Riv
er
Bal
timore
VPA
Char
lest
on
Savan
nah
Jack
sonvi
lle
Port E
verg
lades
Mia
mi
Mobile
New
Orlea
ns
Houst
on
Avg. 2007 Vessel TEU Capacity
Avg. 2007 Vessel Discharge and Load
As vessel sizes grew, concern increased over the potential for “load centering”, the expected
practice of using large vessels to serve large ports and smaller feeder vessels (or inland truck or
rail service) to serve smaller ports. The practice was not widely used in part because carriers
formed VSAs and alliances and continued direct service to small ports under competitive
pressure.
The data in Exhibit 16, however, suggest that load centering or similar practices may be limiting
volumes through Boston, Philadelphia, Baltimore, and Portland. These ports are all adjacent to
major competitors. PANYNJ competes with Boston and Philadelphia; Virginia competes with
Baltimore, and Seattle and Tacoma compete with Portland. Philadelphia, Baltimore, and
Portland also have the competitive disadvantage of being located some distance from the open
ocean.
The analysis provides two different perspectives on berth capacity.
The Maximum Vessel Basis, which estimates the potential throughput using the largest vessel for
the available draft and the 2007 ratio of discharge/load total to vessel capacity. In Exhibit 17, an
example from Boston, the nominal maximum vessel size is 5,183 TEU based on an available

Page 17
Tioga
draft of 45 feet and a corresponding sailing draft of 42 feet. The current average vessel capacity
(2007) is estimated at 3,675 TEU, with a 37% discharge/load rate. At the same rate, a 5,183
TEU vessel would load and discharge 1,930 TEU at Boston. Based on a maximum of 260 calls
per year per berth (5 per week) and a sustainable estimate of 208 (80%) per berth. The annual
TEU capacity would be 803,012.
Exhibit 17: Berth Capacity - Maximum Vessel Basis Example
Berth Capacity - Max Vessel Basis Conley Port Total
Berths 2 2
Berth length 2,000 2000
Berth Depth - Feet 45 45
Max Sailing Draft 42 42
Corresponding Design Draft @ 95% 44 44
Corresponding DWT 63,678 63,678
Nominal Max Vessel TEU 5,183 5,183
Corresponding Vessel Length - Feet 1,000 1,000
Vessel Spacing (Beam) 140 140
Length requirement 1,140 1,140
Available Berths for Max Vessel 2.0 2.0
Port average TEU/container 1.73 1.73
2007 TEU 220,339 220,339
Avg. TEU/Vessel 1,369 1,369
Avg. Vessel DWT 45,571 45,571
Average Est. Vessel Capacity TEU 3,675 3,675
Average Discharge & Load % 37% 37%
Average TEU per Max Vessel 1,930 1,930
Max annual calls per berth 260 260
Sustainable Calls per berth @ 80% 208 208
Total Sustainable Vessel Calls 416 416
Annual Berth Capacity TEU 803,012 803,012
2008 Annual TEU 208,626 208,626
Berth Utilization, Max Vessel Basis 26% 26%
Alternatively, the berth capacity can be more conservatively estimated using the current average
vessel size and simply maximizing the number of calls (Exhibit 18).
Exhibit 18: Berth Capacity Estimate- Vessel Call Basis Example
Berth Utilization - Vessel Call Basis Conley Port Total
Max Calls per berth 5 / wk 260 260
Available Berths 2.0 2.0
Sustainable Calls per berth @ 80% 208 208
Total Sustainable Vessel Calls 416 416
2007 Vessel calls 161 161
2007 Berth Utilization 39% 39%
Container Yard Storage Density (Stacking Height)
Marine container terminal operators adjust container yard (CY) storage density and stacking
height by reconfiguring the CY, changing handling equipment, and varying container storage
practices. Typical handling equipment types are shown in Exhibit 19.

Page 18
Tioga
Exhibit 19: Container Yard Handling Equipment Types
TOP-PICK EMPTY HANDLERTOP-PICK EMPTY HANDLER REACH STACKERREACH STACKER SIDE LOADERSIDE LOADER
STRADDLE CARRIERSTRADDLE CARRIER RUBBER-TIRED GANTRY (RTG)RUBBER-TIRED GANTRY (RTG) RAIL-MOUNTED GANTRY (RMG)RAIL-MOUNTED GANTRY (RMG)
TOP-PICK EMPTY HANDLERTOP-PICK EMPTY HANDLER REACH STACKERREACH STACKER SIDE LOADERSIDE LOADER
STRADDLE CARRIERSTRADDLE CARRIER RUBBER-TIRED GANTRY (RTG)RUBBER-TIRED GANTRY (RTG) RAIL-MOUNTED GANTRY (RMG)RAIL-MOUNTED GANTRY (RMG)
Exhibit 20 displays the progression of terminal handling methods from lowest to highest density.
Virtually all U.S. marine container terminals use a mix of the handling methods shown in Exhibit
19 and Exhibit 20, and vary that mix to provide sufficient capacity at minimum cost. Terminal
operators gravitate to low-density, low-cost operating methods whenever possible.
Exhibit 20: Progression of Terminal Handling Methods
DENSITY TYPE COMMENT
Ro/Ro or Ship’s gear Very small, barge, specialized
Wheeled Combination Small, mixed, legacy
Dedicated Wheeled Older terminals when new
Wheeled/Top-pick Transition temrinals
Top-pick/Wheeled Transition temrinals
Straddle/Top-pick/Wheeled Hybrid terminal
RTG/Top-pick/Wheeled Dominant hyrbid type
Straddle Carrier NIT Virginia
RTG No US Example
VERY HIGH DENSITY Pure RMG APM Portsmouth
VERY LOW DENSITY
LOW DENSITY
MID DENSITY
HIGH DENSITY
Faced with a need to accommodate more trade, terminals move progressively up the density
scale.
Terminal operators start increasing density by stacking empty containers instead
of leaving them parked on chassis. Empties can be handled with inexpensive
equipment and stacked first-in/last-out since they are largely interchangeable.

Page 19
Tioga
As additional capacity is required, terminal operators begin stacking loaded
export containers. Export containers typically build up over the week prior to
vessel arrival and need not be accessed until it is time to load that vessel. Loaded
containers are heavier than empties, however, and must be accessed in a sequence
tied to vessel loading plans. Loaded export storage therefore usually requires
more expensive RTGs or straddle carriers.
Terminal operators typically leave loaded import containers parked on chassis
(“wheeled”) as long as possible to both minimize handling cost and maximize
responsiveness to customer needs. When loaded imports are eventually stacked,
they require RTG or straddle carriers for flexible access.
Containers with special requirement are rarely stacked, and most terminals
reserve space to keep such movements on chassis. Specialized movements
include refrigerated containers, containers with hazardous cargo, over-size or
over-weight containers, tank containers, and containers held for CBP inspection.
In peak periods, such as the annual holiday import surge, terminals shift the balance of
operations to higher densities. In slack periods, the operators park more containers on chassis.
In protracted downturns, such as the current recession, terminal operators will idle costly
handling equipment and revert to wheeled operations, even on space configured for stacking
(Exhibit 21).
Exhibit 21: Wheeled Containers on RTG Layout
IDLE RTGsIDLE RTGs
EMPTIES
STACKED WITH
TOP-PICKS
EMPTIES
STACKED WITH
TOP-PICKS
WHEELED
CONTAINERS
PARKED ON
RTG LAYOUT
WHEELED
CONTAINERS
PARKED ON
RTG LAYOUT
IDLE RTGsIDLE RTGs
EMPTIES
STACKED WITH
TOP-PICKS
EMPTIES
STACKED WITH
TOP-PICKS
WHEELED
CONTAINERS
PARKED ON
RTG LAYOUT
WHEELED
CONTAINERS
PARKED ON
RTG LAYOUT
The CY capacity estimation method used in this study is necessarily a compromise, based on a
“snapshot” of current stacking density. As shown in the example below, the team used the most
recent aerial photos available on Google Earth and estimated the CY acreage configured for each
storage density category. The precision of this method is necessarily limited in several respects.
The latest available aerial photos vary from a few months old to 2 to 3 years old,
and terminal configurations and uses can change on short notice.

Page 20
Tioga
Aerial estimates of acreage and uses are imprecise although probably sufficiently
accurate for high-level capacity estimates.
The container yard capacities were estimated by dividing the CY acreage by handling type and
applying the storage factors for each to derive estimated TEU slot totals. The typical storage
densities for terminal handling methods are shown in Exhibit 22.
Exhibit 22: Typical CY Storage Densities
CY Storage Method TEU Slots per Acre
Wheeled Chassis 80
Grounded Straddle Carrier 160
Grounded Stacked 200
Grounded RTG 300
Grounded RMG 360
The focus on capacity, rather than current throughput, led the team to rely more on terminal
configuration rather than on current usage or estimates. For example, terminal space configured
to use RTGs was assigned an inherent capacity of 300 TEU per acre even though it may
currently be used for wheeled storage at 80 TEU per acre. This estimation practice is also
necessarily imprecise as the ability to use the full inherent capacity of may depend on the
availability of handling equipment, operating systems, and other factors beyond the scope of this
study.
Exhibit 23 shows an example of CY acreage allocation in which the 79 total CY acres were
divided into 20 acres of wheeled storage at 80 TEU/acre, 43 acres of straddle carrier operation at
160 TEU/acre, 8 acres of stacked storage at 200 TEU/acre, and 8 acres of RTG storage at 300
TEU per acre for a total storage capacity of 12,480 TEU slots (Exhibit 24). If the terminal
needed more CY capacity, the operator would like stack more containers or expand RTG
operations at the expense of low-density wheeled storage. The average of 158 slots per acre is
between the low density of wheeled operations and the higher density of stacked or RTG
operations.
Exhibit 23: CY Acreage Example: Port of New Orleans
Terminal Space Napolean Port Total
Total Acres 128 128
Wheeled CY Acres 20 20
Straddle Carrier CY Acres 43 43
Stacked CY Acres 8 8
RTG CY Acres 8 8
RMG CY Acres -
Total CY Acres 79 79
On-Dock Rail Acres 10 10
Other Non-CY Acres 16 16
Net Berth/Gate/Yard Acres 105 105
Undeveloped Acres - -

Page 21
Tioga
Exhibit 24: CY Capacity Example: Port of New Orleans
Container Yard Capacity Napolean Port Total
Wheeled Chassis Slots 1,600 1,600
Grounded Straddle Carrier Slots 6,880 6,880
Grounded Stacked Slots 1,600 1,600
Grounded RTG Slots 2,400 2,400
Grounded RMG Slots - -
TEU Storage Slots 12,480 12,480
Avg TEU Slots/CY Acre 158 158
Maximum Annual Slot Turnover 70.0 70.0
Maximum Annual CY TEU Capacity 873,600 873,600
Sustainable CY TEU Capacity @ 80% 698,880 698,880
2008 Annual TEU 313,765 313,765
2008 TEU per CY Slot 25 25
2008 CY Capacity Utilization 45% 45%
As Exhibit 24 shows, the team estimated the maximum annual TEU capacity based on a
maximum annual slot turnover of 70 turns annually, an aggressive average of more than one turn
per week and equivalent to an average container dwell time of slightly over 5 days. While
theoretically possible, particularly in periods of peak demand, operation at this level of intensity
is unlikely to be sustainable day-in and day-out. Moreover, if this level of density were routine
there would be no reserve capacity to handle the inevitable trade surges. The study team
therefore also estimated sustainable CY TEU capacity at 80% of the maximum, following a
common industry rule-of-thumb. There is only one major container terminal at the Port of New
Orleans, so in the examples above the port total is the same as the Napoleon terminal total.
2008 annual TEU counts were compared with the estimated sustainable TEU capacity to
estimate the annual TEU per storage slot (25 in the example) and average annual CY capacity
utilization (45% in the example).
Under greater pressure, such as was experienced in Southern California before the current
recession, marine terminals can also increase capacity by reducing container dwell times. By
shortening “free time” allowances and raising or vigorously enforcing charges for excess dwell
time, terminal operators have succeeded in reducing dwell times for import loads and therefore
increasing storage turnover. On the export side, terminals can limit the time in advance of vessel
arrival during which export containers will be accepted. To reduce the dwell time of empty
containers, terminal operators and their ocean carrier clients can move empties to off-terminal
depots or return leased containers to leasing company depots.
Operating Hours
Port terminals occasionally vary operating hours to handle additional vessels or cope with trade
surges. Marine container terminals typically maintain full cargo handling and gate functions for
a single shift five to six days per week. Additional shifts are often operated to handle arriving or
departing vessels and complete loading or unloading, even if full gate and truck handling
functions are not supported. In peak periods, terminals will extend gate hours to handle inbound
and outbound truck movements. At the busiest ports, such as NYNJ or LALB, extended age
hours are a regular feature.
Page 22
Tioga
Labor agreements specify the options available to terminal operators and the attendant costs.
Marine terminal operators attempt to match labor supply and costs with vessel and trade
requirements. The rigidities of these agreements make it difficult and costly for terminal
operators to extend operating hours or to match labor supply closely with trade and vessel
requirements. So although container terminal throughput and capacity could be greatly increased
by adding shifts, that option is usually the last choice for any extended period.
Vessels and Crane Use
Container terminal throughput is limited by the size and utilization of the vessels that call. As
Exhibit 16 suggests, the average vessel that calls at most ports discharges and loads substantially
less than its full capacity. There are two basic reasons for this disparity.
Vessels almost invariably call at multiple U.S. ports on each voyage, and the
vessel’s total cargo discharge and load is split among those ports.
Ocean carriers, like ports and terminals, offer and deploy sufficient capacity to
accommodate growth as well as current cargo volumes. Only in peak periods of
peak years will vessels be completely full.
The ability to handle a given vessel size depends on the berth length and draft available at the
terminal. The ability to handle the cargo from that vessel depends on the number of cranes
available, the hourly throughput capability of those cranes, and the hours those cranes are
available in a day or week.
A typical marine terminal, such as the one shown in Exhibit 25, might have two berths and four
cranes. This configuration gives the terminal operator the flexibility to assign from one to four
cranes to a vessel as required. as the vessel discharge and load averages increase, the number of
cranes may limit the number of vessels that can be handled simultaneously and therefore
annually. As this limit is approached the port or terminal operator will add cranes.

Page 23
Tioga
Exhibit 25: Typical Two-Berth/Four-Crane Terminal
The primary goal of terminal operators is to service the vessel or schedule and at minimum cost.
The number of cranes installed and used is determined primarily by the need to “turn” the vessel,
with annual crane productivity a secondary consideration. This set of priorities results in
relatively low container crane utilization, as suggested by Exhibit 26. A vessel is far more costly
to own and operate than the cranes that serve it, so crane utilization is effectively sacrificed to
vessel utilization.
Exhibit 26: Container Cranes and Utilization
Container CranesN. Atlantic
Ports*
S. Atlantic
PortsGulf Ports
East & Gulf Coast
Ports
Cranes 120 77 27 224
Cranes per Berth 2.1 1.8 2.1 2.0
Annual Crane Capacity - TEU 29,640,002 19,177,987 6,653,344 55,471,333
Reserve Crane Capacity - TEU 20,895,164 12,501,742 4,423,466 37,820,372
Annual TEU/Crane 76,709 86,704 82,588 78,799
Annual Moves/Crane 43,140 48,739 47,017 45,532
Crane Utilization 30% 35% 34% 32%

Page 24
Tioga
III. North Atlantic Ports
North Atlantic Summary
Exhibit 27 summarizes estimates of North Atlantic port capacity and utilization along multiple
dimensions. North Atlantic container trade is dominated by the Port Authority of New York and
New Jersey (60% of the 2008 TEU total) and the Port of Virginia (Virginia Port Authority, 24%
of the 2006 TEU total). The Ports of Boston and Philadelphia (Delaware River) must compete
with NYNJ. The other Delaware River port, Wilmington, DE, is a specialized facility handling
imported bananas. Baltimore must compete with the Port of Virginia In addition to its own
seaport terminals, VPA operates the Virginia Inland Port, a satellite terminal in Baltimore’s
market area. Philadelphia and Baltimore have the additional competitive disadvantage of being
located a significant distance from the open ocean with channel draft restrictions. The new APM
Portsmouth terminal is shown separately.
Exhibit 27: North Atlantic Capacity and Utilization Summary
Container Yard Boston NYNJDelaware
RiverBaltimore VPA
APM
Portsmouth
N. Atlantic
Ports*
2008 TEU 208,626 5,265,058 574,876 613,000 2,083,278 na 8,744,838
Gross Acres 101 1,338 420 458 680 230 3,227
CY Acres 49 783 120 228 284 78 1,542
CY/Gross Ratio 49% 59% 29% 50% 42% 34% 48%
Annual CY Capacity - TEU 666,400 8,772,400 840,000 2,634,240 3,126,200 1,659,000 17,698,240
Reserve CY Capacity - TEU 457,774 3,507,342 265,124 2,021,240 1,042,922 1,659,000 10,612,402
Annual TEU/Gross Acre 2,066 3,935 1,369 1,338 3,064 na 2,918
Annual TEU/CY Acre 4,258 6,724 4,791 2,689 7,335 na 5,973
Est. CY TEU Slots 11,900 125,320 15,000 47,040 44,660 23,700 267,620
Avg. CY Slots/ Acre - Density 243 160 125 206 124 306 174
Avg. Annual TEU/CY Slot (Turns) 18 42 38 13 47 - 36
CY Utilization 31% 75% 68% 23% 83% na 55%
Container Cranes Boston NYNJDelaware
RiverBaltimore VPA
APM
Portsmouth
N. Atlantic
Ports*
Cranes 4 58 8 16 28 6 120
Cranes per Berth 2.0 2.2 1.6 1.6 2.8 1.5 2.1
Annual Crane Capacity - TEU 968,800 14,616,000 2,016,000 3,471,202 7,056,000 1,512,000 29,640,002
Reserve Crane Capacity - TEU 760,174 9,350,942 1,441,124 2,858,202 4,972,722 1,512,000 20,895,164
Annual TEU/Crane 52,157 90,777 71,860 38,313 74,403 na 76,709
Annual Moves/Crane 30,148 50,432 39,922 24,723 41,335 na 43,140
Crane Utilization 22% 36% 29% 18% 30% na 30%
Berths and Vessels Boston NYNJDelaware
RiverBaltimore VPA
APM
Portsmouth
N. Atlantic
Ports*
Berths 2 26 5 10 10 4 57
Berth Feet 2,000 27,421 5,300 8,819 11,460 3,200 58,200
Annual Vessel Calls (2007) 161 2,549 499 427 1,940 na 5,576
Annual Vessel Calls per Berth (2007) 81 98 62 43 194 na 80
Berth Utilization - Vessel Call Basis 39% 45% 30% 21% 67% na 39%
Reserve Berth Capacity - Vessel Calls 255 3067 1165 1653 972 na 8884
Annual TEU per Berth 104,313 202,502 114,975 61,300 208,328 na 164,997
Annual TEU/Foot of Berth 104 192 108 70 182 na 159
Average Vessel Capacity - TEU 3,675 3,895 2,482 3,895 3,895 na 3,762
Average TEU per Vessel (2007) 1,369 2,079 1,146 2,346 1,097 na 1,568
Avg. Vessel Ute. - % Discharge/Load 37% 53% 46% 60% 28% na 42%
Berth Capacity - Avg. Vessel Basis 569,323 11,675,078 1,430,333 4,392,000 2,510,155 na 20,576,889
Berth Utilization - Avg. Vessel Basis 37% 45% 40% 14% 83% na 42%
Reserve Berth Capacity - Avg. Vessel Basis 360,697 6,410,020 855,457 3,779,000 426,877 na 11,832,051
Reserve Berth Capacity - Max. Vessel Basis 594,386 17,125,247 1,396,227 7,809,918 2,406,520 na 29,332,298

Page 25
Tioga
As the summary data show, reserve capacity in the North Atlantic is substantial, in part because
of the shear size of NYNJ and Virginia (particularly of the APM terminal is included) and in part
because Boston, Philadelphia, and Baltimore are underutilized.
Exhibit 28 displays the maximum reported draft available at the North Atlantic ports, and
corresponding estimated maximum vessel TEU capacity. These can be contrasted with the actual
vessel averages and TEU volumes per vessel, which are much lower in some cases. The listed
drafts, however, are not available at all of the NYNJ, Baltimore, and VPA terminals, so some of
those terminals remain draft-constrained.
Exhibit 28: North Atlantic Drafts and Vessel Data
Berths and Vessels Boston NYNJDelaware
RiverBaltimore VPA
APM
Portsmouth
Nominal Maximum Channel/Berth Draft Feet 45 50 40 50 49 50
Estimated Maximum Vessel TEU 5,183 7,470 3,420 7,470 6,967 7,470
2007 Average Vessel TEU 3,675 3,895 2,482 3,895 3,895 na
2008 Average Vessel Discharge/Load 1,369 2,079 1,146 2,346 1,097 na
Port of Boston
Overview
Container activity at the Port of Boston is centered at the 101-acre Conley Container Terminal
(Exhibit 29). The terminal has four Post-Panamax container cranes and 2000 feet of berthing
space. The Port of Boston has direct access to the Atlantic Ocean. The terminal is operated by
The Massachusetts Port Authority (Massport), an independent public authority which develops,
promotes, and manages seaport infrastructure in Massachusetts. Containers were formerly
handled at the 65-acre Moran Terminal, which now has been repurposed as an automobile
handling terminal.
Exhibit 29: Port of Boston Conley Container Terminal
Source: Google Earth Image Date April 17, 2008

Page 26
Tioga
Conley terminal’s peak year was 2007, when 220,000 TEU were handled. Exhibit 30 provides a
profile of the Conley terminal.
Exhibit 30: Conley Container Terminal Profile
Profle date: Sept. 25, 2009 2008 TEU: 208626
Port: Boston Total Acres: 101
Terminal: Conley CY Acres: 49
Terminal Type: RTG/Top-pick/Wheeled On-Dock Rail Acres: 0
First & Farragut Rd. Other Non-CY Acres: 17
Boston MA 02127 Net Terminal Acres (BGY): 84
Operator (Stevedore): MassPort Berths: 2
Contact Name: Total Berth Length: 2,000
Telephone Number: (617) 464-8200 Channel Depth (MLLW): 45
Fax Number: (617) 464-8201 Berth Depth (MLLW): 45
E-Mail Address: Panamax Container Cranes:
Port Website: www.massport.com Post-Panamax Container Cranes: 4
Terminal Website: CY Rail-Mounted Gantries:
Inbound Gates: 8 CY Rubber-Tired Gantries:
Outbound Gates: 4 CY Side or Top Loaders:
Reversible Gates: CY Straddle Carriers:
Total Gates: 12 CY Reach Stackers:
On-Line Access System: GYAS Total CY Lift Machines 0
Appointment System: On-site M&R (yes/no):
Reefer Plugs/Slots: 160 On-dock Rail (yes/no): No
Terminal Hours:
Gate Hours:
CONTAINER TERMINAL PROFILE
Address:
(Diagram)
Notes: On July 22, 2009 Massport launched a web-based Gate and Yard Automated System (GYAS) at
Conley Terminal. This system, designed by Maher Terminal Logistics Systems. This software also gives
Massport an automated approach to yard management, providing
Monday - Friday, 7 a.m-5 p.m. Last inbound truck, 4:15pm

Page 27
Tioga
Container Yard Storage Capacity
Exhibit 31 summarizes land use at Conley Terminal. The total area for the port’s container
operations is 101 acres. The CY to gross ratio is estimated at 49%. Conley does not have on-
dock rail.
Exhibit 31: Conley Terminal Land Use
Port Land Use Conley Port Total
Gross Acres 101 101
CY Acres 49 49
Rail Acres - -
Other Non-CY Acres 17 17
Net Berth/Gate/Yard Acres 84 84
CY/Gross Ratio 49% 49%
Exhibit 32 applies standard CY storage factors to the port acreage. The port currently has a mix
of wheeled and stacked CY operations. The CY area has been estimated to be 49 acres producing
11,900 TEU storage slots. Annual CY sustainable TEU capacity is estimated to 666,400 TEU.
This produces annual utilization of 31% relative to 2008 volume.
Exhibit 32: Conley Terminal Near Term CY Capacity
Container Yard Capacity Conley Port Total
Wheeled Chassis Slots 800 800
Grounded Straddle Carrier Slots - -
Grounded Stacked Slots 1,200 1,200
Grounded RTG Slots 9,900 9,900
Grounded RMG Slots - -
TEU Storage Slots 11,900 11,900
Avg TEU Slots/CY Are 243 243
Maximum Annual Slot Turnover 70.0 70.0
Maximum Annual CY TEU Capacity 833,000 833,000
Sustainable CY TEU Capacity @ 80% 666,400 666,400
2008 Annual TEU 208,626 208,626
2008 TEU per CY Slot 18 18
2008 CY Capacity Utilization 31% 31%
In the long term, Conley could increase CY capacity by shifting the acreage used for wheeled
and stacked storage to RTG storage.
Crane Capacity
Exhibit 33 provides a summary of Conley Terminal cranes and an estimate of crane capacity.
The port provides 4 cranes for use by its tenants. Estimated annual crane capacity at the port is
968,000 TEU with 2008 utilization at 22%. The utilization estimate may be somewhat overstated
because the port has a sizeable Ro-Ro operation which is in the TEU count but does not utilize
container cranes for loading and unloading.

Page 28
Tioga
Exhibit 33: Conley Terminal Near Term Crane Capacity
Crane Capacity Conley Port Total
Cranes 4 4
Available Crane Hours per Day 16 16
Current Annual Operating Days 250 250
Current Annual Hours/Crane 4,000 4,000
Annual Available Crane Hours 16,000 16,000
Sustainable Hours @ 80% 12,800 12,800
Avg. TEU/Available Crane-hour 13.0 13.0
Avg. Annual TEU/Crane 52,157 52,157
Crane Capacity, Moves/hour 35 35
Sustainable Moves/Hr @ 80% 28 28
Port average TEU/container 1.73 1.73
Crane Capacity TEU/hour 61 61
Annual Crane Capacity 968,800 968,800
Current Annual TEU 208,626 208,626
Current Crane Utilization 22% 22%
The four cranes at Conley serve two berths, which are in fact a continuous berth face of 2,000
feet. The terminal can handle two vessels simultaneously with two cranes each at a single larger
vessel with 3-4 cranes.
Berth Capacity
Conley berth capacity in TEU for the maximum vessel size is summarized in Exhibit 34. The
analysis estimates near term berth capacity at 803,012 TEU and 2008 berth utilization at 26%.

Page 29
Tioga
Exhibit 34: Boston Near Term Berth Capacity Maximum Vessel Basis
Berth Capacity - Max Vessel Basis Conley Port Total
Berths 2 2
Berth length 2,000 2000
Berth Depth - Feet 45 45
Max Sailing Draft 42 42
Corresponding Design Draft @ 95% 44 44
Corresponding DWT 63,678 63,678
Nominal Max Vessel TEU 5,183 5,183
Corresponding Vessel Length - Feet 1,000 1,000
Vessel Spacing (Beam) 140 140
Length requirement 1,140 1,140
Available Berths for Max Vessel 2.0 2.0
Port average TEU/container 1.73 1.73
2007 TEU 220,339 220,339
Avg. TEU/Vessel 1,369 1,369
Avg. Vessel DWT 45,571 45,571
Average Est. Vessel Capacity TEU 3,675 3,675
Average Discharge & Load % 37% 37%
Average TEU per Max Vessel 1,930 1,930
Max annual calls per berth 260 260
Sustainable Calls per berth @ 80% 208 208
Total Sustainable Vessel Calls 416 416
Annual Berth Capacity TEU 803,012 803,012
2008 Annual TEU 208,626 208,626
Berth Utilization, Max Vessel Basis 26% 26%
The estimated maximum vessel size of 5,183 TEU is based on the reported 45-foot draft. Larger
vessels could call at Conley, but not fully loaded. Vessels currently calling Conley discharge
and load an average of 37% of their TEU capacity. That ratio is most likely influenced by the
vessel’s need to call at other ports. The analysis implicitly assumes that the ratio will remain
constant, and that cargo growth would be accommodated in larger vessels rather than as larger
loads in existing vessels.
Berth capacity on a vessel call basis is summarized in Exhibit 35. This approach generates a
berth capacity estimate of 416 calls and 2007 berth utilization of 39%.
Exhibit 35: Conley 2007 Berth Capacity Vessel Call Basis
Berth Utilization - Vessel Call Basis Conley Port Total
Est. Sustainable Calls per berth 5 / wk 260 260
Available Berths 2.0 2.0
Sustainable Calls per berth @ 80% 208 208
Total Sustainable Vessel Calls 416 416
2007 Vessel calls 161 161
2007 Berth Utilization 39% 39%
Capacity and Productivity Summary
Exhibit 36 summarizes the capacity and productivity analysis for CY space, container cranes,
and vessel berths for Conley Terminal. This analysis estimates CY utilization at 31%, crane

Page 30
Tioga
utilization at 22%, and berth utilization at 31% on a vessel call basis and 26 % on a maximum
vessel basis. These estimates suggest that the port has substantial inherent capacity to handle
growth.
Exhibit 36: Conley Terminal Near Term Capacity and Productivity Summary
Terminal Space Conley Boston
2008 TEU 208,626 208,626
Gross Acres 101 101CY Acres 49 49CY/Gross Ratio 49% 49%Annual CY Capacity - TEU 666,400 666,400 Annual TEU/Gross Acre 2,066 2,066 Annual TEU/CY Acre 4,258 4,258 Est. CY TEU Slots 11,900 11,900 Avg. CY Slots/ Acre - Density 243 243 Avg. Annual TEU/CY Slot (Turns) 18 18 CY Utilization 31% 31%
Container Cranes Conley Boston
Cranes 4 4
Cranes per Berth 2.0 2.0
Annual Crane Capacity - TEU 968,800 968,800
Avg. Moves/Available Crane-Hour 13.0 13.0
Annual TEU/Crane 52,157 52,157
Annual Moves/Crane 30,148 30,148
Annual Vessel Calls/Crane (2007) 40 40
Crane Utilization 22% 22%
Berths and Vessels Conley Boston
Berths 2 2
Berth Feet 2,000 2,000
Annual Vessel Calls per Berth (2007) 81 81
Berth Utilization - Vessel Call Basis 39% 39%
Annual TEU per Berth 104,313 104,313
Annual TEU/Foot of Berth 104 104
Average Vessel Capacity - TEU 3,675 3,675
Est. Max. Vessel Capacity - TEU 5,183 5,183
Avg. vs. Max. Vessel Capacity 71% 71%
Average TEU per Vessel (2007) 1,369 1,369
Avg. Vessel Utilization - % Discharge/Load 37% 37%
Berth Capacity - Avg. Vessel Basis 569,323 569,323
Berth Utilization - Avg. Vessel Basis 37% 37%
Avg. Discharge/Load per Max. Vessel 1,930 1,930
Berth Capacity - Max. Vessel Basis 803,012 803,012
Berth Utilization - Max. Vessel Basis 26% 26%
Port of New York and New Jersey
Overview
The Port of New York and New Jersey has six container terminals under the Port Authority of
New York and New Jersey (PANYNJ). The Port Authority is a bi-state agency. Exhibit 37 is a
map of the region identifying the major marine container terminal facilities.

Page 31
Tioga
Exhibit 37: Port of New York and New Jersey
Source: Tioga Group 2010, Data available from the Port Authority Web Site. Depot locations are available on the
marine terminal and stevedore websites.
The Port of New York and New Jersey (PANYNJ) is the largest East Coast Port, handling more
than 5 million TEU in 2008. While most of the import cargo using the port is destined for
consumption in the New York Metropolitan area1, the port competes successfully for
discretionary cargo moving by motor carrier to Quebec, Ontario, New England, and
Pennsylvania. Rail service moves cargo to more distant Midwestern locations such as
Columbus, Detroit, and Chicago.
At NYNJ loads and empties are grounded to a greater degree than at other ports. The marine
terminals operate auxiliary chassis and empty container depots to simplify and expedite gate
operations as well as add CY capacity. The trend away from wheeled operations, initiated about
a decade ago, lead to innovations in chassis management such as cooperative chassis pools.
Dredging is underway to produce 50’ drafts at the major PANYNJ terminals. Air draft on the
bridge linking Bayonne and Staten Island is a future constraint for the largest container vessels.
The air draft beneath the Bayonne Bridge varies with the tide between 151 and 156 feet. As more
Port-Panamax and Super-Post-Panamax vessels enter the world fleet, the frequency with which
the Bridge will be a barrier for container terminals west of the Bridge will increase.
Red Hook (Exhibit 38) is a legacy complex of container, bulk, break bulk, and warehouse
facilities. The terminal is operated by American Stevedoring, Inc. Located at the foot of
Hamilton Avenue in Brooklyn, the Red Hook terminal has a total of 80 acres for all of its
operations. The container portion of the terminal is estimated to be 54 acres with 30 acres of CY
space. The Red Hook terminal operates two berths for all of its operations with a total berth
1 Precise numbers are not available. Tioga estimates this at approximately 80% remains in the New York Metropolitan area, with up to 5%
moving by motor carrier to Canada, 5-10% moving by rail, and the remainder by motor carrier to nearby states.

Page 32
Tioga
length of 2,080 feet. In Port Newark, ASI operates a 20-acre barge facility which is linked to the
main Brooklyn terminal by a cross-harbor barge service.
Exhibit 38: Red Hook Marine Terminal
Profle date: February 15, 2010 2008 TEU:
Port: PA of New York and New Jersey Total Acres: 80
Terminal: Red Hook Container Terminal CY Acres: 30
Terminal Type: Top-pick Combination On-Dock Rail Acres: 0
70 Hamilton Ave. Other Non-CY Acres: 26
Brooklyn, NY 11231 Net Terminal Acres: 54
Operator (Stevedore): American Stevedoring Berths: 2
Contact Name: Total Berth Length: 2,080
Telephone Number: (718) 875-0777 Channel Depth (MLLW): 42
Fax Number: (718) 643-7201 Berth Depth (MLLW): 42
E-Mail Address: Panamax Container Cranes: 4
Port Website: http://www.panynj.gov/port/containerized-cargo.htmlPost-Panamax Container Cranes:
Terminal Website: www.asiterminals.com CY Rail-Mounted Gantries:
Inbound Gates: 1 CY Rubber-Tired Gantries:
Outbound Gates: 1 CY Side or Top Loaders: Yes
Reversible Gates: CY Straddle Carriers:
Total Gates: 2 CY Reach Stackers:
On-Line Access System: Total CY Lift Machines 0
Appointment System: On-site M&R (yes/no):
Reefer Plugs/Slots: 72 On-dock Rail (yes/no):
Terminal Hours:
Gate Hours:
2007 TEU
2006 TEU
2005 TEU
2004 TEU
CONTAINER TERMINAL PROFILE
Address:
Notes: Entrance Gates: Foot of Hamilton Avenue. Cranes: four active container cranes 1 Star-50-ton, 1 Kone-50-
ton, 2 Paceco-40-ton. 2 Liebherr-60-ton Toploaders-45-tons.
8am-4pm M-F
Global Marine Terminal (Exhibit 39) is a dedicated container terminal using a combination of
RTG, top-pick, and wheeled storage. The terminal has a total of 100 acres with 64 acres for CY
storage. Global operates two container berths with a total berth length of 1,800 feet. The Global
terminal is operated by Global Terminal & Container Services, LLC. Work is underway to
produce 50’ berth drafts at Global. In addition Global Marine Terminal is the one New Jersey
facility which is not affected by air draft restrictions imposed by the Bayonne Bridge.
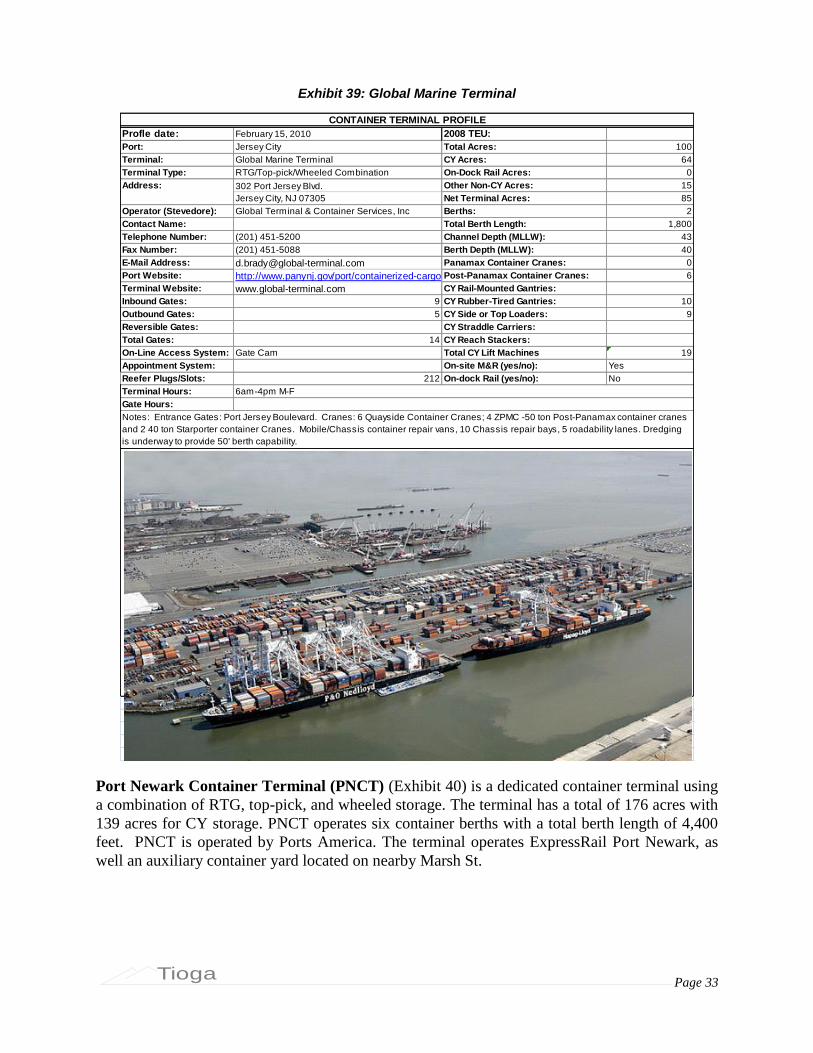
Page 33
Tioga
Exhibit 39: Global Marine Terminal
Profle date: February 15, 2010 2008 TEU:
Port: Jersey City Total Acres: 100
Terminal: Global Marine Terminal CY Acres: 64
Terminal Type: RTG/Top-pick/Wheeled Combination On-Dock Rail Acres: 0
302 Port Jersey Blvd. Other Non-CY Acres: 15
Jersey City, NJ 07305 Net Terminal Acres: 85
Operator (Stevedore): Global Terminal & Container Services, Inc Berths: 2
Contact Name: Total Berth Length: 1,800
Telephone Number: (201) 451-5200 Channel Depth (MLLW): 43
Fax Number: (201) 451-5088 Berth Depth (MLLW): 40
E-Mail Address: [email protected] Panamax Container Cranes: 0
Port Website: http://www.panynj.gov/port/containerized-cargo.htmlPost-Panamax Container Cranes: 6
Terminal Website: www.global-terminal.com CY Rail-Mounted Gantries:
Inbound Gates: 9 CY Rubber-Tired Gantries: 10
Outbound Gates: 5 CY Side or Top Loaders: 9
Reversible Gates: CY Straddle Carriers:
Total Gates: 14 CY Reach Stackers:
On-Line Access System: Gate Cam Total CY Lift Machines 19
Appointment System: On-site M&R (yes/no): Yes
Reefer Plugs/Slots: 212 On-dock Rail (yes/no): No
Terminal Hours:
Gate Hours:
CONTAINER TERMINAL PROFILE
Address:
(Diagram)
Notes: Entrance Gates: Port Jersey Boulevard. Cranes: 6 Quayside Container Cranes; 4 ZPMC -50 ton Post-Panamax container cranes
and 2 40 ton Starporter container Cranes. Mobile/Chassis container repair vans, 10 Chassis repair bays, 5 roadability lanes. Dredging
is underway to provide 50' berth capability.
6am-4pm M-F
Port Newark Container Terminal (PNCT) (Exhibit 40) is a dedicated container terminal using
a combination of RTG, top-pick, and wheeled storage. The terminal has a total of 176 acres with
139 acres for CY storage. PNCT operates six container berths with a total berth length of 4,400
feet. PNCT is operated by Ports America. The terminal operates ExpressRail Port Newark, as
well an auxiliary container yard located on nearby Marsh St.

Page 34
Tioga
Exhibit 40: Port Newark Container Terminal (PNCT)
Profle date: February 15, 2010 2008 TEU:
Port: Port Newark Total Acres: 176
Terminal: PNCT CY Acres: 76
Terminal Type: Straddle/Top-pick/Wheeled On-Dock Rail Acres: 0
241 Calcutta St. Other Non-CY Acres: 41
Port Newark, NJ 07114 Net Terminal Acres: 135
Operator (Stevedore): PNCT a Ports America Subsidiary Berths: 6
Contact Name: Total Berth Length: 4,400
Telephone Number: (973) 522-2200 Channel Depth (MLLW): 50
Fax Number: (973) 465-8827 Berth Depth (MLLW): 50
E-Mail Address: Panamax Container Cranes: 0
Port Website: http://www.panynj.gov/port/containerized-cargo.htmlPost-Panamax Container Cranes: 9
Terminal Website: www.pnct.net CY Rail-Mounted Gantries:
Inbound Gates: 8 CY Rubber-Tired Gantries:
Outbound Gates: 7 CY Side or Top Loaders: 12
Reversible Gates: CY Straddle Carriers: 72
Total Gates: 15 CY Reach Stackers: 6
On-Line Access System: Navis Total CY Lift Machines 90
Appointment System: On-site M&R (yes/no): Yes
Reefer Plugs/Slots: 335 On-dock Rail (yes/no): No
Terminal Hours:
Gate Hours:
CONTAINER TERMINAL PROFILE
Address:
(Diagram)
Notes: Entrance Gates: Calcutta Street (Main Gate). Recent change closed Mohawk, Panama, and Maracaibo streets
to truck traffic. The terminal is now using a remote CY on Kellog Street.
6 to 6
0600-1600 Monday-Friday (August 2009)
Maher Terminal (Exhibit 41) is a dedicated container terminal using a combination of RTG and
seven-high top-pick empty container handlers. The terminal has a total of 445 acres with 273
acres for CY storage. Maher operates eight container berths with a total berth length of 10,128
feet. Maher is operated by Maher Terminals, LLC. The terminal shares operation of ExpressRail
Port Elizabeth with APM. The facility is totally grounded and chassis are stored in a nearby
depot. Empty containers are permitted on the terminal only with repositioning bookings.

Page 35
Tioga
Exhibit 41: Maher Terminal
Profle date: February 15, 2010 2008 TEU:
Port: Port Elizabeth Total Acres: 445
Terminal: Maher CY Acres: 273
Terminal Type: Straddle/Top-pick On-Dock Rail Acres: 41
1020 N. Fleet St. Other Non-CY Acres: 72
Elizabeth, NJ 07201 Net Terminal Acres: 332
Operator (Stevedore): Maher Terminals, Inc. Berths: 8
Contact Name: Total Berth Length: 10,128
Telephone Number: (908) 527-8200 Channel Depth (MLLW): 50
Fax Number: (908) 354-4874 Berth Depth (MLLW): 50
E-Mail Address: Panamax Container Cranes: 6
Port Website: http://www.panynj.gov/port/containerized-cargo.htmlPost-Panamax Container Cranes: 9
Terminal Website: www.maherterminals.com CY Rail-Mounted Gantries:
Inbound Gates: 28 CY Rubber-Tired Gantries:
Outbound Gates: 25 CY Side or Top Loaders: Yes
Reversible Gates: CY Straddle Carriers: Yes
Total Gates: 53 CY Reach Stackers: Yes
On-Line Access System: Total CY Lift Machines 0
Appointment System: On-site M&R (yes/no):
Reefer Plugs/Slots: On-dock Rail (yes/no): Yes
Terminal Hours:
Gate Hours:
CONTAINER TERMINAL PROFILE
Address:
Notes: Depth: 45-50 ft. Cranes: 6 Paceco – 30-ton, 2 Paceco Post Panamax – 50-ton. 5 Post Panamax – 60-
ton. Stackers 15-ton, 30-ton, and 5-ton. Toploader – 40-ton. ExpressRail Elizabeth is adjacent. Grounded
operation. Relies on remote empty con
M-F 6am - 10pm
APM Elizabeth Marine Terminal (Exhibit 42) is a dedicated container terminal using a
combination of RTG, top-pick and wheeled storage. The terminal has a total of 350 acres with
192 acres for CY storage. APM Elizabeth operates five container berths with a total berth length
of 6,001 feet. APM Elizabeth is operated by APM Terminals. The terminal shares operation of
ExpressRail Port Elizabeth with Maher.

Page 36
Tioga
Exhibit 42: APM Elizabeth Marine Terminal
Profle date: February 15, 2010 2008 TEU:
Port: Port Elizabeth Total Acres: 350
Terminal: APM CY Acres: 192
Terminal Type: RTG/Top-pick/Wheeled On-Dock Rail Acres: 0
5080 Lester St. Other Non-CY Acres: 61
Elizabeth, NJ 07207 Net Terminal Acres: 289
Operator (Stevedore): APM Terminals Berths: 5
Contact Name: Total Berth Length: 6,001
Telephone Number: 908-558-6000 Channel Depth (MLLW): 45
Fax Number: 908- 558-6481 Berth Depth (MLLW): 50
E-Mail Address: Panamax Container Cranes: 3
Port Website: http://www.panynj.gov/port/containerized-cargo.htmlPost-Panamax Container Cranes: 12
Terminal Website: www.apmterminals.com CY Rail-Mounted Gantries:
Inbound Gates: 19 CY Rubber-Tired Gantries: 32
Outbound Gates: 9 CY Side or Top Loaders: 23
Reversible Gates: 3 CY Straddle Carriers:
Total Gates: 31 CY Reach Stackers: 8
On-Line Access System: Navis Express and Navis Sparcs Total CY Lift Machines 63
Appointment System: On-site M&R (yes/no):
Reefer Plugs/Slots: 1968 On-dock Rail (yes/no): yes
Terminal Hours:
Gate Hours:
CONTAINER TERMINAL PROFILE
Address:
(Diagram)
Notes: Navis Express gate system. Navis Sparcs computerized stowage and yard operations system. 3 berths
@ 50 ft. others at 45 ft. 15 ship-to-shore cranes, 6 Paceco – 30-ton, 2 Paceco Post-Panamax – 50-ton, 4 ZPMC
Post-Panamax-50 ton. Adjacent to Ex
0600-2200 M-F
New York Container Terminal (NYCT) (Exhibit 43) is a dedicated container terminal using a
combination of top-pick and wheeled storage. The terminal has a total of 187 acres with 85 acres
for CY storage. NYCT operates three container berths with a total berth length of 3,012 feet.
NYCT is operated by New York Container Terminal, Inc. The terminal operates ExpressRail
Staten Island.

Page 37
Tioga
Exhibit 43: New York Container Terminal
Profle date: February 15, 2010 2008 TEU:
Port: New York Total Acres: 187
Terminal: New York Container Terminal CY Acres: 85
Terminal Type: Top-pick/Wheeled On-Dock Rail Acres: 0
300 Western Ave. Other Non-CY Acres: 20
Staten Island, NY 10303 Net Terminal Acres: 167
Operator (Stevedore):New York Container Terminal,
Inc.Berths: 3
Contact Name: Total Berth Length: 3,012
Telephone Number: (718) 273-7000 Channel Depth (MLLW): 35
Fax Number: (718) 273-7050 Berth Depth (MLLW): 45
E-Mail Address: Panamax Container Cranes: 5
Port Website: http://www.panynj.gov/port/containerized-cargo.htmlPost-Panamax Container Cranes: 4
Terminal Website: www.nycterminal.com CY Rail-Mounted Gantries:
Inbound Gates: 12 CY Rubber-Tired Gantries:
Outbound Gates: 8 CY Side or Top Loaders: 32
Reversible Gates: CY Straddle Carriers:
Total Gates: 20 CY Reach Stackers:
On-Line Access System: Total CY Lift Machines 32
Appointment System: On-site M&R (yes/no): Yes
Reefer Plugs/Slots: 477 On-dock Rail (yes/no): Yes
Terminal Hours:
Gate Hours:
CONTAINER TERMINAL PROFILE
Address:
Notes: Entrance Gates: North Washington Ave & Western Ave. 4 IHI- 40-ton, 4 Liebher Cranes, 2 Paceco- 45
Ðton. Berths: 42 ft. for 2,300 feet of berth; 37 ft. for 700 feet of berth. 22 full container handlers; 9 empty container
handlers. Adjacent 37 a
Monday - Friday: 6:00am - 4:00pm
Container Yard Storage Capacity
Exhibit 44 summarizes land use at the Port of New York and New Jersey. The combined acreage
of the container terminals is 1,338 acres. The net terminal area is 1,062 acres with 783 acres of
CY, yielding a CY/Gross ratio of 59%. The container acreage areas were estimated from the
aerial photos. As Exhibit 37 shows these legacy terminals have a significant amount of non-CY

Page 38
Tioga
acreage. While most have been periodically reorganized and rationalized, they do not have the
“clean sheet of paper” configurations of the most modern terminals (e.g. APM Portsmouth or the
Mobile Container Terminal). As anticipated, Red Hook, which is a mixed use terminal, has the
lowest CY/Gross ratio.
Exhibit 44: Port of New York and New Jersey Land Use
Port Land Use Red Hook Global PNCT Maher APM NYCT Port Total
Gross Acres 80 100 176 445 350 187 1,338
CY Acres 30 64 139 273 192 85 783
Rail Acres - - - - - - -
Other Non-CY Acres 26 15 41 72 61 20 235
Net Berth/Gate/Yard Acres 54 85 135 332 289 167 1,062
CY/Gross Ratio 38% 64% 79% 61% 55% 45% 59%
Exhibit 45 applies standard CY storage factors to the port acreage from Exhibit 44. Applying
standard CY storage factors yields an estimated combined total of 125,320 TEU slots for the six
terminals. Annual sustainable CY TEU capacity is estimated to be 7.0 million TEU producing
annual utilization of 75% relative to 2008 volume of 5.2 million TEU.
Exhibit 45: Port of New York and New Jersey Near Term CY Storage Capacity
Container Yard Capacity Red Hook Global PNCT Maher APM NYCT Port Total
Wheeled Chassis Slots - 2,000 6,160 800 8,160 960 18,080
Grounded Straddle Carrier Slots - - 8,960 37,280 - - 46,240
Grounded Stacked Slots 6,000 3,000 1,200 6,000 8,000 14,600 38,800
Grounded RTG Slots - 7,200 - - 15,000 - 22,200
Grounded RMG Slots - - - - - - -
TEU Storage Slots 6,000 12,200 16,320 44,080 31,160 15,560 125,320
Avg TEU Slots/CY Acre 200 191 117 161 162 183 160
Maximum Annual Slot Turnover 70.0 70.0 71.0 72.0 73.0 70.0 70.0
Maximum Annual CY TEU Capacity 420,000 854,000 1,158,720 3,173,760 2,274,680 1,089,200 8,772,400
Sustainable CY TEU Capacity @ 80% 336,000 683,200 926,976 2,539,008 1,819,744 871,360 7,017,920
2008 Annual TEU - - - - - - 5,265,058
2008 TEU per CY Slot - - - - - - 42
2008 CY Capacity Utilization 75%
At this level of utilization spot shortages of CY capacity have occurred as trade ebbs and flows
and as carriers and business volume shifts between terminals. Maher established and has
maintained use of auxiliary chassis and empty container yards through the downturn. PNCT
gained a large new customer in late 2009 that created a demand for CY space that it was unable
to meet without adding an outside CY. Cargo is constantly being redistributed among the
terminals.
The use of off-terminal land to store chassis and empty containers at PANYNJ is a likely
harbinger of developments to come at other ports. in addition Maersk, the major tenant at APM
Terminals, has converted its carrier-provided chassis pool to a per-diem pool that can be used for
non-Maersk containers. These developments probably signal the start of a shift between the US-
only practice of carrier chassis supply via on-terminal fleets to trucker-supplied chassis, as is the
practice everywhere else. Moving chassis pools out of the terminals will increase throughput
capacity.
Crane Capacity
Exhibit 46 summarizes the Port of New York and New Jersey container cranes and their
estimated capacity. A total of 58 container cranes operate at the six PANYNJ container

Page 39
Tioga
terminals. Panamax cranes are gradually being replaced and supplemented with Post-Panamax
and Super Post-Panamax varieties. Red Hook is the only terminal that does not have Post -
Panamax cranes. Annual crane capacity for the port is estimated to be 14.6 million TEU with
2008 utilization estimated at 36%.
Exhibit 46: Port of New York and New Jersey Near-term Crane Capacity
Crane Capacity Red Hook Global PNCT Maher APM NYCT Port Total
Cranes 4 6 9 15 15 9 58
Available Crane Hours per Day 16 16 16 16 16 16 16
Current Annual Operating Days 250 250 250 250 250 250 250
Current Annual Hours/Crane 4,000 4,000 4,000 4,000 4,000 4,000 4,000
Annual Available Crane Hours 16,000 24,000 36,000 60,000 60,000 36,000 232,000
Sustainable Hours @ 80% 12,800 19,200 28,800 48,000 48,000 28,800 185,600
Avg. TEU/Available Crane-hour - - - - - - 28.4
Avg. Annual TEU/Crane - - - - - - 90,777
Crane Capacity, Moves/hour 35 35 35 35 35 35 35
Sustainable Moves/Hr @ 80% 28 28 28 28 28 28 28
Port average TEU/container 1.80 1.80 1.80 1.80 1.80 1.80 1.80
Crane Capacity TEU/hour 63 63 63 63 63 63 63
Annual Crane Capacity 1,008,000 1,512,000 2,268,000 3,780,000 3,780,000 2,268,000 14,616,000
Current Annual TEU - - - - - - 5,265,058
Current Crane Utilization 36%
As at other ports, the number of cranes is dictated by the need to unload and load vessels on
schedule, so crane utilization is effectively sacrificed in favor of vessel utilization.
Berth Capacity
The Port of New York and New Jersey’s berth capacity estimated in TEU for the maximum
vessel size is summarized in Exhibit 47 . This estimate generates near term berth capacity of 22.4
million TEU and berth utilization of 24%.
Exhibit 47: Port of New York and New Jersey Near Term Berth Capacity Maximum Vessel Basis
Berth Capacity - Max Vessel Basis Red Hook Global PNCT Maher APM NYCT Port Total
Berths 2 2 6 8 5 3 26
Berth length 2,080 1,800 4,400 10,128 6,001 3,012 27,421
Berth Depth - Feet 42 43 50 50 45 35 50
Max Sailing Draft 39 40 47 47 42 32 47
Corresponding Design Draft @ 95% 41 42 49 49 44 34 49
Corresponding DWT 50,280 54,506 91,137 91,137 63,678 26,763 91,137
Nominal Max Vessel TEU 4,067 4,419 7,470 7,470 5,183 2,108 7,470
Corresponding Vessel Length - Feet 900 900 1,000 1,000 900 700 1,000
Vessel Spacing (Beam) 105 105 120 120 105 90 120
Length requirement 1,005 1,005 1,120 1,120 1,005 790 1,120
Available Berths for Max Vessel 2.0 2.0 4.0 9.0 6.0 4.0 27.0
Port average TEU/container 1.72 1.72 1.72 1.72 1.72 1.72 1.72
2007 TEU 5,299,105
Avg. TEU/Vessel 2,079
Avg. Vessel DWT 48,220
Average Est. Vessel Capacity TEU 3,895
Average Discharge & Load % 53%
Average TEU per Max Vessel 3,987
Max annual calls per berth 260
Sustainable Calls per berth @ 80% 208
Total Sustainable Vessel Calls 5,616
Annual Berth Capacity TEU 22,390,305
2008 Annual TEU - - - - - - 5,265,058
Berth Utilization, Max Vessel Basis 24%

Page 40
Tioga
The PANYNJ average vessel discharge/load ratio of 53% is substantially higher than at Boston,
with which PANYNJ competes.
Berth capacity based on vessel calls is summarized in Ex ___. This approach generates a berth
capacity estimate of 7020 vessel calls and 2007 port berth utilization of 36% Exhibit 48.
Exhibit 48: Port of New York and New Jersey Berth Capacity Vessel Call Basis
Berth Utilization - Vessel Call Basis Red Hook Global PNCT Maher APM NYCT Port Total
Est. Sustainable Calls per berth 5 / wk 260 260 260 260 260 260 260
Available Berths 2 2 4 9 6 4 27
Sustainable Calls per berth @ 80% 208 208 208 208 208 208 208
Total Sustainable Vessel Calls 416 416 832 1,872 1,248 832 5,616
2007 Vessel calls 2549
2007 Berth Utilization 45%
Capacity and Productivity Summary
Exhibit 49 summarizes the capacity and productivity analysis for CY space, container cranes,
and vessel berths for the Port of New York and New Jersey. The port currently has estimated
sustainable CY capacity of 8.8 million TEU with utilization at 75%. Current crane capacity for
the port’s 58 cranes is estimated to be 14.6 million TEU with utilization of 36%. Berth capacity
utilization on a vessel call basis is estimated to be 36%. On a TEU basis berth capacity is
estimated to be 4.4 million TEU with utilization of 24%.
Overall this analysis indicates that the Port of New York and New Jersey is potentially land
constrained, that spot shortages of CY space have been experienced, and that management
measures are being taken to both densify container yard storage and move non-essential features
off the main marine terminal. Capacity exists for growth in both crane and berth capacity.

Page 41
Tioga
Exhibit 49: Port of New York and New Jersey Near Term Capacity and Productivity Summary
Terminal Space Red Hook Global PNCT Maher APM NYCT NYNJ
2008 TEU 0 0 0 0 0 0 5,265,058
Gross Acres 80 100 176 445 350 187 1,338CY Acres 30 64 139 273 192 85 783CY/Gross Ratio 38% 64% 79% 61% 55% 45% 59%Annual CY Capacity - TEU 420,000 854,000 1,158,720 3,173,760 2,274,680 1,089,200 8,772,400 Annual TEU/Gross Acre - - - - - - 3,935 Annual TEU/CY Acre - - - - - - 6,724 Est. CY TEU Slots 6,000 12,200 16,320 44,080 31,160 15,560 125,320 Avg. CY Slots/ Acre - Density 200 191 117 161 162 183 160 Avg. Annual TEU/CY Slot (Turns) - - - - - - 42 CY Utilization 75%
Container Cranes Red Hook Global PNCT Maher APM NYCT NYNJ
Cranes 4 6 9 15 15 9 58
Cranes per Berth 2.0 3.0 1.5 1.9 3.0 3.0 2.2
Annual Crane Capacity - TEU 1,008,000 1,512,000 2,268,000 3,780,000 3,780,000 2,268,000 14,616,000
Avg. Moves/Available Crane-Hour - - - - - - 28.4
Annual TEU/Crane - - - - - - 90,777
Annual Moves/Crane - - - - - - 50,432
Annual Vessel Calls/Crane (2007) - - - - - 44
Crane Utilization 36%
Berths and Vessels Red Hook Global PNCT Maher APM NYCT NYNJ
Berths 2 2 6 8 5 3 26
Berth Feet 2,080 1,800 4,400 10,128 6,001 3,012 27,421
Annual Vessel Calls per Berth (2007) - - - - - - 98
Berth Utilization - Vessel Call Basis 45%
Annual TEU per Berth - - - - - - 202,502
Annual TEU/Foot of Berth - - - - - - 192
Average Vessel Capacity - TEU - - - - - - 3,895
Est. Max. Vessel Capacity - TEU 4,067 4,419 7,470 7,470 5,183 2,108 7,470
Avg. vs. Max. Vessel Capacity 0% 0% 0% 0% 0% 0% 52%
Average TEU per Vessel (2007) - - - - - - 2,079
Avg. Vessel Utilization - % Discharge/Load 53%
Berth Capacity - Avg. Vessel Basis - - - - - - 11,675,078
Berth Utilization - Avg. Vessel Basis 45%
Avg. Discharge/Load per Max. Vessel 3,987
Berth Capacity - Max. Vessel Basis 22,390,305
Berth Utilization - Max. Vessel Basis 24%
Delaware River Ports
Overview
Because MARAD combines all ship call information for all ports on the Delaware River, this
estimate covers both the Port of Philadelphia and the Port of Wilmington, Delaware. Both
terminals handle frozen and refrigerated goods and have temperature and atmosphere controlled
on dock warehouses. Packer Terminal at Philadelphia handles steel and project cargo and has a
ro-ro berth. Wilmington’s largest customers are Dole and Chiquita and the terminal is the largest
banana port in the world.
Packer Marine Terminal (Exhibit 50) is a mixed use, legacy complex of container, Ro-Ro, and
break bulk terminals and berths. The container facilities are operated by Greenwich Terminals,
LLC which is a subsidiary of Holt Logistics. The Packer terminal has a total of 112 acres for all
of its operations. The container portion of the terminal is estimated to be 68 acres with 51 acres
of CY space. The Packer terminal operates 5 berths for all of its operations with a total berth
length of 3,800 feet.

Page 42
Tioga
Exhibit 50: Packer Marine Terminal
Profle date: Sept. 27, 2009 2008 TEU: 255994
Port: Philadelphia Total Acres: 112
Terminal: Packer Ave. CY Acres: 51
Terminal Type: Top-pick/Wheeled On-Dock Rail Acres: 0
3301 S. Columbus Blvd. Other Non-CY Acres: 17
Philadelphia, PA 19148 Net Terminal Acres: 68
Operator (Stevedore): Greenwich Terminals. LLC Berths: 5
Contact Name: Total Berth Length: 3,800
Telephone Number: (215) 923-5000 Channel Depth (MLLW): 40
Fax Number: Berth Depth (MLLW): 40
E-Mail Address: Panamax Container Cranes: 7
Port Website: www.philaport.com Post-Panamax Container Cranes:
Terminal Website: www.holtlogistics.com CY Rail-Mounted Gantries:
Inbound Gates: 8 CY Rubber-Tired Gantries:
Outbound Gates: 3 CY Side or Top Loaders: 13
Reversible Gates: CY Straddle Carriers:
Total Gates: 11 CY Reach Stackers: 8
On-Line Access System: Total CY Lift Machines 21
Appointment System: On-site M&R (yes/no):
Reefer Plugs/Slots: 1,350 On-dock Rail (yes/no): No
Terminal Hours:
Gate Hours:
CONTAINER TERMINAL PROFILE
Address:
Notes: Separate gate for breakbulk cargo. 6 berths, 1 RO/RO. Cranes: 2 Hyundai container cranes (65 T) (Twin
lift capable), 1 Kocks container crane: 375 tons (340.1 metric tons), 3 Kocks container cranes: 45 tons each (40.8
metric to), 1 Paceco container crane

Page 43
Tioga
Exhibit 51 is an aerial view of Packer Marine Terminal.
Exhibit 51: Packer Marine Terminal, Philadelphia
Source: Google Earth Image Date July 4, 2007
Wilmington Marine Terminal (Exhibit 52) is a mixed-use marine terminal complex for
container, Ro-Ro, and break bulk cargo. The terminal is owned by the state and operated by
Delaware River Stevedores, Inc. The Wilmington terminal has a total of 308 acres for all of its
operations. The container portion of the terminal is estimated to be 83 acres with 59 acres of CY
space. The Wilmington terminal operates 2 berths for its container operations with a total berth
length of 1,500 feet.
The terminal also handles palletized fruit, beef, automobiles, and dry bulk, such as petroleum-
coke, road salt, and magnetite. The Port facilities include seven deepwater general cargo berths,
a tanker berth, a floating berth for Ro-Ro vessels on the Christina River, and an auto and Ro-Ro
berth on the Delaware River.
Containerized handling equipment includes two multi-purpose gantry cranes, each with 50-ton
capacity.

Page 44
Tioga
Exhibit 52 Wilmington Marine Terminal
Profle date: April 8, 2010 2008 TEU: 267684
Port: Delaware Bay Total Acres: 308
Terminal: Wilmington CY Acres: 69
Terminal Type: Top-pick/Wheeled On-Dock Rail Acres: 0
1 Hausel Road Other Non-CY Acres: 14
Wilmington, DE 19801-5852 Net Terminal Acres: 83
Operator (Stevedore): Delaware River Stevedores Berths: 2
Contact Name: Total Berth Length: 1,500
Telephone Number: (302) 472-7678 Channel Depth (MLLW): 38
Fax Number: Berth Depth (MLLW): 38
E-Mail Address: Panamax Container Cranes: 2
Port Website: http://www.portofwilmington.com/ Post-Panamax Container Cranes: 0
Terminal Website: http://www.d-r-s.com/wilmington.htmlCY Rail-Mounted Gantries:
Inbound Gates: CY Rubber-Tired Gantries:
Outbound Gates: CY Side or Top Loaders:
Reversible Gates: 14 CY Straddle Carriers:
Total Gates: 14 CY Reach Stackers:
On-Line Access System: Total CY Lift Machines
Appointment System: On-site M&R (yes/no): Yes
Reefer Plugs/Slots: Temprature and Atmosphere On-dock Rail (yes/no): No
Terminal Hours:
Gate Hours:
CONTAINER TERMINAL PROFILE
Address:

Page 45
Tioga
Exhibit 53 is an aerial view of the Wilmington marine terminal.
Exhibit 53: Wilmington Marine Terminal, Wilmington, DE
Source: Google Earth Image Date August 6, 2009
Container Yard Storage Capacity
Exhibit 54 summarizes land use at the Delaware River container ports. The combined acreage of
the Packer container terminal and the Wilmington container terminal areas is 420 acres. The CY
area is 120 acres creating net land use of 29%. Both terminals, but particularly Wilmington, are
mixed use facilities.
Exhibit 54: Delaware River Ports Land Use
Port Land Use Packer Wilmington Port Total
Gross Acres 112 308 420
CY Acres 51 69 120
Rail Acres - - -
Other Non-CY Acres 17 14 31
Net Berth/Gate/Yard Acres 68 83 151
CYGross Ratio 46% 22% 29%
Exhibit 55 applies standard CY storage factors to the port acreage from Exhibit 63. Based on
interpretation of aerial photos, Packer is about 12% wheeled and 88% grounded with top-picks.
Wilmington’s CY is currently 100% wheeled. Applying these percentages to the standard CY
storage factors yields an estimated combined total of 15,000 TEU slots for the two terminals.
Annual CY sustainable TEU capacity is estimated to be 1.1 million TEU producing annual
utilization of 68% relative to 2008 volume of 575,000 TEU.

Page 46
Tioga
Exhibit 55: Delaware River Ports Near Term CY Storage Capacity
Container Yard Capacity Packer Wilmington Port Total
Wheeled Chassis Slots 480 5,520 6,000
Grounded Straddle Carrier Slots - - -
Grounded Stacked Slots 9,000 - 9,000
Grounded RTG Slots - - -
Grounded RMG Slots - - -
TEU Storage Slots 9,480 5,520 15,000
Avg TEU Slots/CY Acre 186 80 125
Maximum Annual Slot Turnover 70.0 70.0 70.0
Maximum Annual CY TEU Capacity 663,600 386,400 1,050,000
Sustainable CY TEU Capacity @ 80% 530,880 309,120 840,000
2008 Annual TEU 307,192 267,684 574,876
2008 TEU per CY Slot 32 48 38
2008 CY Capacity Utilization 58% 87% 68%
Crane Capacity
Exhibit 56 summarizes the Delaware River Ports container cranes and their estimated capacity.
Eight Panamax container cranes operate at the two terminals. Annual crane capacity for the port
is estimated to be 2.0 million TEU with 2008 utilization at 29%. Both Packer and Wilmington
have additional cranes for heavy lifting.
Exhibit 56: Delaware River Ports Near-term Crane Capacity
Crane Capacity Packer Wilmington Port Total
Cranes 6 2 8
Available Crane Hours per Day 16 16 16
Current Annual Operating Days 250 250 250
Current Annual Hours/Crane 4,000 4,000 4,000
Annual Available Crane Hours 24,000 8,000 32,000
Sustainable Hours @ 80% 19,200 6,400 25,600
Avg. TEU/Available Crane-hour 16.0 41.8 22.5
Avg. Annual TEU/Crane 51,199 133,842 71,860
Crane Capacity, Moves/hour 35 35 35
Sustainable Moves/Hr @ 80% 28 28 28
Port average TEU/container 1.80 2.00 1.80
Crane Capacity TEU/hour 63 70 63
Annual Crane Capacity 1,512,000 560,000 2,016,000
Current Annual TEU 307,192 267,684 574,876
Current Crane Utilization 20% 48% 29%
Berth Capacity
The Delaware River Ports’ container berth capacity estimated in TEU for the maximum vessel
size is summarized in Exhibit 57. This estimate generates near-term berth capacity of 2.0 million
TEU and berth utilization of 29%. Berth capacity based on vessel calls is summarized in Exhibit
57. This approach generates a berth capacity estimate of 2600 vessel calls and 2007 port berth
utilization of 32%.

Page 47
Tioga
Exhibit 57: Delaware River Ports Near Term Berth Capacity Maximum Vessel Basis
Berth Capacity - Max Vessel Basis Packer Wilmington Port Total
Berths 5 2 8
Berth length 3,800 1,500 5,300
Berth Depth - Feet 40 38 40
Max Sailing Draft 37 35 37
Corresponding Design Draft @ 95% 39 37 39
Corresponding DWT 42,512 40,000 42,512
Nominal Max Vessel TEU 3,420 3,210 3,420
Corresponding Vessel Length - Feet 800 800 800
Vessel Spacing (Beam) 105 105 105
Length requirement 905 905 905
Available Berths for Max Vessel 4.0 2.0 6.0
Port average TEU/container 1.80 2.00 1.90
2007 TEU 287,552 284,352 571,904
Avg. TEU/Vessel 1,146
Avg. Vessel DWT 31,250
Average Est. Vessel Capacity TEU 2,482
Average Discharge & Load % 46%
Average TEU per Max Vessel 1,579
Max annual calls per berth 260
Sustainable Calls per berth @ 80% 208
Total Sustainable Vessel Calls 1,248
Annual Berth Capacity TEU - - 1,971,103
2008 Annual TEU 307,192 267,684 574,876
Berth Utilization, Max Vessel Basis 29%
The maximum vessel size for Philadelphia and Wilmington is constrained by channel and berth
depth. The proposed Delaware River dredging project has been repeatedly delayed and is now
being held up by a dispute between the States of Pennsylvania and New Jersey. If eventually
completed, the project would provide a 45-foot channel to the Packer and Wilmington
Terminals. The deeper channel would raise the maximum vessel size to an estimated 5,183
TEU, and increase long-term berth capacity to roughly 3 million TEU.
Exhibit 58: Delaware River Ports Berth Capacity Vessel Call Basis
Berth Utilization - Vessel Call Basis Packer Wilmington Port Total
Max annual calls per berth 260 260 260
Sustainable Calls per berth @ 80% 208 208 208
Available Berths 4 2 6
Total Sustainable Vessel Calls 832 416 1,248
2007 Vessel calls 499
2007 Berth Utilization 40%
Capacity and Productivity Summary
Exhibit 59 summarizes the capacity and productivity analysis for CY space, container cranes,
and vessel berths for the Delaware River Container Ports. The port region currently has
estimated sustainable CY capacity of 840,000 TEU with utilization at 68%. Current crane

Page 48
Tioga
capacity for the port’s 16 cranes is estimated to be 2.0 million TEU with utilization of 29%.
Berth capacity utilization on a vessel call basis is estimated to be 32%. On a TEU basis berth
capacity is estimated to be 2.0 million TEU with utilization of 29%. Overall this analysis
indicates that the Delaware River Ports have adequate capacity to handle future growth.
Exhibit 59: Delaware River Ports Near Term Capacity and Productivity Summary
Terminal Space Packer Wilmington Delaware River
2008 TEU 307,192 267,684 574,876
Gross Acres 112 308 420
CY Acres 51 69 120
CY/Gross Ratio 46% 22% 29%
Annual CY Capacity - TEU 530,880 309,120 840,000
Annual TEU/Gross Acre 2,743 869 1,369
Annual TEU/CY Acre 6,023 3,879 4,791
Est. CY TEU Slots 9,480 5,520 15,000
Avg. CY Slots/ Acre - Density 186 80 125
Avg. Annual TEU/CY Slot (Turns) 32 48 38
CY Utilization 58% 87% 68%
Container Cranes Packer Wilmington Delaware River
Cranes 6 2 8
Cranes per Berth 1.5 1.0 1.6
Annual Crane Capacity - TEU 1,512,000 560,000 2,016,000
Avg. Moves/Available Crane-Hour 16.0 41.8 22.5
Annual TEU/Crane 51,199 133,842 71,860
Annual Moves/Crane 28,444 66,921 39,922
Annual Vessel Calls/Crane (2007) 62
Crane Utilization 20% 48% 29%
Berths and Vessels Packer Wilmington Delaware River
Berths 4 2 5
Berth Feet 3,800 1,500 5,300
Annual Vessel Calls per Berth (2007) 62
Berth Utilization - Vessel Call Basis 30%
Annual TEU per Berth 76,798 133,842 114,975
Annual TEU/Foot of Berth 81 178 108
Average Vessel Capacity - TEU 2,482
Est. Max. Vessel Capacity - TEU 3,420 3,210 3,420
Avg. vs. Max. Vessel Capacity 73%
Average TEU per Vessel (2007) 1,146
Avg. Vessel Utilization - % Discharge/Load 46%
Berth Capacity - Avg. Vessel Basis 1,430,333
Berth Utilization - Avg. Vessel Basis 40%
Avg. Discharge/Load per Max. Vessel 1,579
Berth Capacity - Max. Vessel Basis 1,971,103
Berth Utilization - Max. Vessel Basis 29%
Like the Port of Boston, the Port of Philadelphia competes with the PANYNJ. Some ocean
carriers currently offer Philadelphia bills of lading via truck service to and from PANYNJ.
Philadelphia’s market share thus appears to have been reduced by a variation on load centering.

Page 49
Tioga
Port of Baltimore
Overview
The Port of Baltimore has two container terminals owned by the Maryland Port Administration.
The Seagirt Marine Terminal is a dedicated container terminal and the Dundalk Marine terminal
is a mixed-use port facility. Exhibit 60 is an aerial view of the port with the container operating
areas outlined in red.
Exhibit 60: Port of Baltimore
Source: Google Earth Image Date February 28, 2007
Dundalk (Exhibit 61) is a legacy complex of container, Ro-Ro, and break bulk terminals and
berths. The container facilities are operated by Ports America and Ceres stevedoring companies.
Unlike most dedicated container terminals there is no exclusive relationship between gates,
container yard, berths, and cranes. The Dundalk terminal has a total of 570 acres for all of its
operations. However, the container portion of the terminal is estimated to be 202 acres with 94
acres of CY space. The Dundalk terminal operates 7 berths for all of its operations with a total
berth length of 5,692 feet.
Seagirt (Exhibit 62) is a dedicated container terminal using a combination of RTG, top-pick, and
wheeled storage. The terminal has a total of 256 acres with 134 acres for CY storage. The
terminal acreage also includes a 66 acre on dock rail intermodal terminal which is operated by
CSX. Seagirt operates three container berths with a total berth length of 3,127 feet. The Seagirt
terminal was leased to Ports America Chesapeake in a 50-year concession agreement in January
of 2010. One of the provisions of the agreement is that Ports America has agreed to construct a
new 50-foot draft berth at Seagirt.

Page 50
Tioga
Exhibit 61: Dundalk Marine Terminal
Profle date: Sept. 27, 2009 2008 TEU: 144,000
Port: Baltimore, Maryland Total Acres: 202
Terminal: Dundalk Marine Terminal CY Acres: 94
Terminal Type: Container, RoRo & Breakbulk On-Dock Rail Acres: NA
2700 Broening Highway Other Non-CY Acres: 108
Baltimore, MD 21222 Net Terminal Acres: 94
Operator (Stevedore): Ports America (410-282-4260) Berths: 7
Contact Name: Total Berth Length: 5,692
Telephone Number: 410-633-1043 Channel Depth (MLLW): 42' & 38'
Fax Number: 410-633-3273 Berth Depth (MLLW): 42'
E-Mail Address: Panamax Container Cranes: 9
Port Website: www.marylandports.com Post-Panamax Container Cranes:
Terminal Website: www.portsamerica.com CY Rail-Mounted Gantries:
Inbound Gates: 5 container, 4 non container CY Rubber-Tired Gantries:
Outbound Gates: 3 CY Side or Top Loaders:
Reversible Gates: CY Straddle Carriers:
Total Gates: 12 CY Reach Stackers:
On-Line Access System: eModal & Navis Total CY Lift Machines 0
Appointment System: no On-site M&R (yes/no):
Reefer Plugs/Slots: 142 On-dock Rail (yes/no): No
Terminal Hours:
Gate Hours:
CONTAINER TERMINAL PROFILE
Address:
(Diagram)
Notes: 570 acres includes container, general cargo and automobile facilities. 94 acres of container storage. Seagirt ICTF
operated by CSX is adjacent to Dundalk, Norfolk Southern Baltimore terminal about 4 miles. Dundalk and Seagirt terminals
are connected by internal connector bridge.
Mon – Fri 0700-1600
Mon – Fri 0630-1800

Page 51
Tioga
Exhibit 62: Seagirt Marine Terminal
Profle date: Sept. 27, 2009 2008 TEU: 469,000
Port: Maryland Total Acres: 256
Terminal: Seagirt Marine, Baltimore CY Acres: 134
Terminal Type: Container Terminal On-Dock Rail Acres: 66
2600 Broening Highway Other Non-CY Acres: 56
Baltimore, MD 21224 Net Terminal Acres: 190
Operator (Stevedore): Ports America (410-288-8602) Berths: 3
Contact Name: Total Berth Length: 3,127
Telephone Number: 410-288-8602 Channel Depth (MLLW): 50'
Fax Number: 410-288-8649 Berth Depth (MLLW): 42'
E-Mail Address: Panamax Container Cranes:
Port Website: www.marylandports.com Post-Panamax Container Cranes: 7
Terminal Website: www.portsamerica.com CY Rail-Mounted Gantries:
Inbound Gates: 9 CY Rubber-Tired Gantries: 12
Outbound Gates: 5 CY Side or Top Loaders:
Reversible Gates: CY Straddle Carriers:
Total Gates: 14 CY Reach Stackers:
On-Line Access System: eModal & Navis Total CY Lift Machines 12
Appointment System: no On-site M&R (yes/no): no
Reefer Plugs/Slots: 192 On-dock Rail (yes/no): yes
Terminal Hours:
Gate Hours:
CONTAINER TERMINAL PROFILE
Address:
(Diagram)
Notes: Seagirt near dock terminal operated by CSX is contiguous to the marine terminal, Norfolk Southern Baltimore
terminal 3-4 miles. Dundalk and Seagirt terminals are connected by internal connector bridge.
Mon – Fri 0700-1700

Page 52
Tioga
Container Yard Storage Capacity
Exhibit 63 summarizes the land use at the Port of Baltimore. The combined acreage of the
Seagirt container terminal and the Dundalk container terminal areas is 458 acres. The CY
terminal area is 336 acres creating a CY/gross ratio of 73%. The container acreage areas for
Dundalk were estimated from the aerial photos. Only the estimated container areas for the
Dundalk terminal were considered in this analysis. The inclusion of 66 acres of rail intermodal
operations within Seagirt lowers the net/gross ratio.
Exhibit 63: Port of Baltimore Land Use
Port Land Use Seagirt Dundalk Port Total
Gross Acres 256 202 458
CY Acres 134 94 228
Rail Acres 66 - 66
Other Non-CY Acres 56 108 164
Net Berth/Gate/Yard Acres 134 202 336
CY/Gross Ratio 52% 47% 50%
Exhibit 64 applies standard CY storage factors to the port acreage from Exhibit 63. Based on
interpretation of aerial photos, Dundalk is about 31% wheeled and 69% grounded with top-picks.
Seagirt’s CY is currently 15% wheeled, 49% grounded with top-picks, and 36% grounded with
RTGs. Applying these percentages to the standard CY storage factors yields an estimated
combined total of 47,040 TEU slots for the two terminals. Annual CY sustainable TEU capacity
is estimated to be 2.6 million TEU producing annual utilization of 23% relative to 2008 volume
of 613,000 TEU.
Exhibit 64: Port of Baltimore Near Term CY Storage Capacity
Container Yard Capacity Seagirt Dundalk Port Total
Wheeled Chassis Slots 1,280 2,160 3,440
Grounded Straddle Carrier Slots - - -
Grounded Stacked Slots 10,400 13,400 23,800
Grounded RTG Slots 19,800 - 19,800
Grounded RMG Slots - - -
TEU Storage Slots 31,480 15,560 47,040
Avg TEU Slots/CY Acre 235 166 206
Maximum Annual Slot Turnover 70.0 70.0 70.0
Maximum Annual CY TEU Capacity 2,203,600 1,089,200 3,292,800
Sustainable CY TEU Capacity @ 80% 1,762,880 871,360 2,634,240
2008 Annual TEU 469,000 144,000 613,000
2008 TEU per CY Slot 15 9 13
2008 CY Capacity Utilization 27% 17% 23%
Crane Capacity
Exhibit 65 summarizes the Port of Baltimore container cranes and their estimated capacity. The
port operates 16 cranes at its two terminals. Seagirt’s modern, dual-hoist, post-Panamax cranes
are exceptionally productive. Dundalk’s Panamax cranes are older, and are not heavily used.
Annual crane capacity for the port is estimated to be 3.5 million TEU with 2008 utilization at
18%. The low port average is due to the underutilized cranes at Dundalk.

Page 53
Tioga
Exhibit 65: Port of Baltimore Near-term Crane Capacity
Crane Capacity Seagirt Dundalk Port Total
Cranes 7 9 16
Available Crane Hours per Day 16 16 16
Current Annual Operating Days 250 250 250
Current Annual Hours/Crane 4,000 4,000 4,000
Annual Available Crane Hours 28,000 36,000 64,000
Sustainable Hours @ 80% 22,400 28,800 51,200
Avg. TEU/Available Crane-hour 20.9 5.0 12.0
Avg. Annual TEU/Crane 67,000 16,000 38,313
Crane Capacity, Moves/hour 35 35 35
Sustainable Moves/Hr @ 80% 28 28 28
Port average TEU/container 1.55 1.55 1.55
Crane Capacity TEU/hour 54 54 54
Annual Crane Capacity 1,518,651 1,952,551 3,471,202
Current Annual TEU 469,000 144,000 613,000
Current Crane Utilization 31% 7% 18%
Berth Capacity
The Port of Baltimore’s berth capacity estimated in TEU for the maximum vessel size is
summarized in Exhibit 66. This estimate generates near term berth capacity of 8.4 million TEU
and berth utilization of 7%. Berth capacity based on vessel calls is summarized in Exhibit 67.
This approach generates a berth capacity estimate of 2600 vessel calls and 2007 port berth
utilization of 16%. It is clear that the berth utilization estimates are somewhat understated
because the Dundalk terminal berths are utilized for more than just container ships.

Page 54
Tioga
Exhibit 66: Port of Baltimore Near Term Berth Capacity Maximum Vessel Basis
Berth Capacity - Max Vessel Basis Seagirt Dundalk Port Total
Berths 3 7 10
Berth length 3,127 5,692 8,819
Berth Depth - Feet 50 42 50
Max Sailing Draft 47 39 47
Corresponding Design Draft @ 95% 49 41 49
Corresponding DWT 91,137 50,280 91,137
Nominal Max Vessel TEU 7,470 4,067 7,470
Corresponding Vessel Length - Feet 1,000 900 1,000
Vessel Spacing (Beam) 120 105 120
Length requirement 1,120 1,005 1,120
Available Berths for Max Vessel 3.0 6.0 9.0
Port average TEU/container 1.55 1.55 1.55
2007 TEU 610,000
Avg. TEU/Vessel 2,346
Avg. Vessel DWT 48,220
Average Est. Vessel Capacity TEU 3,895
Average Discharge & Load % 60%
Average TEU per Max Vessel 4,499 4,499 4,499
Max annual calls per Berth 260 260 260
Sustainable Vessel Calls @ 80% 208 208 208
Total Sustainable Vessel Calls 624 1,248 1,872
Annual Berth Capacity TEU 2,807,639 5,615,278 8,422,918
2008 Annual TEU 469,000 144,000 613,000
Berth Utilization, Max Vessel Basis 17% 3% 7%
Exhibit 67: Port of Baltimore Berth Capacity Vessel Call Basis
Berth Utilization - Vessel Call Basis Seagirt Dundalk Port Total
Max annual calls per Berth 260 260 260
Sustainable Vessel Calls @ 80% 208 208 208
Available Berths 3 7 10
Total Sustainable Vessel Calls 624 1,456 2,080
2007 Vessel Calls 427
2007 Berth Utilization 21%
Capacity and Productivity Summary
Exhibit 68 summarizes the capacity and productivity analysis for CY space, container cranes,
and vessel berths for the Port of Baltimore. The port currently has estimated sustainable CY
capacity of 2.6 million TEU with utilization at 23%. Current crane capacity for the port’s 16
cranes is estimated to be 3.5 million TEU with utilization of 18%. Berth capacity utilization on a
vessel call basis is estimated to be 16%. On a TEU basis berth capacity is estimated to be 4.4
million TEU with utilization of 7%. Overall this analysis indicates that the Port of Baltimore has
adequate capacity to handle future growth.
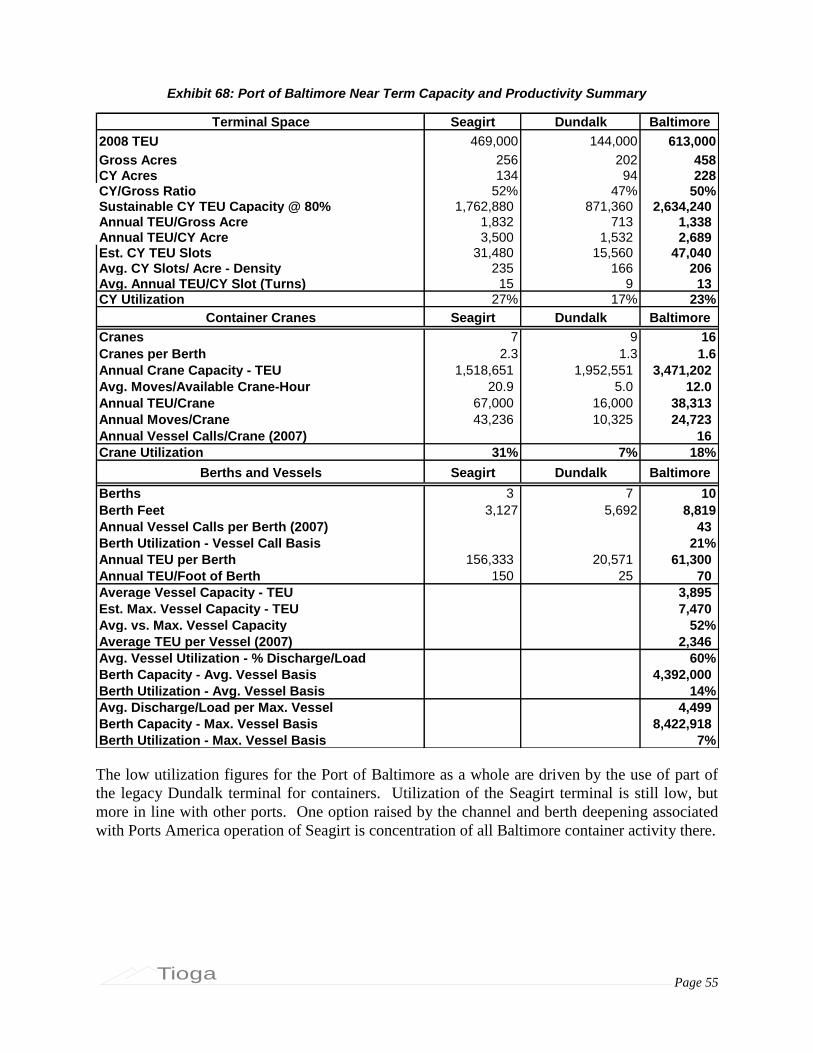
Page 55
Tioga
Exhibit 68: Port of Baltimore Near Term Capacity and Productivity Summary
Terminal Space Seagirt Dundalk Baltimore
2008 TEU 469,000 144,000 613,000
Gross Acres 256 202 458CY Acres 134 94 228CY/Gross Ratio 52% 47% 50%Sustainable CY TEU Capacity @ 80% 1,762,880 871,360 2,634,240 Annual TEU/Gross Acre 1,832 713 1,338 Annual TEU/CY Acre 3,500 1,532 2,689 Est. CY TEU Slots 31,480 15,560 47,040 Avg. CY Slots/ Acre - Density 235 166 206 Avg. Annual TEU/CY Slot (Turns) 15 9 13 CY Utilization 27% 17% 23%
Container Cranes Seagirt Dundalk Baltimore
Cranes 7 9 16
Cranes per Berth 2.3 1.3 1.6
Annual Crane Capacity - TEU 1,518,651 1,952,551 3,471,202
Avg. Moves/Available Crane-Hour 20.9 5.0 12.0
Annual TEU/Crane 67,000 16,000 38,313
Annual Moves/Crane 43,236 10,325 24,723
Annual Vessel Calls/Crane (2007) 16
Crane Utilization 31% 7% 18%
Berths and Vessels Seagirt Dundalk Baltimore
Berths 3 7 10
Berth Feet 3,127 5,692 8,819
Annual Vessel Calls per Berth (2007) 43
Berth Utilization - Vessel Call Basis 21%
Annual TEU per Berth 156,333 20,571 61,300
Annual TEU/Foot of Berth 150 25 70
Average Vessel Capacity - TEU 3,895
Est. Max. Vessel Capacity - TEU 7,470
Avg. vs. Max. Vessel Capacity 52%
Average TEU per Vessel (2007) 2,346
Avg. Vessel Utilization - % Discharge/Load 60%
Berth Capacity - Avg. Vessel Basis 4,392,000
Berth Utilization - Avg. Vessel Basis 14%
Avg. Discharge/Load per Max. Vessel 4,499
Berth Capacity - Max. Vessel Basis 8,422,918
Berth Utilization - Max. Vessel Basis 7%
The low utilization figures for the Port of Baltimore as a whole are driven by the use of part of
the legacy Dundalk terminal for containers. Utilization of the Seagirt terminal is still low, but
more in line with other ports. One option raised by the channel and berth deepening associated
with Ports America operation of Seagirt is concentration of all Baltimore container activity there.

Page 56
Tioga
Port of Virginia
Overview
The Port of Virginia2 has four container terminals, three that are operated by the Virginia
International Terminals, Inc. (VIT) and one a private terminal operated by APM Terminals. VIT
is a corporation owned by the Commonwealth through the local Port Authority (VPA). Exhibit
69 is a map of the region identifying the major marine container terminal facilities. Craney
Island has been identified as a large future development site.
Exhibit 69: Port of Hampton Roads
Source: Tioga Group 2010, Data available from the Port Authority Web Site.
There is an important distinction in the numbers that follow and a difference in approach when
compared with other port capacity estimates. The Port of Virginia’s three terminals reported 2.1
million TEU in 2008. There is no separate report of TEU from APM Virginia, which opened in
September 2007. Ratios involving TEU therefore apply only to the three Port of Virginia
terminals. Vessel call information for 2007 is from a different source and includes the first calls
made at APM Virginia; therefore ratios involving vessel calls apply to all four terminals.
Approximately a third of the containers move west by rail. This percentage is expected to
increase with the completion of Norfolk Southern’s Heartland Corridor project anticipated in
2010. The project will result in a new intermodal route between Hampton Roads, Va., and
Chicago which is approximately 200 miles shorter that the present double stack rail route via
Harrisburg, PA. A low percentage of the cargo remains in the Norfolk area.
A further increase in marine terminal capacity is anticipated with the development of the 600-
acre Craney Island site. The first phase includes a 220 acre container yard, 3000 feet of berth,
an on-dock rail facility, and eight cranes. The ultimate build out is projected with 20 Suez-
class cranes and 8,400 feet of berth space. The first phase could be complete as early as 2017.
2 Port of Virginia is the adopted and preferred term for the complex of Hampton Roads, Norfolk, Newport News, and Portsmouth terminals.

Page 57
Tioga
Norfolk International Terminal (NIT) (Exhibit 70) is a legacy complex of container, bulk,
break bulk, and warehouse facilities. The terminal is operated by Virginia International
Terminals, Inc. Norfolk International Terminal (NIT) is the Port of Virginia's largest container
facility using a combination of straddle carrier, top-pick, and wheeled storage. NIT
has fourteen Super Post-Panamax cranes with a reach stretching 245 feet. The main channel
leading to the terminal is 50 feet deep and is being deepened to 55 feet. The terminal has an
on-dock rail intermodal terminal which is served by Norfolk Southern.
Exhibit 70: Norfolk International Terminal
Profile date: 2/4/2010 2008 TEU:
Port: The Port of Virginia Total Acres: 320
Terminal: Norfolk International Terminals CY Acres: 152
Terminal Type: Straddle/Wheeled/CombinationOn-Dock Rail Acres (includes area
for rail operations):10
7737 Hampton Blvd. Other Non-CY Acres: 0
Norfolk, VA 23505 Net Terminal Acres: 310
Operator (Stevedore): Virginia International Terminals (VIT) Berths (container/total): 5
Contact Name:Russell Held, Deputy Executive Director,
DevelopmentTotal Berth Length: 6,000
Telephone Number: 757-683-2115 Channel Depth (MLLW): 49
Fax Number: 757-683-8500 Berth Depth (MLLW): 48
E-Mail Address: [email protected] Panamax Container Cranes*: 0
Port Website: www.portofvirginia.com Post-Panamax Container Cranes: 14
Terminal Website: www.vit.org CY Rail-Mounted Gantries:
Inbound Gates: Depends on traffic flows CY Rubber-Tired Gantries:
Outbound Gates: Depends on traffic flows CY Side or Top Loaders:
Reversible Gates: 14 CY Straddle Carriers:
Total Gates: 17 CY Reach Stackers:
On-Line Access System: Total CY Lift Machines
Appointment System: In the process of implementing On-site M&R (yes/no): Yes
Reefer Plugs/Slots: 582 On-dock Rail (yes/no): Yes
Terminal Hours: 24/7 with exception of holidays
Gate Hours:
CONTAINER TERMINAL PROFILE
Address:
Notes: *All Post-Panamax container cranes also meet Panamax descriptions. Total container berth length is 6530 ft. Intermodal: On dock
intermodal terminal served by NS.
Monday through Friday 7:00 AM - 5:00 PM - Dispatches Stop at 4:15 PM; LTL: 7:00 AM - 5: PM (Must

Page 58
Tioga
Portsmouth Marine Terminal (PMT) (Exhibit 71) is a dedicated container terminal using a
combination of straddle carrier, top-pick, and wheeled storage. The terminal has a total of 219
acres with 109 acres for CY storage. PMT operates three container berths with a total length of
3,540 feet. All areas have been estimated from aerial photographs. The PMT is operated by
Virginia International Terminals, Inc. The facility has direct access to both Norfolk Southern
and CSX Railroads.
Exhibit 71: Portsmouth Marine Terminal
Profile date: 2/4/2010 2008 TEU:
Port: The Port of Virginia Total Acres: 219
Terminal: Portsmouth Marine Terminal CY Acres: 109
Terminal Type: Straddle/Top-pick/Wheeled On-Dock Rail Acres: 0
2000 Seaboard Ave. Other Non-CY Acres: 20
Portsmouth, VA 23707 Net Terminal Acres (BGY): 199
Operator (Stevedore): Virginia International Terminals (VIT) Berths: 3
Contact Name:Russell Held, Deputy Executive Director,
DevelopmentTotal Berth Length: 3,540
Telephone Number: 757-683-2115 Channel Depth (MLLW): 43
Fax Number: 757-683-8500 Berth Depth (MLLW): 43
E-Mail Address: [email protected] Panamax Container Cranes*: 3
Port Website: www.portofvirginia.com Post-Panamax Container Cranes: 6
Terminal Website: www.vit.org CY Rail-Mounted Gantries:
Inbound Gates: 8 CY Rubber-Tired Gantries:
Outbound Gates: 6 CY Side or Top Loaders:
Reversible Gates: 7 CY Straddle Carriers:
Total Gates: 14 CY Reach Stackers:
On-Line Access System: Total CY Lift Machines
Appointment System: In the process of implementing On-site M&R (yes/no): Yes
Reefer Plugs/Slots: 150 On-dock Rail (yes/no): (rail service) No
Terminal Hours: 24/7 with exception of holidays
Gate Hours:
CONTAINER TERMINAL PROFILE
Address:
Notes: *All Post-Panamax cranes also meet Panamax descriptions, cranes that only meet the description of Panamax and not Post-
Panamax are listed in this column. CSX Portsmouth intermodal terminal is adjacent to PMT and NS Chesapeake terminal is within draft.
Monday through Friday 7:00 AM - 5:00 PM - Dispatches Stop at 4:15 PM
Newport News Marine Terminal (NNMT) (Exhibit 72) is primarily a break-bulk terminal.
Container facilities are limited to two berths, five Panamax cranes, and a 23-acre container yard.

Page 59
Tioga
Exhibit 72: Newport News Marine Terminal (NNMT)
Profile date: 2/4/2010 2008 TEU:
Port: The Port of Virginia Total Acres: 141
Terminal: Newport News Marine Terminal CY Acres: 23
Terminal Type: Top-pick/Wheeled/CombinationOn-Dock Rail Acres: (includes area
for rail operations)6
25th St. & Warwick Blvd. Other Non-CY Acres: 70
Newport New, VA 23807 Net Terminal Acres: 65
Operator (Stevedore): Virginia International Terminals (VIT) Berths (Container/Total): 2
Contact Name:Russell Held, Deputy Executive Director,
DevelopmentTotal Berth Length: 1,920
Telephone Number: 757-683-2115 Channel Depth (MLLW): 49
Fax Number: 757-683-8500 Berth Depth (MLLW): 40
E-Mail Address: [email protected] Panamax Container Cranes: 5
Port Website: www.portofvirginia.com Post-Panamax Container Cranes: 0
Terminal Website: www.vit.org CY Rail-Mounted Gantries:
Inbound Gates: Depends on traffic flow CY Rubber-Tired Gantries:
Outbound Gates: Depends on traffic flow CY Side or Top Loaders:
Reversible Gates: 3 CY Straddle Carriers:
Total Gates: 6 CY Reach Stackers:
On-Line Access System: Total CY Lift Machines
Appointment System: On-site M&R (yes/no): No
Reefer Plugs/Slots: 72 On-dock Rail (yes/no): (rail service) No
Terminal Hours: 24/7 with exception of holidays
Gate Hours:
CONTAINER TERMINAL PROFILE
Address:
Notes: Container berth length is 1930 ft. CSX Portsmouth terminal and NS Chesapeake terminal within drayage distance. Currently
no on-dock rail service, however, on-dock rail access exists. Newport news handles both containers and breakbulk and ro/ro
containers.
Hours: Monday through Friday 8:00 AM - 12 noon, 1:00 PM - 5:00 PM - Dispatches Stop at 4:30 PM LTL:
APM Terminals, Virginia (Exhibit 73) is a new, highly automated container terminal which
opened in September 2007. The terminal uses RMGs in the main storage area. Some wheeled
storage is provided for expedited and unusual cargo. The terminal has a total of 230 acres, a
significant portion of which remains undeveloped. The facility is operated by APM Terminals
and has a dedicated on-dock rail facility with open access for CSX and Norfolk Southern. The

Page 60
Tioga
terminal is one of the few outside Southern California that operates with a motor carrier
appointment system.
Exhibit 73: APM Terminals Virginia
Profile date: 4/12/2010 2008 TEU:
Port: The Port of Virginia Total Acres: 230
Terminal: APM Virginia CY Acres: 78
Terminal Type: On-Dock Rail Acres : 34
1000 APM Terminals Boulevard Other Non-CY Acres: 122
Portsmouth, VA 23703 Net Terminal Acres: 108
Operator (Stevedore): APM Terminals Berths (container/total): 4
Contact Name: Allison Lovick Total Berth Length: 3,200
Telephone Number: 757.686.6000 Channel Depth (MLLW): 50
Fax Number: Berth Depth (MLLW): 55
E-Mail Address: [email protected] Container Cranes*:
Port Website: Post-Panamax Container Cranes: 6
Terminal Website: http://www.apmterminals.com/americas/virginia/CY Rail-Mounted Gantries: 30
Inbound Gates: 12 CY Rubber-Tired Gantries:
Outbound Gates: 12 CY Side or Top Loaders:
Reversible Gates: 0 CY Straddle Carriers: 20
Total Gates: 24 CY Reach Stackers:
On-Line Access System: Yes, Navis Total CY Lift Machines 50
Appointment System: Yes On-site M&R (yes/no): Yes
Reefer Plugs/Slots: 300+ On-dock Rail (yes/no): Yes
Terminal Hours: 0700-1700 M-F
Gate Hours:
CONTAINER TERMINAL PROFILE
Address:
0700-1600 M-F Dispatch and Recieveing Cut Off
Notes: New Terminal opened September 7, 2007. Rail terminal is immediately adjacent and is operated by
APM Terminals. 2 additonal RTG in Rail Terminal.
Container Yard Storage Capacity
Exhibit 74 summarizes land use at the Port of Virginia. The combined acreage of the container
terminals is 910 acres. The net terminal area is 569 acres creating net land use of 63%, with a
CY/gross ratio of 40%. As anticipated, NNMT which is a mixed use terminal has the lowest
net/gross ratio. Only the southern portion of the Norfolk International Terminals was evaluated

Page 61
Tioga
in this effort; the northern portion contains finger piers and covered storage. The CY/Gross
ratios in Exhibit 67 are low compared to other ports due to the mix of uses at NIT and NNMT
and the undeveloped area at APM.
Exhibit 74: Port of Virginia Land Use
Port Land Use NIT NNMT PMT VPA Total APM Virginia Port Total
Gross Acres 320 141 219 680 230 910
CY Acres 152 23 109 284 78 362
Rail Acres 10 6 - 16 34 50
Other Non-CY Acres 108 70 - 178 88 266
Net Berth/Gate/Yard Acres 202 65 194 461 108 569
CY/Gross Ratio 48% 16% 50% 42% 34% 40%
Exhibit 75 applies standard CY storage factors to the port acreage from Exhibit 74. Applying
standard CY storage factors yields an estimated combined total of 68,360 TEU slots for the four
terminals. Annual CY sustainable TEU capacity is estimated to be 3.1 million TEU for the VPA
terminals only, producing annual utilization of 83% relative to 2008 volume of 2.1 million TEU.
The CY utilization rate points to the need for the future development of the Craney Island
terminal facility.
Exhibit 75: Port of Virginia Near Term CY Storage Capacity
Container Yard Capacity NIT NNMT PMT VPA Total APM Virginia Port Total
Wheeled Chassis Slots 3,040 240 2,200 5,480 1,200 6,680
Grounded Straddle Carrier Slots 16,960 - 8,720 25,680 - 25,680
Grounded Stacked Slots 1,600 600 3,800 6,000 - 6,000
Grounded RTG Slots - 5,100 2,400 7,500 - 7,500
Grounded RMG Slots - - - - 22,500 22,500
TEU Storage Slots 21,600 5,940 17,120 44,660 23,700 68,360
Avg TEU Slots/CY Acre 142 258 157 124 306 189
Maximum Annual Slot Turnover 70.0 70.0 70.0 70.0 70.0 70
Maximum Annual CY TEU Capacity 1,512,000 415,800 1,198,400 3,126,200 1,659,000 4,785,200
Sustainable CY TEU Capacity @ 80% 1,209,600 332,640 958,720 2,500,960 1,327,200 3,828,160
2008 Annual TEU - - - 2,083,278 -
2008 TEU per CY Slot - - - 47 -
2008 CY Capacity Utilization 83%
Crane Capacity
Exhibit 76 summarizes the Port of Virginia container cranes and their estimated capacity. A total
of 34 container cranes operate at the four Virginia container terminals. Older cranes are
gradually being replaced and supplemented with post-Panamax and Suez-class varieties. NNMT
is the only terminal that does not have Post Panamax cranes. Annual crane capacity for the port
is estimated to be 8.6 million TEU with 2008 utilization at the VPA terminals estimated at 30%.

Page 62
Tioga
Exhibit 76: Port of Virginia Near-term Crane Capacity
Crane Capacity NIT NNMT PMT VPA Total APM Virginia Port Total
Cranes 14 5 9 28 6 34
Available Crane Hours per Day 16 16 16 16 16 32
Current Annual Operating Days 250 250 250 250 250 250
Current Annual Hours/Crane 4,000 4,000 4,000 4,000 4,000 4,000
Annual Available Crane Hours 56,000 20,000 36,000 112,000 24,000 136,000
Sustainable Hours @ 80% 44,800 16,000 28,800 89,600 19,200 108,800
Avg. TEU/Available Crane-hour - - - 23.3 -
Avg. Annual TEU/Crane - - - 74,403 -
Crane Capacity, Moves/hour 35 35 35 35 35
Sustainable Moves/Hr @ 80% 28 28 28 28 28
Port average TEU/container 1.80 1.80 1.80 1.80 1.80
Crane Capacity TEU/hour 63 63 63 63 63
Annual Crane Capacity 3,528,000 1,260,000 2,268,000 7,056,000 1,512,000 8,568,000
Current Annual TEU - - - 2,083,278 -
Current Crane Utilization 30%
Berth Capacity
The Port of Virginia’s berth capacity estimated in TEU for the maximum vessel size is
summarized in Exhibit 77. This estimate generates near-term berth capacity of 4.5 million TEU
and berth utilization of 46%.
Exhibit 77: Port of Virginia Near Term Berth Capacity Maximum Vessel Basis
Berth Capacity - Max Vessel Basis NIT NNMT PMT VPA Total
Berths 5 2 3 10
Berth length 6,000 1,920 3,540 11,460
Berth Depth - Feet 49 49 43 49
Max Sailing Draft 46 46 40 46
Corresponding Design Draft @ 95% 48 48 42 48
Corresponding DWT 85,099 85,099 54,506 85,099
Nominal Max Vessel TEU 6,967 6,967 4,419 6,967
Corresponding Vessel Length - Feet 1,000 1,000 900 1,000
Vessel Spacing (Beam) 120 120 105 120
Length requirement 1,120 1,120 1,005 1,120
Available Berths for Max Vessel 5.0 2.0 4.0 11.0
Port average TEU/container 1.76 1.76 1.76 1.76
2007 TEU 2,128,366
Avg. TEU/Vessel 1,097
Avg. Vessel DWT 48,220
Average Est. Vessel Capacity TEU 3,895
Average Discharge & Load % 28%
Average TEU per Max Vessel 1,962
Max annual calls per berth 260
Sustainable Calls per berth @ 80% - - - 208
Total Sustainable Vessel Calls - - - 2,288
Annual Berth Capacity TEU - - - 4,489,798
2008 Annual TEU - - - 2,083,278
Berth Utilization, Max Vessel Basis 46%
Berth capacity for all of the Port of Virginia terminals based on vessel calls is summarized in
Exhibit 78 This approach generates a berth capacity estimate of 3,640 vessel calls and a berth
utilization of 53% based on 2007 vessel calls.

Page 63
Tioga
Exhibit 78: Port of Virginia Berth Capacity Vessel Call Basis
Berth Utilization - Vessel Call Basis NIT PMT NNMT APM Virginia Port Total
Max annual calls per berth 260 260 260 260 260
Sustainable Calls per berth @ 80% 208 208 208 208 208
Available Berths 5 2 3 4 14
Total Sustainable Vessel Calls 1,040 416 624 832 2,912
2007 Vessel calls 1,940
2007 Berth Utilization 67%
The Port of Virginia is pursuing a 55-foot channel depth to handle larger bulk vessels as well as
the expected influx of large container ships form the new Panama Canal locks.
Capacity and Productivity Summary
Exhibit 79 summarizes the capacity and productivity analysis for CY space, container cranes,
and vessel berths for the Port of Hampton Roads. The port currently has estimated sustainable
CY capacity of 4.8 million TEU, with VPA utilization at 83%. Current crane capacity for the
port’s 34 cranes is estimated to be 8.6 million TEU with VPA utilization at 30%. Berth capacity
utilization on a vessel call basis is estimated to be 53%. On a TEU basis berth capacity at VPA
ports is estimated to be 4.4 million TEU with utilization of 46%.

Page 64
Tioga
Exhibit 79: Port of Hampton Roads Near Term Capacity and Productivity Summary
Terminal Space NIT NNMT PMT VPA APM Virginia Port Total
2008 TEU 2,083,278
Gross Acres 320 141 219 680 230 910CY Acres 152 23 109 284 77.5 362CY/Gross Ratio 48% 16% 50% 42% 34% 40%Annual CY Capacity - TEU 1,512,000 415,800 1,198,400 3,126,200 1,659,000 4,785,200Annual TEU/Gross Acre - - - 3,064 -
Annual TEU/CY Acre - - - 7,335 -
Est. CY TEU Slots 21,600 5,940 17,120 44,660 23,700 68,360Avg. CY Slots/ Acre - Density 142 258 157 124 306 189 Avg. Annual TEU/CY Slot (Turns) - - - 47 -
CY Utilization 83%
Container Cranes NIT NNMT PMT VPA APM Virginia Port Total
Cranes 14 5 9 28 6 34
Cranes per Berth 2.8 2.5 3.0 2.8 1.5 2.4
Annual Crane Capacity - TEU 3,528,000 1,260,000 2,268,000 7,056,000 1,512,000 8,568,000
Avg. Moves/Available Crane-Hour - - - 23.3
Annual TEU/Crane - - - 74,403
Annual Moves/Crane - - - 41,335
Annual Vessel Calls/Crane (2007) 69
Crane Utilization 30%
Berths and Vessels NIT NNMT PMT VPA APM Virginia Port Total
Berths 5 2 3 10 4 14
Berth Feet 6,000 1,920 3,540 11,460 3,200 14,660
Annual Vessel Calls per Berth (2007) - - - 139
Berth Utilization - Vessel Call Basis 53%
Annual TEU per Berth - - - 208,328
Annual TEU/Foot of Berth - - - 182
Average Vessel Capacity - TEU - - - 3,895
Est. Max. Vessel Capacity - TEU 6,967
Avg. vs. Max. Vessel Capacity 56%
Average TEU per Vessel (2007) - - - 1,097
Avg. Vessel Utilization - % Discharge/Load 28%
Berth Capacity - Avg. Vessel Basis - - - 2,510,155
Berth Utilization - Avg. Vessel Basis 83%
Avg. Discharge/Load per Max. Vessel 1,962
Berth Capacity - Max. Vessel Basis 4,489,798
Berth Utilization - Max. Vessel Basis 46%
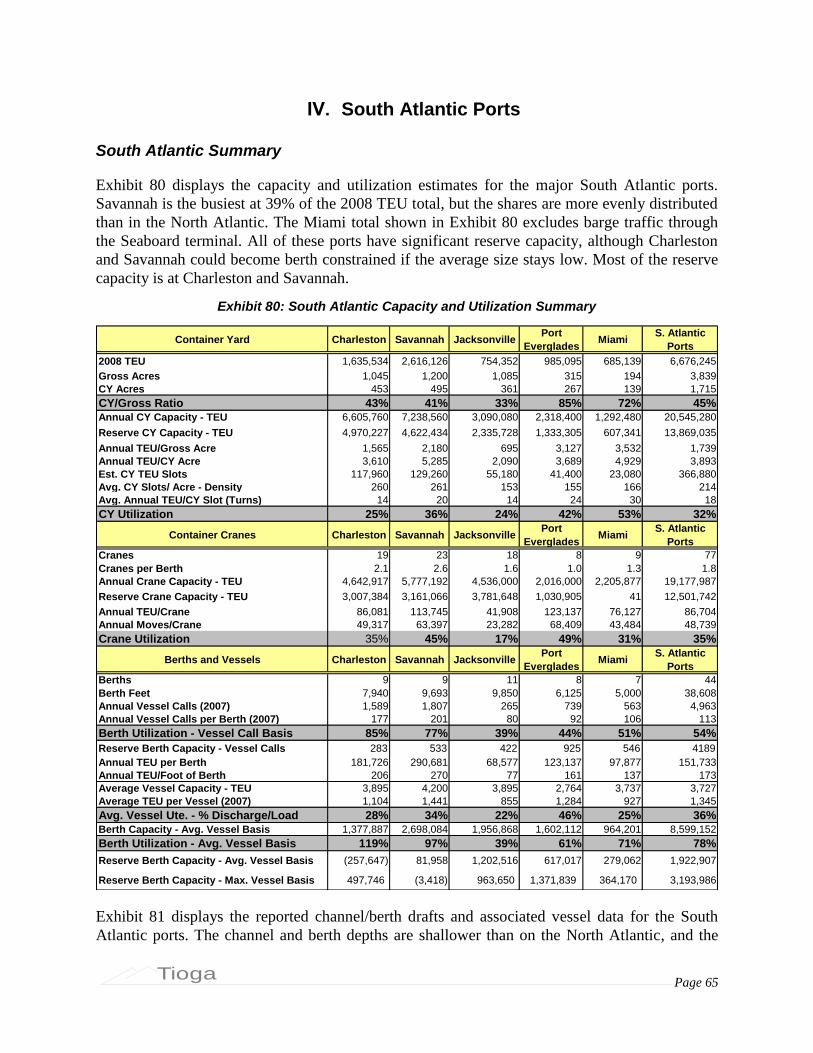
Page 65
Tioga
IV. South Atlantic Ports
South Atlantic Summary
Exhibit 80 displays the capacity and utilization estimates for the major South Atlantic ports.
Savannah is the busiest at 39% of the 2008 TEU total, but the shares are more evenly distributed
than in the North Atlantic. The Miami total shown in Exhibit 80 excludes barge traffic through
the Seaboard terminal. All of these ports have significant reserve capacity, although Charleston
and Savannah could become berth constrained if the average size stays low. Most of the reserve
capacity is at Charleston and Savannah.
Exhibit 80: South Atlantic Capacity and Utilization Summary
Container Yard Charleston Savannah JacksonvillePort
EvergladesMiami
S. Atlantic
Ports
2008 TEU 1,635,534 2,616,126 754,352 985,095 685,139 6,676,245
Gross Acres 1,045 1,200 1,085 315 194 3,839
CY Acres 453 495 361 267 139 1,715
CY/Gross Ratio 43% 41% 33% 85% 72% 45%
Annual CY Capacity - TEU 6,605,760 7,238,560 3,090,080 2,318,400 1,292,480 20,545,280
Reserve CY Capacity - TEU 4,970,227 4,622,434 2,335,728 1,333,305 607,341 13,869,035
Annual TEU/Gross Acre 1,565 2,180 695 3,127 3,532 1,739
Annual TEU/CY Acre 3,610 5,285 2,090 3,689 4,929 3,893
Est. CY TEU Slots 117,960 129,260 55,180 41,400 23,080 366,880
Avg. CY Slots/ Acre - Density 260 261 153 155 166 214
Avg. Annual TEU/CY Slot (Turns) 14 20 14 24 30 18
CY Utilization 25% 36% 24% 42% 53% 32%
Container Cranes Charleston Savannah JacksonvillePort
EvergladesMiami
S. Atlantic
Ports
Cranes 19 23 18 8 9 77
Cranes per Berth 2.1 2.6 1.6 1.0 1.3 1.8
Annual Crane Capacity - TEU 4,642,917 5,777,192 4,536,000 2,016,000 2,205,877 19,177,987
Reserve Crane Capacity - TEU 3,007,384 3,161,066 3,781,648 1,030,905 41 12,501,742
Annual TEU/Crane 86,081 113,745 41,908 123,137 76,127 86,704
Annual Moves/Crane 49,317 63,397 23,282 68,409 43,484 48,739
Crane Utilization 35% 45% 17% 49% 31% 35%
Berths and Vessels Charleston Savannah JacksonvillePort
EvergladesMiami
S. Atlantic
Ports
Berths 9 9 11 8 7 44
Berth Feet 7,940 9,693 9,850 6,125 5,000 38,608
Annual Vessel Calls (2007) 1,589 1,807 265 739 563 4,963
Annual Vessel Calls per Berth (2007) 177 201 80 92 106 113
Berth Utilization - Vessel Call Basis 85% 77% 39% 44% 51% 54%
Reserve Berth Capacity - Vessel Calls 283 533 422 925 546 4189
Annual TEU per Berth 181,726 290,681 68,577 123,137 97,877 151,733
Annual TEU/Foot of Berth 206 270 77 161 137 173
Average Vessel Capacity - TEU 3,895 4,200 3,895 2,764 3,737 3,727
Average TEU per Vessel (2007) 1,104 1,441 855 1,284 927 1,345
Avg. Vessel Ute. - % Discharge/Load 28% 34% 22% 46% 25% 36%
Berth Capacity - Avg. Vessel Basis 1,377,887 2,698,084 1,956,868 1,602,112 964,201 8,599,152
Berth Utilization - Avg. Vessel Basis 119% 97% 39% 61% 71% 78%
Reserve Berth Capacity - Avg. Vessel Basis (257,647) 81,958 1,202,516 617,017 279,062 1,922,907
Reserve Berth Capacity - Max. Vessel Basis 497,746 (3,418) 963,650 1,371,839 364,170 3,193,986
Exhibit 81 displays the reported channel/berth drafts and associated vessel data for the South
Atlantic ports. The channel and berth depths are shallower than on the North Atlantic, and the

Page 66
Tioga
ports shown will not be bale to handle the larger post-expansion vessels that could transit the
Panama Canal without completion of dredging projects.
Exhibit 81: South Atlantic Drafts and Vessels
Berths and Vessels Charleston Savannah JacksonvillePort
EvergladesMiami
Nominal Maximum Channel/Berth Draft Feet 47 42 37 39 42
Estimated Maximum Vessel TEU 6,031 4,067 3,420 4,067 4,067
2007 Average Vessel TEU 3,895 4,200 3,895 2,764 3,737
2008 Average Vessel Discharge/Load 1,104 1,441 855 1,284 927
Port of Charleston
Overview
The Port of Charleston has five terminals owned and operated by the South Carolina State Port
Authority (SCSPA). Three of these terminals are container terminals: Wando Welch, Columbus
Street, and North Charleston. The two other terminals, Union Pier and Veterans Terminal, handle
break bulk, Ro-Ro, and project cargo. SCSPA staff operate the container cranes, run container
yard equipment, and operate gates at all container terminals, with the exception of terminal space
utilized by licensed operators. In these terminal areas the licensed operators operate their own
yards and gates. Total 2008 port volume was 1,635,534 TEU.
Exhibit 82 is an aerial view of the port showing the location and relative size of each terminal. In
this view the access to the Atlantic Ocean is at the bottom of the photo. The photo also shows the
location of a proposed new terminal located at the former Charleston Navy Base.

Page 67
Tioga
Exhibit 82: Port of Charleston
Wando Welch terminal is the port’s largest container operation handling 62% of the port’s 2008
volume. Exhibit 83 provides a profile. Wando Welch is a dedicated container terminal utilizing
361 acres. It has 4 berths with total berth length of 3800 feet. Terminal operator APM is a
licensed operator and operates a 160 acre facility within the terminal.

Page 68
Tioga
Exhibit 83: Wando Welch Terminal
Profle date: Sept. 29, 2009 2008 TEU: 1,011,302
Port: Charleston Total Acres: 689
Terminal: Wando Welch CY Acres: 241.7
Terminal Type: Container On-Dock Rail Acres: 0
400 Long Point Rd. Other Non-CY Acres:
Mt. Pleasant, SC Net Terminal Acres: 361 developed
Operator (Stevedore):SCSPA (Common Use Terminal) and APM
TerminalsBerths: 4
Contact Name: Billy Crowther Total Berth Length: 3,800
Telephone Number: WWT 843-856-7005; APM 843-971-3200 Channel Depth (MLLW): 47
Fax Number: WWT 843-971-3200; APM 843-971-3228 Berth Depth (MLLW): 45
E-Mail Address: [email protected] Panamax Container Cranes:
Port Website: portofcharleston.com Post-Panamax Container Cranes: 10
Terminal Website: http://www.scspa.com/charleston/terminals/wandoterminal.asp CY Rail-Mounted Gantries: 6
Inbound Gates: 12 CY Rubber-Tired Gantries: 30
Outbound Gates: 6 CY Side or Top Loaders: 19 toplifters
Reversible Gates: CY Straddle Carriers:
Total Gates: 18 CY Reach Stackers: 12 empty handlers
On-Line Access System: SCSPA System for common use. APMT for Maersk yard.Total CY Lift Machines 36
Appointment System: SCSPA System for common use. APMT for Maersk yard.On-site M&R (yes/no): Yes
Reefer Plugs/Slots: 438 On-dock Rail (yes/no): No
Terminal Hours:
Gate Hours:
CONTAINER TERMINAL PROFILE
Address:
Notes: APM terminals is a "licensed facility operator" at Wando Terminal with its own 160 acre facility. There are separate gates for
Common Use Terminal and APM Terminals.
APM Terminal: Mon – Fri 0800 – 1145, 1245 - 1600. Common Use Terminal no information.
APM Terminal: Mon – Fri 0800 – 1145, 1245 - 1600. Common Use 0700-1700 no lunch closure.
North Charleston is the Port’s second largest container terminal handling 27% of Charleston’s
2008 volume. It is a mixed use terminal which can handle break bulk and Ro-Ro cargoes in

Page 69
Tioga
addition to containers. Exhibit 84 provides the terminal profile and Exhibit 85 is a schematic
drawing of the terminal. The terminal utilizes 198 acres and operates three berths totaling 2500
feet in length. Ceres Marine Terminals is a licensed operator at North Charleston and utilizes
over 50 acres of the terminal acreage
Exhibit 84: North Charleston Terminal Profile
Profle date: Sept. 29, 2009 2008 TEU: 449,424
Port: Charleston Total Acres: 201
Terminal: North Charlston CY Acres: 129
Terminal Type: Container, breakbulk and roro On-Dock Rail Acres:
1000 Remount Road Other Non-CY Acres:
North Charleston, SC Net Terminal Acres: 198 developed
Operator (Stevedore): SCSPA and Ceres Marine Terminals Berths: 3
Contact Name: David Hoffman Total Berth Length: 2,500
Telephone Number:Common Use 863-745-6533; Ceres 843-881-
1938Channel Depth (MLLW): 47
Fax Number:Common Use 843-745-6540; Ceres 843-881-
1938Berth Depth (MLLW): 45
E-Mail Address: [email protected] Panamax Container Cranes:
Port Website: portofcharleston.com Post-Panamax Container Cranes: 6
Terminal Website: http:/ /www.scspa.com/charleston/terminals/ncharlestonterminal.asp CY Rail-Mounted Gantries: 2
Inbound Gates: 4 (licensed operator) CY Rubber-Tired Gantries: 10
Outbound Gates: 3 (licensed operator) CY Side or Top Loaders: 12
Reversible Gates: 9 (common use) CY Straddle Carriers:
Total Gates: 16 CY Reach Stackers: 5 empty handlers
On-Line Access System: SCSPA System for common use. Ceres TOS. Total CY Lift Machines 24
Appointment System: SCSPA System for common use. Ceres TOS. On-site M&R (yes/no): Yes
Reefer Plugs/Slots: 365 On-dock Rail (yes/no): Near Dock
Terminal Hours: Security 24/7. Terminal operations 24/7 as needed except ILA no-work holidays.
Gate Hours:
CONTAINER TERMINAL PROFILE
Address:
Notes: Ceres Marine Terminals is a licensed terminal operator at North Charleston. Ceres operates the Evergreen terminal at North
Charleston which occupies 25-30% of the terminal acreage. There is a common gate for both SCSPA and Ceres Terminal.
0700-1700 no lunch closure (common use).

Page 70
Tioga
Exhibit 85: North Charleston Terminal Drawing
Columbus Street is the smallest of Charleston’s three container terminals. It handled 11% of the
port’s 2008 container volume. Exhibit 86 is an aerial view. Columbus Street handles both
breakbulk and container cargo. The terminal utilizes 135 developed acres and has six berths with
3500 continuous feet of berth space. The two berths for container ships are 1640 feet. Ceres
Marine Terminals is a licensed operator at Columbus Street and utilizes 74 acres of the facility.
Exhibit 86: Columbus Street Terminal
Exhibit 87 provides a profile of the Columbus Street terminal.

Page 71
Tioga
Exhibit 87: Columbus Street Terminal Profile
Profle date: Sept. 29, 2009 2008 TEU: 174,808
Port: Charleston Total Acres: 155
Terminal: Columbus St. Terminal CY Acres: 81.6
Terminal Type: Container & Breakbulk On-Dock Rail Acres:
1 Immigration St. Other Non-CY Acres:
Charleston, NC 29403 Net Terminal Acres: 135 developed
Operator (Stevedore): SCSPA & Ceres Marine Terms. Berths: 2 container 6 breakbulk 2
Contact Name: John Martin Terminal Mgr Total Berth Length: (container) 1,640
Telephone Number: 843-577-8743; CMT 843-881-1938 Channel Depth (MLLW): 47
Fax Number: 843-577-8755; CMT 843-881-7954 Berth Depth (MLLW): 45
E-Mail Address: [email protected] Panamax Container Cranes: 1
Port Website: portcharleston.com Post-Panamax Container Cranes: 2
Terminal Website: http:/ /www.scspa.com/charleston/terminals/columbusterminal.asp CY Rail-Mounted Gantries: 2
Inbound Gates: CY Rubber-Tired Gantries: 3
Outbound Gates: CY Side or Top Loaders: 13 toplifters
Reversible Gates: 5 CY Straddle Carriers:
Total Gates: 5 CY Reach Stackers:
On-Line Access System: SCSPA System for common use. Ceres TOS. Total CY Lift Machines 18
Appointment System: SCSPA System for common use. Ceres TOS. On-site M&R (yes/no):
Reefer Plugs/Slots: 128 On-dock Rail (yes/no): Yes
Terminal Hours: Security 24/7. Terminal operations 24/7 as needed except ILA no-work holidays.
Gate Hours:
CONTAINER TERMINAL PROFILE
Address:
Notes: 78 acres (74 leased to ocean carriers operated by Ceres, 4 operated by SCSPA). 128 reefer plugs on Ceres operated
terminal. 6 berths (2 container 4 breakbulk). Berth Length: total 3500 feet with 1640 feet of container berth.
0700-1700 no lunch closure (common use).
Container Yard Storage Capacity
Exhibit 88 summarizes land use at the Port of Charleston. The combined area of the three
container terminals is 1,045 acres with net terminal area of 717 acres. This generates a net to
gross land use ratio of 69%, and a CY/Gross ratio of 43%. Land use at Columbus Street and
North Charleston are at 100%. Only the Wando Welch terminal appears to have any available
land with a net to gross ratio of 52%. It is unclear to what extent the port can develop additional
land at the Wando Welch terminal.
Exhibit 88: Port of Charleston Land Use
Port Land UseColumbus
St.
North
Charleston
Wando
WelchPort Total
Gross Acres 155 201 689 1,045
CY Acres 82 129 242 453
Rail Acres - - - -
Other Non-CY Acres - - - -
Net Berth/Gate/Yard Acres 155 201 361 717
CY/Gross Ratio 53% 64% 35% 43%

Page 72
Tioga
Exhibit 89 applies standard CY storage factors to the port acreage. Virtually all of the CY
operation is grounded. Based on interpretation of aerial photographs it was estimated the
combined CY area in use was 453 acres producing an estimated 117,960 storage slots. Annual
CY sustainable TEU capacity is estimated at 6.6 million TEU. This produces annual utilization
of 25% relative to 2008 volume of 1.6 million TEU. This analysis indicates that all three
terminals have sufficient CY capacity to handle future growth.
Exhibit 89: Port of Charleston Near Term CY Storage Capacity
Container Yard CapacityColumbus
St.
North
Charleston
Wando
WelchPort Total
Wheeled Chassis Slots - - - -
Grounded Straddle Carrier Slots - - - -
Grounded Stacked Slots 11,800 12,800 16,800 41,400
Grounded RTG Slots 4,200 16,200 39,600 60,000
Grounded RMG Slots 3,240 3,960 9,360 16,560
TEU Storage Slots 19,240 32,960 65,760 117,960
Avg TEU Slots/CY Acre 235 256 272 260
Maximum Annual Slot Turnover 70.0 70.0 70.0 70.0
Maximum Annual CY TEU Capacity 1,346,800 2,307,200 4,603,200 8,257,200
Sustainable CY TEU Capacity @ 80% 1,077,440 1,845,760 3,682,560 6,605,760
2008 Annual TEU 174,808 449,424 1,011,302 1,635,534
2008 TEU per CY Slot 9 14 15 14
2008 CY Capacity Utilization 16% 24% 27% 25%
Crane Capacity
Exhibit 90 provides a summary of the Port of Charleston’s cranes and an estimate of crane
capacity. The port operates 19 cranes at its three terminals. Annual crane capacity for the port is
estimated to be 4.6 million TEU with 2008 utilization at 35 %. The Wando Welch terminal has
the highest capacity utilization at 41%.
Exhibit 90: Port of Charleston Near Term Crane Capacity
Crane CapacityColumbus
St.
North
Charleston
Wando
WelchPort Total
Cranes 3 6 10 19
Available Crane Hours per Day 16 16 16 16
Current Annual Operating Days 250 250 250 250
Current Annual Hours/Crane 4,000 4,000 4,000 4,000
Annual Available Crane Hours 12,000 24,000 40,000 76,000
Sustainable Hours @ 80% 9,600 19,200 32,000 60,800
Avg. TEU/Available Crane-hour 18.2 23.4 31.6 26.9
Avg. Annual TEU/Crane 58,269 74,904 101,130 86,081
Crane Capacity, Moves/hour 35 35 35 35
Sustainable Moves/Hr @ 80% 28 28 28 28
Port average TEU/container 1.75 1.75 1.75 1.75
Crane Capacity TEU/hour 61 61 61 61
Annual Crane Capacity 733,092 1,466,184 2,443,641 4,642,917
Current Annual TEU 174,808 449,424 1,011,302 1,635,534
Current Crane Utilization 24% 31% 41% 35%

Page 73
Tioga
Berth Capacity
The Port of Charleston berth capacity estimated in TEU for the maximum vessel size is
summarized in Exhibit 91. This estimate generates near term berth capacity of 2.7 million TEU
and berth utilization of 77 %. The Wando terminal has the highest estimated utilization at 95%.
Exhibit 91: Port of Charleston Near Term Berth Capacity Maximum Vessel Basis
Berth Capacity - Max Vessel BasisColumbus
St.
North
Charleston
Wando
WelchPort Total
Berths 2 3 4 9
Berth length 1,640 2,500 3,800 7,940
Berth Depth - Feet 47 47 47 47
Max Sailing Draft 44 44 44 44
Corresponding Design Draft @ 95% 46 46 46 46
Corresponding DWT 73,856 73,856 73,856 73,856
Nominal Max Vessel TEU 6,031 6,031 6,031 6,031
Corresponding Vessel Length - Feet 1,000 1,000 1,000 1,000
Vessel Spacing (Beam) 120 120 120 120
Length requirement 1,120 1,120 1,120 1,120
Available Berths for Max Vessel 1.0 2.0 3.0 6.0
Port average TEU/container 1.75 1.75 1.75 1.75
2007 TEU 1,754,377
Avg. TEU/Vessel 1,104
Avg. Vessel DWT 48,220
Average Est. Vessel Capacity TEU 3,895
Average Discharge & Load % 28%
Average TEU per Max Vessel 1,709 1,709 1,709 1,709
Max Calls per Berth 5/wk 260 260 260 260
Sustainable Calls per Berth @ 80% 208 208 208 208
Total Sustainable Vessel Calls 208 416 624 1,248
Annual Berth Capacity TEU 355,547 711,093 1,066,640 2,133,279
2008 Annual TEU 174,808 449,424 1,011,302 1,635,534
Berth Utilization, Max Vessel Basis 49% 63% 95% 77%
Berth capacity based on vessel calls is summarized in Exhibit 92. This approach generates a
berth capacity estimate of 1,872 calls and 2007 port berth utilization of 85%.
Exhibit 92: Charleston 2007 Berth Capacity Vessel Call Basis
Berth Utilization - Vessel Call BasisColumbus
St.
North
Charleston
Wando
WelchPort Total
Max Calls per Berth 5/wk 260 260 260 260
Sustainable Calls per Berth @ 80% 208 208 208 208
Available Berths 2 3 4 9
Total Sustainable Vessel Calls 416 624 832 1,872
2007 Vessel calls 1,589
2007 Berth Utilization 85%
Capacity and Productivity Summary
Exhibit 93 summarizes the capacity and productivity analysis for CY space, container cranes,
and vessel berths for the Port of Charleston. The port currently has estimated sustainable annual

Page 74
Tioga
CY capacity of 6.6 million TEU with current utilization at 25%. This analysis indicates that all
three terminals of the port have reserve CY capacity for future growth.
Container crane capacity at the port is estimated at 4.6 million TEU with current capacity at
35%. The Wando Welch terminal has the highest utilization at 41%. The analysis indicates that
the port has reserve crane capacity for future growth.
In 2007 the port averaged 177 annual calls per berth. This produced berth utilization of 85%
using a sustainable capacity of 208 annual calls per berth. Berth capacity on a TEU basis is
estimated to be 2.7 million TEU on a maximum vessel call basis. This produces a 2008 capacity
utilization estimate of 79%. Data for containership calls by terminal was not available. Therefore
berth utilization by terminal could not be estimated.
It should also be noted that the SCSPA website advertises port capacity at 2.6 million TEU. This
figure is consistent with the berth capacity estimate of 2.7 million TEU. The SCSPA’s major
terminal capacity expansion project is the development of a new container terminal at the former
Charleston Navy Base. This terminal will be a 280-acre facility with 3 berths and 1.4 million
TEU capacity. Construction of the new terminal has started and completion of the first phase is
projected for 2017. South Carolina and Georgia are seeking to work cooperatively to develop a
new marine terminal on the Savannah River in Jasper County.

Page 75
Tioga
Exhibit 93: Port of Charleston Near Term Capacity and Productivity Summary
Terminal SpaceColumbus
St.
North
Charleston
Wando
WelchCharleston
2008 TEU 174,808 449,424 1,011,302 1,635,534
Gross Acres 155 201 689 1,045CY Acres 82 129 242 453CY/Gross Ratio 53% 64% 35% 43%Annual Sustainable CY TEU Capacity @ 80% 1,077,440 1,845,760 3,682,560 6,605,760 Annual TEU/Gross Acre 1,128 2,236 1,468 1,565 Annual TEU/CY Acre 2,132 3,484 4,179 3,610 Est. CY TEU Slots 19,240 32,960 65,760 117,960 Avg. CY Slots/ Acre - Density 235 256 272 260 Avg. Annual TEU/CY Slot (Turns) 9 14 15 14 CY Utilization 16% 24% 27% 25%
Container CranesColumbus
St.
North
Charleston
Wando
WelchCharleston
Cranes 3 6 10 19
Cranes per Berth 1.5 2.0 2.5 2.1
Annual Crane Capacity - TEU 733,092 1,466,184 2,443,641 4,642,917
Avg. Moves/Available Crane-Hour 18.2 23.4 31.6 26.9
Annual TEU/Crane 58,269 74,904 101,130 86,081
Annual Moves/Crane 33,383 42,914 57,939 49,317
Annual Vessel Calls/Crane (2007) - - 84
Crane Utilization 24% 31% 41% 35%
Berths and VesselsColumbus
St.
North
Charleston
Wando
WelchCharleston
Berths 2 3 4 9
Berth Feet 1,640 2,500 3,800 7,940
Annual Vessel Calls per Berth (2007) 177
Berth Utilization - Vessel Call Basis 85%
Annual TEU per Berth 87,404 149,808 252,826 181,726
Annual TEU/Foot of Berth 107 180 266 206
Average Vessel Capacity - TEU 3,895
Est. Max. Vessel Capacity - TEU 6,031 6,031 6,031 6,031
Avg. vs. Max. Vessel Capacity 65%
Average TEU per Vessel (2007) 1,104
Avg. Vessel Utilization - % Discharge/Load 28%
Berth Capacity - Avg. Vessel Basis 1,377,887
Berth Utilization - Avg. Vessel Basis 119%
Avg. Discharge/Load per Max. Vessel 1,709
Berth Capacity - Max. Vessel Basis 2,133,279
Berth Utilization - Max. Vessel Basis 77%
Georgia Port Authority (GPA) Port of Savannah
Overview
The Port of Savannah has one large container terminal, the Garden City Terminal. Exhibit 94
provides an aerial view. The terminal is located on the Savannah River 13 miles from the
Atlantic Ocean. The GPA’s Garden City property includes a total of 1200 acres with the terminal
and associated rail facilities covering 625 acres. The Garden City Terminal also handles liquid
bulk products. The Garden City container terminal is the largest single container port facility in
North America. The terminal is owned and operated by GPA. Exhibit 94 identifies the key
features of the terminal and Exhibit 95 provides a summary of terminal information.

Page 76
Tioga
The terminal operates nine container berths with 9693 feet of berth and includes two on-dock rail
intermodal terminals. GPA provides 23 container cranes for its operation. The port has two rail
facilities. The Mason ICTF is served by Norfolk Southern and the Chatham ICTF is served by
CSX. The CY operation covers 495 acres and is principally a stacked operation utilizing RTG
and top lift equipment. 2008 port volume was 2,616,162 TEU.
Exhibit 94: Garden City Container Terminal
Source: Google Earth Image date February 29, 2008
Over the next 10 years, Garden City Terminal is scheduled to add on average two high-speed
super post-Panamax container cranes every 18 months for a total of 25 cranes, as well as 86
Rubber-Tired Gantries (RTG) as part of long-term developments for a full RTG conversion at
the facility.
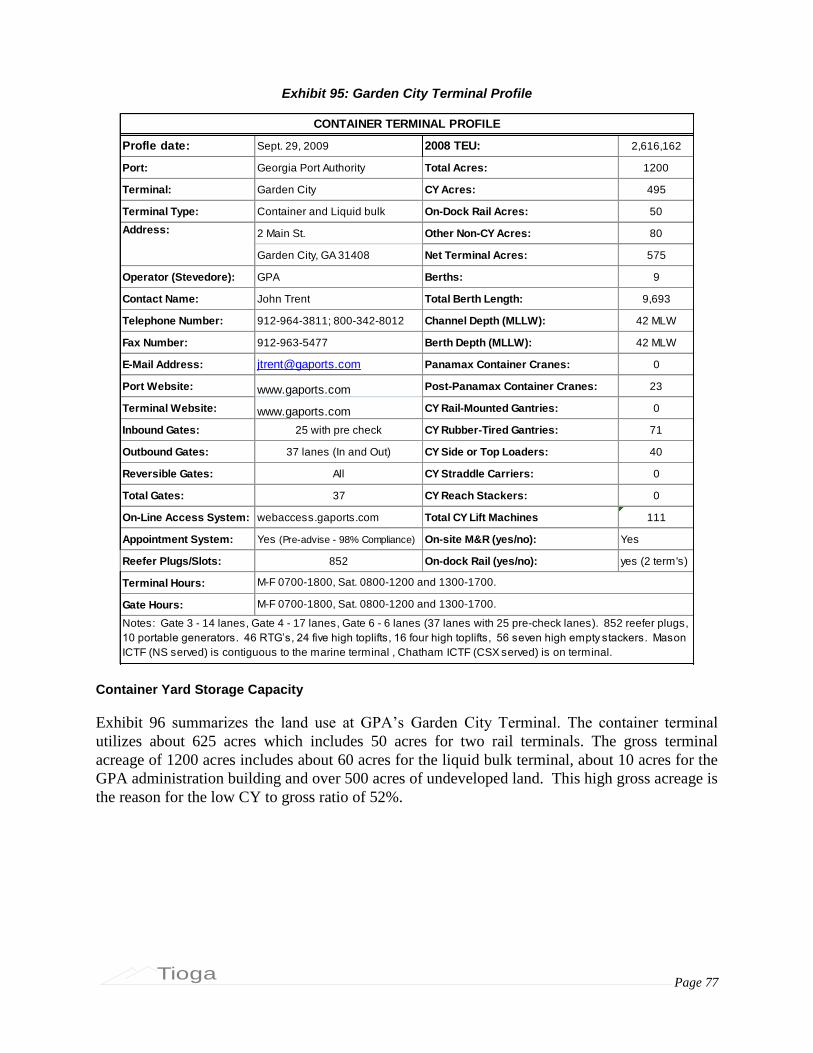
Page 77
Tioga
Exhibit 95: Garden City Terminal Profile
Profle date: Sept. 29, 2009 2008 TEU: 2,616,162
Port: Georgia Port Authority Total Acres: 1200
Terminal: Garden City CY Acres: 495
Terminal Type: Container and Liquid bulk On-Dock Rail Acres: 50
2 Main St. Other Non-CY Acres: 80
Garden City, GA 31408 Net Terminal Acres: 575
Operator (Stevedore): GPA Berths: 9
Contact Name: John Trent Total Berth Length: 9,693
Telephone Number: 912-964-3811; 800-342-8012 Channel Depth (MLLW): 42 MLW
Fax Number: 912-963-5477 Berth Depth (MLLW): 42 MLW
E-Mail Address: [email protected] Panamax Container Cranes: 0
Port Website: www.gaports.com Post-Panamax Container Cranes: 23
Terminal Website: www.gaports.com CY Rail-Mounted Gantries: 0
Inbound Gates: 25 with pre check CY Rubber-Tired Gantries: 71
Outbound Gates: 37 lanes (In and Out) CY Side or Top Loaders: 40
Reversible Gates: All CY Straddle Carriers: 0
Total Gates: 37 CY Reach Stackers: 0
On-Line Access System: webaccess.gaports.com Total CY Lift Machines 111
Appointment System: Yes (Pre-advise - 98% Compliance) On-site M&R (yes/no): Yes
Reefer Plugs/Slots: 852 On-dock Rail (yes/no): yes (2 term's)
Terminal Hours:
Gate Hours:
CONTAINER TERMINAL PROFILE
Address:
Notes: Gate 3 - 14 lanes, Gate 4 - 17 lanes, Gate 6 - 6 lanes (37 lanes with 25 pre-check lanes). 852 reefer plugs,
10 portable generators. 46 RTG’s, 24 five high toplifts, 16 four high toplifts, 56 seven high empty stackers. Mason
ICTF (NS served) is contiguous to the marine terminal , Chatham ICTF (CSX served) is on terminal.
M-F 0700-1800, Sat. 0800-1200 and 1300-1700.
M-F 0700-1800, Sat. 0800-1200 and 1300-1700.
Container Yard Storage Capacity
Exhibit 96 summarizes the land use at GPA’s Garden City Terminal. The container terminal
utilizes about 625 acres which includes 50 acres for two rail terminals. The gross terminal
acreage of 1200 acres includes about 60 acres for the liquid bulk terminal, about 10 acres for the
GPA administration building and over 500 acres of undeveloped land. This high gross acreage is
the reason for the low CY to gross ratio of 52%.

Page 78
Tioga
Exhibit 96: Garden City Land Use
Port Land Use Garden City Port Total
Gross Acres 1,200 1,200
CY Acres 495 495
Rail Acres 50 50
Other Non-CY Acres 80 80
Net Berth/Gate/Yard Acres 625 625
CY/Gross Ratio 41% 41%
Exhibit 97 applies standard CY storage factors to the Garden City CY acreage. Virtually all of
the CY operation is grounded, primarily using RTG and top lift equipment for container
handling. The only wheeled area is the 12-acre rapid dispatch area utilized for high priority
shipments. Based on interpretation of the aerial photos it was estimated that 70% of the 483 acre
CY area or 340 acres utilized RTG equipment and the remaining 143 acres utilized top lift
equipment. This acreage allocation generated an estimate of 129,260 storage slots with annual
sustainable CY capacity of 7.2 million TEU. This produces capacity utilization of 36% relative
to 2008 volume of 2.6 million TEU.
Exhibit 97: Garden City Near Term CY Storage Capacity
Container Yard Capacity Garden City Port Total
Wheeled Chassis Slots 960 960
Grounded Straddle Carrier Slots - -
Grounded Stacked Slots 33,200 33,200
Grounded RTG Slots 95,100 95,100
Grounded RMG Slots - -
TEU Storage Slots 129,260 129,260
Avg TEU Slots/CY Acre 261 261
Maximum Annual Slot Turnover 70.0 70.0
Maximum Annual CY TEU Capacity 9,048,200 9,048,200
Sustainable CY TEU Capacity @ 80% 7,238,560 7,238,560
2008 Annual TEU 2,616,126 2,616,126
2008 TEU per CY Slot 20 20
2008 CY Capacity Utilization 36% 36%
Crane Capacity
Exhibit 98 summarizes the Garden City Terminal’s estimate of container crane capacity for its 23
cranes. Annual crane capacity is estimated at 5.8 million TEU with current utilization of 45%.

Page 79
Tioga
Exhibit 98: Garden City Terminal Near Term Crane Capacity
Crane Capacity Garden City Port Total
Cranes 23 23
Available Crane Hours per Day 16 16
Current Annual Operating Days 250 250
Current Annual Hours/Crane 4,000 4,000
Annual Available Crane Hours 92,000 92,000
Sustainable Hours @ 80% 73,600 73,600
Avg. TEU/Available Crane-hour 35.5 35.5
Avg. Annual TEU/Crane 113,745 113,745
Crane Capacity, Moves/hour 35 35
Sustainable Moves/Hr @ 80% 28 28
Port average TEU/container 1.79 1.79
Crane Capacity TEU/hour 63 63
Annual Crane Capacity 5,777,192 5,777,192
Current Annual TEU 2,616,126 2,616,126
Current Crane Utilization 45% 45%
Berth Capacity
Garden City berth capacity estimated in TEU for the maximum vessel size is summarized in
Exhibit 99. This estimate generates near-term capacity of 2.6 million TEU and berth utilization
of 100%.
Exhibit 99: Garden City Terminal Near Term Berth Capacity Max Vessel Basis
Berth Capacity - Max Vessel Basis Garden City Port Total
Berths 9 9
Berth length 9,693 9,693
Berth Depth - Feet 42 42
Max Sailing Draft 39 39
Corresponding Design Draft @ 95% 41 41
Corresponding DWT 50,280 50,280
Nominal Max Vessel TEU 4,067 4,067
Corresponding Vessel Length - Feet 900 900
Vessel Spacing (Beam) 105 105
Length requirement 1,005 1,005
Available Berths for Max Vessel 9.0 9.0
Port average TEU/container 1.79 1.79
2007 TEU 2,604,401 2,604,401
Avg. TEU/Vessel 1,441 1,441
Avg. Vessel DWT 51,875 51,875
Average Est. Vessel Capacity TEU 4,200 4,200
Average Discharge & Load % 34% 34%
Average TEU per Max Vessel 1,396 1,396
Max Calls per berth 5 / wk 260 260
Sustainable Calls per berth @ 80% 208 208
Total Sustainable Vessel Calls 1,872 1,872
Annual Berth Capacity TEU 2,612,708 2,612,708
2008 Annual TEU 2,616,126 2,616,126
Berth Utilization, Max Vessel Basis 100% 100%

Page 80
Tioga
Berth capacity based on vessel calls is summarized in Exhibit 100. This approach generates a
berth capacity estimate of 1,872 calls and 2007 berth utilization of 97%.
Exhibit 100: Garden City 2007 Berth Capacity Vessel Call Basis
Berth Utilization - Vessel Call Basis Garden City Port Total
Max Calls per berth 5 / wk 260 260
Sustainable Calls per berth @ 80% 208 208
Available Berths 9 9
Total Sustainable Vessel Calls 1,872 1,872
2007 Vessel calls 1,807 1,807
2007 Berth Utilization 97% 97%
Current Capacity and Productivity Summary
Exhibit 101 summarizes the capacity and productivity analysis for CY space, container cranes,
and vessel berths for the Garden City Terminal. The terminal currently has estimated annual
sustainable CY storage capacity of 7.2 million TEU with current utilization at 36%. This
indicates that Garden City has plenty of reserve capacity CY for future growth. The port also has
a plan to add an additional 15 rubber-tired gantry cranes to reach a total of 86 cranes as it
converts to a full RTG CY operation. In addition, there appear to be several hundred acres of
undeveloped land that may be available for future development.
Container crane capacity for the terminal’s 23 cranes is estimated at 5.8 million TEU with
current utilization of 45%. In addition, the GPA website indicates that there is a plan to add 2
additional cranes to reach a total of 25 cranes on the terminal.
In 2007 Garden City averaged 201 calls per berth. This produced a utilization estimate of 97 %
using standard capacity of 208 calls per berth. Berth capacity on a TEU basis was estimated at
2.6 million TEU with 100% utilization on a maximum vessel call basis.
This analysis indicates that the Port of Savannah has adequate capacity CY to handle future
growth. Berth capacity appears to the most constrained facility resource. However, larger vessel
size and higher discharge rates could enable future volume growth and improved berth
throughput. to accommodate the larger traffic necessary to keep up with demand, the Georgia
Ports Authority is in the process of increasing the depth of the Savannah River Navigation
Channel from 42 to 48 feet.
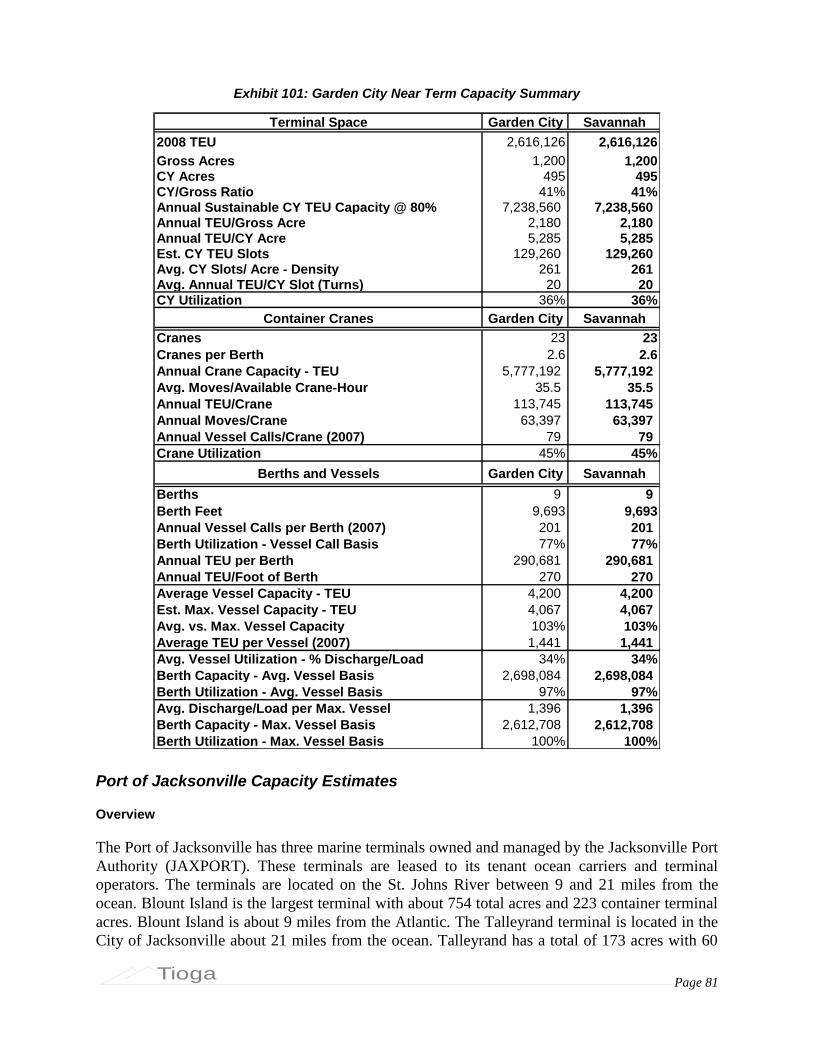
Page 81
Tioga
Exhibit 101: Garden City Near Term Capacity Summary
Terminal Space Garden City Savannah
2008 TEU 2,616,126 2,616,126
Gross Acres 1,200 1,200CY Acres 495 495CY/Gross Ratio 41% 41%Annual Sustainable CY TEU Capacity @ 80% 7,238,560 7,238,560 Annual TEU/Gross Acre 2,180 2,180 Annual TEU/CY Acre 5,285 5,285 Est. CY TEU Slots 129,260 129,260 Avg. CY Slots/ Acre - Density 261 261 Avg. Annual TEU/CY Slot (Turns) 20 20 CY Utilization 36% 36%
Container Cranes Garden City Savannah
Cranes 23 23
Cranes per Berth 2.6 2.6
Annual Crane Capacity - TEU 5,777,192 5,777,192
Avg. Moves/Available Crane-Hour 35.5 35.5
Annual TEU/Crane 113,745 113,745
Annual Moves/Crane 63,397 63,397
Annual Vessel Calls/Crane (2007) 79 79
Crane Utilization 45% 45%
Berths and Vessels Garden City Savannah
Berths 9 9
Berth Feet 9,693 9,693
Annual Vessel Calls per Berth (2007) 201 201
Berth Utilization - Vessel Call Basis 77% 77%
Annual TEU per Berth 290,681 290,681
Annual TEU/Foot of Berth 270 270
Average Vessel Capacity - TEU 4,200 4,200
Est. Max. Vessel Capacity - TEU 4,067 4,067
Avg. vs. Max. Vessel Capacity 103% 103%
Average TEU per Vessel (2007) 1,441 1,441
Avg. Vessel Utilization - % Discharge/Load 34% 34%
Berth Capacity - Avg. Vessel Basis 2,698,084 2,698,084
Berth Utilization - Avg. Vessel Basis 97% 97%
Avg. Discharge/Load per Max. Vessel 1,396 1,396
Berth Capacity - Max. Vessel Basis 2,612,708 2,612,708
Berth Utilization - Max. Vessel Basis 100% 100%
Port of Jacksonville Capacity Estimates
Overview
The Port of Jacksonville has three marine terminals owned and managed by the Jacksonville Port
Authority (JAXPORT). These terminals are leased to its tenant ocean carriers and terminal
operators. The terminals are located on the St. Johns River between 9 and 21 miles from the
ocean. Blount Island is the largest terminal with about 754 total acres and 223 container terminal
acres. Blount Island is about 9 miles from the Atlantic. The Talleyrand terminal is located in the
City of Jacksonville about 21 miles from the ocean. Talleyrand has a total of 173 acres with 60
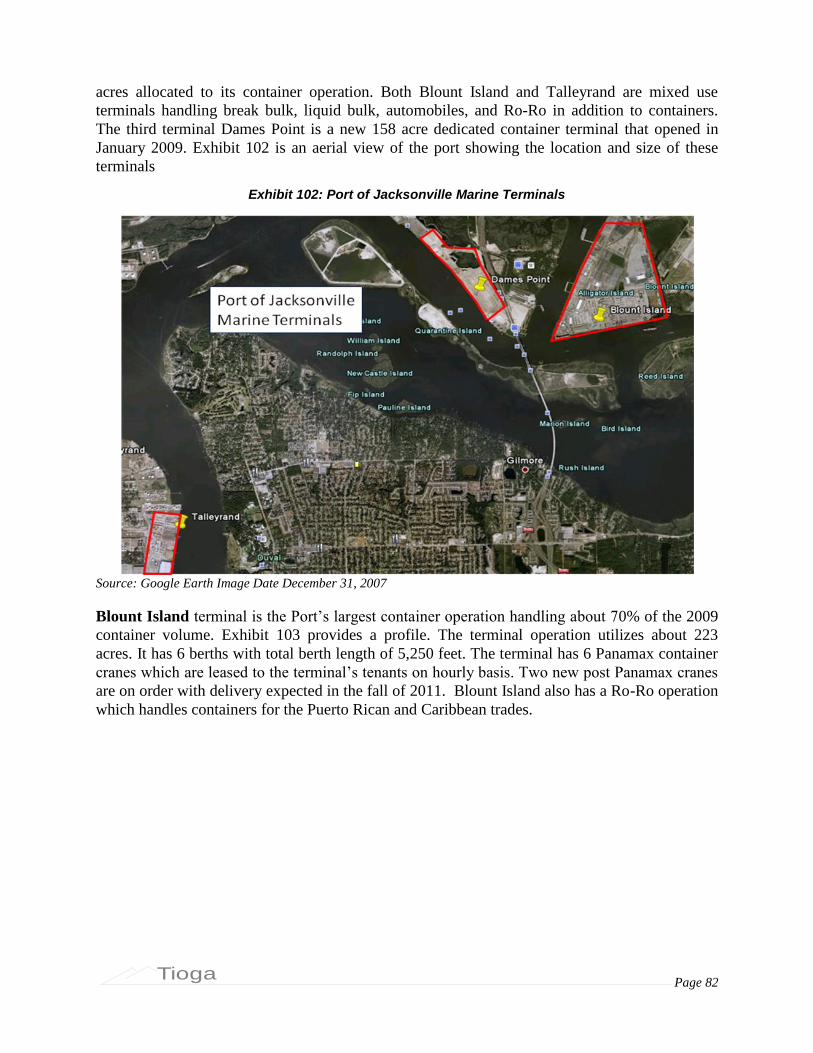
Page 82
Tioga
acres allocated to its container operation. Both Blount Island and Talleyrand are mixed use
terminals handling break bulk, liquid bulk, automobiles, and Ro-Ro in addition to containers.
The third terminal Dames Point is a new 158 acre dedicated container terminal that opened in
January 2009. Exhibit 102 is an aerial view of the port showing the location and size of these
terminals
Exhibit 102: Port of Jacksonville Marine Terminals
Source: Google Earth Image Date December 31, 2007
Blount Island terminal is the Port’s largest container operation handling about 70% of the 2009
container volume. Exhibit 103 provides a profile. The terminal operation utilizes about 223
acres. It has 6 berths with total berth length of 5,250 feet. The terminal has 6 Panamax container
cranes which are leased to the terminal’s tenants on hourly basis. Two new post Panamax cranes
are on order with delivery expected in the fall of 2011. Blount Island also has a Ro-Ro operation
which handles containers for the Puerto Rican and Caribbean trades.
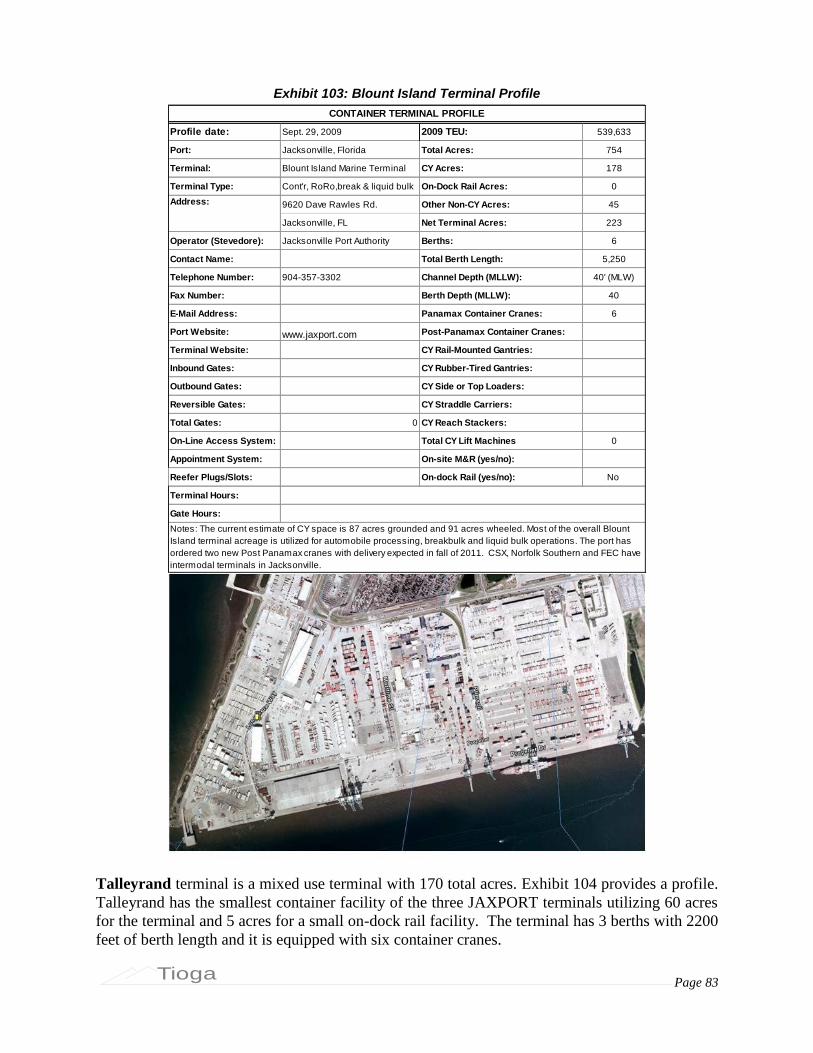
Page 83
Tioga
Exhibit 103: Blount Island Terminal Profile
Profile date: Sept. 29, 2009 2009 TEU: 539,633
Port: Jacksonville, Florida Total Acres: 754
Terminal: Blount Island Marine Terminal CY Acres: 178
Terminal Type: Cont'r, RoRo,break & liquid bulk On-Dock Rail Acres: 0
9620 Dave Rawles Rd. Other Non-CY Acres: 45
Jacksonville, FL Net Terminal Acres: 223
Operator (Stevedore): Jacksonville Port Authority Berths: 6
Contact Name: Total Berth Length: 5,250
Telephone Number: 904-357-3302 Channel Depth (MLLW): 40' (MLW)
Fax Number: Berth Depth (MLLW): 40
E-Mail Address: Panamax Container Cranes: 6
Port Website: www.jaxport.com Post-Panamax Container Cranes:
Terminal Website: CY Rail-Mounted Gantries:
Inbound Gates: CY Rubber-Tired Gantries:
Outbound Gates: CY Side or Top Loaders:
Reversible Gates: CY Straddle Carriers:
Total Gates: 0 CY Reach Stackers:
On-Line Access System: Total CY Lift Machines 0
Appointment System: On-site M&R (yes/no):
Reefer Plugs/Slots: On-dock Rail (yes/no): No
Terminal Hours:
Gate Hours:
CONTAINER TERMINAL PROFILE
Address:
Notes: The current estimate of CY space is 87 acres grounded and 91 acres wheeled. Most of the overall Blount
Island terminal acreage is utilized for automobile processing, breakbulk and liquid bulk operations. The port has
ordered two new Post Panamax cranes with delivery expected in fall of 2011. CSX, Norfolk Southern and FEC have
intermodal terminals in Jacksonville.
Talleyrand terminal is a mixed use terminal with 170 total acres. Exhibit 104 provides a profile.
Talleyrand has the smallest container facility of the three JAXPORT terminals utilizing 60 acres
for the terminal and 5 acres for a small on-dock rail facility. The terminal has 3 berths with 2200
feet of berth length and it is equipped with six container cranes.

Page 84
Tioga
Exhibit 104: Talleyrand Marine Terminal
Profle date: Sept. 29, 2009 2009 TEU: 164,441
Port: Jacksonville Total Acres: 173
Terminal: Talleyrand Marine Terminal CY Acres: 50
Terminal Type: Container, roro, break bulk On-Dock Rail Acres: 5
2085 Talleyrand Ave. Other Non-CY Acres: 10
Jacksonville, FL 32206 Net Terminal Acres: 60
Operator (Stevedore): Jacksonville Port Authority Berths: 3
Contact Name: Total Berth Length: 2200
Telephone Number: 904-357-3205 Channel Depth (MLLW): 38 (MLW)
Fax Number: Berth Depth (MLLW): 38
E-Mail Address: Panamax Container Cranes: 6
Port Website: www.jaxport.com Post-Panamax Container Cranes:
Terminal Website: CY Rail-Mounted Gantries:
Inbound Gates: CY Rubber-Tired Gantries: 2
Outbound Gates: CY Side or Top Loaders: 6
Reversible Gates: CY Straddle Carriers:
Total Gates: 0 CY Reach Stackers: 1
On-Line Access System: Total CY Lift Machines 9
Appointment System: On-site M&R (yes/no):
Reefer Plugs/Slots: On-dock Rail (yes/no): Yes
Terminal Hours:
Gate Hours:
CONTAINER TERMINAL PROFILE
Address:
Notes: The terminal has a small on dock rail facility served by the Talleyrand Terminal Railroad which connects to
both CSX and NS.
Dames Point Terminal is a new 158 acre dedicated container terminal that was opened in
January 2009. A terminal profile and an artist’s rendering of the completed terminal are provided
in Exhibit 105. The terminal has 2 berths with a total of 2400 feet of berth length. The terminal is
equipped with 6 Post-Panamax cranes and is operated by TraPac Inc., the marine terminal
operating company subsidiary of ocean carrier Mitsui OSK Lines (MOL).

Page 85
Tioga
Exhibit 105: Dames Point Container Terminal
Profile date: Sept. 29, 2009 2009 TEU: 48,269
Port: Jacksonville, FL Total Acres: 158
Terminal: Dames Point (TraPac) CY Acres: 133
Terminal Type: Container On-Dock Rail Acres: 0
9834 New Berlin Road Other Non-CY Acres: 25
Jacksonville, FL 32226 Net Terminal Acres: 158
Operator (Stevedore): TraPac Terminals Berths: 2
Contact Name: Total Berth Length: 2,400
Telephone Number: 904-696-4900 Channel Depth (MLLW): 40
Fax Number: Berth Depth (MLLW): 40
E-Mail Address: Panamax Container Cranes:
Port Website: www.jaxport.com Post-Panamax Container Cranes: 6
Terminal Website: www.trapac.com CY Rail-Mounted Gantries:
Inbound Gates: CY Rubber-Tired Gantries: 6
Outbound Gates: CY Side or Top Loaders:
Reversible Gates: CY Straddle Carriers:
Total Gates: 0 CY Reach Stackers:
On-Line Access System: Total CY Lift Machines 6
Appointment System: On-site M&R (yes/no):
Reefer Plugs/Slots: On-dock Rail (yes/no): No
Terminal Hours:
Gate Hours:
Notes: This terminal was just completed and opened for operations in January 2009. Currently the terminal
serves MOL, Hyundai and APL vessels. Volume levels are still low with about two vessels per week.
CONTAINER TERMINAL PROFILE
Address:
The Port’s shipping channel depth is currently maintained to 40 feet to for its first 15 miles from
the ocean to Drummond Point, which is beyond both Blount Island and Dames Point terminals.
However, the last 6 miles of the channel to the Talleyrand terminal are maintained to 38 feet.
The Port has a dredging project in progress to increase the channel depth to Talleyrand to 40 feet.
This project is expected to be completed by the end of 2010.

Page 86
Tioga
A second navigation issue that the Port is working on is to reduce tidal cross currents at Mile
Point where the Intracoastal Waterway cuts through the St. Johns River about 5 miles from the
ocean. Due to the effect of these cross currents from the intracoastal waterway, the operation of
larger vessels with draft of 33 feet or greater is limited to less than 12 hours per day when
incoming tides mitigate the cross currents. The Army Corps of Engineers currently has a study
underway to address this issue.
Container Yard Storage Capacity
Exhibit 106 summarizes land use for the Port of Jacksonville. The combined total acreage for all
three terminals in 1085 acres with net terminal area of 441 acres. This generates a net to gross
ratio of only 41% and a CY/Gross ratio of only 33%. The reason is that both Blount Island and
Talleyrand are mixed use terminals with most of the terminal area consumed in break bulk,
automobile, and liquid bulk uses. Expansion of the container operations at these two terminals
would require a reallocation of terminal property from existing non-container uses.
Exhibit 106: Port of Jacksonville Land Use
Port Land UseJax Blount
Isl.Jax Talleyrand
Jax Dames
Pt.Port Total
Gross Acres 754 173 158 1,085
CY Acres 178 50 133 361
Rail Acres - 5 - 5
Other Non-CY Acres 45 10 25 80
Net Berth/Gate/Yard Acres 223 60 158 441
CY/Gross Ratio 24% 29% 84% 33%
Exhibit 107 applies standard CY storage factors to the port acreage. Interpretation of aerial
photos for Blount Island and Talleyrand indicates CY areas are primarily stacked operations. The
new terminal at Dames Point is designed for RTG use. However, it appears that wheeled
operations are being used because the terminal is new and volume levels do not require the
additional CY capacity provided by grounded RTG operation. Overall this analysis shows that
the three terminals have sufficient CY capacity to handle future growth.
Exhibit 107: Port of Jacksonville CY Storage Capacity
Container Yard CapacityJax Blount
Isl.Jax Talleyrand
Jax Dames
Pt.Port Total
Wheeled Chassis Slots 7,280 1,200 6,400 14,880
Grounded Straddle Carrier Slots - - - -
Grounded Stacked Slots 17,400 7,000 - 24,400
Grounded RTG Slots - - 15,900 15,900
Grounded RMG Slots - - - -
TEU Storage Slots 24,680 8,200 22,300 55,180
Avg TEU Slots/CY Acre 139 164 168 153
Maximum Annual Slot Turnover 70.0 70.0 70.0 70.0
Maximum Annual CY TEU Capacity 1,727,600 574,000 1,561,000 3,862,600
Sustainable CY TEU Capacity @ 80% 1,382,080 459,200 1,248,800 3,090,080
2008 Annual TEU 539,633 164,441 48,269 754,352
2008 TEU per CY Slot 22 20 2 14
2008 CY Capacity Utilization 39% 36% 4% 24%

Page 87
Tioga
Crane Capacity
Exhibit 108 provides a summary of Jacksonville cranes and an estimate of crane capacity. There
are six cranes operated at each of the three facilities. Annual crane capacity for the port is
estimated at 17%. The analysis shows there will be adequate crane capacity for future growth. In
addition, the Port has two new cranes on order for Blount Island. It is also clear that the low
volume levels at Dames Point have not yet tested the terminal’s crane capacity.
Exhibit 108: Port of Jacksonville Near Term Crane Capacity
Crane CapacityJax Blount
Isl.Jax Talleyrand
Jax Dames
Pt.Port Total
Cranes 6 6 6 18
Available Crane Hours per Day 16 16 16 16
Current Annual Operating Days 250 250 250 250
Current Annual Hours/Crane 4,000 4,000 4,000 4,000
Annual Available Crane Hours 24,000 24,000 24,000 72,000
Sustainable Hours @ 80% 19,200 19,200 19,200 57,600
Avg. TEU/Available Crane-hour 28.1 8.6 2.5 13.1
Avg. Annual TEU/Crane 89,939 27,407 8,045 41,908
Crane Capacity, Moves/hour 35 35 35 35
Sustainable Moves/Hr @ 80% 28 28 28 28
Port average TEU/container 1.80 1.80 1.80 1.80
Crane Capacity TEU/hour 63 63 63 63
Annual Crane Capacity 1,512,000 1,512,000 1,512,000 4,536,000
Current Annual TEU 539,633 164,441 48,269 754,352
Current Crane Utilization 36% 11% 3% 17%
Berth Capacity
The Port of Jacksonville berth capacity estimated in TEU for the maximum vessel size is
summarized in Exhibit 109. This estimate generates near term berth capacity 1.7 million TEU
with berth utilization for the port at 44%. However, the overall average is influenced by the low
berth utilization estimate for Dames Point.
Berth capacity on a vessel call basis is summarized in Exhibit 110. This approach generates
berth a berth capacity estimate of 2860 vessel calls and 2009 estimated berth utilization of 31%.
The Port has plans in progress to maintain its entire 21-mile approach channel to 41 feet, and
there is a Corps study reportedly in progress to consider greater depths.

Page 88
Tioga
Exhibit 109: Port of Jacksonville Near Term Berth Capacity Max Vessel Basis
Berth Capacity - Max Vessel BasisJax Blount
Isl.Jax Talleyrand
Jax Dames
Pt.Port Total
Berths 6 3 2 11
Berth length 5,250 2,200 2,400 9,850
Berth Depth - Feet 40 38 40 40
Max Sailing Draft 37 35 37 37
Corresponding Design Draft @ 95% 39 37 39 39
Corresponding DWT 42,512 35,611 42,512 42,512
Nominal Max Vessel TEU 3,420 2,845 3,420 3,420
Corresponding Vessel Length - Feet 800 800 800 800
Vessel Spacing (Beam) 105 100 105 105
Length requirement 905 900 905 905
Available Berths for Max Vessel 6.0 2.0 3.0 11.0
Port average TEU/container 1.75 1.75 1.75 1.75
2009 TEU 754,352
Avg. TEU/Vessel 855
Avg. Vessel DWT 48,220
Average Est. Vessel Capacity TEU 3,895
Average Discharge & Load % 22%
Average TEU per Max Vessel 751 751 751 751
Max annual calls per berth 260 260 260 260
Sustainable Calls per berth @ 80% 208 208 208 208
Total Sustainable Vessel Calls 1,248 416 624 2,288
Annual Berth Capacity TEU 937,092 312,364 468,546 1,718,002
2008 Annual TEU 539,633 164,441 48,269 754,352
Berth Utilization, Max Vessel Basis 58% 53% 10% 44%
Exhibit 110: Port of Jacksonville 2009 Berth Capacity Vessel Call Basis
Berth Utilization - Vessel Call BasisJax Blount
Isl.Jax Talleyrand
Jax Dames
Pt.Port Total
Max annual calls per berth 260 260 260 260
Sustainable Calls per berth @ 80% 208 208 208 208
Available Berths 6 3 2 11
Total Sustainable Vessel Calls 1,248 624 416 2,288
2009 Estimated Vessel calls 882
Berth Utilization 39%
Capacity and Productivity Summary
Exhibit 111 summarizes the capacity and productivity analysis for CY space, container cranes,
and vessel berths for the Port of Jacksonville. The port currently has estimated sustainable CY
capacity of 3 million TEU with current capacity utilization of 24%. Container crane capacity at
the port is estimated at 4.5 million TEU with current utilization at 17%. Berth utilization on a
vessel call basis is 31% and on a maximum vessel size basis it is 44%. In all cases the low level
of utilization at the Dames Point terminal has reduced the average for the port. The terminal has
just opened and volume has not grown to a more normal level of utilization due to the economic
downturn. Overall the measures of this analysis indicate that the Port of Jacksonville has
sufficient capacity to handle future growth at its existing terminals.

Page 89
Tioga
Exhibit 111: Port of Jacksonville Near Term Capacity and Productivity Summary
Terminal Space Jax Blount Isl.Jax
Talleyrand
Jax Dames
Pt.Charleston
2009 TEU 539,633 164,441 48,269 754,352
Gross Acres 754 173 158 1,085CY Acres 178 50 133 361CY/Gross Ratio 24% 29% 84% 33%Sustainable CY TEU Capacity @ 80% 1,382,080 459,200 1,248,800 3,090,080 Annual TEU/Gross Acre 716 951 306 695 Annual TEU/CY Acre 3,032 3,289 363 2,090 Est. CY TEU Slots 24,680 8,200 22,300 55,180 Avg. CY Slots/ Acre - Density 139 164 168 153 Avg. Annual TEU/CY Slot (Turns) 22 20 2 14 CY Utilization 39% 36% 4% 24%
Container Cranes Jax Blount Isl.Jax
Talleyrand
Jax Dames
Pt.Charleston
Cranes 6 6 6 18
Cranes per Berth 1.0 2.0 3.0 1.6
Annual Crane Capacity - TEU 1,512,000 1,512,000 1,512,000 4,536,000
Avg. Moves/Available Crane-Hour 28.1 8.6 2.5 13.1
Annual TEU/Crane 89,939 27,407 8,045 41,908
Annual Moves/Crane 49,966 15,226 4,469 23,282
Annual Vessel Calls/Crane (2009) - - 49
Crane Utilization 36% 11% 3% 17%
Berths and Vessels Jax Blount Isl.Jax
Talleyrand
Jax Dames
Pt.Charleston
Berths 6 3 2 11
Berth Feet 5,250 2,200 2,400 9,850
Annual Vessel Calls per Berth (2007) 80
Berth Utilization - Vessel Call Basis 39%
Annual TEU per Berth 89,939 54,814 24,135 68,577
Annual TEU/Foot of Berth 103 75 20 77
Average Vessel Capacity - TEU - - - 3,895
Est. Max. Vessel Capacity - TEU 3,420 2,845 3,420 3,420
Avg. vs. Max. Vessel Capacity 0% 0% 0% 114%
Average TEU per Vessel (2007) 855
Avg. Vessel Utilization - % Discharge/Load 22%
Berth Capacity - Avg. Vessel Basis 1,956,868
Berth Utilization - Avg. Vessel Basis 39%
Avg. Discharge/Load per Max. Vessel 751
Berth Capacity - Max. Vessel Basis 1,718,002
Berth Utilization - Max. Vessel Basis 44%
Port Everglades Capacity Estimates
Overview
Port Everglades has two port areas that handle container cargoes. The primary container terminal
is at Southport with 238 acres of space leased to private terminal operators. The Midport area has
77 acres with two areas leased to terminal operators. Port Everglades terminals are a short
distance to the Atlantic Ocean. The Midport terminals are between one and two miles to the
ocean and the Southport berths are less than three miles. Southport is a dedicated container
terminal with 6 berths and total berth length of 4500 feet. Southport provides 7 Post-Panamax
gantry cranes and has Ro-Ro capability. The Midport terminals have 5 berths and total berth

Page 90
Tioga
length of 2845 feet. The Midport basin berths have one gantry crane and one mobile harbor crane
and also have Ro-Ro capability. For purposes of this analysis the Southport and Midport areas
have been combined. Exhibit 112 provides an aerial view of the Midport and Southport
terminals.
Exhibit 112: Port Everglades Container Terminals
Source: Google Earth Image Date December 31, 2008
Southport terminal area handles about two thirds of the Port’s container volume. It has three
major terminal operators that lease property from the Port. Florida International Terminals (FIT)
operates a public terminal that handles several liner companies. FIT was formed in 2004 from the
combination of two large Latin American terminal operating companies associated with Chilean
ocean carriers CSAV and CCNI. FIT was organized to manage the Port Everglades marine
terminal. Crowley Liner Services operates a terminal for its Port Everglades Ro-Ro operation.
The third terminal operator is Port Everglades Terminal LLC which operates the Mediterranean
Shipping terminal at Southport.
Exhibit 113 provides a profile of the Port Everglades container terminals with an aerial photo of
the Southport operating area. As a part of the Port’s five year expansion plan additional CY
space of 41 acres is being developed in the Southwest corner of the terminal. In addition the plan
includes provisions for development of an on dock rail terminal which would be served by the
FEC railway. These development areas are also shown in the Exhibit.

Page 91
Tioga
Exhibit 113: Port Everglades Container Terminal Profile
Profle date: Sept. 30, 2009 2008 TEU: 985,095
Port: Port Everglades Total Acres: 315
Terminal: Southport & Midport CY Acres: 245
Terminal Type: Container,roro, breakbulk On-Dock Rail Acres: 0
1850 Eller Dr. Other Non-CY Acres:
Fort Lauderdale, FL 33316 Net Terminal Acres:
Operator (Stevedore): Various (see Notes) Berths: 11
Contact Name: Total Berth Length: 7,345
Telephone Number: 954-765-4718 (operations mgr.) Channel Depth (MLLW):
Fax Number: 954-523-3404 Berth Depth (MLLW): 42
E-Mail Address: Panamax Container Cranes: 1
Port Website: www.porteverglades.net Post-Panamax Container Cranes: 7
Terminal Website: CY Rail-Mounted Gantries:
Inbound Gates: CY Rubber-Tired Gantries:
Outbound Gates: CY Side or Top Loaders:
Reversible Gates: CY Straddle Carriers:
Total Gates: 0 CY Reach Stackers:
On-Line Access System: Total CY Lift Machines 0
Appointment System: On-site M&R (yes/no):
Reefer Plugs/Slots: On-dock Rail (yes/no): No
Terminal Hours:
Gate Hours:
CONTAINER TERMINAL PROFILE
Address:
Notes: The port is divided into three operating areas, Southport, Midport and Northport. Southport and Midport
areas have container handling capability. The Southport area is the primary container terminal with Florida
International terminals serving 7 major container carriers. In addition Crowley and Mediterranean Shipping (MSC)
are located at Southport. The Midport area handles numerous Caribbean Carriers plus Chiquita and Dole.
Southport Area 238 acres; Midport Area 77 acres. Southport has 6 Berths container & roro total 4500 feet, Midport
has 5 berths container, cargo, cruise and roro total 2845 ft. Southport – 7 post Panamax cranes, Midport 1 gantry
cranes and 1 mobile harbor crane. FEC Fort Lauderdale terminal within 2 miles of the port.

Page 92
Tioga
Midport terminal handles smaller lines that serve the Caribbean and South American markets. In
addition, Chiquita and Dole vessels serve the port over the Midport terminal bringing fresh fruit
and vegetables utilizing Berth 29. Exhibit 114 provides an aerial of the Midport area. The aerial
from December 31, 2008 shows the Midport Basin CY at the start of a construction project to
demolish a building and expand the CY area. The Midport terminal berths are also used by cruise
ships that call on Port Everglades. The berth and cruise terminal adjacent to the Basin CY have
been expanded to handle 1225 foot Genesis-class cruise ships.
Exhibit 114: Midport Terminal Area
Container Yard Storage Capacity
Exhibit 115 summarizes land use at Port Everglades. The total area for the port’s container
operations is 315 acres, with 267 acres of CY storage and a CY/Gross ratio of 85%.
Exhibit 115: Port Everglades Land Use
Port Land Use South & Mid Port Port Total
Gross Acres 315 315
CY Acres 267 267
Rail Acres - -
Other Non-CY Acres 71 71
Net Berth/Gate/Yard Acres - -
CY/Gross Ratio 85% 85%

Page 93
Tioga
Exhibit 116 applies standard CY storage factors to the port acreage. The port has a mix of
grounded and stacked CY operations. The CY area has been estimated to be 267 acres producing
41,400 TEU storage slots. Annual CY sustainable TEU capacity is estimated to 2.3 million TEU.
This produces annual utilization of 42% relative to 2008 volume. This analysis indicates that the
port has adequate CY capacity for future growth. Not included in the analysis is a 41 acre area of
Southport that is currently being expanded for future port use and which will add CY capacity.
Exhibit 116: Port Everglades Near Term CY Capacity
Container Yard Capacity South & Mid Port Port Total
Wheeled Chassis Slots 8,000 8,000
Grounded Straddle Carrier Slots - -
Grounded Stacked Slots 33,400 33,400
Grounded RTG Slots - -
Grounded RMG Slots - -
TEU Storage Slots 41,400 41,400
Avg TEU Slots/CY Acre 155 155
Maximum Annual Slot Turnover 70.0 70.0
Maximum Annual CY TEU Capacity 2,898,000 2,898,000
Sustainable CY TEU Capacity @ 80% 2,318,400 2,318,400
2008 Annual TEU 985,095 985,095
2008 TEU per CY Slot 24 24
2008 CY Capacity Utilization 42% 42%
Crane Capacity
Exhibit 117 provides a summary of Port Everglades cranes and an estimate of crane capacity.
The port provides 8 cranes for use by its tenants. Estimated annual crane capacity at the port is
2.0 million TEU with 2008 utilization at 49%. The utilization estimate may be somewhat
overstated because the port has a sizeable Ro-Ro operation which is in the TEU count but does
not utilize container cranes for loading and unloading.
Exhibit 117: Port Everglades Near Term Crane Capacity
Crane Capacity South & Mid Port Port Total
Cranes 8 8
Available Crane Hours per Day 16 16
Current Annual Operating Days 250 250
Current Annual Hours/Crane 4,000 4,000
Annual Available Crane Hours 32,000 32,000
Sustainable Hours @ 80% 25,600 25,600
Avg. TEU/Available Crane-hour 38.5 38.5
Avg. Annual TEU/Crane 123,137 123,137
Crane Capacity, Moves/hour 35 35
Sustainable Moves/Hr @ 80% 28 28
Port average TEU/container 1.80 1.80
Crane Capacity TEU/hour 63 63
Annual Crane Capacity 2,016,000 2,016,000
Current Annual TEU 985,095 985,095
Current Crane Utilization 49% 49%
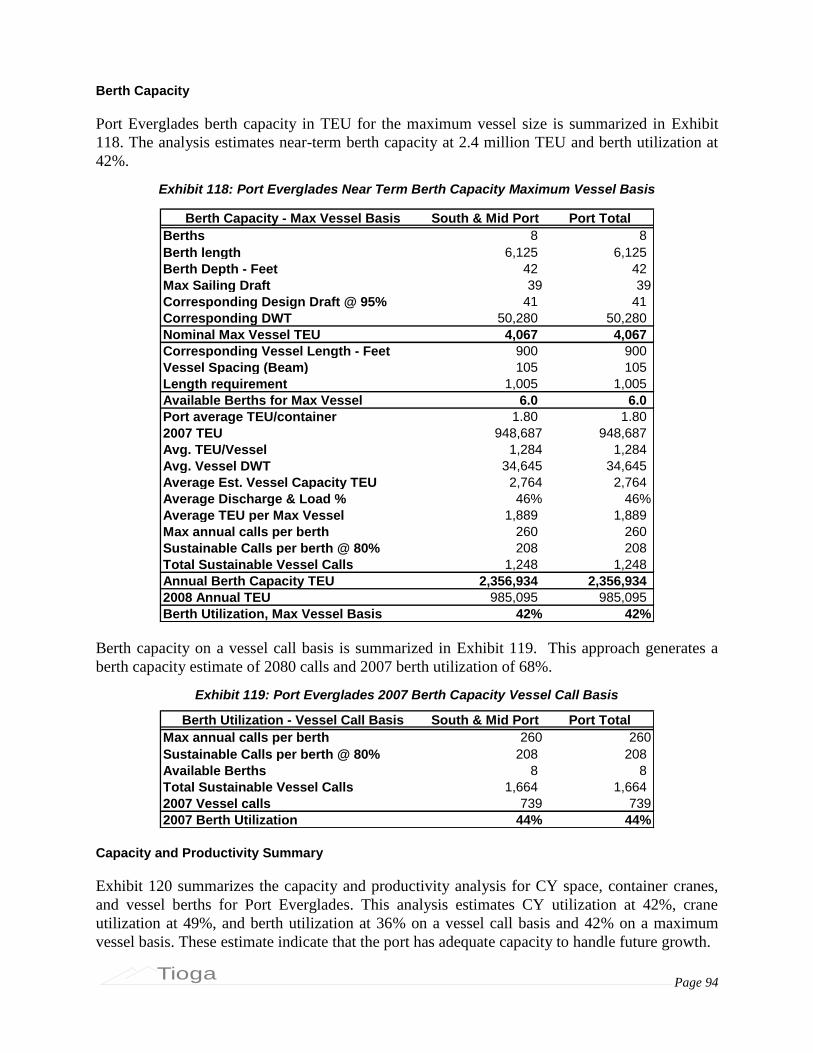
Page 94
Tioga
Berth Capacity
Port Everglades berth capacity in TEU for the maximum vessel size is summarized in Exhibit
118. The analysis estimates near-term berth capacity at 2.4 million TEU and berth utilization at
42%.
Exhibit 118: Port Everglades Near Term Berth Capacity Maximum Vessel Basis
Berth Capacity - Max Vessel Basis South & Mid Port Port Total
Berths 8 8
Berth length 6,125 6,125
Berth Depth - Feet 42 42
Max Sailing Draft 39 39
Corresponding Design Draft @ 95% 41 41
Corresponding DWT 50,280 50,280
Nominal Max Vessel TEU 4,067 4,067
Corresponding Vessel Length - Feet 900 900
Vessel Spacing (Beam) 105 105
Length requirement 1,005 1,005
Available Berths for Max Vessel 6.0 6.0
Port average TEU/container 1.80 1.80
2007 TEU 948,687 948,687
Avg. TEU/Vessel 1,284 1,284
Avg. Vessel DWT 34,645 34,645
Average Est. Vessel Capacity TEU 2,764 2,764
Average Discharge & Load % 46% 46%
Average TEU per Max Vessel 1,889 1,889
Max annual calls per berth 260 260
Sustainable Calls per berth @ 80% 208 208
Total Sustainable Vessel Calls 1,248 1,248
Annual Berth Capacity TEU 2,356,934 2,356,934
2008 Annual TEU 985,095 985,095
Berth Utilization, Max Vessel Basis 42% 42%
Berth capacity on a vessel call basis is summarized in Exhibit 119. This approach generates a
berth capacity estimate of 2080 calls and 2007 berth utilization of 68%.
Exhibit 119: Port Everglades 2007 Berth Capacity Vessel Call Basis
Berth Utilization - Vessel Call Basis South & Mid Port Port Total
Max annual calls per berth 260 260
Sustainable Calls per berth @ 80% 208 208
Available Berths 8 8
Total Sustainable Vessel Calls 1,664 1,664
2007 Vessel calls 739 739
2007 Berth Utilization 44% 44%
Capacity and Productivity Summary
Exhibit 120 summarizes the capacity and productivity analysis for CY space, container cranes,
and vessel berths for Port Everglades. This analysis estimates CY utilization at 42%, crane
utilization at 49%, and berth utilization at 36% on a vessel call basis and 42% on a maximum
vessel basis. These estimate indicate that the port has adequate capacity to handle future growth.
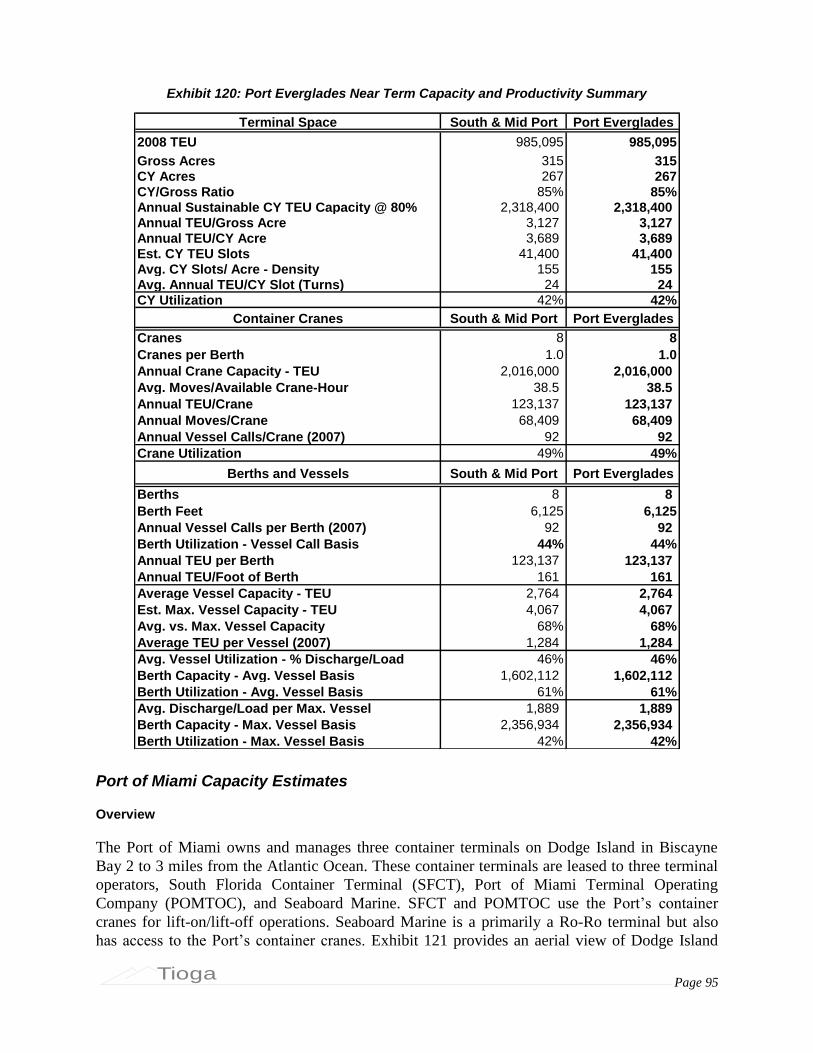
Page 95
Tioga
Exhibit 120: Port Everglades Near Term Capacity and Productivity Summary
Terminal Space South & Mid Port Port Everglades
2008 TEU 985,095 985,095
Gross Acres 315 315CY Acres 267 267CY/Gross Ratio 85% 85%Annual Sustainable CY TEU Capacity @ 80% 2,318,400 2,318,400 Annual TEU/Gross Acre 3,127 3,127 Annual TEU/CY Acre 3,689 3,689 Est. CY TEU Slots 41,400 41,400 Avg. CY Slots/ Acre - Density 155 155 Avg. Annual TEU/CY Slot (Turns) 24 24 CY Utilization 42% 42%
Container Cranes South & Mid Port Port Everglades
Cranes 8 8
Cranes per Berth 1.0 1.0
Annual Crane Capacity - TEU 2,016,000 2,016,000
Avg. Moves/Available Crane-Hour 38.5 38.5
Annual TEU/Crane 123,137 123,137
Annual Moves/Crane 68,409 68,409
Annual Vessel Calls/Crane (2007) 92 92
Crane Utilization 49% 49%
Berths and Vessels South & Mid Port Port Everglades
Berths 8 8
Berth Feet 6,125 6,125
Annual Vessel Calls per Berth (2007) 92 92
Berth Utilization - Vessel Call Basis 44% 44%
Annual TEU per Berth 123,137 123,137
Annual TEU/Foot of Berth 161 161
Average Vessel Capacity - TEU 2,764 2,764
Est. Max. Vessel Capacity - TEU 4,067 4,067
Avg. vs. Max. Vessel Capacity 68% 68%
Average TEU per Vessel (2007) 1,284 1,284
Avg. Vessel Utilization - % Discharge/Load 46% 46%
Berth Capacity - Avg. Vessel Basis 1,602,112 1,602,112
Berth Utilization - Avg. Vessel Basis 61% 61%
Avg. Discharge/Load per Max. Vessel 1,889 1,889
Berth Capacity - Max. Vessel Basis 2,356,934 2,356,934
Berth Utilization - Max. Vessel Basis 42% 42%
Port of Miami Capacity Estimates
Overview
The Port of Miami owns and manages three container terminals on Dodge Island in Biscayne
Bay 2 to 3 miles from the Atlantic Ocean. These container terminals are leased to three terminal
operators, South Florida Container Terminal (SFCT), Port of Miami Terminal Operating
Company (POMTOC), and Seaboard Marine. SFCT and POMTOC use the Port’s container
cranes for lift-on/lift-off operations. Seaboard Marine is a primarily a Ro-Ro terminal but also
has access to the Port’s container cranes. Exhibit 121 provides an aerial view of Dodge Island

Page 96
Tioga
and its container terminals. The Port provides 5 container berths with a total berth length of 5000
feet. The port owns 9 container cranes: 7 cranes are Panamax and 2 are Post-Panamax. The
cranes are maintained by the Port of Miami Crane Management Company (PMCM) and are
operated by the terminal operating companies. In addition to the container terminals the Dodge
Island port complex provides five cruise terminals which handled over 4 million passengers in
2008.
Exhibit 121: Port of Miami Container Terminals
Source: Google Earth Image Date November 17, 2007
Access to the Port of Miami is via Port Boulevard which runs through the city of Miami. A
major project is being advanced by the Port to develop a tunnel which will route port traffic
around the city to US 41 and I-395 as shown in Exhibit 122 below. Construction on this $607
million project is set to begin in mid 2010 with tunnel opening projected for 2014.
Exhibit 122: Miami Tunnel Project
SFCT is a joint venture terminal operator between Terminal Link (CMA-CGM) and APM
Terminals operating the former APM Terminals facility. It was formed when ocean carrier
CMA-CGM left POMTOC and took space in the former APM terminal. The terminal has 74
acres and utilizes the Port of Miami’s berth space and container cranes. Exhibit 123 provides a
profile of this terminal.

Page 97
Tioga
Exhibit 123: South Florida Container Terminal Profile
Profle date: Sept. 30, 2009 2008 TEU: (Miami FY Estimate) 271,182
Port: Miami Total Acres: 74
Terminal: South Florida Cont. Term. CY Acres: _
Terminal Type: Container On-Dock Rail Acres: 0
2299 Port Blvd. Other Non-CY Acres: 0
Miami, FL 33132 Net Terminal Acres: 74
Operator (Stevedore): Eller-ITO Berths: 7
Contact Name: Mark Baker Total Berth Length: 5,000
Telephone Number: 305-347-3801 Channel Depth (MLLW): 42'
Fax Number: 305-358-5106 Berth Depth (MLLW): 42'
E-Mail Address: [email protected] Container Cranes: 7
Port Website: www.miamidade.gov Post-Panamax Container Cranes: 2
Terminal Website: www.apmterminals.com CY Rail-Mounted Gantries: 0
Inbound Gates: 10 lanes, all reversible CY Rubber-Tired Gantries: 0
Outbound Gates: CY Side or Top Loaders: 22
Reversible Gates: CY Straddle Carriers: 0
Total Gates: 10 CY Reach Stackers: 0
On-Line Access System: yes Total CY Lift Machines 22
Appointment System: yes On-site M&R (yes/no): yes
Reefer Plugs/Slots: 538 On-dock Rail (yes/no): No
Terminal Hours:
Gate Hours:
(Diagram)
CONTAINER TERMINAL PROFILE
Address:
available to work container vessels 24 hours
Mon-Fri 0800 – 1630 (closed for lunch from 1200-1300)
Notes: South Florida Continer Terminal was formed when CMA-CGM left the POMTOC terminal and took up space
in cooperation with APM. SFCT terminal is adjacent to the Port of Miami Container Terminal Operating Company
(POMTOC) terminal. Both terminals share use of the berths and container cranes.
POMTOC is a non-carrier owned terminal operating company which serves over 30 ocean
carriers. The terminal occupies 120 acres and utilizes the Port’s berths and cranes as does SFCT.
Exhibit 124 provides a profile of the POMTOC terminal.

Page 98
Tioga
Exhibit 124: Port of Miami Terminal Operating Company Terminal (POMTOC)
Profle date: Sept. 30, 2009 2008 TEU: (Miami FY Estimate) 207,271
Port: Miami Total Acres: 120
Terminal: POMTOC CY Acres: same
Terminal Type: Container On-Dock Rail Acres: 0
1007 North America Way, # 400 Other Non-CY Acres: 0
Miami, FL 33132 Net Terminal Acres: 120
Operator (Stevedore): Eller-ITO & Florida Steve. Berths: 7
Contact Name: John Ballestero Total Berth Length: 5,000
Telephone Number: 305-416-7601 Channel Depth (MLLW): 42'
Fax Number: 305-374-6724 Berth Depth (MLLW): 42'
E-Mail Address: [email protected] Panamax Container Cranes: 7
Port Website: www.miamidade.gov Post-Panamax Container Cranes: 2
Terminal Website: www.pomtoc.com CY Rail-Mounted Gantries: 0
Inbound Gates: 10 CY Rubber-Tired Gantries: 0
Outbound Gates: 6 CY Side or Top Loaders: 18
Reversible Gates: 4 CY Straddle Carriers: 0
Total Gates: 16 CY Reach Stackers: 0
On-Line Access System: yes Total CY Lift Machines 18
Appointment System: yes On-site M&R (yes/no): yes
Reefer Plugs/Slots: 250 On-dock Rail (yes/no): No
Terminal Hours:
Gate Hours:
CONTAINER TERMINAL PROFILE
Address:
available to work container vessels 24 hours.
0800- 1700, closed for lunch from 1200- 1300.
Notes: POMTOC operates a public container terminal serving 30 ocean carriers at the port of Miami. The terminal
has its own gate complex. The POMTOC terminal is adjacent to the South Florida Container Terminal and
Seaboard Marine. All three terminals share the berth space and gantry cranes.
Seaboard Marine terminal is a private terminal operated by Seaboard Marine for its Caribbean
trades and South American trades. The terminal has a total of 84 acres and has 10 berths with
total berth length of 6500 feet. The terminal utilizes mobile harbor cranes and Ro-Ro for loading
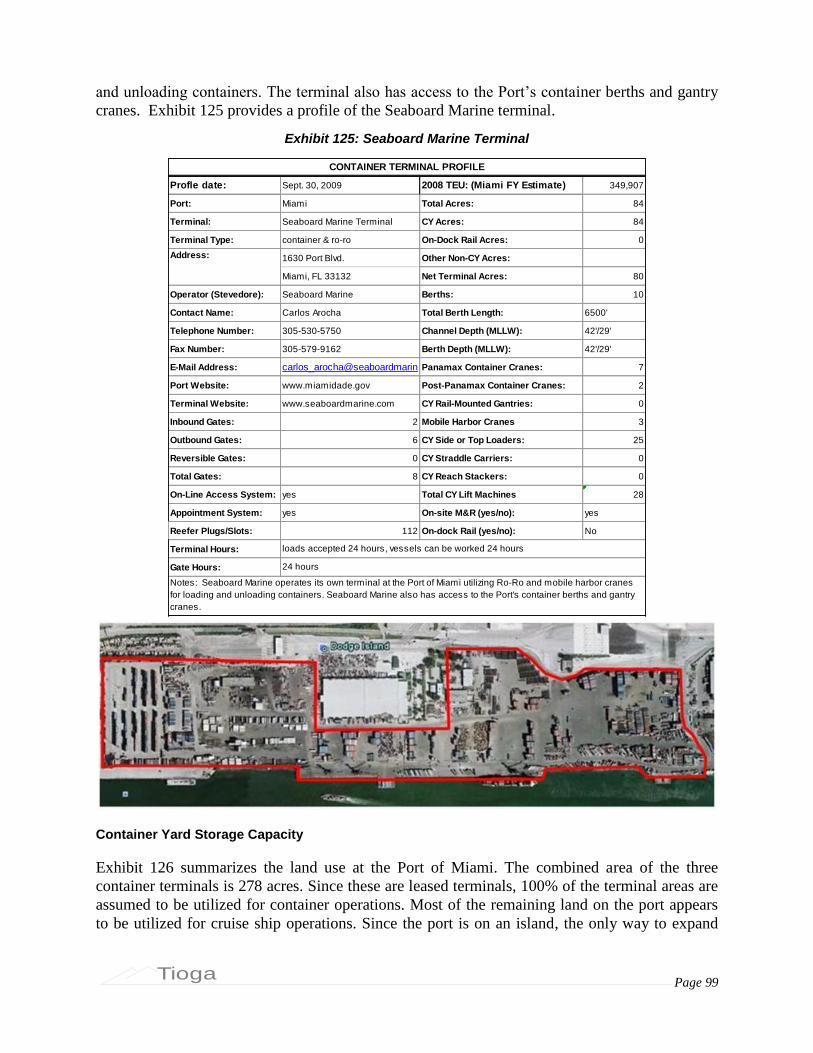
Page 99
Tioga
and unloading containers. The terminal also has access to the Port’s container berths and gantry
cranes. Exhibit 125 provides a profile of the Seaboard Marine terminal.
Exhibit 125: Seaboard Marine Terminal
Profle date: Sept. 30, 2009 2008 TEU: (Miami FY Estimate) 349,907
Port: Miami Total Acres: 84
Terminal: Seaboard Marine Terminal CY Acres: 84
Terminal Type: container & ro-ro On-Dock Rail Acres: 0
1630 Port Blvd. Other Non-CY Acres:
Miami, FL 33132 Net Terminal Acres: 80
Operator (Stevedore): Seaboard Marine Berths: 10
Contact Name: Carlos Arocha Total Berth Length: 6500'
Telephone Number: 305-530-5750 Channel Depth (MLLW): 42'/29'
Fax Number: 305-579-9162 Berth Depth (MLLW): 42'/29'
E-Mail Address: carlos_arocha@seaboardmarin Panamax Container Cranes: 7
Port Website: www.miamidade.gov Post-Panamax Container Cranes: 2
Terminal Website: www.seaboardmarine.com CY Rail-Mounted Gantries: 0
Inbound Gates: 2 Mobile Harbor Cranes 3
Outbound Gates: 6 CY Side or Top Loaders: 25
Reversible Gates: 0 CY Straddle Carriers: 0
Total Gates: 8 CY Reach Stackers: 0
On-Line Access System: yes Total CY Lift Machines 28
Appointment System: yes On-site M&R (yes/no): yes
Reefer Plugs/Slots: 112 On-dock Rail (yes/no): No
Terminal Hours:
Gate Hours:
CONTAINER TERMINAL PROFILE
Address:
Notes: Seaboard Marine operates its own terminal at the Port of Miami utilizing Ro-Ro and mobile harbor cranes
for loading and unloading containers. Seaboard Marine also has access to the Port's container berths and gantry
cranes.
loads accepted 24 hours, vessels can be worked 24 hours
24 hours
Container Yard Storage Capacity
Exhibit 126 summarizes the land use at the Port of Miami. The combined area of the three
container terminals is 278 acres. Since these are leased terminals, 100% of the terminal areas are
assumed to be utilized for container operations. Most of the remaining land on the port appears
to be utilized for cruise ship operations. Since the port is on an island, the only way to expand

Page 100
Tioga
container area is to convert other port land to container operation. For the Port as a whole, there
are an estimated 189 acres of CY space for a CY/Gross ratio of 68%.
Exhibit 126: Port of Miami Land Use
Port Land Use SFCT Seaboard POMTOC Port Total
Gross Acres 74 84 120 278
CY Acres 56 50 83 189
Rail AcresOther Non-CY Acres 18 34 37 89
Net Berth/Gate/Yard Acres 74 84 120 278
CY/Gross Ratio 76% 60% 69% 68%
Exhibit 127 applies standard CY storage factors to the port acreage. Based on review of aerial
photos the CY area is a mixture of wheeled and grounded use. It was estimated that the
combined CY area was 189 acres producing 30,080 storage slots. Annual CY sustainable TEU
capacity is estimated at 1.7 million TEU producing capacity utilization of 70% relative to 2008
volume. However it should be noted that the Seaboard operation is primarily Ro-Ro which may
not have the same dwell time or utilization characteristics as the SFTC or POMTOC terminals.
Exhibit 127: Port of Miami CY Storage Capacity
Container Yard Capacity SFCT Seaboard POMTOC Port Total
Wheeled Chassis Slots 800 2,000 400 3,200
Grounded Straddle Carrier Slots 4,000 - 7,680 11,680
Grounded Stacked Slots 4,200 5,000 6,000 15,200
Grounded RTG Slots - - - -
Grounded RMG Slots - - - -
TEU Storage Slots 9,000 7,000 14,080 30,080
Avg TEU Slots/CY Acre 161 140 170 159
Maximum Annual Slot Turnover 70.0 70.0 70.0 70.0
Maximum Annual CY TEU Capacity 630,000 490,000 985,600 2,105,600
Sustainable CY TEU Capacity @ 80% 504,000 392,000 788,480 1,684,480
2008 Annual TEU 388,329 501,062 296,809 1,186,190
2008 TEU per CY Slot 43 72 21 39
2008 CY Capacity Utilization 77% 128% 38% 70%
Crane Capacity
Exhibit 128 provides a summary of the crane operation and capacity for the combined SFCT and
POMTOC terminals. These two terminals share the 9 cranes and berth space adjacent to their
terminals. Crane capacity for this container operation is estimated to be 2.2 million TEU with
2008 utilization at 31%. Based on this analysis it appears that there is adequate crane capacity to
handle future growth.
Although the Seaboard marine operation can utilize the ports container berths and cranes it was
assumed that only the SFCT and POMTOC operations used these facilities. The Seaboard
facility handles self unloading vessels and R0-Ro vessels. It also has three mobile harbor cranes
to support its operations. Crane capacity calculations are not applicable to this type operation.

Page 101
Tioga
Exhibit 128: Port of Miami Near Term Crane Capacity
Crane Capacity SFCT Seaboard POMTOC SFCT & POMTOC
Cranes Not Applicable Not Applicable Not Applicable 9
Available Crane Hours per Day 16
Current Annual Operating Days 250
Current Annual Hours/Crane 4,000
Annual Available Crane Hours 36,000
Sustainable Hours @ 80% 28,800
Avg. TEU/Available Crane-hour 41.2
Avg. Annual TEU/Crane 76,127
Crane Capacity, Moves/hour 35
Sustainable Moves/Hr @ 80% 28
Port average TEU/container 1.75
Crane Capacity TEU/hour 61
Annual Crane Capacity 2,205,877
Current Annual TEU (SFCT & POMTOC) 685,139
Current Crane Utilization 31%
Berth Capacity
Port of Miami berth capacity estimated for the maximum vessel size is summarized in Exhibit
129. Berth capacity was estimated separately for the combined SFCT and POMTOC and the
Seaboard terminal. The annual berth capacity for the SFTC and POMTOC berth space was
estimated at 1.0 million TEU with utilization of 84%. The Seaboard facility had annual berth
capacity estimate of 2.3 million TEU with utilization of 21%. The maximum vessel analysis
may not be applicable to the Seaboard facility as it currently handles much smaller vessels
because of the markets that Seaboard serves.
Exhibit 129: Port of Miami Near Term Berth Capacity Maximum Vessel Basis
Berth Capacity - Max Vessel Basis SFCT Seaboard POMTOC SFCT & POMTOC
Berths Not Applicable 10 Not Applicable 7
Berth length 6,500 5,000
Berth Depth - Feet 42 42
Max Sailing Draft 39 39
Corresponding Design Draft @ 95% 41 41
Corresponding DWT 50,280 50,280
Nominal Max Vessel TEU 4,067 4,067
Corresponding Vessel Length - Feet 900 900
Vessel Spacing (Beam) 105 105
Length requirement 1,005 1,005
Available Berths for Max Vessel 6.0 5.0
Port average TEU/container 1.75 1.75
2007 TEU 501,062 685,139
Avg. TEU/Vessel 589 927
Avg. Vessel DWT 20,667 46,320
Average Est. Vessel Capacity TEU 1,600 3,737
Average Discharge & Load % 37% 25%
Average TEU per Max Vessel 1,498 1,009
Max Calls per Berth 5/wk 260 260
Sustainable Calls at 80% 208 208
Total Sustainable Vessel Calls 1,248 1,040
Annual Berth Capacity TEU 1,869,892 1,049,308
2008 Annual TEU 501,062 685,139
Berth Utilization, Max Vessel Basis 27% 65%

Page 102
Tioga
Berth capacity based on vessel calls is summarized in Exhibit 130. Using this approach the SFTC
& POMTOC terminals have capacity for 1,456 calls with 2007 utilization of 51%. Similarly the
Seaboard terminal has capacity for 2080 vessel calls at its 10 berths and 2007 berth utilization of
41%.
Exhibit 130: Port of Miami 2007 Berth Capacity Vessel Call Basis
Berth Utilization - Vessel Call Basis SFCT Seaboard POMTOC SFCT & POMTOC
Max Calls per Berth 5/wk Not Applicable 260 Not Applicable 260
Sustainable Calls at 80% 208 208
Available Berths 10 7
Total Sustainable Vessel Calls 2,080 1,456
2007 Vessel calls 850 739
2007 Berth Utilization 41% 51%
Capacity and Productivity Summary
Exhibit 131 summarizes the capacity and productivity analysis for CY space, container cranes,
and vessel berths for the Port of Miami. The port currently has estimated CY capacity of 1.6
million TEU with utilization of 70%. As noted earlier the analysis may not be appropriate for the
Seaboard operation. Crane capacity for the SFCT and POMTOC terminals is 2.2 million TEU
with utilization at 54%. Berth utilization for the SFCT and POMTOC terminals is 57% on a
vessel call basis and 84% on a maximum vessel call basis. Berth utilization at the Seaboard
terminal is 41% on a vessel call basis and 27% on a maximum vessel call basis. This analysis
indicates that the port has adequate terminal capacity to handle future growth.

Page 103
Tioga
Exhibit 131: Port of Miami Near Term Capacity and Productivity Summary
Terminal Space SFCT Seaboard POMTOC Miami
2008 TEU 388,329 501,062 296,809 1,186,190
Gross Acres 74 84 120 278CY Acres 56 50 83 189CY/Gross Ratio 76% 60% 69% 68%Sustainable CY TEU Capacity @ 80% 504,000 392,000 788,480 1,684,480
Annual TEU/Gross Acre 5,248 5,965 2,473 4,267 Annual TEU/CY Acre 6,934 10,021 3,576 6,276 Est. CY TEU Slots 9,000 7,000 14,080 30,080 Avg. CY Slots/ Acre - Density 161 140 170 159 Avg. Annual TEU/CY Slot (Turns) 43 72 21 39 CY Utilization 77% 128% 38% 70%
Container Cranes SFCT Seaboard POMTOC SFCT & POMTOC
Cranes Not Applicable Not Applicable Not Applicable 9
Cranes per Berth 1.3
Annual Crane Capacity - TEU 2,205,877
Avg. Moves/Available Crane-Hour 41.2
Annual TEU/Crane 131,799
Annual Moves/Crane 75,284
Annual Vessel Calls/Crane (2007) 82
Crane Utilization 54%
Berths and Vessels SFCT Seaboard POMTOC SFCT & POMTOC
Berths Not Applicable 10 Not Applicable 7
Berth Feet 6,500 5,000
Annual Vessel Calls per Berth (2007) 85 106
Berth Utilization - Vessel Call Basis 41% 51%
Annual TEU per Berth 50,106 97,877
Annual TEU/Foot of Berth 77 137
Average Vessel Capacity - TEU 1,600 3,737
Est. Max. Vessel Capacity - TEU 4,067 4,067
Avg. vs. Max. Vessel Capacity 39% 92%
Average TEU per Vessel (2007) 589 927
Avg. Vessel Utilization - % Discharge/Load 37% 25%
Berth Capacity - Avg. Vessel Basis 735,678 964,201
Berth Utilization - Avg. Vessel Basis 68% 123%
Avg. Discharge/Load per Max. Vessel 1,498 1,009
Berth Capacity - Max. Vessel Basis 1,869,892 1,049,308
Berth Utilization - Max. Vessel Basis 27% 65%
Page 104
Tioga
V. Gulf Ports
Gulf Coast Summary
Exhibit 132 summarizes capacity and utilization estimates for the three major Gulf Coast
container ports. Houston dominates the region with 80% of the total, and has most of the reserve
capacity. New Orleans suffered a setback from Hurricane Katrina as well as having a
competitive disadvantage from being located roughly 100 miles upriver from the Gulf of
Mexico. Mobile, however, and a new terminal and significant reserve capacity for post-recession
growth.

Page 105
Tioga
Exhibit 132: Gulf Coast Capacity and Utilization Summary
Container Yard MobileNew
OrleansHouston Gulf Ports
2008 TEU 121,803 313,765 1,794,309 2,229,877
Gross Acres 156 128 433 717
CY Acres 91 79 272 442
CY/Gross Ratio 58% 62% 63% 62%
Annual CY Capacity - TEU 898,240 873,600 3,127,040 4,898,880
Reserve CY Capacity - TEU 776,437 559,835 1,332,731 2,669,003
Annual TEU/Gross Acre 781 2,451 4,141 3,109
Annual TEU/CY Acre 1,338 3,972 6,597 5,045
Est. CY TEU Slots 16,040 12,480 55,840 84,360
Avg. CY Slots/ Acre - Density 176 158 205 191
Avg. Annual TEU/CY Slot (Turns) 8 25 32 26
CY Utilization 14% 45% 57% 46%
Container Cranes MobileNew
OrleansHouston Gulf Ports
Cranes 4 4 19 27
Cranes per Berth 1.3 2.0 2.4 2.1
Annual Crane Capacity - TEU 1,008,000 857,344 4,788,000 6,653,344
Reserve Crane Capacity - TEU 886,197 543,578 2,993,691 4,423,466
Annual TEU/Crane 30,451 78,441 94,437 82,588
Annual Moves/Crane 16,917 51,236 52,465 47,017
Crane Utilization 12% 37% 37% 34%
Berths and Vessels MobileNew
OrleansHouston Gulf Ports
Berths 3 2 8 13
Berth Feet 2,900 2,000 8,000 12,900
Annual Vessel Calls (2007) 50 281 818 1,149
Annual Vessel Calls per Berth (2007) 52 141 102 88
Berth Utilization - Vessel Call Basis 25% 54% 49% 42%
Reserve Berth Capacity - Vessel Calls 150 239 846 1555
Annual TEU per Berth 40,601 156,883 224,289 171,529
Annual TEU/Foot of Berth 42 157 224 173
Average Vessel Capacity - TEU 3,895 3,492 3,895 3,387
Average TEU per Vessel (2007) 781 1,189 2,162 1,941
Avg. Vessel Ute. - % Discharge/Load 20% 34% 56% 57%
Berth Capacity - Avg. Vessel Basis 487,212 494,757 4,047,518 5,029,487
Berth Utilization - Avg. Vessel Basis 25% 63% 44% 44%
Reserve Berth Capacity - Avg. Vessel Basis 365,409 180,991 2,253,209 2,799,609
Reserve Berth Capacity - Max. Vessel Basis 305,937 489,247 1,759,147 2,554,332
As shown in Exhibit 133, Houston has a relatively shallow draft, which is being remedied by a
planned dredging project.

Page 106
Tioga
Exhibit 133: Gulf Coast Draft and Vessel Data
Berths and Vessels MobileNew
OrleansHouston
Nominal Maximum Channel/Berth Draft Feet 42 45 40
Estimated Maximum Vessel TEU 3,420 5,183 3,420
2007 Average Vessel TEU 3,895 3,492 3,895
2008 Average Vessel Discharge/Load 781 1,189 2,162
Port of Mobile
Overview
The Alabama State Port Authority (ASPA) has two container terminals at the Port of Mobile.
The new Mobile Container Terminal (MCT) was completed and opened for business in
September 2008. The second terminal is ASPA’s original container terminal at Pier Two. The
Pier Two terminal is a combination container and general cargo terminal. It has been reported
that most of the Port’s container traffic now moves through MCT. Phase I of the new terminal
has 95 developed acres. It has two berths with 2000 feet of berth length serviced by two Post-
Panamax cranes. Channel and berth depth at MCT are 45 feet. Final build out will be 135 acres
with six cranes. The Pier Two terminal utilizes about 21 acres for container operations. The
facility has one 900 foot berth serviced by two PACECO cranes. Water depth at Pier Two is 40
feet. Exhibit 134 and Exhibit 135 provide aerial photos of the MCT and Pier Two terminals.
Exhibit 134: Mobile Container Terminal (MCT)
Source: Mobile Container Terminal Website Information Sheet

Page 107
Tioga
Exhibit 135: Mobile Pier Two - Container and General Cargo Terminal
Source: Google Earth Image Date January 31, 2008
Mobile Container Terminal was a $300 million development of the Alabama State Port
Authority and Mobile Container Terminal, LLC a terminal company formed to operate the
facility. Mobile Container Terminal LLC is a joint venture between APM Terminals, a
subsidiary of AP Moeller, and Terminal Link, a subsidiary of CMA CGM. MCT Phase I is
advertised to have terminal capacity of 350,000 TEU with future expansion capacity to 800,000
TEU. In addition, a new on-dock intermodal facility is being planned for MCT with projected
completion in 2012. Exhibit 136 provides a profile of MCT.
Exhibit 136: Mobile Container Terminal Profile
Profle date: Sept. 30, 2009 2009 TEU for entire Port 121,803
Port: Mobile, Alabama Total Acres: 135
Terminal: Mobile Container Terminal (MCT) CY Acres: 70
Terminal Type: On-Dock Rail Acres:
901 Ezra Trice Blvd. Other Non-CY Acres: 25
Mobile, AL 36603 Net Terminal Acres: 95
Operator (Stevedore): MCT Berths: 2
Contact Name: Total Berth Length: 2,000
Telephone Number: 251-410-6100 Channel Depth (MLLW): 45
Fax Number: 251-410-6101 Berth Depth (MLLW): 45
E-Mail Address: Panamax Container Cranes:
Port Website: www.asdd.com Post-Panamax Container Cranes: 2
Terminal Website: www.mobilecontainerterminal.us CY Rail-Mounted Gantries:
Inbound Gates: 9 CY Rubber-Tired Gantries:
Outbound Gates: 5 CY Side or Top Loaders:
Reversible Gates: CY Straddle Carriers:
Total Gates: 14 CY Reach Stackers: 5
On-Line Access System: Total CY Lift Machines 5
Appointment System: On-site M&R (yes/no): Yes
Reefer Plugs/Slots: 176 On-dock Rail (yes/no): No
Terminal Hours:
Gate Hours:
CONTAINER TERMINAL PROFILE
Address:
Mon – Fri 8:00AM to 5:00PM

Page 108
Tioga
Pier Two terminal is operated by ASPA. This terminal still handles a small amount of container
cargo but the volume has been declining with the opening of the new terminal. With the existing
capacity and future expansion potential of MCT, it does not appear to be necessary for the ASPA
to continue to operate the Pier Two facility for container service. Exhibit 137 provides a profile
for the Pier Two terminal.
Exhibit 137: Pier Two Terminal Profile
Profle date: Sept. 30, 2009 2009 TEU: for entire port 121,803
Port: Mobile, AL Total Acres: 21
Terminal:General Cargo & Container
Terminal Pier 2 TerminalCY Acres: 21
Terminal Type: Container/General Cargo On-Dock Rail Acres: Yes
Main Port Complex Other Non-CY Acres: 550
Pier 2 Port of Mobile - FIRM Code P047Net Terminal Acres: 21
Operator (Stevedore):Private Licensed Stevedores -
list available at Berths: 1
Contact Name: John Mickler, Mgr. General Cargo & IntermodalTotal Berth Length: 900
Telephone Number: 251-441-7325 Channel Depth (MLLW): 40 ft
Fax Number: 251-441-7231 Berth Depth (MLLW): 40
E-Mail Address: [email protected] Panamax Container Cranes: 2
Port Website: www.asdd.com Post-Panamax Container Cranes: 0
Terminal Website: www.asdd.com CY Rail-Mounted Gantries: 0
Inbound Gates: Two CY Rubber-Tired Gantries: 1
Outbound Gates: Two CY Side or Top Loaders: 0
Reversible Gates: CY Straddle Carriers: 0
Total Gates: 4 CY Reach Stackers: 6
On-Line Access System: MainSail Online - Outside Total CY Lift Machines 7
Appointment System: Truckers CHB - Forecast - https://asd.tideworks.com/fc-ASD/default.doOn-site M&R (yes/no): No
Reefer Plugs/Slots: 40 On-dock Rail (yes/no): Yes
Terminal Hours:
Gate Hours:
CONTAINER TERMINAL PROFILE
Address:
8:00 a.m. CT - 4:30 p.m. CT
8:00 a.m. CT - 4:30 p.m. CT
Container Yard Storage Capacity
Exhibit 138 summarizes land use at the Port of Mobile. The combined acreage of the two
terminals is 156 acres with net terminal area of 116 acres. Overall land use ratio is 74%. The
Mobile Container Terminal (MCT) still has 40 acres of undeveloped land which will be available
for future development.

Page 109
Tioga
Exhibit 138: Port of Mobile Land Use
Port Land UseMobile Gen
CargoMobile MCT Port Total
Gross Acres 21 135 156
CY Acres 21 70 91
Rail Acres - - -
Other Non-CY Acres - 25 25
Net Berth/Gate/Yard Acres 21 95 116
CY/Gross Ratio 100% 52% 58%
Exhibit 139 applies standard CY storage factors to the port acreage. The CY area is a primarily a
grounded operation with less than 10% wheeled space. The CY area estimated at 91 acres
produces 16,040 TEU storage slots. Sustainable annual CY capacity is estimated to be nearly
900,000 TEU with CY utilization of 14% based on 2009 volume of 121,803.
Exhibit 139: Port of Mobile Near Term CY Storage Capacity
Container Yard CapacityMobile Gen
CargoMobile MCT Port Total
Wheeled Chassis Slots 320 1,120 1,440
Grounded Straddle Carrier Slots - - -
Grounded Stacked Slots 3,400 11,200 14,600
Grounded RTG Slots - - -
Grounded RMG Slots - - -
TEU Storage Slots 3,720 12,320 16,040
Avg TEU Slots/CY Acre 177 176 176
Maximum Annual Slot Turnover 70.0 70.0 70.0
Maximum Annual CY TEU Capacity 260,400 862,400 1,122,800
Sustainable CY TEU Capacity @ 80% 208,320 689,920 898,240
2009 Estimated Annual TEU 12,180 109,623 121,803
2009 TEU per CY Slot 33 10 8
2009 CY Capacity Utilization 6% 16% 14%
Crane Capacity
Exhibit 140 provides a summary of the Port of Mobile’s cranes and an estimate of crane
capacity. The port has 4 cranes at its two terminals. Annual crane capacity for the port is
estimated to be 1.0 million TEU with current crane utilization of 12%.

Page 110
Tioga
Exhibit 140: Port of Mobile Near Term Crane Capacity
Crane CapacityMobile Gen
CargoMobile MCT Port Total
Cranes 2 2 4
Available Crane Hours per Day 16 16 16
Current Annual Operating Days 250 250 250
Current Annual Hours/Crane 4,000 4,000 4,000
Annual Available Crane Hours 8,000 8,000 16,000
Sustainable Hours @ 80% 6,400 6,400 12,800
Avg. TEU/Available Crane-hour 19.0 19.0 9.5
Avg. Annual TEU/Crane 60,902 60,902 30,451
Crane Capacity, Moves/hour 35 35 35
Sustainable Moves/Hr @ 80% 28 28 28
Port average TEU/container 1.80 1.80 1.80
Crane Capacity TEU/hour 63 63 63
Annual Crane Capacity 504,000 504,000 1,008,000
Current Annual TEU 12,180 109,623 121,803
Current Crane Utilization 2% 22% 12%
Berth Capacity
The Port of Mobile’s estimated berth capacity for the maximum vessel size is summarized in
Exhibit 141. This analysis produces an estimate of near-term berth capacity of 427,740 TEU and
berth utilization of 28%.
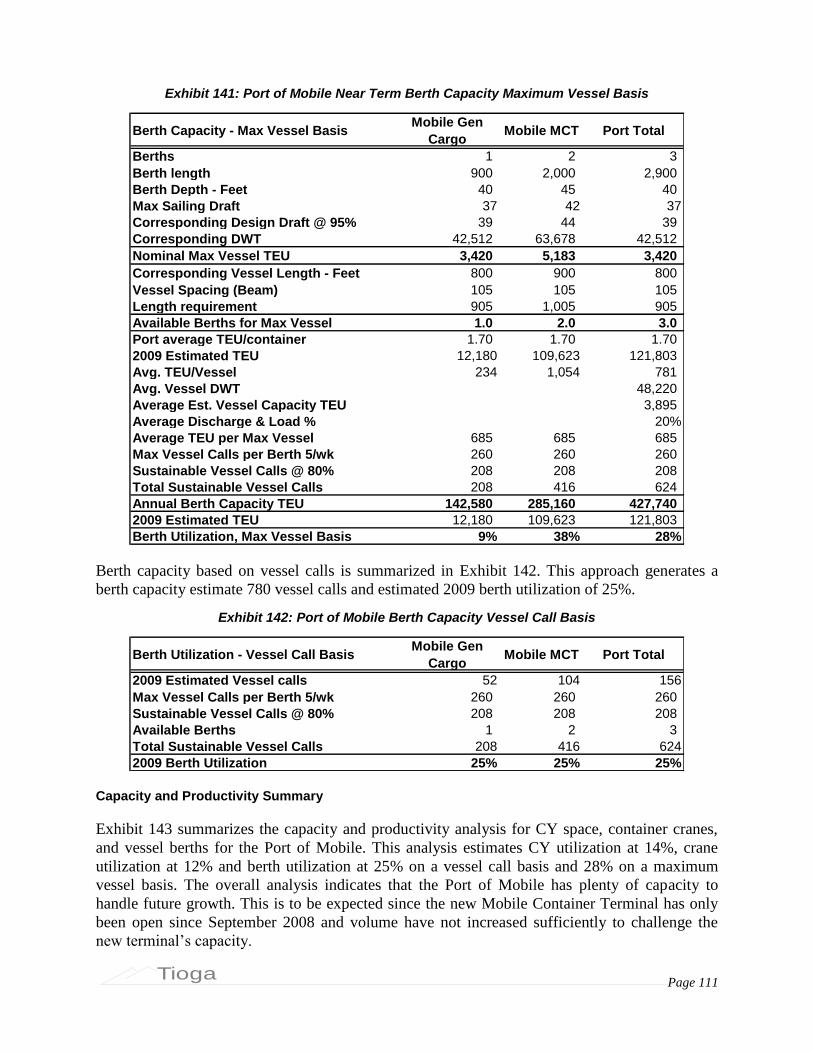
Page 111
Tioga
Exhibit 141: Port of Mobile Near Term Berth Capacity Maximum Vessel Basis
Berth Capacity - Max Vessel BasisMobile Gen
CargoMobile MCT Port Total
Berths 1 2 3
Berth length 900 2,000 2,900
Berth Depth - Feet 40 45 40
Max Sailing Draft 37 42 37
Corresponding Design Draft @ 95% 39 44 39
Corresponding DWT 42,512 63,678 42,512
Nominal Max Vessel TEU 3,420 5,183 3,420
Corresponding Vessel Length - Feet 800 900 800
Vessel Spacing (Beam) 105 105 105
Length requirement 905 1,005 905
Available Berths for Max Vessel 1.0 2.0 3.0
Port average TEU/container 1.70 1.70 1.70
2009 Estimated TEU 12,180 109,623 121,803
Avg. TEU/Vessel 234 1,054 781
Avg. Vessel DWT 48,220
Average Est. Vessel Capacity TEU 3,895
Average Discharge & Load % 20%
Average TEU per Max Vessel 685 685 685
Max Vessel Calls per Berth 5/wk 260 260 260
Sustainable Vessel Calls @ 80% 208 208 208
Total Sustainable Vessel Calls 208 416 624
Annual Berth Capacity TEU 142,580 285,160 427,740
2009 Estimated TEU 12,180 109,623 121,803
Berth Utilization, Max Vessel Basis 9% 38% 28%
Berth capacity based on vessel calls is summarized in Exhibit 142. This approach generates a
berth capacity estimate 780 vessel calls and estimated 2009 berth utilization of 25%.
Exhibit 142: Port of Mobile Berth Capacity Vessel Call Basis
Berth Utilization - Vessel Call BasisMobile Gen
CargoMobile MCT Port Total
2009 Estimated Vessel calls 52 104 156
Max Vessel Calls per Berth 5/wk 260 260 260
Sustainable Vessel Calls @ 80% 208 208 208
Available Berths 1 2 3
Total Sustainable Vessel Calls 208 416 624
2009 Berth Utilization 25% 25% 25%
Capacity and Productivity Summary
Exhibit 143 summarizes the capacity and productivity analysis for CY space, container cranes,
and vessel berths for the Port of Mobile. This analysis estimates CY utilization at 14%, crane
utilization at 12% and berth utilization at 25% on a vessel call basis and 28% on a maximum
vessel basis. The overall analysis indicates that the Port of Mobile has plenty of capacity to
handle future growth. This is to be expected since the new Mobile Container Terminal has only
been open since September 2008 and volume have not increased sufficiently to challenge the
new terminal’s capacity.

Page 112
Tioga
Exhibit 143: Port of Mobile Near Term Capacity and Productivity Summary
Terminal SpaceMobile Gen
CargoMobile MCT Mobile
2009 Estimated TEU 12,180 109,623 121,803
Gross Acres 21 135 156CY Acres 21 70 91CY/Gross Ratio 100% 52% 58%Annual CY Capacity - TEU 208,320 689,920 898,240 Annual TEU/Gross Acre 580 812 781 Annual TEU/CY Acre 580 1,566 1,338 Est. CY TEU Slots 3,720 12,320 16,040 Avg. CY Slots/ Acre - Density 177 176 176 Avg. Annual TEU/CY Slot (Turns) 33 10 8 CY Utilization 6% 16% 14%
Container CranesMobile Gen
CargoMobile MCT Mobile
Cranes 2 2 4
Cranes per Berth 2.0 1.0 1.3
Annual Crane Capacity - TEU 504,000 504,000 1,008,000
Avg. Moves/Available Crane-Hour 19.0 19.0 9.5
Annual TEU/Crane 6,090 54,811 30,451
Annual Moves/Crane 3,383 30,451 16,917
Annual Vessel Calls/Crane (2007) 26 52 39
Crane Utilization 2% 22% 12%
Berths and VesselsMobile Gen
CargoMobile MCT Mobile
Berths 1 2 3
Berth Feet 900 2,000 2,900
Annual Vessel Calls per Berth (2009 estimate) 52 52 52
Berth Utilization - Vessel Call Basis 25% 25% 25%
Annual TEU per Berth 12,180 54,811 40,601
Annual TEU/Foot of Berth 14 55 42
Average Vessel Capacity - TEU - - 3,895
Est. Max. Vessel Capacity - TEU 3,420 5,183 3,420
Avg. vs. Max. Vessel Capacity 114%
Average TEU per Vessel (2007) 234 1,054 781
Avg. Vessel Utilization - % Discharge/Load 20%
Berth Capacity - Avg. Vessel Basis 48,721 438,491 487,212
Berth Utilization - Avg. Vessel Basis 25%
Avg. Discharge/Load per Max. Vessel 685
Berth Capacity - Max. Vessel Basis 142,580 285,160 427,740
Berth Utilization - Max. Vessel Basis 9% 38% 28%
New Orleans Capacity Estimates
Overview
The Port of New Orleans has one container terminal, the Napoleon Avenue Terminal, located on
the Mississippi River 99.5 miles from the Gulf of Mexico. Total acreage of the facility is 125
acres which includes a 10-acre on-dock intermodal terminal. The on dock terminal is served by

Page 113
Tioga
the New Orleans Public Belt Railroad which connects to all 6 Class One rail carriers serving
New Orleans. Canadian National currently offers service to the terminal. The Napoleon Avenue
terminal area also includes a number of freight houses and lay down acreage which supports the
port’s general cargo business. The container terminal provides two berths with a total berth
length of 2000 feet. Channel depth and berth is 45 feet. The berths are equipped with four cranes,
two Panamax and two Post-Panamax. In addition the port has two additional cranes on order
with projected delivery in 2010. Exhibit 144 provides an aerial view of the terminal delineating
the container areas and on-dock rail facility.
Exhibit 144: Port of New Orleans Napoleon Avenue Terminal
Source: Google Earth Image Date February 28, 2006
The terminal’s CY space is leased to two terminal operators, Ceres Gulf, Inc. and Ports America
New Orleans. Ceres Gulf leases 47 acres and Ports America leases 48 acres. Both terminal
operators share a common gate, berth space, and crane use. Exhibit 145 provides a profile of the
Napoleon Avenue Terminal.

Page 114
Tioga
Exhibit 145: Napoleon Avenue Terminal Profile
Profle date: Sept. 30, 2009 2008 TEU: 313,765
Port: New Orleans Total Acres: 125
Terminal: Napoleon Ave. Container Terminal CY Acres: 79
Terminal Type: Container On-Dock Rail Acres: 10
1350 Port of New Orleans Pl. Other Non-CY Acres: 16
New Orleans, LA 70130 Net Terminal Acres: 105
Operator (Stevedore): Ceres Gulf, Inc.; Ports America Berths: 2
Contact Name: Chris Bonura Total Berth Length: 2,000
Telephone Number: 504-522-2551 Channel Depth (MLLW): 45
Fax Number: 504-524-4156 Berth Depth (MLLW): 45
E-Mail Address: [email protected] Panamax Container Cranes: 2
Port Website: www.portno.com Post-Panamax Container Cranes: 2
Terminal Website: www.gemnola.com CY Rail-Mounted Gantries: 0
Inbound Gates: 10 CY Rubber-Tired Gantries: 4
Outbound Gates: 6 CY Side or Top Loaders: 16
Reversible Gates: 16 CY Straddle Carriers: 0
Total Gates: 32 CY Reach Stackers: 3
On-Line Access System: www.gemnola.com Total CY Lift Machines 23
Appointment System: www.gemnola.com On-site M&R (yes/no): yes
Reefer Plugs/Slots: 192 On-dock Rail (yes/no): Yes
Terminal Hours:
Gate Hours:
CONTAINER TERMINAL PROFILE
Address:
Notes: The Napolean Ave Container Terminal is shared by two operators, Ceres and Ports America. Ceres Gulf Inc. at 50
Napolean Ave, New Orleans, LA 70115, leases 47 acres. Ports America New Orleans at 601 Louisiana Ave, New Orleans,
LA 70115 leases 48 acres. They both share a common gate, berthing space and gantry cranes. Two additional Panamax
cranes are on order with delivery expected in 2010 The on-dock intermodal facility is served by New Orleans Public Belt RR
(NOPB) which connects to all 6 class one carriers. CN provides direct intermodal service to the port . In addition BN, UP,
CN, NS, CSX and KCS intermodal terminals serve New Orleans and are within drayage distance of the port.
24 hours per day, 7 days per week
0700 to 1630 hours weekdays
Container Yard Storage Capacity
Exhibit 146 summarizes land use at the Port of New Orleans. The estimated acreage of the
Napoleon Avenue container terminal is 125 acres with net terminal area of 105 acres and a land
use ratio of 84%, and a CY/Gross ratio of 62%. The net terminal area and CY estimates are
based on information taken from the Port Strategy Advisory Report of June 2009. This report,
prepared by Parsons Brinckerhoff, provided a feasibility study for expanding the Napoleon
Avenue terminal. The land area is based on current use by the Ports two terminal operators.
Exhibit 146: Port of New Orleans Land Use
Port Land Use Napoleon Port Total
Gross Acres 128 128
CY Acres 79 79
Rail Acres 10 10
Other Non-CY Acres 16 16
Net Berth/Gate/Yard Acres 105 105
CY/Gross Ratio 62% 62%

Page 115
Tioga
Exhibit 147 applies standard CY storage factors to the port acreage. The CY area is estimated to
provide sustainable annual capacity of 699,000 TEU. This produces annual utilization of 45%
based on 2008 volume of 314,000 TEU (reported loads and estimated empties).
Exhibit 147: Port of New Orleans Near Term Storage Capacity
Container Yard Capacity Napoleon Port Total
Wheeled Chassis Slots 1,600 1,600
Grounded Straddle Carrier Slots 6,880 6,880
Grounded Stacked Slots 1,600 1,600
Grounded RTG Slots 2,400 2,400
Grounded RMG Slots - -
TEU Storage Slots 12,480 12,480
Avg TEU Slots/CY Acre 158 158
Maximum Annual Slot Turnover 70.0 70.0
Maximum Annual CY TEU Capacity 873,600 873,600
Sustainable CY TEU Capacity @ 80% 698,880 698,880
2008 Annual TEU 313,765 313,765
2008 TEU per CY Slot 25 25
2008 CY Capacity Utilization 45% 45%
Crane Capacity
Exhibit 148 provides a summary of the Napoleon Avenue crane capacity. The terminal currently
provides 4 Panamax cranes. Estimated annual crane capacity is 1.0 million TEU with 2008
capacity utilization of 31%. The port also has two additional Post-Panamax cranes on order with
expected delivery in 2010.
Exhibit 148: Port of New Orleans Near Term Crane Capacity
Crane Capacity Napoleon Port Total
Cranes 4 4
Available Crane Hours per Day 16 16
Current Annual Operating Days 250 250
Current Annual Hours/Crane 4,000 4,000
Annual Available Crane Hours 16,000 16,000
Sustainable Hours @ 80% 12,800 12,800
Avg. TEU/Available Crane-hour 24.5 24.5
Avg. Annual TEU/Crane 78,441 78,441
Crane Capacity, Moves/hour 35 35
Sustainable Moves/Hr @ 80% 28 28
Port average TEU/container 1.53 1.53
Crane Capacity TEU/hour 54 54
Annual Crane Capacity 857,344 857,344
Current Annual TEU 313,765 313,765
Current Crane Utilization 37% 37%
Berth Capacity
The Napoleon Avenue berth capacity in TEU for the maximum vessel size is summarized in
Exhibit 149. This estimate generates near-term berth capacity of 803,012 TEU and berth
utilization of 39% for the terminals two container berths.

Page 116
Tioga
Exhibit 149: Port of New Orleans Near Term Berth Capacity Maximum Vessel Basis
Berth Capacity - Max Vessel Basis Napoleon Port Total
Berths 2 2
Berth length 2,000 2,000
Berth Depth - Feet 45 45
Max Sailing Draft 42 42
Corresponding Design Draft @ 95% 44 44
Corresponding DWT 63,678 63,678
Nominal Max Vessel TEU 5,183 5,183
Corresponding Vessel Length - Feet 1,000 1,000
Vessel Spacing (Beam) 140 140
Length requirement 1,140 1,140
Available Berths for Max Vessel 2.0 2.0
Port average TEU/container 1.53 1.53
2007 TEU 334,199 334,199
Avg. TEU/Vessel 1,189 1,189
Avg. Vessel DWT 43,379 43,379
Average Est. Vessel Capacity TEU 3,492 3,492
Average Discharge & Load % 37% 37%
Average TEU per Max Vessel 1,930 1,930
Max annual calls per berth 5/wk 260 260
Sustainable calls at 80% 208 208
Total Sustainable Vessel Calls 416 416
Annual Berth Capacity TEU - Max Vessel Basis 803,012 803,012
2008 Annual TEU 313,765 313,765
Berth Utilization, Max Vessel Basis 39% 39%
Berth capacity based on vessel calls is summarized in Exhibit 150. This approach generates a
berth capacity estimate of 416 vessel calls and 2007 berth utilization of 68%.
Exhibit 150: Port of New Orleans 2007 Berth Capacity Vessel Call Basis
Berth Utilization - Vessel Call Basis Napoleon Port Total
Max annual calls per berth 5/wk 260 260
Sustainable calls at 80% 208 208
Available Berths 2 2
Total Sustainable Vessel Calls 416 416
2007 Vessel calls 281 281
2007 Berth Utilization 68% 68%
Capacity and Productivity Summary
Exhibit 151 summarizes the capacity and productivity analysis for CY space, container cranes,
and vessel berths for the Napoleon Avenue terminal. This analysis estimates current CY
utilization of 45%, crane utilization at 31% and berth utilization at 68% on a vessel call basis and
39% on a maximum vessel basis. These estimates indicate that the port has adequate capacity to
handle future growth.

Page 117
Tioga
Exhibit 151: Port of New Orleans Near Term Capacity and Productivity Summary
Terminal Space Napoleon New Orleans
2008 TEU 313,765 313,765
Gross Acres 128 128CY Acres 79 79CY/Gross Ratio 62% 62%Annual CY Capacity - TEU 873,600 873,600 Annual TEU/Gross Acre 2,451 2,451 Annual TEU/CY Acre 3,972 3,972 Est. CY TEU Slots 12,480 12,480 Avg. CY Slots/ Acre - Density 158 158 Avg. Annual TEU/CY Slot (Turns) 25 25 CY Utilization 45% 45%
Container Cranes Napoleon New Orleans
Cranes 4 4
Cranes per Berth 2.0 2.0
Annual Crane Capacity - TEU 857,344 857,344
Avg. Moves/Available Crane-Hour 24.5 24.5
Annual TEU/Crane 78,441 78,441
Annual Moves/Crane 51,236 51,236
Annual Vessel Calls/Crane (2007) 70 70
Crane Utilization 37% 37%
Berths and Vessels Napoleon New Orleans
Berths 2 2
Berth Feet 2,000 2,000
Annual Vessel Calls per Berth (2007) 141 141
Berth Utilization - Vessel Call Basis 54% 54%
Annual TEU per Berth 156,883 156,883
Annual TEU/Foot of Berth 157 157
Average Vessel Capacity - TEU 3,492 3,492
Est. Max. Vessel Capacity - TEU 5,183 5,183
Avg. vs. Max. Vessel Capacity 67% 67%
Average TEU per Vessel (2007) 1,189 1,189
Avg. Vessel Utilization - % Discharge/Load 34% 34%
Berth Capacity - Avg. Vessel Basis 494,757 494,757
Berth Utilization - Avg. Vessel Basis 63% 63%
Avg. Discharge/Load per Max. Vessel 1,765 1,765
Berth Capacity - Max. Vessel Basis 803,012 803,012
Berth Utilization - Max. Vessel Basis 39% 39%
Port of Houston
Overview
The Port of Houston has two container terminals owned by the Port of Houston Authority
(PHA). Aerial photos of the Barbours Cut Container Terminal and the Bayport Container
Terminal are shown in Exhibit 60. It should be noted that the latest expansion of the Bayport
terminal was completed after the aerial photos were taken.

Page 118
Tioga
Exhibit 152: Port of Houston Terminals
Source: Google Earth Image Date January 9, 2008
Barbours Cut is the port’s largest terminal with a total of 303 acres and 165 acres of CY space.
The terminal has a 42 acre on-dock rail terminal. Barbours Cut has six berths with a total of
6000 feet of berth length. The port operates a total of 18 cranes at the terminal, five of which are
Post-Panamax. Exhibit 153 provides a profile of the terminal.
Bayport is a new terminal which opened in January 2007. The present development of 130 acres
is Phase IA of a 15 to 20 year phased development. The terminal has 107 acres of CY and two
berths with 2000 feet of berth length. The berths are served by six Post-Panamax cranes. When
fully built out the terminal will have seven berths, 378 acres of CY and a 123 acre intermodal
terminal. Exhibit 154 provides a profile of the terminal. Bayport will also have a cruise terminal
with three cruise ship berths.

Page 119
Tioga
Exhibit 153: Barbours Cut Terminal
Profle date: 10/5/2009 2008 TEU: 750,145
Port: Houston Total Acres: (Not incl Empty Yards, etc.) 303
Terminal: Barbours Cut CY Acres: 165
Terminal Type: Container On-Dock Rail Acres: 42
1515 E. Barbours Cut Blvd. Other Non-CY Acres: 4
La Porte, TX 77571 Net Terminal Acres (BGY): 257
Operator (Stevedore): Port of Houston Berths: 6
Contact Name: Total Berth Length: 6,000
Telephone Number: 281-470-1800 Channel Depth (MLLW): 40
Fax Number: 281-470-5580 Berth Depth (MLLW): 40
E-Mail Address: Panamax Container Cranes: 8
Port Website: www.portofhouston.com Post-Panamax Container Cranes: 5
Terminal Website: www.portofhouston.com CY Rail-Mounted Gantries: 0
Inbound Gates: 29 CY Rubber-Tired Gantries: 52
Outbound Gates: 20 CY Side or Top Loaders: 12
Reversible Gates: 0 CY Straddle Carriers: 0
Total Gates: 49 CY Reach Stackers: 0
On-Line Access System: Navis Express/WebAccess Total CY Lift Machines 64
Appointment System: N/A On-site M&R (yes/no): Yes
Reefer Plugs/Slots: 392 On-dock Rail (yes/no): Yes
Terminal Hours:
Gate Hours:
Barbours Cut Container Terminal Profile
Address:
Notes: Four entry points with a total of 26 truck lanes. 13 wharf cranes. On dock rail intermodal terminal served by
BNSF and Union Pacific. Four 40-ton (40.64 m.t.) Morris Cranes, eight 40-ton Bardella cranes, six 40 ton-Noell
cranes, 22 new 50-ton K
Monday through Friday: 7 am –5 pm
Monday through Friday: 7 am –5 pm

Page 120
Tioga
Exhibit 154: Bayport Terminal
Profle date: Sept. 30, 2009 2008 TEU: 470,547
Port: Houston Total Acres: 130
Terminal: Bayport Container Terminal CY Acres: 107
Terminal Type: On-Dock Rail Acres: 0
12619 Port Rd. Other Non-CY Acres: 23
Seabrook, Tx 77586 Net Terminal Acres (BGY) 107
Operator (Stevedore): Berths: 2
Contact Name: Total Berth Length: 2,000
Telephone Number: 281-291-6000 Channel Depth (MLLW): 40
Fax Number: 281-291-6007 Berth Depth (MLLW): 40
E-Mail Address: Panamax Container Cranes: 0
Port Website: www.portofhouston.com Post-Panamax Container Cranes: 6
Terminal Website: www.portofhouston.com CY Rail-Mounted Gantries: 0
Inbound Gates: 18 CY Rubber-Tired Gantries: 18
Outbound Gates: 12 CY Side or Top Loaders: 12
Reversible Gates: 0 CY Straddle Carriers: 0
Total Gates: 30 CY Reach Stackers: 0
On-Line Access System: Navis Express/WebAccess Total CY Lift Machines 30
Appointment System: N/A On-site M&R (yes/no): Yes
Reefer Plugs/Slots: 300 On-dock Rail (yes/no): No
Terminal Hours:
Gate Hours:
BAYPORT CONTAINER TERMINAL PROFILE
Address:
Notes: Entrance Gates: Port Road, 8 Inbound, 4 Outbound. Acreage: 90 total, wharf 5.6 acres, container yard 60.3 acres, gate 23.4
acres. Intermodal rail ramp at Barbours Cut.
Monday through Friday: 7 am –5 pm
Monday through Friday: 7 am –5 pm

Page 121
Tioga
Container Yard Storage Capacity
Exhibit 155 summarizes land use for the Port of Houston. The combined acreage of the two
terminals is 433 acres with 364 net terminal acres. This creates a net to gross land use ratio of
84% for the current developed terminal areas. The Bayport terminal has several hundred
undeveloped acres available for future container terminal expansion.
Exhibit 155: Port of Houston Land Use
Port Land Use Barbours Cut Bayport Port Total
Gross Acres 303 130 433
CY Acres 165 107 272
Rail Acres 42 - 42
Other Non-CY Acres 4 23 27
Net Berth/Gate/Yard Acres 257 107 364
CY/Gross Ratio 54% 82% 63%
Exhibit 156 applies standard CY storage factors to the port acreage. Houston has a mix of
wheeled, stacked, and RTG storage areas. Based on interpretation of aerial photographs it was
estimated that the CY area of 272 acres produced 55,840 storage slots. Annual CY sustainable
capacity is estimated at 3.1 million TEU producing annual utilization of 57 % relative to 2008
volume of 1.8 million TEU.
Exhibit 156: Port of Houston Near Term CY Storage Capacity
Container Yard Capacity Barbours Cut Bayport Port Total
Wheeled Chassis Slots 5,680 2,160 7,840
Grounded Straddle Carrier Slots - - -
Grounded Stacked Slots 2,400 6,000 8,400
Grounded RTG Slots 24,600 15,000 39,600
Grounded RMG Slots - - -
TEU Storage Slots 32,680 23,160 55,840
Avg TEU Slots/CY Acre 198 216 205
Maximum Annual Slot Turnover 70.0 70.0 70.0
Maximum Annual CY TEU Capacity 2,287,600 1,621,200 3,908,800
Sustainable CY TEU Capacity @ 80% 1,830,080 1,296,960 3,127,040
2008 Annual TEU 750,145 470,547 1,794,309
2008 TEU per CY Slot 23 20 32
2008 CY Capacity Utilization 41% 36% 57%
Crane Capacity
Exhibit 157 provides a summary of the Port of Houston’s cranes and an estimate of crane
capacity. The port operates 19 cranes at its two terminals. Annual crane capacity for the port is
estimated to be 4.8 million TEU with 2008 utilization at 37%. In addition, three additional cranes
are being added to the Bayport terminal with delivery expected by the end of 2010.

Page 122
Tioga
Exhibit 157: Port of Houston Near Term Crane Capacity
Crane Capacity Barbours Cut Bayport Port Total
Cranes 13 6 19
Available Crane Hours per Day 16 16 16
Current Annual Operating Days 250 250 250
Current Annual Hours/Crane 4,000 4,000 4,000
Annual Available Crane Hours 52,000 24,000 76,000
Sustainable Hours @ 80% 41,600 19,200 60,800
Avg. TEU/Available Crane-hour 18.0 24.5 29.5
Avg. Annual TEU/Crane 57,703 78,425 94,437
Crane Capacity, Moves/hour 35 35 35
Sustainable Moves/Hr @ 80% 28 28 28
Port average TEU/container 1.80 1.80 1.80
Crane Capacity TEU/hour 63 63 63
Annual Crane Capacity 3,276,000 1,512,000 4,788,000
Current Annual TEU 750,145 470,547 1,794,309
Current Crane Utilization 23% 31% 37%
Berth Capacity
The Port of Houston berth capacity estimate in TEU for the maximum vessel size is summarized
in Exhibit 158. This estimate gives near-term berth capacity of 3.6 million TEU and berth
utilization of 50%. In addition, the berth length at Bayport is undergoing an expansion project
which will extend it to 3,300 feet by the end of 2010.
Exhibit 158: Port of Houston Near Term Berth Capacity Maximum Vessel Basis
Berth Capacity - Max Vessel Basis Barbours Cut Bayport Port Total
Berths 6 2 8
Berth length 6,000 2,000 8,000
Berth Depth - Feet 40 40 40
Max Sailing Draft 37 37 37
Corresponding Design Draft @ 95% 39 39 39
Corresponding DWT 42,512 42,512 42,512
Nominal Max Vessel TEU 3,420 3,420 3,420
Corresponding Vessel Length - Feet 800 800 800
Vessel Spacing (Beam) 105 105 105
Length requirement 905 905 905
Available Berths for Max Vessel 7.0 2.0 9.0
Port average TEU/container 1.63 1.63 1.63
2007 TEU 1,768,627
Avg. TEU/Vessel 2,162
Avg. Vessel DWT 48,220
Average Est. Vessel Capacity TEU 3,895
Average Discharge & Load % 56%
Average TEU per Max Vessel 1,898 1,898 1,898
Max Vessel Calls per Berth 5/wk 260 260 260
Sustainable Vessel Calls @ 80% 208 208 208
Total Sustainable Vessel Calls 1,456 416 1,872
Annual Berth Capacity TEU 2,763,799 789,657 3,553,456
2008 Annual TEU 750,145 470,547 1,794,309
Berth Utilization, Max Vessel Basis 27% 60% 50%

Page 123
Tioga
Berth capacity based on vessel calls is summarized in Exhibit 159. This approach generates berth
a capacity estimate 1,664 vessel calls and 2007 berth utilization of 49%.
Exhibit 159: Port of Houston 2007 Berth Capacity Vessel Call Basis
Berth Utilization - Vessel Call Basis Barbours Cut Bayport Port Total
Max Vessel Calls per Berth 5/wk 260 260 260
Sustainable Vessel Calls @ 80% 208 208 208
Available Berths 6 2 8
Total Sustainable Vessel Calls 1,248 416 1,664
2007 Vessel calls 818
2007 Berth Utilization 49%
Capacity and Productivity Summary
Exhibit 160 summarizes the capacity and productivity analysis for CY space, container cranes,
and vessel berths for the Port of Houston. This analysis estimates current CY utilization of 57%,
crane utilization at 37% and berth utilization at 49% on a vessel call basis and 50% on a
maximum vessel basis. These estimates indicate that the port has adequate capacity to handle
future growth. In addition, the Bayport terminal is undergoing a berth expansion project which
will add 1300 feet of berth length and three new container cranes by the end of 2010.

Page 124
Tioga
Exhibit 160: Port of Houston Near Term Capacity and Productivity Summary
Terminal Space Barbours Cut Bayport Houston
2008 TEU 750,145 470,547 1,794,309
Gross Acres 303 130 433CY Acres 165 107 272CY/Gross Ratio 54% 82% 63%Sustainable CY TEU Capacity @ 80% 1,830,080 1,296,960 3,127,040 Annual TEU/Gross Acre 2,476 3,611 4,141 Annual TEU/CY Acre 4,546 4,398 6,597 Est. CY TEU Slots 32,680 23,160 55,840 Avg. CY Slots/ Acre - Density 198 216 205 Avg. Annual TEU/CY Slot (Turns) 23 20 32 CY Utilization 41% 36% 57%
Container Cranes Barbours Cut Bayport Houston
Cranes 13 6 19
Cranes per Berth 2.2 3.0 2.4
Annual Crane Capacity - TEU 3,276,000 1,512,000 4,788,000
Avg. Moves/Available Crane-Hour 18.0 24.5 29.5
Annual TEU/Crane 57,703 78,425 94,437
Annual Moves/Crane 32,057 43,569 52,465
Annual Vessel Calls/Crane (2007) - 43
Crane Utilization 23% 31% 37%
Berths and Vessels Barbours Cut Bayport Houston
Berths 6 2 8
Berth Feet 6,000 2,000 8,000
Annual Vessel Calls per Berth (2007) 102
Berth Utilization - Vessel Call Basis 49%
Annual TEU per Berth 125,024 235,274 224,289
Annual TEU/Foot of Berth 125 235 224
Average Vessel Capacity - TEU 3,895
Est. Max. Vessel Capacity - TEU 3,420 3,420 3,420
Avg. vs. Max. Vessel Capacity 114%
Average TEU per Vessel (2007) 2,162
Avg. Vessel Utilization - % Discharge/Load 56%
Berth Capacity - Avg. Vessel Basis 4,047,518
Berth Utilization - Avg. Vessel Basis 44%
Avg. Discharge/Load per Max. Vessel 1,898
Berth Capacity - Max. Vessel Basis 3,553,456
Berth Utilization - Max. Vessel Basis 50%
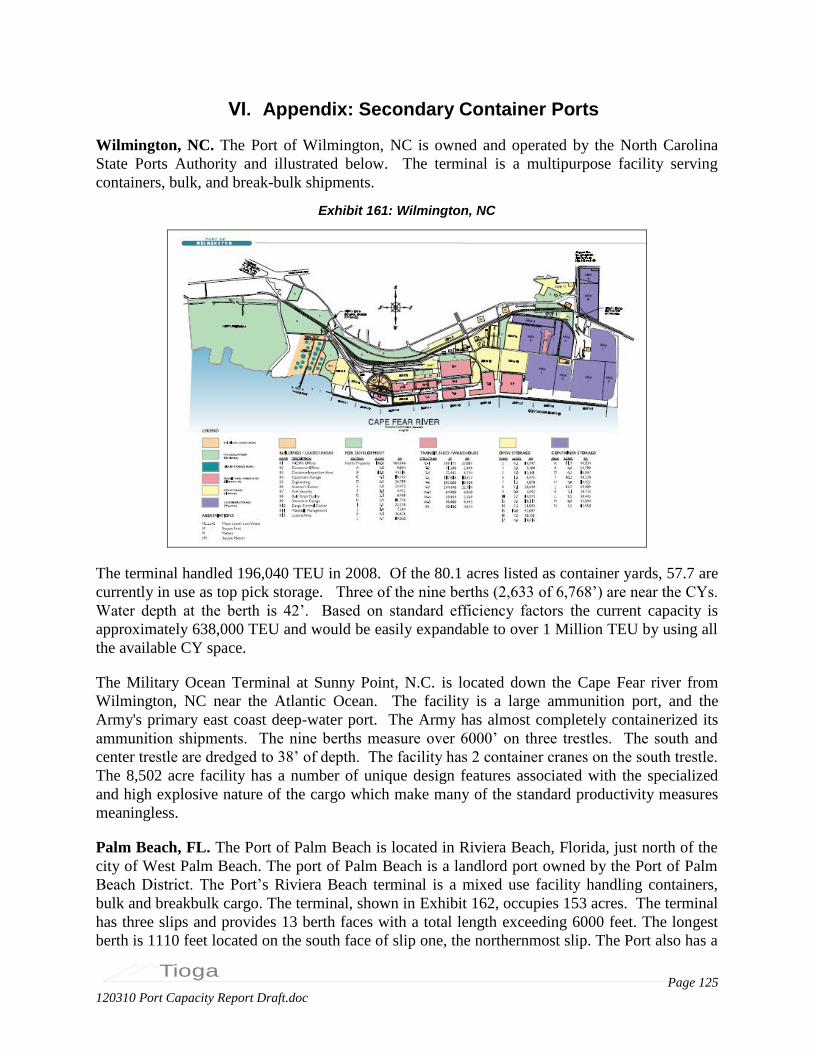
Page 125
120310 Port Capacity Report Draft.doc
Tioga
VI. Appendix: Secondary Container Ports
Wilmington, NC. The Port of Wilmington, NC is owned and operated by the North Carolina
State Ports Authority and illustrated below. The terminal is a multipurpose facility serving
containers, bulk, and break-bulk shipments.
Exhibit 161: Wilmington, NC
The terminal handled 196,040 TEU in 2008. Of the 80.1 acres listed as container yards, 57.7 are
currently in use as top pick storage. Three of the nine berths (2,633 of 6,768’) are near the CYs.
Water depth at the berth is 42’. Based on standard efficiency factors the current capacity is
approximately 638,000 TEU and would be easily expandable to over 1 Million TEU by using all
the available CY space.
The Military Ocean Terminal at Sunny Point, N.C. is located down the Cape Fear river from
Wilmington, NC near the Atlantic Ocean. The facility is a large ammunition port, and the
Army's primary east coast deep-water port. The Army has almost completely containerized its
ammunition shipments. The nine berths measure over 6000’ on three trestles. The south and
center trestle are dredged to 38’ of depth. The facility has 2 container cranes on the south trestle.
The 8,502 acre facility has a number of unique design features associated with the specialized
and high explosive nature of the cargo which make many of the standard productivity measures
meaningless.
Palm Beach, FL. The Port of Palm Beach is located in Riviera Beach, Florida, just north of the
city of West Palm Beach. The port of Palm Beach is a landlord port owned by the Port of Palm
Beach District. The Port’s Riviera Beach terminal is a mixed use facility handling containers,
bulk and breakbulk cargo. The terminal, shown in Exhibit 162, occupies 153 acres. The terminal
has three slips and provides 13 berth faces with a total length exceeding 6000 feet. The longest
berth is 1110 feet located on the south face of slip one, the northernmost slip. The Port also has a

Page 126
120310 Port Capacity Report Draft.doc
Tioga
cruise ship terminal on the north side. The terminal is limited to handling cruise ships up to 680
feet in length. The port is located less than 1.5 miles from the Atlantic Ocean and has channel
berth depth of 33 feet. The port operates its own switching rail line which provides on dock
switching service for carload and intermodal rail cars. The Port’s direct rail connection is with
the FEC Railroad.
Exhibit 162: Port of Palm Beach - Riviera Beach Terminal
Source: Google Earth Image Date January 20, 2009
The Port’s container operating tenant is Tropical Shipping, a Caribbean container carrier.
Tropical’s corporate office is located on the Riviera Beach terminal. Tropical utilizes about 55
acres of the terminal for its container operations. Based on the aerial photograph above, Tropical
utilizes six mobile harbor cranes for loading and unloading its container ships. The terminal also
has Ro-Ro capability on the inner face of slips one and two. Palm Beach container volume in
2008 was 244,638 TEU.
Tampa, FL. The Port of Tampa is located at the north end of Tampa Bay about 33 miles from
the Gulf of Mexico. The Port is primarily a bulk cargo port handling over 40 million tons of
liquid and dry bulk cargoes in 2008. The Tampa Port Authority owns a 40 acre container
terminal which is operated by stevedoring company Ports America. The Tampa Container
Terminal, shown in Exhibit 162, has two berths with a total berth length of 2100 feet. The berths
are equipped three gantry cranes. The entrance channel and main container berth are maintained
to a depth of 43 feet. A terminal expansion project completed in April 2010 increased the
terminal area from 25 to 40 acres taking terminal capacity to 200,000 annual TEU. The Port has
a phased expansion plan to increase the container terminal to 140 acres with 750,000 TEU
capacity over the next three to five years.

Page 127
120310 Port Capacity Report Draft.doc
Tioga
Exhibit 163: Port of Tampa
Source: Google Earth Image Date December 19, 2007
The terminal is served by Zim Shipping Services which provides a weekly Asia-Gulf Express
service and Horizon Lines which provides a Gulf – Puerto Rico Service. 2009 container volume
was 48,788 TEU. The Port Authority projects 2010 volume at 61,000 TEU.
Gulfport, MS. The Port of Gulfport, MS, is owned and operated by the Mississippi State Port
Authority (MSPA). The port operates 10 berths on two piers with a total berth length of nearly
6000 feet. The Gulfport terminal, shown in Exhibit 162 is a mixed use facility handling bulk,
breakbulk, and containerized cargo. The terminal is equipped with two Gottwald 100 ton cargo
cranes and has 400,00 square feet of covered storage. The port area encompasses 204 acres with
over 80 acres of open and container storage. The port channel is dredged to a depth of 36 feet.

Page 128
120310 Port Capacity Report Draft.doc
Tioga
Exhibit 164: Port of Gulfport
Source: MSPA Website Image Date December 2009
MSPA utilizes the services of two stevedoring companies, Stevedoring Services of America
(SSA) and Ports America Gulfport. The Port is served by three container shipping lines,
Chiquita’s Great White Fleet, Dole Fresh Fruit Company and Crowley Maritime. These lines
principally serve the Central American Markets with Chiquita and Dole handling imported
produce. The port handled 214,074 TEU in 2008. The port has no on dock container crates;
containers are loaded and unloaded with the vessel mounted cranes of self sustaining
containerships.
The port was severely damaged in 2005 by hurricane Katrina. As a result the Port is in the
process of undergoing a major restoration project to repair damage and to elevate the Port to an
elevation of 25 feet above sea level. The first phase of this project is filling a 60 acre area
adjacent to the West Pier. This project is approximately 54% complete. The second phase of the
project is to fill an additional 24 acres for a total expansion of 84 acres of the West Pier.
Freeport, TX. Freeport handled 71,900 TEU in 2008. The facility includes 186 acres of
developed land, a 400-foot-wide, 45’ deep channel, and a 70’ deep berthing area with 14
individual berths. Rail access is to the Union Pacific Railway. The terminal had over 3000
vessel and barge calls per year, primarily serving bulk commodities. Primary imports include
aggregates, chemicals, clothing, crude oil, foods (fruit), paper goods, plastics, and windmills.
Top export commodities include autos, chemicals, clothing, foods, paper goods, resins, and rice.
The primary container cargo moving through the port are bananas and other fresh fruits. Like
Wilmington, DE, Dole and Chiquita are major tenants.
A major new container terminal is under construction in Freeport. The initial phase of the
Velasco Terminal is expected to open in the second quarter of 2010. Phase I consists of an 800’
berth, 50’ depth, and 20 acres of CY space. The ultimate build out is 2,400’ of berthing and 90
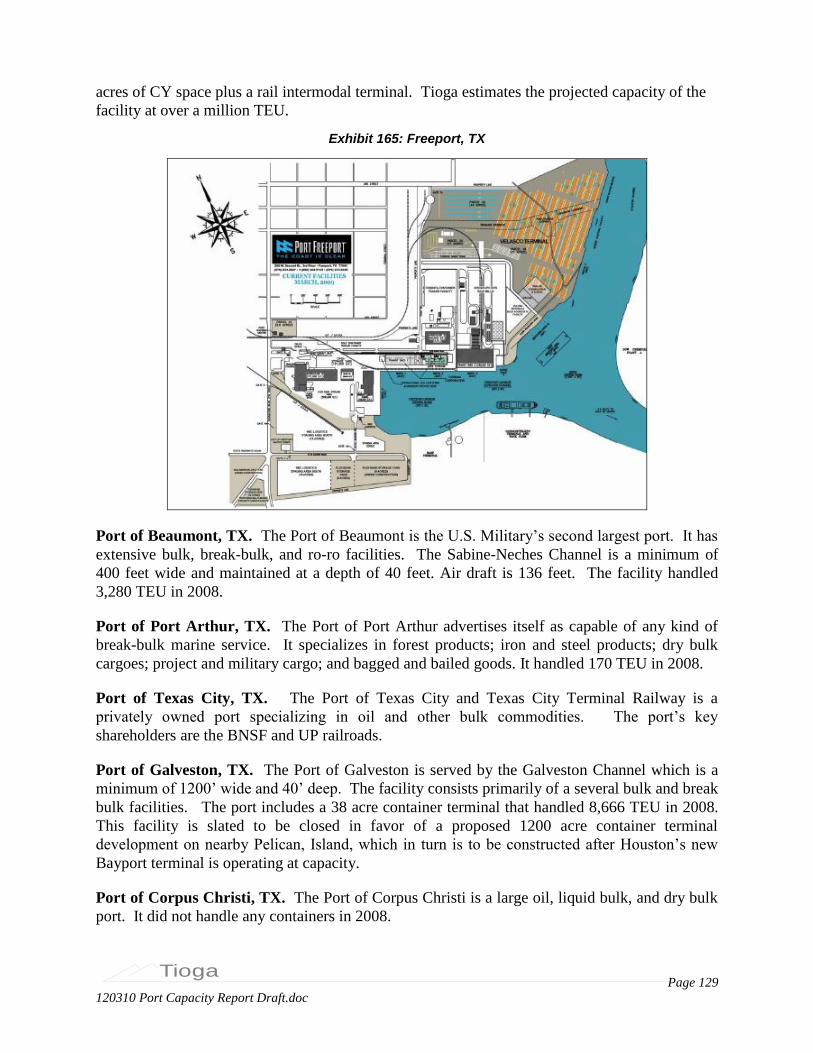
Page 129
120310 Port Capacity Report Draft.doc
Tioga
acres of CY space plus a rail intermodal terminal. Tioga estimates the projected capacity of the
facility at over a million TEU.
Exhibit 165: Freeport, TX
Port of Beaumont, TX. The Port of Beaumont is the U.S. Military’s second largest port. It has
extensive bulk, break-bulk, and ro-ro facilities. The Sabine-Neches Channel is a minimum of
400 feet wide and maintained at a depth of 40 feet. Air draft is 136 feet. The facility handled
3,280 TEU in 2008.
Port of Port Arthur, TX. The Port of Port Arthur advertises itself as capable of any kind of
break-bulk marine service. It specializes in forest products; iron and steel products; dry bulk
cargoes; project and military cargo; and bagged and bailed goods. It handled 170 TEU in 2008.
Port of Texas City, TX. The Port of Texas City and Texas City Terminal Railway is a
privately owned port specializing in oil and other bulk commodities. The port’s key
shareholders are the BNSF and UP railroads.
Port of Galveston, TX. The Port of Galveston is served by the Galveston Channel which is a
minimum of 1200’ wide and 40’ deep. The facility consists primarily of a several bulk and break
bulk facilities. The port includes a 38 acre container terminal that handled 8,666 TEU in 2008.
This facility is slated to be closed in favor of a proposed 1200 acre container terminal
development on nearby Pelican, Island, which in turn is to be constructed after Houston’s new
Bayport terminal is operating at capacity.
Port of Corpus Christi, TX. The Port of Corpus Christi is a large oil, liquid bulk, and dry bulk
port. It did not handle any containers in 2008.
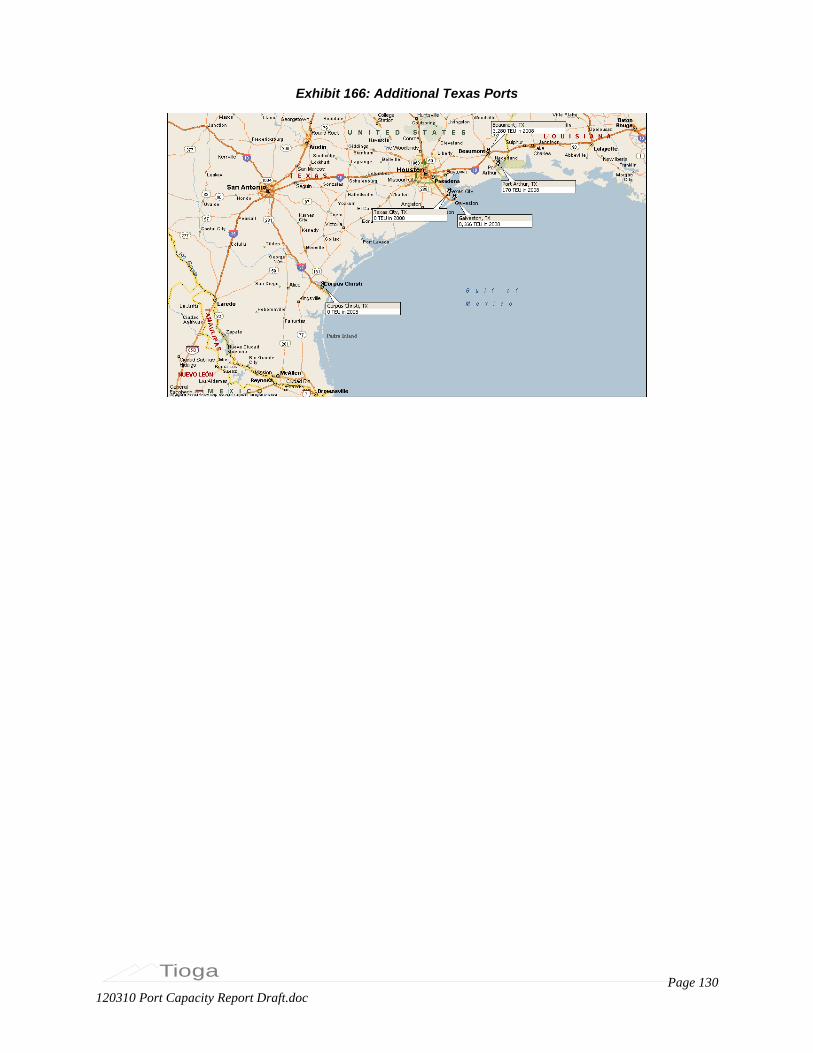
Page 130
120310 Port Capacity Report Draft.doc
Tioga
Exhibit 166: Additional Texas Ports