contact information and office hours doug kane [email protected]@osu.edu office hours: w...
TRANSCRIPT

Contact Information and Office Hours
• Doug Kane- [email protected]
Office Hours:
W 12:30- 1:18- MBD 1527 or by appointment
• Joe Conroy- [email protected]
Office Hours:
M 10:00-11:00- MBD 1527 or by appointment
Prepared by Doug Kane


Morphometry and Graphical Representation of Limnological
Data• Goals:
1. Learn to draw a morphometric map of a lake
2. Determine a number of parameters of the lake (i.e. volume, development of shoreline etc.
3. Calculate changes in total heat and oxygen content in a lake
4. Prepare an isopleth diagram showing the variation of temperature with depth and time for a lake

But wait……
• Why do I need to do all this?
• Don’t GIS programs do this nowadays?
• How is doing this going to help me learn anything?

Reasons for doing this lab
• Throughout Wetzel and the course there are isopleth diagrams, references to heat and oxygen budgets, and references to different morophometric parameters of lakes
• Lab II
• 5% of your grade

Materials
• Outline of Hypo Lake with bathymeter data (P. 86)
• 2 Blank outline maps of Hypo Lake (Pp. 90-91)• Morphometric map of Hall Lake (P. 92)• Morphometric constants handout (P. 93)• Temperature and Oxygen values in Hall Lake
(1971-1972) (P. 94)• Handout on integration (P. 95)

Point Breakdown (100 pts total)
• 20- Morphometric map- 6 m contours, only 6m done precisely• 10- Table with surface area, and area for successive contours for Hall
Lake• 10- Table showing volume of successive strata for Hall Lake• 5- Table showing mean depth, length of shoreline, development of
shoreline, and development of volume for Hall Lake• 30- Isopleth diagram for Hall Lake temperature using 5 degree
intervals• 10- Calculation of seasonal temperature budgets for Hall Lake• 10- Calculation of hypolimnetic oxygen consumption between 18
March and 30 April and 30 April and 4 June 1972• Calculation of the relative volumes of the hypolimnion and epilimnion
for July 20

What to turn in:
• Data sheets for Lab 1(pp. 87-89)- completed
• Morphometric map of Hypo Lake
• At least one sample calculation for each different type of calculation
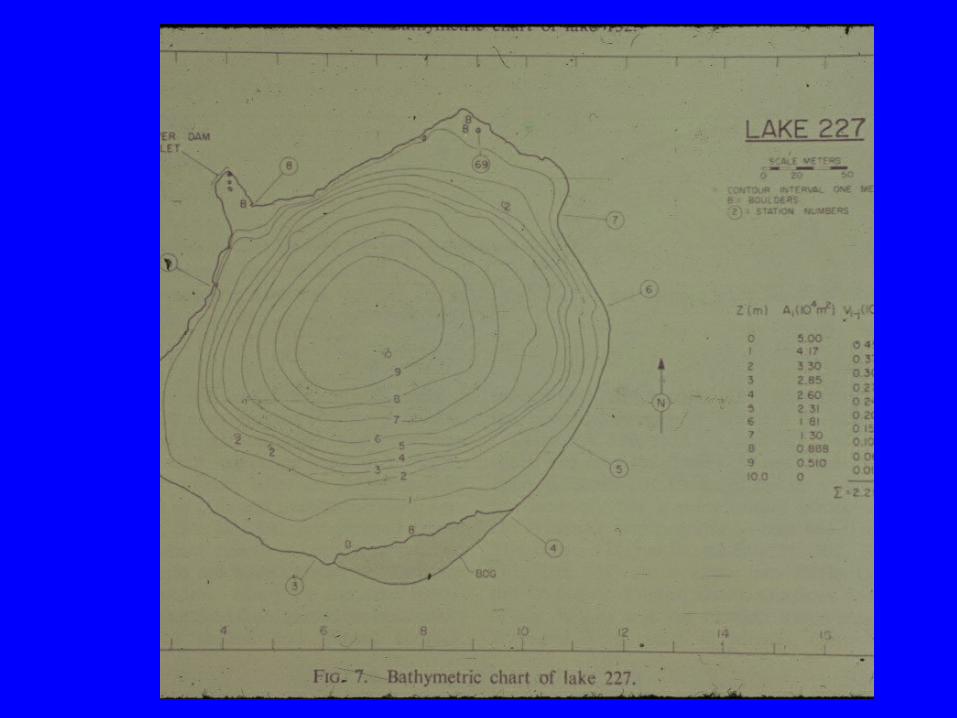
Morphometric Map
• Connect points of equal depth• Precisely for 6 m contour, approximations for others• Interpolation example: Have a 6.9 m and a 4.0 m
point, where does the 6 m contour go?• 6.9-4.0= 2.9, 6.0-4.0= 2.0• 2.0/2.9= 0.6897• Measure the actual distance (cm) between 4.0 m and
6.9 m, then multiply by 0.6897 to find out how far (cm) the 6 m contour is from 4.0 m point
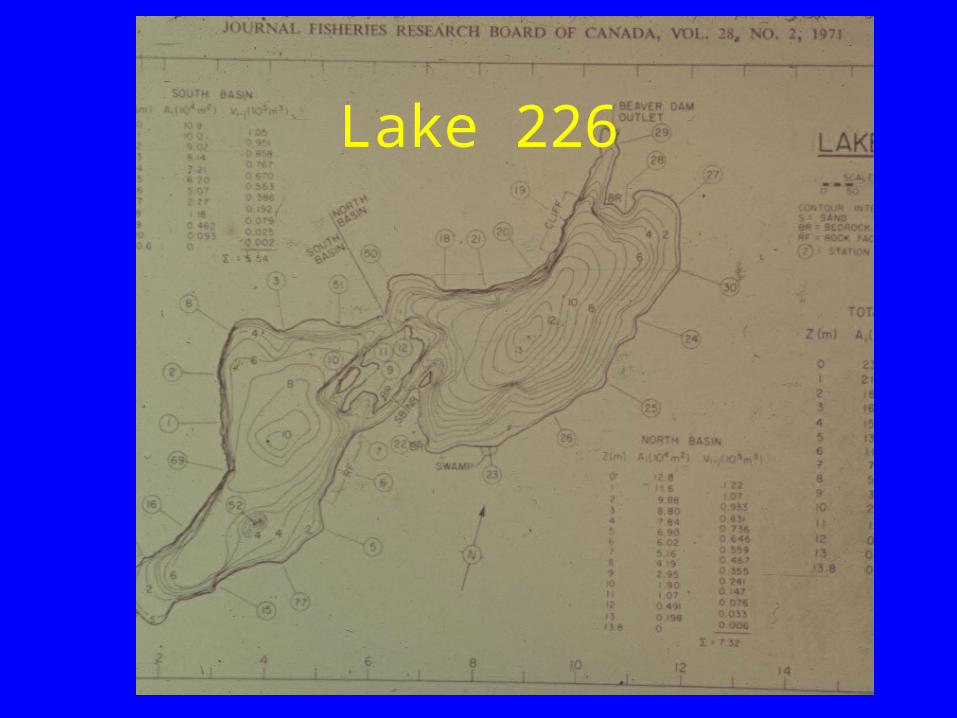
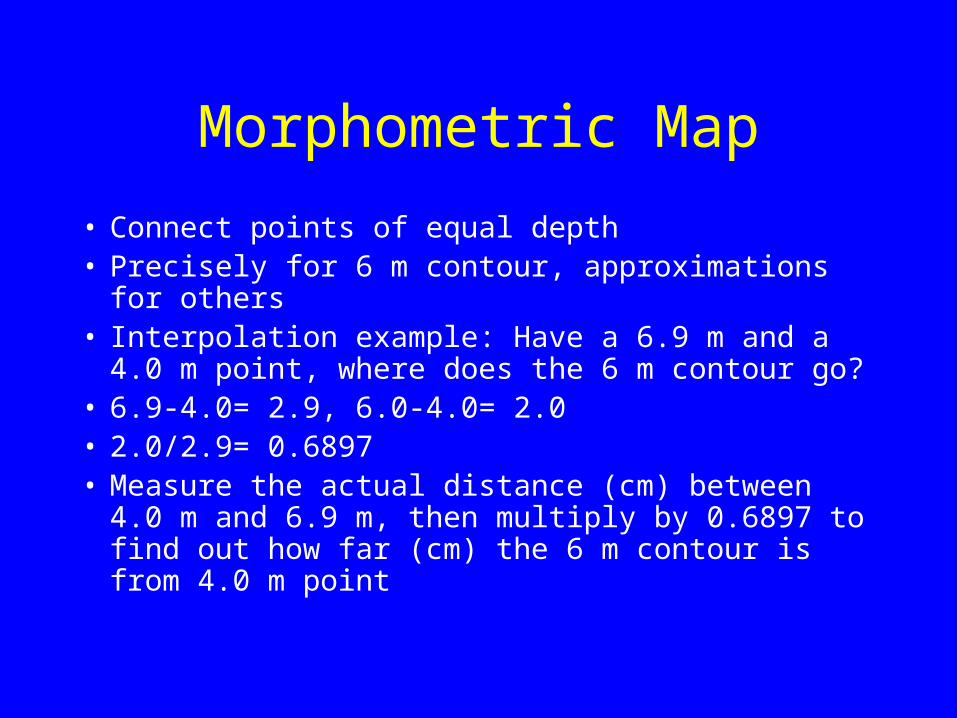
Lake 226

Calculations of areas, circumferences, volumes
• Areas- use planimeter
• Circumferences- use map reader
• Need to calibrate using square with 50 m on a side (2500 m2 )
• V= ((Am + An)/2) (n – m)
n deeper than m

Isopleths of temperature
• Y axis- depth, x- axis time, temperature is a contour on the depth*time plane

Isopleths of temperature (cont’d)
• 1st prepare temperature profiles (Type I) for each of the 10 dates given- Y- depth, X- temperature
• 2nd prepare depth (0-16, 0 at the top) vs. Julian date (400 days long)
• Pick out depths at which given temperature occurs, e.g. 5.0 degrees occurs at 7.5 m on 30 April
• Graph 5, 10, 15, and 20 ºC contours

• Do isopleth diagram in pencil!
• Interpolate as before (see P. 85)
• Contours can never cross
Isopleths of temperature (Hints)

Heat Budget
• Subtract temperature in lake on the coldest day (27- Dec-71) from temperature on the hottest day (5- Sep-72)

Heat Budget
Stratum# of squares
Area of Stratum(m ºC)
Average temperature of stratum (ºC)
VolumeofStratum(m3)
Heat in Stratum(ºCm3)

Heat Budget (cont’d)
• Want to convert m3 to cm3 • Note: 1 ºC cm3 = 1 cal• Add in heat to melt 1 cm of ice • Final Heat Budget: cal/ surface area (cm2)/ season• Hint: draw hottest and coldest days on the same
graph paper and then you just have to count the squares between the dates for each stratum
Hypolimnetic Oxygen Depletion
• What the heck is a hypolimnion?


Hypolimnetic Oxygen Depletion
• Hint: Graph the depth vs. oxygen graphs for 18- March, 30- April, and 4- June all on one page. Then count squares in between dates.
• Hint: convert m3 to L
• Hint: final answer in mg/ cm2 / month
Relative volumes of hypolimnion and epilimnion
• Delineate hypolimnion and epilimnion using a ruler
• Don’t forget that there is a metalimnion between the two
• Hypolimnion/ epilimnion

Final Four Hints
• Keep track of units!
• Keep track of units!
• Keep track of units!
• Keep track of units!

Measured Area Measured Distance Stratum Area Distance191303 1684.126117 16 3187.739 217.187354190 2394.299782 15.5 5901.974 308.771148227 1544.284271 Calibration 2469.951 199.152480985 2669.596247 15 8014.798 344.274607559 3007.787156 14 10123.938 387.887757557 3335.593288 12 12623.400 430.161878857 3568.772004 10 14644.658 460.232151321 1556.970563 Calibration 2521.507 200.788992443 3797.139536 8 16537.376 489.683
1104923 3985.673591 6 18411.664 513.9961240237 4248.911181 4 20666.442 547.9441430240 4583.337588 2 23832.519 591.0721728576 5392.687009 0 28803.782 695.446150543 1551.313708 Calibration 2508.543 200.059