consumption and production of livestock...
TRANSCRIPT

Consumption and Production of Livestock Products in Japan -The past, Present and Future-
Shinichi KobayashiDepartment of Animal Science and Resources
Nihon University
1. The consumption of livestock products since the World War Ⅱ

Trend in per capita annual meat consumption
0
5
10
15
20
25
30
35
1955 60 65 70 75 80 85 90 95 2000
kg
Total meat Beef Pork Chicken Others
The consumption had increased steeply
because of the Westernization of eating
and reflecting rising income levels
.

Changing
Japanese dietary patterns1960 1997
Meat 5.2kg 30.7kg
Milk & mp 22.2kg 93.2kg
Eggs 6.3kg 17.6kg
Livestock p. 90kcal 435kcal
ratio to daily 3.9% 16.5%energy supply

Net supply of meat by variety
beef
pork
chickenwhale
others
0%
20%
40%
60%
80%
100%
1960 64 68 72 76 80 84 88 92 96 2000

Growth rate of annual meat consumption(%)
meat beef pork chicken others
1960s 10.3 7.5 18.2 17.2 15.6
1970s 6.3 6.2 8.5 8.8 3.6
1980s 2.3 5.0 1.8 3.2 -6.4
1990s 1.0 4.0 0.2 0.6 -8.0
total 4.5 5.3 6.5 6.8 0.6
Note; average by decades from 1960s to the 90s
The rate of growth was not constant but has
been declining decade after decade.
The rate of growth of consumption varied by
varieties of meat.

Share of each meat consumption type (estimate) �i ���j
1975 1980 1985 1990 1995 2000
Beef Household use 70 62 56 48 43 37
Manufacturing 13 14 14 9 8 9
Food service industry 17 24 30 43 49 54
Pork Household use 59 52 46 40 40 41
Manufacturing 19 25 27 30 31 28
Food service industry 22 23 27 30 29 31
Chicken Household use 52 46 40 32 30 31
Manufacturing 3 4 7 8 11 9
Food service industry 45 50 53 60 59 60
The increase in demand took place more in
the food service industry than in the home.

Changing
Japanese dietary patterns To summarize,
the growth of per capita meat consumption
during the 1960s and the 1970s had centered
on pork and chicken, but in the 1980s beef led
the growth of meat consumption.
Until early 1990s, beef consumption,
especially imported beef, is the meat
accounting for most of the growth.

International comparison of willingness to consume meat Japan USA Australia Thailand Taiwan China Korea
Beef 99 80 93 63 82 138 116
Pork 92 90 91 87 71 100 77
Chicken 102 118 111 93 88 135 99
Turkey 54 124 95 62 63 89 58
Ham & sausage 84 81 98 78 58 80 69
Eggs 120 87 102 131 131 151 145
Milk 139 104 110 135 154 125 171
Yoghurt 121 117 116 125 105 99 96
Cheese 98 80 95 67 91 71 76
Fish 150 131 132 139 141 165 63
Vegetable 164 156 147 153 162 170 125
Fruits 153 153 147 156 162 172 166
Source:Kobayashi,Koizumi,Nagano & others(1994)
Note:Consumer attitude index=More - Less(in terms of percentage share of answer)+100
no item in the group of meats of which the above
index exceeds 120

The value of the index dropped to 62 in 2002 and
recovered to only 64 in 2004 due to the impact of BSE in Japan (2001) and in the USA (2004).
Changes in willingness to consume meat
1984 1988 1990 1994 1996 1998 2002 2004
Beef 120 127 116 99 63 97 62 64
Pork 112 99 85 92 91 107 94 97
Chicken 118 120 100 102 92 109 96 95
Eggs 125 124 109 120 107 111 116 109
Milk 134 140 127 139 113 118 115 113
Yoghurt 119 122 113 121 114 125 118 112
Fish 134 141 134 150 132 130 146 137
Vegetables 163 154 142 164 138 136 151 146
Source:Kobayashi,Koizumi,Nagano & others
Note:Consumer attitude index=More - Less(in terms of percentage share of answer)+100

Stagnating demand for livestock
products the per capita consumption is still low
compared to foreign countries’
difficult to foresee an increase in it up to the
level of the Western people
Japanese take less calories than people in
the West
misgivings about excessive intake of calories
and fat amid spreading adult illness
consuming a lot of fish: 36.0kg in 1994

Recent Livestock Diseases &
Related Incidents in Japan
1996 E-coli O-157
2000 FMD
Snow Brand milk poisoning incident
2001 BSE
2003 BSE(USA)
2004 Avian Influenza

Consciousness for the safety of meat
2002 2004 2002 2004
Beef 2.1 2.7 2.0 1.9
Pork 2.6 3.1 2.1 2.2
Chicken 2.7 3.0 2.1 2.1
Fish 3.0 3.2 2.3 2.3
Note:5-grade answers from "No"(1) to "Yes"(5)
Domestic Imported
The average levels for either domestic or
imported meats were relatively low, though
domestic meats were always higher than
imported ones.

Consumer consciousness of agricultural products
2002 2004
USA Australia
Domestic food are safer than imported ones. 3.5 3.7 4.0 3.6 3.9
Farmers produce safe foods. - 3.2 2.7 2.8 2.9
Food manufacturers and distributors pay enough attention to safety. 2.8 3.0 2.7 2.0 2.6
The government pays enough attention to food safety. 2.8 3.2 2.6 2.1 2.6
Source:Kobayashi,Koizumi,Nagano & others
Note:5-grade answers from "No"(1) to "Yes"(5) are indexed.
1994
Japan
As far as food safety is concerned, domestic products are
always valued far above imported ones.
Consumers simultaneously have a greater distrust of
producers, distributors and the government.
This reveals a complicated consciousness on the part of
consumers in Japan.

Food safety
The Japanese Government introduced two
major policies in terms of food safety after the
BSE incidence.
First, restructured its organization and
created the Food Safety Committee
independently from the Ministry of Agriculture,
Forestry and Fisheries and also the Ministry
of Welfare and Labor in July 2003.
Second, The beef traceability law has been
enforced from December 2003.

2. The Characteristics of
Livestock Production
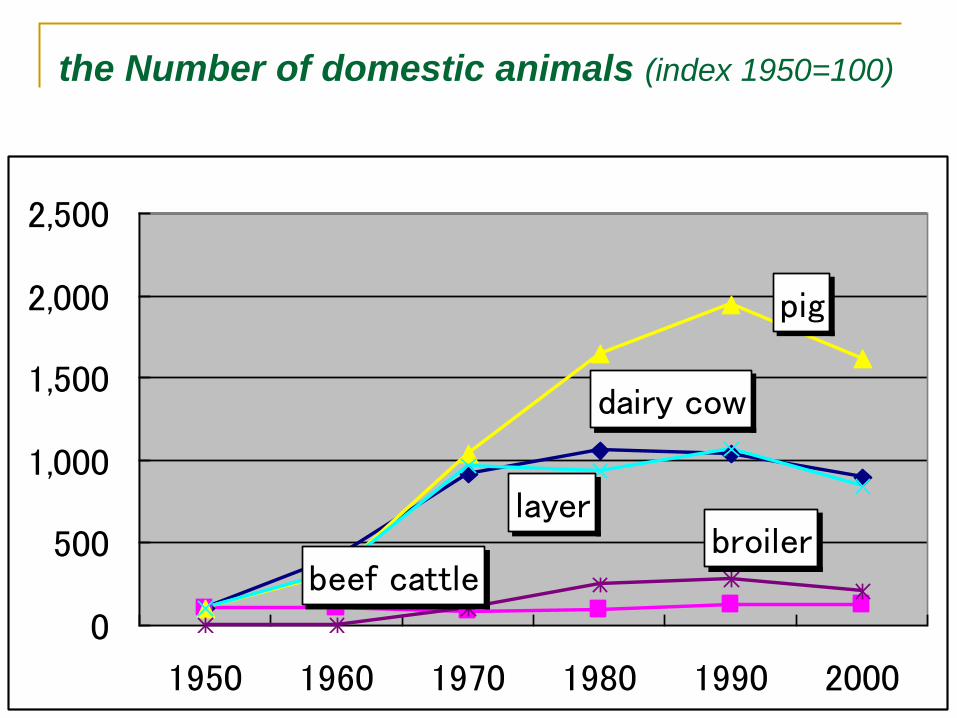
the Number of domestic animals (index 1950=100)
dairy cow
beef cattle
pig
layerbroiler
0
500
1,000
1,500
2,000
2,500
1950 1960 1970 1980 1990 2000

The number of livestock farms (unit:’000)
1950 1960 1970 1980 1990 2000
dairy cow 133 410 308 115 63 34
beef
cattle 1,986 2,032 902 364 232 117
pig 459 799 445 141 43 12
layer 3,754 3,839 1,696 187 87 5
broiler - - 18 8 6 3

The Number of animals per farm
1950 1960 1970 1980 1990 2000
dairy cow 1 2 6 18 33 52
beef cattle 1 1 2 6 12 24
pig 1 2 14 71 272 817
layer 4 14 95 831 2,046 28,646
broiler - - 3,054 15,796 27,210 36,137

The reasons why Japanese livestock
industries have developed so rapidly
Coarse grain as feed can be imported with no tariff under the feed import policy.
Livestock farmers can enlarge their size free from constraint of limited farmland.
Import restriction of livestock products and price stabilization system have supported farmers’
management.
Sharp increase in the consumer demand for livestock products stimulated production of livestock products.
Sustainable development of
the livestock Industry
Livestock sectors have been facing
several difficulties such as
a large volume of rural imports,
stagnant demand and
helplessness of the price support
system.

Sustainable development of
the livestock Industry

Sustainable development of
the livestock Industry
Need to make clear the raison d’etre of
livestock farming ,
Employment
Food supply
Partner in recycling of resources
Utilization and conservation of farm land
Landscape conservation etc.,

Grazing on a wasted land
Farm land esp. in the mountainous areas have been
abandoned due to economical and social reasons.
Grazing cattle is the handy way to conserve farm
land.
before
after