consumers’ race, ethnicity, and language preference
TRANSCRIPT

DATA HIGHLIGHTNO. 2 3 | JULY 2 021
Consumers’ Race, Ethnicity, and Language Preference Selections during the 2019 Health Insurance Marketplace® Open Enrollment Period IntroductionFollowing the conclusion of each Health Insurance Marketplace®* Open Enrollment Period (OEP), the Centers for Medicare & Medicaid Services (CMS) releases a Final Enrollment Report. The Health Insurance Exchanges 2019 Open Enrollment Report1 summarizes various sociodemographic characteristics of consumers making health plan selections or being automatically re-enrolled using the HealthCare.gov eligibility and enrollment platform, as well as for the 12 State-based Exchanges (SBEs) that do not use the HealthCare.gov platform. This data highlight complements and expands upon the aforementioned 2019 Open Enrollment Report by describing (a) granular race and ethnicity data and (b) preferred spoken and written language data for consumers from the 39 states that participated in the OEP for 2019 coverage (from November 1, 2018 through to December 15, 2018) for the Health Insurance Marketplace® through the HealthCare.gov eligibility and enrollment platform.
Data from the HealthCare.gov eligibility and enrollment platform includes – in addition to plan selection information – consumers’ self-reported data on several key sociodemographic characteristics, including race and ethnicity, as well as consumers’ spoken and written language preferences. The descriptive results presented in this data highlight are exclusive to those consumers who made Qualified Health Plan (QHP) selections from in the 39 states with Marketplaces that utilized the HealthCare.gov platform for the 2019 benefit year. Consumers of SBEs were not included.
In April of 2017, the CMS Office of Minority Health (OMH) published a data highlight2 – titled “Race, Ethnicity, and Language Preference in the Health Insurance Marketplace® 2017 Open Enrollment Period” – which describes the race, ethnicity, and language preferences of consumers of the 2017 OEP. Broadly, the purpose of this data highlight is to provide similar, updated information using data from 2019 Marketplace OEP consumers.
Key Findings:Race & Ethnicity
• Among consumers aged 18-64 years who made a plan selection on HealthCare.gov in the 2019 benefit year, nearly one-third (30.24%) did not indicate a race and one-quarter (23%) did not indicate an ethnicity.
• Of the 69.75% of consumers who did indicate a race, the three most frequently observed races were White or Caucasian (73.28%), Asian (10.48%), and Black or African American (10.42%). Further, more than one in ten (12.26%) consumers identified Hispanic or Latino.
• Among consumers who self-identified as Hispanic or Latino, the three most frequently selected subgroups included Mexican (36.75%), Other Hispanic or Latino (30.68%), and Cuban (12.76%).

2DATA HIGHLIGHT | JULY 2021Paid for by the U.S. Department of Health and Human Services.
Similar to the report from 2017, this report adheres to the Department of Health and Human Services’ (HHS) implementation guidance3 (i.e., HHS Data Standards) for reporting federal data on race, ethnicity, and preferred language. The HHS Data Standards, developed in accordance with Section 4302 of the Affordable Care Act, represent a key step toward ensuring consistent collection and reporting of reliable, granular data that is needed to determine the most effective, appropriate, and culturally competent strategies to mitigate existing health disparities.4
Study ObjectivesThis data highlight aims to:
1. Describe the racial, ethnic, and country of origin (COO)/ancestry selections made by Marketplace OEP consumers during the OEP for 2019 coverage following the HHS Data Standards3 for reporting race and ethnicity information.
2. Describe spoken and written language preference selections made by those same consumers.
To provide important context, and to highlight potential disparities in how enrollment is distributed, this report also includes how race and ethnicity groups are distributed across the overall United States population, as well as across the top three states with the largest numbers of consumers during the OEP for 2019 coverage, using 2015-2019 5-year demographic estimates from the American Community Survey (ACS).
Methods
Data Sources2019 Health Insurance Marketplace® Open Enrollment Period (OEP) Consumer Data. Consumer data from the 2019 OEP (which ran between November 1, 2018 and December 15, 2018 and included clean-up for late Exchange activity between December 16, 2019 and December 22, 2018) on race, ethnicity, COO/ancestry, preferred spoken language, and preferred written language were obtained from the CMS Multi-Dimensional Insurance Data Analytics System (MIDAS). MIDAS serves as a data repository and analytics solution system for capturing, organizing, aggregating, and analyzing CMS’ Health Insurance Marketplace® data for the 36 states that use HealthCare.gov for strengthening decision-making, streamlining business processes, and improving services offered to consumers, states, issuers, and other stakeholder groups alike.
The Health Insurance Marketplace® application optionally allowed consumers to self-identify (1) their race, (2) their ethnicity, and (3) for individuals who identified as Asian, Native Hawaiian or Other Pacific Islander (NH/OPI), or Hispanic or Latino, to identify their COO/ancestry (hereto referred to as “subgroups”).
Key Findings:Preferred Language
• Among consumers aged 18-64 years who made a plan selection on Healthcare.gov in the 2019 benefit year, approximately one-quarter (26.66%) of consumers did not select a preferred spoken language and a similar proportion – 26.63% – did not select a preferred written language.
• Of the 73.34% of consumers who did indicate a spoken language preference, the two most frequently selected languages were English (88.02%) and Spanish (9.99%). Similarly, of the 73.37% of consumers who did indicate a written language preference, 88.43% selected English and 9.85% selected Spanish.
3Paid for by the U.S. Department of Health and Human Services.DATA HIGHLIGHT | JULY 2021
Response options available for race included (a) American Indian or Alaska Native (AI/AN), (b) Asian, (c) Black or African American, (d) NH/OPI, (e) white or Caucasian, (f) two or more races, and (g) another race not listed. The response options available for ethnicity included (a) Hispanic or Latino and (b) not Hispanic or Latino.
For individuals of Asian race, the following subgroup options were available: (a) Asian Indian, (b) Chinese, (c) Filipino, (d) Japanese, (e) Korean, (f) Vietnamese, (g) other Asian, and (h) two or more Asian groups. For individuals of NH/OPI race, the following subgroup options were available: (a) Native Hawaiian, (b) Guamanian, (c) Samoan, (d) other Pacific Islander, or (e) two or more NH/OPI groups. Finally, for individuals who identified as Hispanic or Latino, the following subgroup options were available: (a) Cuban, (b) Mexican, (c) Puerto Rican, (d) other Hispanic or Latino, and (e) two or more Hispanic or Latino groups.
Response options for spoken and written language preference included (a) Arabic, (b) Chinese, (c) Gujarati, (d) Hindi, (e) Korean, (f) Tagalog, (g) Urdu, (h) Vietnamese, (i) Creole, (j) English, (k) French (l) German (m) Polish (n) Portuguese, (o) Russian, (p) Spanish, and (q) another language.
Consumers were not required to self-identify their race, ethnicity, or, where relevant, their COO/ancestry, nor were they required to disclose their spoken or written language preferences. Further, choosing to abstain from answering one of the above questions (e.g., race) did not prevent an individual from disclosing an ethnicity and/or COO/ancestry subgroup. Similarly, consumers could select for one, the other, both, or neither of the language preference questions.
2015-2019 American Community Survey (ACS) Demographic and Housing and Language Spoken at Home 5-Year Estimates Data. Publicly available data from the ACS 5-year demographic and housing summary file from 2015-20195 were used to obtain estimates of race, ethnicity, and COO/ancestry subgroups at the HHS Data Standard3 for the general U.S. population, as well as for the populations for the three states with the largest shares of OEP consumers in selecting QHPs through the HealthCare.gov Health Insurance Marketplace® during the 2019 OEP. In addition, ACS 5-year estimates of language spoken at home6 were used to report the proportion of individuals whose only spoken language at home was English for the general US population, as well as for the three states with the largest shares of 2019 OEP consumers.
AnalysisDescriptive statistics – specifically, frequencies and percentages – were generated for consumers for race, ethnicity, and, where relevant, COO/ancestry using the 2019 OEP consumer data. Frequencies and percentages were also generated for consumers’ for spoken and written language preferences.
Using the 2015-2019 ACS 5-year demographic and housing estimates, race, ethnicity, and COO/ancestry subgroup data for the total US population and for the populations of the top three states with the largest numbers of 2019 OEP consumers, were reported. The ACS 5-year estimates for language spoken at home were also used to report data on proportion of the population (for the total US population, as well as for the top three states with the largest numbers of 2019 OEP consumers) who were monolingual English speakers.
Of note, this report adheres to the CMS cell size suppression policy7 to protect consumers’ right to privacy. This policy sets a minimum threshold for the display of CMS data and stipulates that no cell containing a value between 1 and 10 may be reported directly. An asterisk (*) was placed in each cell in each table and supplemental table where relevant to denote this suppression.
4Paid for by the U.S. Department of Health and Human Services.DATA HIGHLIGHT | JULY 2021
Results
The total number of consumers aged 18-64 years who made a plan selection or were automatically re-enrolled in a Health Insurance Marketplace® plan during the 2019 OEP was N=7,526,154. The state with the largest number of plan selections and automatic re-enrollments was Florida (n=1,619,254), followed by Texas (n=950,440) and then North Carolina (n=450,164).
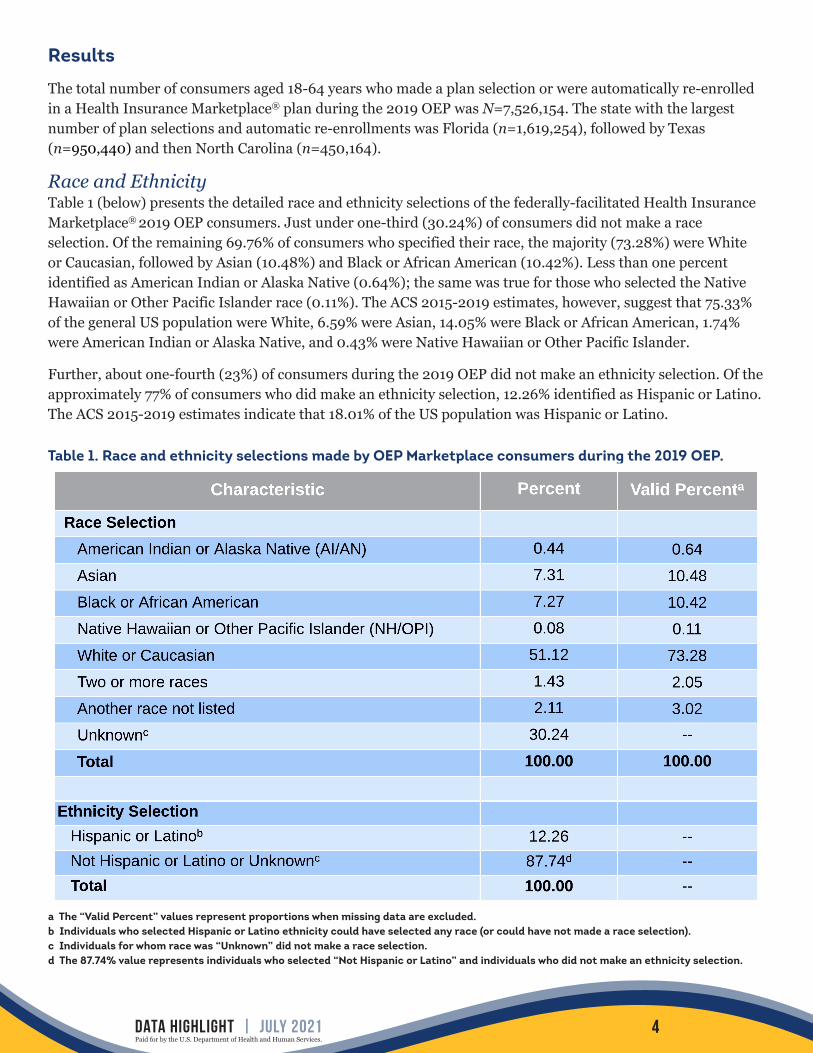
Race and EthnicityTable 1 (below) presents the detailed race and ethnicity selections of the federally-facilitated Health Insurance Marketplace® 2019 OEP consumers. Just under one-third (30.24%) of consumers did not make a race selection. Of the remaining 69.76% of consumers who specified their race, the majority (73.28%) were White or Caucasian, followed by Asian (10.48%) and Black or African American (10.42%). Less than one percent identified as American Indian or Alaska Native (0.64%); the same was true for those who selected the Native Hawaiian or Other Pacific Islander race (0.11%). The ACS 2015-2019 estimates, however, suggest that 75.33% of the general US population were White, 6.59% were Asian, 14.05% were Black or African American, 1.74% were American Indian or Alaska Native, and 0.43% were Native Hawaiian or Other Pacific Islander.
Further, about one-fourth (23%) of consumers during the 2019 OEP did not make an ethnicity selection. Of the approximately 77% of consumers who did make an ethnicity selection, 12.26% identified as Hispanic or Latino. The ACS 2015-2019 estimates indicate that 18.01% of the US population was Hispanic or Latino.
Table 1. Race and ethnicity selections made by OEP Marketplace consumers during the 2019 OEP.
a The “Valid Percent” values represent proportions when missing data are excluded.b Individuals who selected Hispanic or Latino ethnicity could have selected any race (or could have not made a race selection).c Individuals for whom race was “Unknown” did not make a race selection.d The 87.74% value represents individuals who selected “Not Hispanic or Latino” and individuals who did not make an ethnicity selection.

5DATA HIGHLIGHT | JULY 2021Paid for by the U.S. Department of Health and Human Services.
Below, Table 2 reports on the Asian racial subgroup selections of 2019 OEP consumers. The most common Asian racial subgroup selected was Vietnamese (28.17%), followed by Asian Indian (23.24%), Chinese (17.39%), another Asian subgroup (14.98%), Korean (9.57%), Filipino (3.94%), and Japanese (1.09%). The remaining 1.62% of consumers who were Asian selected two or more Asian subgroups.
By comparison, the ACS 2015-2019 estimates suggest that 10.09% of the Asian US population were Vietnamese, 22.29% were Asian Indian, 23.91% were Chinese, 15.24% were another Asian subgroup, 8.12% were Korean, 16.04% were Filipino, and 4.30% were Japanese. Of note, the ACS estimates did not report a “two or more Asian subgroups” category.
Table 2. Asian race subgroup selections made by Marketplace consumers during the 2019 OEP.
a Values represent proportions of all Asian beneficiaries.
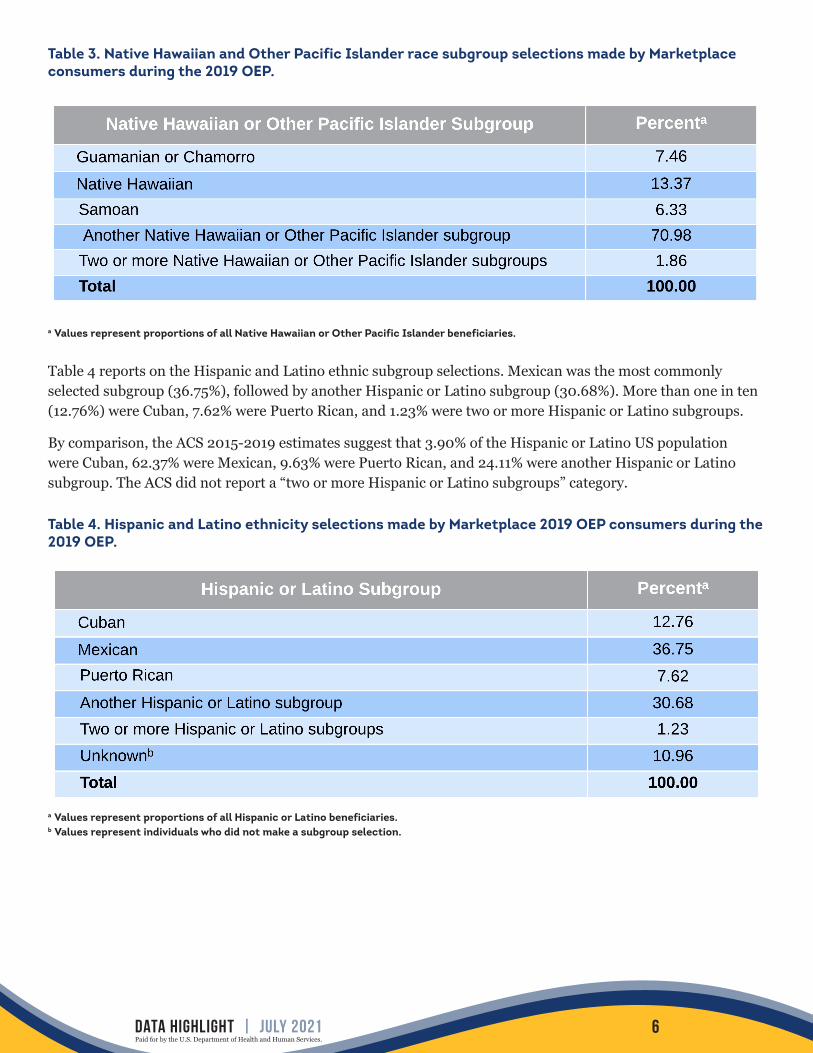
Table 3 below reports on the NH/OPI racial subgroup selections. For NH/OPI 2019 OEP consumers enrolled in the Marketplace, the most common racial subgroup was the “Another Native Hawaiian or Other Pacific Islander subgroup” (70.98%)8 followed by Native Hawaiian (13.37%).
By comparison, the ACS 2015-2019 estimates suggest that 14.35% of the NH/OPI US population were Guamanian or Chamorro, 30.68% were Native Hawaiian, 19.17% were Samoan, and 35.80% were another Native Hawaiian or Other Pacific Islander subgroup. Of note, the ACS estimates did not report a “two or more Native Hawaiian or Other Pacific Islander subgroups” category.
6DATA HIGHLIGHT | JULY 2021Paid for by the U.S. Department of Health and Human Services.
Table 3. Native Hawaiian and Other Pacific Islander race subgroup selections made by Marketplace consumers during the 2019 OEP.
a Values represent proportions of all Native Hawaiian or Other Pacific Islander beneficiaries.
Table 4 reports on the Hispanic and Latino ethnic subgroup selections. Mexican was the most commonly selected subgroup (36.75%), followed by another Hispanic or Latino subgroup (30.68%). More than one in ten (12.76%) were Cuban, 7.62% were Puerto Rican, and 1.23% were two or more Hispanic or Latino subgroups.
By comparison, the ACS 2015-2019 estimates suggest that 3.90% of the Hispanic or Latino US population were Cuban, 62.37% were Mexican, 9.63% were Puerto Rican, and 24.11% were another Hispanic or Latino subgroup. The ACS did not report a “two or more Hispanic or Latino subgroups” category.
Table 4. Hispanic and Latino ethnicity selections made by Marketplace 2019 OEP consumers during the 2019 OEP.
a Values represent proportions of all Hispanic or Latino beneficiaries.b Values represent individuals who did not make a subgroup selection.

7DATA HIGHLIGHT | JULY 2021Paid for by the U.S. Department of Health and Human Services.
State-level Race and Ethnicity InformationDuring the 2019 OEP, Florida had the largest number of plan selections and automatic re-enrollments. The majority of Florida consumers selected White (36.00%) followed by Black (7.41%), Asian (3.69%), two or more races (1.08%), AI/AN (0.10%), and NH/OPI (0.07%). In total, 22.90% of 2019 OEP consumers in Florida selected Hispanic or Latino ethnicity.
The ACS 2015-2019 estimates for Florida suggest that 77.45% of its population were White, 3.52% were Asian, 17.48% were Black or African American, 0.83% were AI/AN, and 0.20% were NH/OPI. Approximately one in four (25.58%) Floridians were Hispanic or Latino. Of those who were Hispanic or Latino, 28.44% were Cuban, 13.57% were Mexican, 21.28% were Puerto Rican, and 36.71% were another Hispanic or Latino subgroup.
Texas had the second largest number of 2019 OEP consumer plan selections and automatic re-enrollments. The majority of Texas 2019 OEP consumers selected White race (39.46%) followed by Asian (13.85%), Black (8.93%), two or more races (1.56%), AI/AN (0.31%), and NH/OPI (0.06%). In total, 25.33% of consumers were Hispanic or Latino.
The ACS 2015-2019 estimates for Texas suggest that 76.28% of its population were White, 5.54% were Asian, 13.19% were Black or African American, 1.24% were AI/AN, and 0.21% were NH/OPI. Nearly four in 10 (39.34%) Texans were Hispanic or Latino. Of those who were Hispanic or Latino, 0.81% were Cuban, 85.48% were Mexican, 1.84% were Puerto Rican, and 11.87% were another Hispanic or Latino subgroup.
Finally, North Carolina had the third largest number of 2019 OEP consumer plan selections and automatic re-enrollments. The majority of North Carolina consumers selected White (54.47%) followed by Black (11.25%), Asian (5.20%), two or more races (1.38%), AI/AN (0.46%), and NH/OPI (0.04%). In total, 4.97% of consumers were Hispanic or Latino.
The ACS 2015-2019 estimates for North Carolina suggest that 70.91% of North Carolinians were White, 3.47% were Asian, 22.99% were Black or African American, 1.99% were AI/AN, and 0.18% were NH/OPI. Nearly one in 10 (9.40%) North Carolinians were Hispanic or Latino. Of those, 2.87% were Cuban, 55.88% were Mexican, 11.03% were Puerto Rican, and 30.22% were another Hispanic or Latino subgroup.
Preferred Spoken and Written LanguagesTable 5 below presents the spoken language preferences of 2019 OEP consumers.
More than one in four 2019 OEP consumers (26.66%) did not select a preferred spoken language. For those 2019 OEP consumers that who did select a preferred spoken language, the majority (88.02%) selected English, followed by Spanish (9.99%). Asian and Pacific Islander languages were chosen as preferred spoken languages for 1.59% of 2019 OEP consumers. The remaining spoken language (i.e., Arabic, French Creole, French, German, Polish, Portuguese, Russian, and “another language”) selections were made by less than 1% of 2019 OEP consumers each.
By comparison, the 2015-2019 ACS estimates suggest that approximately 78.37% of the US population spoke only English, and the remaining 21.63% spoke a language other than English. While this does not speak directly to preferred spoken language, it may serve as a reasonable proxy, as individuals who report that they are monolingual English speakers would very likely prefer English as their spoken language.

8DATA HIGHLIGHT | JULY 2021Paid for by the U.S. Department of Health and Human Services.
Table 5. Preferred spoken language selections made by 2019 Marketplace OEP consumers.
a The “Valid Percent” values represent proportions when missing data are excluded.b Please refer to Table 7 for disaggregated information on Asian and Pacific Islander languages.c Individuals for whom race was “Unknown” did not make a preferred spoken language selection.
Table 6 below presents the written language preferences of 2019 OEP consumers. Similar to the breakdown of spoken language preferences reported above, over one-quarter (26.63%) of 2019 OEP consumers did not select a preferred written language. Of the 2019 OEP consumers who did make a preferred written language selection, the majority (88.43%) selected English. Approximately one in 10 (9.85%) 2019 OEP consumers selected Spanish, and 1.38% of 2019 OEP consumers selected Asian and Pacific Islander languages. The remaining written language (i.e., Arabic, French Creole, French, German, Polish, Portuguese, Russian, and “another language”) selections were made by less than 1% of 2019 OEP consumers each.

9DATA HIGHLIGHT | JULY 2021Paid for by the U.S. Department of Health and Human Services.
Table 6. Preferred written language selections made by Marketplace 2019 OEP consumers.
a The “Valid Percent” values represent proportions when missing data are excluded.b Please refer to Table 7 for disaggregated information on Asian and Pacific Islander languages.c Individuals for whom race was “Unknown” did not make a preferred written language selection.
Table 7 examines in more detail the spoken and written language preferences of 2019 OEP consumers who, broadly, selected “Asian and Pacific Island languages.” For 2019, Of those 2019 OEP consumers who preferred to speak Asian or other Pacific Island languages, Vietnamese was one most frequently selected followed by (42.43%) Chinese (35.38%), Korean (14.62%), Gujarati (3.86%), Hindi (1.78%), Urdu (1.25%), and Tagalog (0.67%). 2019 OEP consumer preference for written Asian or Pacific Island languages followed the same pattern as for spoken language.
Table 7. Preferred spoken and written language Asian and Pacific Island subgroup selections made by Marketplace 2019 OEP consumers.

10DATA HIGHLIGHT | JULY 2021Paid for by the U.S. Department of Health and Human Services.
State-level Preferred Spoken Language InformationIn Florida, 52.02% of 2019 OEP consumers reported English as their preferred spoken language; the 2015-2019 ACS estimates suggest that 69.74% of Floridians speak only English at home. In Texas and North Carolina, 55.17% and 71.31% of 2019 OEP consumers, respectively, reported English as their preferred spoken language. By comparison, the 2015-2019 ACS estimates suggest that 64.45% of Texans and 87.72% of individuals in North Carolina speak only English at home.
11DATA HIGHLIGHT | JULY 2021Paid for by the U.S. Department of Health and Human Services.
Conclusion
In sum, this highlight examined consumers’ detailed – at the HHS Data Standard3 level – race and ethnicity (including subgroup) and preferred spoken and written language selections made during the 2019 OEP.
We found that approximately one-third (30.24%) of consumers participating in the federally-facilitated Health Insurance Marketplace® 2019 OEP – from November 1, 2018 through December 15, 2018 – did not select a race. Of those who did, the most frequently selected race was White (73.28%), followed by Black or African American (10.42%) and Asian (10.48%). For preferred spoken language, over one-quarter (26.66%) of consumers during the 2019 OEP did not select a spoken language. Of those who did, the most frequently selected spoken language was English (88.02%) followed by Spanish (9.99%). Preferred written language results were similar. The results of this data highlight may provide guidance for targeted outreach and enrollment, as well as ideas for resource allocation (e.g., for plans in areas with high concentrations of potentially underrepresented populations).
LimitationsThere are several limitations to the present data highlight. First, it focuses only on the 39 states utilizing the federally-facilitated Health Insurance Marketplace® eligibility and enrollment platform on Healthcare.gov and therefore excludes the 12 states utilizing their own SBEs during the 2019 OEP (see “Definitions” on page 13). Second, the Health Insurance Marketplace® population is not necessarily representative of the overall US pop-ulation, as not everyone in the general US population is eligible for to enroll in a QHP. Third, preferred spoken and written language information is populated only for the individual who submits the application; therefore, any additional consumers on the same application will have unknown preferred spoken and written language.

12DATA HIGHLIGHT | JULY 2021Paid for by the U.S. Department of Health and Human Services.
Definitions
PopulationThe US population aged 18-64 years who made a plan selection on Healthcare.gov or were automatically re-enrolled for the 2019 benefit year.
States with Marketplaces utilizing the Federal Health Insurance Marketplace® through HealthCare.gov eligibility and enrollment platform:States (39) with Marketplaces that used the federal Health Insurance Marketplace® via the HealthCare.gov eligibility and enrollment platform include: Alabama, Alaska, Arizona, Arkansas, Delaware, Florida, Georgia, Hawaii, Illinois, Indiana, Iowa, Kansas, Kentucky, Louisiana, Maine, Michigan, Mississippi, Missouri, Montana, Nebraska, Nevada, New Hampshire, New Jersey, New Mexico, North Carolina, North Dakota, Ohio, Oklahoma, Oregon, Pennsylvania, South Carolina, South Dakota, Tennessee, Texas, Utah, Virginia, West Virginia, Wisconsin, and Wyoming.
States with Marketplaces Not Utilizing the Health Insurance Marketplace® using their own eligibility and enrollment platform:States (12) with Marketplaces that used their own State-based Marketplace eligibility and enrollment platforms for the 2019 benefit year include: California, Colorado, Connecticut, the District of Columbia, Idaho, Maryland, Massachusetts, Minnesota, New York, Rhode Island, Vermont, and Washington. These 12 states were not included in this data highlight.

13DATA HIGHLIGHT | JULY 2021Paid for by the U.S. Department of Health and Human Services.
References1. Centers for Medicare & Medicaid Services. Health Insurance Exchanges 2019 Open Enrollment Report.
Published March 25, 2019. Accessed December 2020. Available from: https://www.cms.gov/newsroom/fact-sheets/health-insurance-exchanges-2019-open-enrollment-report.
2. Centers for Medicare & Medicaid Services’ Office of Minority Health (CMS OMH). Detailed Race, Ethnicity, and Language Preference in the Marketplace, 2017. CMS OMH Data Highlight No. 7. Baltimore, MD. Available from: https://www.cms.gov/About-CMS/Agency-Information/OMH/research-and-data/information-products/data-highlights/Race-Ethnicity-and-Language-Preference-in-the-Health-Insurance-Marketplace. Published April 2017. Accessed December 2020.
3. US Department of Health and Human Services Implementation Guidance on Data Collection Standards for Race, Ethnicity, Sex, Primary Language, and Disability Status. US Department of Health and Human Services. Available from: https://aspe.hhs.gov/basic-report/hhs-implementation-guidance-data-collection-standards-race-ethnicity-sex-primary-language-and-disability-status. Published October 31, 2011. Accessed December 2020.
4. Dorsey R, Graham G. New HHS data standards for race, ethnicity, sex, primary language, and disability status. JAMA. 2011; 306(21):2378-2379. doi:10.1001/jama.2011.1789.
5. US Census Bureau; American Community Survey, 2019 5-Year Estimates Table DP05. Available from: https://data.census.gov/cedsci/table?q=United%20States&g=0100000US&tid=ACSDP5Y2019.DP05; (December 2020).
6. US Census Bureau; American Community Survey, 2019 5-Year Estimates Table S1601. Available from: https://data.census.gov/cedsci/table?q=United%20States&g=0100000US&tid=ACSDP5Y2019.S1601; (December 2020).
7. CMS Cell Suppression Policy. Guidance for CMS Cell Suppression Policy Web Page. US. Department of Health and Human Services Guidance Portal. Available from: https://www.hhs.gov/guidance/document/cms-cell-suppression-policy. Published September 15, 2020. Accessed December 2, 2020.
8. US Census Bureau. The Native Hawaiian and Other Pacific Islander Population: 2010 Census Briefs. Available from: https://www.census.gov/prod/cen2010/briefs/c2010br-12.pdf. Published May 2012. Accessed December 2020.
9. Health Insurance Marketplace® is a registered service mark of the U.S. Department of Health & Human Services.

14DATA HIGHLIGHT | JULY 2021Paid for by the U.S. Department of Health and Human Services.
About the Authors
This data highlight was prepared by Luis A Pons Pérez, Dr. Jessica L Maksut, Dr. Loida Tamayo, Meagan T Khau, and Amaya Razmi from the Data and Policy Analytics Group in the Office of Minority Health (OMH) at the Centers for Medicare & Medicaid Services (CMS).
Suggested Citation
Pons Pérez, LA, Maksut, JL, Tamayo, L, Khau, MT, & Ramzi, M. Report of Consumers’ Race, Ethnicity, and Language Preference Selections during the 2019 Health Insurance Marketplace® Open Enrollment Period. CMS OMH Data Highlight No. 23. Baltimore, MD: CMS Office of Minority Health. 2021.
Disclaimer
This work was sponsored by the Centers for Medicare & Medicaid Services’ Office of Minority Health and was produced, published, and disseminated at US taxpayer expense.
CMS Office of Minority Health 7500 Security BoulevardMS S2-12-17 Baltimore, MD [email protected] http://go.cms.gov/cms-omh