consumer trends - confectionery in poland€¦ · however, gum, milk chocolate bars and boiled...
TRANSCRIPT
International Markets Bureau
MARKET INDICATOR REPORT | APRIL 2013
Consumer Trends
Confectionery in Poland
MARKET SNAPSHOT INSIDE THIS ISSUE
PAGE 2
Consumer Trends Confectionery in Poland
Market Snapshot 2
Consumer Trends 3
Trade Activity 4
Category Segmentation 5
Retail Sales 7
Market Share by Brand and Company
11
Distribution Channels 12
New Product Examples 13
Resources 15
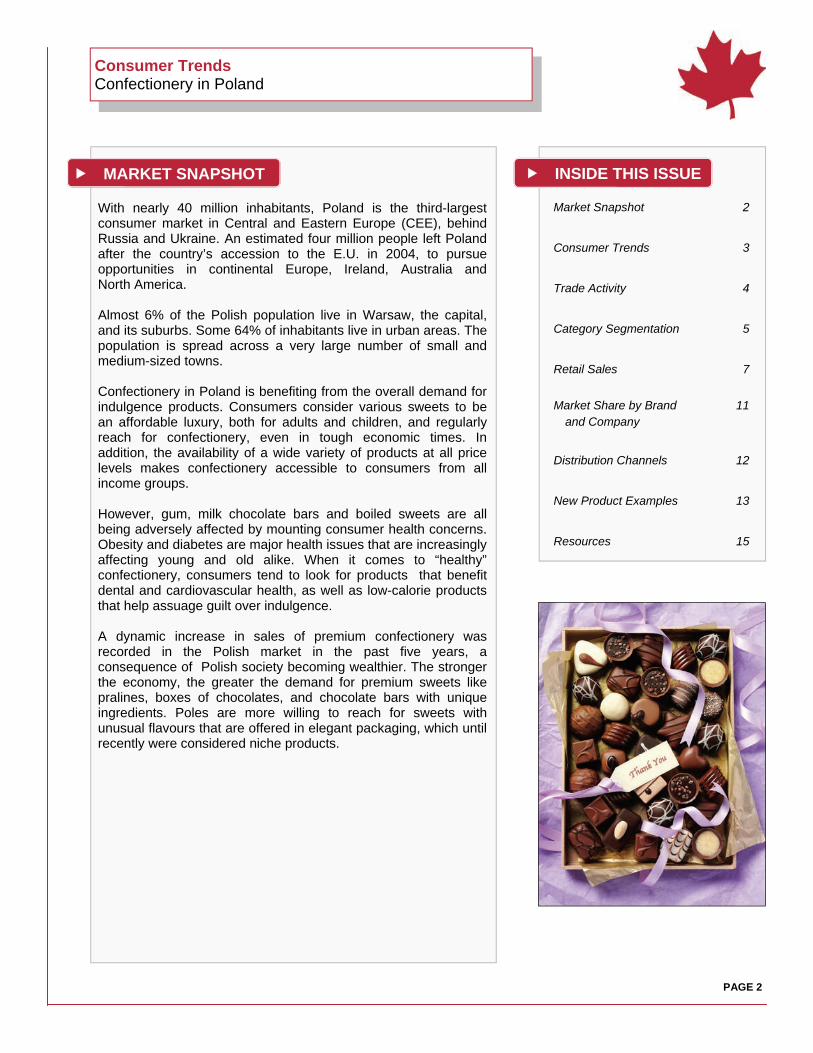
With nearly 40 million inhabitants, Poland is the third-largest consumer market in Central and Eastern Europe (CEE), behind Russia and Ukraine. An estimated four million people left Poland after the country’s accession to the E.U. in 2004, to pursue opportunities in continental Europe, Ireland, Australia and North America. Almost 6% of the Polish population live in Warsaw, the capital, and its suburbs. Some 64% of inhabitants live in urban areas. The population is spread across a very large number of small and medium-sized towns. Confectionery in Poland is benefiting from the overall demand for indulgence products. Consumers consider various sweets to be an affordable luxury, both for adults and children, and regularly reach for confectionery, even in tough economic times. In addition, the availability of a wide variety of products at all price levels makes confectionery accessible to consumers from all income groups. However, gum, milk chocolate bars and boiled sweets are all being adversely affected by mounting consumer health concerns. Obesity and diabetes are major health issues that are increasingly affecting young and old alike. When it comes to “healthy” confectionery, consumers tend to look for products that benefit dental and cardiovascular health, as well as low-calorie products that help assuage guilt over indulgence. A dynamic increase in sales of premium confectionery was recorded in the Polish market in the past five years, a consequence of Polish society becoming wealthier. The stronger the economy, the greater the demand for premium sweets like pralines, boxes of chocolates, and chocolate bars with unique ingredients. Poles are more willing to reach for sweets with unusual flavours that are offered in elegant packaging, which until recently were considered niche products.

CONSUMER TRENDS
PAGE 3
As in other European countries, the population in Poland is aging, which is having a major impact on consumption trends. The number of seniors increased from 5.1 million in 2006 to 5.2 million in 2010, accounting for 13.5% of the total population. People in Poland are expected to continue to live longer, while birth rates are expected to continue to decline. The number of Poles aged 65 years and older is projected to grow by 30.4%, reaching 6.9 million in 2020, and will account for 23% of the total Polish population in 2035. Moreover, the median age of the population is projected to increase, from 37.8 in 2010 to 41.1 years in 2020. Another particularity of the Polish market is that the number of single-person households is expected to increase, reaching 5.4 million in 2020 and representing 35.4% of total households. This trend is the result, in part, of young people increasingly deciding to postpone marriage, while pursuing careers or education and living alone. According to Euromonitor, the purchasing habits of Polish consumers are becoming more Westernized, and this is reflected in the increased demand for luxury goods in the country, including food items. Indeed, between 2005 and 2010, the luxury goods market grew by 50% (in real terms). The Polish market for luxury goods is relatively young and value sales in all categories increased significantly during this time period. It is forecasted that nearly all luxury sectors will be registering double-digit sales growth through to 2020. As disposable incomes rise, demand for premium and super-premium brands is expected to grow, while demand for private label products falls, although these less expensive products will remain popular amongst less affluent consumers. In addition, many food shoppers are expected to become more inclined to visit those retailers that offer the most pleasant shopping environment and a range of additional services, such as loyalty programs. The Polish confectionery industry has been developing steadily since the 1990s. The growth in the confectionery industry is attributed to economic factors, and sociological trends. Polish consumers are starting to purchase more impulse and indulgence products due to the better performance of the Polish economy after the 2008-09 recession. In addition, confectionery sales are being driven by two key trends: the developing snacking trend and rising health awareness. Manufacturers have developed new product lines, with claims such as “sugar-free,” in order to satisfy the need for indulgence mixed with health consciousness. They have also increased their range of dark chocolate lines, due to its perceived health benefits. In Poland, confectionery is purchased by virtually all social groups. The consumption of confectionery products is also undoubtedly stimulated by promotional campaigns by the largest manufacturers.

TRADE ACTIVITY
PAGE 4
Poland Trade Data, HS:180620 – Chocolate and Other Food Preparations Containing Cocoa, In Bars, Blocks, Slabs or Other Bulk Form
in Containers of a Content Exceeding 2 Kg
Source: Global Trade Atlas 2012 .
For several years, Italy, Germany and Belgium led chocolate imports into Poland. These three countries represent over 75% of Poland’s chocolate imports. Poland’s exports of chocolate and other products containing cocoa are growing steadily. While exports to the Czech Republic have declined by 20% from 2010, exports to Russia and Sweden have increased by 309% and 120%, respectively.
Poland Trade Data, HS:170490 – Sugar Confectionery (Including White Chocolate), Not Containing Cocoa
Source: Global Trade Atlas 2012 .
Imports in US$ Exports in US$
Partner Country 2009 2010 2011 Partner Country 2009 2010 2011
World 95,261,515 124,056,008 134,989,967 World 28,230,813 32,429,355 42,690,096
Italy 7,980,605 38,896,424 39,392,769 Czech Republic 10,393,445 10,714,641 8,537,602
Germany 40,412,002 36,648,387 38,619,515 Russia 137,071 1,556,297 6,362,240
Belgium 16,150,167 18,099,625 25,894,405 Sweden 3,171,326 2,566,508 5,644,489
Czech Republic 12,010,949 10,625,550 14,268,107 Germany 3,106,285 3,603,854 5,244,669
France 5,504,909 6,670,898 6,348,243 France 2,338,122 4,505,711 4,411,657
United Kingdom 2,838,070 1,823,372 3,633,180 Lithuania 712,800 1,829,479 3,367,585
Denmark 2,779,351 2,656,178 2,344,249 Croatia 1,297,266 127,692 1,030,511
Netherlands 1,298,124 3,713,494 1,762,953 Serbia 1,049,241 912,393 759,969
Spain 154,291 875,722 1,048,933 Austria 1,273,805 572,043 722,781
Sweden 364,923 422,560 864,957 Belgium 139,904 180,131 610,601
Imports in US$ Exports in US$
Partner Country 2009 2010 2011 Partner Country 2009 2010 2011
World 142,076,025 139,854,551 158,570,220 World 267,353,926 215,456,735 216,164,937
Germany 55,986,153 62,253,646 66,623,791 Germany 46,035,659 39,198,451 39,691,878
Netherlands 12,636,459 11,184,414 14,626,879 Czech Republic 11,077,117 11,528,539 13,263,394
Czech Republic 11,507,852 10,978,538 13,464,893 United Kingdom 11,146,084 11,819,072 12,882,037
Spain 8,592,893 9,799,886 9,593,949 Hungary 15,436,758 11,019,055 10,844,997
Belgium 5,096,464 4,465,587 7,095,527 Saudi Arabia 8,743,286 7,811,748 10,699,888
Ecuador 3,815,369 4,737,791 5,012,721 Russia 51,307,368 22,877,408 10,257,445
Colombia 5,565,449 3,089,829 4,063,204 Netherlands 6,729,962 5,536,351 8,856,843
Italy 6,591,749 3,941,242 3,894,450 Romania 4,608,119 5,938,713 6,826,430
Lithuania 2,493,266 2,554,692 3,323,233 Italy 10,789,639 7,769,888 6,803,367
Greece 3,065,939 2,666,821 3,150,402 Denmark 4,719,908 5,429,543 5,970,392
PAGE 5
Source: Euromonitor 2012 .
Source: Mintel 2012.
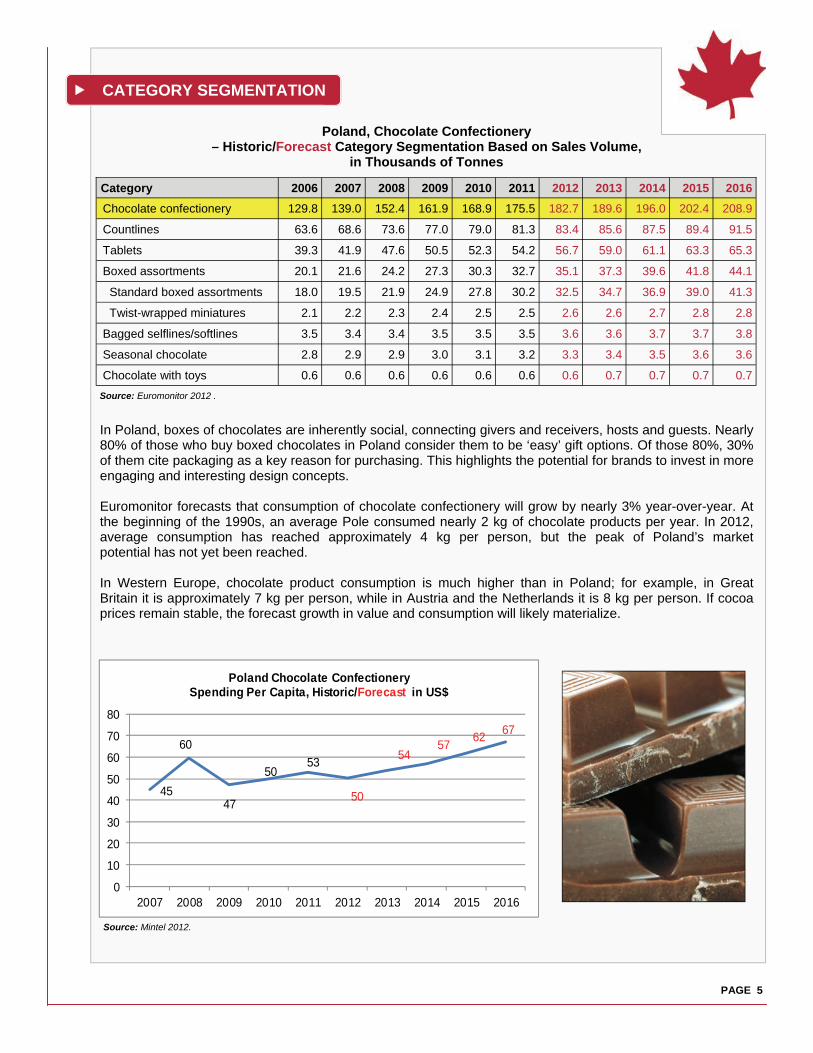
In Poland, boxes of chocolates are inherently social, connecting givers and receivers, hosts and guests. Nearly 80% of those who buy boxed chocolates in Poland consider them to be ‘easy’ gift options. Of those 80%, 30% of them cite packaging as a key reason for purchasing. This highlights the potential for brands to invest in more engaging and interesting design concepts. Euromonitor forecasts that consumption of chocolate confectionery will grow by nearly 3% year-over-year. At the beginning of the 1990s, an average Pole consumed nearly 2 kg of chocolate products per year. In 2012, average consumption has reached approximately 4 kg per person, but the peak of Poland’s market potential has not yet been reached. In Western Europe, chocolate product consumption is much higher than in Poland; for example, in Great Britain it is approximately 7 kg per person, while in Austria and the Netherlands it is 8 kg per person. If cocoa prices remain stable, the forecast growth in value and consumption will likely materialize.
Poland, Chocolate Confectionery – Historic/Forecast Category Segmentation Based on Sales Volume,
in Thousands of Tonnes
Category 2006 2007 2008 2009 2010 2011 2012 2013 2014 2015 2016
Chocolate confectionery 129.8 139.0 152.4 161.9 168.9 175.5 182.7 189.6 196.0 202.4 208.9
Countlines 63.6 68.6 73.6 77.0 79.0 81.3 83.4 85.6 87.5 89.4 91.5
Tablets 39.3 41.9 47.6 50.5 52.3 54.2 56.7 59.0 61.1 63.3 65.3
Boxed assortments 20.1 21.6 24.2 27.3 30.3 32.7 35.1 37.3 39.6 41.8 44.1
Standard boxed assortments 18.0 19.5 21.9 24.9 27.8 30.2 32.5 34.7 36.9 39.0 41.3
Twist-wrapped miniatures 2.1 2.2 2.3 2.4 2.5 2.5 2.6 2.6 2.7 2.8 2.8
Bagged selflines/softlines 3.5 3.4 3.4 3.5 3.5 3.5 3.6 3.6 3.7 3.7 3.8
Seasonal chocolate 2.8 2.9 2.9 3.0 3.1 3.2 3.3 3.4 3.5 3.6 3.6
Chocolate with toys 0.6 0.6 0.6 0.6 0.6 0.6 0.6 0.7 0.7 0.7 0.7
45
60
47
5053
50
5457
6267
0
10
20
30
40
50
60
70
80
2007 2008 2009 2010 2011 2012 2013 2014 2015 2016
Poland Chocolate ConfectionerySpending Per Capita, Historic/Forecast in US$
CATEGORY SEGMENTATION

PAGE 6
Source: Euromonitor 2012.
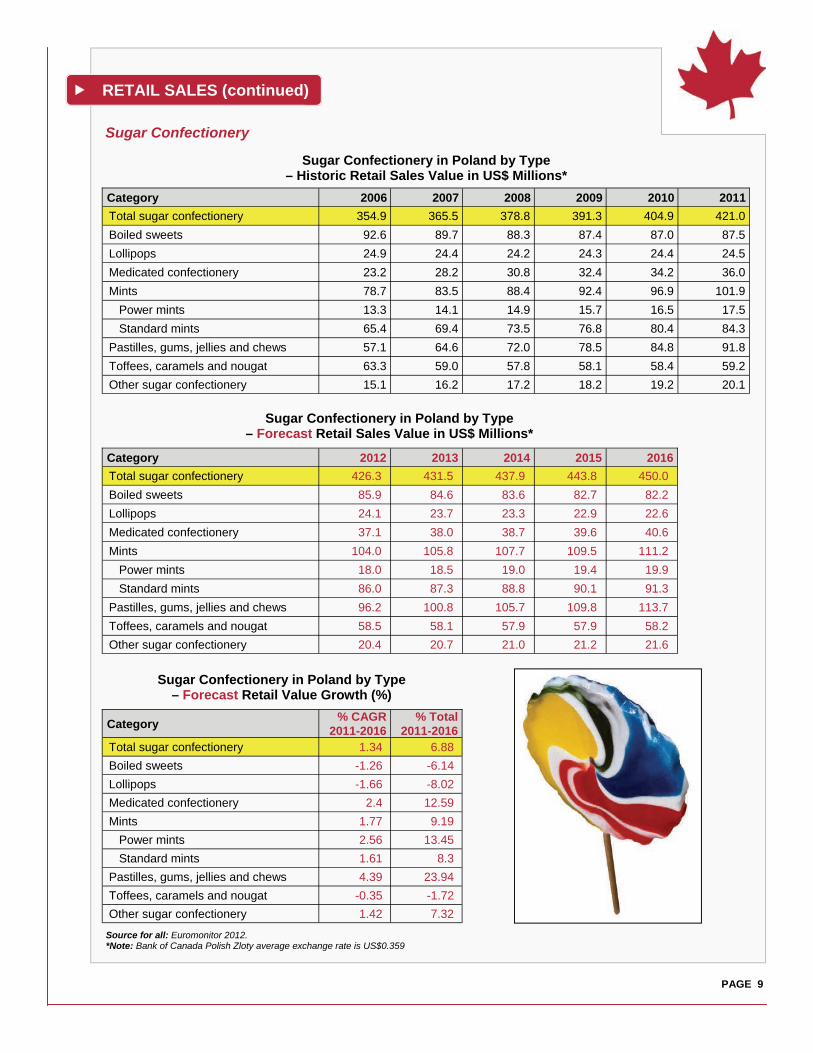
The sugar confectionery market in Poland benefits from a stronger perception of value for money than other snack segments. The market is expected to continue to benefit from the image of its products as an affordable treat, even as consumer budgets remain under pressure. Perhaps surprisingly, 85% of Polish parents are happy to give their children sweets as an occasional treat. This could be linked to the improved perception of the health credentials of sweets that contain less sugar and promote the absence of artificial ingredients, or, it may simply be evidence of more relaxed attitudes towards ‘junk food’. One way to improve the health credentials of sugar confectionery could be to emphasize their fruit content. Some 55% of users prefer sweets using natural fruit juice, with very little deviation in preference among the different demographic groups, indicating that this is a strong attitude across the market.
Poland, Sugar Confectionery – Historic/Forecast Market Segmentation Based on Sales Volume,
in Thousands of Tonnes
Category 2006 2007 2008 2009 2010 2011 2012 2013 2014 2015 2016
Sugar confectionery 40.53 40.51 41.09 41.94 42.98 44.13 45.48 46.82 48.26 49.68 51.19
Boiled sweets 16.92 16.26 15.87 15.67 15.57 15.57 15.66 15.75 15.89 16.05 16.25
Pastilles, gums, jellies and chews 5.49 6.10 6.72 7.29 7.86 8.44 9.07 9.70 10.37 10.98 11.60
Mints 6.77 7.10 7.45 7.76 8.11 8.48 8.85 9.20 9.55 9.91 10.25
Standard mints 5.76 6.05 6.34 6.60 6.89 7.20 7.50 7.79 8.07 8.36 8.63
Power mints 1.01 1.06 1.11 1.16 1.22 1.28 1.35 1.41 1.48 1.55 1.62
Toffees, caramels and nougat 6.80 6.36 6.23 6.25 6.27 6.32 6.40 6.49 6.60 6.73 6.89
Other sugar confectionery 1.77 1.84 1.91 2.00 2.11 2.18 2.26 2.34 2.43 2.50 2.59
Medicated confectionery 1.49 1.58 1.65 1.71 1.79 1.86 1.96 2.05 2.13 2.21 2.30
Lollipops 1.30 1.27 1.27 1.27 1.27 1.27 1.28 1.29 1.30 1.30 1.31
CATEGORY SEGMENTATION (continued)
PAGE 7
RETAIL SALES
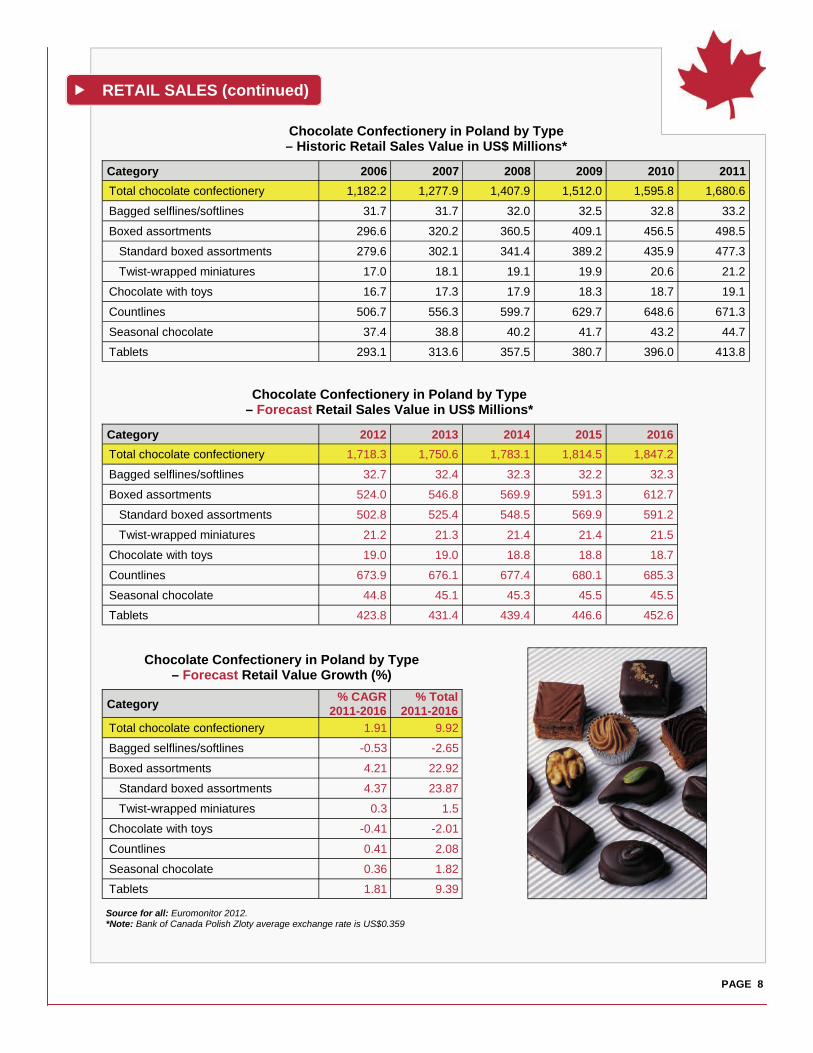
Chocolate Confectionery Poland tends to be passionate about chocolate, which supports the healthy growth of chocolate confectionery overall. The upward sales movement for high-end products confirms that chocolate confectionery is considered an affordable luxury. In addition, the selection and availability of products at all price segments is very wide, which translates into steady demand. In Poland, boxed chocolates are one of the fastest-growing segments of the entire chocolate product category. Until recently, they were considered an exclusive product associated with special occasions. However, according to Euromonitor, Poles are more and more willing to reach for these chocolate formats. When selecting chocolate products, Polish consumers tend to trust familiar brands that are known to be of high quality. This trend applies both to products purchased as gifts such as boxes of chocolates, as well as those purchased for personal use.
Poland, Gum Confectionery – Historic/Forecast Market Segmentation Based on Sales Volume,
in Thousands of Tonnes
Category 2006 2007 2008 2009 2010 2011 2012 2013 2014 2015 2016
Gum - all types 6.41 6.51 6.67 6.90 6.80 6.78 6.85 6.94 7.08 7.20 7.28
Chewing gum 5.77 5.87 6.04 6.26 6.16 6.13 6.21 6.30 6.42 6.54 6.62
Sugar-free gum 5.32 5.38 5.49 5.66 5.57 5.51 5.53 5.57 5.64 5.70 5.72
Functional gum 0.37 0.41 0.47 0.52 0.57 0.62 0.67 0.72 0.77 0.83 0.89
Sugarized gum 0.08 0.08 0.08 0.08 0.01 0.01 0.01 0.01 0.01 0.01 0.01
Bubble gum 0.64 0.63 0.64 0.64 0.64 0.64 0.65 0.65 0.65 0.66 0.67
Source: Euromonitor 2012.
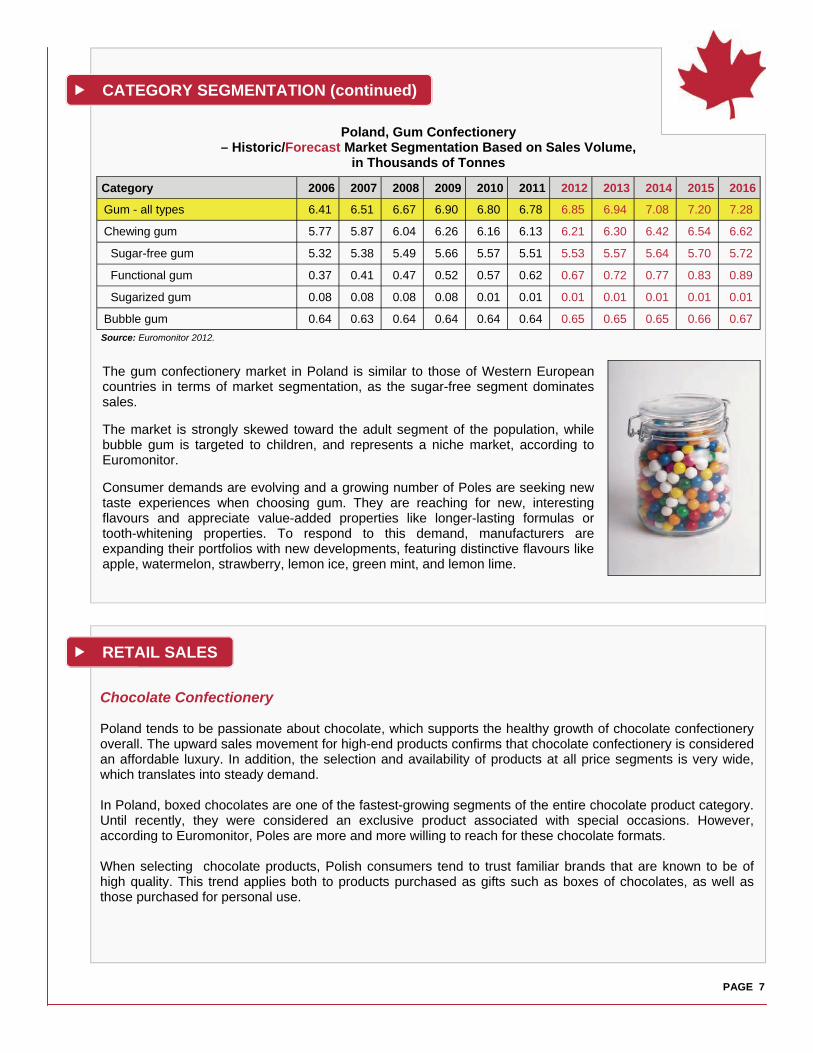
The gum confectionery market in Poland is similar to those of Western European countries in terms of market segmentation, as the sugar-free segment dominates sales. The market is strongly skewed toward the adult segment of the population, while bubble gum is targeted to children, and represents a niche market, according to Euromonitor. Consumer demands are evolving and a growing number of Poles are seeking new taste experiences when choosing gum. They are reaching for new, interesting flavours and appreciate value-added properties like longer-lasting formulas or tooth-whitening properties. To respond to this demand, manufacturers are expanding their portfolios with new developments, featuring distinctive flavours like apple, watermelon, strawberry, lemon ice, green mint, and lemon lime.
CATEGORY SEGMENTATION (continued)
PAGE 8
Source for all: Euromonitor 2012. *Note: Bank of Canada Polish Zloty average exchange rate is US$0.359
Category 2006 2007 2008 2009 2010 2011
Total chocolate confectionery 1,182.2 1,277.9 1,407.9 1,512.0 1,595.8 1,680.6
Bagged selflines/softlines 31.7 31.7 32.0 32.5 32.8 33.2
Boxed assortments 296.6 320.2 360.5 409.1 456.5 498.5
Standard boxed assortments 279.6 302.1 341.4 389.2 435.9 477.3
Twist-wrapped miniatures 17.0 18.1 19.1 19.9 20.6 21.2
Chocolate with toys 16.7 17.3 17.9 18.3 18.7 19.1
Countlines 506.7 556.3 599.7 629.7 648.6 671.3
Seasonal chocolate 37.4 38.8 40.2 41.7 43.2 44.7
Tablets 293.1 313.6 357.5 380.7 396.0 413.8
Chocolate Confectionery in Poland by Type – Historic Retail Sales Value in US$ Millions*
RETAIL SALES (continued)
Category 2012 2013 2014 2015 2016
Total chocolate confectionery 1,718.3 1,750.6 1,783.1 1,814.5 1,847.2
Bagged selflines/softlines 32.7 32.4 32.3 32.2 32.3
Boxed assortments 524.0 546.8 569.9 591.3 612.7
Standard boxed assortments 502.8 525.4 548.5 569.9 591.2
Twist-wrapped miniatures 21.2 21.3 21.4 21.4 21.5
Chocolate with toys 19.0 19.0 18.8 18.8 18.7
Countlines 673.9 676.1 677.4 680.1 685.3
Seasonal chocolate 44.8 45.1 45.3 45.5 45.5
Tablets 423.8 431.4 439.4 446.6 452.6
Chocolate Confectionery in Poland by Type – Forecast Retail Sales Value in US$ Millions*
Category % CAGR
2011-2016 % Total
2011-2016
Total chocolate confectionery 1.91 9.92
Bagged selflines/softlines -0.53 -2.65
Boxed assortments 4.21 22.92
Standard boxed assortments 4.37 23.87
Twist-wrapped miniatures 0.3 1.5
Chocolate with toys -0.41 -2.01
Countlines 0.41 2.08
Seasonal chocolate 0.36 1.82
Tablets 1.81 9.39
Chocolate Confectionery in Poland by Type – Forecast Retail Value Growth (%)
PAGE 9
Source for all: Euromonitor 2012. *Note: Bank of Canada Polish Zloty average exchange rate is US$0.359
Category 2006 2007 2008 2009 2010 2011
Total sugar confectionery 354.9 365.5 378.8 391.3 404.9 421.0
Boiled sweets 92.6 89.7 88.3 87.4 87.0 87.5
Lollipops 24.9 24.4 24.2 24.3 24.4 24.5
Medicated confectionery 23.2 28.2 30.8 32.4 34.2 36.0
Mints 78.7 83.5 88.4 92.4 96.9 101.9
Power mints 13.3 14.1 14.9 15.7 16.5 17.5
Standard mints 65.4 69.4 73.5 76.8 80.4 84.3
Pastilles, gums, jellies and chews 57.1 64.6 72.0 78.5 84.8 91.8
Toffees, caramels and nougat 63.3 59.0 57.8 58.1 58.4 59.2
Other sugar confectionery 15.1 16.2 17.2 18.2 19.2 20.1
Sugar Confectionery in Poland by Type – Historic Retail Sales Value in US$ Millions*
RETAIL SALES (continued)
Category 2012 2013 2014 2015 2016
Total sugar confectionery 426.3 431.5 437.9 443.8 450.0
Boiled sweets 85.9 84.6 83.6 82.7 82.2
Lollipops 24.1 23.7 23.3 22.9 22.6
Medicated confectionery 37.1 38.0 38.7 39.6 40.6
Mints 104.0 105.8 107.7 109.5 111.2
Power mints 18.0 18.5 19.0 19.4 19.9
Standard mints 86.0 87.3 88.8 90.1 91.3
Pastilles, gums, jellies and chews 96.2 100.8 105.7 109.8 113.7
Toffees, caramels and nougat 58.5 58.1 57.9 57.9 58.2
Other sugar confectionery 20.4 20.7 21.0 21.2 21.6
Sugar Confectionery in Poland by Type – Forecast Retail Sales Value in US$ Millions*
Category % CAGR
2011-2016 % Total
2011-2016 Total sugar confectionery 1.34 6.88
Boiled sweets -1.26 -6.14
Lollipops -1.66 -8.02
Medicated confectionery 2.4 12.59
Mints 1.77 9.19
Power mints 2.56 13.45
Standard mints 1.61 8.3
Pastilles, gums, jellies and chews 4.39 23.94
Toffees, caramels and nougat -0.35 -1.72
Other sugar confectionery 1.42 7.32
Sugar Confectionery in Poland by Type – Forecast Retail Value Growth (%)
Sugar Confectionery

PAGE 10
Source for all: Euromonitor 2012. *Note: Bank of Canada Polish Zloty average exchange rate is US$0.359
Category 2006 2007 2008 2009 2010 2011
Total gum 245.1 241.2 244.0 251.7 249.3 249.6
Chewing gum 234.7 231.2 234.0 241.8 239.2 239.5
Sugar-free gum 216.6 211.6 212.7 218.4 215.2 213.3
Functional gum 16.1 17.6 19.4 21.4 23.8 25.9
Sugarized gum 2.0 2.0 1.9 1.9 0.3 0.3
Bubble gum 10.4 10.0 9.9 10.0 10.0 10.1
Gum Confectionery in Poland by Type – Historic Retail Sales Value in US$ Millions*
RETAIL SALES (continued)
Category 2012 2013 2014 2015 2016
Total gum 246.7 244.6 243.9 243.4 242.3
Chewing gum 236.8 234.8 234.3 233.9 232.8
Sugar-free gum 209.2 205.9 203.9 201.7 199.1
Functional gum 27.3 28.6 30.2 31.9 33.5
Sugarized gum 0.3 0.3 0.2 0.2 0.2
Bubble gum 9.9 9.7 9.6 9.6 9.4
Gum Confectionery in Poland by Type – Forecast Retail Sales Value in US$ Millions*
Gum Confectionery
Flavour 2006 2007 2008 2009 2010
Mint 1 1 1 1 1
Spearmint 3 3 2 2 2
Peppermint 4 4 3 3 3
Eucalyptus 2 2 4 4 4
Fruit 5 5 5 5 5
Juicy fruit 6 6 6 6 6
2011
1
2
3
4
5
6
Citrus 7 7 7 7 7 7
Honey and lemon 8 8 8 8 8 8
Apple 11 11 11 11 9 9
Cherry menthol 9 10 10 10 10 10
Others 10 9 9 9 - -
Leading Flavours of Gum Confectionery in Poland – Ranking Based on Sales
PAGE 11
Main Chocolate Producers and their Polish Brands Cadbury Wedel Sp zoo led sales of chocolate confectionery in Poland in 2010, holding 16.9% of the market through various brands. Its main brand was Wedel.
Main Sugar Confectionery Producers and their Polish Brands Multinationals hold strong positions in sugar confectionery, as they possess strong brands and have considerable budgets to conduct price promotions. However, domestic players, like ZPC Mieszko SA, strive to improve their performance with the introduction of new products and increased promotional activities.
Brand Company 2007 2008 2009 2010
Wedel Cadbury Wedel Sp zoo 9.82 9.74 9.45 9.28
Princessa Nestlé Polska SA 6.23 6.11 5.62 5.49
Milka Kraft Foods Polska Sp zoo 4.44 4.96 4.92 4.83
Grzeski FPC Kaliszanka Sp zoo 4.68 4.64 4.81 4.71
Alpen Gold Kraft Foods Polska Sp zoo 3.93 4.44 4.53 4.47
Snickers Mars Polska Sp zoo 4.67 4.6 4.38 4.27
Prince Polo Kraft Foods Polska Sp zoo 4.18 4.11 3.75 3.66
Mars Mars Polska Sp zoo 3.09 3.07 3.07 3.05
Ptasie Mleczko Cadbury Wedel Sp zoo 2.84 2.91 2.83 3.00
Merci Storck Polska Sp zoo 2.27 2.3 2.45 2.59
Poland, Top 10 Chocolate Brand Shares Retail Value, % Breakdown Based on Retail Sales Price
Source: Euromonitor 2012.
Source: Euromonitor 2012.
Poland, Top 10 Sugar Confectionery Brand Shares Retail Value, % Breakdown Based on Retail Sales Price
MARKET SHARE BY BRAND AND COMPANY
Brand Company 2007 2008 2009 2010
Mentos Perfetti Van Melle Polska Sp zoo 7.95 8.19 8.32 8.45
Tic Tac Ferrero Polska sp zoo 7.52 7.68 7.78 7.68
Zozole ZPC Mieszko SA 4.24 4.19 4.23 4.77
Goplana Jutrzenka Colian Sp zoo - 4.41 4.47 4.53
Haribo Haribo Sp zoo 3.05 3.25 3.47 3.58
Halls Cadbury Wedel Sp zoo 3.25 3.43 3.46 3.51
Chupa Chups Perfetti Van Melle Polska Sp zoo 2.00 2.24 2.79 2.71
Landryny Cadbury Wedel Sp zoo 2.25 2.16 2.12 2.36
Werther's Original Storck Polska Sp zoo 2.31 2.21 2.30 2.24
Jojo Nestlé Polska SA 1.59 1.68 1.83 2.08
PAGE 12
Distribution Channel 2006 2007 2008 2009 2010 2011
Store-based retailing 99.66 99.49 99.45 99.35 99.2 99.05
Grocery retailers 99.66 99.49 99.45 99.35 99.2 99.05
Supermarkets/hypermarkets 38.5 38.95 38.45 40.92 43.36 45.08
Discounters 10.00 10.00 11.75 11.85 11.90 11.90
Small grocery retailers 40.11 39.22 37.85 35.28 32.94 31.27
Convenience stores 8.00 8.00 8.00 8.10 8.15 8.20
Independent small grocers 28.98 27.77 26.35 23.58 21.14 19.37
Forecourt retailers 3.13 3.45 3.50 3.60 3.65 3.70
Confectionery specialists 4.50 5.00 5.00 5.00 5.00 5.00
Other grocery retailers 6.55 6.32 6.40 6.30 6.00 5.80
Non-Store retailing 0.34 0.51 0.55 0.65 0.80 0.95
Vending 0.14 0.16 0.20 0.25 0.30 0.35
Internet retailing 0.20 0.35 0.35 0.40 0.50 0.60
Total 100 100 100 100 100 100
Source: Euromonitor 2012.
MARKET SHARE BY BRAND AND COMPANY (continued)
Main Gum Producers and their Polish Brands Multinationals, such as Wrigley Poland Sp zoo and Perfetti Van Melle Polska Sp zoo, dominate gum sales in Poland. They possess considerable budgets which enable them to invest heavily in the latest technology and advertising. This, in turn, translates into universal brand recognition and positive sales results.
Supermarkets and hypermarkets are and will likely remain the main distribution channels for confectionery in Poland, as they offer a wide selection of brands at all price levels. In addition, their capacity to organize frequent price promotions helps to attract new consumers. At the same time, discounters are expected to gain share, as there are many price-sensitive buyers in Poland, which is expected to lead to rising interest in private label products.
Sales of Confectionery by Distribution Format, % Analysis 2006-2011
Brand Company 2007 2008 2009 2010
Orbit Wrigley Poland Sp zoo 58.23 57.37 58.27 57.82
Winterfresh Wrigley Poland Sp zoo 23.51 23.54 22.56 22.44
Airwaves Wrigley Poland Sp zoo 5.15 5.61 6.12 6.82
Mentos Perfetti Van Melle Polska Sp zoo 6.14 6.54 5.64 5.61
Hubba Bubba Wrigley Poland Sp zoo 2.35 2.28 2.22 2.17
Zozole ZPC Mieszko SA 0.87 0.87 0.87 1.01
Big Red Wrigley Poland Sp zoo 0.74 0.72 0.64 -
Poland, Top Gum Confectionery Brand Shares Retail Value, % Breakdown Based on Retail Sales Price
Source: Euromonitor 2012.
DISTRIBUTION CHANNELS

PAGE 13
Tesco Extra Strong Menthol Sweets
Tesco Krowki Smietankowe
(Soft Cream Toffees)
Wawel Trufle Biale (White Compound Coated Candies)
Source for all: Mintel 2012.
Large-scale grocery outlets, namely supermarkets and hypermarkets, as well as independent small grocers, generate the majority of revenues in impulse and indulgence products such as chocolate, sugar and gum confectionery. Supermarkets and hypermarkets hold strong positions due to the wide selection of brands on offer, considerable shelf space and frequent price promotions. In the case of independent small grocers, proximity and convenience are the major factors that influence buying decisions. Discounters are becoming an increasingly important distribution channel in Poland. This trend is becoming even stronger in the face of toughening economic conditions with average disposable incomes diminishing. In addition, Polish consumers tend to be price-conscious and seek a value offering, which makes discounters an ideal place to shop for both private label and branded confectionery products.
Many global brands overlook the value of tailoring their product lines for individual markets, choosing instead to launch a single product line worldwide. In order to give a more local feel within individual markets, manufacturers should take inspiration from large national brands (see examples of customized products from Lindt chocolate on the following page).
DISTRIBUTION CHANNELS (continued)
NEW PRODUCT EXAMPLES

PAGE 14
The Lindt brand is a global market leader in flavour innovation and regularly launches new variants, which are predominantly based on new flavour combinations.
In the chewing gum sector, unusual flavours included dragon fruit, cucumber and pomegranate, tea varieties (e.g. jasmine tea, herbal tea, and green tea), ginger ale mint, liquorice mint, soy sauce, and violet.
Dragon fruit Spearmint melon Cola Functional
Source for all: Mintel 2012
Wasabi Coconut Dessert
NEW PRODUCT EXAMPLES (continued)
Lime
Beverage Alcohol Mousse texture Super fruit
Euromonitor International. “Chocolate Confectionery in Poland.” 2012. Accessed: December 2012.
— “Confectionery Statistics.” 2012. Accessed: December 2012.
— “Gum Confectionery in Poland.” 2012. Accessed: December 2012.
— “Sugar Confectionery in Poland.” 2012. Accessed: December 2012.
— “Retailing in Poland.” 2012. Accessed: December 2012.
— “Packaged food in Poland.” 2012. Accessed: December 2012.
— “Poland Overview.” 2012. Accessed: December 2012.
— “Retailers in Poland.” 2012. Accessed: December 2012.
Mintel Global New Products Database. Accessed: December 2012.
Mintel. “Category Insights – Chocolate Confectionery in Europe.” 2012. Accessed: December 2012.
PAGE 15
RESOURCES

Consumer Trends: Confectionery in Poland © Her Majesty the Queen in Right of Canada, represented by the Minister of Agriculture and Agri-Food (2013). ISSN 1920-6615 AAFC No. 11980E Photo Credits All photographs reproduced in this publication are used by permission of the rights holders. All images, unless otherwise noted, are copyright Her Majesty the Queen in Right of Canada. For additional copies, to request an alternate format, and for all other inquiries regarding this publication, please contact: Agriculture and Agri-Food Canada, Global Analysis Division 1341 Baseline Road, Tower 5, 4th floor Ottawa, ON Canada K1A 0C5 E-mail: [email protected] Aussi disponible en français sous le titre : Tendances de consommation : Le marché polonais de la confiserie
The Government of Canada has prepared this report based on primary and secondary sources of information. Although every effort has been made to ensure that the information is accurate, Agriculture and Agri-Food Canada (AAFC) assumes no liability for any actions taken based on the information contained herein.
Reproduction or redistribution of this document, in whole or in part, must include acknowledgement of Agriculture and Agri-Food Canada as the owner of the copyright in the document, through a reference citing AAFC, the title of the document and the year. Where the reproduction or redistribution includes data from this document, it must also include an acknowledgement of the specific data source(s), as noted in this document. Agriculture and Agri-Food Canada provides this document and other report services to agriculture and food industry clients free of charge.