consumer preference for sampling at farmers …ageconsearch.umn.edu/bitstream/230054/2/saea2016...1...
TRANSCRIPT
Consumer Preference for Sampling at Farmers Markets
Lijun Chen
Visiting Scholar
Department of Agricultural & Applied Economics
University of Missouri
327 Mumford Hall
Columbia, MO 65211
Email: chenlij@ missouri.edu
[Presenting Author]
Joe L. Parcell
Professor
Department of Agricultural & Applied Economics
University of Missouri
202 Mumford Hall
Columbia, MO 65211
Email: [email protected]
Jill A. Moreland
Instructor
Department of Agricultural & Applied Economics
University of Missouri
203 Mumford Hall
Columbia, MO 65211
Email: [email protected]
Selected paper prepared for presentation at the Southern Agricultural Economics
Association (SAEA) Annual Meeting, San Antonio, Texas, 6-9 February 2016
© 2016 by Lijun Chen and Joe L. Parcell. Readers may make verbatim copies of this
document for non-commercial purposes by any means, provided this copyright notice
appears on all such copies
Consumer Preference for Sampling at Farmers Markets
Abstract: From a survey of farmers’ markets shoppers, this study aims to investigate the
factors that differentiate samplers and non-samplers, factors that motivate and discourage
consumers to take free samples presented by vendors, and estimate to what extent sampling
affects consumer behavior and perceptions about products. A survey questionnaire was
conducted yielding 1145 usable responses. A simultaneous equation model and exploratory
factor analysis assessment was conducted. Results show that consumers’ trust in farmers’
markets food system have a significant impact on sampling decisions, and affiliation towards
persons distributing samples motivate consumers to sample. The post sampling effect can be
reflected by consumers’ immediate purchase, generating word of mouth and an increase in
unplanned purchase.
Keywords: Sampling, Farmers’ Markets, Consumer Preference

1
Consumer Preference for Sampling at Farmers Markets
Consumers are adopting the habit of buying local. Farmers’ markets are the consumers’
option of choice to buy local for over the past thirty years. In the last few years, the number
of farmers markets across the America increased rapidly, USDA's National Farmers Market
Directory listed 8,268 markets by August 2014, an increase of 76 percent since 2008 (USDA).
Researchers show that vendors’ sales at farmers’ markets make up a significant portion of
their income, especially for retired farmers and small sized farmers. Results of a 2006 farmers’
markets survey show average per vendor sales of $7,108 and farmers’ market sales as the sole
source of farm income for 25% of vendors (USDA, 2006).
In order to increase vendors’ revenue in farmers’ markets and improve community
economy, vendors need the expertise of promotion. Typically, farmers’ markets vendors have
many options when promoting their foods including: labeling “organic” and “local” products,
displaying their farm stories, sharing recipe cards, suggesting complementary products, and
distributing brochures (Cowee, Curtis, & Gatzke, 2009). A marketing strategy recently
adopted by vendors of farmers’ markets is sampling1. Sampling allows for a bundle of
marketing strategies to promote products. Sampling, for example, allows one to experience a
recipe card and be introduced to complementary products. This allows consumers to learn
about the item through sensory experience (Marks & Kamins, 1988). In return, the sensory
experience helps introduce new products, improve product image (Bettinger, Dawson, &
Wales, 1979) and generate word of mouth advertising (Meyer, 1982). Free samples presented
at the point of purchase (POP) have an even greater impact on purchasing behavior, both on
1Adoption of sampling is often constrained by state-level health ordinances.

2
short term and long term purchasing habits of shoppers (Heilman, Lakishyk, Radas, &
Nakamoto, 2004). As a result of trial of free sample, consumers’ behavior towards products,
brands and even markets may change if the experience is positive (McGuinness, Gendall, &
Mathew, 1992).
Empirical studies on sampling are diffused on different markets such as grocery stores
and supermarkets, and on different areas such as software and fragrance. As for farmers’
markets, we are aware of no research analyzing sampling as a promotion technique. Our
study focuses on sampling of food products presented in a farmers’ market setting. The
purpose of our study is: 1) to examine factors that motivate consumers to take free samples
presented by vendors and factors that discourage consumers to take free samples presented by
vendors, and 2) to estimate what extent sampling affects consumer behavior and perceptions
about products, vendors, and farmers’ markets. Our data set of 1145 usable responses was
collected through an electronic survey of farmers’ market attendees. Our study provides
valuable insights into the use of sampling as a marketing mix to promote food products at
farmers’ markets.
Previous Research
Farmers’ markets have played a critical role in helping small-size and medium-size
farmers gain access to consumers directly, and sales from farmers’ markets can be a crucial
component or supplement of farmers’ income (Kezis, Gwebu, Peavey, & Cheng, 1998). The
increasing popularity of farmers’ markets is owed to the consumers increasing demand for
fresh, local, and organic produce, and it also leads to an increase in research about promotion
methods at farmers’ markets, which provide useful insights for vendors to improve their
3
marketing tactic and sales income (Kezis et al., 1998; Marianne M Wolf, Spittler, & Ahern,
2005). A survey of Indiana farmers’ markets vendors found that the majority of vendors keep
farming as their full-time occupation (Brown & Miller, 2008). A study of farmers’ markets in
2000 by the USDA showed 19,000 farmers use farmers' markets as their sole marketing outlet
(Payne, 2002). On the other hand, farming can also be a part-time activity, providing only
supplemental income to many vendors, who reported produce sales less than $5,000 in an
Iowa study (Varner & Otto, 2008). Farmer-vendors are responsible for their individual
promotional campaigns because of the importance to make direct sales to overall revenue
(Kohls & Uhl, 1972). Researchers found that the long-term viability of the farmers' markets
increased when promotion activity is incorporated, especially when a part-time marketing
coordinator is hired (Conrey, Frongillo, Dollahite, & Griffin, 2003).
Promotion helps consumers generate perception and awareness of the product and
persuade consumers to buy it as an important component of marketing mix (Marianne
McGarry Wolf, 1997). In farmers’ markets, there is a variety of promotion methods applied to
increase sales, recruit new customers, build vendors’ images, etc. Promotions involving free
gifts were proved to increase purchase likelihood when the decision is affective, but to
decrease purchase likelihood when the decision is cognitive with uncertainty (Laran & Tsiros,
2013). Besides, the application of promotional tools needs to take price effect into
consideration. In promotion of a special category such as organic food, consumers are less
price-sensitive and more brand-sensitive, and sales promotion might increase the perceived
risk when product quality is uncertain (Ngobo, 2011). Providing coupons to consumers help
create a more direct marketing opportunity for vendors (Balsam, Webber, & Oehlke, 1994).

4
Yet, researchers found the effectiveness of a coupon is comparable to a price discount (Dong,
2010). As for advertising, it is a common strategic planning for a farmers’ market venues to
use vendor fees for attracting consumers in ways such as road signs, flags, and other media
(Baker, Hamshaw, & Kolodinsky, 2009). Most of these promotional tools may have intrinsic
disadvantages, for advertising has a cost that cannot be ignored, pricing strategies have
different impacts on consumers, and coupons may be less effective because of delays in
reimbursement (Suarez-Balcazar, Martinez, Cox, & Jayraj, 2006).
Sampling is a unique element in the marketing mix and appears to have increased in
recent decades. Sampling has also proved to be effective in different market types such as
grocery stores (Heilman et al., 2004), shopping malls (Freedman, 1986), perfume, skin care,
and make up (Amor & Guilbert, 2007), information goods, and software (Dey, Lahiri, & Liu,
2013; Wyss & Jorgensen, 1998), and in aspects such as intangible traits of brand image
(Amor & Guilbert, 2007), word of mouth (Holmes & Lett, 1977), etc. Nevertheless, there are
few studies on sampling at farmers’ markets that can provide meaningful insights.
Methods and Empirical Findings
A survey on sampling at farmers’ markets was carried out via Survey Monkey and
Research Now online. Survey respondents answered questions related to location,
demographic information, trust in farmers’ markets, factors that encourage consumers to
sample, factors discouraging consumers from sampling, and reactions to sampling. The
questionnaire distinguishes 939 respondents willing to sample and 206 respondents unwilling
to sample.
5
Willingness to Sample
Inspired by prior research related to demographic characteristics tied to consumers
involvement with purchasing habits (Quester & Smart, 1996; Slama & Tashchian, 1985), we
became interested in whether personal characteristics and shopping behaviors will
differentiate “samplers” and “non-samplers” (Heilman, Lakishyk, & Radas, 2011). The
information shown in Table 1 is summary statistics for both samplers and non-samplers.
We conducted a test of means between samplers and non-samplers, shown as p-values, in
the following discussion. Four demographic characteristics were found to be statistically
different between non-samplers and samplers. Respondents willing to sample are more likely
to possess a bachelor’s degree (p<0.1) and higher household income (p<0.05), which
indicates that consumers with higher education level and higher household income may be
more willing to take part in the promotion of sampling. Meanwhile, the assumed effective
factor of social capital is measured by the number of internet-based (p<0.1) and
non-internet-based social organizations (p<0.01) a respondent belongs. This suggest that
internet-based social organizations (e.g., Facebook) and non-internet-based social
organizations (e.g., church) have a positive influence on consumer decision to sample or not.
The more social organizations a consumer is involved, the more he or she is likely to take the
sample. Consumers shopping behavior also contribute to differentiate samplers from
non-samplers. Samplers are likely to shop more frequently (p<0.05) and eat out more often
(p<0.05). Consumers who eat out more may find sampling as a curiosity to enjoy new
foods.
We assume that demographic characteristics, shopping behaviors, and consumers’ trust in

6
farmers’ markets food system may have an impact on consumers’ willingness to sample. The
survey design required respondents to compare their trust in farmers’ markets with grocery
stores, with scores for seven discrete variables including food labels, certifications, fair price,
traceability, safety, quality, and word of mouth. And mean value of these seven variables is
defined as “TRUST”. Following, we note that demographic characteristics may affect
consumers’ trust scores, which cause the three aspects to share a complex interaction with
each other. Considering the dependent variable as a discrete choice variable of sampling (=1)
or not sampling (=0), a Simultaneous Equation Model was specified to analyze this
assumption (Amemiya, 1978), allowing for the endogeneity of TRUST (Cai, 2010).
Table 1. Summary Statistics
Name Variable Description Non-sampler Sampler
G %Females 11.00% 46.81%
A
Age of respondent (1= Younger than 18,
2=18-27, 3=28-37, 4=38-47, 5=48-57,
6=58-67, 7=68 and older)
2=4.85% 3=18.45% 4=17.48%
5=18.93% 6=26.21% 7=14.08%
2=6.60% 3=16.83%
4=15.23% 5=21.62%
6=27.80% 7=11.93%
WC
Self-selected weight category
(1=Underweight, 2=Average, 3 = Overweight,
4=Obese)
1=2.91% 2= 53.40% 3= 41.75%
4= 1.94%
1=2.34% 2=54.85%
3=40.47% 4=2.34%
E* %with Bachelor's Degree or higher 69.93%* 74.76%*
HS
Household size (1=No more than 2 people,
2=3-4 people, 3=5-6 people, 4=7 or more
people )
1=67.96% 2=25.24% 3=6.31%
4=0.49%
1=65.60% 2=28.01%
3=5.54% 4=0.85%
HI**
Household income ($s) (1= Less than $25k, 2=
$25-50k, 3=$50k-100k, 4=$100-150k, 5=
More than $150k)
1=6.31% 2=18.93% 3=47.09%
4=18.93% 5=8.74%
1=5.11% 2=17.15%
3=43.02% 4=22.58%
5=12.14%
CH Children in household under 18 (1=None,
2=1-2, 3=3-4, 4=More than 4)
1=74.27%2=21.84% 3=3.40%
4=0.49%
1=72.95% 2=22.68%
3=3.83% 4=0.53%
ISO* Average internet-based social organization in
the past year 1.90* 2.05*
NISO*** Average non-internet-based social
organizations in the past year 1.26*** 1.54***
7
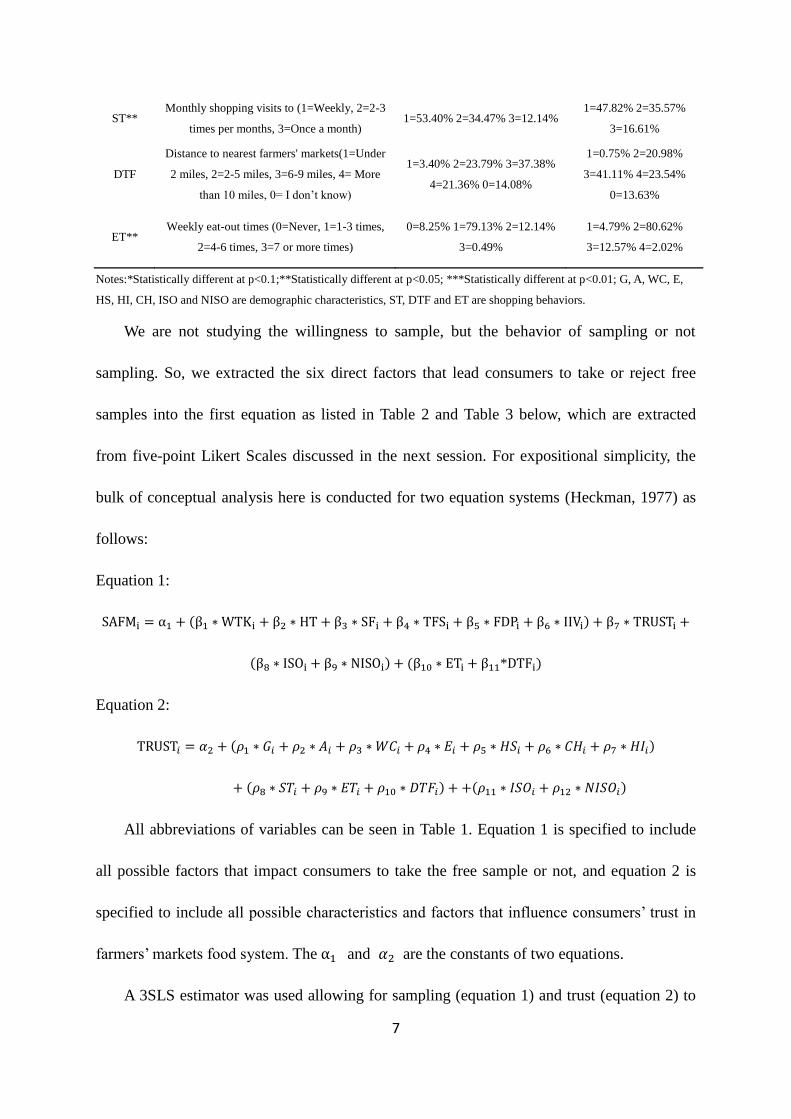
ST** Monthly shopping visits to (1=Weekly, 2=2-3
times per months, 3=Once a month) 1=53.40% 2=34.47% 3=12.14%
1=47.82% 2=35.57%
3=16.61%
DTF
Distance to nearest farmers' markets(1=Under
2 miles, 2=2-5 miles, 3=6-9 miles, 4= More
than 10 miles, 0= I don’t know)
1=3.40% 2=23.79% 3=37.38%
4=21.36% 0=14.08%
1=0.75% 2=20.98%
3=41.11% 4=23.54%
0=13.63%
ET** Weekly eat-out times (0=Never, 1=1-3 times,
2=4-6 times, 3=7 or more times)
0=8.25% 1=79.13% 2=12.14%
3=0.49%
1=4.79% 2=80.62%
3=12.57% 4=2.02%
Notes:*Statistically different at p<0.1;**Statistically different at p<0.05; ***Statistically different at p<0.01; G, A, WC, E,
HS, HI, CH, ISO and NISO are demographic characteristics, ST, DTF and ET are shopping behaviors.
We are not studying the willingness to sample, but the behavior of sampling or not
sampling. So, we extracted the six direct factors that lead consumers to take or reject free
samples into the first equation as listed in Table 2 and Table 3 below, which are extracted
from five-point Likert Scales discussed in the next session. For expositional simplicity, the
bulk of conceptual analysis here is conducted for two equation systems (Heckman, 1977) as
follows:
Equation 1:
SAFMi = α1 + (β1 ∗ WTKi + β2 ∗ HT + β3 ∗ SFi + β4 ∗ TFSi + β5 ∗ FDPi + β6 ∗ IIVi) + β7 ∗ TRUSTi +
(β8 ∗ ISOi + β9 ∗ NISOi) + (β10 ∗ ETi + β11*DTFi)
Equation 2:
TRUST𝑖 = 𝛼2 + (𝜌1 ∗ 𝐺𝑖 + 𝜌2 ∗ 𝐴𝑖 + 𝜌3 ∗ 𝑊𝐶𝑖 + 𝜌4 ∗ 𝐸𝑖 + 𝜌5 ∗ 𝐻𝑆𝑖 + 𝜌6 ∗ 𝐶𝐻𝑖 + 𝜌7 ∗ 𝐻𝐼𝑖)
+ (𝜌8 ∗ 𝑆𝑇𝑖 + 𝜌9 ∗ 𝐸𝑇𝑖 + 𝜌10 ∗ 𝐷𝑇𝐹𝑖) + +(𝜌11 ∗ 𝐼𝑆𝑂𝑖 + 𝜌12 ∗ 𝑁𝐼𝑆𝑂𝑖)
All abbreviations of variables can be seen in Table 1. Equation 1 is specified to include
all possible factors that impact consumers to take the free sample or not, and equation 2 is
specified to include all possible characteristics and factors that influence consumers’ trust in
farmers’ markets food system. The α1 and 𝛼2 are the constants of two equations.
A 3SLS estimator was used allowing for sampling (equation 1) and trust (equation 2) to
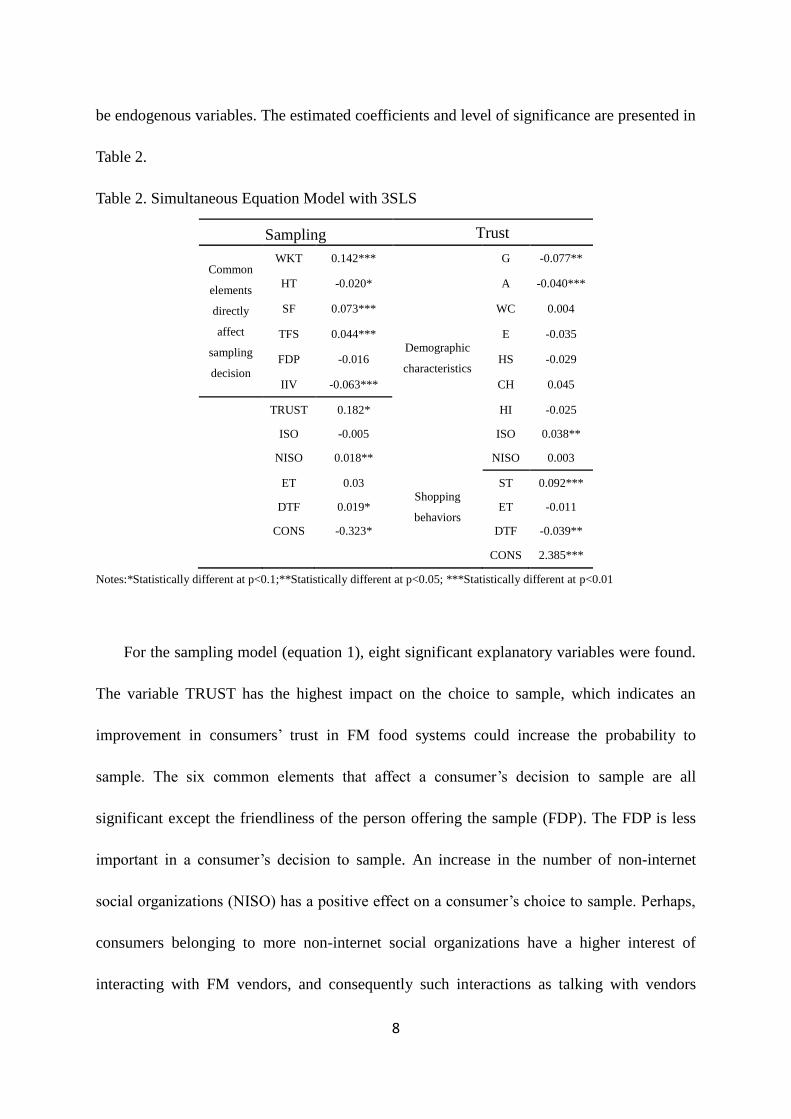
8
be endogenous variables. The estimated coefficients and level of significance are presented in
Table 2.
Table 2. Simultaneous Equation Model with 3SLS
Sampling Trust
Common
elements
directly
affect
sampling
decision
WKT 0.142***
Demographic
characteristics
G -0.077**
HT -0.020* A -0.040***
SF 0.073*** WC 0.004
TFS 0.044*** E -0.035
FDP -0.016 HS -0.029
IIV -0.063*** CH 0.045
TRUST 0.182* HI -0.025
ISO -0.005 ISO 0.038**
NISO 0.018** NISO 0.003
ET 0.03 Shopping
behaviors
ST 0.092***
DTF 0.019* ET -0.011
CONS -0.323* DTF -0.039**
CONS 2.385***
Notes:*Statistically different at p<0.1;**Statistically different at p<0.05; ***Statistically different at p<0.01
For the sampling model (equation 1), eight significant explanatory variables were found.
The variable TRUST has the highest impact on the choice to sample, which indicates an
improvement in consumers’ trust in FM food systems could increase the probability to
sample. The six common elements that affect a consumer’s decision to sample are all
significant except the friendliness of the person offering the sample (FDP). The FDP is less
important in a consumer’s decision to sample. An increase in the number of non-internet
social organizations (NISO) has a positive effect on a consumer’s choice to sample. Perhaps,
consumers belonging to more non-internet social organizations have a higher interest of
interacting with FM vendors, and consequently such interactions as talking with vendors
9
about seasonal foods and new recipes have a positive effect on sampling (Hunt, 2007).
Shoppers traveling a farther distance to visit farmers’ markets (DTF) is positively related to
the travel cost theory. Consumers who travel farther to shop at a FM’s have higher search
costs, so experiencing the food product is important to ensure the shopping experience has
both hedonic value and utility value (Babin, Darden, & Griffin, 1994).
The variable trust (TRUST) is an endogenous variable, and the level of trust is explained
primarily by five explanatory variables. Shopping frequency (ST) has the highest positive
effect on trust. Consumers frequenting FM’s more often have a higher trust in the FM food
system. An increase in distance to farmers market (DTF) is negatively related to shopper’s
trust in the FM. This finding supports the proliferation of FM’s, demonstrating the closer the
FM, the greater consumer trust and the more frequent one is to shop at the farmers’ market.
This relates to increasing demand for local food that consumers trust more in food markets
surrounding his or her living space (Katchova & Woods, 2011).
Age and gender both have a negative coefficient and significantly influence respondent
trust in FM food system. These findings indicate that male respondents and younger
respondents tend to hold more trust in FM products. As the number of internet-based social
organizations one belongs to increases, a consumer has a higher tendency to trust the FMs
food system. This result quantifies why FM’s have developed online social networking
presence to not only increase awareness of the market, but to build trust between consumers
and vendors.
Motivations for sampling
In addition to measuring sampling behavior from personal determinants, we were
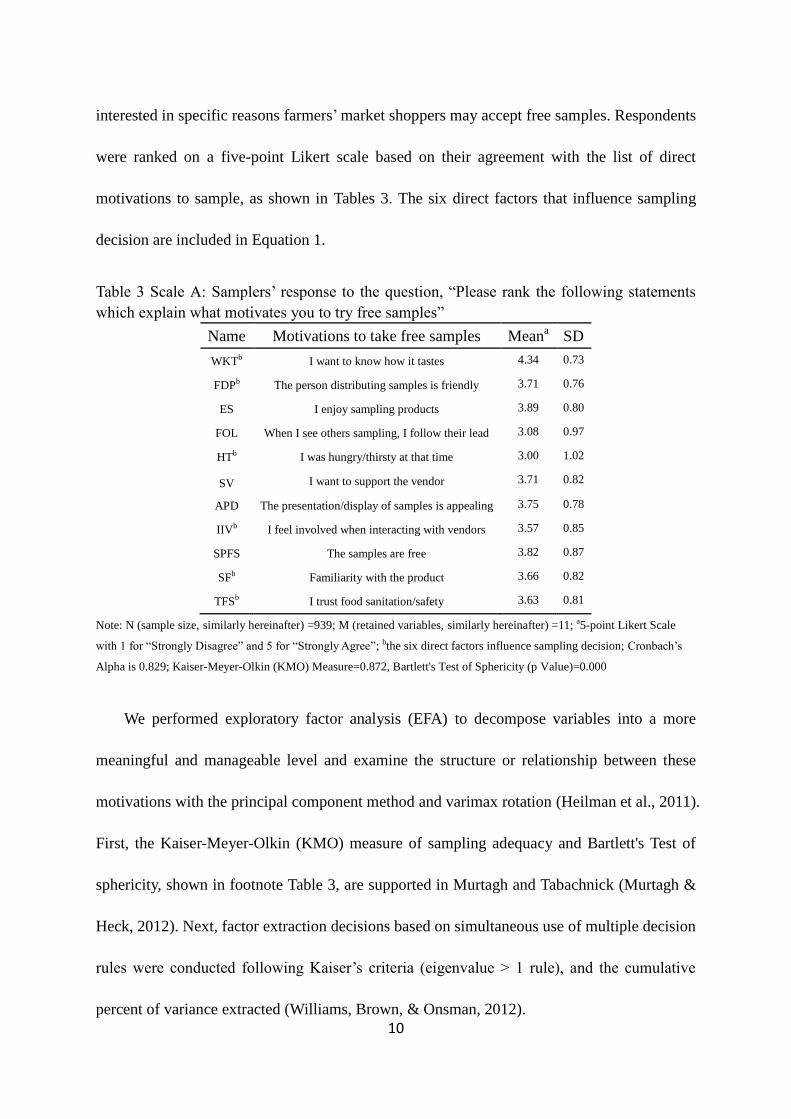
10
interested in specific reasons farmers’ market shoppers may accept free samples. Respondents
were ranked on a five-point Likert scale based on their agreement with the list of direct
motivations to sample, as shown in Tables 3. The six direct factors that influence sampling
decision are included in Equation 1.
Table 3 Scale A: Samplers’ response to the question, “Please rank the following statements
which explain what motivates you to try free samples”
Name Motivations to take free samples Meana SD
WKTb I want to know how it tastes 4.34 0.73
FDPb The person distributing samples is friendly 3.71 0.76
ES I enjoy sampling products 3.89 0.80
FOL When I see others sampling, I follow their lead 3.08 0.97
HTb I was hungry/thirsty at that time 3.00 1.02
SV I want to support the vendor 3.71 0.82
APD The presentation/display of samples is appealing 3.75 0.78
IIVb I feel involved when interacting with vendors 3.57 0.85
SPFS The samples are free 3.82 0.87
SFb Familiarity with the product 3.66 0.82
TFSb I trust food sanitation/safety 3.63 0.81
Note: N (sample size, similarly hereinafter) =939; M (retained variables, similarly hereinafter) =11; a5-point Likert Scale
with 1 for “Strongly Disagree” and 5 for “Strongly Agree”; bthe six direct factors influence sampling decision; Cronbach’s
Alpha is 0.829; Kaiser-Meyer-Olkin (KMO) Measure=0.872, Bartlett's Test of Sphericity (p Value)=0.000
We performed exploratory factor analysis (EFA) to decompose variables into a more
meaningful and manageable level and examine the structure or relationship between these
motivations with the principal component method and varimax rotation (Heilman et al., 2011).
First, the Kaiser-Meyer-Olkin (KMO) measure of sampling adequacy and Bartlett's Test of
sphericity, shown in footnote Table 3, are supported in Murtagh and Tabachnick (Murtagh &
Heck, 2012). Next, factor extraction decisions based on simultaneous use of multiple decision
rules were conducted following Kaiser’s criteria (eigenvalue > 1 rule), and the cumulative
percent of variance extracted (Williams, Brown, & Onsman, 2012).

11
Three factor categories could be extracted from 11 variables (Table 4), and they
explained 58.1% of total variance commonly accepted in humanities science (Williams et al.,
2012). Column 5 is the comprehensive value, which indicates that the model explains a
reasonable proportion of the variance in each variable, which is communality (Klopcic,
Hocquette, Kuipers, & ebrary, 2013). A value less than 0.4 is considered unacceptable.
Column 4 comprehensive values shows all variables carry the acceptable communality (Paul
& Rana, 2012).
Table 4. Rotated Component Matrix and Extracted Factors of Scale A
Variable Affiliation
Motivation
Passive
Motivation
Utilitarian
Motivation Communality
SV 0.765 0.181 -0.003 0.618
APD 0.682 0.201 0.198 0.545
IIV 0.672 0.309 0.104 0.558
SF 0.603 -0.020 0.245 0.424
FDP 0.556 0.303 0.301 0.491
TFS 0.539 -0.051 0.377 0.436
HT 0.059 0.811 0.092 0.669
FOL 0.282 0.761 0.043 0.660
WKT 0.198 -0.100 0.821 0.724
ES 0.203 0.379 0.670 0.633
SPFS 0.205 0.484 0.595 0.630
Eigen-value 4.166 1.205 1.016
% variance
explained 37.9% 11% 9.3% 58.1%
Note: Rotation converged in six iterations
The first factor explains 37.9% of total variance and captures personal emotions towards
sampled products and vendors, which was labeled “Affiliation Motivation”. Consumer
interaction with the person distributing samples has a mean value of 3.7 (see Table 3), which
indicates that positive affiliation towards involved persons are commonly recognized to
motivate consumers to sample. The other 3 variables APD, SF, and TFS, describe consumers’
satisfaction about the product itself, display and presentation, and sanitation and safety, which

12
provides the understanding that offering a favored product sample in an appealing and
sanitary way will simulate consumers to sample.
The second factor captures a passive situation a consumer was in when he or she took the
free sample. This was labeled “Passive Motivation”. It explains the reason why a consumer
who takes samples is perhaps not intentionally, but is affected by realistic conditions, such as
hunger or influence by others. This motivation had the lowest mean of 3.00 (see Table 3),
which indicates that providing samples around lunch time is an ineffective sampling strategy,
or that depending on word of mouth for a sampling experience is an unrealistic expectation.
The last factor is “Utilitarian Motivation”. Sampling enables consumers to have access
to taste the product prior to purchase.Some consumers take the free samples because of the
pleasure of sampling and not because of interest in the product. The variable ES also has a
high score of 3.89 (see Table 3). This finding indicates that sampling may be a shopping habit
expected and not so much about trying a new product prior to purchasing. Thus, sampling
may attract consumers to a vendor not to purchase the item being sampled, but to cause the
consumer to stop at the vendor’s booth.
Why not sample?
To measure specific reasons farmers’ market shoppers may reject free samples,
respondents were ranked on a five-point Likert scale based on their agreement with the list of
direct discouragements to sample as shown in Table 5. The six direct factors that influence
sampling decisions in Equation 1 are included.
Following the same procedures employed in the previous scale, an EFA was performed
to estimate dimensions of factors discouraging consumers to sample. In the rotated
13
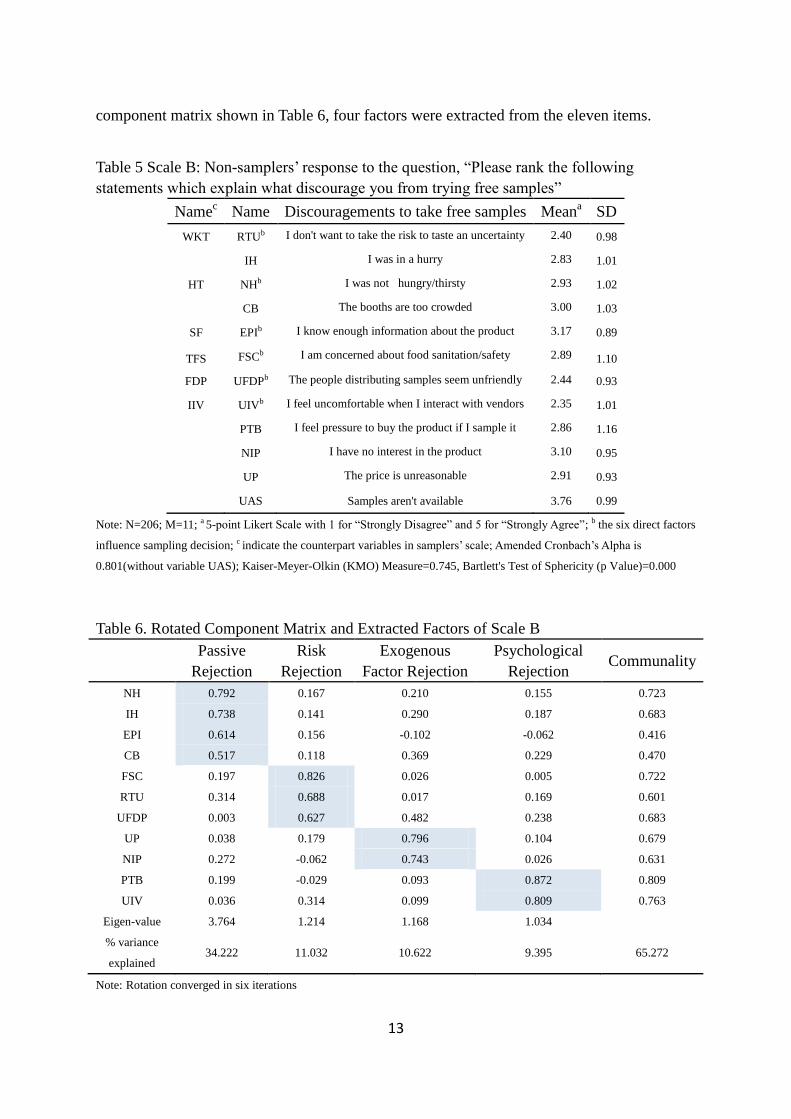
component matrix shown in Table 6, four factors were extracted from the eleven items.
Table 5 Scale B: Non-samplers’ response to the question, “Please rank the following
statements which explain what discourage you from trying free samples”
Namec Name Discouragements to take free samples Mean
a SD
WKT RTUb I don't want to take the risk to taste an uncertainty 2.40 0.98
IH I was in a hurry 2.83 1.01
HT NHb I was not hungry/thirsty 2.93 1.02
CB The booths are too crowded 3.00 1.03
SF EPIb I know enough information about the product 3.17 0.89
TFS FSCb I am concerned about food sanitation/safety 2.89 1.10
FDP UFDPb The people distributing samples seem unfriendly 2.44 0.93
IIV UIVb I feel uncomfortable when I interact with vendors 2.35 1.01
PTB I feel pressure to buy the product if I sample it 2.86 1.16
NIP I have no interest in the product 3.10 0.95
UP The price is unreasonable 2.91 0.93
UAS Samples aren't available 3.76 0.99
Note: N=206; M=11; a 5-point Likert Scale with 1 for “Strongly Disagree” and 5 for “Strongly Agree”; b the six direct factors
influence sampling decision; c indicate the counterpart variables in samplers’ scale; Amended Cronbach’s Alpha is
0.801(without variable UAS); Kaiser-Meyer-Olkin (KMO) Measure=0.745, Bartlett's Test of Sphericity (p Value)=0.000
Table 6. Rotated Component Matrix and Extracted Factors of Scale B
Passive
Rejection
Risk
Rejection
Exogenous
Factor Rejection
Psychological
Rejection Communality
NH 0.792 0.167 0.210 0.155 0.723
IH 0.738 0.141 0.290 0.187 0.683
EPI 0.614 0.156 -0.102 -0.062 0.416
CB 0.517 0.118 0.369 0.229 0.470
FSC 0.197 0.826 0.026 0.005 0.722
RTU 0.314 0.688 0.017 0.169 0.601
UFDP 0.003 0.627 0.482 0.238 0.683
UP 0.038 0.179 0.796 0.104 0.679
NIP 0.272 -0.062 0.743 0.026 0.631
PTB 0.199 -0.029 0.093 0.872 0.809
UIV 0.036 0.314 0.099 0.809 0.763
Eigen-value 3.764 1.214 1.168 1.034
% variance
explained 34.222 11.032 10.622 9.395 65.272
Note: Rotation converged in six iterations
14
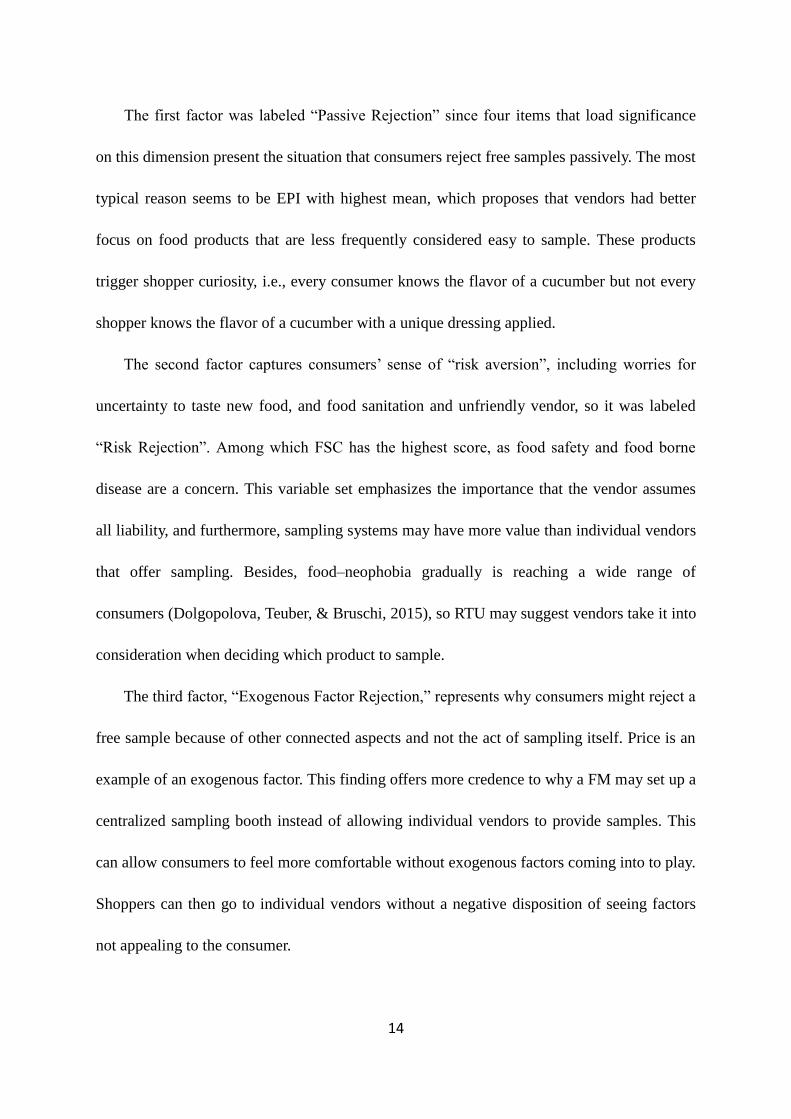
The first factor was labeled “Passive Rejection” since four items that load significance
on this dimension present the situation that consumers reject free samples passively. The most
typical reason seems to be EPI with highest mean, which proposes that vendors had better
focus on food products that are less frequently considered easy to sample. These products
trigger shopper curiosity, i.e., every consumer knows the flavor of a cucumber but not every
shopper knows the flavor of a cucumber with a unique dressing applied.
The second factor captures consumers’ sense of “risk aversion”, including worries for
uncertainty to taste new food, and food sanitation and unfriendly vendor, so it was labeled
“Risk Rejection”. Among which FSC has the highest score, as food safety and food borne
disease are a concern. This variable set emphasizes the importance that the vendor assumes
all liability, and furthermore, sampling systems may have more value than individual vendors
that offer sampling. Besides, food–neophobia gradually is reaching a wide range of
consumers (Dolgopolova, Teuber, & Bruschi, 2015), so RTU may suggest vendors take it into
consideration when deciding which product to sample.
The third factor, “Exogenous Factor Rejection,” represents why consumers might reject a
free sample because of other connected aspects and not the act of sampling itself. Price is an
example of an exogenous factor. This finding offers more credence to why a FM may set up a
centralized sampling booth instead of allowing individual vendors to provide samples. This
can allow consumers to feel more comfortable without exogenous factors coming into to play.
Shoppers can then go to individual vendors without a negative disposition of seeing factors
not appealing to the consumer.

15
The last factor was labeled “Psychological Rejection” for it referred to psychological
activities that cause consumers to reject samples, mainly including psychological barriers to
interact with vendors and the apprehension to sample due to the perceived obligation to
purchase.
The final column of Table 5 indicates that the combined scale has a relatively low score
in comparison with Scale A, we considered two reasons accounted. First, typically it is easier
for people to rank why you accept something than to rank why you don’t like something.
Second, consumers’ reasons about why to reject a free sample vary in different dimensions,
and are not as convergent as Scale A.
Reactions to sampling
Sampling activity may be positively correlated with consumers’ short- and long-term
purchasing behavior (Heilman et al., 2011). We show the average of a 5-point Likert Scale to
investigate consumers’ reactions or responses to sampling as shown in Table 7.
Table 7 Scale C: Samplers’ response to the question, “Please rank the following statements
which describe your reactions after having tried free samples at farmers’ markets”
Name Reactions to Sampling Meana SD
PPS I will buy the product because I planned to prior to the sample 3.55 0.88
ETS I will buy the product because I enjoyed the sample 3.98 0.68
BODP I will buy other products from this vendor I didn't plan to prior to sampling 3.55 0.76
SSTV
I will switch my shopping to this vendor from other vendors who don't offer
samples 3.08 0.89
IPFM I will increase my purchases from this FM 3.52 0.76
RPTF I will recommend the sample products to family or friends 3.86 0.71
RVTF I will recommend the vendor to family or friends 3.86 0.7
RFTF I will recommend the FM to family or friends. 3.98 0.68
PLR The price is less relevant. 3.17 0.91
Note: N=939; M=9; a5-point Likert Scale with 1 for “Strongly Disagree” and 5 for “Strongly Agree”; Cronbach’s Alpha is
0.825; Kaiser-Meyer-Olkin (KMO) Measure=0.862, Bartlett's Test of Sphericity (p Value)=0.000
16
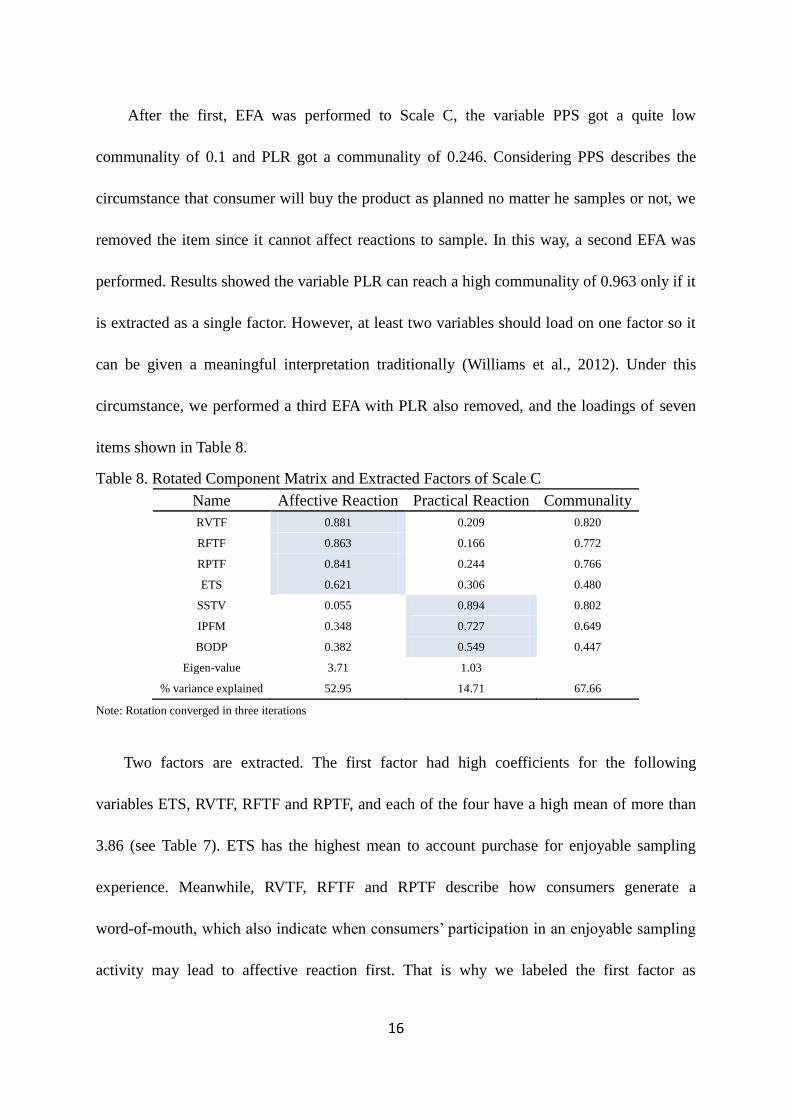
After the first, EFA was performed to Scale C, the variable PPS got a quite low
communality of 0.1 and PLR got a communality of 0.246. Considering PPS describes the
circumstance that consumer will buy the product as planned no matter he samples or not, we
removed the item since it cannot affect reactions to sample. In this way, a second EFA was
performed. Results showed the variable PLR can reach a high communality of 0.963 only if it
is extracted as a single factor. However, at least two variables should load on one factor so it
can be given a meaningful interpretation traditionally (Williams et al., 2012). Under this
circumstance, we performed a third EFA with PLR also removed, and the loadings of seven
items shown in Table 8.
Table 8. Rotated Component Matrix and Extracted Factors of Scale C
Name Affective Reaction Practical Reaction Communality
RVTF 0.881 0.209 0.820
RFTF 0.863 0.166 0.772
RPTF 0.841 0.244 0.766
ETS 0.621 0.306 0.480
SSTV 0.055 0.894 0.802
IPFM 0.348 0.727 0.649
BODP 0.382 0.549 0.447
Eigen-value 3.71 1.03
% variance explained 52.95 14.71 67.66
Note: Rotation converged in three iterations
Two factors are extracted. The first factor had high coefficients for the following
variables ETS, RVTF, RFTF and RPTF, and each of the four have a high mean of more than
3.86 (see Table 7). ETS has the highest mean to account purchase for enjoyable sampling
experience. Meanwhile, RVTF, RFTF and RPTF describe how consumers generate a
word-of-mouth, which also indicate when consumers’ participation in an enjoyable sampling
activity may lead to affective reaction first. That is why we labeled the first factor as
17
“Affective Reaction”.
The second factor was labeled “Practical Reaction” for SSTV, IPFM and BODP captures
direct purchase behavior in response to sampling, especially it give us the empirical proof
that a satisfied sampling will attract unexpected additional purchase both in the vendor and
the FM.
As for the item of PLR removed from EFA, we can draw two notifications. Firstly, it has
a relatively low mean 3.17 (see Table 7) of whole Scale C, which reflects that sampling as a
promotion tool does really have the ability to make price less relevant, but the ability is not
that powerful. Secondly, it indicates that maybe there exists a defect in our scale that more
items relate to consumers’ perception about price after sampling need to be added, which will
add robust to scale’s structure and we can conduct a more meaningful estimate of price
influence and sampling influence.
Conclusion and Directions for Future Research
The study investigated consumer behavior to sampling activity at farmers’ markets. The
research provides some interesting findings. First, the study demonstrated consumers’ trust in
farmers’ markets food system has the most significant impact on the consumer sampling
decision. Consumers with higher levels of trust are more willing to take free samples because
they don’t worry about food quality and food safety. Consumers generally have a higher level
of trust in fair price at farmers’ markets, food quality at farmers’ markets and word-of-mouth
publicity associated with farmers’ markets than with grocery stores, but lower levels at
farmers’ markets for trust in food safety, labeling system, and traceability. Consumers’ trust
emerges with frequent shopping activity, by younger male consumers, and by those who live
18
closer to farmers’ markets. Internet-based social organization have a positive effect on trust
and non-internet social organization have a positive effect on sampling.
We identified specific reasons to accept samples and to reject samples. Sampling
motivations related to what we termed affiliation motivation, which emphasizes the
significance of consumers’ affiliation for samples. It gives vendors a hint that to attract
samplers, two aspects need to be considered. Well-trained friendly vendors are preferred by
consumers. Samples following a certification process is preferred by consumers, which
indicates that a centralized farmers’ market sampling booth is preferred.
As for reason why consumers don’t sample, passive rejection is the most important.
Consumers have an instinct to explore desirable foods so these persons want a unique
sampling experience. But, if consumers are faced with the pressure to purchase from an
unfriendly vendor, or shopping in a crowded environment, they will reject sampling passively.
In summary, friendliness may not be a determinant in consumers’ decision to sample or not to
sample, but a friendly vendor plays an important role as to whether the consumer sampling
experience is enjoyable.
As a promotional tool, sampling positively impacts consumer behavior both in short-term
and long-term (Heilman et al., 2011). The current study found consumers react to sampling in
two ways, affective reaction and practical reaction. An enjoyable sampling experience firstly
arouses consumer’s affection towards the product. This, in turn, leads to a direct purchase
following word-of-mouth coming from consumers of farmers’ markets. These practices lead
to subsequent purchase behavior and an increase in unplanned product purchases. It is
reasonable to make this assessment because it can explain how short-term and long-term
19
impact generates.
As for food products, it is generally agreed that sampling experiences are more enjoyable,
which is derived from the high satisfaction of psychological elements including a harmonious
sampling environment with friendly vendors. The assessment of survey respondents
concluded that free samples of food products are not adequately available at farmers’
markets.
A future research direction is to investigate how effective sampling will be under a
complex promotion situation with reference to prices, and to what extent the post sampling
experience will impact price relevance to the decision. Another valuable extension is to see
how much sampling contributes to sales improvement, how vendors manage sampling’s cost
and increased income, and how consumers’ actual purchase behavior change after sampling
in future. We believe these may provide valuable insights for future research.
20
References
United States Department of Agriculture. New Data Reflects the Continued Demand for
Farmers Markets. Release No.0167.14. Retrieved January 16, 2016, from
http://www.usda.gov/wps/portal/usda/usdahome?contentid=2014/08/0167.xml
United States Department of Agriculture. 2006. USDA Releases New Farmers Market
Statistics. AMS No.281-06, Washington, DC: AMS.
Amemiya, T. (1978). The estimation of a simultaneous equation generalized probit model.
Econometrica: Journal of the Econometric Society, 1193-1205.
Amor, I. B., & Guilbert, F. (2007). The effect of product sampling on brand image.
DEVELOPMENTS IN MARKETING SCIENCE, 30, 139.
Babin, B. J., Darden, W. R., & Griffin, M. (1994). Work and/or fun: measuring hedonic and
utilitarian shopping value. Journal of consumer research, 644-656.
Baker, D., Hamshaw, K., & Kolodinsky, J. (2009). Who shops at the market? Using consumer
surveys to grow farmers' markets: Findings from a regional market in northwestern
Vermont. Journal of Extension, 47(6), 1-9.
Balsam, A., Webber, D., & Oehlke, B. (1994). The farmers' market coupon program for
low-income elders. Journal of Nutrition for the Elderly, 13(4), 35-42.
Bettinger, C. O., Dawson, L. E., & Wales, H. G. (1979). IMPACT OF FREE-SAMPLE
ADVERTISING. Journal of Advertising Research, 19(3), 35-39.
Brown, C., & Miller, S. (2008). The impacts of local markets: a review of research on farmers
markets and community supported agriculture (CSA). American Journal of
Agricultural Economics, 90(5), 1298-1302.
Cai, L. (2010). The relationship between health and labour force participation: Evidence from
a panel data simultaneous equation model. Labour Economics, 17(1), 77-90.
Conrey, E. J., Frongillo, E. A., Dollahite, J. S., & Griffin, M. R. (2003). Integrated program
enhancements increased utilization of Farmers’ Market Nutrition Program. The
Journal of nutrition, 133(6), 1841-1844.
Cowee, M. W., Curtis, K. R., & Gatzke, H. (2009). Marketing Farmers' Markets: Ideas for
Market Vendors & Managers in Nevada: University of Nevada Cooperative
Extension.
Dey, D., Lahiri, A., & Liu, D. (2013). Consumer learning and time-locked trials of software
products. Journal of Management Information Systems, 30(2), 239-268.
Dolgopolova, I., Teuber, R., & Bruschi, V. (2015). Consumers' perceptions of functional
foods: trust and food‐neophobia in a cross‐cultural context. International Journal of
Consumer Studies.
Dong, D. (2010). Promoting fruit and vegetable consumption: are coupons more effective
than pure price discounts? : DIANE Publishing.
Freedman, A. M. (1986). Use of free product samples wins new favor as sales tool. Wall
Street J, 19.
Heckman, J. J. (1977). Dummy endogenous variables in a simultaneous equation system:
National Bureau of Economic Research Cambridge, Mass., USA.
Heilman, C., Lakishyk, K., & Radas, S. (2011). An empirical investigation of in-store
sampling promotions. British food journal, 113(10), 1252-1266.

21
Heilman, C., Lakishyk, K., Radas, S., & Nakamoto, K. (2004). The Effect of In-Store Free
Samples on Short-and Long-Term Purchasing Behavior. White Paper, Mclntire School
of Commerce, University of Virginia, Charlottesville, VA.
Holmes, J. H., & Lett, J. D. (1977). Product sampling and word of mouth. Journal of
Advertising Research.
Hunt, A. R. (2007). Consumer interactions and influences on farmers' market vendors.
Renewable Agriculture and Food Systems, 22(01), 54-66.
Katchova, A. L., & Woods, T. A. (2011). Local Food Procurement and Promotion Strategies
of Food Cooperatives. Selected Paper.
Kezis, A., Gwebu, T., Peavey, S., & Cheng, H.-T. (1998). A study of consumers at a small
farmers' market in Maine: Results from a 1995 survey. Journal of Food Distribution
Research, 29, 91-99.
Klopcic, M., Hocquette, J.-F., Kuipers, A., & ebrary, I. (2013). Consumer attitudes to food
quality products [electronic resource]: emphasis on Southern Europe (Vol. 133.;no.
133.;). Wageningen: Wageningen Academic Publishers.
Kohls, R. L., & Uhl, J. N. (1972). Marketing of agricultural products (Vol. 55): Macmillan.
Laran, J., & Tsiros, M. (2013). An investigation of the effectiveness of uncertainty in
marketing promotions involving free gifts. Journal of Marketing, 77(2), 112-123.
Marks, L. J., & Kamins, M. A. (1988). The use of product sampling and advertising: Effects
of sequence of exposure and degree of advertising claim exaggeration on consumers'
belief strength, belief confidence, and attitudes. Journal of Marketing Research,
266-281.
McGuinness, D., Gendall, P., & Mathew, S. (1992). The effect of product sampling on
product trial, purchase and conversion. International Journal of Advertising, 11(1),
83-92.
Meyer, E. (1982). Sampling builds better business. Advertising Age, 12.
Murtagh, F., & Heck, A. (2012). Multivariate data analysis (Vol. 131): Springer Science &
Business Media.
Ngobo, P. V. (2011). What Drives Household Choice of Organic Products in Grocery Stores?
Journal of Retailing, 87(1), 90-100. doi: 10.1016/j.jretai.2010.08.001
Paul, J., & Rana, J. (2012). Consumer behavior and purchase intention for organic food.
Journal of Consumer Marketing, 29(6), 412-422.
Payne, T. (2002). US Farmers Markets, 2000: A Study of Emerging Trends: US Department
of Agriculture, Marketing and Regulatory Programs, Agricultural Marketing Service,
Transportation and Marketing Programs, Marketing Services Branch.
Quester, P. G., & Smart, J. (1996). Product involvement in consumer wine purchases: Its
demographic determinants and influence on choice attributes. International Journal of
Wine Marketing, 8(3), 37-56.
Slama, M. E., & Tashchian, A. (1985). Selected socioeconomic and demographic
characteristics associated with purchasing involvement. The Journal of Marketing,
72-82.
Suarez-Balcazar, Y., Martinez, L. I., Cox, G., & Jayraj, A. (2006). African Americans’ views
on access to healthy foods: what a farmers’ market provides. Journal of Extension,
44(2), 1-11.
22
Varner, T., & Otto, D. (2008). Factors affecting sales at farmers' markets: an Iowa study.
Applied Economic Perspectives and Policy, 30(1), 176-189.
Williams, B., Brown, T., & Onsman, A. (2012). Exploratory factor analysis: A five-step guide
for novices. Australasian Journal of Paramedicine, 8(3), 1.
Wolf, M. M. (1997). A target consumer profile and positioning for promotion of the direct
marketing of fresh produce: A case study. Journal of Food Distribution Research,
28(3), 11-17.
Wolf, M. M., Spittler, A., & Ahern, J. (2005). A profile of farmers’ market consumers and the
perceived advantages of produce sold at farmers’ markets. Journal of Food
Distribution Research, 36(1), 192-201.
Wyss, G. D., & Jorgensen, K. H. (1998). A user’s guide to LHS: Sandia’s Latin hypercube
sampling software. SAND98-0210, Sandia National Laboratories, Albuquerque, NM.