consumer-owned retail cooperative in duopoly with...
TRANSCRIPT

Consumer-owned retail cooperativein duopoly with horizontallydifferentiated goods: a Finnishexperience
Economics
Master's thesis
Tuomas Kronqvist
2010
Department of Economics
HELSINGIN KAUPPAKORKEAKOULUHELSINKI SCHOOL OF ECONOMICS

HELSINKI SCHOOL OF ECONOMICS
Department of Economics
CONSUMER-OWNED RETAIL COOPERATIVE IN DUOPOLY WITH
HORIZONTALLY DIFFERENTIATED GOODS: A FINNISH EXPERIENCE
Master’s Thesis in Economics
Tuomas Kronqvist
(Spring Term) 2010
Approved by the Head of the Economics Department ___/___ 201___ and awarded the
grade ____________________________________________

HELSINKI SCHOOL OF ECONOMICS ABSTRACTMaster’s Thesis in Economics 9.4.2010Tuomas Kronqvist
CONSUMER-OWNED RETAIL COOPERATIVE IN DUOPOLY WITHHORIZONTALLY DIFFERENTIATED GOODS: A FINNISH EXPERIENCE
In this thesis I analyze the prevailing market structure and a peculiarity of the Finnish groceryretail trade. The market structure resembles duopoly. The two biggest retailers, S-group andK-group, have market shares of 43 and 34 per cent, respectively. Grocery retail trade isexceptionally concentrated in Finland although other Nordic countries also have aconcentrated market. The peculiarity of the Finnish market is that the market leader, S-group,is not a profit-maximizing firm but a consumer-owned cooperative. Instead of shareholdersthe group has 1.8 million member-owners. I formulate and analyze the Nash equilibrium of aduopoly with a cooperative and a profit-maximizing firm (mixed duopoly). I also compare theresulting equilibrium to the Nash equilibrium of a duopoly with two profit-maximizing firms(normal duopoly).
I perform the analysis by constructing a duopoly model with horizontally differentiated goodsusing a framework developed by Singh and Vives (1984). I also build on the work ofAnderson et al (1979) and Ireland and Law (1983). In the basic model employed in this thesis,firms are assumed to compete in price (Bertrand competition) and all consumers are assumedto be homogenous members of the cooperative. However, after analyzing this basic model Iseparately consider how equilibrium changes if the cooperative were a Stackelberg leader andif an exogenous part of consumers were not part of the cooperative.
The cooperative chooses to price at marginal cost in the Nash equilibrium of mixed duopoly.This is significant because in normal duopoly firms use market power to sustain abovemarginal cost pricing. The cooperative’s competitor, a profit-maximizing firm, can stillsustain above marginal cost pricing in mixed duopoly but less so than would be possible innormal duopoly. In Stackelberg competition the cooperative chooses to price below marginalcost. If some consumers are not members of the cooperative the firms charge different pricesdue to different reaction curves with the cooperative having the higher price.
The willingness of consumers to substitute one good for the other and their value for variety ismeasured in the model by parameter gamma. A high level of gamma means that consumersare ready to substitute one good with the other and that they do not value consuming variety.In normal duopoly consumer utility is the higher the higher gamma is. In mixed duopolyutility is highest if gamma is low. The difference is explained by the effect of gamma onpricing power, which is not important in mixed duopoly where the cooperative alreadyrestricts the use of pricing power.
If consumers are faced with a choice between normal and mixed duopoly, they are better offchoosing mixed duopoly since the cooperative reduces the adverse effects of duopoly. Thisresult has implications on how one should approach the current market structure in Finlandsince the model’s theoretical cooperative has much in common with actual S-group behavior.
Keywords: cooperative, grocery retail, duopoly, Bertrand, differentiated goods

TABLE OF CONTENTS
1. Introduction ............................................................................................................... - 1 -
2. Finnish grocery trade ................................................................................................. - 5 -
2.1. Major players ..................................................................................................... - 5 -
2.2. Developments in market structure ...................................................................... - 7 -
3. Cooperative theory................................................................................................... - 10 -
3.1. What is a cooperative? ..................................................................................... - 10 -
3.2. When would a consumer-owned cooperative be more efficient?....................... - 12 -
4. Imperfect market theory........................................................................................... - 16 -
4.1. Number of market participants ......................................................................... - 16 -
4.2. Homogenous goods.......................................................................................... - 17 -
4.3. Profit-maximizing firms ................................................................................... - 18 -
5. Formal framework and modeling ............................................................................. - 20 -
5.1. Limitations and background ............................................................................. - 20 -
5.2. Building blocks ................................................................................................ - 22 -
5.3. Nash equilibrium.............................................................................................. - 25 -
5.4. Nash equilibrium at different levels of gamma ................................................. - 27 -
5.5. The corresponding normal duopoly .................................................................. - 30 -
6. Different equilibria of the normal and mixed duopoly .............................................. - 33 -
6.1. Price and quantity ............................................................................................ - 33 -
6.2. Utility and profit .............................................................................................. - 36 -
6.3. Total surplus .................................................................................................... - 39 -
7. Extensions to the basic model .................................................................................. - 41 -
7.1. Stackelberg competition ................................................................................... - 41 -
7.2. Outside sales .................................................................................................... - 43 -
8. Relating S-group behavior to the model ................................................................... - 48 -
9. Conclusions ............................................................................................................. - 51 -
10. Literature ............................................................................................................. - 58 -
11. Equations ............................................................................................................. - 62 -
TABLE OF FIGURES
Exhibit 1 K- and S-group market shares from 2000 to 2009........................................... - 8 -

- 1 -
1. Introduction
”The purpose of a company is to generate profits for the shareholders”
- Limited Liability Companies Act - Finland, section 5 (2009)
”The purpose of a co-operative shall be to promote the economic and business interests of its
members”
- Co-operatives Act - Finland, section 2 (2009)
In this thesis I study a duopoly in the grocery trade with horizontally differentiated goods.
Instead of two profit-maximizing firms, duopoly players consist of a consumer-owned
cooperative and a profit-maximizing firm. As revealed by the above quotes these two firm
types have very different objectives. I focus on how the Nash equilibrium of this mixed
duopoly compares to a Nash equilibrium of a normal duopoly, i.e. that of two profit-
maximizing firms. A consumer-owned cooperative is a firm that is not owned by shareholders
but rather by its customers. Each customer-owner has an equal say of how the firm should be
organized. Instead of maximizing profit the cooperative’s goal is to maximize individual
member surplus. Two major players dominate Finnish grocery trade. S-group and K-group
have a combined market share of almost 80 per cent. S-group is a cooperative and K-group is
a profit-maximizing firm listed in the Helsinki stock exchange. This market reality makes the
question of a how a cooperative changes equilibrium extremely interesting.
I study the mixed duopoly setting by constructing an explicit model and comparing its
equilibrium to that of a normal duopoly’s equilibrium. In order to make explicit comparisons I
assume a specific consumer utility function. Other simplifications are also made in order to
limit the analysis to that of what is appropriate for this thesis. The most important of these is
that all consumers are assumed to be homogenous members of the cooperative. In the basic
model firms compete by setting price simultaneously, i.e. Bertrand competition. In addition to
analyzing this basic Bertrand model I briefly study two extensions. First, I assume that firms
compete in price but that the cooperative decides first, i.e. Stackelberg competition. Second, I
relieve the restriction of consumer homogeneity and study how equilibrium changes when an
exogenous portion of consumers are not members of the cooperative.

- 2 -
The questions I examine in this thesis are all related to the consumer-owned cooperative.
This form of firm has been largely disregarded in mainstream economic literature. Questions
include: How is a consumer-owned cooperative different from a profit-maximizing firm? Do
these differences cause differences in behavior between the two types of firms? What does a
duopoly model with these different types of firms suggest as behavior? How does the model
relate to the reality of the Finnish market? What are the policy implications?
Duopolies with two profit-maximizing firms have been studied extensively. However, the
effect of having a cooperative as a market participant instead of a profit-maximizing firm has
not been in the focus of research. Globally, consumer-owned cooperatives in the grocery trade
have been rare and perhaps that is why they have attracted limited research interest. However,
some research has been done. Ireland and Law (1983) and Anderson et al. (1979) have made
important contributions. The former studied a Cournot-Nash model of a consumer-owned
cooperative. The latter analyzed the economics of consumer-owned cooperatives in general.
Both of the aforementioned papers build on the pioneering work of Enke (1945). This thesis
aims to make a contribution to this field.
Throughout the thesis gamma is used to depict consumers’ preference for variety. A high
level of gamma means that consumers are ready to substitute one good for the other. In
contrast, lower levels of gamma imply that consumers prefer variety and are hesitant to
substitute. Strictly speaking consumers are born with some appetite for variety that cannot be
directly affected by retailers. However, retailers can affect consumer choice by changing the
location and variety of their stores. Modeling a retailer’s optimal choice problem is not at the
centre of this thesis and such considerations will be absent. Having said that, this thesis is
interested in how different levels of gamma affect equilibrium prices, quantities and profits.
Thus, I adopt a less strict interpretation of gamma in which the parameter is thought to
contain both the inherent appetite for variety but also the sensitivity of consumers’
willingness (and possibility) to substitute one good for the other. Retailers can indirectly
influence the latter by their choice of horizontal differentiation. This interpretation allows me
to consider how equilibrium depends on both consumers’ taste for variety and, indirectly,
retailers’ good differentiation choice.

- 3 -
This thesis is composed of nine parts and two appendices. Following this introduction I
describe the state of Finnish grocery trade. I take a look at the major players and describe
some recent changes in market structure. I find that the market has become more concentrated
during the past fifteen years and that S-group has become the market leader ahead of K-group.
I then take a look at cooperative theory. I describe in detail what a cooperative is and consider
what makes it different from a profit-maximizing firm. I build on Hansmann (1996 and 1999)
and discuss the circumstances in which a cooperative might be a better form of institution
than a profit-maximizing firm. In the analysis I take the consumer’s point of view. I find that
if consumers are homogenous enough and the market displays imperfections, e.g. in the case
of monopoly, a cooperative can be a good form of institution to organize a firm.
In the fourth part of this thesis I review some aspects of imperfect market theory. Specifically
I look at how standard perfect market assumptions on the number of market participants,
homogenous goods and profit-maximizing firms differ from Finnish market reality. I use this
analysis to shape the model in the fifth part of the thesis.
The fifth part of this thesis is its backbone and contains the modeling of the market setting. I
first discuss some limitations and assumptions before building the model. I create the model
using the frameworks utilized by Anderson et al. (1979) and Ireland and Law (1983).
Additionally, the linear demand system employed by Singh and Vives (1984) is put into use. I
formulate the explicit Nash equilibrium of the duopoly setting and also investigate the
equilibrium at different levels of consumer’s preference for variety (represented as gamma in
the models). In order to have a benchmark I present the equilibrium of a duopoly with two
symmetric profit-maximizing firms (normal duopoly). The model employed in this thesis is
an adaptation of that used by Singh and Vives (1984) to compare price and quantity
competition. Formulations of equations are omitted from the main text but can be found in the
equations appendix.
In part six I turn to compare the equilibria of mixed and normal duopoly. I find that price is
always lower in mixed duopoly due to the cooperative’s reluctance to use its pricing power to
the disadvantage of its consumer-owners. The price difference is found to be at its greatest at
a moderate level of gamma and thus is not monotonous with respect to consumers’ preference
for variety. However, consumed total quantity is always higher in mixed than normal
- 4 -
duopoly. As one might expect, consumer utility is higher in mixed duopoly whereas firm
profit is higher in normal duopoly. However, an interesting finding is that consumer surplus is
decreasing with respect to gamma. In other words, if one of the duopolists is a cooperative,
consumers are increasingly better off the higher their preference for variety is. This is contrary
to a normal duopoly where consumers are better off if they are willing to substitute one good
for the other, thus decreasing supplier pricing power.
In the seventh part I expand the analysis by first changing the way the duopolists compete and
then by allowing cooperative sales to non-members. Changing the competition setting to
Stackelberg competition entices the cooperative to price below marginal cost. Exogenously
setting some part of the population as cooperative non-members, I study how allowing
cooperative sales to non-members affects equilibrium. Making this change gives the profit-
maximizing firm a greater possibility to exercise market power.
In the eighth part of this thesis I take a step back and examine how actual S-group behavior
fits the model’s predictions. I find that S-group’s stated goal is compatible with the
optimization problem in the model but that because the model is static, important saving and
investment decisions are left out of scope distorting the comparison to S-group performance. I
discuss at length the way S-group disburses any profit to its members. A difference between
modeled and actual behavior is that S-group employs a non-linear schedule instead of a pure
pro rata one. In other words, a customer’s return from the cooperative is not linear according
to her purchases but is increasing. All in all I find the model to be compatible with S-group’s
behavior. I close this thesis with conclusions in the ninth part. Conclusions are followed by a
list of references and an appendix containing equation formulations.

- 5 -
2. Finnish grocery trade
The Finnish Grocery Trade Association (Päivittäistavarakauppa ry, 2009) defines groceries as
“in addition to food, consumer goods consumed on a daily basis which are bought while
purchasing food. Groceries include food, drink, cosmetics, toiletry, detergents, home paper,
cigarettes, magazines and newspapers.” The grocery trade is defined as the retailing of these
products in a mostly self-service store. It is important to note that large scale grocery stores,
i.e. hypermarkets, commonly sell clothes, electronics and sporting goods. These items are not
covered in the definition of groceries and are excluded from my thesis.
Throughout this thesis I use market share instead of earnings as a measure of success when
appraising firm performance. The first reason is that market share information is readily
available and comparable across time and companies. Second, because S-group is a
cooperative and K-group a profit-maximizing firm, comparing earnings would be misplaced
since S-group is not trying to maximize its profit as K-group is. Third, because S-group and
K-group operate across several countries and in various industries I feel reluctant to start
breaking down their reporting in order to get a comparable figure for grocery trade in Finland.
Thus I will use market share as the defining measure of success in the Finnish grocery trade.
In this part of my thesis I give background information on the Finnish food retail industry.
First, I present the major players. Following that I take a look at changes in market dynamics
during the past decade or so.
2.1. Major players
In this section I introduce the major players in the Finnish grocery industry starting with the
market leader, S-group. This cooperative group is composed of 22 regional cooperatives and
one central cooperative (Suomen osuuskauppojen keskuskunta, SOK) which provides central
corporate functions to the regional cooperatives and coordinates their operations. S-group
operates in six fields: grocery stores (57 % of sales1), gas stations (14%), department stores
1 Contains all sales from grocery stores even when sales are not groceries, e.g. clothing sold from hypermarkets

- 6 -
(4%), car showrooms (6%), hotels and restaurants (7%) and agricultural stores (12%). Hired
managers run S-group grocery stores. Sales are made to cooperative member and non-
members alike. The group has recently entered retail banking offering daily banking services
and has some operations in Russia and the Baltics. Although S-group’s grocery stores are
organized in several different chains I will disregard this detail and refer to the group as a
whole. (S-group, 2009b)
S-group is wholly owned by its 1.8 million (S-group, 2009a) cooperative members who are
also consumers of the cooperative. Governance of the local cooperatives is arranged so that
cooperative members participate in elections every four years to elect members to a body of
representatives (edustajisto in Finnish). Each member of the cooperative has one vote in the
election. The body of representatives elects the administrative council (hallintoneuvosto in
Finnish) which appoints the CEO of the local cooperative. In addition, the council appoints
three to four members to the administrative board which is chaired by the CEO. Governance
of the central cooperative, SOK, is administered much in the same way except that the local
cooperatives nominate the body of representatives according to their ownership stake in the
central cooperative. (S-group, 2007)
Kesko Oyj (hereafter K-group) is a listed company with four divisions: food trade (38% of net
sales), building and home improvement trade (30%), home and specialty goods trade (16%)
and car and machinery trade (15%). Food trade is present only in Finland but the other
divisions have operations in Russia, Sweden, Norway and the Baltic countries. K-group
grocery stores are run by retailer entrepreneurs with a personal investment in the store but
who are supported and trained by K-group. As with S-group, K-group consists of several
different chains but I will treat the whole group as one entity. (Talma, 2009)
In 2009 K-group and S-group held 77 per cent of the grocery market share (see exhibit 1,
page 8). The remaining 23 per cent is split among Suomen Lähikauppa Oy with a 10 per cent
share, Lidl Ky with five per cent and other smaller players (HOK-Elanto, 2010b). Suomen
Lähikauppa Oy, previously know as Tradeka, was formed from the bankruptcy of the EKA-
cooperative in 1993 (Seppänen, 1993). Nowadays 66 per cent of Lähikauppa Oy is owned by
a Swedish private equity house, IK Investment Partners (Suomen Lähikauppa, 2008). Lidl Ky,
which is part of the German hard discounter group, entered the Finnish market in 2002

- 7 -
introducing its Finnish competitors and customers alike to a new way of doing business
(Peltola, 2009).
2.2. Developments in market structure
In this section I present the changes that the Finnish consumer goods retail industry has gone
through since 2000. I take a quick look at the structure of the industry in 2000, how and why
it has changed since then and where it is as the decade ended. Three major points stand out: 1)
of the two leading players, S-group has succeeded better and has overtaken the market share
of the former leader, K-group, 2) the two groups, K and S, compromise a larger share of the
total market than before and 3) alongside these two giants there is a group of smaller firms
including Lidl, whose effect on Finnish retailing has been less than anticipated (Peltola,
2009).
In 2000 K-group was the clear market leader (see exhibit 1, page 8) in a shaken up industry.
Before the mid-90s the Finnish grocery retail trade was dominated by four large players. Two
of them, K-group and Tuko, were profit-maximizing firms whereas the other two, S-group
and EKA, were consumer-owned cooperatives. The Finnish depression in the early 1990s
changed this landscape and the 21st century began with a setting resembling duopoly with K-
group at the lead and S-group 10 percentage points behind in market share.
The next eight years saw S-group stampede past K-group. Peltola (2009) offers several
reasons for S-groups prominence and K-group’s slide. S-group created a central procurement
and logistics company (Inex Partners Oy), focused on four retailer chains and emphasized
distribution of retained earnings to cooperative members instead of offering erratic (and often
expensive) in-store discounts. At the same time K-group was involved in disputes between its
central organization and retailers and was late in restructuring its business to match the
quickly urbanized Finnish demography. However, since S-groups market share grew by over
14 per cent and K-group lost only 3.4 in the years from 2000 to 2009, S-group has necessarily
gained share also from other retailers. Thus, market concentration has increased since smaller
players have also lost market share.

- 8 -
Einarsson (2008) calculated a Herfindal-Hirschman index (HHI) from 2004 data for food
retail trade in each of the Nordic countries. Finland’s index was 2500. At the time this was the
lowest figure for the five Nordic countries in question. Sweden had an HHI of 3100, Denmark
2900, Iceland 2800 and Norway 2600. With new market shares from 2009 Finland’s HHI for
the four biggest firms is 3200. This increase from 2500 in 2004 to 3200 in 2009 is
considerable. To put the Nordic situation in perspective France’s and Germany’s indices in
2004 were approximately 1600, the UK’s 1800 and Spain’s between 300 and 500 (Einarsson,
2008). In the US, competition authorities classify an industry with an HHI of 1800 or higher
as highly concentrated (United States Department of Justice and the Federal Trade
Commission, 1997).
A report by the National Consumer Research Centre (2010, 77) also found the Finnish
grocery trade to be highly concentrated. The report cites firm efficiency as one of the reasons
for lack of foreign firm entry. Additionally, the report claims that the country’s remote
location and small market do not entice entry. An exception is of course Lidl. The reports
writers highlight that a concentrated industry is seldom in the interest of consumers but do not
discuss potential implications further.
Market share in grocery retail 1995 - 2009, S- and K-group.
01020
3040506070
8090
100
Year
%
S-group 21,9 23,3 25,1 26,3 27,8 28,9 30,5 31,1 31,1 34,3 35,9 39,9 41,1 42,4 43,2
K-group 39,9 39,6 38,1 38,3 37,8 37,6 36,4 36 35,8 35,3 33,9 33,4 33,9 33,7 34,2
SUM 61,8 62,9 63,2 64,6 65,6 66,5 66,9 67,1 66,9 69,6 69,8 73,3 75 76,1 77,4
1995 1996 1997 1998 1999 2000 2001 2002 2003 2004 2005 2006 2007 2008 2009
Exhibit 1 K- and S-group market shares from 2000 to 2009 (Sources: K-group and S-group annual reports;S-group, 2009b; HOK-Elanto, 2010b)

- 9 -
In 2009 the two giants, S- and K-group, had a combined market share of approximately 77 per
cent. This is approximately ten percentage points more than in 2000. Thus the Finnish market
has become concentrated up to a level which can be described as exceptionally high compared
to non-Nordic European countries. A point to note is that concentration has increased
throughout the past decade and has not been reversed by the entry of the first real hard
discounter, Lidl, in 2002.
What makes the current situation so interesting is that the two major players are so different.
K-group is an investor-owned profit-maximizing firm which is listed on the Helsinki stock
exchange. The business model of K-group combines a large degree of local retailer
independence and entrepreneurship leveraged on a common brand and shared operations. The
business model of K-group has much in common with franchising. In contrast, S-group is a
consumer-owned cooperative. Local retailers in the group are run by hired managers who
have a limited amount of independence in how to run their store. Independence at the regional
cooperative level is much higher. However, the relatively high level of coordination is
characteristic to S-group and has undoubtedly contributed to its success in the Finnish grocery
trade.
These distinctions make an enquiry into the prevailing duopoly setting very interesting. Next I
will examine the relevant theory on cooperatives in order to later evaluate if they depict
Finnish reality.

- 10 -
3. Cooperative theory
This thesis is an inquiry into cooperative firms in an imperfectly competitive grocery retail
industry. In this section I present the relevant literature which I will build my later arguments
on. First I define a cooperative and give a brief overview of its history. Then I study the
circumstances in which a cooperative might be an efficient way to organize a firm.
3.1. What is a cooperative?
The roots of the cooperative firm can be traced back to the English Equitable Rochdale
Pioneers of 1844. These founders of the first cooperative operated according to seven
Rochdale principles, which had a major influence on later cooperatives. The influence of their
ideals can still be seen today. These seven principles were: (Thompson, 1994)
1. open membership,
2. democratic control (one man, one vote),
3. distribution of surplus in proportion to trade,
4. payment of limited interest on capital,
5. political and religious neutrality,
6. cash trading, and
7. promotion of education.
From Rochdale the cooperative movement spread throughout the world to several different
industries. Four industries stand out as areas where the cooperative movement has gained
most ground. These are agriculture, banking and finance, insurance and retailing. Examples of
these include, respectively: farmers forming a cooperative to market their goods, credit
unions, mutual insurance and consumer-owned retailers. Geographically consumer-owned
retail cooperatives have been uncommon in the United States but have been popular in some
European countries, including Finland. In this thesis I focus on consumer cooperatives in the
retail industry. Despite ample research in the fields of farmer producer cooperatives,
cooperatives in developing economies and worker cooperatives, there is much less research in
consumer cooperatives. (Jones & Kalmi, 2009)

- 11 -
I define a standard consumer-owned cooperative in the retail industry as a firm following
seven central principles. Compared to the above Roschdale principles, many characteristics
have stayed the same since 1844. If not mentioned separately, I will assume these cooperative
characteristics throughout this thesis. A standard consumer-owned cooperative will display
the following characteristics:
1. The firm is owned by its members,
2. voting rights are divided equally between members,
3. members are also customers of the firm,
4. disbursed retained earnings are distributed pro rata consumption,
5. the firms maximizes net individual consumer surplus,
6. cooperative can choose the amount of members, and
7. sales to non-members are prohibited.
The first five depict traditional cooperatives and are the key characteristics which differentiate
a cooperative from a profit-maximizing firm. The first three are self-explanatory but numbers
four and five deserve some thought. Disbursing retained earnings on a pro rata basis is a
common feature of cooperatives and is meant to reward those who contribute most to the
cooperative. In the case of a consumer-owned retail cooperative, this means that the more a
consumer buys from the firm the bigger her share of retained earnings is. Moreover, a given
member’s share of profit grows in a linear fashion with respect to money spent on the
cooperative. The fifth characterization is the most important difference between a profit-
maximizing firm and a cooperative. Whereas a profit-maximizing firm only maximizes
supplier surplus, the cooperative will maximize the net benefit of each cooperative member.
However, it should be noted that a cooperative is not the same thing as a government-owned
entity with a goal of maximizing total surplus. Rather, the consumer-owned cooperative seeks
to maximize the individual surplus of each cooperative member.
Characterizations six and seven are in order to simplify modeling. They conflict somewhat
with Finnish reality. Point six conflicts with the aforementioned Roschdale ideal of free entry.
However, allowing the cooperative to choose the amount of members is consistent with
Finnish law (Co-operatives Act, 2009). The market leader and only consumer cooperative in

- 12 -
the grocery retail trade, S-group, does not restrict entry. One could however interpret that the
amount of members in S-group is below or immaterially close to optimum and thus the
cooperative chooses not to restrict entry although it has a legal right to do so. There could also
be other, non-financial reasons for not limiting entry. In the basic model I will assume that all
consumers are part of the cooperative. This is warranted because consumers are assumed to be
homogenous. If it makes sense for one to join, all should join. However, I will later expand
the basic model to consider a situation where part an exogenously determined part of the
population is not part of the cooperative.
Point seven is in stark conflict with the reality of S-group but is in line with United States law
which does not allow sales to non-members. From a Finnish point of view, US legislation is
unfortunate since American research in the field often takes point seven for granted even
though this is not the case in Finland. Being well aware of this contradiction of reality, I
choose to first uphold this restriction in basic modeling. I will however later expand the basic
model and consider how sales to outside members changes equilibrium.
I have now presented a short history of the cooperative movement and depicted how a firm
organized as a consumer-owned cooperative is defined. I turn to an obvious question: why
cooperatives exist at all. Since privately owned profit-maximizing firms are generally optimal
for society an exception to this rule needs to be motivated.
3.2. When would a consumer-owned cooperative be more efficient?
To answer this question I need explore how a cooperative actually differs from a profit-
maximizing firm. Then, after mapping the differences, I look into the range of circumstances
when it might make sense for consumers to join forces and form a consumer-owned
cooperative instead of relying on market transactions.
So how different is a consumer-owned cooperative retailer from a typical profit-maximizing
firm? Conceptually, there are surprisingly few differences. Hansmann (12, 1996) argues that
typical profit-maximizing firms are in fact just another type of a cooperative, a lenders’
cooperative. The only transaction of a firm’s lenders is to supply capital and thus they are
only interested in collecting a profit on their investment: lenders’ cooperatives optimize return

- 13 -
on investment. In contrast, the primary transaction of a firm’s customers is buying from the
firm. Thus they are interested in the net cost of their shopping. From this observation and the
earlier mentioned seven characterizations of a consumer-owned cooperative follows that the
most important difference between the two firm types is that they optimize different
outcomes.
The key question of consumer cooperatives is whether they are more efficient way of
organizing a firm and if yes, in what circumstances. In Hansmann’s words (1999):
“Efficiency is best served if ownership is assigned so that total transactions costs for all
patrons, including both costs of market contracting and costs of ownership, are minimized”.
By patrons Hansmann means “all of the firm’s customers and suppliers” including suppliers
of labor and capital. So how is efficiency, measured as firm costs, affected by whether the
firm is a cooperative or a profit-maximizing firm? Input costs should be the same for both
institution types. It is fair to assume that consumer-owned retail cooperatives pay the same
price for their supplies as other types of firms. This leaves other aspects of the cost function.
Hansmann (1999) defines a categorization of costs which presents a methodology for
evaluating when total transaction costs for all patrons could be lower for a consumer-owned
retail cooperative than for an otherwise identical profit-maximizing firm.
The first category includes costs of market contracting. Essentially this means that it could be
beneficial for consumers to have direct control over their supplier through ownership rather
than relying on simple market transactions, i.e. negotiating a price and buying from the
supplier. Monopoly power of the supplier could be an obvious motive for consumer
ownership. Another could be the presence of asymmetric information. In Hansmann’s (1999)
example, a supplier may be better informed of the quality of products it sells and it can be
overly costly for the consumer to control the quality of its supply. In such a case it can be
beneficial for the customer to have ownership in the cooperative and have power over the
product itself.2
2 Interestingly enough, these examples of monopoly and asymmetric information point to well knownproblems of imperfect competition. Thus consumer-owned cooperatives and cooperatives in generalcould be seen as tools of mechanism design in which a market failure or imperfection can beaddressed and potentially resolved.

- 14 -
The second category consists of ownership costs. Hansmann (1999) divides these costs into
three groups: costs of monitoring, costs of collective decision-making and costs of risk-
bearing. The first of these is related to the principal-agent problem of aligning owner and
employer goals. The second compares the cost of taking part in collective decision-making
versus entering into a market transaction. The third is the cost of capital cooperative members
incur when they take on risk on their cooperative membership fee, which may or may not
yield profit in the form of cheaper goods or payout of retained earnings.
The cost of risk-bearing is analogous to costs of capital. This costs stems from paying a
membership fee to the cooperative which differs from an investor’s investment in a profit-
maximizing firm. First, memberships are generally non-tradable and redemption policies can
be designed to discourage exit. This locks in the members’ capital, which is a polar opposite
to investing in a listed profit-maximizing firm’s stock, which can be freely traded. Second,
membership benefits including price reductions on purchases and disbursed retained earnings
carry a risk. A cooperative member cannot be sure of the cooperative’s ability to offer price
reductions or disburse earnings. Whether this risk is higher than the dividend risk and price
volatility of a stock is an interesting question. In any case, the importance of risk-bearing
costs is surely increasing in membership fee size.
In S-group, initial membership fees vary according to which regional cooperative the member
wishes to join. The regional cooperative in the Helsinki area charges 35 euros as its
membership fee. However, most regional cooperatives charge 100 euros for joining (S-group,
2010). These are still somewhat modest sums, especially when taking into account that the
member does not typically need to pay the whole sum up front. Thus the costs of risk-bearing
for these small invested amounts are unlikely to be material.
The other two costs of ownership, costs of monitoring and collective decision-making, can be
significant in consumer cooperatives, especially small ones. Participating in collective
decision-making and monitoring the actions of the firm can have considerable costs
associated to them. If the goals of cooperatives consumers are homogenous enough, collective
decision-making and costs of monitoring can be thought of as a fixed cost. From this follows
that cost per member is declining with respect to the number of cooperative members.
However, if members have different goals this relation can be largely offset and even reversed
as the number of members increases. Heterogeneity increases costs of ownership for all.

- 15 -
Holmström (1997) also emphasizes the importance of homogeneity and possibility of exit in
collective decision making. The two are closely interlinked. If there is a mechanism of exit in
the firm, it serves to homogenize the owner base. If a shareholder disagrees with the
management of a listed profit-maximizing firm she can either use her voice to change the
firm’s strategy or she can exit by selling the stock. Even the credible threat of exit is
important for shareholders to get their voice heard. Managers often listen to shareholders not
because they fear active shareholder action but because they can exit the company by selling
stock and thus pushing the share price down. In fact, Hansmann (1999) argues that the reason
for the prevalence of investor-owned profit-maximizing firms in our modern economy has
everything to do with homogeneity. He argues that lenders of capital have the most
homogenous interests of maximizing their return on investment. Thus, organizing firms as
lenders’ cooperatives is commonly the most efficient arrangement.
In addition to these cost of ownership and market contracting, there are also non-financial
reasons why a cooperative might be a good way of organizing a firm. An example of these
non-financial arguments for cooperatives is valuing consumer participation in the firm’s
democratic decision-making in itself (Hansmann 1996). However, I choose to disregard these
considerations and focus entirely on efficiency aspects. I do this for two reasons. First, I want
to limit the scope of this thesis. Second, valuing the non-economic effects is essentially a
discussion about values. This thesis is interested primarily in efficiency and understanding the
economic dynamics of cooperatives in a duopoly setting. However, excluding such benefits
from this thesis does not mean that non-economic considerations are unimportant.
Summarizing, one can say that from a consumer’s point of view there are circumstances in
which forming a cooperative might be beneficial. The existence of a large enough
homogenous consumer base and market imperfections such as monopoly power can be
expected to promote forming a consumer-owned cooperative. Likewise, members must have a
low required rate of return for their membership fee in order to entice them to lock-up their
investment in the cooperative when alternative liquid investment opportunities are abundant.
If the membership fee is sufficiently low, costs of risk-bearing are likely to be immaterial
Next I look at how assumptions about perfect markets need to relaxed in order to make a
meaningful analysis about a consumer-owned cooperative in the Finnish retail trade.

- 16 -
4. Imperfect market theory
No real world market meets the requirements of a perfect market characterized by the absence
of entry and exit barriers, perfect information, costless transactions, an infinite amount of
market participants, profit-maximizing firms and homogenous goods. However, these
assumptions are often utilized to enable meaningful research in economics
In studying the Finnish food retail industry some perfect market assumptions need to be
relaxed while others upheld in order to make a meaningful analysis. The number of market
participants is fixed to two and at least some degree of good heterogeneity is assumed. Also,
the assumption of all firms maximizing profit needs to be relaxed in the case of the
cooperative firm. This is of course central to my thesis. However, perfect market assumptions
of perfect information and costless transactions are upheld. Without these simplifications the
analysis would become much more complicated without adding value to the analysis at hand.
Next I will discuss these central assumptions underpinning later modeling.
4.1. Number of market participants
First I will discuss the finite number of participants in the Finnish food retail market. As
discussed earlier, the market is currently characterized by two large firms who are
accompanied by smaller competitors. This is contrary to the perfect market assumptions in
which agents are assumed to be small price-takers. The market is not characterized by a
perfect duopoly either. However, since my focus is on cooperative firm behavior against a
profit-maximizing competitor, I choose to ignore the smaller firms in the market and assume a
two-firm setting. I also disregard any entry and exit considerations.
The two classical models of duopoly were separately written in the 19th century by Antoine
Augustin Cournot and Joseph Louis Francois Bertrand. The key difference between the two
models is that in Bertrand competition firms compete by setting prices and in Cournot by
setting quantity. Firms are typically barred from cooperation and equilibrium is resolved by
utilizing Nash’s non-cooperative equilibrium concept. (Singh & Vives, 1984)

- 17 -
Which of the classical models depicts competitive behavior in the grocery retail trade? Do
firms compete by setting price (Bertrand competition) or quantity (Cournot competition)?
Naturally reality is somewhere between these two perfect cases. Retailers may pre-commit to
certain volumes and determine price accordingly. However, customers of grocery retailers are
cost conscious and the blitz of marketing coupons, temporary price reductions and other
pricing related promotions are clear signs of competition via pricing decisions. Thus, the
nature of the oligopolistic competition in grocery trade would seem to be more Bertrand than
Cournot. Firms compete in prices and let quantity vary accordingly.
A common assumption for both Bertrand and Cournot competition is that firms move
simultaneously. A third type of game is a Stackelberg game where one of the duopolists
moves first and is called the Stackelberg leader. The Stackelberg follower observes the
leader’s commitment to some action and only thereafter makes her own move. This kind of
setting might be appropriate for a market where one participant has achieved first-mover
status. Although I will employ Bertrand competition in the basic model I will later in this
thesis change the market setting to Stackelberg in order to study how it affects equilibrium.
4.2. Homogenous goods
Second I look into the perfect market assumption of good homogeneity. Goods can be
different in two dimensions: vertically and horizontally. In the former, consumers are able to
rank goods in quality order from best to worst. However, they differ in their willingness to
pay for the different goods. An example of vertical differentiation is the ranking of cars into
luxury, premium and compact. All consumers agree that a luxury car ranks before a premium
one but they differ in their willingness to pay for one. Goods can also be horizontally
differentiated. This means that consumers have different tastes and are not able to rank goods
in quality order. An example of horizontal differentiation is arranging cars into different
categories by color. Consumers agree that that colors are different but cannot agree on which
color is best.
Although there are premium grocery stores around, e.g. Stockmann Oyj in Finland, in this
thesis horizontal differentiation will take central stage since this is how K- and S-group
mostly differentiate their goods and services. The most important building block of horizontal

- 18 -
good differentiation is Hotelling’s spatial model. Consumers are thought to be situated on a
line segment. Producers choose their location and thereafter compete in price. Consumers
incur a cost when buying from a producer which is not situated at the same point as they are.
The cost is increasing in length. Thus, to minimize cost, consumers always buy from the
producer closest to them. The equilibrium of producers’ location is that they locate to the
centre of the line segment. This spatial model can be also expanded to explain other
differentiating factors than spatial. For example, the locations on the line segment could be
interpreted as differences in good color and a consumer’s location on the line segment as a
preference for the respective color. (Hotelling, 1929)
There are some obvious ways for a grocery retailer to horizontally differentiate his good. The
first and most important one is spatial, i.e. the retailer can decide where to locate her store. A
study by The Finnish Grocery Trade Association’s (Päivittäistavarakauppa ry, 2009) found
that store proximity is the most important factor in a consumer’s choice of where to shop.
Another way to differentiate is by in-store service. Some consumers might prefer the type of
service in one store to that of another store. Other ways of differentiating include branding the
store in a way to retain customer loyalty and creating a loyalty program with the purpose of
influencing the customer’s choice of retailer.
4.3. Profit-maximizing firms
Firms in economic modeling are typically assumed to be profit-maximizing. This is a
reasonable assumption since firms strive to maximize shareholder value via dividends or
stock repurchases. Although many firms state additional goals such as protecting the
environment and being a responsible employer, profit maximization is still their main goal as
depicted in the Limited Liability Act (2009): ”The purpose of a company is to generate profits
for the shareholders”. The firm’s optimization function is thus its revenue reduced by its
costs. In a perfect market a firm faces a market price which is unaffected by its own actions.
The firm’s choice is limited to choosing the quantity it sells on the market.
Since this thesis is interested in cooperatives, it is obvious that the above assumption needs to
be adjusted. In a way, cooperatives have the same goal as profit-maximizing firms: they seek
to optimize their owners’ utility from the firm. However, because owners of the consumer-

- 19 -
owned cooperative have an additional role as customers, this has to flow through to the formal
optimization formula. Cooperatives have two ways of disbursing money to their customer-
owners: return on the membership fee and reduced price. Without loss of generality I will
assume that a cooperative can forecast its costs and demand accurately and doesn’t retain any
earnings. It sets its price so low that it doesn’t make any profit.

- 20 -
5. Formal framework and modeling
In this section I will build on this thesis’s previous discussion to construct a formal duopoly
framework consisting of a profit-maximizing firm and a consumer-owned cooperative. I will
use the framework built in this section to find an explicit Nash equilibrium. First I discuss
some limitations and background of the model.
5.1. Limitations and background
There is a limited amount of differences between a profit-maximizing firm and a consumer-
owned cooperative. Indeed, Hansmann (12, 1996) argues that the profit-maximizing firm is
actually just another form of a cooperative, a lenders’ cooperative. As discussed earlier, one
reason for this form’s prevalence is due to the high degree of homogeneity among lenders.
This homogeneity makes them the patrons whose costs of ownerships are commonly the
lowest.
From a modeling point of view Hansmann’s insight is important because it gives backing for
modeling a cooperative with only a few differences to a typical profit-maximizing firm. For
example the cost function can be assumed to be the same since I can expect the differences in
logistics, procurement, management and other processes to be immaterial between different
forms of organizing the firm. The most important distinction in modeling cooperative
behavior compared to that of a profit-maximizing firm is that the two optimize different goals.
Whereas the sole goal of the profit-maximizing firm is to maximize profit, the consumer-
owned cooperative optimizes the individual net surplus of its members.
Enke (1945), Anderson et al. (1979) and Ireland and Law (1983) have made important
contributions to cooperative modeling. Enke looked at the welfare implications of the
cooperative and Anderson et al. built on his analysis and expanded it. Ireland and Law
constructed a model involving a consumer-owned cooperative in a Cournot-Nash setting.
Next I use their research to present a model of a cooperative firm in a duopoly with a profit-
maximizing firm.

- 21 -
The basic model in this thesis has three important characterizations: limitation to one period,
no sales to non-members and modeling the cooperative as a perfect proxy for its member
desired action. As with the previous research, the model displayed here will be a single-period
one. Cooperatives and investment behavior is not at the focus of this thesis and thus multi-
period considerations are omitted. However, this is not to say that this line of research would
be uninteresting. On the contrary, the rapid expansion of the Finnish market leader S-group
could be an interesting topic to investigate from a saving and investment behavior point of
view.
Second, a relevant question in cooperative modeling is whether the cooperative is allowed to
sell to non-members. As discussed before, legislation in the United States has prohibited sales
to non-members which is probably the reason why most researchers have taken this for
granted. Anderson et al. (1979) developed their basic model assuming sales to members only
but do briefly consider how sales to non-members might affect equilibrium. They find that
sales to non-members increase cooperative member utility. However, this result cannot be
directly applied to the setting of duopoly since Anderson et al. assume that the cooperative’s
pricing decisions has no effect on its competitors. I will first formulate a model which does
not incorporate sales to non-members. Later in the thesis I will extend it to consider sales to
non-members by exogenously setting some part of the population as non-members.
Third, if members of the cooperative are assumed homogenous enough, we can model the
actions of the cooperative as actions of a representative single member. The underlying
assumption here is that the democratic process produces a strategy for the firm which aligns
the goals of each homogenous member and the cooperative as a whole. Anderson et al. (1979)
use a consumer-manager concept to illustrate how homogenous members choose a member to
manage the firm to pursue their shared goals. The writers also assume no management costs.
Interestingly, this line of thought implies minimal principal-agent problems. However, it is
debatable whether large consumer-owned retail cooperatives are really run by an emergent
member of the cooperative. Rather, one could assume that professional management is
recruited and compensated just like that of a profit-maximizing firm’s entailing the usual
principal-agent problems between owners and managers. I disregard this problem and assume
that cooperative members are homogenous and that they are able to align the cooperative’s
interests with their own.

- 22 -
5.2. Building blocks
I will now formally define the building blocks of cooperative modeling adopted from
Anderson et al. (1979) and Ireland and Law (1983). The population consists of N homogenous
consumers. Because consumers are homogenous either all or none choose to be part of the
cooperative. My starting point here will be to assume that all choose to be part of the
cooperative because without the cooperative they would be forced to buy from a monopoly
firm making them inherently worse off. For simplicity I will utilize a linear demand system.
The existence of differentiated goods is taken as granted. Singh’s and Vives’s model (1984)
of duopoly is used as a starting point and the consumers’ utility function is defined as follows.
0
000
),2,1(
2/)2(),(
221
22
2121
iji
i
i
jiiwhere
yyxxyxxyU
(1)
Gamma, , depicts whether the two goods are substitutes ( 0 ), complements ( 0 ), or
independent of each other ( 0 ). The goods in the model are thought to be the same basket
of products which are horizontally differentiated, e.g. spatially. Thus it is infeasible that the
goods would be something else than substitutes. What follows is that gamma must be
positive. Also, gamma cannot be greater than either beta because otherwise the substitute
would satisfy demand “better” than the good itself.
An interesting question is whether the cooperative should maximize the sum of the
cooperative’s utility or that of each member’s. I opt for the latter approach. Despite the
benevolent nature of cooperatives, it seems implausible that current members would accept
new members if the marginal utility to them of doing so was negative even though taking in
new members might increase in the cooperative’s total utility. The papers by Anderson et al.
(1979) and Ireland and Law (1983) adopt the same approach of optimizing individual utility
instead of the sum. Additionally, S-group’s stated business idea is to “produce services and

- 23 -
benefits to cooperative members” (S-group, 2009b) which would lend further weight to
optimizing current individual member utility instead of the total utility of the cooperative.
The cost function of both firms is assumed to display constant marginal costs and no fixed
costs. The latter assumption is justified because my focus is not on entry and thus fixed costs
play little role in such a setting. Constant variable costs are desirable for a well behaved
model. Moreover, there is also some evidence showing that firms in the grocery retail trade do
not display increasing marginal costs. Aalto-Setälä (2001) reports that based on Finnish data:
“costs per sold unit of large retail entities are not lower than those of smaller firms”. It is
important to note that Aalto-Setälä is referring to costs at firm level not store level. Thus his
finding does not mean that the average cost per sold unit of small stores is the same as in large
stores. Because this thesis looks at two firms in a national duopoly, store-specific efficiency
factors are secondary to firm-specific factors. Formally I denote marginal cost as
constant yxici ,: .
yy
xx
ycyCxcxC
)()(
(2)
The price of the good sold by the profit-maximizing firm y, is py and the price of the
cooperative’s good x is px. The cooperative’s revenue is the product of price, px, number of
cooperative members, N and the quantity of goods bought by each homogenous member, x.
Total cooperative profit, c , is revenues minus total costs. Total profit per member is
distributed pro rata according to share of total revenue generated for the cooperative and is
depicted as c .
c N(xpx Cx ) //Cx (x) xcx
c Nx( px cx )
cpx x
Npx x cNx( px cx )
Nx(px c)
(3)
A natural and relevant question is how goods x and y relate to each other. Namely, are they
homogenous goods or does some degree of vertical or horizontal differentiation exist? If we
consider the reality of the retail industry, it is unlikely that the products on shelf themselves

- 24 -
differ to a material degree. A bottle of shampoo from a specific producer has the same
features regardless of where it is sold. However, goods are differentiated in many more ways
than just product attributes. The most obvious differentiating factor is spatial. Others
differentiating factors include retailer brands and different types of service.
Goods x and y depict baskets of the same products. These baskets do not differ in their
product attributes but are differentiated according to the retailer they are bought from, e.g. by
dimensions of location. By differentiating their goods retailers can obtain pricing power. The
degree to which the two goods are substitutable is a defining factor of market power for both
the consumer-owned cooperative and the profit-maximizing firm. To analyze competition
with differentiated goods I will apply a linear demand system similar to that of Singh and
Vives (1984). Consumer demand for the cooperative’s good x depends not only on its own
price xp but also on the price of the good sold by the profit-maximizing firm yp and vice
versa.
I now formulate direct demand functions in order to depict the effect of prices on demand. To
do this I consider the consumer’s standard optimization problem and take partial derivatives
of net utility (utility functions minus prices) with respect to the two goods x and y. This
generates inverse demand schedules from which direct demands can be solved. I will later use
the demand schedules to find the duopoly setting’s Nash equilibrium.
y
d
x
b
x
d
y
b
ppx
ppy
221
221
22
21
212
221
221
12
21
121
1
2
(4)
Contrary to Singh and Vives (1984), I will not replace the original parameters (alphas, betas
and gammas) of indirect demands with price elasticities (denoted b1, b2 and d) for the
remaining formulation. This is because the cooperative will maximize both consumer utility
and profit per member and thus I will need to work with parameters in the consumer’s utility
function.

- 25 -
5.3. Nash equilibrium
In this part I formulate the Nash equilibrium using the building blocks of the preceding
section. The cooperative maximizes the utility of its members’ individual consumption. The
maximization function contains net utility from consumption and the share of the
cooperative’s profit. Thus the cooperative’s optimization problem is as follows.
xcypyyxxyx xypx
2/)2(max 22
2121 (5)
Below I present the optimization problem of the profit-maximizing firm.
ycypyp yyypy
),(max (6)
As argued before, the two duopolists compete by prices in Bertrand competition. Nash
equilibrium will be found at the point where the reaction curves intersect. The profit-
maximizing firm chooses the price of its good to maximize profit by taking the cooperative’s
pricing, xp , as given. It encounters the demand functions for y displayed earlier. The reaction
curve of the profit-maximizing firm, yRC , is as follows.
x
slope
yxyy p
cppRC
11
121
222)( (7)
The cooperative’s reaction curve, xRC , is more difficult to derive. This is because the
cooperative is a special type of firm. Instead of maximizing profit it maximizes the net of
consumer utility and share of cooperative profit. The resulting reaction curve is quite
interesting. It implies that the cooperative always produces at marginal cost under Bertrand
competition.
xxx cpRC (8)

- 26 -
The sign of determines whether the reaction curve of the profit-maximizing good is upward
or downward sloping and whether the two goods are strategic complements or substitutes,
respectively. Because I have earlier defined the two goods to be substitutes, is positive.
Thus the goods of the profit-maximizing goods are strategic complements with the restriction
that the reaction curve of the cooperative does not depend on the price of the profit-
maximizing good’s price. To check that the goods are strategic complements I take the second
derivative of the profit-maximizing firm’s profit function (Bulow et al., 1985).
0,0//0
)(
2212
21
2
221
yx
yyx
pp
cpp
(9)
Nash equilibrium ),( Ny
Nx pp is at the intersection of the marginal cost of the cooperative firm
(its reaction curve) and the reaction curve of the profit-maximizing firm. Plugging the
cooperative’s reaction function into the profit-maximizing firm’s reaction function I get the
Nash equilibrium prices for both cooperative and profit-maximizing firm.
xNx
xyN
y
cp
cc
p11
121
222 (10)
The Nash equilibrium quantities can be solved by plugging equilibrium prices into the direct
demand functions.
yxNy
Nx
xyNy
Nx
ccppx
ccppy
221
22
21
222
21
212
122
112
221
21
221
121
221
12121
)(),(
)(),(
1
2
1
(11)
Under these prices the profit of the profit-maximizing firm is as follows.

- 27 -
1
21121
4)(
),( xyy
ccyp (12)
The utility of the cooperative member is as follows ( 221 ).
221
21
12121
2
21
21
12121
2222
121
221
12
2
2222
121
221
121
2
21
121
1212111
112
2222
121
221
121
)(
)()()()(2
)()()(
21
)()
222(
)()()()(
1
2
1
1
2
1
1
2
1
xy
xyyx
yx
xy
xy
yxx
cc
cccc
cc
ccc
c
ccc
U
(13)
5.4. Nash equilibrium at different levels of gamma
In this section I will use comparative statics to see how elements of Nash equilibrium react to
different levels of gamma. I focus on gamma because consumers’ desire for variety and their
willingness to substitute one good for the other are defining factors of retailer competition. As
discussed earlier in this thesis, gamma essentially measures consumers’ taste for variety,
which cannot in principle be changed but is rather a characteristic that consumers are born
with. However, a less strict interpretation views gamma as a proxy measure for the
consumers’ willingness to change consumption from one good to the other. Retailers can
affect willingness to substitute by, for example, changing the location of their store3. Thus,
analyzing Nash equilibrium at different levels of gamma reveals interesting findings about
equilibria at different levels of taste for variety and willingness to substitute.
To simplify this analysis, I set 21 , 21 and 0yx cc . The first two
assumptions set the demands for the two goods to be symmetric. The intent of this analysis is
not to forecast exact demands but rather to map how changes in market structure affect
equilibrium. Without this simplification, the analysis would become much more cumbersome
3 However, optimal retailer choice of good heterogeneity will not be covered in this thesis.

- 28 -
without adding much value to the analysis. Setting both marginal costs to zero implies that my
focus will not be on potential cost differences between firms and that prices should be
interpreted as mark-ups. This has the downside of losing the ability to follow how different
cost structures might influence equilibrium. However, the important upside is simplification.
First I analyze prices by taking the derivative of Nash equilibrium prices with respect to
gamma.
0
2Nx
Ny
p
p
(14)
The equilibrium price of the profit-maximizing firm’s good is lower the higher gamma is.
This is natural since at higher levels of gamma the profit-maximizing firm’s pricing power is
lower. The price of the cooperative’s good is unaffected by changes in gamma because it is
always sold at marginal cost.
Next I look at quantities.
2)(2),(),( N
yNx
Ny
Nx ppyppx
(15)
The interesting aspect of quantities is that consumption is lower at higher levels of gamma.
This is contrary to how demand would behave in a normal duopoly setting with two profit-
maximizing firms, which I will present later. The reason why demand decreases is due to a
weakened price effect and a desire for good diversity. In the cooperative setting the price
effect of higher gamma is subdued because the cooperative always prices at marginal cost. In
a normal duopoly setting this effect would be the main driver of increasing demand at higher
levels of gamma. Consumers’ preference for diversity is built into the convex indifference
surfaces of the concave utility function (Dixit & Stiglitz, 1977). In the mixed duopoly setting
with the chosen utility function, the weakened price effect is overshadowed by the loss of
utility from variety. Because the consumer gains less from consuming a variety of goods, the
consumer demands less of them even though the profit-maximizing firm’s good is cheaper.

- 29 -
Now I’ll present the effect gamma has on profit.
2
2
)(2),( ypy (16)
A higher level of gamma entails lower profit-maximizing firm profit, which is a consequence
of decreasing demand and weaker pricing power entailed by a decreased taste for variety.
I also look at how utility changes with respect to gamma.
2
2
)(4U (17)
As one could expect from the discussion relating to quantity, also cooperative members’
utility is declining with respect to gamma. The earlier discussion on quantities applies here as
well. The utility-enhancing effect of price on utility is overshadowed by the negative effect of
decreased utility from variety. If I was to compare two duopoly settings with different levels
of consumers’ taste for variety, consumers with a higher taste for variety would reach a higher
level of utility.
Last, I look at how total surplus changes with respect to gamma. I have not earlier formulated
an equation for total surplus but can derive how it behaves by using the derivatives of profit
and utility. Total surplus is the sum of utility and profit and thus its derivative is the sum of its
components’ derivatives.
2
2
2
2
2
2
)(43
)(2)(4UTS
UTS(18)
As would be expected from its negative components, also total surplus is decreasing with
respect to gamma. The interests of market participants are aligned. All would prefer lower
values of gamma.

- 30 -
5.5. The corresponding normal duopoly
I next formulate the Nash equilibrium of two symmetric profit-maximizing firms in order to
have a benchmark for later analysis. To avoid confusion, I will denote the prices, profits and
quantities of these two firms with an apostrophe. For example Nash equilibrium price of good
x in normal duopoly is denoted by Nxp ' . I will first find Nash equilibrium prices and thereafter
profits and quantities.
Prices
yxNx
xyNy
ccp
ccp
221
12
21
212
21
2112211
'
221
22
21
212
21
2221212
'
442
42
442
42
(19)
Quantity
)4(22
)(),('
)4(22
)(),('
221
2122
1122
12112
21
2''
221
2122
2212
22122
21
1''
xxyNy
Nx
yyxNy
Nx
cccppx
cccppy
(20)

- 31 -
Profit
)2()2(
)2(
)2(
))(2(
)2(
)4)((
)',(
)2()2(
)2(
)2(
))(2()2(
)4)((
)',(
2211
2221
2
221
3221
21
2112211
21
12
112211
22112211
2221
221
2
''
2212
2221
2
222
3221
22
2221212
22
22
221212
22221212
2221
221
1
''
yxx
yxy
x
x
Nxx
yxy
xyx
x
x
Nyy
ccc
ccc
c
c
xp
ccc
ccc
c
c
yp
(21)
Consumer utility under the equilibrium prices is as follows.
221
22221
222121
2122
2212
2212
2122
1122
1211
221
22112
212112
2221
2221
21
2122
2212
2212
1112
2221
221
21
2122
1122
1211
2221
2221
221
21
)22(
)22(*
)22(2
)22(
)4()(2
)22(*
)22(
)4)((
)22(*
)22(
)4)((
yyx
yyx
xxy
xxy
yyx
xy
xxy
yx
ccc
ccc
ccc
ccc
ccc
cc
ccc
ccU
(22)
Next I list how the Nash equilibrium of normal duopoly behaves with respect to gamma.
Since these are well documented, I do not comment on these further. To simplify, I
set 21 , 21 and 0yx cc .
0)2( 2
''Nx
Ny pp
(23)

- 32 -
0)2()(
)2()),('()),('(22
''''Ny
Nx
Ny
Nx ppxppy
(24)
0)2()(
2))',(())',((32
2
0
22'''' xpyp N
xxNyy (25)
3222
)2()(3U (26)
0)2()(
4742
2
32
222UTS
UTS(27)
Note that consumer surplus is increasing with respect to gamma but that total surplus and
profit are decreasing. The reason for a lower total surplus with higher gamma is that the
decrease in profit due to a reduction in pricing power is greater than consumers’ net utility
gain from loss of variety and decrease of price.

- 33 -
6. Different equilibria of the normal and mixed duopoly
I will now compare the prices, quantities, profits and utilities of the two duopoly settings. The
goal of this analysis is to find how the two market settings differ and how the level of gamma
influences this difference. As before, I set 21 , 21 and 0yx cc to
simplify the analysis. Variables of the normal duopoly are denoted by an apostrophe.
6.1. Price and quantity
By subtracting Nash equilibrium prices from each other I can investigate which one of the
two equilibrium prices is higher. For the cooperative’s good the answer is clear since the
cooperative produces at marginal cost.
00''Nx
Nx
Nx ppp (28)
The price difference is dependant on gamma as follows:
2''
)2()( N
xNx
Nx ppp (29)
The price difference is decreasing with respect to gamma. Since the cooperative’s price is
always at marginal cost, this reflects the decrease in the profit-maximizing firm’s pricing
power due to increasing substitutability between goods. At high values of gamma consumers
don’t care for variety and are ready to substitute one good for the other thus decreasing the
profit-maximizing firm’s opportunity to charge a premium for its goods.
For the profit-maximizing firm’s good:
)21)((
)4( 22'Ny
Ny pp (30)

- 34 -
Whether the difference in prices is negative or positive is defined solely by the equation in
brackets since in my assumptions is 022 , which implies 04 22 .
Because 0 , the price of the profit-maximizing firm’s good is always higher in normal
duopoly than in mixed. This follows from the way the profit-maximizing firm’s room for
price increases is higher in normal duopoly where both firms maximize their profit and prices
are strategic complements. In contrast, in mixed duopoly the cooperative commits to marginal
cost pricing thus limiting the profit-maximizing firm’s price.
Next I look at how the price difference responds to different values of gamma.
)2
12()2
12()2(
)(0
293.0707.1
0
2'
Ny
Ny pp
(31)
The derivative with respect to gamma shows that the price difference of the profit-
maximizing firm’s good is increasing when )59.0( 4 and decreasing when )59.0(
and has a local maximum at )59.0( . 5 To understand why, one must recall that I am
presenting the price difference between the profit-maximizing firm’s good in mixed duopoly
and the price of the same good in normal duopoly. The existence of a local maximum is
explained by the varying effect of the cooperative’s ability to influence the profit-maximizing
firm’s pricing in mixed duopoly. At low degrees of gamma, the cooperative’s influence on the
profit-maximizing firm’s price is negligible since consumers have a high level of taste for
variety. The two goods are close to forming their own markets due to consumers’ low
willingness to substitute. The pricing decision of the profit-maximizing firm in both duopoly
settings is very similar because the cooperative’s pricing has little influence. Thus there is
little difference between prices in the two settings. At greater degrees of gamma high
substitutability itself enforces a low price difference in both settings. When gamma
approaches beta the goods become closer to perfect substitutes, which pushes prices to
4 59.07.1
1
5 Recall assumption that

- 35 -
marginal cost. Thus, the effect of the cooperative is greatest at moderate levels of
substitutability when it can influence its competitor’s price by placing further downward
pressure on it.
I now turn my analysis to quantities.
Quantities in normal duopoly
)4(2
)(),('
)4(2
)(),('
22
22
22''
22
22
22''
Ny
Nx
Ny
Nx
ppx
ppy(32)
Quantities in mixed duopoly
22
221
21
2221
),(
)(),(
Ny
Nx
Ny
Nx
ppx
ppy(33)
First I analyze the quantity of the good sold by the cooperative and then that sold by the
profit-maximizing firm.
)2
1)(2
1())(2(
),('),(
1
''Ny
Nx
Ny
Nx ppxppx (34)
Because all factors in brackets are positive when , the consumed quantity of the
cooperative’s good x is always higher in the mixed than in the normal duopoly. This follows
from the lower price of the cooperative’s good in mixed duopoly compared to the Nash
equilibrium price in normal duopoly.
))(2(2),('),( ''
Ny
Nx
Ny
Nx ppyppy (35)
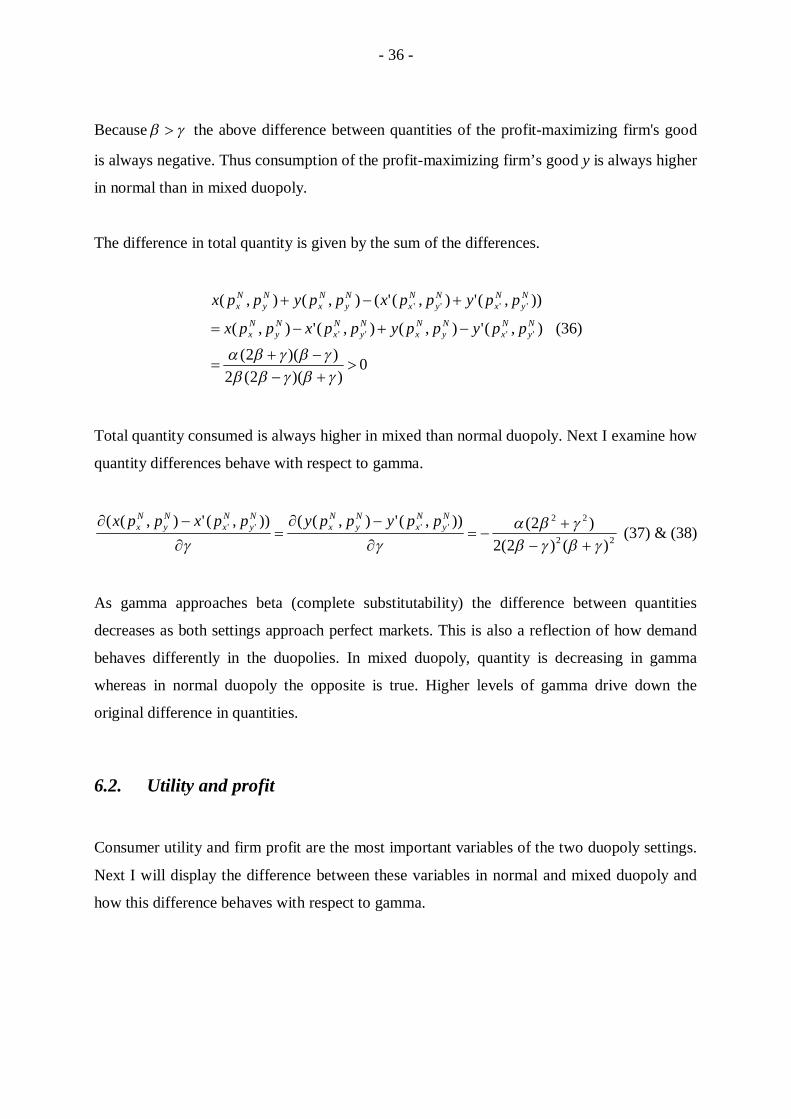
- 36 -
Because the above difference between quantities of the profit-maximizing firm's good
is always negative. Thus consumption of the profit-maximizing firm’s good y is always higher
in normal than in mixed duopoly.
The difference in total quantity is given by the sum of the differences.
0))(2(2
))(2(),('),(),('),(
)),('),('(),(),(
''''
''''
Ny
Nx
Ny
Nx
Ny
Nx
Ny
Nx
Ny
Nx
Ny
Nx
Ny
Nx
Ny
Nx
ppyppyppxppx
ppyppxppyppx
(36)
Total quantity consumed is always higher in mixed than normal duopoly. Next I examine how
quantity differences behave with respect to gamma.
22
22''''
)()2(2)2()),('),(()),('),(( N
yNx
Ny
Nx
Ny
Nx
Ny
Nx ppyppyppxppx
(37) & (38)
As gamma approaches beta (complete substitutability) the difference between quantities
decreases as both settings approach perfect markets. This is also a reflection of how demand
behaves differently in the duopolies. In mixed duopoly, quantity is decreasing in gamma
whereas in normal duopoly the opposite is true. Higher levels of gamma drive down the
original difference in quantities.
6.2. Utility and profit
Consumer utility and firm profit are the most important variables of the two duopoly settings.
Next I will display the difference between these variables in normal and mixed duopoly and
how this difference behaves with respect to gamma.

- 37 -
Utility in normal duopoly
))4(
)2)(()4(
)2)()(2(2)( 222
222
222
2222
222
22
normalU (39)
Utility in mixed duopoly
)8
24()(
281
)( 222
222
222
2
mixedU (40)
Difference between utilities
0
))((8
5
)(6
)4)(()(
222
3
3
222
2
normalmixed UU (41)
Somewhat unsurprisingly, consumer utility is always higher in mixed duopoly than in normal
duopoly. This is due to the fact that in mixed duopoly the pricing power of the profit-
maximizing firm is reduced. Consumers can always resort to consuming the cooperative’s
goods at marginal cost. Because the cooperative is insensitive to the profit-maximizing firm’s
price changes, the profit-maximizing firm has less room for maintaining a higher price. In
normal duopoly with strategic complements the two firms could support higher prices even
without explicit collusion.
It is also interesting to employ comparative statics to see how the difference in utilities reacts
to the substitutability of goods.
068)2()(4
)( 23332
2normalmixed UU (42)

- 38 -
Although consumer utility is always higher in mixed duopoly than in normal, the above
equation shows that the utility difference is decreasing with respect to gamma. This is an
obvious result if one recalls that utility in mixed duopoly is decreasing with respect to gamma
but increasing in normal duopoly.
Next I take a look at how profits of the profit-maximizing firm compare in the two settings.
Profit in normal duopoly
22222222
2
'' )2()4)((
)',( ypNyy (43)
Profit in mixed duopoly
2
222
2222
2
4)4()(
)4)((),( yp y (44)
Difference between profits
4)2)((4
)(),()',( 2
2
'' ypyp yNyy (45)
Since , 4 must also be positive. Thus the profit-maximizing firm’s profit is lower
in mixed than normal duopoly. The same discussion that applied to higher utility for the
consumer applies to lower profit for the firm. Lower pricing power in mixed duopoly limits
the price which the profit-maximizing firm can sustain.
I also employ comparative statics to see how the difference in profits responds to the level of
gamma.

- 39 -
0
2
515
22
8.1
5132
2
''
)54
1511
()1
1()2()(
2
)),()',(( ypyp yNyy
(46)
Comparative statics show that the derivative of the difference between profits is positive with
low values (in this case when 55.0 )6 and negative with high values of gamma relative
to beta ( 55.0 ). Ignoring the nature of gamma and focusing only on the mechanics of
the model, the difference between profits is first increasing and then, after reaching its
maximum at a given threshold, decreasing with respect to gamma. Despite the change in the
derivative’s sign, the profit-maximizing firm’s profit in normal duopoly is still always higher
than in mixed duopoly. The initial increasing difference comes from the increase in the
cooperative’s effect on the profit-maximizing firm’s price as discussed before in the case of
price (31). When gamma is close to zero the two market settings are similar to each other
because the profit-maximizing firm is shielded from the cooperative’s pricing effect by low
substitutability. The decreasing difference is explained by the diminishing pricing power as
consumers are more willing to substitute one good for the other. As gamma approaches beta,
the two market settings become again more alike.
6.3. Total surplus
Total surplus (TS) is the sum of firm profit and consumer utility. In mixed duopoly it is the
sum the representative cooperative member’s profit and the profit-maximizing firm’s profit.
In the normal duopoly case it is the sum of the two firms’ profits and consumer utility. The
previously calculated differences between variables in the two duopolies can be used to
calculate the difference in total surplus. I sustain the simplification of 21 ,
21 and 0yx cc .
6 55.08.1
1

- 40 -
)2
12()2
12()2)((2
)(
)()()2()(
207.10
2
2
normalmixed
normalnormalmixednormalmixed
normalnormalmixedmixed
normalmixed
TSTS
UUUU
TSTSTS
(47)
From this, one can see that total surplus can be lower in mixed duopoly than in normal
duopoly. Only when gamma is below a certain threshold (in this case 83.0 )7 is mixed
duopoly preferable from a total surplus point of view. To see why, one must return to the
individual components. The difference between utilities is decreasing with respect to gamma
due to decreasing utility from variety in mixed duopoly, which is not compensated by a strong
enough lower price effect as it is in normal duopoly. Although consumer utility is always
higher in mixed duopoly, the fact that it is decreasing means that at some point the higher
profit-maximizing firm profit in normal duopoly overshadows higher consumer utility in
mixed duopoly. With this model the tipping point happens to be when 83.0 .
I also formulate the derivative of the difference in total surpluses to see how the difference
evolves with respect to gamma.
32
0
222
)2()()345.086.0()086.1(2)( normalmixed TSTS (48)
Taking the derivative of the difference in total surplus with respect to gamma shows that the
difference is decreasing for lower ranges of gamma. When gamma approaches beta the
difference in surpluses is reversed. This is a natural state of affairs in the light of the earlier
finding of how normal duopoly total surplus can be more than mixed duopoly total surplus.
7 83.0207.11

- 41 -
7. Extensions to the basic model
In this section I will consider two extensions to the Bertrand competition model that I have
presented before. First I change the market setting from Bertrand to Stackelberg and see how
this change affects price. In the second extension part of the population is exogenously
excluded from the cooperative, which makes an analysis of sales to non-members possible.
7.1. Stackelberg competition
A characteristic of Bertrand competition is that agents set prices simultaneously. However,
this is not the only way to model firm behavior. In fact, firms seldom take action
simultaneously. It is conceivable that one firm has gained market leadership through previous
success or earlier market entry. Whatever the reason, this firm will be the market leader
whose actions are followed by others. Stackelberg competition is a framework for analyzing
this kind of setting where one firm leads and others react. In Finland, S-group has the greatest
market share with a 40 per cent of the market. Due to its large market size, the cooperative
could have achieved status of Stackelberg leader. Moreover, it is possible that K-group, who
is the second largest player in the market, follows the decisions made by S-group and only
then decides on its own course of action.
In an extension to the basic Bertrand model I will now examine Stackelberg competition in
which the cooperative sets prices first and the profit-maximizing firm sets prices next. It will
be interesting to see how the behavior of the cooperative firm changes in Stackelberg
competition. In this analysis I will assume 21 , 21 and 0yx cc . To
solve Nash equilibrium, I will utilize backward induction and first solve the follower’s
optimal response and thereafter the leader’s action.
222 //),(max yxyyyp
ppppypy
(49)

- 42 -
The reaction curve of the profit-maximizing firm is the same as earlier (7):
xxyy
y
pppRC
dpdCOF
22)(
).(.. (50)
The Stackelberg leader optimizes her price taking into account the above optimal reaction of
the follower.
0)2()2(
)(
2/)2(max
0
22
x
yp
p
ypyyxxyxx
(51)
An interesting finding from this analysis is that at the Nash equilibrium of Stackelberg
competition, the cooperative firm prices below marginal cost. The reason for this is clear.
When the cooperative is the Stackelberg leader it pays off to commit to a price below
marginal cost because by doing so cooperative members can reach a higher level of utility.
0)2)(2(
2)( 22
yp (52)
However, the cooperative cannot induce the profit-maximizing firm to price below costs but
can only diminish its profit. Comparing the price of the profit-maximizing firm’s good in this
Stackelberg setting to that of the Bertrand setting (10) reveals that the price of the firm is
indeed lower in Bertrand.

- 43 -
Price of the profit-maximizing firm’s good
BertrandgStackelber
2)(
)2)(2(2)( 22
(53)8
As a result of the above pricing decision consumers are necessarily better off but the profit-
maximizing firm’s profit is squeezed further. Is this kind of behavior sustainable? From the
consumer’s point of view she would need to recapitalize the cooperative because it would sell
under marginal costs. However, this would be offset by the ability to influence the profit-
maximizing firm’s price to a lower level.
7.2. Outside sales
Previously all consumers were assumed to be members of the cooperative. From a Finnish
point of view, this restriction leaves out an important part of reality because all consumers not
are part of S-group but nevertheless buy goods from it. Now I will consider a model which
takes into account the cooperative’s sales to non-members. In this setting an exogenous share
of the population is not part of the cooperative. Consumers could decide not to join the
cooperative for a number of reasons. Some might have ideological reasons for not joining,
some might find the initial cash outlay to pay the membership fee too high and others may
simply be unaware of how and why to join.
A fraction of the population N, denoted by a, are members of the cooperative. The remainder
are not members and make up (1-a)N of the population. The market setting is as before and
includes a profit-maximizing firm and a cooperative. The two firms compete with
horizontally differentiated goods in Bertrand competition by simultaneously setting prices.
There are two goods on the market. Good y is the good sold by the profit-maximizing firm
and x is sold by the cooperative. I use subscript m for the goods demanded by cooperative
members and r for the non-members. Marginal costs are set to zero and thus prices are to be
interpreted as mark-ups. The price of the profit-maximizing firm’s goods is yp and the price
8 For proof see equations appendix

- 44 -
of the cooperative’s good is xp . The cooperative sells to non-members above marginal cost
which departs from its pricing to members to whom it sells at marginal cost.
The profit-maximizing firm maximizes profit by optimizing price. Demand for its good
comes from two sources: cooperative members and non-members. Thus total profit consists
of revenue from both groups. Likewise, the cooperative faces two demands: demand from its
members and that from non-members. Unlike the profit-maximizing firm, the cooperative has
two different prices. Its price for members is zero but it charges xp for sales to non-members.
Cooperative total profit is depicted as coop and per member profit as coop . The utility
functions for the representative member and non-member are identical and as before (1). For
simplicity, I assume 21 , 21 and 0yx cc .
First I derive the profit functions and the net utility functions.
xrcoop
coop
xrcoop
xrmcoop
pxa
aaN
pNxa
pNxaaNx
)1(
)1(
)1(0*
(54)
ryrxrrrrrrr
xrmymmmmmmmmp
rymyp
ypxpyyxxyxU
pxa
aypxyyxxyxU
ypyp
coop
x
y
)2(
)1(0*)2(max
max
2221
2221 (55)
Note that the representative member’s utility function includes her share of the cooperative’s
profit from sales to non-members.

- 45 -
Next I solve direct demands mrm xyy ,, and rx .
ym
ym
px
py
demandMembers
2222
2222
'
(56)
yxr
xyr
ppx
ppy
demandmembersNon
222222
222222
'
(57)
The profit-maximizing firm and the cooperative face these four demand schedules. Next I will
derive their reaction curves starting with the price of the profit-maximizing firm’s good.
x
slope
xy ppp42
)( (58)
The cooperative’s reaction for its price to non-members is as follows.
y
slope
yx ppp22
)( (59)
The slope of the cooperative’s reaction curve is twice that of the profit-maximizing firm’s.
Also, the cooperative’s reaction curve is the same as the profit-maximizing firm’s when
cooperative sales to non-members were prohibited (7). The difference in reaction curves
stems from the cooperative’s ability to apply dual pricing. It sells goods at marginal cost to
members but sells at xp to non-members. However, the profit-maximizing firm is bound in

- 46 -
this model to one price for both groups. This diminishes the effect of the cooperative’s price
on the price of the profit-maximizing firm thus leading to a lower slope in its reaction curve
Next I derive Nash equilibrium prices.
22
22
8
)212)((2
8)2)((2
Ny
Nx
p
p
(60)
Nash equilibrium prices are asymmetric due to different reaction curves. The cooperative is
able to price its good higher than the profit-maximizing firm. As discussed above, this is
because some consumers are cooperative members and some are not. A hike in the
cooperative’s price reduces demand from non-members only while a corresponding move on
the profit-maximizing firm’s price reduces demand from both cooperative members and non-
members.
It is interesting to compare how these Nash equilibrium prices compare to those of normal
(19) or mixed duopoly (10) with only sales to members.
Comparison of the profit-maximizing firm’s pricing
memberstoonlysalesecooperativ
duopolymixedmembersnontoalsosalesecooperativ
duopolymixed
duopolynormal :
:
2222 28
)212)((2
4
)21)((2
(61 & 62)9
Comparison to mixed and normal duopoly reveals that the price of the profit-maximizing
firm’s good is highest in normal duopoly. If some consumers are not part of the cooperative
and sales are allowed to them, the profit-maximizing firm’s price is higher than if all
consumers would be members of the cooperative.
9 For proof see equations appendix

- 47 -
Comparison of the cooperative’s pricing
memberstoonlysalesecooperativ
duopolymixedmembersnontoalsosalesecooperativ
duopolymixed:
:
22 08
)2)((2 (63)
The price of the cooperative’s good is naturally higher in this setting since when everybody is
a member, the cooperative prices at marginal cost.
- 48 -
8. Relating S-group behavior to the model
The purpose of this section is to take a step back from modeling and reflect on how it fits
Finnish reality. First I will look at the role of S-group and consider how its behavior fits that
of a theoretical cooperative. Second I will touch on the subject of the cooperative’s saving and
investment decision. Third I will look at how the cooperative disburses excess profit. Last I
review some recent evidence of S-group’s pricing.
The institutions and aims of S-group are what one might expect from a cooperative. There is
no reason to suspect that elected members and the management they incentivize would not
have maximizing individual consumer surplus as their goal when making decisions. Indeed,
this point of view is echoed in S-group’s stated purpose of “producing services and benefits
for cooperative members” (21, S-group, 2009a). This supports the model framework in which
the cooperative maximizes individual consumer utility.
Another outcome of the model is that the profit of the cooperative should always be zero. One
might conclude from S-group’s annual statements that a decision to withhold profit would
mean that the cooperative is acting against what the model would predict. However, the
model is static and thus disregards saving and investment decisions that are central to any
business. Determining what level of investment is optimal, e.g. opening new stores, is next to
impossible ex ante. Additionally, what might not look like a profitable venture for a profit-
maximizing firm might just be worthwhile for a cooperative aiming for marginal cost price.
The model in this thesis fails to take into account a dynamic setting of intertemporal saving
and investment behavior, which would be an interesting field for future research.
S-group uses a membership card to record purchases and to identify members for members-
only benefits and discounts. Based on the use of the membership card, the cooperative
calculates the member’s share of the cooperative’s disbursable profit. To simplify the process,
each member cooperative has a bonus schedule which dictates how much a given member
receives from the cooperative each month. The amount returned, called bonus, depends on the
amount the member has spent on the cooperative. This is compatible with the earlier
introduced Roschdale principles. In addition to receiving a bonus on their purchases, the
cooperative can decide to disburse accumulated profit by paying interest on the member fee.

- 49 -
The regional cooperative of the Helsinki area paid a ten percent interest on each member’s
membership fee from its 2008 profit (HOK-Elanto, 2009).
The percentage rate determining how much of purchases is returned to members as bonus is
increasing with respect to purchases. For example, the cooperative in the Helsinki area, HOK-
Elanto, returns three per cent of purchases if a member’s purchases are between 300 euros and
400 euros in a given month. The rate of return increases with purchases so that if a member
spends over 1500 euros a month on the cooperative, she is returned five per cent of the spent
sum (HOK-Elanto, 2010). The non-linear bonus payment structure used by S-group differs
from the pure linear scheme I utilized in my model. It also differs from what one might
assume from a cooperative. Having a progressive bonus scheme does not seem to be in the
spirit of the cooperative ideal because it is against equal treatment of members. In essence, it
is a way to charge different prices from different types of consumers and attract members to
centralize their purchases into the cooperative. In other words S-group is performing (second
degree) price discrimination towards its members. Investigating what the welfare effects of
this behavior is left unstudied but would be an interesting field to pursue.
S-group’s competitors have also adopted loyalty card programs. For example K-group’s
“Plussa” card program is widespread. Like S-group, K-group rewards loyalty by paying a
bonus on the basis of purchases. Also like its cooperative competitor, K-group employs a non-
linear bonus payment structure. K-group is a profit-maximizing firm and thus does not return
profit to its customers. This is the likely reason why its customers receive less bonus from
purchases than if they would have used the same money in S-group stores. For example:
purchasing 400 euros worth of goods yields a return of 10 euros from S-group but only seven
euros from K-group. Membership or loyalty cards can also have other uses for a firm. One
important use is data collection. Retailers can use data collected from card use to analyze their
consumers’ purchasing behavior.
Finland’s VAT on food was decreased in October 2009 from 17 to 12 per cent. To examine
the effect of the VAT decrease, the National Consumer Research Centre (2010) conducted a
study on food prices before and after the VAT decrease. The study found that the price
difference between the retail chains had decreased from 2008 to 2009. Moreover, the
researchers state that “it cannot be said with a high level of confidence that price differences
between retailer chains are statistically significant” (National Consumer Research Centre,

- 50 -
2010, 39). In the study, data revealed that Lidl had the lowest prices. However, Lidl operates
as a hard discounter involving a different pricing, variety and location strategy. This makes
direct comparison to other players in the Finnish market difficult.
The cheapest normal retailer was S-group followed by K-group. Price data used in the sample
is normal price and does not take into account price discounts or bonus payments (National
Consumer Research Centre, 2010, 10). Since K-group’s pricing is more geared to price
discounts and S-group’s to rewarding bonuses, including these factors would shed light to the
actual price difference between the two players. The price study lends authority to the basic
model’s prediction of pricing behavior. S-group is pricing below its duopoly counterpart K-
group as suggested and its goal of price leadership is also reflected in S-group’s strategy:
“The central goal and competitive advantage of S-group is our continuously cheap price for
groceries” (S-group, 2009a). I can conclude that S-group is aiming for price leadership as
suggested by the basic model and, based on the recent study, is also executing it. However,
the model which considered that some consumers were not part of the cooperative predicts
that normal prices would be higher in S-group, which is contrary to the study’s findings. This
highlights that more research in the model and cooperatives is needed.
In summary, the modeled cooperative matches actual S-group behavior in some aspects but
not others. S-group’s statements back the assumption that the cooperative maximizes
individual consumer utility. The static model does not take into account saving and
investment behavior which clearly S-group management needs to consider. This distorts the
comparison between the model’s prediction of zero profit and annual reports. Additionally, S-
group’s way of paying out excess profit in a non-linear fashion is contrary to what is modeled.
Based on a recent study S-group is the cheapest normal grocery retailer although Lidl, a hard
discounter, sustains an even lower price. This observation is in tune with the basic model’s
prediction of price leadership. All of these areas would be interesting directions to further
develop this thesis’s analysis.

- 51 -
9. Conclusions
The goal of this thesis is to study the grocery retail trade and how a cooperative might affect
the market. In this section I will first summarize the findings from modeling a Bertrand
duopoly with a profit-maximizing firm and a cooperative (mixed duopoly). I also compare the
resulting Nash equilibrium with the Nash equilibrium of two profit-maximizing firms (normal
duopoly). I start with price and continue with quantity, profit, utility and total surplus. I also
summarize my findings from extending the basic Bertrand model to first Stackelberg
competition and second to a setting where all consumers are not members of the cooperative.
I will then relate these findings to reality. Thereafter I will touch on some potential policy
considerations before closing with some ideas for further research.
Bertrand duopoly with horizontally differentiated goods is normally modeled assuming two
profit-maximizing firms. In this thesis one of the duopolists is assumed to be a consumer-
owned retail cooperative, which has a profound effect on market equilibrium. The most
important characteristic of the resulting market equilibrium is that the price of the
cooperative’s good is set equal to marginal cost (see equation 8). This is also intuitively
attractive. After all, in the basic model’s assumptions the cooperative is barred from sell to
non-members and thus the effective price to the owner-members must be equal to cost. An
important parameter in the model is the willingness of consumers to substitute one good for
the other (parameter gamma in the model). The price of the cooperative’s good is independent
of gamma but the price of the profit-maximizing firm’s good is negatively correlated to
gamma. The more willing consumers are to substitute goods the lower the profit-maximizing
firm’s profit.
Comparison between the Nash equilibrium price of normal duopoly and mixed duopoly
reveals differences between the two duopoly settings. The price of the cooperative’s good in
mixed duopoly is naturally lower than the price of either symmetric good in normal duopoly
(28). The gap between prices in the different duopoly settings is lower when consumers do
not value variety and are ready to substitute one good for the other (29). This is because the
market power of the profit-maximizing firms in normal duopoly is the lower the more
consumers are ready to substitute one good for the other. The price of the profit-maximizing
firm’s good in mixed duopoly is always lower than the corresponding price in normal duopoly

- 52 -
due to the cooperative’s choice to price at marginal cost (30). However, this price difference
is not monotonous but has a local maximum at a value of consumers’ willingness to substitute
(31).
An interesting finding is that at low values of willingness to substitute (and high value for
variety), the two duopoly settings are actually quite similar regarding the good sold by the
profit-maximizing firm. Because goods are not readily substituted, firms operate as near
monopolists with respect to their own markets. Only if consumers are ready to substitute the
profit-maximizing firm’s good for the cooperative’s good will the cooperative’s marginal cost
pricing start to affect the profit-maximizing firm’s pricing and increase the difference between
the profit-maximizing firm’s pricing in normal and mixed duopoly. If consumers are almost
indifferent to which good they consume, i.e. they do not value variety, the force of
competition will drive prices in both settings towards perfect market pricing, pricing at
marginal cost, which overshadows the effect of the cooperative’s marginal cost pricing on its
competitor’s pricing decision.
The findings on price are of particular interest because there has long been an active debate
about whether Finnish grocery prices are high and if yes, why? Some have blamed the
duopolists S-group and K-group of using market power to uphold high prices. However, the
findings of this thesis would support the view that the current situation with mixed duopoly is
in fact beneficial to that of two profit-maximizing firms and thus the adverse effect of a
concentrated market structure is decreased due to the cooperative’s unwillingness to use
market power.
Like price, consumed quantity is different in the Nash equilibria of the two duopoly settings.
It also behaves differently with respect to consumers’ willingness to substitute. Due to the
marginal cost pricing of the cooperative good in mixed duopoly, it is no surprise that the
consumed quantity of the cooperative’s good is higher in mixed duopoly than consumption of
the goods in normal duopoly (34). On the other hand, the consumed quantity of the profit-
maximizing firm’s good in mixed duopoly is lower than consumption in normal duopoly (35).
The less consumers value variety and the readier they are to substitute one good for the other,
the less (more) they consume in mixed (normal) duopoly (15, 24). Thus the higher gamma is
the less quantities in the duopoly settings differ (32 & 33).

- 53 -
A characteristic of demand in mixed duopoly is that it is decreasing with respect to
consumers’ willingness to substitute. While a higher level of substitutability and lower taste
for variety has the effect of lowering the price of the non-cooperatively sold good (boosting
demand), lower taste for variety obviously means less utility from variety (depressing
demand). In normal duopoly and with this particular utility function, the loss of utility from
variety is curtailed by the effect of increasing substitutability on price. This force is
considerably weaker in mixed duopoly where prices are lower due to the cooperative’s choice
to price at marginal cost.
The profit-maximizing firm’s profit in mixed duopoly is at its highest when consumers are
unwilling to substitute one good for the other (16). This is a logical consequence of pricing
power due to the consumers’ reluctance to substitute and applies to both duopoly settings (16
& 25). The difference between the profit-maximizing firm’s profit in mixed duopoly and
profit in normal duopoly is not monotonous. This is due to the same reason as with prices. At
low values of gamma, i.e. low willingness to substitute and high value for variety, there is
little substitution effect between the two goods in both settings and thus the duopoly settings
resemble each other. At higher values of gamma, consumers are more willing to substitute
goods. In mixed duopoly the profit-maximizing firm is affected by the cooperative’s marginal
cost pricing, which is the root cause for the difference between profits in the duopoly settings.
An important finding of this thesis is that consumer utility is decreasing with respect to
gamma in mixed duopoly (17). This is contrary to what is the case in normal duopoly (26).
The reason for this difference to normal duopoly is, as with quantity, consumers value variety.
A higher level of gamma means less utility from variety reducing utility. This reduction of
utility is not countered by a big enough decrease of price due to the cooperative’s already
aggressive pricing and thus the decrease in utility from variety is the prevailing force.
However, at a given level of gamma utility is always higher in mixed duopoly than in normal
duopoly. The difference is decreasing in gamma as an increase in consumers’ willingness to
substitute one good for the other pushes normal duopoly prices closer to marginal cost thus
decreasing the pricing power of the profit-maximizing firms.
In both duopoly settings total surplus is highest at low levels of gamma meaning a low
willingness to substitute and high value of variety (18 & 27). In mixed duopoly this is a direct
result of both profit and utility being the higher the lower gamma is. In normal duopoly utility

- 54 -
is higher at large values of gamma but not high enough to counter reduced firm profit in a
setting where consumers readily consume the cheapest good. At low levels of gamma mixed
duopoly total surplus is higher than in normal duopoly but is decreasing faster with respect to
gamma (48). What follows is that with high values of gamma, normal duopoly exhibits a
higher level of total surplus than mixed duopoly (47).
After modeling the market in Bertrand competition with all members of the population as
cooperative members I expanded the analysis. I first changed decision-making so that instead
of choosing prices simultaneously the cooperative was made to commit to a price first. The
resulting Stackelberg competition leads to the cooperative pricing below marginal cost (51).
Consequently, the price chosen by the profit-maximizing firm is below what it was in
Bertrand competition (52 & 53). Herein lies the rationale for the cooperative’s negative
pricing. By precommitting to a negative price it can influence the profit-maximizing firm to
price at lower a lower level than what it would if the firms chose simultaneously. In reality the
outcome predicted by the Stackelberg model could be sustained. Members of the cooperative
would be better off so they should not object to the practice. Also, the cooperative could
sustain losses by adjusting the amount it returns to customers. An interesting continuation of
research would be to look into whether there are signs that S-group is selling to members
below marginal costs (after adjusting for bonus payments).
The second extension to the basic model is made in order to study how sales to cooperative
non-members affects equilibrium. I exogenously set a portion of the population to not be
members of the cooperative. This results in dual pricing for the cooperative. For members,
goods are sold at marginal cost but pricing power is used against the non-members. The
profit-maximizing firm uses one price for sales to members and non-members. As a result, the
reaction curve of the profit-maximizing firm is less elastic to the price of the cooperative than
the reaction curve of the cooperative is to the profit-maximizing firm’s price. Thus the
cooperative’s price is higher than the profit-maximizing firm’s price. This is because a price
change by the profit-maximizing firm is directed at the whole population whereas the
cooperative’s actions only affect cooperative non-members. Nash equilibrium prices are
asymmetric with the cooperative having a higher price than the profit-maximizing firm. The
profit-maximizing firm’s price is higher than in the earlier model now that the cooperative is
allowed to sell to non-members. Whether the model’s predictions hold with K-group and S-
group is not investigated in this thesis but could be an interesting research pursuit.

- 55 -
In this thesis I have not used a general model but have rather used a particular utility function
and assumed no cost differences between firms. These give rise to restrictions on how results
can be applied to real-world considerations. However, if one accepts that the simplified model
has some resonance with real world activities I can present some tentative ideas on how a
cooperative changes a duopoly. The immediate effect is that cooperative marginal cost pricing
reins in the market power of the profit-maximizing firm. Thus, if consumers face a choice
between a duopoly of two profit-maximizing firms and a duopoly of a cooperative and a
profit-maximizing firm, they would be better off choosing the latter. If one takes the duopoly
structure in Finnish grocery trade as given, consumers should be pleased that S-group, due to
its cooperative setup, limits its own and K-group’s market power. If one takes a total surplus
point of view the answer is ambiguous. Either setting of duopoly can deliver higher levels of
total surplus. Which duopoly setting delivers a higher level of total surplus depends on how
much consumers value good variety and how ready they are to substitute one good for the
other.
If one takes mixed duopoly as given, profit, consumer utility and total surplus are all the
higher the more consumers value good variety and the less they are willing to substitute one
good for the other, i.e. low gamma. Policy makers can influence consumers’ willingness to
substitute. The most obvious way is zoning. The results of the model mean that S-group and
K-group stores should not be discouraged from locating at different locations based on
competition concerns. This is nontrivial because the current trend has seen an increase of
locating competing hypermarkets of both groups almost opposite of each other, which
decreases consumers’ choice of locations to shop at. Reasons for this kind of zoning include
environmental concerns or a desire to form a given urban framework. However, based on this
analysis such practice cannot be defended based on increased competition because due to S-
group’s assumed marginal cost pricing an increased possibility to substitute shopping from K-
group’s hypermarket to S-group’s hypermarket does not have a strong price effect.
In summary, S-group’s cooperative form decreases the adverse effects of duopoly and allows
consumers value a high level of variety without giving too much pricing power to the duopoly
firms. For these model results to hold S-group must keep its cooperative form. This is
important because if policy makers take a relaxed view on the duopoly setting, they must be
sure that S-group retains it cooperative form. Although a change in S-group’s setting is

- 56 -
presently a remote possibility, the Finnish depression in the 1990s caused one cooperative in
the grocery retail trade to change into a profit-maximizing firm.
An interesting topic for further research would be to analyze duopoly competition without
assuming a particular form for the consumer utility function. The linear demand system used
in this thesis has allowed me to explicitly formulate Nash equilibria. However, any
conclusions are only indicative and would be strengthened by treating the same problem with
a generalized utility function.
Expanding from a static setting to a dynamic model might also yield interesting findings. The
model used in this thesis only looked at one period and disregarded any investment and
saving decisions. However, because a profit-maximizing firm and cooperative firm maximize
different outcomes one could expect them to make investment decisions differently. S-group
might be content with breaking even on a given investment whereas K-group would need to
pass some hurdle rate on its return on investment. This would necessarily cause differences in
how the two expand.
An analysis of the institutions of cooperatives in general and S-group in particular would be
interesting to read. Looking into how S-group’s institutions perform from a cost efficiency
point of view but also in channeling members’ desire into S-group decision making might be
worth looking into. Comparing a cooperative’s structure to that of a publicly listed firm
(maybe as a case study between K-group and S-group) could also be productive.
Investigating different cost structures and their effects on equilibrium would also be an
interesting undertaking. One reason for the profit-maximizing firm’s prevalence is that it is
generally so effective compared to other forms of organization. However, in this thesis I have
assumed no differences in cost structures. This is warranted because S-group does not seem to
be any more cost inefficient than K-group. It might even be that the opposite is true. In fact, it
might be interesting to see how equilibrium changes in the face of a cooperative that is more
efficient than its profit-maximizing counterpart. This relates to a more general question.
Marginal cost pricing seems to be attainable not only in a perfect market setting but also when
a firm is organized as a cooperative. Generally, I would assume that the drawbacks of a
cooperative structure involve not only cost inefficiencies but also difficulties in formulating a
coherent strategy. After all, defining goals for a cooperative is more difficult than simply

- 57 -
asking for profit maximization. However, the example of S-group shows that a cooperative
structure can succeed in grocery trade. From a Finnish consumer’s point of view this is
fortunate since the cooperative structure lessens the adverse effects of market concentration.

- 58 -
10. Literature
Aalto-Setälä, Ville (2002), “The effect of concentration and market power on food prices:
evidence from Finland”, Journal of Retailing, Vol. 70, No. 3 (Aut. 2002), pp. 207-216
Anderson, Richard K., Porter, Philip K. and Maurice, S. Charles (1979), “The Economics of
Consumer-Managed Firms”, Southern Economic Journal, Vol. 46, No. 1 (Jul. 1979), pp. 119-
130
Bulow, Jermery I., Geanakoplos, John D. and Klemperer, Paul. D. (1985), “Multimarket
Oligopoly: Strategic Substitutes and Complements”, The Journal of Political Economy, Vol.
93, No. 3 (Jun. 1985), pp. 488-511
Co-operatives Act 1488/2001 (2009), Finnish legislation,
http://www.finlex.fi/en/laki/kaannokset/2001/en20011488.pdf, retrieved 31.3.2010
Dixit, Avinash K. and Stiglitz, Joseph E. (1977), “Monopolistic Competition and Optimum
Product Diversity”, The American Economic Review, Vol. 67, Issue 3 (Jun. 1977), pp. 297-
308
Einarsson, Ágúst (2008), “The retail sector in the Nordic countries: A description of the
differences, similarities and uniqueness in the global market”, Journal of Retailing and
Consumer Services, Vol. 15, No. 6 (Nov. 2008), pp. 443-451
Enke, Stephen (1945), “Consumer Cooperatives and Economic Efficiency”, The American
Economic Review, Vol. 35, No.1 (Mar. 1945), pp. 148-155
Hansmann, Henry (1996), The Ownership of Enterprise, Cambridge, Massachusetts
Hansmann, Henry (1999), "Cooperative Firms in Theory and Practice”, Finnish Journal of
Business Economics, No.4, pp. 387-403

- 59 -
HOK-Elanto (2009), HOK-Elanto vuosikertomus 2008 (English: Annual report 2008),
http://www.hok-elanto.fi/fileadmin/HOK_Elanto_yrityksena/Muut/
HOK_Elanto_Vuosikertomus.pdf, retrieved 5.3.2010
HOK-Elanto (2010a), Welcome as a new member of Helsinki Co-operative Society Elanto,
http://www.hok-elanto.fi/fileadmin/S_Etukortti/Pdf/
HOK_Elanto_Welcome_as_a_new_member.pdf, retrieved 5.3.2010
HOK-Elanto (2010b), HOK-Elannon markkinaosuus nousi 40.9 prosenttiin, (English: Market
Share of HOK-Elanto Increased to 40,9 per cent. Only available in Finnish), http://www.hok-
elanto.fi/index.php?id=3837, retrieved 31.3.2010
Holmström, Bengt (1999), "Future of Cooperatives: A Corporate Perspective”, Finnish
Journal of Business Economics, No.4, pp. 404-417
Hotelling, Harold (1929), “Stability in Competition”, The Economic Journal, Vol. 39, No.
153 (Mar. 1929), pp.41-57
Ireland, Norman J. and Law, Peter J. (1983), “A Cournot-Nash Model of the Consumer
Cooperative”, Southern Economic Journal, Vol. 49, No. 3 (Jan. 1983), pp. 706-716
Jones, Derek C. and Kalmi, Panu (2009), “Co-operatives and Employee Ownership”,
International Encyclopedia of Civil Society, pp. 557-563, Springer New York
K-group annual reports (2000 to 2008), Keskon vuosi (only available in Finnish),
http://www.kesko.fi/index.asp?id=C8F926B0E7054CFE8893C73D379DAF27, retrieved
16.12.2009
Kalmi, Panu (2006), “The Disappearance of Co-operatives from Economics Textbooks”,
Helsinki School of Economics Working Papers, W-398
Limited Liability Companies Act 624/2006 (2009), Finnish legislation,
http://www.finlex.fi/en/laki/kaannokset/2006/en20060624.pdf , retrieved 31.3.2010

- 60 -
National Consumer Research Centre (2010), Elintarvikkeiden alv-alennus ja hintakehitys,
(English: The VAT reduction and the price development of foodstuffs. Only available in
Finnish), http://www.kuluttajatutkimuskeskus.fi/files/5433/2010_01_julkaisu_alv.pdf,
retrieved 31.3.2010
Peltola, Heikki (2009), “Kauppakisan voittajat ja voitetut” (English: The winners and losers
of grocery competition. Only available in Finnish), Kaupasta kaikille, Kuluttajatutkimuksen
kirjoja 5, pp. 37-48, Helsinki 2009
Päivittäistavarakauppa ry (2009), Päivittäistavarakauppa 2009-2010 (English: Grocery trade
2009-2010. Only available in Finnish), http://www.pty.fi/fileadmin/pty_tiedostot/
Julkaisut/47929_PTY_vuosikertomus.pdf, retrieved 21.12.2009
Seppänen, Esko (1993), Punapääoman romahdus (English: The Collapse of Red Capital.
Only available in Finnish), WSOY, Porvoo
Singh, Nirvikar and Vives, Xavier (1984), ”Price and quantity competition in a differentiated
duopoly”, Rand Journal of Economics, Vol. 15, No. 4 (Winter 1984), pp. 546-554
S-group (2007), SOK-yhtymän hallintotapa ja johtamisjärjestelmä (English: SOK corporate
governance. Only available in Finnish), http://www.s-kanava.fi/getbinary?siteId=1&src=/
kuvat/skanava/liitetiedostot/2009/viestinta_Corporate_Governance_2007_fi.pdf, retrieved
17.12.2009
S-group (2009a), SOK-yhtymä: Vuosikertomus 2008 (English: SOK annual report. Only
available in Finnish), http://www.s-kanava.fi/getbinary?siteId=1&src=/kuvat/skanava/
liitetiedostot/2009/Vuosiraportointi_2009/SOK_Vuosikertomus_08.pdf, retrieved 15.12.2009
S-group (2009b), S-ryhmä tänään, (English: S-group today. Only available in Finnish),
http://mediapalvelu.s-kanava.fi/s-ryhma/aineistopankki/fi_FI/aineistopankki/_files/
82089551893367828/default/S_ryhma_tanaan_2008_200309.pdf, retrieved 17.12.2009

- 61 -
S-group (2010), website for a regional cooperative, https://www02.s-kanava.net/
liityasiakasomistajaksi/LiityAsiakasomistajaksi.do (Only available in Finnish), visited
5.3.2010
Suomen Lähikauppa Oy (2008), Tilinpäätös 2008, (English: Financial Statements 2008. Only
available in Finnish), http://www.lahikauppa.fi/client-data/file/tilinpaatostiedote_08.pdf,
retrieved 5.3.2010
Talma, Arja (2009), Kesko Oyj Roadshow, (presentation by CFO to investors in London
20.11.2009),http://www.kesko.fi/modules/upndown/download_upndownfile.asp?id=AB0AC5
9770D041C786E89D854F757064&itemtype=UPNDOWNFILE, retrieved 17.12.2009
Thompson, David (1994), “Cooperative Principles Then and Now”, The Cooperative Grocer,
No. 43, July-August 1994, available at http://www.cooperativegrocer.coop/articles/
index.php?id=158, retrieved 8.3.2010
United States Department of Justice and the Federal Trade Commission (1997), Horizontal
Merger Guidelines, http://www.justice.gov/atr/public/guidelines/hmg.htm, retrieved
21.12.2009
Vihma, Päivi (2009), S-Kauppa vyöryy yli Suomen (article in Talouselämä magazine
18.3.2009), http://www.talouselama.fi/uutiset/article256290.ece?s=l&wtm=talouselama/-
18032009#, retrieved 21.12.2009

- 62 -
11. Equations
(4) Equation
xyp
pxyy
yxp
pyxx
demandsinversesolvetoCOF
ypxpyyxxyx
ypxpxyU
y
y
x
x
yx
yx
22
22
11
11
22
2121
0
0
)(..
2/)2(
),(
y
d
x
b
x
d
y
b
yx
yx
yx
y
y
ppx
Similarly
ppy
yypp
ypy
p
pyxyxp
pyx
xyp
demandsdirectSolve
221
221
22
21
212
221
221
12
21
121
2211211
2211
2211
22
22
1
2
//*
//

- 63 -
(5) Equation
xcypyyxxyx
yyxxyxyxUxcypyxU
cpxypxpyxU
cpxypxpyxU
xyp
xyp
xxyxp
xxyxp
x
x
x
x
2/)2(max
2/)2(),(//),(max
)(),(max
)(//),(max
22
2121
22
2121
(6) Equation n/a
(7) Equation
x
slope
yxyy
yxy
yxy
yyxy
yyxy
y
yyxy
yyxy
xyyy
yyyp
pc
ppRC
cpp
cppcppp
cppp
dpdCOF
cppp
cppp
ppycpy
ycypypy
11
121
11
121
11211
11121
11121
1121
2212
212
21
12
21
121
221
221
12
21
121
222)(
222
20)(
//*0)(
).(..
))((
0//))((
//)(
),(max
(8) Equation
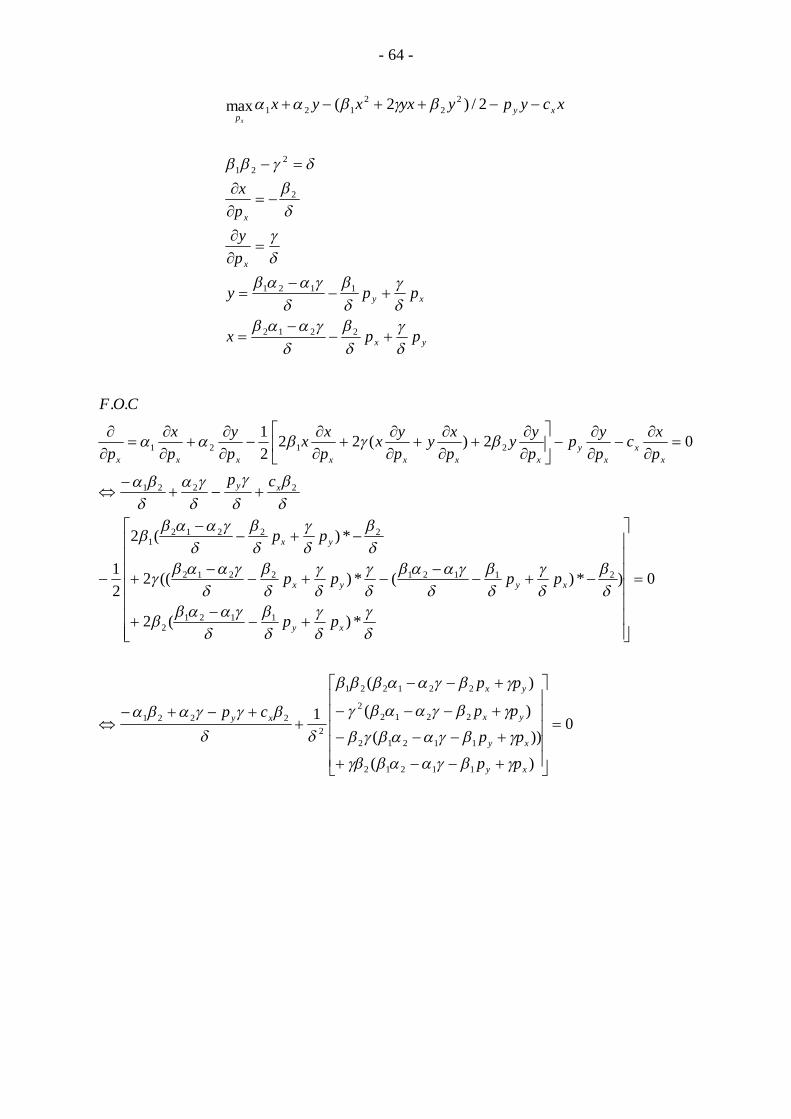
- 64 -
yx
xy
x
x
xyp
ppx
ppy
py
px
xcypyyxxyxx
2212
1121
2
221
22
2121 2/)2(max
0
)(
))()(
)(
1
0
*)(2
)*)(*)((2
*)(2
21
02)(2221
..
11212
11212
22122
221221
22221
11212
211212212
222121
2221
2121
xy
xy
yx
yx
xy
xy
xyyx
yx
xy
xx
xy
xxxxxxx
pp
pppp
pp
cp
pp
pppp
pp
cppxc
pyp
pyy
pxy
pyx
pxx
py
px
p
COF

- 65 -
0)(*)(1
01
01
22122
2122221
3222
31
22
212212211
221
22221
22211
22221
2221
212221
32
22
312
2
212212211
221
22221
yxxy
yx
yxxy
xy
xy
yx
yx
xy
ppcp
pp
ppcp
pp
pp
pp
pp
cp
xx
xx
yxxy
yxxy
yxxy
cppc
ppcp
ppcp
ppcp
00
//*0
0
22
22122221
22122221
221222221
(9) Equation
0,0//0
)(
))((
//)(
),(
2212
21
2
221
221
221
12
21
121
221
221
12
21
121
yx
yyx
yyxy
xyyy
yyy
pp
cpp
cppp
ppycpy
ycypyp
(10) Equation

- 66 -
xNx
xx
xyN
y
xxx
slope
yxyy
cpcRC
cc
p
cPpc
ppRC
11
121
11
121
222
//222
)(
(11) Equation
yx
xyx
xyx
Ny
Nx
Ny
Nx
xy
xxy
Nx
Ny
Ny
Nx
cc
ccc
ccc
ppppx
Similarly
cc
ccc
ppppy
221
22
21
222
21
212
122
112
221
212
212
121
221
221
22
21
212
11
1212
212
21
22
21
212
221
221
22
21
212
221
21
221
121
221
12121
221
221
112121
221
121
221
221
12
21
121
)(
)222
(
),(
)(
)(
),(
1
2
1
11
(12) Equation
- 67 -
1
21121
1
11211121
11
1
1
12121
121
12121
11
12121
121
12121
11
121
221
21
121
12121
4)(
4))((
)222
)()(
(
)222
)()(
(
222
,,)(
//)(),(
xy
xyxy
xy
xy
yxy
xy
xyN
y
xy
yyy
cc
cccc
cc
cc
ccc
cc
cc
p
ccycpyyp
(13) Equation
221
21
12121
2
21
21
12121
2222
121
221
12
2
2222
121
221
121
2
21
121
1212111
112
2222
121
221
121
22
2121
221
11
121
221
21
221
121
221
12121
221
2
221
222
21
212
122
112
22
2121
)(
)()()()(2
)()()(
21
)()
222(
)()()()(
2/)2()()(
;222
)(
)(
//2/)2(
1
2
1
1
2
1
1
2
1
1
2
1
xy
xyyx
yx
xy
xy
yxx
yx
xNxx
yNy
xy
y
x
xy
cc
cccc
cc
ccc
c
cccU
yyxxypxc
cpcc
p
ccy
c
cx
xcypyyxxyxU
(14) Equation n/a

- 68 -
(15) Equation
2
22
2
222
22
222
3223223
222
2222
22
22
2
)(2
)()()(
2
)(2
2
)(22422
2
)()2(2))(2(
2),(
)(2
2),(
)(2),(
Ny
Nx
Ny
Nx
Ny
Nx
ppx
ppx
ppy
(16) Equation
2
2
2
2
2
2
2
2
)(2
)(2
4
)()()(
4),(
)()(
4
)(4)(),(
yp
yp
y
y
(17) Equation

- 69 -
)(8)35(
)53)((
)(85
385)(8
2444)(8
24)41(4
)(8
24)21(4
)(8
)24()(
)()21(4
)()(8
)24()(
)()21(4
)(8
)8
24()(
281
)(
2
2
2
222
2
22222
2
22222
2
2222
2
222
22
22
2
222
22
222
2
222
222
222
2
U
2
2
2
2
2
2
2
2
)(4
)(4
)(2
8
)(35)(3
8U
(18) Equation n/a
(19) Equation

- 70 -
yxNx
xyNy
xyy
xyy
xyy
xyy
yxy
y
yxy
y
yx
yxxy
xy
yx
yxx
xy
xyy
ccp
Similarly
ccp
ccp
ccp
ccp
ccp
pccp
pccp
pcpppc
pp
pcppRC
pc
ppRC
221
12
21
212
21
2112211
'
221
22
21
212
21
2221212
'
221
22
21
212
21
222121212
'
221
22
21
212
21
2121212'
21
2
21
21
21
2121212
21
2
'
121
212
1
121
21
2
'
'21
2
121
212
1
121'
'22
212
11
121'
'22
212'''
11
121''
'22
212'''
'11
121'''
442
42
442
42
442
422
442
4)()(2
442
4)()(2)
41(
44)(
22)
41(
444)(
22
)222
(222
222)(//
222)(
222)(
222)(
(20) Equation

- 71 -
)4(22
)(),('
)4(22
)(),('
)4)((22
)4)((222
)4)((44
)4)((222
)44
24
2(
)44
24
2(
442
42
442
42
//),('
221
2122
1122
12112
21
2''
221
2122
2212
22122
21
1''
221
221
21
2212
21211
2212
212
221
221
21
31
212211212
21
2122112
212
221
221
31211
2212
212
221
221
21
31
212211212
21
2122112
212
221
121
221
12
21
212
21
2112211
221
221
22
21
212
21
2221212
221
1
221
121
221
12
21
21
221
2112211
'
221
22
21
21
221
2221212
'
'221
'221
12
21
121''
xxyNy
Nx
yyxNy
Nx
yxy
yxy
yxy
yx
xy
yx
Nx
xy
Ny
Nx
Ny
Ny
Nx
cccppx
Similarly
cccppy
ccc
ccc
ccc
cc
cc
cc
p
cc
p
ppppy
(21) Equation

- 72 -
)2()2()2(
)2())(2(
)2(
)4)((
)',(
)2()2()2(
)2())(2(
)2(
)4)((
)2(
)2(
)2()2(
)2(
)2(
))(2(
)2)(2(
)2(
)4)((
)',(
))44
24
2(*
)4
)2()()2((
)44
24
2('
442
42
)4(22
)(),('
//)(')',(
2211
2221
2221
3221
21
2112211
211
2112211
22112211
2221
221
2
''
2212
2221
2222
3221
22
2221212
222
2221212
22221212
2221
221
1
2212
2221
2
2221212
221
222
3
221
22
2221212
22
22
221212
221
2221212
22221212
2221
221
1
''
221
22
21
221
221
2221212
221
221
22
2221212
221
1
221
22
21
221
221
2221212
221
22
21
212
21
2221212
'
221
2122
2212
22122
21
1''
'''
yxxyxy
xx
Nxx
yxyxyx
xx
yx
y
y
x
yx
x
x
y
Nyy
xy
yx
xy
xyNy
yyxNy
Nx
yNy
Nyy
cccccc
cc
xp
Similarly
cccccc
cc
cc
c
cc
cc
c
c
c
yp
cc
cc
ccy
ccp
cccppy
cpyyp
(22) Equation

- 73 -
221
22221
222121
2122
2212
2212
2122
1122
1211
221
22112
212112
2221
2221
21
2122
2212
2212
1112
2221
221
21
2122
1122
1211
2221
2221
221
21
22
21
1112221
2
2221221
1
22
21
2212
2212122
2212221
1212
1122112
1211221
22
2121
221
1
221
212
21
2112211
'
221
2
221
212
21
2221212
'
221
2122
2212
2212
221
1''
221
2122
1122
1211
221
2''
22
2121
)22(
)22(*
)22(2
)22(
)4()(2
)22(*
)22(
)4)((
)22(*
)22(
)4)((
2/)2(
)22(4
)22(4
2/)2(
)224(4
)224(4
2/)2()()(
4
42
42
4
42
42
)4(22
*
)(),('
)4(22
*
)(),('
//2/)2(
yyx
yyx
xxy
xxy
yyx
xy
xxy
yx
xy
yx
xy
yx
yx
y
xNx
x
yNy
yyx
Ny
Nx
xxy
Ny
Nx
xy
ccc
ccc
ccc
ccc
ccc
cc
ccc
ccyyxx
ccy
ccxyyxx
ccy
ccxyyxxpypx
c
cp
c
cp
ccc
ppy
ccc
ppx
xpypyyxxyx
U

- 74 -
(23) Equation
2
222
22
22
22
222
22
222
3223322
222
3223322
222
2222
222
2222''
22
22
''
)2(
)2)(44()44(
)2()2()44(
)4()44(
)4(284224
)4()284(224
)4()4)(2()2(2
)4()2)(2()4)(2(
42
Nx
Ny
Nx
Ny
pp
pp
(24) Equation
22''''
22
22''''
)2()()2()),('()),('(
2)2)(()2)(2()2(
)(
)4())(2(
))((),('),('
Ny
Nx
Ny
Nx
Ny
Nx
Ny
Nx
ppxppy
ppxppy

- 75 -
(25) Equation
0)2()(
2
)2()(222
)2()(33)22(
)2()()(3)2)((
)2()()3)(()2)((
)2()()222)(()2)((
)2()())2()(2)(()2)((
)2()())2())(2(2)(()2)(())',(())',((
)2)(()(
)2()2)()(()()2(
)4)(()()2(
)2()4)((
)',()',(
32
2
0
22
32
222
32
2222
322
322
322
322
42
222''''
2
2
22
222
22222
222
22222222
2
''''
xpyp
xpyp
Nxx
Nyy
Nxx
Nyy
(26) Equation n/a
2222
2222
22
222222
222
222
222
2222
222
22
222
2222
222
22222
222
2
222222222222
22
2221
222
222222
)2)((1
)2)((2
)2()2()()()()2)((
)2()2()()())(2)()()(2(2
))4(
)2)(()4(
)2)()(2(2)(
))4(
)2()()4(
)2)()(2(2)(
)2()2()4()(
)4()()2)(2)((2U

- 76 -
3222
3222
42
222
2
22
)2()(3
)2()()222(
)2()()))(2(2)2((
)2)((U
U
(27) Equation
rootsrealno
UTSUTS
//)2()(
474)2()(
444)2()(
3)2()(
)(4)2()(
3
2
2
32
222
32
222232
32
22
32
222
32
22
(28) Equation n/a

- 77 -
(29) Equation
2
22
2
22
22
22
22
22
223
22
3223223
22
32222
222
2222
''
)2(
)2()2()2(
)2()2(44
)2()2(44
)2()2(44
)2()2(224284
)2()2()224()4)(2(
)4()2(2)4)(2(
)( Nx
Nx
Nx ppp
(30) Equation
xNx
xyN
y
yxNx
xyNy
cp
cc
p
duopolyMixed
ccp
ccp
duopolyNormal
11
121
221
12
21
212
21
2112211
'
221
22
21
212
21
2221212
'
222
442
42
442
42

- 78 -
xx
yy
xx
yy
Ny
Ny
cc
cc
cc
ccpp
12
21
2
221
21
1
1212
21
2221212
12
21
2
221
21
1
1212
21
2221212
'
24
242
242
24
242
242
xy
xx
yy
cc
cc
cc
0//0
22
21
21
212
122
121
0//0
221
221
32
12
221
2
221
221
212
21
21
221
312
1222
121212
221
2221212
221
1
1
221
1
1
)(4
42
4
42
42
422
42
2212
21
22
221
21
22
221
21
22'
)4(
//*4
4Ny
Ny pp

- 79 -
1)(
)(..
)2(
1
1
2
2212
212
21
2212
21
23
21
2212
41
21
dd
dd
COF
rootsfind
)21)((
)4(
)4(
22
2212
21
22'Ny
Ny pp
(31) Equation
)2132)(2(
)2()2(
21544
)4(
4212
21
21224
)4(
)4)(21()
21
21)(4(
)4(
)4)(21()
21)()(4(
)4(
)21)()(4(
)4()4()
21(
)4(
)21)((
)4(2)4()(
21)
21(
)4(
)(
322322
42234222
42233
43222234
222
2222222222
2222222
22222
22222
222
222
22
'Ny
Ny pp

- 80 -
)2
12)(2
12()2(
212
)2(
212)(2(
)2()2(
)2132(
)2()2(
293,0707,1
2
222
222
32232
(32) Equation (normal duopoly)
)4(2
)(),('
)4(2
)(
)4(22
)(),('
22
22
22''
22
22
22
221
2122
2212
22122
21
1''
Ny
Nx
yyxNy
Nx
ppx
Similarly
cccppy
(33) Equation (mixed duopoly)
22
221
21
221
22
21
222
21
212
122
112
2221
221
21
221
121
221
12121
)(),(
)()(),(
1
2
1yx
Ny
Nx
xyNy
Nx
ccppx
Similarly
ccppy

- 81 -
(34) Equation
)2
1)(2
1())(2(
))(2)(2
1)(2
1())()(2)(2(
))(21)(
21)(
21(
))(4(2
)424))(4(2
)22))(4(
)22))(4(
)2
2
24
))(4(
)2
2
24
))(4(1
)2(
)4)(())(4(
1
)4(2
)(),('),(
2222
4322342222
4213
212234
2222
4213
21223
2222
223
4212
321223
2222
223
4212
321223
2222
22
22221
21
2222
22
22
2222
221
21
''Ny
Nx
Ny
Nx ppxppx

- 82 -
(35) Equation
)21)((
)4)((
2)4)((
2)4)((2
2)4)((2
22444)4)((2
)2(2)4)(()4)((2
)4(2
)()(),('),(
2222
222222
222222
3222222
22332232222
22222222
22
22
222221
''Ny
Nx
Ny
Nx ppyppy
)2)((2
)21(
)21)(2)((2
)21(
)2)(2)((
)21(
)4)((
)21)((
)4)()((
22
22

- 83 -
(36) Equation
))(2(2))(2(
2))(2(2
222
))(2(
221
))(2(
2
)2
1)(2
1(
))(2(
))(2(2)
21)(
21(
))(2(
),('),(),('),(
)),('),('(),(),(
22
22
22
''''
''''
Ny
Nx
Ny
Nx
Ny
Nx
Ny
Nx
Ny
Nx
Ny
Nx
Ny
Nx
Ny
Nx
ppyppyppxppx
ppyppxppyppx

- 84 -
(37) Equation
22
22
22
22
22
22322
22
32233222
22
32232
22
22
22
22
22
22
22
''
)()2(
)21(
)()2(21
1
)()2(2122
)()2(21222
)()2(
)212())(2(
)()2(
)2)(21())(2(
)()2(
))()2)((21())(2(
/))(2(
21
/))(2(
21
/))(2(
)21()),('),(( N
yNx
Ny
Nx ppxppx

- 85 -
(38) Equation
22
22
22
22
22
222
22
22''
)()2(2)2(
)()2(2
2
)()2(222
2
)()2()2())(2(
2
)()2())()2(())(2(
2)),('),(( N
yNx
Ny
Nx ppyppy
(39) Equation
))4(
)2)(()4(
)2)()(2(2)(
)2)(()2)()(2(2)4()(
)2)(()4()(
)2)(2()4)((
2
)2()2)(2(2
)2(
)4()(2
)2)(2()4)((
)2)(2()4)((
222
222
222
2222
222
22
2222222222222
22
222222222
2
2222222
2
222
2222
222
222222
2
2222222
2
2222222
2

- 86 -
(40) Equation
2
22
22
222
222
2222
222
2
281
221
21
21
2221
21
21
222
221
2122
222
2
281
221
21
21
2221
21
21
222
2
222
222
2
221
2122
222
2
221
212
21
21
2221
21
222
21
22
221
21
22
)(8)(
24
281
4)(
)2)((21
)(
4)(
))((
)(
)()(
4)(
)(
))(()(
)(
)(2)(2
1
)()
2(

- 87 -
)8
24()(
281
)(
)8
)(2()(
281
)(
))(8
)(2()()(
281
4)2(
)(
))(8
)(2()(
281
)4
22)(2(
)(
))(84
1()(
281
)4
)(21)(2(
)(
222
222
222
2
222
222
222
2
2
2222
222
222
222
2
2
22222
222
22222
222
2
2222
222
2222
222
2

- 88 -
(41) Equation
)32)(24(
)252)(8
2(
2344)8
3(
)4()(
)22)(24(
)24)(2(81)816(
2))81)816((
)4()(
)2)()(2(2)8
24()()4(
)2)((281)4(
)4()(
)4()2)()(2(2
)4(
)8
24()()4(
)4()2)((
)4(
281)4(
)(
))4(
)2()()4(
)2)()(2(2)(
)8
24()(
281
)(
34322423
422344
23
4322344
223
222222
2
3422322423
22224224
222234224
222222
2
2222222
2222
2222222222
222222
2
222
22222
222
222222
222
2222
222
222222
222
2
222
2222
222
22222
222
2
222
222
222
2
normalmixed UU
)22264444128
)252)(8
2(
81
41
83
21
21
23442344
3691212
)4()(
435225346
34436257
422344
23
8765243
652433425
524334256
43342567
222222
2

- 89 -
5243
87
652
43342567
222222
2
5243
87
652
43342567
222222
2
435225346
34436257
865243
6433425
432567
8765243
652433425
524334256
43342567
222222
2
41
85
83
41
431171446
)4()(
41
85
83
41
431171446
)4()(
22264444128
41
85
41
81
25241042
81
41
83
21
21
23442344
3691212
)4()(

- 90 -
643
62534
752
86
5234
257
222222
2
643
752
86
5234
257
222222
2
643
752
86
5234
257
222222
2
4893
829
84
41
41
83
83
3366
)4()(
4893
41
41
83
4
37146
)4()(
4893
41
41
83
4
37146
)4()(

- 91 -
564
235
3223
45
22222
2
56234432522222
2
56325234422222
2
56325234422222222
2
346
436
4325
5632522
222222
2
41
83
829
5233
44
)4)((
41
8384
82936
)4)((
41
83368
8294
)4)((
)41
83368
8294)((
)4()(
44829
829
88
)41
8336)((
)4()(

- 92 -
))((
)(85
)(6
)4)((
))((
85
85
66
)4)((
)85)((
8566
)4)((
)8332(
8566
)4)((
8332
8566
)4)((
8332
8332
4134
)4)((
)8332)((
4134
)4)((
)8332)((
)4134)((
)4)((
224222
54
224
222
2
224222
54
224
222
2
4224222
4224
222
2
4224
4224
222
2
533
4224
222
2
533
4224
4224
222
2
423
4224
222
2
42322
4224
22222
2

- 93 -
))((8
5
)(6
)4)(()(
)))((()(85
)(6
)4)(()(
))())(((
85
)(6
)4)(()(
)))(()()((
)(85
))((6
)4)((
))()((
)(85
)(6
)4)((
222
3
3
222
2
2
4
2
222
2
22
4
2
222
2
222
4
2
222
2
222222
4
222
222
2

- 94 -
(42) Equation
)2)(2()(2
25
6
)4)(()(
))((8
5)(6
)4()(2242
)2)(2()(2
25
6
)4)(()(
))((8
5)(6
)4()())(4)4)((()4)(()4(
)2)(2()(2
25
6
)4)(()(
))((8
5)(6
)4()())4(4)(()4)((()4)((
))((8
5)(6
)4)(()(
))((8
5)(6
))4)((
)(()(
22
2
3
3
222
2
222
4
3
3222
32232
22
2
3
3
222
2
222
4
3
42222
2222222
22
2
3
3
222
2
222
4
3
42222
2222222222
222
4
3
222
2
222
4
3
222
2
normalmixed UU
- 95 -
527643
34524325
34524325
634257
3222
2
52674334
344352256
435263425
25344367
3222
2
23234222243222
2
22343432233222
2
222323223222
2
22343432233222
2
2323222
2
2234343222
32232
42338
1661232
42338
1661232
)4()(
84233224
84233224
42431612
16836448
)4()(
)42338)(44(
)4()(
)28386)(4428(
)4()(
)4)(42338)((
)4()(
)28386)(224(2
)4()(
42338
)4)(()(
28386
)4()(2242
024186244116
)4()(2433425
0
663222
2

- 96 -
32332
2
3233
332
2
3233332
2
32333222
2
34223423222
2
32423532453222
2
4233533
2353245
3222
2
68)2()(4
21216()21(
)21()2()(8
21216()21(
)2()2()(
21216()21(
)4()(
)412816()21(
)4()(
)61621161616)(
21(
)4()(
24212
)1621161616)(
21(
)4()(
(43) Equation
22222222
2
2212
2221
2222
3221
22
2221212
222
2221212
22221212
2221
221
1
''
)2()4)((
)2()2()2(
)2())(2(
)2(
)4)((
)',(
yxyxyx
xx
Nyy
cccccc
cc
yp
(44) Equation
2
222
2222
2
22
22
2211
21121
4)4()(
)4)((
)(4)(
)(4)(
),( xyy
ccyp

- 97 -
(45) Equation
2
222222432234
22222
2
2
2222222
22222
2
2
2222
22222
2
22222222
2
''
4)4()(2244
)4)((
4)4()()2(
)4)((
4)4()(
)4)((
)2()4)((
),()',( ypyp yNyy
2
2222222
222
2
2
2222
2222
222
2
2
2222222222
22222
2
2
222243223224
22222
2
4)4)(()()4(
)4)((
4)4()(
)())(()()4(
)4)()((
4)4()()()()()4(
)4)((
4)4()(2244
)4)((

- 98 -
4)2)((4
)(
4)2)((4
)(
)44(4)2)((4
)(
)2(4)2)((4
)(
4)2(1
)2)(()(
4)2)(()(
)2)((
4)2)(2)(())(2(
)2)(2)((
4)2)(2)(()2(
)2)(2)((
4)2()2)(()2()2)(2(
)2()2)((
4)4)((2)4(
)4)((
2
2
22
2
2222
2
222
2
2
2
2
2
2
2
2
2
2
2
2
2
2
22
2
2
2
222
22
2
2
2223222
222
2

- 99 -
(46) Equation
)2)()(()4)(32()2()(4
)2()(4)2)()(()4(
)2()(32
4
)2)((4)()4(
)2()(32
4
)2)((4)()4(
)2()(33242422
4
)2)((4)()4(
)2()(3)22)(2(
4
)2)((4)()4(
)2()()(3)2)()(2(
4
)2)((4)()4(
)2()())(2)2)((()2)()(2(
4
)2)((4)()4(
)2()())2)((2)2)((()2)()(2(
4
4)2)((4
)()4()
)2)((4)((
)),()',((
32332
2
32
2
32
3232
2
2
32
3232
2
2
32
32322222232
2
2
32
32222
2
2
32
22
2
2
32
2
2
2
42
222
2
22
2
'' ypyp yNyy
0
2
515
22
8,1
5132
2
232332
2
2233432
2
22343
4223334
32
2
23
4223334
32
2
2232332
2
)54
1511
()1
1(4)2()(2
284)2()(2
42168)2()(4
22324128
)2()(4
)2)((324128
)2()(4
)2)(()4)(32()2()(4

- 100 -
(47) Equation
normalnormalmixednormalmixed
normalnormalmixedmixed
normalmixed
UUUU
TSTSTS
)()()2()(
)2)((8
5
)(6
)4)(()(
22
3
3
222
2
normalmixed UU
2222
2
2
2
)2)(4(41
)4)(()(
4)2)((4
)()( mixednormal
normalmixed
2
2222
222
2
222222
2
22222222
2
)()2(
)4)(()(
)2()4)()((
)2()4)((
normal

- 101 -
2
2222
2
22
3
3
222
2
2
2222
2
22
3
3
222
2
2
2222
222
2
2222
2
22
3
3
222
2
)()2(
)2)(4(41
)2)((8
5
)(6
)4)(()(
)()2(
)2)(4(41
)2)((8
5
)(6
)4)(()(
)()2(
)4)(()(
)2)(4(41
)4)(()(
)2)((8
5
)(6
)4)(()(
normalmixed TSTS

- 102 -
22
22
3
3
222
2
22
2
22
3
3
222
2
2
222
2
22
3
3
222
2
)2)(41(
)2)((8
5
)(6
)4)(()(
)2(
)2)(4(41
)2)((8
5
)(6
)4)(()(
)()2()(
)2)(4(41
)2)((8
5
)(6
)4)(()(

- 103 -
)2
12()2
12()2)((2
)(
)2
12)(2
12)(21)(2(
)2()2)(()(
)2
12)(2
12()21(2
)4)(()(
8122
)4)(()(
2812
)4)(()(
4441
4422
85
)(6
)4)(()(
)44)(41(
228
5
)(6
)4)(()(
0
2
2
22
2
2222
2
43224222
2
2234
222
2
234
322
223
3223
3
3
222
2
222
3223
3
3
222
2

- 104 -
(48) Equation
42
2222
222
2
42
22
2
2
42
22
2
2
42
2
2
2
2
2
)2()(
))(24(44)2
122
122
122
12)((
)2)())(21)(()
212
212
212
212((
2
)2()(
))(24(44)2
12)(2
12)((
)2)((*))21)(()
212)(
212((
2
)2()(
))(24(44)2
12)(2
12)((
)2)((*
))4
122
12()
412
212
()()2
12)(
212
((
2
)2()(
))(2(2)2()2
12)(2
12)((
)2)((*
))2
12(
212
)2
12(
212
)()2
12)(
212
((
2
/)2)((
)2
12)(2
12(*)(
2)( normalmixed TSTS

- 105 -
32
22
22
2
42
22
222
2
42
222
222
2
42
222
22222
2
42
222222
22222
2
42
222222
222
2
)2()()44)((3
)2)()(368(
8
)2()(
)2)(44)((43
)2)()(43
232(
2
)2()(
2)44)((43
)2)()(43
232(
2
)2()(
2)44)((43
)2)()(21
21
41(
2
)2()(
224444)41)((
)2)()(21
21
41(
2
)2()(
224444)41)((
)2)())(21)(()
41((
2
32
32232
32
322342
32
4322
3223
4322
3223
2234
2
)2()(3288
4
)2()(641616
8
)2()(3121231212
3366612
8816
8

- 106 -
32
222
32
22
2
32
3223
2
)2()()345,86,0)(86,1(
2
)2()(
345,0//)2
12)(
212
(2
)2()(83
41
2
zzzz
(49) Equation
yxyy
yxy
yxyyxy
yyxy
xyyy
yyyp
pppp
ppp
cccppp
cppp
ppycpy
ycypypy
2
222121
1121
2212
212
21
12
21
121
221
221
12
21
121
))((
,0,,//))((
0//))((
//)(
//),(max
(50) Equation n/a

- 107 -
(51) Equation
22
2
2
22
22
22
21212
22
121
2
)2
(2
)(
)22
(
2
22
)2
(2
)22
(
//)22
(2/)2(
)22
(2/)2(
22)(//2/)2(
0,,//2/)2(max
x
x
xx
x
x
x
xx
x
x
xxyy
yxxyp
px
p
ppx
py
p
p
ppy
pyyyxxyx
pyyyxxyx
pppypyyxxyx
ccxcypyyxxyxx
0222
0)2
()22
(2/)2)(22()(
..
yppy
py
pyy
ypxx
py
pxx
py
px
yppy
pyyy
pxx
py
pxx
py
px
p
COF
xxxx
xx
xxx
xxxxxxxxx

- 108 -
xxxxxx
xxx
xx
x
xxx
xx
x
pppppp
okppp
pp
p
ppp
pp
p
4442
4)2(
4)2(
4
444
4)2)((
4)(
2)(
4)2)((
2)2)((
22
//0444444
4)2(
4)2)(()
24(
4)(
2)(
)4
)2((4
)2)((2
)2)((22
02
)22
(22222
)22
(
)22
)(2
())2
(2
)((2
)2
))(2
(2
)((2
)2
(
2
2
22
2
224
2
23
2
2222
22
2
22
2
23
2
3
2
2
2
22
2
2222
2222
2
2
2
22
2
23
2
23
2
2
2
4
2
3
2
2
2
222
2
22
2
2222
22
222

- 109 -
))((//)(2)()()(2
)2)()((2242
2473
)(2)()()(2)2)((2)2)((2
2422473
42)2(2)2(
4)(2
4)(
4)(
2)(
4)2)((2
2)2)((
22
42
44)2(2
4)2(
4)(2
4)(
4)(
2)(
4)2)((2
2)2)((
22
232
22
22
24224
232
2222
22
24224
2
222222222
222
3
2
2
2
22
2
222
2
2
2
2
22
2
222
2
222
22
3
2
2
2
22
2
2222
x
x
x
xxxx
p
p
p
pppp

- 110 -
0)2()2(
)(
)()2)()(2)((
))((
)(45
))((45
)(
22245
)(2
2)(45
)(
2)2242242)((
22473)(
))((22)2)((2
)(2)(4)(2
)(2473)(
0
4224
234224
232324224
232
2
4224
232
22222
4224224
232
22
22
2224224
x
x
x
x
x
x
x
x
p
p
p
p
p
p
p
p

- 111 -
(52) Equation
0)2)(2(
2)(
)2)(2(2)(
)2)(2(42
2)(
)2)(2()2)(2(4
2)(
)2)(2()2)(2()2)(2(
2)(
)2)(2(1
2)(
)2)(2()(
2)(
2
)2)(2()(
2)(
2)(
)2)(2()(//
22)(
0)2()2(
)(
22
22
22
222
2
2
2
0
xy
xxxyy
x
pp
ppppRC
p

- 112 -
(53) Equation
deq
BertrandgStackelber
..
210
2122
21
42
21
)2)(2(2
2)(
)2)(2(2)(
2
2222
22
22
22
22
(54) Equation n/a
(55) Equation n/a

- 113 -
(56) Equation
ym
ym
ym
ymmm
ym
ymm
mmy
mmy
mmmmy
mmyymmm
m
mmmm
m
m
px
px
px
pyyx
py
pyy
yyp
yyp
yxxyp
xyppxyyU
yxyxxU
membersCOF
2222
2222
222
2222
2222
2222
22
22
2
)()(
)()()(
//
//*
//
0
0
)(..
(57) Equation
yxr
xyr
ppx
ppy
membersnonCOF
222222
222222
)(..

- 114 -
(58) Equation
xxy
xy
xy
yxyy
xyy
ym
xyr
rmy
rymyp
ppp
pp
pp
pppp
COF
ppp
py
ppyyyp
ypypy
42)(
)(24
)(24
022)(2..
)2)(2(
//)(
max
222222
22222222
222222
2222
222222

- 115 -
(59) Equation
yyx
xy
xyx
xr
rxx
r
x
my
x
mm
x
mm
x
mm
x
mm
x
m
x
m
x
m
x
m
ym
x
r
yxr
x
m
ym
xrmymmmmmmmp
ppp
pp
ppp
pa
axa
a
xa
appx
aa
pyp
pyy
pxy
pyx
pxx
py
px
pU
COF
py
py
px
ppx
px
px
pxa
aypyyxxyxUx
22)(
2
)1()1(
0)1()1(
)2)(22(
..
0
0
//)1()2(max
22
22
21
22
2221

- 116 -
(60) Equation
)8()4)((
)8(2)28)((
)8(2)2)((
)8(2)8)((
)8(2)2)((
2
8)2)((2//
42)(
8)2)((2
8)(2)(4
42)
88(
842
842
)42
(22
42)(//
22)(
22
22
222
2222
22
22
22
22
22
2
2
2
22
2
2
2
2
2
2
2
2
Ny
xxxy
Nx
x
x
xx
x
x
xxyyyx
p
pppp
p
p
p
pp
p
p
pppppp

- 117 -
(61) Equation
...
022
828
18
)212(4
28
)212)((2
2
2
222
22
:
:
22
deq
memberstoonlysalesecooperativduopolymixed
membersnontoalsosalesecooperativduopolymixed
(62) Equation
deq
membersnontoalsosalesecooperativduopolymixedduopolynormal
..
230
21
2124
214
)2)(212()8(
21
)2)(2)(212()8)(2(
21
)2)(2)(212()8)(
21(
)4)(212()8)(
21(
8
)212(
4
)21(
8
)212)((2
4
)21)((2
2222
22
22
22
2222
2222
:
2222
(63) Equation n/a