consumer discretionary reza aditya hakan altan adam barrick peter manuselis
TRANSCRIPT

Consumer DiscretionaryReza Aditya
Hakan Altan
Adam Barrick
Peter Manuselis

Agenda
• Sector Recommendation Recap
• Stock Selected Overview
• Financial Analysis
• Valuation Analysis
• Stock Recommendation

Current SIM Holdings
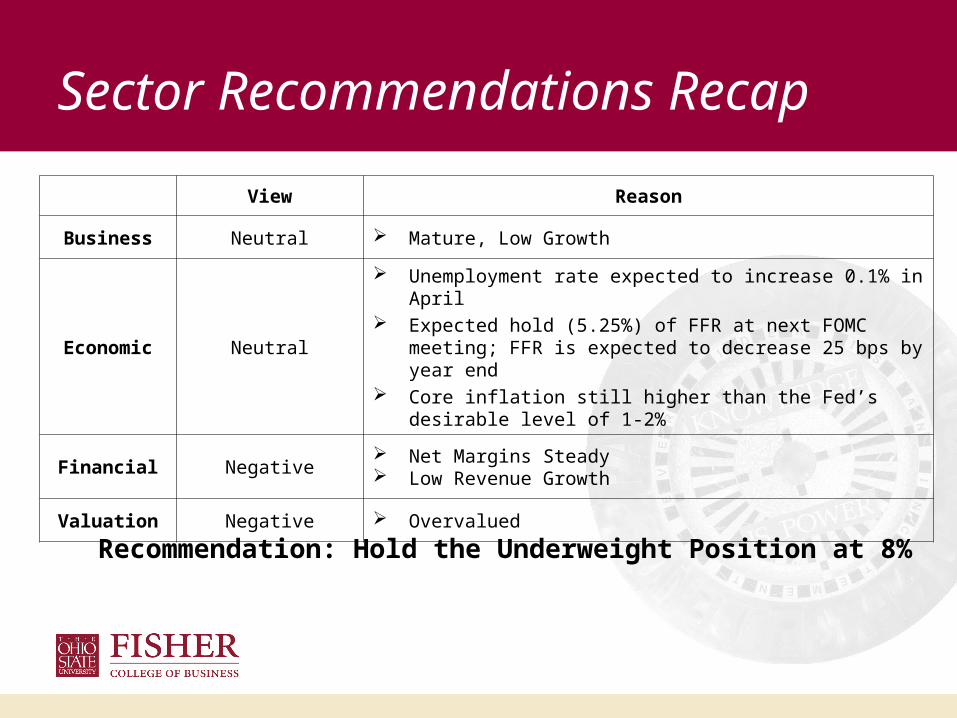
Sector Recommendations Recap
View Reason
Business Neutral Mature, Low Growth
Economic Neutral
Unemployment rate expected to increase 0.1% in April Expected hold (5.25%) of FFR at next FOMC meeting; FFR is
expected to decrease 25 bps by year end Core inflation still higher than the Fed’s desirable level of 1-
2%
Financial Negative Net Margins Steady Low Revenue Growth
Valuation Negative Overvalued
Recommendation: Hold the Underweight Position at 8%

Current Position
Shares Purchase Price
Current Price
(5/11/07)
Unrealized Gain/(Loss)
Market Value
SIM Weight
Coach 14,000 $42.78 $47.84 $70,840 $669,760 2.92%
Limited Brands
23,400 $26.08 $27.67 $37,206 $647,478 2.54%
Carnival 12,000 $39.83 $48.79 $107,520 $585,480 2.34%

Nike Overview
– 2006 Revenue $14,955 MM (8.8% increase from ‘05)
– 2006 Net Income $1,392 MM (14.9% increase from ‘05)
– 2006 EPS $2.64 (17.9% increase from ‘05)
– 52 week range: $37.76 – $55.10
– Completed a 2 – 1 stock split on April 2, 2007
– Current Price as of 5/14/07 - $52.87
– 1.4% Div. Yield

Catalysts• Strong market position and brand
– Number one shoemaker, holding a 40% market share of the global footwear industry
– World’s largest manufacturer of athletic apparel– Nike swoosh sign is one the most widely recognized logo– Relatively inelastic demand
• Robust financial performance– Strong cash position that will provide funding for future expansion strategies
• Strong product portfolio– Reduced dependence on footwear and has established a strong position in the
equipment and apparel markets– Offers specialized sports gear for sports including golf, hockey, skateboarding,
and cycling– Allows them to spread risk across its product segments

Financial AnalysisStockVal®NIKE INCORPORATED (NKE) Price 53.03
1997 1998 1999 2000 2001 2002 2003 2004 2005 2006 2007 20081997 1998 1999 2000 2001 2002 2003 2004 2005 2006 2007 2008 2009
PRICE12
16
20
24
32
44
56
HI 55LO 13ME 28CU 53GR 6.6%
05-09-199705-11-2007
REVENUE-PER-SHARE15
17
19
22
25
28
32
HI 31LO 15ME 18CU 31GR 7.5%
05-31-199702-28-2007
EARNINGS-PER-SHARE0.4
0.6
0.8
1.0
1.4
2.0
2.8
HI 2.68 LO 0.57 ME 1.31 CU 2.68 GR 7.4%
05-31-199702-28-2007
• Stock price, Revenue/share,EPS are increasing.

StockVal®NIKE INCORPORATED (NKE) Price 53.031997 1998 1999 2000 2001 2002 2003 2004 2005 2006 2007 20081997 1998 1999 2000 2001 2002 2003 2004 2005 2006 2007 2008 2009
PRICE RELATIVE TO S&P CONSUMER DIS. SECTOR COMP ADJ (SP-25) M-Wtd0.2
0.3
0.4
0.6
0.8
1.1
HI 1.05 LO 0.27 ME 0.68 CU 0.91
05-09-199705-11-2007
REVENUE-PER-SHARE RELATIVE TO S&P CONSUMER DIS. SECTOR COMP ADJ (SP-25) M-Wtd0.8
0.9
1.0
1.1
1.2
HI 1.18 LO 0.85 ME 1.01 CU 1.18
06-30-199703-31-2007
EARNINGS RELATIVE TO S&P CONSUMER DIS. SECTOR COMP ADJ (SP-25) M-Wtd0.3
0.4
0.5
0.6
0.8
1.0
1.2
HI 1.18 LO 0.39 ME 0.92 CU 1.13 FY1 1.16 FY2 1.08
06-30-199703-31-2007
Financial Analysis
• Relative to Consumer discretionary sectorStock price, Revenue/share,EPS are increasing.

StockVal®NIKE INCORPORATED (NKE) Price 53.031997 1998 1999 2000 2001 2002 2003 2004 2005 2006 2007 2008
DIVIDENDS-PER-SHARE RELATIVE TO S&P CONSUMER DIS. SECTOR COMP ADJ (SP-25) M-Wtd1.0
1.2
1.4
1.6
1.8
2.0
2.4
HI 2.38 LO 1.00 ME 1.44 CU 2.34
06-30-199712-31-2006
TOTAL RETURN RELATIVE TO S&P CONSUMER DIS. SECTOR COMP ADJ (SP-25) M-Wtd0.2
0.3
0.4
0.6
0.8
1.1
HI 1.05 LO 0.28 ME 0.68 CU 0.90
05-09-199705-11-2007
GROWTH RATE ESTIMATE RELATIVE TO S&P CONSUMER DIS. SECTOR COMP ADJ (SP-25) M-Wtd0.6
0.7
0.8
0.9
1.0
1.1
HI 1.06 LO 0.70 ME 0.91 CU 1.05
05-09-199705-04-2007
Financial Analysis
• Dividends/shareare higher compared to Cons Disc.
•Growth rate estimates are going up compared to Cons Disc.

StockVal®NIKE INCORPORATED (NKE) Price 53.032002 2003 2004 2005 2006 20072002 2003 2004 2005 2006 2007 2008
PRICE / YEAR-FORWARD EARNINGS RELATIVE TO S&P CONSUMER DIS. SECTOR COMP ADJ (SP-25) M-Wtd0.7
0.8
0.9HI 1.00 LO 0.71 ME 0.85 CU 0.83
05-10-200205-11-2007
PRICE / EBITDA RELATIVE TO S&P CONSUMER DIS. SECTOR COMP ADJ (SP-25) M-Wtd0.8
1.0
1.2
1.4HI 1.75 LO 0.94 ME 1.27 CU 1.49
05-10-200205-11-2007
PRICE / SALES RELATIVE TO S&P CONSUMER DIS. SECTOR COMP ADJ (SP-25) M-Wtd1.2
1.4
1.6
1.8 HI 1.81 LO 1.34 ME 1.62 CU 1.71
05-10-200205-11-2007
PRICE / BOOK VALUE RELATIVE TO S&P CONSUMER DIS. SECTOR COMP ADJ (SP-25) M-Wtd1.2
1.4
1.6
1.8 HI 1.87 LO 1.27 ME 1.54 CU 1.35
05-10-200205-11-2007
Valuation Analysis – 5yr
CU < ME
Trending Down
CU > ME
Trending Down
CU > ME
Stable
CU < ME
Trending Down

Valuation Analysis – 5yrStockVal®NIKE INCORPORATED (NKE) Price 53.03
2002 2003 2004 2005 2006 20072002 2003 2004 2005 2006 2007 2008
PRICE / CASH FLOW ADJUSTED RELATIVE TO S&P CONSUMER DIS. SECTOR COMP ADJ (SP-25) M-Wtd1.24
1.30
1.35
1.40
1.45
1.50
1.55
1.60
1.65
1.70
1.75
1.80
1.85
1.90
1.95
2.00
2.05
HI 2.03 LO 1.29 ME 1.56 CU 1.54
05-10-200205-11-2007
CU < ME
Trending Down

Valuation Summary 5-yr
HI LO ME CU
P/E 1.00 0.71 0.85 > 0.83
P/EBITDA 1.75 0.94 1.27 < 1.49
P/S 1.81 1.34 1.62 < 1.71
P/BV 1.87 1.27 1.54 > 1.35
P/CF 2.03 1.29 1.56 > 1.54

StockVal®NIKE INCORPORATED (NKE) Price 53.031997 1998 1999 2000 2001 2002 2003 2004 2005 2006 2007 2008
PRICE / YEAR-FORWARD EARNINGS RELATIVE TO S&P CONSUMER DIS. SECTOR COMP ADJ (SP-25) M-Wtd0
1
2HI 2.16 LO 0.45 ME 0.86 CU 0.83
05-09-199705-11-2007
PRICE / EBITDA RELATIVE TO S&P CONSUMER DIS. SECTOR COMP ADJ (SP-25) M-Wtd0.8
1.2
1.6
2.4 HI 3.14 LO 0.88 ME 1.44 CU 1.49
05-09-199705-11-2007
PRICE / SALES RELATIVE TO S&P CONSUMER DIS. SECTOR COMP ADJ (SP-25) M-Wtd0
1
2HI 2.33 LO 0.67 ME 1.52 CU 1.71
05-09-199705-11-2007
PRICE / BOOK VALUE RELATIVE TO S&P CONSUMER DIS. SECTOR COMP ADJ (SP-25) M-Wtd0
1
2HI 2.13 LO 0.61 ME 1.43 CU 1.35
05-09-199705-11-2007
Valuation Analysis - 10yr
CU < ME
Stable
CU > ME
Trending Up
CU > ME
Stable
CU < ME
Stable
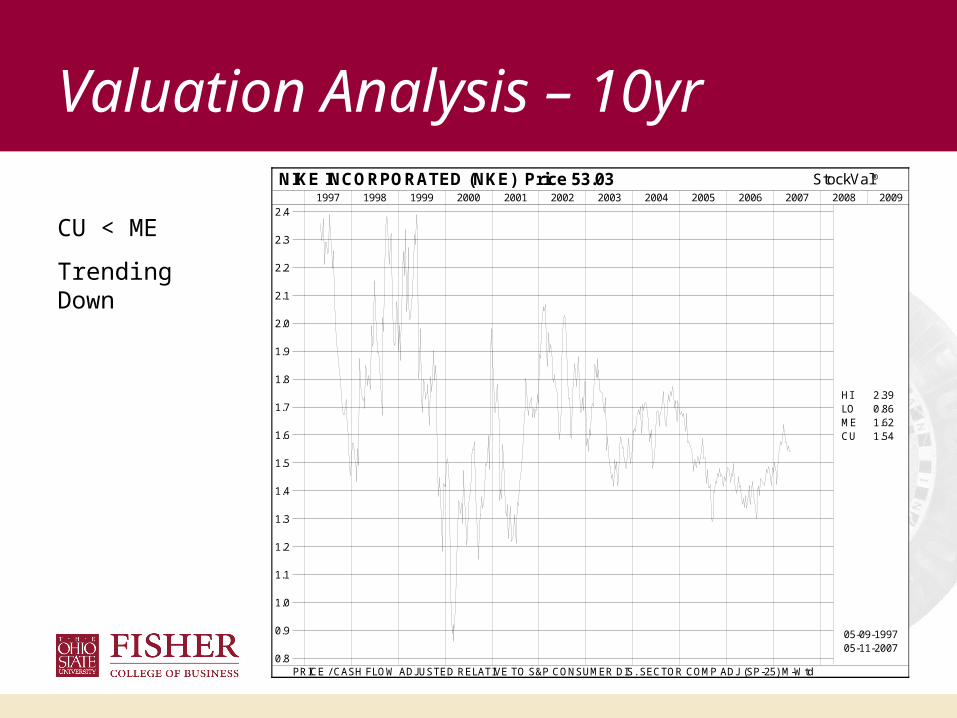
Valuation Analysis – 10yrStockVal®NIKE INCORPORATED (NKE) Price 53.03
1997 1998 1999 2000 2001 2002 2003 2004 2005 2006 2007 20081997 1998 1999 2000 2001 2002 2003 2004 2005 2006 2007 2008 2009
PRICE / CASH FLOW ADJUSTED RELATIVE TO S&P CONSUMER DIS. SECTOR COMP ADJ (SP-25) M-Wtd0.8
0.9
1.0
1.1
1.2
1.3
1.4
1.5
1.6
1.7
1.8
1.9
2.0
2.1
2.2
2.3
2.4
HI 2.39 LO 0.86 ME 1.62 CU 1.54
05-09-199705-11-2007
CU < ME
Trending Down

DCF AnalysisNIKEDCF Valuation ($MM) 2007E 2008E 2009E 2010E 2011E 2012E 2013E 2014E 2015E 2016ERevenues $16,151 $17,443 $18,839 $19,875 $20,968 $22,174 $23,449 $24,856 $26,347 $27,928
% Growth 8.0% 8.0% 5.5% 5.5% 5.8% 5.8% 6.0% 6.0% 6.0%Operating Income (EBIT) $2,261 $2,442 $2,637 $3,826 $4,036 $4,268 $4,514 $4,785 $5,072 $5,376
% Revenues 14.0% 14.0% 14.0% 19.3% 19.3% 19.3% 19.3% 19.3% 19.3% 19.3%D&A $323 $349 $377 $497 $524 $665 $703 $746 $659 $698
% Revenues 2.0% 2.0% 2.0% 2.5% 2.5% 3.0% 3.0% 3.0% 2.5% 2.5%EBITDA $2,584 $2,791 $3,014 $4,323 $4,561 $4,934 $5,217 $5,530 $5,730 $6,074
CAPEX ($323) ($349) ($377) ($497) ($524) ($665) ($703) ($746) ($659) ($698)% Revenues 2.0% 2.0% 2.0% 2.5% 2.5% 3.0% 3.0% 3.0% 2.5% 2.5%
Net Change in WC ($350) ($226) ($244) ($199) ($210) ($111) ($117) ($124) ($263) ($279)% Revenues 2.2% 1.3% 1.3% 1.0% 1.0% 0.5% 0.5% 0.5% 1.0% 1.0%
Taxes ($791) ($855) ($923) ($1,339) ($1,413) ($1,494) ($1,580) ($1,675) ($1,775) ($1,882)Tax Rate 35% 35% 35% 35% 35% 35% 35% 35% 35% 35%Free Cash Flow $1,119 $1,361 $1,470 $2,288 $2,414 $2,664 $2,817 $2,986 $3,033 $3,215
Growth Rate 4%Discount Rate (CAPM) 10%Terminal Enterprise Value $55,730Implied Term. Value EBITDA Multiple
9.2x
Discounted Free Cash FlowNPV Free Cash Flow $1,018 $1,125 $1,105 $1,563 $1,499 $1,504 $1,445 $1,393 $1,286 $1,240NPV Terminal Value $21,486
Total Discounted Cash Flows$34,663 $1,018 $1,125 $1,105 $1,563 $1,499 $1,504 $1,445 $1,393 $1,286 $22,726
Summary DCF Valuation DCF Value per Share
DCF Enterprise Value $34,663 14.5 x EBITDA Discount Rate
Less: Net Debt $1,724 Growth 8.0% 9.0% 10.0%Equity Value $36,387 3.0% 89.2 73.8 62.8
Shares 528 4.0% 104.4 83.1 69.0DCF Value per Share $68.97 5.0% 129.8 97.1 77.6
6.0% 180.6 120.5 90.57.0% 333.0 167.3 112.0

Stock Recommendations
View Reason
Business Positive
Strong market position and brand Robust Financial Performance Strong product portfolio
Financial Positive Revenue, EPS, are going up relative to Consumer Discretionary
DCF Positive Target Price $69, 30% upside
Valuation Neutral On par with the mean
Recommendation: Buy

Risks
• Rising raw material cost
– Rising oil prices increase the price of synthetic rubber and plastic based products. Increasing raw material cost would increase the production cost and its profitability.
• Chinese products
– Chinese footwear has been flooding the EU and can significantly affect Nike’s market share in the EU
• Intense competition
– The launch of technologically superior products by competitors such as Adidas could lead to a fall in the company’s market share

Action RecommendationCorrelation with NKE
Current Weight
Proposed Weight
Proposed Change
Proposed $ Amount
Proposed # of Shares
Current # Shares
Change # of shares
COH .44 37% 19% -18% $356,398.41 7,450 14,647 (7,197)
LTD .37 33% 22% -10% $414,643.23 14,985 22,038 (7,053)
CCL .33 30% 24% -6% $446,293.96 9,147 11,525 (2,378)
NKE 1 NA 35% 35% $655,488.40 12,368 0 12,368
Sharpe 2.20 4.88 2.68

Questions?