consumer demand for value-added subscription … demand for value-added subscription services...
TRANSCRIPT

X
Consumer Demand for Value-added Subscription ServicesFebruary 2016

1
Table of ContentsAbout the Survey 1
Executive Summary 1
Current Attitudes and Behaviors 3
Hypotheticals 9
Subscription Cancellations 12
Demographics 13
Appendix 15

2
About the SurveyIn January 2016, Vindicia commissioned Widmeyer Communications to conduct a survey on U.S. consumers’ usage and attitudes toward paid subscription online services. Specific goals of the survey included 1) assessing adults’ current behaviors and opinions of paid subscription services, involving frequency of use and salience of different service categories, 2) gauging interest in subscription upgrades and comparing hypothetical price points, and 3) determining reasons for subscription cancellations.
From January 25 to 29, Widmeyer Communications conducted an online, nationwide survey of 1,000 American adults who have at least one paid subscription service. The sample was stratified and the data were weighted slightly by regions, gender, and race in order to ensure a proportional, representative sample.
This report details the quantitative research and highlights key findings emerging from the survey.
Executive SummaryResults from a national survey of 1,000 U.S. adults who have at least one paid subscription service offer meaningful insight into attitudes and usage patterns of subscription service users. Most users were subscribing to video, shopping, and audio services. Included in these categories are services such as HBO Now, Netflix and Hulu (video); Amazon Prime and Google Express (shopping); and Apple Music, Pandora, Spotify and Audible (audio). These three categories together accounted for more than 80 percent of responses in terms of 1) services paid for, 2) most important service, and 3) most frequently used service.
But for users to subscribe to any service (regardless of the category), convenience and value of service were top concerns. For 29 percent and 26 percent of the sample respectively, whether or not it was convenient and the value they received for what they were paying was important. Respondents were generally not looking to personalize their service: almost half of the respondents (41 percent) ranked this factor as the least important reason that they subscribe to online services.
Slightly less than one-half of survey respondents (43 percent) received their subscription through a gift, whether they asked for it or not. For users to continue or renew their subscription annually, saving money and getting a deal were almost equally important at 21 and 20 percent, respectively.
Usage was also an important consideration in this survey. Results show that on average, almost one third (30 percent) of users were engaging at least 20 hours per week with what they identified as their most-utilized subscription service.
A key focus of this survey was also learning more about consumers’ interest in upgrading from a basic subscription to a premium service. Better content (52 percent) and value of service (28 percent) were key drivers of willingness to upgrade among users. Results show that almost all (90 percent) respondents were either very interested (52 percent) or somewhat interested (37 percent) in getting added privileges such as discounts, exclusive offers and access to events or activities with other subscribers. For these additional privileges, most respondents were willing to pay up to $3.99 a month for the opportunity.
For those users that recently canceled a subscription, most stopped using it due to value, cost, or relevance. These users indicated that they no longer saw the value of the subscription (39 percent), no longer wanted the financial obligation (36 percent), or the subscription was no longer relevant (34 percent).

3
Current Attitudes and Behaviors Overview
The primary objective of this survey was to analyze the usage of paid subscription services by American adults, as well as their attitudes toward them. Research into the habits and opinions of respondents regarding subscription services reveals that a majority of adults have subscribed to at least one service, and that they are using their number one service (the service they report using most frequently) for an average of 19 hours per week.
Types of Services
In multiple cases, data showed another key finding related to the relationship between age and behavior. Younger adults, ages 18 to 29, were the age group most likely to:
• have over-the-top/video demand service subscriptions (52 percent)
• use a service for more than the average engagement time of 19 hours per week (35 percent)
• ask for and receive a monthly online subscription as a gift (22 percent)
Age was also a factor when it came to attitudes. To consider renewing or continuing a subscription, 29 percent of older adults (greater than 44 years old) were persuaded by pricing offers and getting value for their money. Only 17 percent of younger adults mentioned this.
Non-Users
We also surveyed individuals who had did not currently use a subscription service (n=333). Those respondents who reported that they had canceled a subscription service were asked to explain their reasons why. Among these respondents, the most common explanations given were 1) not wanting the financial obligation (45 percent) and 2) getting enough value from what is available for free (42 percent). The full results are shown below in Figure 1.
Figure 1. Reasons for no longer subscribing
Services Used
For those respondents who did currently subscribe to online subscription services, they were asked to identify the services they currently pay for, from a provided list of categories. The results are graphed below in Figure 2. The most common subscriptions paid for were video and shopping services. Almost three-quarters (74 percent) of respondents pay for video-watching services, including subscriptions to sites like HBO Now,

4
Netflix, Hulu and Amazon Prime. The other service category used by over half of respondents was shopping services (62 percent), including Amazon and Google Express. Audio services like Apple Music, Pandora, Spotify and Audible were less popular but still used by over a third of respondents (37 percent). Possibly surprising to many, dating services ranked lowest in the list of possible services to pay for (2 percent).
Figure 2. Current subscriptions
Importance and Frequency of Use
Many respondents (N=700) reported paying for multiple categories of services. Of those who selected multiple categories of service, their most important subscriptions were shopping and video services. (see Figure 3). Video services was ranked most important by four-in-ten respondents, and shopping by almost a third (32 percent). Audio services, including Apple Music, Pandora, Spotify and Audible, ranked third in importance to respondents, at 9 percent.
Figure 3. Importance of Subscription Service, among users with multiple subscriptions

5
In addition to these results, a deeper look at the data showed that half of African Americans (49 percent) ranked video services as their most important subscription. Other groups most likely to rank video services as most important are those “not interested” in the privileges of upgrade (48 percent), and those who have not recently upgraded to premium (46 percent).
Responses were similar when the participants who selected only one category of service were included in the total count. Figure 4 includes respondents who reported paying for only one subscription, with that choice counting as their “most important” service. Video, shopping, and audio services remained the top three services in terms of importance. Together, video and shopping services account for three-quarters of responses.
Figure 4. Importance of subscription service, among all users
In addition to importance of service subscriptions, respondents were asked about frequency of engagement. As one may expect, adults are most frequently using the services that they find most important. Data in Figure 4 show that the most frequently used subscription was video services, with 42 percent of responses. Shopping services accounted for 28 percent, when 30 percent reported that this was most important to them. Audio service followed more closely in frequency of use than it did in importance, rising beyond one-in-ten respondents, at 13 percent.
Figure 5. Importance of subscription service, among users with multiple services

6
Groups likely to use video services most frequently were African Americans (53 percent), those aged 18-29 (49 percent), those who have not recently upgraded to premium (48 percent), those who have cancelled an online subscription (48 percent), and women (46 percent).
As before, Figure 6 shows that adding in the responses from those participants who only chose one subscription category did not sway the results greatly. Over-the-top services remained the service category most frequently used, but by an even greater difference (19 percent more than shopping, compared to 14 percent in smaller sample).
Figure 6. Importance of subscription service, among all users
But how much time are individuals really spending with these frequently used services? More than four out of ten (43 percent) respondents say they use their most frequent service 16 hours a week or more, with the average respondent coming in at 19 hours per week (see Figure 7). Age of respondent played a role in this; while those aged 18 to 44 years old averaged 20 hours a week on their favorite service, individuals 45 years or older averaged 13 hours per week.
Figure 7. Weekly use of services
The type/category of service also affected the time spent. Those who utilized audio services most often

7
reported the highest weekly service use, 25 hours. Video service was the second highest, at 23 hours per week. Shopping services were used an average of 12 hours per week, falling below the average weekly rate of service use.
Reasons for Purchasing Subscriptions
For those with service subscriptions, these services can clearly become a major part of their day. We wanted to uncover how and why users purchase subscriptions to services in the first place.
As Figure 8 shows, one-third (32 percent) of respondents acknowledged asking for and receiving a monthly online subscription as a gift, whether it was paid in full by the giver or them after. Almost one-tenth (8 percent) of respondents did not ask for but received one as a gift and had it paid in full by the gift giver.
Figure 8. Subscriptions as gifts
Considering paid service subscriptions to be a gift (that you would ask for or give) seems to be more accepted by younger audiences. Adults under 45 years old are more likely to have asked for and received an online subscription (19 percent) compared to those older than 45 (10 percent). This is especially true for adults aged 18 to 29 year olds (22 percent).
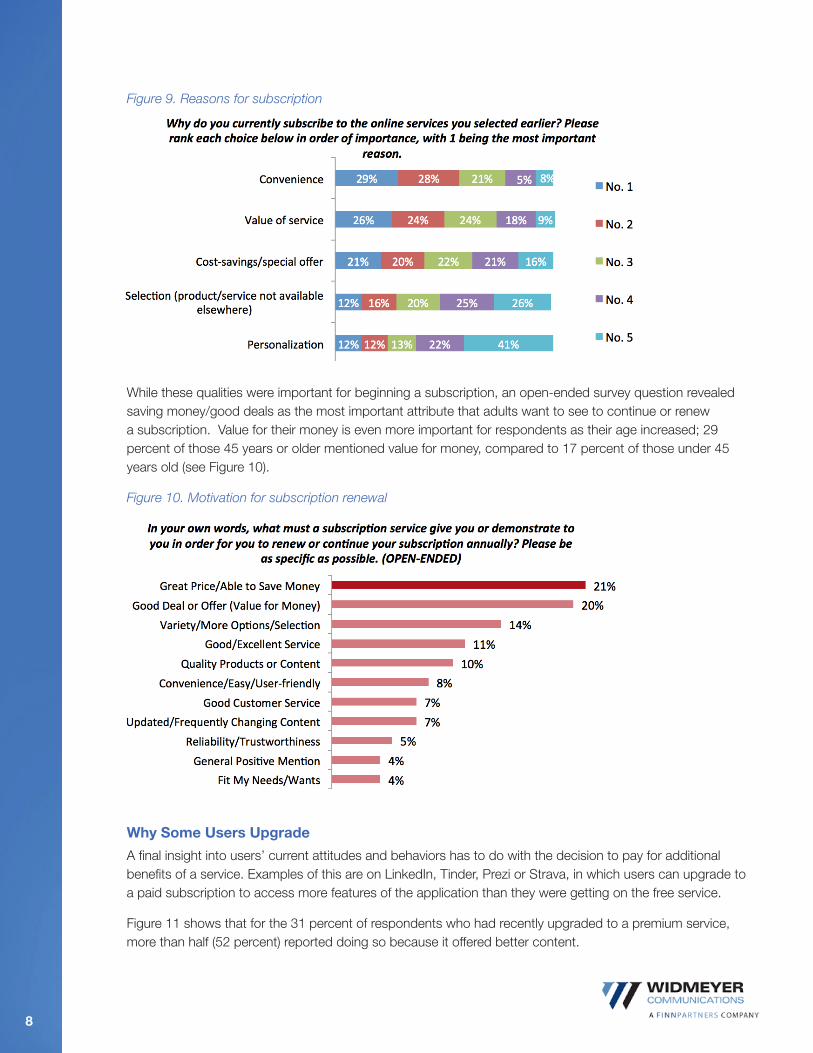
The main reason adults decide to get a subscription is convenience. Figure 9 shows that convenience ranked at the top of users’ lists, as the number one reason for 29 percent of respondents. Value of the service was a close second, with about a quarter (26 percent) of respondents ranking this as the number one reason. Cost-savings and selection of service were moderately ranked, and personalization ranked last among the choices listed, with 41 percent ranking it number five out of five.
8
Figure 9. Reasons for subscription
While these qualities were important for beginning a subscription, an open-ended survey question revealed saving money/good deals as the most important attribute that adults want to see to continue or renew a subscription. Value for their money is even more important for respondents as their age increased; 29 percent of those 45 years or older mentioned value for money, compared to 17 percent of those under 45 years old (see Figure 10).
Figure 10. Motivation for subscription renewal
Why Some Users Upgrade
A final insight into users’ current attitudes and behaviors has to do with the decision to pay for additional benefits of a service. Examples of this are on LinkedIn, Tinder, Prezi or Strava, in which users can upgrade to a paid subscription to access more features of the application than they were getting on the free service.
Figure 11 shows that for the 31 percent of respondents who had recently upgraded to a premium service, more than half (52 percent) reported doing so because it offered better content.

9
Figure 11. Reasons for upgrading
Likely groups to have upgraded include those who use audio subscriptions most frequently (50 percent), those “very interested” in the privileges of upgrade (47 percent), those identifying as Hispanic (44 percent), urban residents (44 percent), those aged 18-29 (40 percent), and males (37 percent).
HypotheticalsOverview
Another objective of this research was to gauge interest in premium upgrades and compare hypothetical price points. Many services offer different subscription level options to their users. By giving them the opportunity to upgrade to a service with added privileges, possibly discounts or exclusive events, companies offer an exciting alternative to the regular subscription.
Willingness to Pay for Upgrades
The survey also explored which privileges users who had upgraded found most exciting. Results showed that respondents were most interested in discounts or early access to sales (67 percent). Not too far behind in interest was the privilege of exclusive offers (62 percent).
Of course, this comes at a price. Users’ willingness to pay for upgrades was measured at two different price points – $1.99 and $3.99 a month. Results show that the $2 a month difference did not dissuade many respondents. Regardless of the price point given to respondents, a clear majority (75 percent at $3.99 and 84 percent at $1.99) say they would be probably or definitely be willing to pay an extra fee for a membership that gives special members-only access to premium content or other benefits.
Respondents were asked to think about the services that are most important to them, and how interested they would be in upgrading from a subscription in which they received only what is paid for to a membership with added privileges (see Figure 12). More than half (52 percent) of respondents were very interested (extremely 24 percent and very 28 percent) in upgrading to a subscription with value-added privileges. Another 37 percent expressed that they were “somewhat interested.” Only 10 percent say they would not be interested.

10
Figure 12. Interest in upgrading
Groups more likely to be very interested compared to their counterparts were those who recently upgraded from a “freemium” subscription version (78 percent), who identify as Hispanic (63 percent), who most frequently use audio service (63 percent), employed full-time (60 percent), aged 18-29 (60 percent), living in urban settings (59 percent), with children (59 percent), who are male (57 percent), and most frequently use shopping services (56 percent).
Once respondents expressed interest in this hypothetical upgrade, they were given a list of potential privileges and asked, which two would increase interest most. For 67 percent of respondents, discounts or early access to sales would increase interest in the upgrade, while exclusive offers was also a top privilege (62 percent of responses). Four-in-ten respondents reported “first access to new products or services” as a privilege that increased their interest. Improved customer service, and events or social activities with other members, were the least favored privileges, at 18 percent and 12 percent, respectively. The data are shown in Figure 13.
Figure 13. Preferred privileges through upgrades

11
While the largest majority (67 percent) of respondents favored discounts and special sales, we were able to look at who exactly these people are. Groups most likely to be interested in this privilege are not employed (77 percent), divorced, separated, or widowed (77 percent), females (76 percent), most frequently using shopping services (75 percent), those with incomes under $40K (74 percent), those aged 45 or older (74 percent), and those who have not upgraded to premium subscription (73 percent).
Through a split sample question, respondents were asked how willing they would be to pay extra on a monthly basis for a subscription with upgraded benefits. Willingness was compared between two price points, $1.99 or $3.99 monthly. Results in Figure 14 showed that regardless of the price point specified (up to $3.99), a clear majority would be willing to pay an extra fee. At $1.99 more a month, 84 percent were willing to pay for the upgrade. At $3.99 a month, three-quarters (76 percent) were still willing, while “probably not” responses rose by 6 percent (14 percent from $1.99 sample to 20 percent). At both price points, less than 5 percent reported “definitely not” being willing to pay the extra fee. Clearly, users are open to the idea of service upgrades at these prices.
It is important to note the 23 percent of respondents who reported the highest level of willingness at the $3.99 price point. People most likely to definitely pay $3.99 were those who had upgraded from a “freemium” (44 percent), those “very interested” in the privileges offered (41 percent), and those who most frequently used audio services (32 percent).
Figure 14. Willingness to pay extra
Thinking about the subscriptions that are most important to you, would you be willing to pay $1.99 (or $3.99)
extra a month for a membership that gives you members-only access to premium content or other benefits?

12
Subscription CancellationsOverview
At some point, users decide to cancel their service subscription. This survey also explored why users cancel, and what could be done to encourage renewal.
Reasons for Cancellation
Close to two-thirds (62 percent) of respondents say they have cancelled a subscription service they have signed up for, with 38 percent saying they have done so within the last three months (see Figure 15).
When asked to remember why they canceled their subscription, unseen value was the most common explanation, mentioned by almost four-in-ten respondents (39 percent). Other reasons that were reported by over a third of respondents were unwanted financial obligation (36 percent) and loss of relevancy (34 percent).
Figure 15. Past cancellation of subscription service
Figure 16 shows that when respondents were asked to think about their most recent cancellation, 38 percent reported cancelling in the past three months, and 17 percent in the last 30 days. Almost three-in-ten (29 percent) of respondents, however, reported their most recent cancellation was over a year ago.
Figure 16. Timing of cancellation

13
When asked for a reason of cancellation, users most often (39 percent) said they could no longer see value in the subscription. There were a number of other reasons, though – 36 percent report no longer wanting the financial obligation, and 34 percent report feeling the subscription was no longer relevant to them. Billing complications, realizing they were still paying, not fully understanding the service, and online privacy/security issues were reasons selected by less than 15 percent of respondents, each.
Figure 17. Reasons for cancellation
DemographicsAs Table 1 shows, over half of the sample (51 percent) had a household income of $59,999 or less.
Table 1. Total household income
Total Household Income %
Under $20,000 11
$20,000-$39,999 20
$40,000-$59,999 21
$60,000-$79,999 17
$80,000-$99,999 13
$100,000-$149,999 12
$150,000 or more 4
Don’t know 2

14
Most of the respondents (51 percent) were aged 34 or under (see Table 2).
Table 2. Age
Age %
18-24 17
25-29 16
30-34 20
35-44 25
45-54 12
55-59 4
60-64 2
65-74 3
75 or older 0
Almost half of the sample (41 percent) had a Bachelor’s degree or higher.
Table 3. Education
Highest Education %
Less than high school 2
High school graduate 22
Some college (Associates degree) 35
4-year (BA, BS) college degree 27
Post graduate study 14
As Figure 18 shows, two-thirds of the sample was Caucasian.
Figure 18. Race/Ethnicity

15
AppendixVindicia Subscription Online Survey – January 2016
Objective: Obtain insights on U.S. respondents about their usage of and attitudes toward subscription and membership services.
1. From the following list, what categories of services do you currently PAY subscription services for? Please select all that apply to you. (RANDOMIZE) (MUST SELECT AT LEAST ONE CATEGORY A-L)
a. Dating Services (Match.com, eHarmony, JDate)
b. Financial Services (Credit scores, Motley Fool, LearnVest)
c. Professional Services (Dropbox, Office 365, Professional Associations, LinkedIn)
d. Learning Services (Craftsy, Rosetta Stone, Lynda.com)
e. “Print” Media (Amazon Prime/Kindle Unlimited, Texture, Wall Street Journal)
f. Lifestyle (Birchbox, Fabletics, Dollar Shave Club, Trunk Club)
g. Audio Services (Apple Music, Pandora, Spotify, Audible)
h. Over-the-top/Video on Demand (HBONow, Netflix, Hulu, Amazon Prime)
i. Shopping (Amazon Now/Prime, Google Express)
j. Health & Wellness (Classpass, BlueApron, YogaGlo)
k. Other (please specify)
l. I DO NOT PAY FOR ANY ONLINE SUBSCRIPTION SERVICES (TERMINATE)
IF ANSWERED L TO QUESTION 1, TERMINATE SURVEY AFTER RESPONDENT ANSWERS QUESTION 2
2. From the following list of choices, why do you currently not subscribe to online subscription services? Please select all that apply.
a. I don’t want the financial obligation
b. I don’t believe online services are a necessity
c. I’m concerned about my online privacy or potential security issues
d. I’m not ready to commit to a service
e. I don’t fully understand the service
f. I was not satisfied with the value I was getting
g. I am getting enough value from the free version
h. Other (please specify)
SURVEY FOR QUALIFIED RESPONDENTS
3. From the list of categories you currently have subscription services for, which one is most important to you at this time? (RANDOMIZE) (LIST IS GENERATED FROM SELECTIONS IN Q1; IF ONLY ONE CATEGORY WAS CHOSEN IN Q1, SKIP TO Q5)
16
a. Dating Services (Match.com, eHarmony, JDate)
b. Financial Services (Credit scores, Motley Fool, LearnVest)
c. Professional Services (Dropbox, Office 365, Prezi, LinkedIn)
d. Learning Services (Craftsy, Rosetta Stone, Lynda.com)
e. “Print” Media (Amazon Prime/Kindle Unlimited, Texture, Wall Street Journal)
f. Lifestyle (Birchbox, Fabletics, Dollar Shave Club, Trunk Club)
g. Audio Services (Apple Music, Pandora, Spotify, Audible)
h. Over-the-top/Video on Demand (HBONow, Netflix, Hulu, Amazon Prime)
i. Shopping (Amazon Now/Prime, Google Express)
j. Health & Wellness (Classpass, BlueApron, YogaGlo)
k. Other (please specify)
4. From the same list, what category of subscription services do you use most frequently? (RANDOMIZE) (LIST IS GENERATED FROM SELECTIONS IN Q1; IF ONLY ONE CATEGORY WAS CHOSEN IN Q1, SKIP TO Q5)
a. Dating Services (Match.com, eHarmony, JDate)
b. Financial Services (Credit scores, Motley Fool, LearnVest)
c. Professional Services (Dropbox, Office 365, Prezi, LinkedIn)
d. Learning Services (Craftsy, Rosetta Stone, Lynda.com)
e. “Print” Media (Amazon Prime/Kindle Unlimited, Texture, Wall Street Journal)
f. Lifestyle (Birchbox, Fabletics, Dollar Shave Club, Trunk Club)
g. Audio Services (Apple Music, Pandora, Spotify, Audible)
h. Over-the-top/Video on Demand (HBONow, Netflix, Hulu, Amazon Prime)
i. Shopping (Amazon Now/Prime, Google Express)
j. Health & Wellness (Classpass, BlueApron, YogaGlo)
k. Other (please specify)
4B. How often do you utilize the (FILL-IN CHOICE FROM Q4) service in an average day or week? (OPEN-ENDED) Please enter the amount of time within the category that is easiest for you to remember. (CAN ONLY ENTER TIME UNDER WEEKLY OR DAILY)
Weekly ________ (hours per week)
Daily ____:_____ (hours and minutes per day)
5. Have you ever asked for and/or received a monthly online subscription as a gift? Please select the choice that best represents your answer to this question.
a. Asked for and received – paid by me after period of time
b. Asked for and received – paid in full by gift giver

17
c. Did not ask for but received–paid by me after period of time
d. Did not ask for but received– paid in full by gift giver
e. NEVER ASKED FOR A GIFT LIKE THIS
f. NEVER RECEIVED A GIFT LIKE THIS
6. From the following list of choices, why do you currently subscribe to the online services you selected earlier? Please rank each choice below in order of importance with 1 being the most important reason and 5 being the least important. (RANDOMIZE)
___ Selection – product or service is not available anywhere else
___ Convenience
___ Cost-savings/special offer
___ Value of service
___ Personalization
___ Other (please specify)
7. In your own words, what must a subscription service give you or demonstrate to you in order for you to renew or continue your subscription annually? Please be as specific as possible. (OPEN-ENDED)
8. Have you recently upgraded from a “freemium” service to a premium service? (For example, LinkedIn, Tinder, Prezi or Strava users can upgrade to a paid subscription to access more features of the application.)
____ Yes (If yes, continue to #9. If no, skip to #10)
____ No
9. What was the main reason you upgraded from a freemium service to a premium service?
a. Value of service
b. Better content
c. Enhanced privacy/security
d. Free-trial had expired
e. Other (please specify)
10. Thinking about the services that are most important to you, how interested would you be in upgrading from a subscription (receive only what is paid for) to a membership with added privileges (examples: discounts, exclusive events, etc.)?
a. Extremely interested
b. Very interested
c. Somewhat interested

18
d. Not too interested
e. Not interested at all
11. Thinking about the members-only privileges mentioned in the last question, from the following list of choices, what form of privilege would increase your interest the most if it were offered as part of the members-only program? Select your top 2 in order. (RANDOMIZE)
a. Discounts or early access to sales
b. Events or social activities with other members
c. First access to new products or services
d. Exclusive offers
e. Increased customer service
f. Other (please specify)
Split Sample Question
(Sample A ask)
12. Thinking about the subscriptions that are most important to you, would you be willing pay $1.99 extra a month for a membership that gives you special members-only access to premium content or other benefits?
a. Yes, definitely
b. Yes, probably
c. Probably not
d. Definitely not
(Sample B ask)
Thinking about the subscriptions that are most important to you, would you be willing to pay $3.99 extra a month for a membership that gives you special members-only access to premium content or other benefits?
a. Yes, definitely
b. Yes, probably
c. Probably not
d. Definitely not
13. Have you ever cancelled an online subscription service you signed up for?
a. Yes (CONTINUE)
b. No (SKIP TO DEMOGRAPHICS)

19
14. Thinking about your most recent cancellation, how long ago did you cancel this subscription?
a. Within 30 days
b. 1-3 months ago
c. 4-6 months ago
d. 7-12 months ago
g. More than a year ago
15. Thinking about your most recent cancellation, from the following list of choices, why did you cancel this subscription? Please select all that apply.
a. I no longer wanted the financial obligation
b. I didn’t see the value of the subscription
c. The subscription was no longer relevant to me
d. I was concerned about my online privacy and security
e. I tried it but didn’t fully understand the service
f. I didn’t realize I was still paying for it
g. Billing complications (updating credit card, confirming payment details, etc.)
h. Other (please specify)
Demographics
Are you between the ages of:
18-24 1
25-29 2
30-34 3
35-44 4
45-54 5
55-59 6
60-64 7
65-74 8
75 or older 9
(Refused) 10
What is the highest level of education you have completed? (Prompt if necessary.)
Less than high school 1
High school graduate 2
Some college (Associates degree) 3

20
4-year (BA,BS) college degree 4
Post graduate study 5
(Prefer not to say) 6
Which best describes your marital status?
Single
Living with a partner
Married
Divorced or separated
Widowed
Rather not say
Do children under 18 live at home with you?
Yes
No
Which best describes the area where you live?
Urban
Suburban
Rural
What is your employment status?
Employed full-time
Employed part-time
Homemaker
Student
Retired
Unemployed
Not sure
Rather not say
Are you, yourself, of Hispanic origin or descent, such as Mexican, Puerto Rican, Cuban or some other Hispanic background?
21
Yes 1
No 2
(Don’t know) 3
(Refused) 4
ASK IF NOT HISPANIC TO PREVIOUS QUESTION (2-4)
What is your race? Are you African American, Caucasian, Asian, or some other race?
African-American/black 1
Caucasian/white 2
Asian 3
More than one race / Other 4
(Refused) 5
RESUME ASKING ALL
We want to classify people into broad income groups for statistical purposes only. What would you say is your total annual family income before taxes?
Under $20,000 1
$20,000 - $39,999 2
$40,000 - $59,999 3
$60,000 - $79,999 4
$80,000 - $99,999 5
$100,000 - $149,999 6
$150,000 or more 7
(Don’t know) 8
(Refused) 9
Gender.
Male 1
Female 2
What state do you live in? Region. (Record From File/Census Designations)
Northeast 1
Midwest 2
South 3
West 4