consumer debt study 193503
TRANSCRIPT

D e p a r t m e n t o f C o m m e r c e
BUREAU OF FOREIGN AND DOMESTIC COMMERCE
CONSUMER DEBT STUDY
a
Marck, 1935
Price 10 cenfs
Digitized for FRASER http://fraser.stlouisfed.org/ Federal Reserve Bank of St. Louis
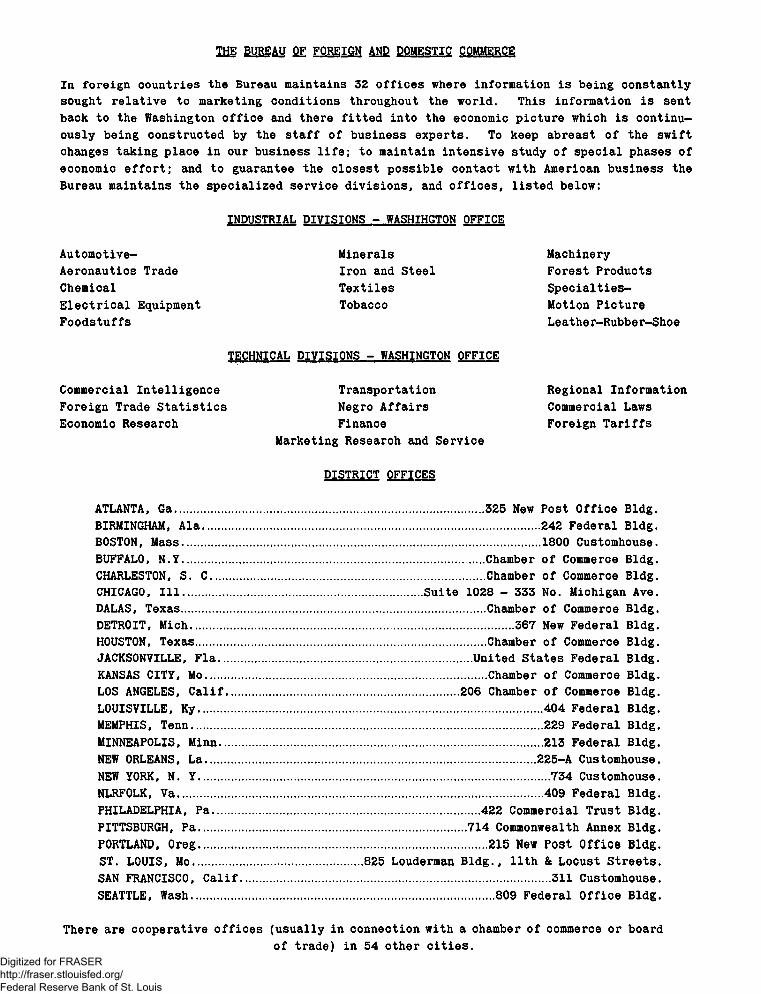
THE BUREAU OF FOREIGN AND DOMESTIC COMMERCE
In foreign countries the Bureau maintains 32 offices where information is being constantly sought relative to marketing conditions throughout the world. This information is sent back to the Washington office and there fitted into the economic picture which is continuously being constructed by the staff of business experts. To keep abreast of the swift changes taking place in our business life; to maintain intensive study of special phases of economic effort; and to guarantee the closest possible contact with American business the Bureau maintains the specialized service divisions, and offices, listed below:
INDUSTRIAL DIVISIONS - WASHIHGTON OFFICE
Automotive- Aeronautics Trade ChemicalElectrical Equipment Foodstuffs
Minerals Iron and Steel Textiles Tobacco
Machinery Forest Products Specialties- Motion Picture Leather-Rubber-Shoe
TECHNICAL DIVISIONS - WASHINGTON OFFICE
Commercial Intelligence Foreign Trade Statistics Economic Research
Transportation Negro Affairs Finance
Marketing Research and Service
Regional Information Commercial Laws Foreign Tariffs
DISTRICT OFFICES
ATLANTA, Ga........................................ 325 New Post Office Bldg,BIRMINGHAM, Ala............................................ 242 Federal Bldg.BOSTON, Mass............................................... 1800 Customhouse.BUFFALO, N.Y..................................... ..Chamber of Commerce Bldg.CHARLESTON, S. C.................................... Chamber of Commerce Bldg.CHICAGO, 111............................... Suite 1028 - 333 No. Michigan Ave.DALAS, Texas........................................Chamber of Commerce Bldg.DETROIT, Mich.......................................... 367 New Federal Bldg.HOUSTON, Texas...................................... Chamber of Commerce Bldg.JACKSONVILLE, Fla................................. United States Federal Bldg.KANSAS CITY, Mo.....................................Chamber of Commerce Bldg.LOS ANGELES, Calif.............................. 206 Chamber of Commerce Bldg.LOUISVILLE, Ky............................................. 404 Federal Bldg.MEMPHIS, Tenn.............................................. 229 Federal Bldg.MINNEAPOLIS, Minn.......................................... 213 Federal Bldg.NEW ORLEANS, La........................................... 225-A Customhouse.NEW YORK, N. Y.............................................. 734 Customhouse.NLRFOLK, Va................................................409 Federal Bldg.PHILADELPHIA, Pa................................... 422 Commercial Trust Bldg.PITTSBURGH, Pa................................... 714 Commonwealth Annex Bldg.PORTLAND, Oreg......................................215 New Post Office Bldg.ST. LOUIS, Mo...................... 825 Louderman Bldg., 11th & Locust Streets.SAN FRANCISCO, Calif........................................ 311 Customhouse.SEATTLE, Wash........................................809 Federal Office Bldg.
There are cooperative offices (usually in connection with a chamber of commerce or boardof trade) in 54 other cities.
Digitized for FRASER http://fraser.stlouisfed.org/ Federal Reserve Bank of St. Louis

UNITED STATES DEPARTMENT OF COMMERCEDANIEL C. ROPER, Secretary
BUREAU OF FOREIGN AND DOMESTIC COMMERCECLAUDIUS T. MURCHISON, Director
CONSUMER DEBT STUDY
By
H . T. LaCrosse
M a r c h 19 3 5 Price 10 CentsDigitized for FRASER http://fraser.stlouisfed.org/ Federal Reserve Bank of St. Louis

<m m § .
PageForeword................. . . .................................. 1Conclusions............................................ 2Method and Scope of Survey........................................ 3Total Business.................................. ................, 4Kind and Extent of Credit Business........... .................... 4Delinquency of Accounts Owing to Hetail and Service Creditors . . . . 6Delinquency According to Size of Business . ....................... 9
Retail Creditors ........................... . . . . . . . . . . . 9Service Creditors...................................... . . . . 12
Delinquency According to Degree of Credit Business......... . . . . 1 5Delinquent Accounts Expected to "be Collected . . . . . . . . . . . . . 1 7Methods Used in Collecting Delinquent Accounts............. . 19Sources of Credit Used by Creditors ................... 21Accounts Receivable Compromised . °......... .............. . . . . 2 3
Table 1.- Kind and Extent of Credit Business of Reporting Retail andService Creditors, 1933, By Type of Creditor......... . 5
2.- Somber and Value of Retail and Service Creditors' Accounts Receivable Delinquent Six Months or More on December 31,1933 ................................ . . . . . . . . . 8
3-12.- Value of Accounts Receivable Delinquent Six Months or More on December 31, 1933, Grouped According to Size of Business:
3.- Department Store............................... 94.- Electrical Dealer.............................. 105.- Furniture Store....................... ; . . . . 106.- Grocery Store................... .............. 117.- Men's Clothing S t o r e ...........................11
8.- Women's Clothing S t o r e ................. . 129.- Dentists' ........................ . . . . . . . 1310.- Doctors'....................................... 1811.- Landlord's..................................... 1412.- Undertakers'................ . . . ............ 14
13.- Value of Retail and Service Creditor's Accounts ReceivableDelinquent Six Months or More on December 31, 1933,Classified According to Degree of Credit Business . . . . 16
14.- Proportion of Retail and Service Creditors' AccountsReceivable Delinquent Six Months or More Expected to be Collected and Anticipated Collection Cost ............. 18
15.- Methods Used by Retail and Service Creditors in CollectingAccounts Delinquent Six Months or More........... . . .20
16.- Sources of Credit Used by Retail and Service Creditors inthe Conduct of Their Business During 1933 ............. 22
17.- Number of Retail and Service Creditors' Accounts ReceivableCompromised During Six Months Period, 1933-1934 ........ 23
Some publications of the Bureau of Foreign and Domestic .Commerce...................................... . Inside back cover
Digitized for FRASER http://fraser.stlouisfed.org/ Federal Reserve Bank of St. Louis

The purpose of this consumer debt study was to gather selected facts on the extent to which consumers' accounts with retailers and professional men were long overdue. Some people believe that an enormous amount of delinquent debt has been accumulated by consumers because of unemployment or severely reduced incomes. To the extent that this situation holds, creditors having much of their capital tied up in these accounts may have difficulty in securing bank loans. At the same time, consumers recently reemployed may find thei incomes largely diverted into debt liquidation, rather than into new purchases
This study was inaugurated by a Conmittee on Consumer Debt, appointed by the Consumers1 Advisory Board of the National Recovery Administration. The basic data were gathered by the staff of the District Offices of the Bureau of Foreign and Domestic Commerce and by a small group of men employed by the Works Division of the New York Emergency Relief Bureau,, working under Mr. Rolf Nugent, who is directing the general study for the Committee.
Acknowledgment is made for the valuable assistance rendered by the follow ing organizations and individuals: all retail and service creditors who gave their confidential figures, Mr. Rolf Nugent, district office managers of the Bureau of Foreign and Domestic Commerce, and H. B. Moore, R. M. Sanders, and Z. A. Koenig of the Market Data Section of the bureau.
This report was prepared by H. T. LaCrosse, under the general direction of N. H. Engle, Assistant Director of the Bureau of Foreign and Domestic Commerce, and Wilford L. Waite, Chief, Marketing Research and Service Division, and represents one section of a more detailed analysis being prepared by Mr. Nugent, on behalf of the committee.
March, 1935.Claudius T. Murchison,Director,
Bureau of Foreign and Domestic Commerce.Digitized for FRASER http://fraser.stlouisfed.org/ Federal Reserve Bank of St. Louis

Conclusions
1. The proportion of total business on credit was much greater for the service group of creditors (90 percent) reporting in this study than the retail group (54 percent). (See page 5)
2. The ratio of delinquency was much higher for the service creditors (59 percent) than the percentage of delinquency for the retail creditors (13 percent). (See page 81)
3. Of the amounts delinquent six months or more, 658 creditors reported that 66 percent was expected to he collected; 68 percent for the retail group and 52 percent for the service group. (See page 18L)
4. The anticipated costs of collecting delinquent accounts is about the same on the average for both the retail and service groups. The retail creditors reported that of the amount they expected to collect^ 12 percent would be spent in collection costs; service creditors, 15 percent. (See page 1&)
5. Over 800 creditors reported that dunning letters and personal visits were the most common methods used in collecting accounts delinquent six months or more. (See page 20J
6. IPhe commercial bank.was reported most frequently by both the retail and service creditors as the source of credit used in the conduct of their business. (See page 22.)
7. The percentage of retail and service creditors effecting a compromise of delinquent accounts"*«a. approximately the same. Jor the retail group 232 or 45 percent of the total reporting followed this practice; 138 or 46 percent of the total service group reporting did likewise. (See page 23.)
- 2 -Digitized for FRASER http://fraser.stlouisfed.org/ Federal Reserve Bank of St. Louis

The field investigation method of study was followed in collecting material for this report. A few representatives of 10 major creditor groups in cities located throughout 21 States were asked to furnish information showing their experiences in dealing with consumer accounts. Factual data and opinions were submitted on the number and value of accounts outstanding six months or more, proportion expected to be collected, methods used in collecting these accounts, and other relevant points pertaining to the subject.
The median and arithmetic average as well as the highest and lowest percentages reported by each class of creditors have been employed to esqpress the various relationships based on tabular material. The median was obtained by arraying the individual percentages in order of magnitude and selecting the "middle item*, that is, the percentage located where the number of items larger and smaller were equal. The arithmetic average is the figure used throughout the text in describing conditions unless otherwise specified.
A total of 839 creditors located in selected cities in the States appearing in the footnote to Table 1 submitted reports that were usable in at least one table. In the compilation of each table, all those reports containing pertinent material were included. Results have been presented separately by States where 15 or more reports were received from any one type of creditor.
The data collected and analyzed in this report are presented with a full reallzation that the sample is very small. While there is no reason to believe that these results are at all representative of consumer debt conditlons gener- all£. it is believed that they have sufficient significance to .justify their publication on the grounds that a few carefully selected facts, well analyzed. are better than none at all.
Method and Scope of Survey
- 3 -Digitized for FRASER http://fraser.stlouisfed.org/ Federal Reserve Bank of St. Louis

'Total Business
The total net business of the 718 creditors reporting on this subject in the study amounted to $462,578,517 for the year 1933. This amount, distributed among kinds of business in Table 1, furnishes some indication of the sample obtained for each class of creditors. The bulk of the business (98 percent) was done by the retail group, a fact caused by the number of reports from department stores with relatively large sales in 1933.
Kind and Extent of Credit Business
The proportion of total business on credit (open And installment) for this group of 718 creditors amounted to 55 percent. The Service group had a much greater proportion of business on a credit. ba*is than the retail group; 90 percent as compared with 54 percent for retailers.
Furniture stores did a larger proportion of their business on a credit basis than any of the other types of retail stores (89 percent) althougi electrical goods store figures irere also high (86 percent).
The highest percentage of credit business reported by any of the gro,ups was 94 percent, the figure for undertakers.
- 4Digitized for FRASER http://fraser.stlouisfed.org/ Federal Reserve Bank of St. Louis

Table 1.- Kind and Extent of Credit Business of Reporting Retail and Service Creditors, 1933: Humber of : Total net : Cash Otsen credit : Installment credit
Kind of c redi tor : creditors : business : : : ••: reporting Dollars : Dollars :Percent: Dollars :Percent: Dollars . 4Peroent
Retail:Department ............ 7** 332.893,59U l67.UU3.OU7 50.3 139.015.737 Ul.8 26.u3u.s10 7*9Electrical goods .. 5U 7.93*.9*8 1.1U9.555 lU.5 3 .312.726 Ul.7 3.U76.701 U3.8
82 28.387.515 3,233.930 1 1 .U 5.U21.959 19.1 19.731.626 69.5Grocery ....... ......... 113 15,682,805 8,ooo,UUo 51.0 7.682.365 U9.O —
Men's clothing . . . . 73 27.862,735 12 ,102.022 U3.U 1U.966.0U6 53.7 79U.667 2-9Women18 clothing .. 68 39.577.900 IUJU9.626 37.3 23,861,109 60.3 967,165 2.U
Service:Dentist ................. 82 796,289 182 M S 22.9 551.607 69.3 62.19U 7.8Doctor (M.D.) ....... 58 775.021 100,590 13.0 6U0.902 82.7 33.529 U.3Landlord ................ 5U 2.5**9.599 366,Uoo lU.U 2.1U8.199 8U.3 35.000 l.UUndertaker ............ 6o 6,nU,077 388,5U3 6.U 5.301.833 86.7 U23.701 6.9
Total Retail ......... U6U U52.3U3.531 206,678.620 U5.7 19U,259.9U2 U2.9 5 1 .U0U.969 1 1 .u
Total Service ....... 25U lO.23U.986 1 ,038,021 10.2 8.6U2 .5U1 8U.U 55U.U2U 5*U
Grand Total ........... 718 U62.578.517 207,7i6 ,6Ui UU.9 202.902.U83 U3.9 51.959.393 11.2
Digitized for FRASER http://fraser.stlouisfed.org/ Federal Reserve Bank of St. Louis
Delinquency of Accounts Owing to Retail and Service Creditors
In practically all forms of "business enterprises extending credit, the problem of delinquency is present to a varying degree. With respect to the ratios of consumer indebtedness past due, the subject to which this study pertains, a wide variation was found to exist between sales and service creditors.
Table 2 shows that the percentage of accounts receivable delinquent six months or more was much lower for the group of 416 retail creditors reporting in the study than the percentage of delinquency for the group of 264 service creditors. The ratio of amounts delinquent six months or more on December 31, 1933, to the amount of receivables outstanding on that date, was 13 percent for the retail group, which is in striking contrast with the figure of 59 percent shown for the service group. A comparison of the median percentages for the same relationship shows less variation but the difference is still very great.
One of the reasons for this variation may be attributed to the difference in credit methods employed. Creditors dealing in coranodities more frequently check carefully on the worthiness of an applicant for credit, while those covered in the service group are forced to extend credit, in a great many cases, at least, without sufficient investigation. Moreover, the collection policies of the latter group are less aggressive than those of the retail group, as a result of their apparent reluctance to press debtors for overdue
accounts.
- 6 -
Digitized for FRASER http://fraser.stlouisfed.org/ Federal Reserve Bank of St. Louis
Grocery stores reported, on the average, 25 percent of their total dollar accounts receivable delinquent six months or more, which figure was the highest ratio of delinquency for any of the types of creditors in the retail group. Department stores, at the other extreme, reported 9 percent.
The ratio of delinquency for the 65 doctors (M.D.) reporting in the study amounted to 67 percent, which was higher than any of the types of creditors in the service group. The sa-ne number of landlords reported in the study and had, on the average, the lowest ratio of delinquency (45 per
cent) .The average value of delinouent accounts for all retail establishments
was slightly more than one-half ($37 per account) the figure for service organizations ($64 per account). The difference, however, between the average of all accounts and delinquent accounts was small, only $3 for both t vpes of establishments.
All types of creditors, with the exception of the landlord group, reported very slight differences in the average values of delinquent and total accounts. In the c' oe of the landlords reporting, the average value of the delinquent account was larger by $187.
- 7 -Digitized for FRASER http://fraser.stlouisfed.org/ Federal Reserve Bank of St. Louis

Taole Number and Value of Retail and Service Creditor*' Accounts Receivable Delinquent Six Month* or More on December 31, 1933. By Type of Creditor
■umber■I .g V.a-A
l e e o t a t i j H e c ' i i 1 v a b l a
AverageDel inouent l6 months or more J. Percentages of total — annte
Type of creditor by States
: creditors : : reporting :
Humber : Amount:: (dollars)
: value per : : account : j (dollars) 1
Humber I Amount
| (dollars)
: value per < account' : (dollars)
1 Averagel
Highestt: Lowest ♦
: t : Median
Retail:Department store, total* 62 1 ,200,63U 55.718.U57 30 95.656 3.19U.370 31 8.9 88.9 1 .0 11.3Electrical goods, total* 50 U3 ,168 1,576 ,U88 37 7,823 3U7.363 UU 22.0 . 79-2 0.0 28.9
Hew Tork 23 5.659 269,8U9 U8 1.736 52,268 30 19.U 57.1 0.5 26.0Other states (20) 27 37,509 1 ,106,639 35 6,087 295.095 u* 22.6 79.2 0.0 30.0
Purniture store, total* 68 272.153 15.771,320 58 55.781 2,860,9*40 51 18.1 77-0 0.0 19-3Sew Tork 18 31,181 1.805.0U6 58 8,899 U56.905 51 25.3 77-0 1.8 32.UOther states (20) 50 2Ul,022 1 3 .966.27U 58 U6.882 2,U0U,035 51 17-2 70.0 0.0 18.2
Grocery, total* 115 37,966 1,273.582 3U 7,636 315.203 Ul 2U.7 9U.1 0.0 33.3Few Tork 3« 8,509 28U.282 33 1,859 90,820 U9 3 1.9 80.0 5-0 36.7Pennsylvania 22 6,159 156.751 25 7U6 25.08U
r16 .0 75.0 0.0 U7.U
Other states (19) 55 23.29* 832.5U9 36 5.031 199,29* Uo 23.9 9U.I 0.0 29.7Men's clothing, total* 61 12U,012 3.3U5.601 27 19 .7 56 598,306 2° 17.9 7 1. u 2.5 22.2
NeW Tork 16 19.052 831.18U UU 8,161 137.123 63 16.5 50.0 2.5 11.8Other states (20) U5 10^,960 2,5iU,Ui7 2U 17.588 U6i,i83 26 18.3 71.U u.5 2U.8
Women's clothing, total* 60 163.972 U.U15.936 27 31.532 763,122 23 17.3 6 5.2 0.0 13.3Hew Tork 16 21,331 711,181 33 2.697 99.7§l 37 lU.0 6 5.2 0.0 16.1Other states (20) UU lU2,6Ul 3.70U.755 26 29,835 663,361 22 17.9 60.0 0.0 12.7
Service:Dentist, total* 75 13.569 321,228 2U 6.528
2.U85178 ,718 27 55*6 90.0 10.0 55.8
Hew Tork 36 6,753 15U.019 23 71.290 29 U6I3 83.3 10.0 53*9Othe btates (20) 1*2 6,816 167,209 25 U.OUj 107,U28 27 6U.2 90.0 19 .3 62*5
Doctor (H.D.), total* 65 19,706 U96.256 25 12.U57 330.UU3 27 66.6 92.2 15 .0 62. UHew Tork 28 6,239 17 5 .9 19 28 3,78r 123.350 33 70.1 90.0 21.8 6U.7Other states (20) 37 13.U67 320,337 2U 8,670 207.093 2U 6U.6 92.2 15 .0 62. U
Landlord, total* 65 5,lU8 663.939 129 1.00U 317,1U7 316 U5.1 90.3 0.0 u.oHew Tork 27 5«9 51.157 H 109 17.U28 160 19.U 80.0 0.0 . 0.8Hew Jersey 17 375 20,858 56 U3 3.535 82 1 6 .9 UU.O 0.0 0.0Other states (19) 21 U.isU 5 9 1,92U 1U1 852 296.18U 3U8 50.0 90.3 0.0 37.7
Undertaker, total* 56 9 . m 1.U50.306 lUg 5.366 790,951 1U7 5U.5 85.U 10.0 50.7Hew Tork 16 1.05U 273,UU6 259 U22 87.636 *08 32.0 80.6 10 .9 Ul.lOther states (20) UO 8,720 1 ,176,860 135 U,9UU 703.315 1U2 59.8 85»lf 22.0 5U.6
Yptal Retail Ul6 |.8Ui,905 62,1 0 1,3SU 3U 219,18U 8.079.30U 37 13*0 9U4 0.0 22.28ervic* 26U >+8,197 2.931,729 61 25.355 (1.617.259 6U 58.6 90.3 0.0 50.0
9tas4 Total 680 1,890,102 65.033.113 3U=-— :nar
2UU.539 9.696.563= * = =
Uo IU.9 9U.> 0.0 33.3
*Ooaprialng; returns from the following states: Alabama, California, Colorado, Tlorlda,jOeorgia, Illinois, Kentucky, Louisiana, Massachusetts, Michigan, Minnesota, Missouri, few Jersey, Sew Tork, Oregon, Pennsylvania, South Carolina, Tennessee, Texas, Virginia, and Wa«hlngtP&t
Digitized for FRASER http://fraser.stlouisfed.org/ Federal Reserve Bank of St. Louis
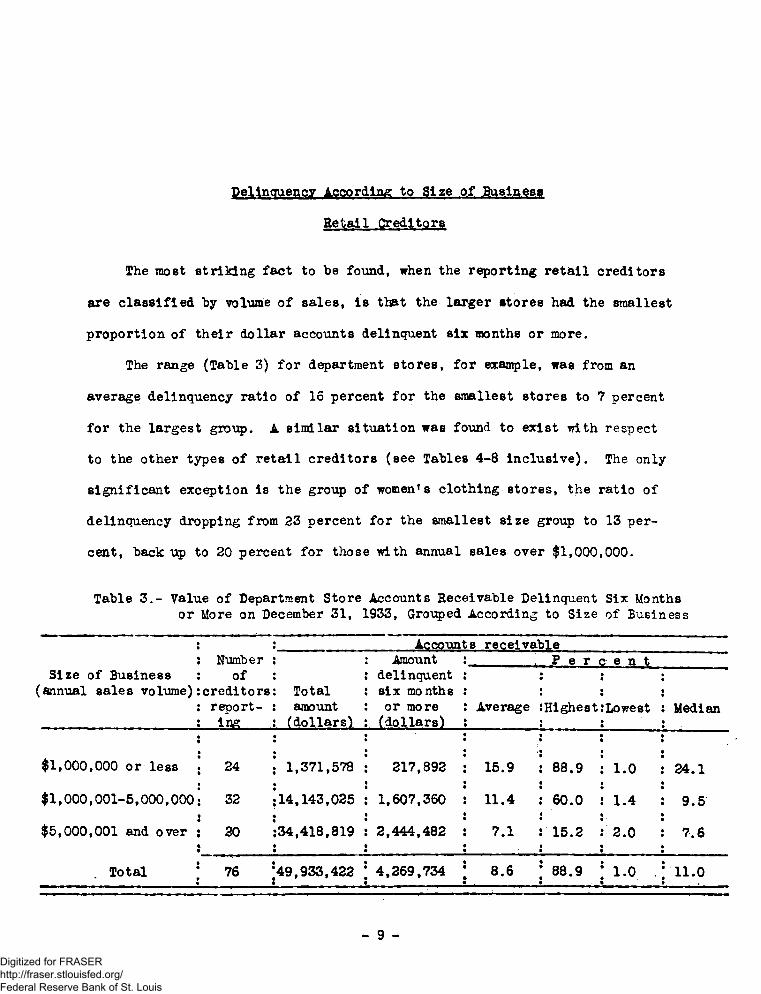
Delinquency According to Size of BusinessRetail Creditors
The most striking fact to he found, when the reporting retail creditors are classified by volume of sales, is that the larger stores had the smallest proportion of their dollar accounts delinquent six months or more.
The range (Table 3) for department stores, for example, was from an average delinquency ratio of 16 percent for the smallest stores to 7 percent for the largest group. A similar situation was found to exist with respect to the other types of retail creditors (see Tables 4-8 Inclusive). The only significant exception is the group of women's clothing stores, the ratio of delinquency dropping from 23 percent for the smallest size group to 13 percent, back up to 20 percent for those with annual sales over $1,000,000.
Table 3.- Value of Department Store Accounts Receivable Delinquent Six Months or More on December 31, 1933, Grouped According to Size of Business
Accounts receivableSize of Business
(annual sales volume)Numberof
creditorsreporting
Total amount (dollars)
.Amount delinquent six months or more (dollars)
Average
P e r c e n t•«•♦,
Highest:Lowest ••Median
$1,000,000 or less 24 1,371,578 217,892 15.9
•••88.9 : 1.0 24.1
$1,000,001-5,000,000 32 14,143,025 1,607,360 11.4•
60.0 : 1.4 9.5$5,000,001 and over 20 34,418,819 2,444,482 7.1 15.2 : 2.0 • 7.6
Total 76 49,933,422 4,269,734 8.6 88.9 | 1.0 . 11.0
- 9 -Digitized for FRASER http://fraser.stlouisfed.org/ Federal Reserve Bank of St. Louis
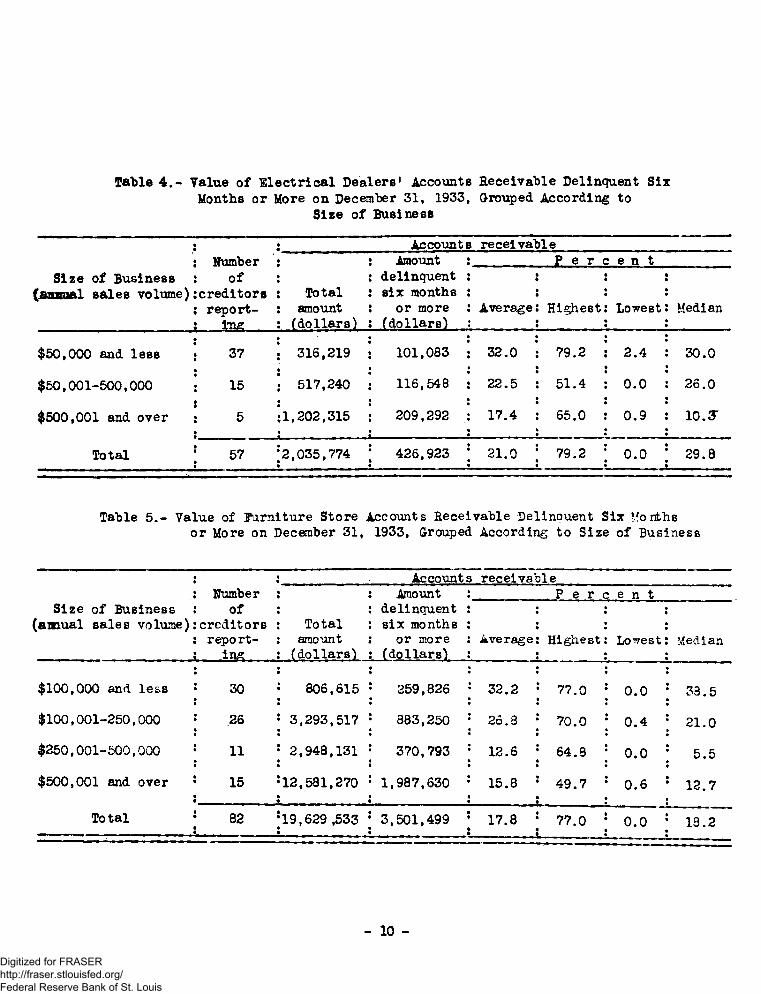
Table 4.- Value of Electrical Dealers' Accounts Receivable Delinquent SixMonths or More on December 31, 1933, Grouped According to
Size of BusinessAccounts receivable
Number .Amount P e r c e n tSize of Business
[jBaanal sales volume)of
creditorsreporting
Total amount (doliars)
delinquent six months or more
(dollars)Average Highest Lowest Median
$50,000 and less 37 316,219 101,083 32.0 79.2 2.4 30.0$50,001-500,000 15 517,240 116,548 22.5 51.4 0.0 26.0
$500,001 and over 5 1,202,315 209,292 17.4 65.0 0.9 10. JF
Total 57 2,035,774 426,923 21.0 79.2 0.0 29.8
Table 5.- Value of Furniture Store Accounts Receivable Delinouent Six Monthsor More on December 31, 1933, Grouped According to Size of Business
Accounts receivableSize of Business
[amual sales volume)Ilumber
ofcreditorsreporting
Totalamount(dollars)
Amount delinquent six months or more
(dollars)
P e r c e n t
Average: Highest Lowest: Median
$100,000 and less 30 806,615 259,826 32.2 j 77.0 0.0 1 33.5$100,001-250,000 26 3,293,517 883,250 26.3 j 70.0 0.4 ; 21.0$250,001-500,000 11 2,948,131 370,793 12.6 ; 64.8 0.0 | 5.5$500,001 and over 15 12,581,270 1,987,630 15.8 : 49.7 0.6 : 12.7
Total 82 19,629 ,533 3,501,499 17.8 j 77.0 0.0 ; 13.2
- 10 -Digitized for FRASER http://fraser.stlouisfed.org/ Federal Reserve Bank of St. Louis

Table 6.- Value of Grocery Store Accounts Receivable Delinquent Six ‘'rntbs
or More on December 31, 1933, Grouped According to Si^e
of Business
Size of Business annual sales volume)
Numberof
creditorsreporting
Accounts receivable
Totalamount(dollars)
Amount delinquent six months or more
(dollars)Average
P e i
Highest
c e n
Lowest
t
Median
$25,000 and less 31 59,934 30,559 51.0 80.0 11.8 48.0$25,001-50,000 27 86,462 34,648 40.1 77.0 17.9 35.3$50,001-100,000 32 254,110 86,493 34.0 94.1 0.0 30.3$100,001-250,000 14 251,841 58,221 23.1 43.9 5.0 -19.9$250,001-500,000 12 362,593 58,126 16.0 48.7 2.8 13.4$500,001 and over 5 385,429 59,352 15.4 24.2 0.0 18.0
Total 121 1,400,369 327,399 23.4 94.1 0.0 33.3• • *-----
Table 7.- Value of Men’s Clothing Store Accounts Receivable Delinquent Six Months or More oh December 31, 1933, Grouped According to Size of Business
Accounts receivableNumber Amount P e r c e n t
Size of Business (annual sales volume)
ofcreditorsreporting
Totalamount(dollars)
delinquent six months or more
(dollars)Average Highest Lowest Median
$100,000 and less 27 359,773 98,356 27.3 71.4 5.5 27.1$100,001-250 ,000 18 534,740 133,908 25.0 55.8 4.7 24.1$250,001-500,000 17 1,197,681 293,043 24.5 53.9 0.0 16.0$500,001 and over 14 2,409,207 250,878 10.4 26.1 2.5 10.3
Total 76 4,501,401 776,185 17.2 71.4 0.0 18.1
- 11 -
Digitized for FRASER http://fraser.stlouisfed.org/ Federal Reserve Bank of St. Louis

Table 8.- Value of Women' s Clothing Store Accounts Receivable DelinquentSix Months or More on December 31, 1933, Grouped According
to Size of Business
- Accounts receivableIftunber ■ Amount P e r c e n t
Size of Business (annual sales volume)
ofcreditors reporting _
Totalamount(dollars)
delinquent six months or more
(do liars)Average
iHighest Lowest Median
$250 ,000 and less 36 691,640 161,893 23.4 65.2 0.0 15.5$250,001-500,000 14 815,410 117,756 14.4 28.4 3.7 11.5$500,001-1,000,000 12 1,373,949 184,280 13.4 28.8 3.9 11.1$1,000,001 and over 12 4,253,488 853,326 20.1 : 44.5 4.9 11.9
Total 74 7,134,487 1,317,255 18.5 65.2 0.0 13.3
Service Creditors
The inverse ratio between the size of retail establishments and the proportion of their dollar receivables *hich has been delinquent six months or more, does not hold for service creditors, with the exception of dentists (Table 9). In this instance the range is from 61 percent to 52 percent.In the case of the landlords, there is a direct relationship with those with the largest incomes sustaining the highest proportion of delinquency.
- 12 -
Digitized for FRASER http://fraser.stlouisfed.org/ Federal Reserve Bank of St. Louis
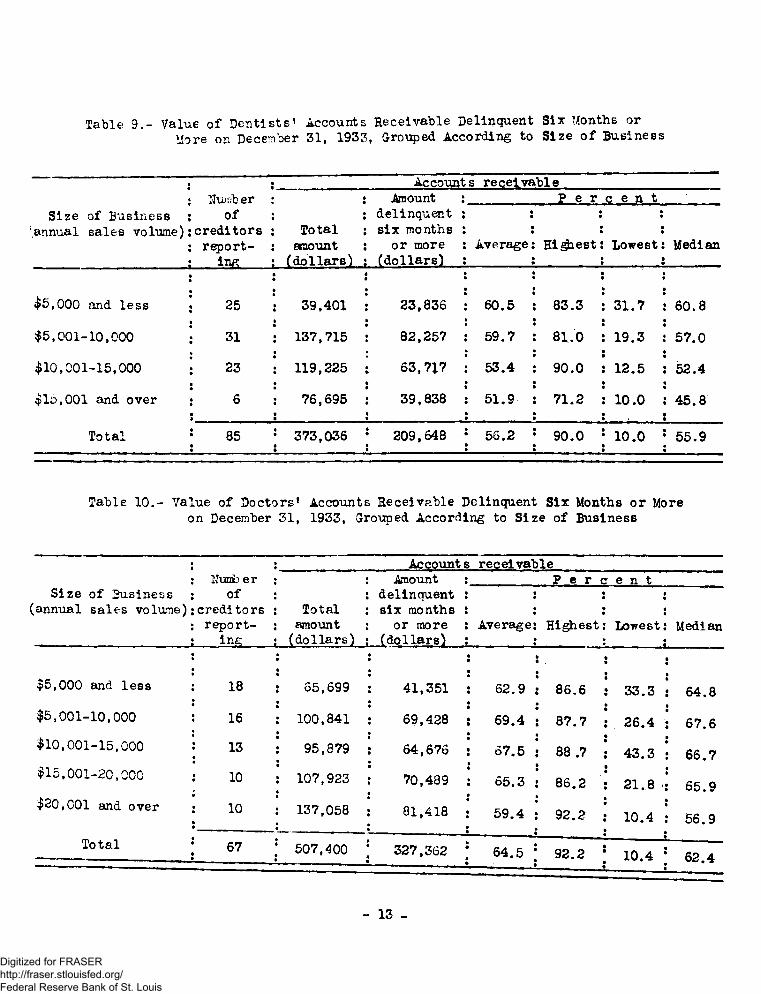
Table 9.- Value of Dentists1 Accounts Receivable Delinquent Six Months or
More on December 31, 1933, Grouped According to Size of Business
Accounts receivableNumber Amount P e r c e n t
Size of Business annual sales volume)
ofcreditorsreporting
Total amount (dollars}
delinquent six months or more
(doliars5Average Hipest Lowest Median
$5,000 and less 25 39,401 23,836 60.5 83.3 31.7 60.8$5,001-10,000 31 137,715 82,257 59.7 81.0 19.3 57.0$10,001-15,000 23 119,225 63,7*7 53.4 90.0 12.5 52.4$15,001 and over 6 76,695 39,838 51.9 71.2 10.0 45.8
Total 85 373,036 209,648 56.2 90.0 10.0 55.9
Table 10.- Value of Doctors’ Accounts Receivable Delinquent Six Months or More on December 31, 1933, Grouped According to Size of Business
Accounts receivableNumb er Anount P e r c e n t
Size of Business annual sales volune)
ofcreditorsreporting
Totalamount(dollars)
delinquent six months or more
(dollars}Average Highest Lowest Median
$5,000 and less 18 65,699 41,351 62.9 86.6 33.3 64.8$5,001-10,000 16 100,841 69,428 69.4 87.7 26.4 67.6$10,001-15,000 13 95,879 64,676 67.5 88 .7 43.3 66.7$15,001-20,000 10 107,923 70,489 65.3 86.2 21.8 65.9$20,001 and over 10 137,058 81,418 59.4 92.2 10.4 56.9
Total 67 507,400 327,362 64.5 92.2 10.4 62.4
- 13 -
Digitized for FRASER http://fraser.stlouisfed.org/ Federal Reserve Bank of St. Louis
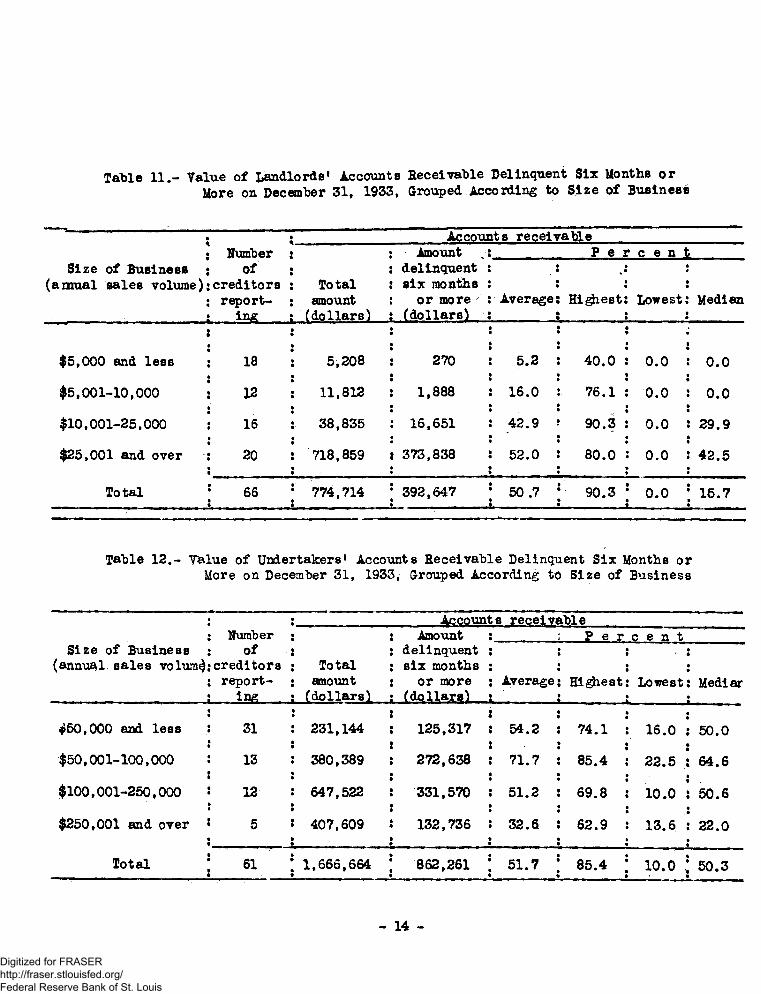
Table 11.- Value of Landlords' Accounts Receivable Delinquent Six Months orMore on December 31, 1933, Grouped According to Size of Business
« Accounts receivableNumber Amount P e r c e n t
Size of Business (amual sales volume)
ofcreditorsreporting
To tal amount (dollars)
delinquent six month8 or more/
(dollars)Average Hi^iest Lowest Median
$5,000 and less 18 5,208 270 5.2 40.0 0.0 0.0$5,001-10,000 12 11,812 1,888 16.0 76.1 0.0 0.0$10,001-25,000 16 38,835 16,651 42.9 90.3 0.0 29.9$25,001 and over 20 718,859 373,838 52.0 80.0 0.0 42.5
Total 66 774,714 392,647r. . ---------- a
50 .7»L . . , , .
90.3 0.0I1---------
15.7
Table 12.- Value of Undertakers' Accounts Receivable Delinquent Six Months or More on December 31, 1933, Grouped According to Size of Business
Accounts receivableSize of Business
(annual.sales volum^Numberof
creditorsreporting
Totalamount(dollars)
Amount delinquent six months or more
(dollars)
P e r c e n t
Average Highest
•
••
Lowest: Medlar •
>50,000 and less 31 231,144 125,317 54.2 74.1••
16.0 : 50.0$50,001-100,000 13 380,389 272,638 71.7 85.4
•
22.5 : 64.6$100,001-250,000 12 647,522 331,570 51.2 69.8 10.0 s 50.6$250,001 and over 5 407,609 132,736 32.6 62.9
. •13.6 : 22.0
•
Total 61 1,666,664 862,261 51.7 85.4 10.0 ; 50.3
14 -
Digitized for FRASER http://fraser.stlouisfed.org/ Federal Reserve Bank of St. Louis

Delinquency According to Degree of Credit Business
The business of creditors Is further analyzed in Table 13 according to ratios of delinquency by proportions of credit business. In general, the greater the proportions of credit business the higher the ratios of delinquency.
For all creditors reporting (729) the range was from a delinquency ratio of 11 percent for establishments having the smallest proportion of total business on a credit basis (25 percent or less) to 22 percent for establishments having the largest proportions of credit business (over 75 percent).
Similar figures for the retail group were about the same; 10 and 18 percent, respectively, for service establishments, however, the figures are consistently higher, running 42, 68, 62, and 54 percent for the four quartiles.
It is interesting to notice, in passing, that while only 38 percent (177) of the 469 retailers reported over 75 percent of their 1933 business as credit sales, 77 percent (201) of the service operators so reported.
With respect to the service group an unusual situation was found to exist for the landlord type of creditor, as only two landlords reported 25 percent or less credit business with the remainder (53) reporting all of their business on a credit basis. The reason for this is that most of the landlords cooperating in the study did not follow the usual practice of requiring rent payable in advance and, therefore, listed all of their business on credit. In the case of the two landlords reporting a portion of their business on a credit basis, one reported that rent was required in advance from all but a part of his tenants and the other made a practice of arranging for installment repayments wherever the advance deposit was used up.
- 16 -Digitized for FRASER http://fraser.stlouisfed.org/ Federal Reserve Bank of St. Louis

9i «i»
4
Table 13.- Value of Hetall and Service Creditors' Accounts Receivable Delinquent Si* Months or More on December 31. 1933. ClaseifiedAccording to Degree of Credit Business
Accounts Receivable :Ratio of Delinauent Accounts to Total Accounts by Proportion of Credit BusinessAmount : : 1 to 25 percent 26 to 50 percent: 50 to 75 percent: Over 75 percentt Humber of delinquent : :
Type of creditor : creditors. Total six months : Percent : Number : Ratio Number : Ratio : Number : Ratio: Number : Ratio: reporting amount : or more : : of of : : of of :s (dollars) : (dollars) : : stores stores : : stores stores :
Retail:Department -— ■— — fk U9,530,U22 4,205,634 8.5 7 5-7 34 7.6 27 8.7 6 19-9Electrical goods-- 56 2.035.6*4 425,277 20.9 2 32.7 12 19.7 8 41.4 34 20.3Purniture — ----- 82 19.629.533 3.501.U99 17.8 2 41.4 4 52.8 7 24.4 69 17.5Grocery------ ■— 113 1*3^3.200 308,871 23«0 16 15.6 24 30.1 44 28.7 29 18.3Ken's clothing--- 75 4,530.734 774,730 17.1 13 16*3 21 9.7 24 19.3 17 27.7Women's clothing -- 69 7 .060,759 1,308,203 18.5 8 43.3 14 25.1 25 14.0 22 19.0
Service:Dentist -— ------- 84 366,025 206,263 56.4 7 37.1 9 67.O 11 52.2 57 56.7Doctor (M.D.) — — - 60 518.361 352.037 67.9 1 88.7 8 71.9 9 62.9 42 68.3Landlord — ---— 55 409,809 197.182 48.1 2 71.9 - - - - 53 47.7Undertaker — — -— - 6l 1.703.37U 891,382 52.3 5 32.5 4 64.8 3 67.4 49 52.0
Be tail (excludingDepartment stores) 395 34,599.910 6,318,580 18.3 Ui 21.9 75 19.3 108 17.6 171 18.2
Total Betall ----- 469 8U. 130,332 10,524,214 12.5 48 9-7 109 9.2 135 10.5 177 18.3Total Service -— — 260 2.997.569 1,61+6,864 54.9 13 41.5 21 67.5 23 62.4 201 5U.3Grand Total — ---- 729 87.127.901 12 171.078 14.0 63’ 10.6 130 9*4 158 10.8 378 21.6
Digitized for FRASER http://fraser.stlouisfed.org/ Federal Reserve Bank of St. Louis
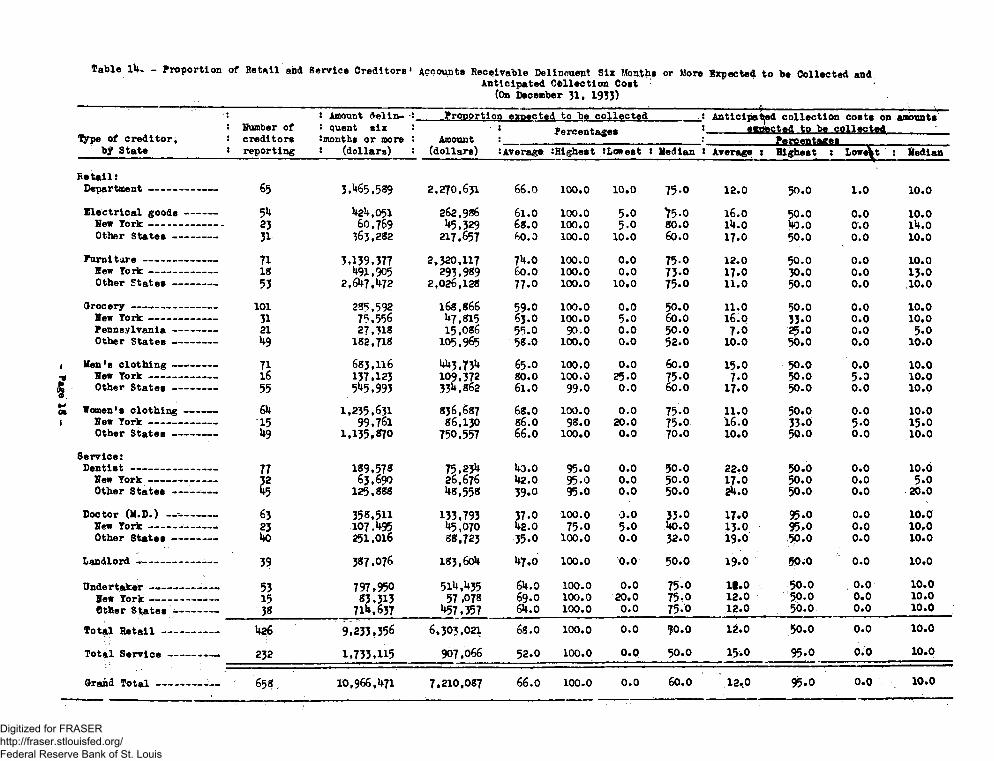
Delinquent Accounts Expected to be Qollected
Creditors were asked: H0f the book value of accounts delinquent six months or more, what proportion do you expect to collect?" A total of 658 creditors furnished percentage estimates on this question which were converted to dollars for purposes of obtaining arithmetic averages. The figures on this basis were 66 percent for the total group, as shown In Table 14.
The proportion expected to be collected for the retail group amounted to 68 percent, whereas the service group expected to collect a smaller proportion or 52 percent. The median average showed approximately the same result for each group, the figures being 70 percent and 50 percent for the retail and service groups, respectively.
Furniture dealers were the most optimistic of all types of creditors reporting. The 71 furniture creditors reporting indicated that, on the average, they expected to collect 74 percent of their delinquent accounts.A contributing factor to the situation may be the practice of furniture stores in repossessing merchandise where necessary to effect final liquidation of the account. This is borne out by Table 15, which shows that 75 percent of the furniture creditors reported repossession as a method used in collecting delinquent accounts.
The anticipated costs of collecting delinquent accounts is about the same on the average for the retail and service groups. The retail creditors reported that of the amount they expected to collect, 12 percent would be spent in collection costs; for the service creditors the estimated figure on the average was 15 percent. The higher figure for the latter group was caused largely by the 77 dentists whose estimate averaged 22 percent.
- IT -
Digitized for FRASER http://fraser.stlouisfed.org/ Federal Reserve Bank of St. Louis
Page 18
Table lU - Proportion of Betail and Service Creditors 1 Accounts Receivable Delinouent Six Months or More Expected to be Collected and Anticipated Collection Cost (On December 31, 1933)
Type of creditor, bf State
Humber of creditors
Amount delinquent six
Proportion expected to be collectedAmount Percentages
Anticipated collection costs on amounts ----- wp^cted to be collected
Betail:Department ------- —Electrical goods -----New York --------Other States----- -
Purnitare--- ----- -New York ------- -—Other States -----
Grocery -— --------- -Hew York ----------Pennsylvania ------Other States -------
lien's clothing -------Hew York----.--- -—Other States ------
Women's clothing -----Hew York -------- —Other States -------
Service:Dentist -----r-------Hew York----------Other States ----—
Doctor (M.D.) --- -—Hew York----------Other States ------
Landlord *--------- -Undertaker — — ----— -
Hew York-------—Other States ----— -
Total Detail — j------Total Service-----—
Grand Total -------■
: reporting : (dollars) i (dollars) :Average :Highest SLowest S Median 1 Average t Highest : LowAt Median
65 3,^5.589 2,270,631 66.0 100.0 10.0 75-o 12.0 50.0 1.0 10.0
5** U2U.051 262,986 61.O 100.0 5.0 >5-0 16.0 50.0 0.0 10.023 60,769 5.329 68.0 100.0 5-0 80.0 1U.0 *10.0 Or.O 1U.031 363,282 217,657 60. D 100.0 10.0 60.0 17.0 50.0 0.0 10.071 3.139,377 2,320,117 7**.0 100.0 0.0 75-0 12.0 50.0 0.0 10.018 **91.905 293.989 60.0 100.0 0.0 73.0 17.0 30.0 0.0 13.053 2,6U7.**72 2,026,128 77.0 100.0 10.0 75.0 11.0 50.0 0.0 10.0
101 28*5,592 168,866 59.0 100.0 0.0 50.0 11.0 50.0 0.0 10.031 75,556 **7.815 63.O 100.0 5.0 60.0 16.0 33.0 0.0 10.021 27.318 15.086 55.0 90.0 0.0 50.0 7.0 25.0 0.0 5.0U9 182,718 105,965 58.0 100.0 0.0 52.0 10.0 50.0 0.0 10.071 683,116 **3.73** 65.0 100.0 0.0 60.0 15.0 50.0 0.0 10.016 137.123 109,372 80.0 100.0 25.0 75.0 7.0 50.0 5.3 10.055 5 5,993 33**. 862 61.0 99.0 0.0 60.0 17.0 50.0 0.0 10.06U 1.235.631 836,687 68.0 100.0 0.0 75-0 11.0 50.0 0.0 10.015 99.761 86,130 86.0 98.0 20.0 75.0 16.0 33.0 5.0 15.0U9 1,135.870 750,557 66.0 100.0 0.0 70.0 10.0 50.0 0.0 10.0
77 189.578 75.23** 140.0 95.0 0.0 50.0 22.0 50.0 0.0 10.0?2 63,690 26,676 U2.0 95.0 0.0 50.0 17.0 50.0 0.0 5.065 125,888 **8,558 39.0 95.0 0.0 50.0 2U.0 50.0 0.0 20.063 358.511 133.793 37.0 100.0 0.0 33-0 I7.O 95.0 0.0 10.023 10 7.**95 **5,070 U2.0 75.0 5.0 1*0.0 13.0 95.0 0.0 10.0>40 251.016 88.723 35.0 100.0 0.0 32.0 19.0 >50.0 0.0 10.039 387.076 I83,60U **7.0 100.0 0.0 50.0 19.0 50*o 0.0 10.0
53 797.950 51**.**35 6U.0 100.0 0.0 75-0 11.0 50.0 0.0 10.015 83.313 57 ,078 69.O 100.0 20.0 75-0 12.0 50.0 0.0 10.038 71H .637 **57.357 6U.0 100.0 0.0 75.0 12.0 50.0 0.0 10.0U26 9.233.356 6,303,021 68.0 100.0 0.0 $0.0 12.0 50.0 0.0 10.0232 1.733.U5 907,066 52.0 100.0 0.0 50.0 15.0 95.0 0.0 10.0
65? 10,966,1*71 7.210,087 66.0 100.0 0.0 60.0 12,0 95.0 0.0 10.0
Digitized for FRASER http://fraser.stlouisfed.org/ Federal Reserve Bank of St. Louis
Methods Used In Collecting Delinquent Account a
Over 800 creditors report that dunning letters and personal visits were the most common methods used in collecting accounts delinquent six months or more. Of these two, the second is employed much more frequently by retailers than by the service operators. (See Table 15.)
A private collection agency and suits, two other methods,, were reported by about four out of ten creditors. Both retail and service establishments used the former to about the same proportion, but proportionately only a little more than one half the service creditors resorted to suits, as compared with the retailers.
Although almost one-third of the retailers reported that they repossessed merchandise sold but unpaid for at the end of six months, none of the grocers and very few of the men’s and women's clothing store proprietors reported such a policy. The only service group to report repossession was the landlord.
One striking fact found in the following table is that so few of these retail and service creditors use merchant credit bureaus. The only exceptions to this conclusion were department stores and men’s and women's clothing stores, for all of which the figure is over 30 percent.
With two exceptions, all of the creditors reported using one or more methods in collecting delinquent accounts. One undertaker stated, however,
that no method was used in collecting delinquent accounts because "when they have money they will pay - old families." A physician stated, with reference to the same question: H3Ione, because conditions specifically known in each
instance."
- 19 -Digitized for FRASER http://fraser.stlouisfed.org/ Federal Reserve Bank of St. Louis

Table 15-- Methods Used by Retail #nd Service Creditor* In Collecting Accounts OellnoucBt SI* Month* or More on December 31, 19J3
Typ#of
creditor> Number t creditors: (reporting) i t
t Dunning letters < Personal visit* s
Humber : '•
using : Percent »____ :__ __ISomber :using I Percent
Private collection: .15SSSX_______5
Repossession
Sumter I using > Percent__ I __
Numberusing Percent
Somber t :using : Percent >
s Merchant* credit bureau
OtherBianber : S
using i Percent :____ __!________ L
Somber : using ! Percent
Betall;Be partnent 95 83 87.U 78 82.1 58 6li,l 56 58.9 59 62.1 k8 50.5 17 17 .9Pennsylvania 16 8 50.0 12 75.0 6 37-5 5 8 50.0 5 31.3 3 18.8Otter 79 75 9**.9 66 83.5 52 65.8 51 6k.6 51 6k. 6 k3 5k.k ik 17.7
Zlectrloal rood* 66 55 83.3 60 90.9 20 30.3 17 25.8 31 k7 .o 12 18.2 6 9.1Sew Tork 26 2U 92.3 23 88.5 7 26.9 8 30.8 9 3U.6 5 19.2 0 __Other Uo 31 77-5 37 92.5 13 32.5 9 22.5 22 55-0 7 17.5 6 15.0
furniture 93 8k 90.3 85 91. k 23 2k. 7 k6 k9.5 70 75.3 11 11.8 6 6.5Sew Tork 19 17 89-5 19 100.0 5 26.3 10 52.6 11 57-9 3 15.8 1 5.3Other 7k 67 90.5 66 89.2 18 2k. 3 36 ks.6 59 79.7 8 10.8 5 6.8Qrooorj 121 8k 69.H 106 87.6 36 29.8 31 25.6 0 22 18.2 18 ik. 9lew Tork 3® 28 73-7 3>* 89-5 9 23.7 9 83.7 0 - 3 7.9 6 15.8Pennsylvania 6 26.1 19 82.6 1 k.3 2 8.7 0 2 8.7 0Otheri 60 50 83.3 53 88.3 26 >*3.3 80 33.3 0 - 17 28.3 12 20.0
£ Mra's clothing 86 7k 86.0 78 90.7 US 53.5 Ul k7-7 2 2.3 31 36.0 a 2k.k1 lew Tork 16 16 100.0 10 68.5 8 50.0 7 k3.8 0 _ 1 6.3 1 6.3g Other 70 58 82.9 68 97.1 38 5k. 3 3k ks.6 2 2.9 30 U2.9 20 28.61 Vamn's clothing 67 63 9k.O 39 58.2 U7 70.2 32 k7,8 5 7-5 22 32.8 20 29.9Vow Tork 17 Ik 82. U 8 kj.l 13 76.5 8 k7fl 1 5.9 2 11.8 3 1 7 .6Otter 50 k9 98.0 31 62.0 3k 68.0 2k kf.p k 8.0 20 ko.o 17 3k.0Servicet
96Dentist 88 91.7 30 31.3 *♦7 U9.0 28 w»e 0 • 22 22.9 71 32.3Sew. Tortc 3* 3k 89.5 8 21.1 19 50.0 IP jtb.3 0 _ ik 10.5 17 kk.7Otter 5 « 5k 93.1 ?2 37-9 28 U8.3 18 Il.p 0 - 18 31.0 ik 2k. 1
Doctflfr(n.S.) 7* 71 91,0 18 23.1 16 U6.2 S>1n-5 0 6 7-7 15 19.2Sew Tork 29 ?7 93.1 5 17.2 13 kU.S 10,3 0 _ 1 3.U 2 6.9Otter **■9 »*7 95.9 13 26.5 23 U6.9 d fP.2 0 - 5 10 .2 13 26.5
Landlord 68 29 U2.6 k6 67.6 15 22.1 30,9 22 32.3 I 1.5 16 23*5Sew Toik 22 9 k0.9 16 72.7 5 22.7 9 ko.9 3 13.6 0 8 36.4Otter 1*6 20 kj.5 30 65.2 10 21.7 26,1 19 kl.3 X 2.2 8 . 17 .kUndertaker 69 57 12.6 61 88. k 27 39.1 18 26.» 0 7 10.1 8 11.6Sew Toik 17 16 9U.1 lk 82. k 9 52-9 k 81.5 0 3 17 .6 1 5.9Other 52 kl 78.8 *»7 90. U 18 3k. 6 lk 0 - k 7.7 7 13.5Total Retail total 8*rvloe
52*311
UUJ2k5
83.9
78.8kk6155
8U.5
U9.8
230
125*3.6U0.2 76
ka.28k.U
167
2231.6
7.1V*36
87-71 1 .6
8870
16 .7
21.5Orand Total 839 688 82.0 601 71 .6 355 k?.j 299 35-6 189 22.5 182 81.7 158 18,8
Digitized for FRASER http://fraser.stlouisfed.org/ Federal Reserve Bank of St. Louis
Sources of Credit Used by Creditors
The commercial hank was reported most frequently by both the retail and service creditors as the source of credit used In the conduct of their business. Of 527 retail creditors reporting, 239 or 45 percent checked the regular terms of banks as a source of credit; for the 278 service creditors reporting, 79 or 28 percent checked the same agency as a source (Table 16).
Cooperative credit associations (26 percent) and wholesalers or factors (22 percent), were also an important source of credit for the retail group. For the service group of creditors, the second most Important source of credit was the assistance obtained from relatives or friends.
The group of creditors rendering service alone had, as to be expected, less occasion to secure credit from outside sources than the group of creditors selling merchandise. The number of service creditors that reported using no agency for credit requirements was 117 or 42 percent of the total, as compared with 55 or 10 percent of all retail creditors reporting.
- 21 -Digitized for FRASER http://fraser.stlouisfed.org/ Federal Reserve Bank of St. Louis
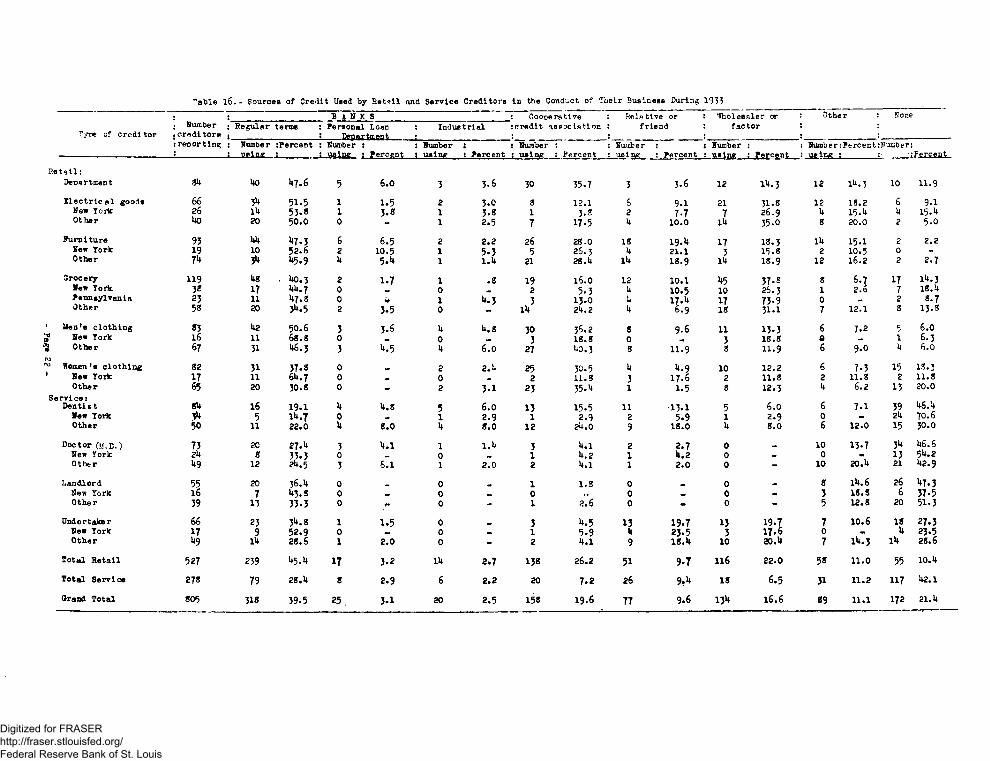
Table l6.- Sources of Credit Used by Ret»ll and Service Creditors in the Conduct of Their Business During 1933
b a n k s : Cooperative Relative or Wholesaler or : Other None
Tyre of credi tor. Number •creditors
Regular terms : Personal Logn ! Department
: Industrial tcredit association friend factor,
; reporting Number ;Percent : Number : : Number : S Number : Number : Number : : Number:Percent JJuaber:
• usin? ! : using s Percent : us in* : Percent : using : Percent using : Percent using : Percent : uein* : . .-Percent.
Re 19 i1:
Deosrtment 8U Mo U7.6 5 6.0 3 3.6 30 35.7 3 3.6 12 1U.3 12 1U.3 10 11.9
Electrical goods 66 3>» 51.5 1 1.5 2 3.0 8 12.1 6 9.1 21 31.8 12 18.2 6 9.1New York 26 lU 53-8 1 3.8 1 3.8 1 3.2 2 7-7 7 26.9 U 15 . u U 15 . uOther MO 20 50.0 0 - 1 2.5 7 17.5 u 10.0 lU 35.0 8 20.0 2 5.0
Furniture 93 UU »*7-3 6 6.5 2 2.2 26 28.0 18 19 .U 17 18.3 lU 15.1 2 2.2New York 19 10 52-6 2 10.5 1 5.3 5 26.3 U 2 1.1 3 15.8 2 10.5 0 -Other 7* 3U U5.9 U 5.U 1 l.U 21 28.U 1U 18.9 lU 18.9 12 16.2 2 2-7
Grocery 119 Us • U0.3 2 1.7 1 .8 19 16.0 12 10 .1 U5 37.3 8 6.7 17 1U.3New York 38 17 UU.7 0 0 2 5.3 u 10.5 10 26.3 1 2.6 7 18.UPennsylvania 23 n 1*7.8 0 a 1 U.3 3 13.0 u 17 . u 17 73.9 0 2 8.7Other 58 20 3U.5 2 3.5 0 lU 24.2 u 6.9 18 31.1 7 12.1 8 13.8
1 Men's clothing 83 U2 50.6 3 3-6 u U.8 30 36.2 8 9-6 11 13.3 6 7.2 cJ 6.0
JJ New York 16 11 68.8 0 0 3 18.8 0 3 18.8 0 _ 1 6.3Other 67 31 U6.3 3 U.5 U 6.0 27 U0.3 8 11.9 8 11.9 6 9.0 U 6.0
ro1X1 Women's clothing 82 31 37.3 0 2 2.U 25 30.5 U U.9 10 12.2 6 7.3 15 13.31 New York 17 11 6U.7 0 _ 0 _ 2 11.8 3 17 .6 2 11.8 2 11.8 2 11.8
Other 65 20 30.8 0 2 3 .1 23 35. U 1 1.5 8 12-3 U 6.2 13 20.0
Service s Dentl c t SU 16 19.1 U U.8 5 6.0 13 15.5 11 13.1 5 6.0 6 7-1 39 U6.M
New Yoric 5 1U.7 0 _ 1 2.9 1 2.9 2 5.9 1 2.9 0 - 2U 70.6Other 50 11 22.0 u 8.0 U 8.0 12 2U.0 9 18.0 U 8.0 6 12.0 15 30.0
Doctor (M.D.) 73 20 27. U 3 U.l 1 l.U 3 U.l 2 2.7 0 _ 10 13.7 3U Ub.6New York zk 8 33.3 0 _ 0 .. 1 U.2 1 U.2 0 0 - 13 5U.2Other U9 12 2U.5 3 6.1 1 2.0 2 u.l I 2.0 0 - 10 20.U 21 U2.9
Landlord 55 20 36.U 0 0 1 1.8 0 0 8 1U.6 26 *+7.3New York 16 7 1+3.5 0 0 .. 0 .. 0 0 - 3 18. S 6 37.5Other 39 13 33.3 0 0 - 1 2.6 0 - 0 - 5 12.8 20 51.3
Undertaker 66 23 3U.8 1 1.5 0 3 U.5 13 19.7 13 19.7 7 10.6 18 27.3New York 17 9 52.9 0 0 1 5.9 U 23.5 3 17 .6 0 - k 23.5Other U9 lU 28.6 1 2.0 0 - 2 U.l 9 18.U 10 20.U 7 1U.3 lU 28.6
Total Retail 527 239 U5 .U 17 3-2 lU 2.7 138 26.2 51 9.7 116 22.0 58 11.0 55 10. U
Total Service 278 79 28.U 8 2.9 6 2.2 20 7.2 26 9.U 18 6.5 31 11.2 117 U2.1
Grand Total 805 318 39-5 25 . 3-1 20 2.5 158 19.6 77 9.6 13* 16.6 89 11.1 172 21. U
Digitized for FRASER http://fraser.stlouisfed.org/ Federal Reserve Bank of St. Louis

Accountb Receivable Compromised
Creditors were asked if any delinquent claims with debtors were compromised over a period of six months. The table below shows the answers to this question and indicates that the percentage of retail and service creditors effecting a compromise of delinquent accounts was approximately the same. For the retail group 232 or 45 percent of the total reporting followed this practice; 138 or 48 percent of the total service group reporting did likewise. The average number of accounts compromised by the retail group was 19; for the service grot?) 16.
Table 17.- Number of Retail and Service Creditors1 Accounts Receivable Compromised During Six Months Period, 1933-1934••
Type of creditor s:Number of i creditors : reporting :
Creditors effecting conroromi ee
Number :* PercentAccounts
To tal number
compromised : Average : number
Retail:Department ...... . 89 44 49.4 1,088 25Electrical goods ... 63 33 52.4 597 18Furniture ......... 92 58 63.0 2,138 37Grocery .......... 113 38 33.6 160 4Men's clothing .... 84 27 32.1 165 6Women's clothing ... 77 32 41.6 139 4
Service:Dentist ........... 89 50 56.2 382 8Doctor (M.D.) ..... 74 42 56.8 1,098 26Landlord ......... 59 18 30.5 418 23Undertaker ......... ___£5 . . . 28 43.1 251 9Total Retail ...... 518 232 44.8 4,287 19Total Service..... 287 138 48.1 2,149 16Grand Total ........ 805 370 46.0 6,436 17
- 23 -
Digitized for FRASER http://fraser.stlouisfed.org/ Federal Reserve Bank of St. Louis
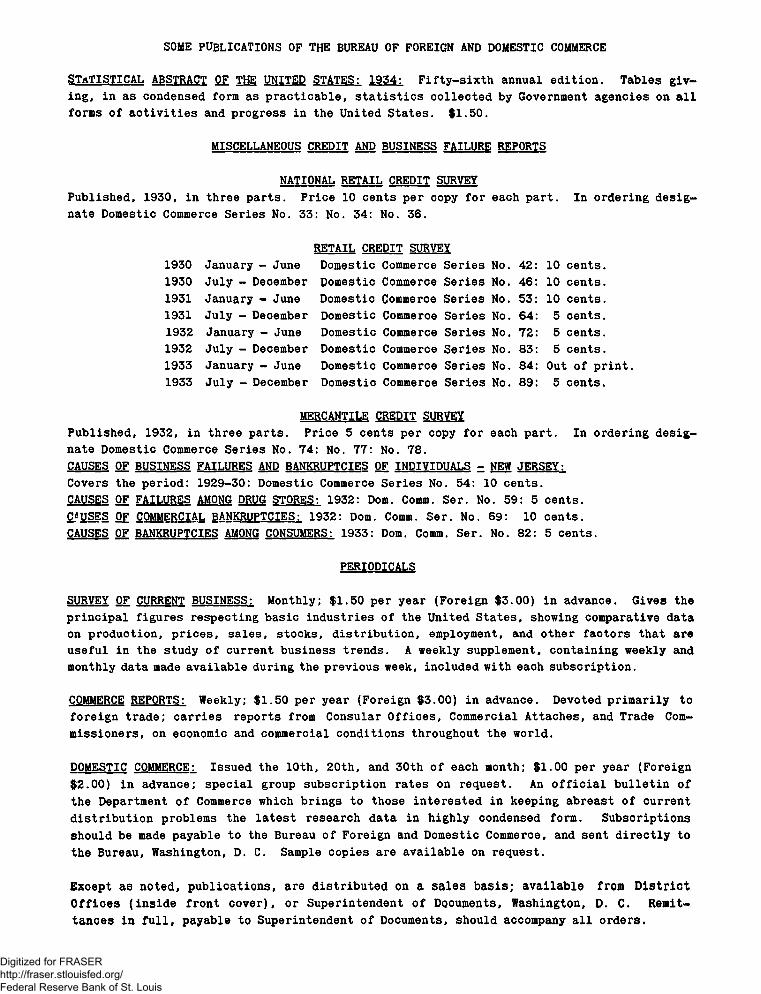
SOME PUBLICATIONS OF THE BUREAU OF FOREIGN AND DOMESTIC COMMERCE
STATISTICAL ABSTRACT OF THE UNITED STATES: 1954: Fifty-sixth annual edition. Tables giving, in as condensed form as practicable, statistics collected by Government agencies on all forms of activities and progress in the United States. $1.50.
MISCELLANEOUS CREDIT AND BUSINESS FAILURE REPORTS
NATIONAL RETAIL CREDIT SURVEY Published, 1930, in three parts. Price 10 cents per copy for each part. In ordering designate Domestic Commerce Series No. 33: No. 34: No. 36.
RETAIL CREDIT SURVEY1930 January - June Domestic Commerce Series No. 42: 10 cents.1930 July - December Domestic Commerce Series No. 46: 10 cents.1931 January - June Domestic Commerce Series No. 53: 10 cents.1931 July - December Domestic Commerce Series No. 64: 5 cents.1932 January - June Domestic Commerce Series No. 72: 5 cents.1932 July - December Domestic Commerce Series No. 83: 5 cents.1933 January - June Domestic Commerce Series No. 84: Out of print.1933 July - December Domestic Commerce Series No. 89: 5 cents.
MERCANTILE CREDIT SURVEY Published, 1932, in three parts. Price 5 cents per copy for each part. In ordering designate Domestic Commerce Series No. 74: No. 77: No. 78.CAUSES OF BUSINESS FAILURES AND BANKRUPTCIES OF INDIVIDUALS = NEW JERSEY:Covers the period: 1929-30: Domestic Commerce Series No. 54: 10 cents.CAUSES OF FAILURES AMONG DRUG STORES: 1932: Dom. Comm. Ser. No. 59: 5 cents.CAUSES OF COMMERCIAL BANKRUPTCIES: 1932: Dom. Comm. Ser. No. 69: 10 cents.CAUSES OF BANKRUPTCIES AMONG CONSUMERS: 1933: Dom. Comm. Ser. No. 82: 5 cents.
PERIODICALS
SURVEY OF CURRENT BUSINESS: Monthly; $1.50 per year (Foreign $3.00) in advance. Gives the principal figures respecting basic industries of the United States, shoving comparative data on production, prices, sales, stocks, distribution, employment, and other factors that are useful in the study of current business trends. A weekly supplement, containing weekly and monthly data made available during the previous week, included with each subscription.
COMMERCE REPORTS: Weekly; $1.50 per year (Foreign $3.00) in advance. Devoted primarily to foreign trade; carries reports from Consular Offices, Commercial Attaches, and Trade Commissioners, on economic and commercial conditions throughout the world.
DOMESTIC COMMERCE: Issued the 10th, 20th, and 30th of each month; $1.00 per year (Foreign $2.00) in advance; special group subscription rates on request. An official bulletin of the Department of Commerce which brings to those interested in keeping abreast of current distribution problems the latest research data in highly condensed form. Subscriptions should be made payable to the Bureau of Foreign and Domestic Commerce, and sent directly to the Bureau, Washington, D. C. Sample copies are available on request.
Except as noted, publications, are distributed on a sales basis; available from District Offices (inside front cover), or Superintendent of Documents, Washington, D. C. Remittances in full, payable to Superintendent of Documents, should accompany all orders.
Digitized for FRASER http://fraser.stlouisfed.org/ Federal Reserve Bank of St. Louis
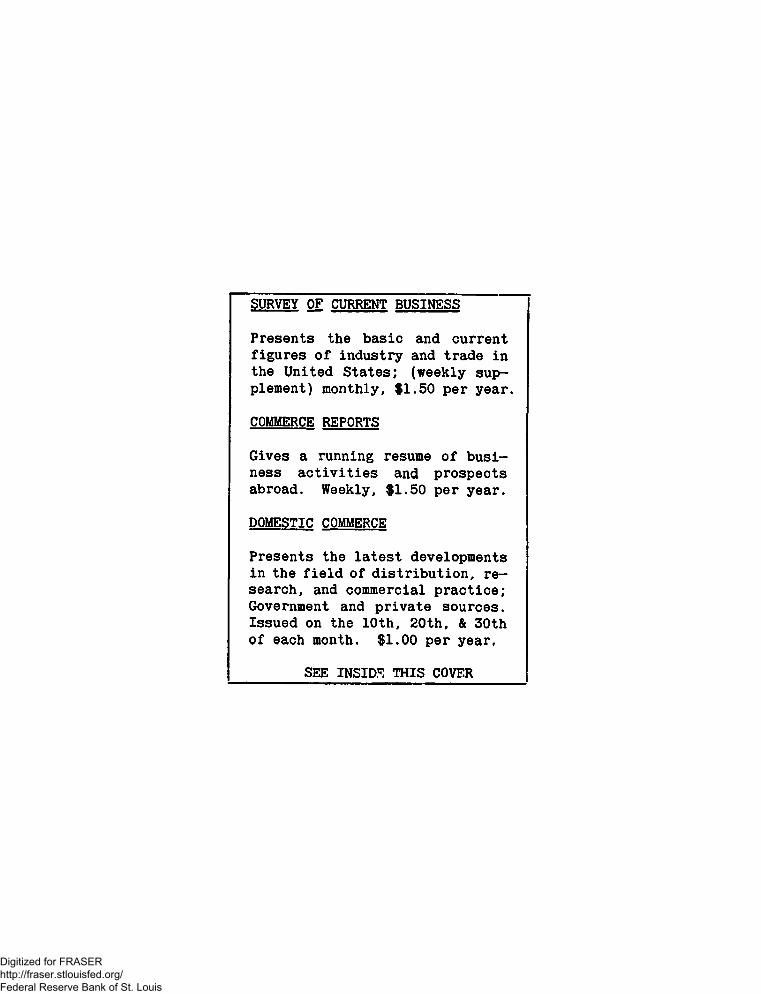
SURVEY OF CURRENT BUSINESS
Presents the basic and current figures of industry and trade in the United States; (weekly supplement) monthly, $1.50 per year.
COMMERCE REPORTS
Gives a running resume of business activities and prospects abroad. Weekly, $1.50 per year.
DOMESTIC COMMERCE
Presents the latest developments in the field of distribution, research, and commercial practice; Government and private sources. Issued on the 10th, 20th, & 30th of each month. $1.00 per year.
SEE INSIDS THIS COVER
Digitized for FRASER http://fraser.stlouisfed.org/ Federal Reserve Bank of St. Louis