consumer adoption of sustainable energy …
TRANSCRIPT

CONSUMER ADOPTION OF SUSTAINABLE ENERGY TECHNOLOGY –
THE CASE OF SMART GRID TECHNOLOGY
By Madeleine Broman Toft
A PhD thesis submitted to
Business and Social Sciences, Aarhus University,
in partial fulfilment of the requirements of
the PhD degree in
Business Administration
September 2014

i
ACKNOWLEDGEMENT
A wise professor told me once when I had doubts about starting a life as a PhD student
that writing a PhD is like obtaining a license to do research, no worse than that. Those words
I have brought with me on this trip, and luckily she (Liisa Lähteenmäki) did not mention the
bumpy roads, speed chicanes and steep slopes, not to mention the psychological tests you
have to pass to get this license. Because I doubt that I would have gone on this trip had I
known this.
Now the day for my "research" license test is approaching, and I can look back on three
years filled with many experiences: challenges, traveling, meetings with new people and lots
of new knowledge. However, I think the greatest experience is that I have proved to myself
that everything is possible as long as you want it enough.
I think that in a few years I can look back at my life and feel proud that I have
contributed something to society. Maybe, not something big like the cure for cancer or the
invention of power. But a contribution to how Smart Grid technology, a technology that may
contribute to reducing the negative impact the use of electricity has on our environment, can
be marketed to diffuse successfully among private consumers.
I would like to thank my supervisor John Thøgersen who believed in me and gave me
the opportunity to do research in this important topic: you have literally been my "road-
guide" on this trip and shown me the path I should take when there were several to choose
from. You have broadened my horizons and been there to answer many of my questions
when I knocked on your door.

ii
Anything is possible as long as you want it enough, but often only with the help from
others. In addition to John, there are some key people who helped me make the impossible
possible:
Geertje Schuitema: you've always had your door open for me, being able to discuss
things with you has the weight of gold for me, you have spent much time explaining things
I've found difficult, not to mention all the encouraging comments you've given me in times of
frustration. Thanks for everything! I also want to thank my co-supervisor Alice Grønhøj for
the help and guidance.
My dear “travelling companion” and office-mate Pernille Haugaard: you have
supported me in the ups and downs that a PhD life contains; for me, you have been the good
Samaritan who helped me on the way at times when it felt like I crashed into a rock wall. To
my second office-mate Livia Marian, thanks for the glorious inputs through the years. My
PhD life would not have been the same if we had not shared office Pernille, you and I.
Sabine Müller, I really appreciate the time you took to help me, thanks!
Henk Staats, thank you for the hospitality that you and Leiden University showed me
during my research environment exchange; it was amazing to visit you and have the
opportunity to focus on one of my articles.
My beloved husband, Peter, thanks for pushing me towards a life as a PhD student and
for the support you have given me all the way, without you, I am nothing. To my beloved
children, George and Sofia, thank you for putting up with a mother who at times was
stressed, angry and grumpy because of staying up to late at night, working. You are the best
children in the whole world.

iii
To the rest of my family and friends: thank you for the support, encouragement and
interest you have shown me and my project
I also would like to express my gratitude to Birgitte Steffensen for the fantastic work of
proof reading she has done with this thesis.
My PhD would not have been possible without the support of the two projects
IMPROSUME and READY financed by Energinet.dk, for that I would like to say thanks, and
thanks to all the partners in the projects.
Last but not least, I want to send special thanks to my assessment committee Professor
Henk Staats, Professor Moritz Loock and Professor Liisa Lähteenmäki for the valuable
recommendations you have given me helping me to improve my work.
Aarhus, 21 November 2014

iv
“getting a new idea adopted, even when it has obvious
advantages, is difficult”
(Rogers, 2003)

v
RESUMÉ
Denne ph.d.-afhandling bidrager med en undersøgelse af forbrugernes accept og
anvendelse af bæredygtig energiteknologi. Mere specifikt består den af en række studier
omhandlende, hvilke faktorer der er afgørende for udbredelsen af Smart Grid-teknologi
blandt private forbrugere. I introduktionen bliver det redegjort for at motivation, tid og
ressourcer har indflydelse på, hvilke kognitive processer (systematiske og / eller
automatiske), der kommer i spil, når forbrugeren træffer en beslutning. Velvidende at
forbrugerne ikke altid tænker tingene grundigt igennem, inden de tager en beslutning, men
også handler på impulser og heuristik, præsenterer denne afhandling et sæt
forskningsspørgsmål, som behandles i tre artikler. Disse udforsker mulighederne i forbindelse
med både accept og anvendelse af Smart Grid-teknologi. De spørgsmål, som ønskes besvaret
med denne afhandling, er:
Hvem er villig til at installere og bruge Smart Grid-teknologi i sit hjem?
Hvilke motivationsfaktorer spiller ind for forbrugernes accept af Smart Grid-
teknologi, dvs. får dem til at indvillige i at få denne teknologi installeret i deres hjem?
Hvilke(n) metode(r) kan bruges til at motivere private forbrugere til at træffe en
beslutning om at installere og bruge Smart Grid-teknologi?
Mål og bidrag fra hver af forskningsartiklerne præsenteres kort i det følgende.
Artikel 1: Betydningen af ”early adopters” for en ny innovations succes er
dokumenteret i tidligere forskning. Derfor var formålet med denne undersøgelse at
undersøge, hvem der er villige til at få Smart Grid-teknologi installeret i deres hjem i en tidlig
fase af innovationens livscyklus – og hvorfor. I denne artikel er det empirisk undersøgt, om
de forbrugere, der allerede har andre typer af ny energiteknologi, såsom en jordvarmepumpe,

vi
er mere positivt indstillet over for Smart Grid-teknologi end andre forbrugere. Desuden blev
det undersøgt, om forbrugere, der har meldt sig til, at deres varmepumpe kunne bruges som
fleksibel kapacitet i et forsøg, adskiller sig fra andre varmepumpeejere. 24 danske husstande
deltog i dybdeinterviews og besvarede ydermere et spørgeskema. Analysen af disse data
viser, at de deltagende husholdninger ikke er lige villige til at benytte sig af Smart Grid-
teknologi, og at forbrugernes opfattelse om hvornår beslutningen skal/kan træffes (afstand i
tid) påvirker deres villighed til at få denne teknologi ind i deres hjem. De forbrugere, der er
mest tilbøjelige til at indføre Smart Grid-teknologi, findes i det segment, som har haft
mulighed for at afprøve teknologien. Dette segment var også det, som vi fandt, havde den
mest positive indstilling til denne nye teknologi. Denne forskningsartikel bidrager med
indsigt i, hvilke forbrugersegmenter som det vil give mest mening at målrette sig mod, når
Smart Grid-teknologi skal markedsføres på det private forbrugermarked. Resultatet antyder
også, at det er behov for særlig markedsføring rettet mod segmentet med varmepumpe, idet
de har specifik behov for information. Det anbefales også at lade forbrugerne afprøve
teknologien før køb, idet dette kan have en positiv effekt på deres villighed til at bruge den
fuldt ud. Ved at kombinere Diffusion of Innovation teori med Construal Level teori i en
analyse af forbrugernes villighed til at installere og bruge Smart Grid-teknologi bidrager
denne undersøgelse med empiriske resultater, der bekræfter de antagelser, som kan udledes af
Construal Level teori, nemlig at forbrugerne vurderer det at anskaffe sig og bruge Smart Grid
teknologi forskelligt, alt efter om de opfatter det at gennemføre handlingen som noget, der
skal gøres indenfor nær fremtid, respektive langt ude i fremtiden.
Artikel 2: Meningsmålinger og Smart Grid-projekter viser, at forbrugernes engagement
i Smart Grid hovedsageligt afhænger af to faktorer: kortsigtede økonomiske motiver, såsom
en lavere elregning og kontrol over elforbruget, og miljømæssige motiver. Derfor er formålet

vii
med dette studie empirisk at undersøge betydningen af egeninteresse og miljømæssige
motiver for forbrugernes accept af Smart Grid-teknologi. Accept blev analyseret i en model,
der kombinerer to velkendte social-kognitive modeller, Technology Acceptance-Modellen og
Norm Activation-Modellen, til en ny model, kaldet “the Responsible Technology Acceptance
Model”. En online-undersøgelse blev gennemført i tre lande, Danmark, Norge og Schweiz.
Resultaterne viser for alle tre lande, at Responsible Technology Acceptance-Modellen giver
en bedre forklaring af private forbrugeres motivation for at få installere Smart Grid-teknologi,
end de to velkendte modeller hver for sig. Det viser, at rationelle vurderinger ikke er de
eneste overvejelser, forbrugerne gør sig, når de beslutter sig for Smart Grid-teknologi.
Moralsk forpligtelse og ansvarsfølelse over for miljøet og samfundet er også faktorer, der
spiller en vigtig rolle. Det betyder, at når Smart Grid-teknologi skal markedsføres, er det
vigtigt ikke kun at fremhæve de individuelle fordele ved at anskaffe sig teknologien –
samfundsmæssige og miljømæssige fordele bør også tydeliggøres i kommunikationen til
potentielle bruger.
Artikel 3: Forskning i forbrugernes interesse i energispørgsmål og elforsyning i
almindelighed afslører en lav involveringsgrad i disse emner. Derfor har dette studie til
formål empirisk at undersøge, med udgangspunkt i adfærdsøkonomisk forskning i
betydningen af ”default” for individers valg, hvorvidt man blot ved en omhyggelig
formulering af spørgsmålet (til forbrugerne, om de ønsker at deltage i den intelligente
elforsyning, Smart Grid) kan påvirke deres deltagelse i Smart Grid (dvs. accept af Smart
Grid-teknologi). Forbrugerne blev tilfældigt tildelt én af tre muligheder i en online-
undersøgelse foretaget i tre lande, Danmark, Norge og Schweiz (N = 3.082). Forsøget blev
gentaget i et feltforsøg med danske husejere, der har en varmepumpe (N = 140). To af
mulighederne var formuleret som enten tilvalg eller fravalg, og den tredje var "neutral" i

viii
udgangspunktet (dvs. deltagerne skulle foretage et aktivt valg, uden at have en ”default” at
kunne falde tilbage på). Resultaterne i begge studier viste, at når forbrugerne skulle melde fra
(fravalg), hvis de ikke ønskede at få Smart Grid teknologi installeret, genererede det en højere
deltagelse end tilvalgs metoden. Den neutrale formulering resulterede i samme deltagelse
som fravalgsmuligheden i online-eksperimentet. Men i det virkelige liv kan man ikke tvinge
folk til at træffe et valg ved at bruge den neutrale formulering. Resultaterne viser, at når man
kan tvinge folk til at træffe et valg er fravalgs- og neutrale formuleringer af en invitation til at
deltage lige effektive og væsentligt mere effektive end formuleringen, hvor forbrugerne skal
vælge til. Tilvalgsmetoden giver forbrugerne mulighed for at forholde sig passivt og gør, at
mange forbrugere udskyder beslutningen (på ubestemt tid), formentlig fordi de ikke er
motiverede for at investere den nødvendige mentale indsats for at træffe en beslutning. Den
neutrale metode synes i princippet ideel, men kan ofte ikke anvendes i praksis, fordi det ikke
er muligt at tvinge forbrugerne til at foretage et valg. Det betyder, at fravalgsformuleringen
vil være den foretrukne metode til at motivere forbrugerne til at træffe en beslutning om
anskaffelse af Smart Grid-teknologi – og til rent faktisk at bruge den.

ix
EXECUTIVE SUMMARY
This PhD thesis contributes a study of consumer acceptance and adoption of sustainable
energy technology. More specifically, it consists of a set of studies that explores which
factors determine the diffusion of Smart Grid technology among private consumers. The
introduction explains that consumers’ motivation, time and resources influence which
cognitive processes (systematic and/or automatic) will come into play when the consumer
makes a decision. With the knowledge that consumers do not always think carefully before
making a decision, but also act on impulses and heuristics, this thesis presents a set of
research questions (addressed in the research papers) that explores both of these possibilities
in the context of acceptance and adoption of Smart Grid technology. The questions that this
thesis set out to answer are:
Who are willing to adopt Smart Grid technology?
What are significant drivers of consumers’ acceptance of Smart Grid technology, i.e.,
agreeing to have this technology installed in their home?
Which method/methods can be used to motivate private consumers to make a decision
about adopting Smart Grid technology?
The aims and contributions of each of the research papers are briefly outlined in the
following.
Research paper 1: Early adopters’ importance for the success of the diffusion of a new
innovation has been documented in prior research. Hence, the aim of this study was to
investigate who are willing to adopt Smart Grid technology at an early stage and why. In this
research paper it is empirically investigated whether consumers who have already adopted
other types of new energy technology, such as a geothermal heat pump, are more favorably

x
disposed towards Smart Grid technology than other consumers. Furthermore, it is also
investigated if consumers who have signed up to let their heat pump be used as flexible
capacity in a test trial differ from other heat pump owners. 24 Danish households participated
in depth-interviews and also answered a questionnaire. The analysis of this data reveals that
the participating households are not equally willing to adopt Smart Grid technology and that
the consumers’ construal level with regard to this decision influences their expressed
willingness to do so. The consumers most willing to adopt Smart Grid technology belong to
the segment that has tried the technology, which was also the segment that was found to have
the highest innovativeness level. This research paper contributes insight as regards which
consumer segments will be most meaningful to approach when introducing Smart Grid
technology to the private consumer market; it also suggests that these customers need specific
marketing to address their concerns. Furthermore the research paper proposes that letting
consumers try the technology before buying it can have a positive effect on their willingness
to “fully” adopt it. By combining Diffusion of Innovation Theory with Construal Level
Theory for the analysis of consumers’ willingness to adopt Smart Grid technology, this study
contributes empirical results supporting the assumptions of the Construal Level Theory that
consumers evaluate the object differently depending on their temporal construal.
Research paper 2: Opinion polls and Smart Grid projects report that consumers’
engagement in the Smart Grid depends mainly on two factors: short-term financial motives,
such as reduction of and control over their electricity bill, and environmental motives (i.e.,
protecting the environment). Therefore, the aim of this study was to empirically investigate
the importance of self-interest and environmental motives for predicting consumer
acceptance of Smart Grid technology. Acceptance was analyzed in a framework combining
the Technology Acceptance Model and the Norm Activation Model, named the Responsible

xi
Technology Acceptance Model. An online survey was conducted in three European
countries, Denmark, Norway and Switzerland. The results show that the Responsible
Technology Acceptance Model successfully predicts acceptance of Smart Grid technology in
all three countries. This means that rational assessments are not the only considerations
involved in the acceptance of Smart Grid technology. Feelings of a moral obligation or
responsibility towards the environment and a positive contribution to society are important as
well. The practical implications are that when promoting Smart Grid Technology it is
important not only to stress the individual benefits for adoption, societal and environmental
benefits should also be stressed in communication to potential adopters.
Research paper 3: Research on consumers’ interest in energy issues and the electricity
system in general reveals low involvement in these issues among the public. Therefore, this
study aims to empirically investigate if the careful choice of default could be an effective
strategy to influence consumers’ participation in the Smart Grid (i.e., acceptance of Smart
Grid technology). Consumers were randomly assigned to three conditions in an online study
conducted in three countries, Denmark, Norway and Switzerland (N=3,082). The experiment
was replicated in a field test with Danish house owners with a heat pump installed (N=140).
Two of the conditions (opt-in versus opt-out) implied different defaults and the third was
"neutral" in terms of defaults (i.e., participants had to make an active choice). The results in
both studies showed that the opt-out frame was more effective in generating a high
acceptance rate than the opt-in. The neutral condition generated the same acceptance rate as
the opt-out frame in the online experiment. However, in a real-life setting it is impossible to
force consumers to make a choice when using the neutral condition. The results suggest that
the opt-out and neutral approaches are equally effective and significantly and substantially
more effective than the opt-in condition, which makes inaction the default and make many

xii
consumers procrastinate because they are not motivated to invest the mental effort needed to
make the decision. However, the neutral condition cannot be used in practice because it is not
possible to force consumers to make a choice. The practical implication is that an opt-out
framing would be the preferable method to motivate consumers to make a decision about
adoption of Smart Grid technology, and to actually adopt it.

xiii
TABLE OF CONTENTS
1 BACKGROUND .................................................................................................... 1
______________________________________________________________________
1.1 Problem with electricity use ............................................................................. 1
1.2 Research gaps and research questions .............................................................. 6
1.3 Thesis structure .............................................................................................. 11
1.4 Key constructs ................................................................................................ 13
1.5 Research focus................................................................................................ 14
1.6 Research context ............................................................................................ 14
1.7 The case object – Smart Grid technology ...................................................... 16
2 STATE–OF–THE–ART AND THEORETICAL FRAMEWORK ................ 19
______________________________________________________________________
2.1 Consumer behaviour and behavioural change ............................................... 19
2.2 Decision-making based on systematic reasoning – the rational decision-maker ...
........................................................................................................................ 24
2.3 Decision-making based on automatic reasoning – the satisficing decision-maker
........................................................................................................................ 28
2.4 Decision-making based on moral reasoning – the moral decision-maker ..... 29
2.5 The adoption process – deciding to adopt or reject ........................................ 33
2.6 Theoretical approach - overview .................................................................... 37
3 RESEARCH DESIGN AND METHODS.......................................................... 39
______________________________________________________________________
3.1 Relation between research papers .................................................................. 42

xiv
4 EXPLORING PRIVATE CONSUMERS’ WILLINGNESS TO ADOPT
SMART GRID TECHNOLOGY ....................................................................... 47
______________________________________________________________________
1 Introduction ........................................................................................................... 49
2 Theoretical background: Consumer innovation adoption and temporal construal 51
3 Methodology and data ........................................................................................... 55
3.1 Unit of analysis............................................................................................... 56
3.2 Recruitment .................................................................................................... 57
3.3 The interviews ................................................................................................ 58
3.4 Coding and analysis ....................................................................................... 59
4 Results ................................................................................................................... 60
4.1 Some characteristics of the families in the three groups ................................ 60
4.2 Potential adopters’ perception of Smart Grid technology .............................. 61
4.2.1 Perceived relative advantage ...................................................................... 62
4.2.2 Perceived compatibility .............................................................................. 67
4.2.3 Perceived complexity ................................................................................. 70
5 Discussion .............................................................................................................. 72
5.1 Limitations ..................................................................................................... 74
5.2 Conclusions and implications ........................................................................ 74
Acknowledgements ........................................................................................................ 76
References ...................................................................................................................... 76

xv
5 RESPONSIBLE TECHNOLOGY ACCEPTANCE: MODEL
DEVELOPMENT AND APPLICATION TO CONSUMER ACCEPTANCE
OF SMART GRID TECHNOLOGY ................................................................. 85
______________________________________________________________________
1 Introduction ........................................................................................................... 87
2 Acceptance of new technology – Theoretical framework ..................................... 91
2.1 The Technology Acceptance Model .............................................................. 91
2.2 The Norm Activation Model .......................................................................... 92
2.3 The Responsible Technology Acceptance Model .......................................... 93
2.4 Hypotheses ..................................................................................................... 95
3 Method ................................................................................................................... 97
3.1 Participants and procedure ............................................................................. 97
3.2 Questionnaire ................................................................................................. 98
3.3 Measures......................................................................................................... 99
4 Results ................................................................................................................. 100
4.1 Descriptive statistics ..................................................................................... 100
4.2 Measurement invariance across countries .................................................... 101
4.3 Hypotheses tests ........................................................................................... 104
5 Discussion and conclusion................................................................................... 106
Acknowledgements ...................................................................................................... 109
References .................................................................................................................... 110
Appendix 1 ................................................................................................................... 115

xvi
THE IMPORTANCE OF FRAMING FOR CONSUMER ACCEPTANCE 6
OF THE SMART GRID: A COMPARATIVE STUDY OF DENMARK,
NORWAY AND SWITZERLAND .................................................................. 117
______________________________________________________________________
Introduction ......................................................................................................... 119 1
Hypotheses........................................................................................................... 126 2
Study 1: Default effects in three countries .......................................................... 128 3
3.1 Method .......................................................................................................... 128
3.1.1 Participants and procedure ........................................................................ 128
3.1.2 Study design ............................................................................................ 129
3.2 Results .......................................................................................................... 132
3.3 Discussion ..................................................................................................... 136
Study 2: Default effects in real life ...................................................................... 137 4
4.1 Method ............................................................................................................ 138
4.1.1 Participants and Procedure ....................................................................... 138
4.1.2 Study Design .............................................................................................. 139
4.2 Results ............................................................................................................ 140
4.3 Discussion....................................................................................................... 141
General discussion ............................................................................................... 142 5
Limitations ........................................................................................................... 145 6
Conclusion ........................................................................................................... 146 7
Acknowledgements ...................................................................................................... 147
References .................................................................................................................... 147
Appendix ...................................................................................................................... 151
7 CONCLUSION AND IMPLICATIONS ......................................................... 153
______________________________________________________________________
7.1 Specific research paper contributions .......................................................... 155
7.2 Implications .................................................................................................. 161
References .................................................................................................................... 165

1
1 BACKGROUND
1.1 Problem with electricity use
Peoples way of living, especially in the western part of the world, are related to
behaviours that have a negative impact on our society and environment (Edenhofer O. et al.,
2014). Some of the most environmentally damaging behaviours relate to energy consumption
(i.e., electricity, heating, industry and transport). A large amount of the electricity we
consume is generated on fossil fuels which releases carbon dioxide when burned and is found
to be one of the greatest contribute to global warming (Stamm, Clark, & Eblacas, 2000).
Furthermore, the air pollution coming from burning fossil fuels are; linked to health problems
such as lung cancer, the cause of acid rain and other environmental problems (cf., Lehman &
Geller, 2004). The residential sector in Europe accounts for a large part (30%) of the of the
total electricity consumption, and in recent years (between 1990 and 2010) the consumption
deriving from the residential sector has increased by almost 40% (European Commission's
Joint Research Centre, 2012). There is no indication that this consumption will stagnate or
decrease (EIA, 2013). For decades, researches have been occupied with how this
development can be slowed and sustainable energy technologies that make consumers use
electricity more efficiently, wisely and from clean renewable sources have been developed,
aiming to reduce the unsustainable behaviours related to electricity consumption.
Governments and other actors have for years tried with different information campaigns
and other initiatives aiming to get consumers to adopt sustainable energy technologies and
change their behaviours related to electricity use (see Delmas, Fischlein, & Asensio, 2013 for
a meta-analysis of experimental studies). However, as the statistics and a majority of research

2
reveal, private consumers are reluctant to adopt these technologies (e.g., photovoltaics, solar
heating, heat pumps and private wind turbines) (Geller, 2003; Rao & Kishore, 2010) and
change when it comes to energy use (Steg, 2008). Researchers have found that some
consumers are not very enthusiastic about technological innovations in general (Ellen
Scholder, Bearden, & Sharma, 1991). Technologies are to some consumers perceived as
complex, difficult to understand and use. Furthermore, sustainable energy technologies are
often most beneficial to the society, whereas the private rewards from adoption is usually
distant in time and place (cf., Harland, Staats, & Wilke, 2007), which means that consumers
might have difficulties understanding the benefits that the adoption of the technology entails
(Harper-Slaboszewicz, McGregor, & Sunderhauf, 2011). Another barrier is that these
technologies often require an up-front investment, which is compared with the calculated
private returns of the investment and a payback period which is often perceived as long
(Geller, 2003; Rao & Kishore, 2010). Moreover, the majority of the sustainable energy
technologies require consumer behavioural changes, and because of this consumers might
form negative attitudes and resist adopting them (Garcia, Bardhi, & Friedrich, 2007). The
reluctance towards behaviour change is arguably associated with key characteristics of
electricity. Electricity is invisible and use of it is an indirect outcome of other types of
activities, such as cooking food, watching TV, using the computer, heating up the house, etc.
(Paetz, Dütschke, & Fichtner, 2012). Because electricity use is invisible to the consumers,
they often do not relate these behaviours directly to electricity use and the damaging effect it
has on the environment (Paetz et al., 2012). Furthermore, it is common practice for electricity
suppliers to bill their private customers long time after the actual use of electricity has taken
place. This results in that not many electricity consumers are aware of the cost of their
behaviour. Social research back this up indicating low levels of public awareness and interest

3
in energy technologies and that energy consumption is taken for granted (Egan, 2002;
Hedges, 1991).
European governments have come to an agreement1 to curb the negative development
related to energy use and are planning for a more sustainable power system. More renewables
will be implemented in this “new” power system such as wind, hydro and solar power plants
(Wolsink, 2012). These technologies will reduce some of the enormous unsustainable
environmental impacts that current use of fossil fuels has on our society. The goal is to reach
20% of energy generated from renewable power sources by 2020 (European Commission,
2011a). However, this is challenging the current power system’s infrastructure and the
security of the power supply because the capability to provide balancing facilities that meet
the electricity demand in the traditional way disappears (Biegel, Hansen, Stoustrup,
Andersen, & Harbo, 2014). Most of the new renewable electricity resources cannot so easily
be turned on and off; instead the demand must be adjusted to meet the production from
sources such as wind turbines and photovoltaic systems (Wolsink, 2012). One of the means to
effectively adjust the demand when there are rapid production changes is introducing a new
sustainable energy technology into the homes of consumers known as Smart Grid technology.
There are various types of Smart Grid technology, and they offer many kinds of services to
customers and energy suppliers (Kaufmann, Künzel, & Loock, 2013). The technology in
focus in this PhD thesis is Smart Grid technology with remote control. Defined as a
digitalized electrical meter that allows two-way information flows between the electricity
supplier and the customer thereby interacting with in-house appliances, it is also known as a
Smart meter with remote control. It enables an electricity supplier or distribution system
1 The climate and energy package is a binding legislation which aims to ensure the European Union
meets its ambitious climate and energy targets for 2020 (European parliament and the council, 2009).

4
operator to adjust (switch on/off) the electricity consumption of household appliances in
order to shave off peak loads (Darby, 2010; European Commission, 2011b). Smart meters are
perceived as being the ‘backbone of the future decarbonized power system’ (European
Commission, 2011b). In the future power system, the Smart Grid, which compared to today’s
centralized power production, will consist of decentralized power generators connected in an
electricity network where Smart meters will function as the link between energy suppliers/
distribution system operators and electricity consumers. The Smart meters will be “major
nodes in the networks of energy flows and information, as they monitor and balance supply,
distribution, demand, and storage” (Wolsink, 2012 p. 824). Smart meters with remote control
or Smart Grid technology2 can be categorized as a sustainable innovation due to the positive
impacts that use of this technology has on society and the environment.
As with all new innovations there is no guarantee that consumers will adopt Smart Grid
technology (Da Silva, Karnouskos, Griesemer, & Ilic, 2012). Especially, research on
diffusion on sustainable innovations very often highlights the difficulties in spreading and
implementing these types of innovations because of the delayed adoption rewards (Rogers,
2002). In the case of Smart Grid technology, society at large (incl. the environment) is the
primary beneficiary. The private benefits are smaller (Hamilton, 2010) in terms of savings on
the electricity bill, receiving feedback on electricity consumption, and becoming energy
efficient (Krishnamurti et al., 2012). Smart meters with remote control are not yet available to
private consumers in the market but have been installed and tested in different European
project settings, for instance, the E-flex project (Dong Energy, 2012), EcoGrid EU
(Energinet.dk, 2012), the READY project (ea-energianalyse.dk, 2013) and the Improsume
2 From now on, Smart Grid technology will be used synonymously with Smart meter with remote
control.

5
project (Thøgersen, 2014). However, knowledge about the size of private rewards (i.e. saving
on the electricity bill, gaining insight into electricity consumption, indoor comfort
improvements) is sparse and reporting is divided. In a report about benefits derived from the
Smart Grid, prepared for the United States Government, it is concluded that “The direct
financial benefits to consumers are not compelling, particularly when compared to the risks”
(Hamilton, 2010, p. 27). Here they are pointing at the drawbacks related to the use of Smart
Grid technology. One that is often mentioned is the risk of violation of consumers’ privacy.
Utilities and distribution system operators will receive more accurate information about
consumers’ electricity consumption patterns resulting from the installation of Smart Grid
technology. However, this data might reveal personal behaviour and habits and whether the
consumer is at home or not (Mármol, Sorge, Ugus, & Pérez, 2012). Another risk mentioned is
the health impact of Smart Grid technology since transmission of wireless information
produces non-thermal radiofrequency radiation (Beyea, 2010). This was the subject of much
debate in the US leading to the California Council on Science and Technology publishing a
report on the issue in 2011. The report concluded that “To date, scientific studies have not
identified or confirmed negative health effects from potential/non thermal impacts of RF
emissions such as those produced by existing common household electronic devices and
smart meters” (California Council on Science and Technology, 2011).
The uncertainty about the risks and the private benefits from adoption makes it
important to gain insight into consumers’ perceptions of the characteristics of Smart Grid
technology and into how consumers weight them in their decision of whether or not adopt the
technology. Hence, consumers’ adoption of Smart Grid technology comes with a number of
societal benefits such as significant reduction of the environmental impact of the whole
electricity supply system, reduction of blackout time by identifying defects and compensating
6
remotely, reduction of labour costs, quality and security of supply, integration towards the
European market, better facilitation of the connection and operation of generators of all sizes
and technologies (Krishnamurti et al., 2012; The Smart Grids task force, 2010 p. 6).
However, in general these benefits are only realizable if electricity consumers adopt Smart
Grid technology, which establishes the link between the Smart Grid and the electricity
consumers. Therefore, it is essential that consumers adopt Smart Grid technology.
1.2 Research gaps and research questions
Over the years, several studies have been conducted searching for answers to which
factors that influence adoption of new technologies (i.e., innovations). Low and slow
diffusion rates for technology innovations that have obvious advantages continue to puzzle
researchers and marketers (Rogers, 2004). In the area of consumer adoption of sustainable
energy technology, some studies have been conducted, using social cognitive and innovation
adoption theories as frameworks, to explore what influences consumers acceptance and
adoption of hydrogen fuel station (Huijts, Molin, & Steg, 2012), solar heating technology
(Guagnano, Hawkes, Acredolo, & White, 1986), photovoltaic systems (Schelly, 2014), and
ground source heat pumps (Karytsas & Theodoropoulou, 2014). However, the area of
consumer adoption of Smart Grid technology has not yet been explored, especially in regards
to research focusing on the private consumer and their motivation for adopting this type of
sustainable energy technology. Private consumers and their adoption of Smart Grid
technology is acknowledged by the European Task force for Smart Grids and others ( e.g.,
Gangale, Mengolini, & Onyeji, 2013; IEA, 2011; The Smart Grids task force, 2010) as being
important for the functioning of (what is expected to be) the future grid known as the Smart
Grid. The optimal situation for management of the future grid would be that all private

7
households adopt Smart Grid technology. One way of realizing that scenario would be for
governments to make installation of Smart Grid technology mandatory. However, this is not
likely to happen because adoption of Smart Grid technology is not expected to be relevant for
all households (Frontier Economics, 2011) and would hence be likely to provoke public and
political resistance. It is instead more likely to remain a voluntary choice.
However, because this technology is new, it is likely that consumers will perceive
risks, e.g., installation problems, technology breakdown, and that they will have reservations
towards adoption (see Krishnamurti et al., 2012). Furthermore, only small financial benefits
are expected as outcome for the private electricity consumers (Dong Energy, 2012) while the
benefit for the society as a whole is larger, with the penetration of more renewables in the
grid (Hamilton, 2010). Therefore, it could also be expected that even customer segments for
which adoption would be relevant might not see the benefits of doing so. Moreover, for a
long time, electricity consumers have just been passive consumers using electricity whenever
needed without having to think about the supply capacity in the grid. Changing behaviour and
engaging in the management of the capacity of the grid can therefore be perceived as difficult
and irrelevant for many consumers.
The public’s acceptance of Smart Grid technology is a societal problem (Wolsink,
2012) and the implementation of Smart Grid technology in people’s homes is a necessary
component of developing the future grid into a more sustainable and efficient grid. However,
there are several indications (e.g., lack of motivation, perceived risks, and small economic
benefits) suggesting that, when consumers are given the voluntary choice of installing Smart
Grid technology into their homes, the diffusion of the technology will be too small and too
slow.

8
This problem raises therefor the following question:
What determines the diffusion of Smart Grid technology among private
consumers and how can it be speeded up?
According to Diffusion of Innovation Theory (Rogers, 2003), the diffusion of a new
technology typically starts with a small group of consumers adopting the technology first
(i.e., early adopters). This segment of consumers has been found to have special personal
traits such as interest in new products (in this case interest in new technology), willingness to
take risks and to be crucial for the following success of the diffusion of the innovation.
Hence, identifying a segment of likely adopters to be targeted in the early phase could
positively impact the diffusion of Smart Grid technology, which leads to the following sub-
question (explored in the empirical paper Chapter 4):
Who are willing to adopt Smart Grid technology?
To be able to effectively promote the adoption of Smart Grid technology it is important
to gain knowledge about drivers for acceptance and adoption, i.e., what consumers perceive
as important outcomes for including the technology in their everyday lives. Hence, the
following sub-question is raised (explored in the empirical paper Chapter 5):
What are significant drivers for consumers’ acceptance of Smart Grid technology,
i.e., agreeing to have this technology installed in their home?
In terms of consumer decision-making, adoption of new technology is often assumed to
follow a “high-effort” path (also known as “System 2” among psychologists, see Kahneman,
2011) through the innovation adoption process (see Figure 5, section 2.5) (Schiffman, Kanuk,
& Hansen, 2012). The consumer is assumed to function as a reasoning problem solver,

9
processing information that leads to the formation of a preference and finally to adoption
intentions and actual adoption. Researchers on consumer decision-making argue that this path
is followed when potential adopters are highly involved in the decision (Chaiken & Trope,
1999) However, researchers also recognize that there are situations where consumers are
unable or unwilling to cope with and obtain all available information about different choices
and use short-cut decision rules (known as heuristics) instead, to ease the decision making
process. In these situations is the consumer following a “low-effort” path when making a
decision (also known as System 1, which operates when judgments are made rapidly, see
Kahneman, 2011). These automatic judgments can sometimes make consumers to choose
differently than they would if they had carefully considered the matter (Sunstein & Reisch,
2014). Because Smart Grid technology is new and unknown to private consumers, it is likely
that they might perceive this technology as complex and therefore be uncertain about the
consequences of adoption. Often when people are uncertain they try to avoid choosing, which
often leads to doing noting instead (Anderson, 2003). We also know from behavioural change
research, e.g., on organ donation (Johnson & Goldstein, 2003) that people often tend to
procrastinate, avoiding to make a decision when it is perceived as difficult or does not
involve any immediate personal consequences (Thomsen, Borgida, & Lavine, 1995;
Verplanken, 2002).
For the reasons mentioned above one could expect that when the choice of adopting Smart
Grid technology is voluntary, many consumers might try to avoid making a decision about
adoption. Therefore the following sub-question is raised (explored in the empirical paper
Chapter 6).

10
Which method/methods can be used to motivate private consumer to make a
decision about adopting Smart Grid technology?
Addressing these questions, the main focus of this thesis is to explore the practical
problem of making the diffusion of Smart Grid technology faster and wider. With this
objective, the attention of the thesis is on personal (i.e., traits, beliefs, attitude and norms),
product (i.e., attributes) and environmental factors (i.e., choice architecture) influencing
consumers’ acceptance and adoption of Smart Grid technology.

11
1.3 Thesis structure
In addition to this introduction and overview, this thesis consists of a collection of
scientific papers, presented in Chapters 4, 5 and 6. Table 1 presents the structure of the thesis.
Table 1. Thesis structure
Chapter Content
Chapter 1 Background
This chapter presents the background for the thesis, the central
research questions that this thesis aims to answer, and its scientific
contribution. It also gives a definition of key constructs used in the
thesis, explains the focus of the research, the context that surrounded
the data collections and gives an introduction to the case object –
Smart Grid technology.
Chapter 2 State of the art and theoretical framework
This chapter reviews the body of literature relevant for this thesis and
gives an overview and a synthesis of the theoretical frameworks that
serve as foundation for the studies conducted in this thesis. More
focused reviews are presented in the research papers.
Chapter 3 Research design and methods
This chapter explains the research strategy used to conduct the studies
for this thesis. It also explains the specifics of how data were
collected as well as the relation between research papers.
Chapter 4 Exploring private consumers’ willingness to adopt smart grid
technology
Research question: Who is willing to adopt Smart Grid technology?
Aim: The aim is to explore different household segments’ willingness
to adopt Smart Grid technology and become active in the Smart Grid
Contribution: This study contributes with insight into which
consumer segments that will be most meaningful to approach when
introducing Smart Grid technology to the private consumer market
and suggestions for in what way. Furthermore, this study also
contributes with empirically combining Diffusion of Innovation
Theory with Construal Level Theory for the analysis of consumers’
willingness to adopt innovations.

12
Chapter 5 Responsible technology acceptance: model development and
application to consumer acceptance of smart grid technology
Research question: What are significant drivers for consumers’
acceptance of Smart Grid technology, i.e., their agreement to have
this technology installed in their home?
Aim: This study empirically tests the importance of expected
motivational factors predicting acceptance of Smart Grid technology
and aims to develop a framework for technology acceptance that can
be applied to sustainable technologies
Contribution: This study contribute with identifying important
motivational factors for consumer acceptance of Smart Grid
technology, as well as proposing a new framework to explain
consumer acceptance of societally beneficial technologies that proved
to predict acceptance in three countries.
Chapter 6 The importance of framing for consumer acceptance of the smart
grid: a comparative study of Denmark, Norway and Switzerland
Research question: Which method/methods can be used to motivate
private consumer to make a decision about adopting Smart Grid
technology, and to accept the technology
Aim: Examining the impact of the careful choice of the default on
consumers’ acceptance of Smart Grid technology
Contribution: This study contributes with insight into the relevance
of how the choice is framed when consumers are asked to accept
Smart Grid technology. The evidence is not only generated in a
survey context but also in a “real-life” setting. Meaning that the study
contributes with results reflecting the situation where the consumer
perceives the adoption decision as taking place in the “near future”.
This is as close as we can come in research to a real life adoption
decision.
Chapter 7 Conclusion and implications
This chapter presents each research paper’s contribution as well as the
overall contribution of this thesis. Here are also suggestions for the
implications for practice and theory to be found.
13
1.4 Key constructs
Sustainable energy technology: Technology that makes consumers use energy
efficiently, wisely and from clean, renewable sources.
The Smart Grid: In Europe, a Smart Grid is commonly defined as an ”electricity
network that can intelligently integrate the behaviour and actions of all users connected to it –
generators, consumers and those that do both – in order to efficiently deliver sustainable,
economic and secure electricity supplies” (Clastres, 2011).
Smart Grid technology: In this thesis the term Smart Grid technology is used
synonymously with what is also known as a Smart meter with remote control. It covers a
digitalized electrical meter with remote control that allows two-way information flows
between the electricity supplier and the customer thereby interacting with in-house
appliances. Smart Grid technology enables an electricity supplier or distribution system
operator to remotely control (switch on/off) the electricity consumption of household
appliances in order to shave off peak loads.
Participation in the Smart Grid: The term “participation in the Smart Grid” is in this
thesis used as a synonym with acceptance and adoption of Smart Grid technology. Adoption
of Smart Grid technology is a precondition for consumers if they are going to participate as
active consumers, helping to balance the grid.
Technology acceptance: In this thesis the term acceptance reflects intention to use the
technology (i.e., the consumer accepts to use the technology).
Technology adoption is defined as the purchase behaviour according to Rogers (2003).

14
1.5 Research focus
This thesis focuses on private consumers’ motivation for adopting sustainable energy
technologies. As a result it disregards research about other consumer segments, such as
industry. Furthermore, socio-political acceptance is also something that tends to be
emphasized when discussing acceptance of sustainable energy technologies; however, it
involves consumers’ response to policy making that does not necessarily affect their own
situation in terms of risks, costs and benefits of products they would not buy themselves
(Huijts et al., 2012). This is why socio-political acceptance will not be discussed in this
thesis. Furthermore, there are many approaches to studying innovation adoption; this thesis
focuses on the cognitive aspect of consumers’ decision-making, such as following defaults,
consumer beliefs, attitude formation and norms. Other approaches, which might also have
been relevant, have been left out.
1.6 Research context
In 1997 a range of developed countries signed the Kyoto protocol agreeing to reduce
CO2 emissions by 5.2% in the first committed period of 2008-2012, using 1990 as a base line
(United Nations Framework Convention on Climate Change, 2014). Some of the European
countries have subsequently made even more ambitious commitments to reduce CO2
emissions, including Denmark. Denmark is aiming to replace fossil fuels with 50%
renewables (i.e., primarily wind energy) by 2020, and the end goal is to become 100% fossil
free in all the energy sectors by 2050 (The Danish Ministry of Climate and Energy, 2011). In
a European perspective, Denmark can be defined as a pioneer with its ambitious goal of
transforming the existing electricity system from dependence mainly on fossil fuels towards
integrating a high proportion of renewables in the near future. Furthermore, due to the high

15
penetration of renewables and the need to transform the traditional electricity system,
Denmark is the European country with the highest number of ongoing R&D and Smart Grid
demonstration projects (European Commission Joint Research Centre, 2012). Hence,
Denmark is an obvious choice for studying consumer acceptance of Smart Grid technology.
Other European countries also have Smart Grid and the implementation of Smart Grid
technology relatively high on the political agenda, including Norway and Switzerland. These
countries differ from Denmark both in cultural aspects, pricing, and use of electricity
(Throne-Holst, Strandbakken, & Stø, 2008) as well as in the composition of electricity
supply.
Norway’s electricity production is mainly based on hydropower (99%). Hydropower’s
capacity to meet the demand is in times fluctuating and Norway is in periods experiencing
low water levels in the reservoirs (Throne-Holst et al., 2008). Furthermore, Norway sees an
increasing production of electricity coming from wind power, and the potential for wind
power production is estimated to be large due to Norway’s long and windy coastline (Seljom
et al., 2011). Therefore, the public acceptance of Smart Grid technology is also relevant in
Norway.
Switzerland also has a great contribution from hydropower in their electricity mix, with
54% hydropower; the rest comes from nuclear power (40%) and around 5% conventional
thermal power plants and energy recovery from waste incineration (cf., Boesch, Vadenbo,
Saner, Huter, & Hellweg, 2014). Being highly dependent on renewables as these three
countries are, and will become even more in the future, is a challenge for the management of
supply and demand in the electricity system. Therefore, consumers’ adoption and acceptance
of Smart Grid technology are highly relevant for these three countries, as well as for any
other country facing this transition towards more renewables in their power system.

16
1.7 The case object – Smart Grid technology
Smart Grid technology covers a range of technologies (for details see Wissner, 2011).
The Smart Grid technology in focus in this thesis is referred to as a Smart meter with remote
control. Smart meters come with different features; the one that is of particular importance
for balancing supply and demand on the grid is the remote control feature. In this thesis a
Smart meter with remote control is defined as a digitalized electrical meter that allows a two-
way information flow between the electricity supplier and the customer. This enables
interaction with in-house appliances where remote control allows an electricity supplier or
distribution system operator (DSO) to automatically and remotely control (switch on/off) the
electricity consumption of household appliances; the purpose being a supply and demand
balance in the power system. Thus, the idea is not to have consumers manually control their
electricity consumption when they think it is appropriate. Instead, it will be done
automatically to achieve an effective and accurate regulation of the grid when needed. In
order for an electricity consumer to become active in balancing demand and supply in the
Smart Grid, it is therefore not enough merely to have the technology installed. The consumers
must also accept that some of their electricity consumption is being remotely and
automatically controlled by a utility or a DSO. Figure 1 presents an example of a Smart
Meter with remote control connected to a heat pump.

17
NOTE: A Smart meter with remote control functions like this: Signals are sent from the utility or a DSO via the Internet to the gateway
when the heat pump should be turned off/on in order to shave peak loads. The gateway communicates with the relay and clamp reader. The
temperature gauge communicates with the gateway and will indicate whether the temperature is above or below minimum temperature
threshold set by the consumer. The consumer receives feedback regarding electricity consumption and regulation on a computer, tablet, or
Smart Phone. Picture developed by Greenwave Reality Systems (2012).
Figure 1. Smart Grid technology with remote control connected to a heat pump
The remote control feature is triggered by a signal (e.g., a price signal) that is sent when
the load on the grid needs to be reduced (or occasionally increased). The remote control
enables an electricity supply cut-off to the appliances connected to the remote control
function. The electricity consumer can override the cut-off either by increasing the minimum
comfort temperature set (i.e., if the Smart meter with remote control is connected to the
heating system) or pressing an “ignore” button on a Smart phone, tablet, computer or on the
appliance. As such, automatic remote control will be most suitable in private households with
large-scale power consuming appliances (such as a heat pump) because they have a more

18
flexible balancing capacity compared to, for instance, a computer. However, it is expected
that consumers will interact with the feedback from Smart Grid monitors or Smart phone
apps to adjust their electricity consumption manually (see Hargreaves, Nye, & Burgess,
2010) as well as automatically.

19
2 STATE–OF–THE–ART AND THEORETICAL FRAMEWORK
This chapter presents a review of relevant research and an overview and integration of the
various models of consumer behaviour and of behavioural change used in this thesis to
understand what motivates and drives consumer acceptance and adoption of Smart Grid
technology. The literature on consumer acceptance and adoption of Smart Grid technology is
rather limited and as a consequence it was felt necessary to also draw on findings in literature
dealing with consumer adoption of related energy technologies, such as photovoltaics, wind
turbines, heat pumps, biomass and solar thermal.
2.1 Consumer behaviour and behavioural change
There are in the literature several approaches for explaining why consumers behave the
way they do. A dominating approach assumes that consumers behave based on rationality,
being motivated by the goal to maximize their utility, that is, behave in the way that gives the
highest gain against the lowest costs. Another approach assumes that consumers often act
according to moral norms, that is, behave in the way that they believe to be the most
appropriate in the that situation, motivated by doing the right thing for the common good
(i.e., society and/or the environment) (Thøgersen, 2008).
The literature often focuses on either one or the other of these motivations for
consumers’ behaviour. However, this thesis is based on an integrated view, proposing a
synthesis that brings together knowledge about both of these two motives for consumer
behaviour while also acknowledging that consumer behaviour is not always the outcome of a
deliberate cognitive process.

20
Actually, consumers often behave on impulses in their everyday life. Such impulses
may sometimes make them procrastinate (Ariely, 2008), that is, delay an intended course of
action, in spite of being aware of negative outcomes of doing so (Steel, 2007). For example,
when consumers are given a free choice of whether or not to adopt Smart Grid technology,
they may hesitate to adopt due to their inclination to procrastinate (Ariely, 2008). It is usually
assumed that consumers adopt a complex new technology, such as this, through a high-effort
decision-making process (Kotler & Roberto, 1989). However, due to consumers’ inclination
to procrastinate they may never get around to seriously reason about the pros and cons for
adopting the technology. Hence, it is a key point in this thesis that (de facto) decisions to
adopt or to not adopt an innovation are not necessarily symmetric in terms of consumer
involvement and effort. Kahneman’s (2011) dual process model of cognitive functioning is
helpful for understanding this fundamental asymmetry in decision-making about innovation
adoption.
The most common starting point for explaining consumer behaviour, in marketing as in
most other behavioural sciences, is models whose key assumptions are that consumers strive
to act “rational” and that they aim to reach self-interested goals. They therefore make
decisions based on weighing the costs and benefits of different actions and choose the option
that they believe will maximize their utility or value. Hence, “rational choice” models assume
that decision-makers think carefully through the options before making a decision. That is,
they use the systematic cognitive system that in psychology is often referred to as “System 2”
(Kahneman, 2011). In Chapter 4 and 5, it is explored how consumers reason about Smart
Grid technology and its use when System 2 is used.
However, it is well documented in research that much of our everyday behaviour is
carried out with little conscious deliberation (Hoyer & MacInnis, 2006). In these cases,

21
instead of the deliberate cognitive process, an automatic and unconscious process is in
operation, often referred to as “System 1” (Kahneman, 2011). The main function of System 1
is to produce responses quickly and effortless, making the person able to act quickly, e.g.,
when facing an imminent threat, and to reserve cognitive resources for demanding tasks.
Kahneman argues that both systems are always active when we are awake, System 1 runs
automatically whereas System 2 is dormant most of the time. System 1 continuously supplies
suggestions that System 2 can act on: impressions, intuition, intentions and feelings. When
System 1 runs into problems, it calls for support from System 2 to give a more detailed and
thorough reasoning to solve the problem. Moreover, Kahneman also argues that over time
System 2 responses can become System 1 responses, meaning that choices that need
deliberate reasoning can in time become automatic habits.
To illustrate how the two systems work, look at this problem: 2+2.
Here, the fast way of thinking, the automatic system (System 1) was active helping you
to activate a “rule” from memory, using only little or no effort.
Now look at this problem: 14 x 37.
Immediately, most readers will know that this is a problem that one needs a bit more
time to answer. Hence, here the slow and deliberate way of thinking will operate (System 2),
allocating attention to the effortful mental activities demanding it.
System 1 is always at work and cannot be turned off, even if we would like to. This
implies a constant risk of making the wrong judgment or decision based on intuitive thinking,
because System 2 is not alert (Kahneman, 2011). Kahneman describes System 2 as lazy,
which is why System 1 sometimes is the only system active, even if System 2 was needed to
make the right decision. Kahneman’s dual process model of cognitive functioning belong to a

22
larger family of dual process theories that deal with how individuals think and make
judgments (Chaiken & Trope, 1999). Figure 2 illustrates these two systems and also how
which system is likely to take the lead depends on the person’s motivation, ability and
opportunity.
Olson and Fazio (2009) argue that if a consumer is motivated to process information
and has the opportunity and ability to do so (time and resources) he/she will use System 2 for
judging and decision-making. They also suggest that in the System 1 process, a mentally
stored attitude towards the object in focus can be automatically activated. Hence, if a
consumer has a strong attitude towards the behaviour, the attitude is likely to guide the
consumer’s behaviour without involving any conscious reflection.
Figure 2. Decision-making model – Fazio’s MODE model

23
Understanding how consumers “think” in decision-making contexts is useful for
campaigns to produce behaviour change. By consciously designing the “choice architecture”
(Thaler & Sunstein, 2008) it is possible to influence consumers’ choices. Not least when
trying to influence consumers to make the choice that benefits society (i.e., social marketing),
designing the choice architecture in a suitable way has been found to be effective (Ölander &
Thøgersen, 2014). In Chapter 6 of this thesis, it is illustrated how behavioural change can be
accomplished when taking the dominating role of the automatic system (System 1) and the
asymmetry of adoption and non-adoption decisions into account.
The literature on social influence and/or moral reasoning in consumer decision making
is usually not clear about under which system social influence and moral decision-making
operate. Haidt (2001) and Moll, de Oliveira-Souza, and Eslinger (2003) argue that a moral
decision is the outcome of an (automatic) emotional intuition while Craigie (2011) argue that
both automatic and systematic reasoning operate in an integrated way in moral decision-
making. In Chapter 5 a theoretical framework is proposed that integrates “moral” decision-
making into the “rational” deliberate systematic way of thinking.
The following sections presents a review of relevant research and a more detailed
presentation of the systematic, “rational” decision-making model, the automatic decision-
making model, and the “moral” decision-making model used in this thesis to study consumer
adoption of Smart Grid technology. The choice of frameworks for this thesis is based on their
applicability in previous studies helping us to understand psychological and social influences
on technology adoption, traditional and pro-environmental/pro-social consumer behaviours.
24
2.2 Decision-making based on systematic reasoning – the rational decision-maker
Common theories in the field of explaining the adoption of a new technology, such as
the Theory of Reasoned Action (Fishbein & Ajzen, 1975), the Technology Acceptance Model
(Davis, 1985, 1989), and the Theory of Planned Behaviour (Ajzen, 1985), assume that
individuals are goal-oriented and base their choices on weighing the costs, benefits and risk
of options, and that they choose the option with the highest gain relative to costs or risks, i.e.,
that economic “rational” considerations underlie adoption behaviour (Claudy, Peterson, &
O’Driscoll, 2012). This means that consumers are assumed to use System 2 (Kahneman,
2011), actively reasoning about cost and benefits of performing the adoption behaviour.
The Technology Acceptance Model is an adjusted expectancy value theory, which
states that consumers behave according to their beliefs about the outcome of their behaviour
and the value attached to those outcomes (T. Jackson, 2005). This model has been used
widely in the area of technology acceptance: over 580 articles have been published over the
last 35 years (Chang et al., 2010). For instance, the Technology Acceptance Model has been
shown to successfully predict the acceptance of information technology (IT) such as online
shopping (Henderson & Divett, 2003), online banking (Ndubisi, 2007), and health
information technology (Holden & Karsh, 2010). Various extended models (with variables
such as trust, social norms and perceived behavioural control) have successfully predicted
acceptance of e-governmental services (Belanche, Casaló, & Flavián, 2012), online shopping
(Gefen, Karahanna, & Straub, 2003), and online tax (Wu & Chen, 2005). However, the
author of this thesis has not come across published studies where the model was applied to
Smart Grid technology or other energy technologies. The Technology Acceptance Model is
an modification of the Theory of Reasoned Action (Ajzen & Fishbein, 1980) for the specific
area of predicting user acceptance of technology (originally information systems). There are

25
two key determinants (see Figure 3): perceived ease of use and perceived usefulness, which
have been proven to have a substantial impact on attitudes toward using the technology
(AlAbdulkarim, 2013).
Figure 3: The Technology Acceptance Model (TAM)
Perceived usefulness is defined as the degree to which the use of the technology in question is
believed to enhance the achievement of valued goals (job performance in Davis’s original
study), and perceived ease-of-use is defined as the degree to which use of the technology in
question is believed to be easy and effortless. These beliefs are in principal determined by
external variables, such as knowledge, experience, demographics, personal characteristics
etc.. Perceived usefulness and perceived ease of use are assumed to determine a person’s
attitude toward using the technology. If using a new technology is evaluated favourably (i.e.,
the person’s attitude towards doing so is positive), the person is expected to form an intention
to use it (when made available to him or her). When an intention to use a new technology is
expressed in response to a request to use it, this intention is often referred to as technology
acceptance (Huijts et al., 2012). Perceived usefulness has also been found to directly
influence acceptance of the technology. If the consumer accepts the technology, the model
assumes that this will lead to actual use (i.e., usage behaviour).
There are several comparison studies of the two well-established frameworks, the
Technology Acceptance Model and Theory of Planned Behavior for the purpose of predicting
26
technology acceptance (for details see; Chau & Hu, 2001, 2002; Mathieson, 1991; Taylor &
Todd, 1995). Both the two models are extensions of the Theory of Reasoned Action.
However, they have different foci (Chau & Hu, 2002). The Technology Acceptance Model
has only two distinct beliefs (i.e., perceived usefulness and perceived ease of use) predicting
a person’s attitude towards behavioural intention whereas in the Theory of Planned Behavior
there are several individual salient beliefs determining attitude towards the behavioural
intention. Compared to Theory of Planned Behavior, the Technology Acceptance model
clarifies which specific beliefs that may influence acceptance. Other differences include that
in the Technology Acceptance Model, behavioural intention is the sole direct determinant of
actual use (i.e., behaviour), whereas behaviour in the Theory of Planned Behavior is
predicted by both behavioural intention and perceived behavioural control. Some researchers
confuse Perceived Behavioural Control for being the same construct as Perceived Ease of
Use from the Technology Acceptance Model (see Knabe, 2012). However, Perceived
Behavioural Control is an individual’s perceptions of his/hers ability to perform a given
behaviour, and according to Ajzen (1991) most compatible with Bandura’s self-efficacy
(Bandura, 1977), which “is concerned with judgments of how well one can execute cores of
action required to deal with prospective situations” (Bandura, 1982, p. 122 ). In terms of
accepting new technology, this could refer to the individual’s perceived control over
installing the technology and, for instance, perceived control over expected costs. Whereas
Perceived Ease of Use reflects the individual’s perception of the use of the technology, of
how much effort it will require, and if learning to operate it will be easy.
The Technology Acceptance Model also differs from the Theory of Planned Behavior
by not having a role for normative influences such as Subjective Norms (i.e., the perceived
social pressure to engage or not to engage in a behaviour (Ajzen, 1991)). The role of
27
subjective norm as determinant of technology use is uncertain (Taylor & Todd, 1995). Davis,
Bagozzi, and Warshaw (1989) did not find a significant relationship between Subjective
Norm and Behavioural Intention, neither did Mathieson (1991) in his study. However, others
(Hartwick & Barki, 1994; Moore, 1987) have found it important when studying technology
acceptance in organizational settings.
Some normative influences might be captured by the Perceived Usefulness; for
instance, if the individual finds a technology’s positive environmental impact is an outcome
that he or she values, a person might use the technology for that reason.
In one of the studies presented in this thesis, the aim is to identify significant drivers of
consumers’ acceptance of Smart Grid technology (see chapter 5). Here, the choice of
theoretical framework turned in favour of the Technology Acceptance Model compared to
other competing models (such as Theory of Planned Behavior). The reason for choosing the
Technology Acceptance Model is that it was developed for the particular field of technology
acceptance, and in several studies it has been found to explain more variance than both
Theory of Reason Action (Davis et al., 1989) and the Theory of Planned Behavior (Chau &
Hu, 2001, 2002; Mathieson, 1991) when compared. Even though some researchers argue that
due to its higher complexity, the Theory of Planned Behaviour provides more details that
explain Behavioural Intention. Also the Perceived Behavioural Control construct helps
identify barriers to technology acceptance (Chuttur, 2009). Nevertheless, in science it is often
preferable to go with the most parsimonious model in the choice between two or more
models (Bagozzi, 1982), which in this case is the Technology Acceptance Model.
Furthermore, the Technology Acceptance model is supported in numerous studies (Fusilier &
Durlabhji, 2005) for predicting technology acceptance as well as proven to be a robust model
(Chen, Li, & Li, 2011).

28
2.3 Decision-making based on automatic reasoning – the satisficing decision-maker
Behavioural and experimental economists have explored and successfully challenged
the view that consumers make decisions only by “rational” reasoning, trading off expected
costs and benefits, and suggest that behavioural predictions should be based on a “bounded
rationality” framework instead (Simon, 1996). Bounded rationality expresses the idea that
consumers’ decision-making is limited by the available information, time and the mind’s
ability to process information, and that the satisficing decision-maker tries to find a solution
that is good enough by using as little effort as possible in the decision-making process. When
the structural context contains limited information, time and/or ability to process information,
consumers tend to strive for a satisfactory pay-off rather an optimal pay-off (Simon, 1996).
This means that the automatic system (System 1) dominates decision-making in these
circumstances.
For example, complex information explaining how a new technology works is difficult
to process for the consumer and therefore the consumer may be uncertain about the
consequences of the choice. Uncertainty usually makes them avoid choosing (i.e., do nothing)
(Anderson, 2003).
Thaler and Sunstein (2008) refer to the characteristics of the choice context that a
decision-maker is faced with as “choice architecture.” The choice architecture has been
shown to have a significant impact on what consumers choose (Sunstein & Reisch, 2014;
Ölander & Thøgersen, 2014).
An important aspect of the choice architecture is the default, which is the condition that
is imposed when an individual fails to make a decision (Johnson & Goldstein, 2003). When
consumers stay with the default, it is usually because System 1 is operating alone. Staying

29
with the default is effortless and saves time (Pichert & Katsikopoulos, 2008). If consumers
intend to make another choice than the default, it entails having to search for information and
act.
Consciously using the default has been found to be an effective means to influence
behaviour in a number of studies, for instance, in consumer research (Brown & Krishna,
2004), choice of green electricity (Pichert & Katsikopoulos, 2008), organ donation (Johnson
& Goldstein, 2003), participation in retirement plans (Choi, Laibson, Madrian, & Metrick,
2002), energy-efficient behaviour in private households (Loock, Staake, & Thiesse, 2013)
and in Internet privacy policies (Johnson, Bellman, & Lohse, 2002). All these studies show
that most people do not change the default even if they are free to do so. Moreover, default
effect seems to be even stronger when the choice concerns a product that is “new,” when the
consumer has little prior knowledge about it (Sunstein & Thaler, 2003). This is, for example,
the situation with regard to Smart Grid technology: a new innovation and also a difficult
concept. When adopting Smart Grid technology is voluntary for consumers, the common
default is that they will not get it installed unless they sign up for adoption. In Chapter 6 it is
empirically illustrated how such a default has a negative impact on the adoption rate.
2.4 Decision-making based on moral reasoning – the moral decision-maker
The technology in focus in this research has a positive impact on society and the
environment (the use of Smart Grid technology is expected to result in a more reliable grid
and to integrate more electricity generated from renewable sources into the power system).
This is why some consumers are expected to feel they have a moral obligation to accept the
technology; that it is the right thing to do out of concern for society and the environment.
Hence, it is also relevant to view the adoption of Smart Grid technology as a moral
30
behaviour. Behaviour theoretical frameworks that take the moral aspect into account include
the Norm Activation Model (Schwartz, 1977) and the Value-Belief-Norm Theory (Stern,
2000), which builds on the Norm Activation Model. The Norm Activation Model is one of
the most widely applied models of moral behaviour (European Commission's Joint Research
Centre, 2013) and has successfully predicted pro-environmental behaviours such as the
choice of environmentally-friendly packaging (Thøgersen, 1999) energy saving (Abrahamse
& Steg, 2009), and choosing alternative travel modes to the car (Hunecke, Blöbaum,
Matthies, & Höger, 2001). For example, studies applying the Norm Activation Model to
home energy use and energy savings found it to significantly add to the explanation of energy
savings (Abrahamse & Steg, 2009) as well as willingness to take action in favour or against
nuclear energy (de Groot & Steg, 2010). The Norm Activation Model has also been
combined with the Theory of Planned Behavior in a number of studies. For example, in a
study investigating if personal norm contributed to explaining the intention to perform five
pro-environmental behaviours (use of unbleached paper, reduce meat consumption, use of
other transport forms than car, use of energy-saving light bulbs and turning off the faucet
while brushing teeth), Harland, Staats, and Wilke (1999) found when adding personal norms
(from the Norm Activation Model) to the Theory of Planned Behavior that the personal norm
contributed independently to explaining each of the five behavioural intentions. It also
resulted in that the influence of the attitude (from the Theory of Planned Behavior) on the
behavioural intention decreased when the personal norm was added to the model. In another
study, investigating factors influencing car use and the intention to reduce it, it was found that
commuting by car was mostly explained by perceived behavioural control and the attitude
towards doing so (from the Theory of Planned Behavior) whereas the intention to reduce car
use was mostly explained by the personal norm (Abrahamse, Steg, Gifford, & Vlek, 2009).

31
Schwartz (1977) suggests that moral behaviours such as pro-environmental and pro-
social behaviours are guided by an activated personal norm. Personal norms – the key
construct in the Norm Activation Model – are defined as a feeling of moral obligation to
perform or refrain from specific actions (Schwartz & Howard, 1981, p. 191).
As mentioned in section 2.1, there are different views on whether moral reasoning is
generated by System 1 or System 2, or both. However, evidence for the influence of emotions
(intuition) on moral judgment dominates the moral decision-making literature (Craigie,
2011). Without being definitive, this suggests that perhaps consumers mainly use intuition to
make decisions about moral problems. The question in the context of this thesis is, then, if a
moral decision-maker also will reason in an intuitive way when confronted with the request
to adopt Smart Grid technology? In chapter 5, a framework is developed that takes its point
of departure in an assumption about systematic reasoning, which is then combined with moral
reasoning. It is suggested that this approach is appropriate for explaining acceptance of Smart
Grid technology, because it acknowledges that both “rational” and moral reasoning might be
employed for this type of decision.
It has been theoretically argued and empirically confirmed that the strength of a
personal norm depends on whether or not the person believes that an existing condition poses
a threat of avoidable harm to someone, i.e. Awareness of Consequences, and that their
personal action or inaction may prevent that harm, i.e. Ascription of Responsibility
(Schwartz, 1977). Other identified determinants of norm strength are Outcome Efficacy (the
belief that a particular action will be effective in relieving the problem) and Self-Efficacy (the
faith in own ability to carry out actions to provide relief) (Steg & de Groot, 2010), see Figure
4. This model suggested that Personal Norms function as a mediator of Awareness of
Consequences, Ascription of Responsibility, Outcome Efficacy and Self-Efficacy’s influence
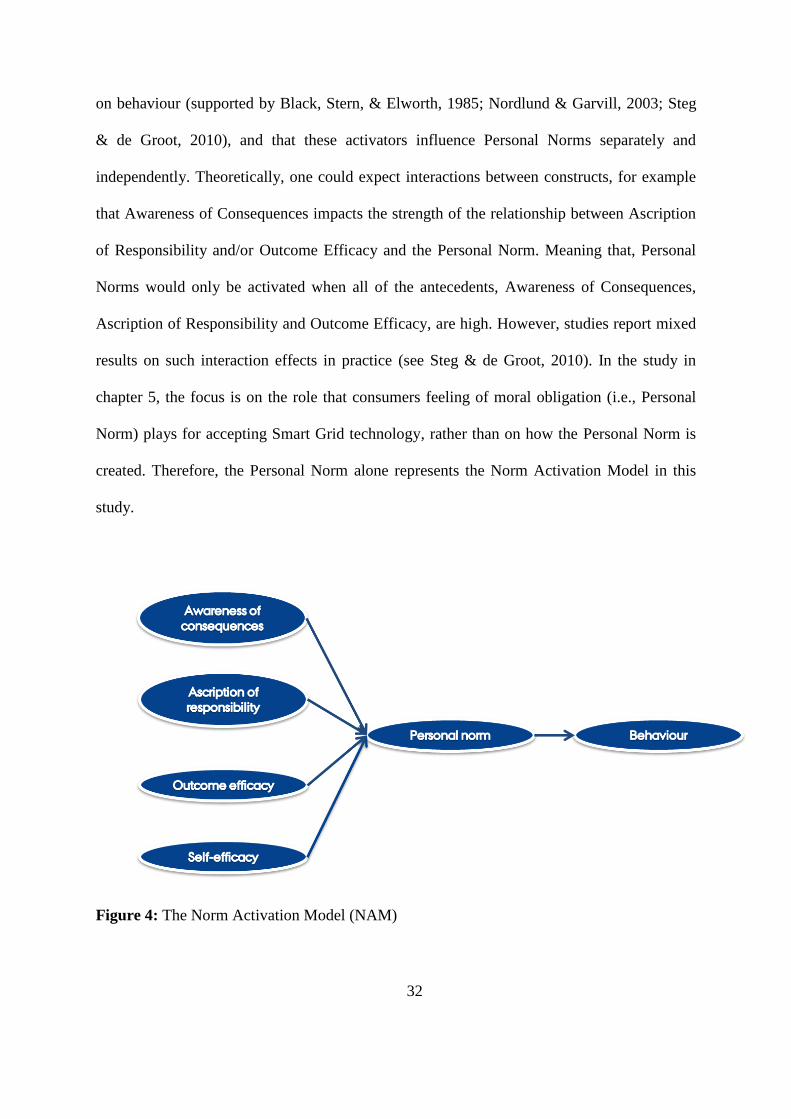
32
on behaviour (supported by Black, Stern, & Elworth, 1985; Nordlund & Garvill, 2003; Steg
& de Groot, 2010), and that these activators influence Personal Norms separately and
independently. Theoretically, one could expect interactions between constructs, for example
that Awareness of Consequences impacts the strength of the relationship between Ascription
of Responsibility and/or Outcome Efficacy and the Personal Norm. Meaning that, Personal
Norms would only be activated when all of the antecedents, Awareness of Consequences,
Ascription of Responsibility and Outcome Efficacy, are high. However, studies report mixed
results on such interaction effects in practice (see Steg & de Groot, 2010). In the study in
chapter 5, the focus is on the role that consumers feeling of moral obligation (i.e., Personal
Norm) plays for accepting Smart Grid technology, rather than on how the Personal Norm is
created. Therefore, the Personal Norm alone represents the Norm Activation Model in this
study.
Figure 4: The Norm Activation Model (NAM)

33
2.5 The adoption process – deciding to adopt or reject
As discussed in the above sections, consumer behaviour seems to be governed by two
types of processes, automatic and systematic. However, what does this mean for consumers’
adoption of an innovation? Roger’s (2003, first edition in 1962 ) Diffusion of Innovation
Theory considers the process of consumer innovation adoption as a social phenomenon. A
multi-stage process that a consumer passes through, “from first knowledge of an innovation,
to forming an attitude towards the innovation, to a decision to adopt or reject, to
implementation of the new idea, and to conformation of this decision,” as presented in a
simplified model in Figure 5. Roger’s model is based on the assumption that consumers use
the systematic system (System 2) to make the adoption decision. However, as discussed
earlier, whereas there are good reasons to assume that a decision to adopt a risky and
complicated new technology has been done using System 2, a decision to reject it might well
have been based purely on System 1 processes. This suggested asymmetry between adoption
and rejection decisions is supported by the empirical study presented in Chapter 6.
The Diffusion of Innovation Theory includes determinants explaining adoption of many
types of innovations (Rogers, 2003). Literature reviews on diffusion of technology indicate
that consumer characteristics, perceptions of the technology’s attributes, and communication
channels seem likely to influence consumers’ adoption decision (Arts, Frambach, & Bijmolt,
2011; Tornatzky & Klein, 1982). Some researchers have argued that the diffusion of energy
technologies are mainly driven by external factors, such as policies and incentives, due to
their characteristics, such as having high investment costs, long payback periods and mainly
being beneficial to the environmental and society, rather than to the individual adopter (Rao
& Kishore, 2010). High investment costs have been found to impede adoption in studies of,
for instance, biomass technology (Toka, Iakovou, Vlachos, Tsolakis, & Grigoriadou, 2014)
34
and sustainable energy technologies such as photovoltaic, micro-wind, heat pumps and solar
systems (Faiers & Neame, 2006; Scarpa & Willis, 2010). However, one study, on consumer
adoption of photovoltaics, found that the return on investment or payback period was less
important than the timing of economic events within the household. This study also found
that consumer characteristics, such as being interested in new technology and enjoying the
technical aspects (recognized as innovativeness in the Diffusion of Innovation Theory), can
motivate adoption (Schelly, 2014). Studies on consumers’ adoption of solar power systems
report that the diffusion of this type of technology is also driven by the innovations’
environmental characteristics (Faiers & Neame, 2006; Jager, 2006). A study found that the
diffusion of heat pumps depend on a variety of consumer characteristics such as income, age,
household size, number of children in the house, education level and gender as well as the
financial aspects such as investment costs, environmental considerations, energy saving,
energy supply security, comfort considerations and aesthetics, general attitude and social
reasons (Karytsas & Theodoropoulou, 2014).

35
Figure 5. The innovation decision process model
The generic adoption process involves five stages: (1) knowledge, which reflects when
a consumer becomes aware of the innovation and gets information about how it works; (2)
persuasion, which reflects the stage when the consumer forms an attitude towards the
innovation (it can be either favourable or unfavourable); (3) decision, which reflects the stage
where the consumer engages in activities that lead to a decision whether to adopt or reject the
innovation; (4) implementation, which is when the consumer starts to use the innovation; and
finally (5) confirmation, which is when the consumer seeks support for a decision made in
favour of adoption, but where this decision might be changed if receiving adverse
information.

36
A number of studies have found that how early a consumer adopts an innovation (i.e.,
whether the consumer is an early adopter) is associated with personal factors, including the
potential adopters’ personality and demographics. Important personality traits include the
consumer’s innovativeness (i.e., “the degree to which an individual is relatively earlier in
adopting new ideas than other members of a system” (Rogers, 2003, p. 267) and risk
perceptions. For instance, J. D. Jackson, Yi, and Park (2013) find that the consumers’
innovativeness is a strong predictor of intentions to use new technology. Arts et al. (2011) also
found that consumer innovativeness has a positive influence on adoption behaviour. However, a
consumer’s innovativeness has been found to depend on product category or interest domains
and a person can therefore not be assumed to have high innovativeness in general (Gatignon
& Robertson, 1985). Rather, consumers’ innovativeness differs between domains and
innovativeness is therefore domain specific (Chao, Reid, & Mavondo, 2012). This also
implies that the consumer’s involvement and interest in the product category related to the
innovation has an effect on their intention to adopt (Arts et al., 2011).
However, a meta-analysis by Tornatzky and Klein (1982) on innovation adoption
drivers concludes that potential adopters’ perceptions of the innovation attributes are better
predictors of adoption than personal factors. Especially, relative advantage, complexity and
compatibility (see Chapter 4 for definitions) were the innovation attributes that explained the
highest variance in innovation adoption. Still, personality and demographics may offer
valuable supplementary segmentation criteria (Gärling & Thøgersen, 2001).
Arts et al. (2011) recommend that the time perspective suggested by Construal Level
Theory (Trope & Liberman, 2003) should be taken into account when studying consumer
innovation adoption. They argue that evaluation and reasoning about an innovation depend
on how far away (in time) the consumer perceives the event (adoption) to be. Consumers who

37
perceive the possible adoption to take place in the near future reason about this event in a
concrete way, searching for information that is detailed and answers context-related
considerations such as how complex the innovation is to operate, install etc. (Arts et al.,
2011). However, consumers who perceive the adoption as something that will take place in
the distant future, if at all, will reason about the event in a more abstract way and on a more
general level, according to Construal Level Theory.
The meta-analysis by Arts et al. (2011) reveals that consumers weight evaluative
criteria differently when expressing innovation adoption intentions, where the focus is on the
somewhat distant future, compared to adoption behaviour, where the focus is on the near
future. This indicates that consumers’ temporal construal is an important aspect that should
be taken into account when studying consumer innovation adoption. However, prior research
on consumers’ adoption of innovations typically has not considered consumers’ different
construal levels. In Chapter 4, it is explored how the distance to the actual decision about
adopting Smart Grid technology influence how consumers reason about it in practice.
2.6 Theoretical approach - overview
Figure 6 presents an overview of the models and theories used in this thesis to study
consumer acceptance and adoption of sustainable energy technology. When studying
consumer behaviour and behavioural change, it is important to understand how the human
mind works in decision-making situations. This is explained in this chapter by presenting
research on dual process models. Kahneman’s (2011) dual cognitive systems (System 1 and
System 2) model helps us understand how consumers make their decisions under different
circumstances. The most common starting point for explaining consumer behaviour is often
“rational” consideration theories, represented here by the Technology Acceptance Model,

38
which is presented as a robust model to explain consumer technology acceptance. However,
as the technology in focus in this research has a positive impact on society and the
environment, it is expected that some consumers will include moral considerations in the
decision-making process, a construct that is not directly included in the Technology
Acceptance Model. This is why we drew on the Norm Activation Model, a well-established
model for predicting pro-environmental behaviours. Finally, aiming to explain what
influences consumers’ innovation adoption decisions, the Diffusion Innovation Theory was
presented together with the Construal Level Theory, which is able to shed light on the fact
that the time perspective can impact how consumers evaluate and reason about an innovation.
Figure 6. Theoretical framework: Overview of the used models and theories

39
3 RESEARCH DESIGN AND METHODS
This chapter outlines the strategy used in this thesis to study, and increase the
understanding of, consumer innovation adoption and behaviours in choice situations. The
Smart Grid and Smart Grid technology comprise a new and complex area (Blumsack &
Fernandez, 2011). When a technology is new, there is a lack of knowledge about it among the
public and therefore many respondents may simply answer ‘I don’t know’ in acceptance
studies. Measured consumer opinions might also not be very stable and predictive of
consumers’ future acceptance of the technology. Therefore, it is important to employ several
and complementary methodological techniques to gain a substantial understanding and valid
results. Survey studies based on a random sample are useful when the aim is to generalize the
findings to the population from which the sample was drawn. Experimental intervention
studies are useful for testing causal relationships. However, both of these types of studies are
often conducted in artificial settings and referring to hypothetical outcomes, which mean that
there is a risk that participants’ responses might not reflect their actual behaviour later on.
This is often referred to as the “attitude-behaviour gap” and has been found to be a quite
common phenomenon, also in innovation adoption research (Garcia et al., 2007).
Field studies are expensive and they are not always possible for practical or ethical
reasons, but when they are they are the most effective way to study actual behaviour
(Simonson, Carmon, Dhar, & Drolet, 2001), that is, obtain results that have ecological
validity (i.e., the degree to which the behaviours observed and recorded in a study reflect the
behaviours that actually occur in natural settings (Williams, 2014)). Also, by using a
qualitative approach, such as in-depth interviews, a researcher can get a richer understanding
of what lies behind people’s perceptions, attitudes, and behavioural reasoning.

40
By using a multi-method approach and triangulation (Miles, Huberman, & Saldaña,
2013), this PhD project aims to achieve a richer and more valid picture of the research topic.
Researchers have highlighted the importance of studying how consumers make decisions
about their involvement in energy systems (Sovacool, 2014; Stern, 2014) and, for example,
Sovacool (2014) points out that there is a lack of research using triangulation within the
energy research area. The reason is probably that using several methods in a research project
is not only resource demanding; it also entails that researchers must familiarize themselves
with these different methods. Despite these challenges, three different methods have been
used in this research project (see Figure 7):
i. Semi-structured depth interviews, supplemented by a questionnaire, were used to
explore consumers’ willingness to become early adopters of Smart Grid technology.
Depth interviews were useful for this purpose because the complex concepts of the
Smart Grid and Smart Grid technology could be explained to the informants in a
detailed way, which can be difficult in the framework of a quantitative study. Depth
interviews also make it possible to probe participants to reflect on how it would be to
live with the technology, using it in everyday life, considering several new concepts
for consumers, such as external control and monitoring of devices inside consumer
premises, time-variable pricing on electricity, storing, and/or postponing electricity
consumption; all very complex matters. Further, a qualitative approach is suitable for
exploring the patterns of motivation and barriers for performing these types of
behaviours. The supplementary questionnaire was used to obtain background
information about the participants in a systematic way. A questionnaire is more
suitable for collecting data about personal characteristics, such as innovativeness,
human values, problem awareness, and demographics, due to the possibility for using

41
validated measurement instruments for this, as well as the anonymity given to
participants answering the questions.
ii. An online survey was used to capture a more general picture of private consumers’
attitudes, motives, and acceptance of Smart Grid technology. The survey was
conducted in three European countries where the issues of energy transformation and
Smart Grid are relatively high on the political agenda, but which differ substantially
with regard to the composition of their electricity supply (Hermwille, 2014; Sovacool,
2013; World Energy Council, 2013). Also, it was used to test whether consumers
responded differently depending on the defaults in the choice situation, i.e., the impact
of the default on how many accepted Smart Grid technology. The main advantages of
an online survey are that it makes it possible to obtain a representative sample, it is
resource effective, time saving, and can reach respondents over long geographical
distances. Some of the drawbacks are that responses are bound within the question
formulations provided by the research team that it is not possible to control the
surroundings in which the respondents answer the questionnaire, and that questions
about future intentions and behaviour are hypothetical.
iii. A field test was used to test the impact of different defaults on the choice of whether
or not to adopt Smart Grid technology in practice. The field test was designed to
provide understanding of consumers’ choices with regard to Smart Grid technology,
and how they can be influenced by carefully designing the choice architecture.
Further, it made it possible to replicate the findings from the online study in a real-life
setting and test their external validity. The limitations of the field test is that it is
extremely costly, time consuming, and depends on the benevolent participation of

42
many non-academic partners (in our case, utilities, a heat-pump supplier, suppliers of
home control equipment, retailers and installers of heat pumps).
Figure 7. Research design
Details about the studies can be found in Chapter 4 (mix of interviews and a questionnaire),
Chapter 5 (online survey) and Chapter 6 (online survey and field test).
3.1 Relation between research papers
Together, the research papers in this thesis give a broad insight into the various ways
consumers make decision as the papers address consumer decision making when using
systematic reasoning (System 2), automatic reasoning (System 1) or both (see Figure 7).
Research paper 1 is drawing on Diffusion of Innovation Theory that assumes that
consumers are reasoning deliberately (System 2 operates) about the benefits and
disadvantages of adopting Smart Grid technology. However, consumers perceiving the
adoption decision to take place in distant future might rely more on automatic processes in
System 1 (illustrated by the dashed line from research paper 1, in Figure 7). Research paper 2
draws on a “rational” decision-making model (the Technology Acceptance Model), which
assumes that consumers’ System 2 operates in the decision-making, and a “normative”
decision-making model (the Norm Activation Model), for which researchers are dissident
about which system that operates. Research paper 3 explores consumers’ decision making
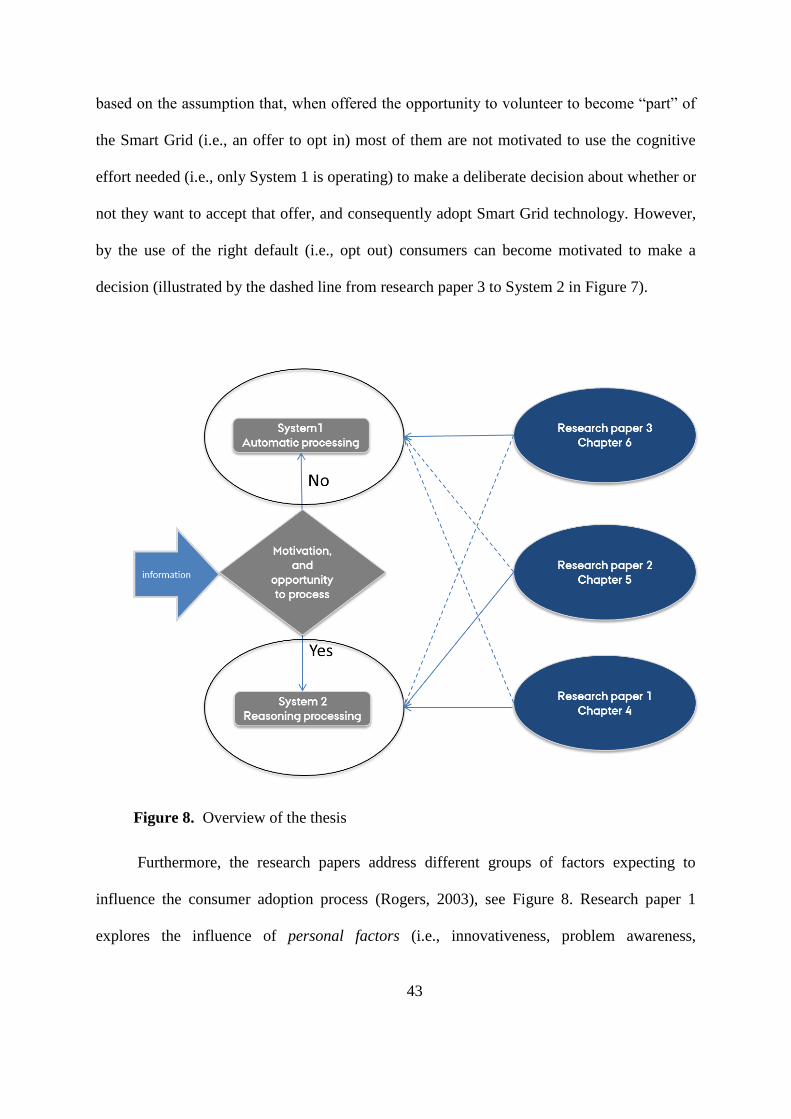
43
based on the assumption that, when offered the opportunity to volunteer to become “part” of
the Smart Grid (i.e., an offer to opt in) most of them are not motivated to use the cognitive
effort needed (i.e., only System 1 is operating) to make a deliberate decision about whether or
not they want to accept that offer, and consequently adopt Smart Grid technology. However,
by the use of the right default (i.e., opt out) consumers can become motivated to make a
decision (illustrated by the dashed line from research paper 3 to System 2 in Figure 7).
Figure 8. Overview of the thesis
Furthermore, the research papers address different groups of factors expecting to
influence the consumer adoption process (Rogers, 2003), see Figure 8. Research paper 1
explores the influence of personal factors (i.e., innovativeness, problem awareness,

44
motivation) and product factors (i.e., perceived relative advantage, compatibility, complexity,
and trialability) on different consumers segments’ acceptance of Smart Grid technology.
Research paper 2 investigates the influence of consumer personal factors (i.e. personal
norm and attitude) and product related factors (i.e., perceived ease of use and usefulness) on
the consumer’s intention to adopt Smart Grid technology.
Research paper 3 investigates how Environmental factors (i.e., the choice architecture)
impact consumers’ intention to adopt (i.e., acceptance) Smart Grid technology.
Figure 9. Factors influencing consumer innovation adoption process

45

46

47
4 EXPLORING PRIVATE CONSUMERS’ WILLINGNESS TO ADOPT
SMART GRID TECHNOLOGY
Madeleine Broman Toft and John Thøgersen
Abstract: The goal of radically increasing the proportion of electricity generated from
renewable sources puts the current electrical grid under pressure and one of the solutions is to
turn the grid into a “Smart Grid”. One of the key elements of the Smart Grid is that electricity
consumers make some of their consumption available as flexible capacity to balance the grid.
Consumers’ flexible capacity is only available to the grid if the consumers adopt Smart Grid
technology that establishes the link between the electric system and the consumer. This
technology is new to private consumers and using it involves behavioural changes. There is a
call for knowledge about who are willing to adopt Smart Grid technology and why. This
study draws on innovation adoption theory as a framework for understanding consumer
adoption of this new technology. We explore whether consumers who have already adopted
other types of new energy technology, such as a geothermal heat pump, are more favourably
disposed towards Smart Grid technology than other consumers. Also, we explore how
consumers who have signed up to let their heat pump be used as flexible capacity in a test
trial differ from other heat pump owners, if at all. We used semi-structured interviews with
household members as well as a questionnaire to explore differences between three groups:
households with (1) a heat pump with Smart Grid technology (n = 11), (2) a heat pump only
(n = 7) or (3) an oil-fired boiler (n = 6). We find that the families in the three groups perceive
the technology characteristics differently and those who have trial experience with Smart
Grid technology are most in favour of the technology.
Keywords: Adoption; Smart Grid technology; household study; sustainable innovation

48
CHAPTER 4 – TABLE OF CONTENTS
1 Introduction ................................................................................................................ 49
2 Theoretical background: Consumer innovation adoption and temporal construal ....................................................................................................................... 51
3 Methodology and data ............................................................................................. 55
3.1 Unit of analysis............................................................................................... 56
3.2 Recruitment .................................................................................................... 57
3.3 The interviews ................................................................................................ 58
3.4 Coding and analysis ....................................................................................... 59
4 Results ........................................................................................................................... 60
4.1 Some characteristics of the families in the three groups ................................ 60
4.2 Potential adopters’ perception of Smart Grid technology .............................. 61
4.2.1 Perceived relative advantage ...................................................................... 62
4.2.2 Perceived compatibility .............................................................................. 67
4.2.3 Perceived complexity ................................................................................. 70
5 Discussion .................................................................................................................... 72
5.1 Limitations ..................................................................................................... 74
5.2 Conclusions and implications ........................................................................ 74
Acknowledgements ............................................................................................................ 76
References ............................................................................................................................. 76

49
1 Introduction
Governments are beginning to realize that significant changes in the production and
consumption of energy are needed (Edenhofer O. et al., 2014; Press & Arnould, 2009),
dramatically increasing the share of renewable energy including solar heating, photovoltaic
systems, heat pumps and wind turbines (Claudy, Peterson, & O’Driscoll, 2012). Integrating a
larger share of renewable sources into the power system requires fundamental changes in the
way the system functions to enable it to fulfil the societal demand for electricity with a much
more fluctuating supply (Biegel, Hansen, Stoustrup, Andersen, & Harbo, 2014). “Smart Grid
technology” with remote control of electrical equipment opens up new possibilities for
balancing the supply and demand of electricity by regulating (i.e. switch on/off and postpone)
electricity consumption. Since private households account for a large and increasing share of
electricity consumption (e.g., 32% in Denmark in 2009, cf. Christensen, Ascarza, &
Throndsen, 2013) (European Commission's Joint Research Centre, 2012), it is important that
also private consumers accept that some of their power demanding appliances are made
available to regulate the timing of electricity consumption and that they adopt Smart Grid
technology for that purpose. In this paper, “Smart Grid technology” refers to advanced smart
meters that enable an electricity supplier or distribution system operator to remotely control
the electricity consumption of in-house appliances (Da Silva, Karnouskos, Griesemer, & Ilic,
2012). Hence, it is a further development of the basic smart meter, which is a digitalized
electrical meter that enables two-way communication between the consumer’s electricity
system and the electricity supplier, making on-site meter reading redundant (see Wissner,
2011, for further details about possible features of smart meters).
The advantages of Smart Grid technology for private consumers include digitalized
reading of their electricity consumption, a possibility to become flexible in electricity
consumption and take advantage of lower off-peak prices and improved feedback on

50
electricity consumption (Benzi, Anglani, Bassi, & Frosini, 2011). However, the societal
benefits are larger (Hamilton, 2010), including more effective markets, increased system
security and greater integration of renewable sources into the power system (Biegel et al.,
2014). Further, recent research indicates that potential adopters may perceive risks in
connection with the adoption of Smart Grid technology, such as loss of comfort (Goulden,
Bedwell, Rennick-Egglestone, Rodden, & Spence, 2014), violation of privacy, increased
costs (Krishnamurti et al., 2012), health concerns (AlAbdulkarim, 2013), less flexibility when
using electricity and difficulty performing peak shaving actions (Paetz, Dütschke, & Fichtner,
2012).
Due to their appliances and fluctuating electricity use during the day, households living
in single-family houses are especially well suited to adopt Smart Grid technology.
Households that have adopted some type of renewable energy technology (e.g., a geothermal
heat pump), already contribute to the “new” electricity system and might also be more ready
to contribute with balancing capacity. For example, households that have a heat pump have a
higher flexibility and a storage capacity that can be utilized for balancing the grid.
To most private consumers, Smart Grid technology is new and unknown. Typically,
such an innovation tends to be first adopted by a small group of people who perceive the
potential risks relative to benefits lower than others due to their personal characteristics,
needs and/or wants (Rogers, 2003). This segment of early adopters is important for the
success of the innovation because they test the innovation and function as opinion leaders,
who potential later adopters can turn to for advice and information thereby reducing the
uncertainty that surrounds the adoption (Rogers, 2003). Hence, by identifying the customer
segment or segments that are likely to become early adopters, for bigger effect can promotion
campaigns be targeted at these segments in the early stage of market penetration (Gärling &
Thøgersen, 2001). The current research provides insight into the adoption of Smart Grid

51
technology by combining an examination of personality and structural factors linked to
perceived time distance.
Studies on consumers’ perceptions of smart meters exist (Benzi et al., 2011; Darby,
2010; Hargreaves, Nye, & Burgess, 2010; He et al., 2013; Krishnamurti et al., 2012; Siano,
2014), but few deal with the adoption of smart meters with remote control. The Danish E-
flex project, that tested consumers flexibility capacity with smart meters with remote control,
found that to a large extent private consumers were willing to let their heat pumps be
externally regulated, and saving electricity costs was found to be an important incentive to do
this together with environmental concern and interest in new technology (Dong Energy,
2012). Other studies found that participants are willing to allow remote control of their home
appliances as long as this does not result in any loss of comfort (Da Silva et al., 2012) or they
get sufficient savings on their electricity bill (Mah, Van der Vleuten, Hills, & Tao, 2012).
However, what we do not know is how the specific segments that have a large electricity load
(i.e., households with, for instance, a heat pump installed) and therefore are a valuable asset
for obtaining balance in the grid, perceive this “new” Smart Grid technology. To the best of
our knowledge, this paper is the first to study these segments’ willingness to become adopters
of Smart Grid technology with remote control, a technology that has not been introduced to
the market yet1.
2 Theoretical background: Consumer innovation adoption and
temporal construal
Research on consumers’ adoption of sustainable energy technologies is sparse. Studies
on the adoption of solar power show that potential early adopters value the environmental
characteristics of solar power, but that widespread adoption is limited by long payback
1 In Denmark, are a number of ongoing Smart Grid projects testing Smart Grid technologies of various
types. However, Smart Grid technology with remote control is not yet available on the market.
52
periods, high capital costs and perceived risks regarding the long-term performance as well as
the products’ aesthetic characteristics (Faiers & Neame, 2006). Studies focusing on
geothermal heat pumps found that early adoption depends on a variety of socio-economic
characteristics such as income, age, household size, number of children in the family,
education and gender as well as on investment costs, environmental considerations, energy
supply security, comfort considerations, aesthetics, and social reasons (for a detailed
literature review see Karytsas & Theodoropoulou, 2014).
Over the years Rogers’ (2003, first edition 1962 ) Diffusion Innovation Theory has
contributed extensively to research on adoption of innovations (Rogers, 2004). The theory
suggests that a potential adopter goes through five stages when adopting an innovation: from
first becoming aware of the innovation over being interested and attending to information
about it and deciding to adopt or reject it, to implementing a decision to adopt and finally
using the innovation on a continuous basis (Faiers & Neame, 2006).
The theory predicts that some consumers adopt innovations earlier than others as a
result of differing innovativeness, defined as “the degree to which an individual is relatively
earlier in adopting new ideas than other members of a system” (Rogers, 2003, p. 267),
openness to change, and risk aversion. Midgley (1977, p. 49) integrates these three
dimensions and defines innovativeness as “the degree to which an individual makes
innovation decisions independently of the communicated experience of others.”
Furthermore, the likelihood that potential adopters adopt the innovation depends on
how they perceive the innovation on five dimensions (Gärling & Thøgersen, 2001): (1)
relative advantage (i.e., the degree to which an innovation is perceived as being better than
the idea/product it supersedes), (2) compatibility (i.e., the degree to which an innovation is
consistent with the potential adopters existing values, past experience, lifestyle and needs),
(3) complexity (i.e., the degree to which an innovation is perceived as relatively difficult to
53
understand and use), (4) trialablilty (i.e., the degree to which an innovation can be
experimented with or tried out), and (5) observability (i.e., the degree to which the outcome
of the innovation is visible to others) (Rogers, 2003).
Both innovation and consumers’ characteristics have been found to be major
determinants of innovation adoption (cf., Arts, Frambach, & Bijmolt, 2011). In a meta-
analysis, Tornatzky and Klein (1982) found that relative advantage, complexity and
compatibility have a consistent relationship to the adoption of an innovation. Arts et al.
(2011) argue that it is important to distinguish between drivers of adoption intention and
adoption behaviour because they represent different “stages” in the innovation adoption
process. They found that perceived compatibility is one of the most influential innovation
attributes affecting intention. Relative advantage is the most important attribute stimulating both
adoption intention and behaviour, and product complexity has a positive effect on adoption
intention while being an important barrier for adoption behaviour. With regard to adopter
characteristics Arts et al. (2011) found that consumer innovativeness has a positive effect on both
intention and behaviour (with a stronger effect on the latter) whereas consumer socio-
demographics (such as age, education and income) have limited impact. Furthermore, consumers’
involvement in the product category has a strong effect on intention to adopt.
Research on consumers’ adoption of innovations typically does not consider
consumers’ perceived time distance to the actual adoption decision, which has been found to
affect their evaluation of the innovation and also the adoption decision (Arts et al., 2011).
Hence, for our empirical study we draw on both diffusion of innovation theory (Rogers,
2003) and construal level theory (Liberman & Trope, 1998), which is used to get a better
understanding of how different types of potential adopters assess Smart Grid technology prior
to an adoption decision.
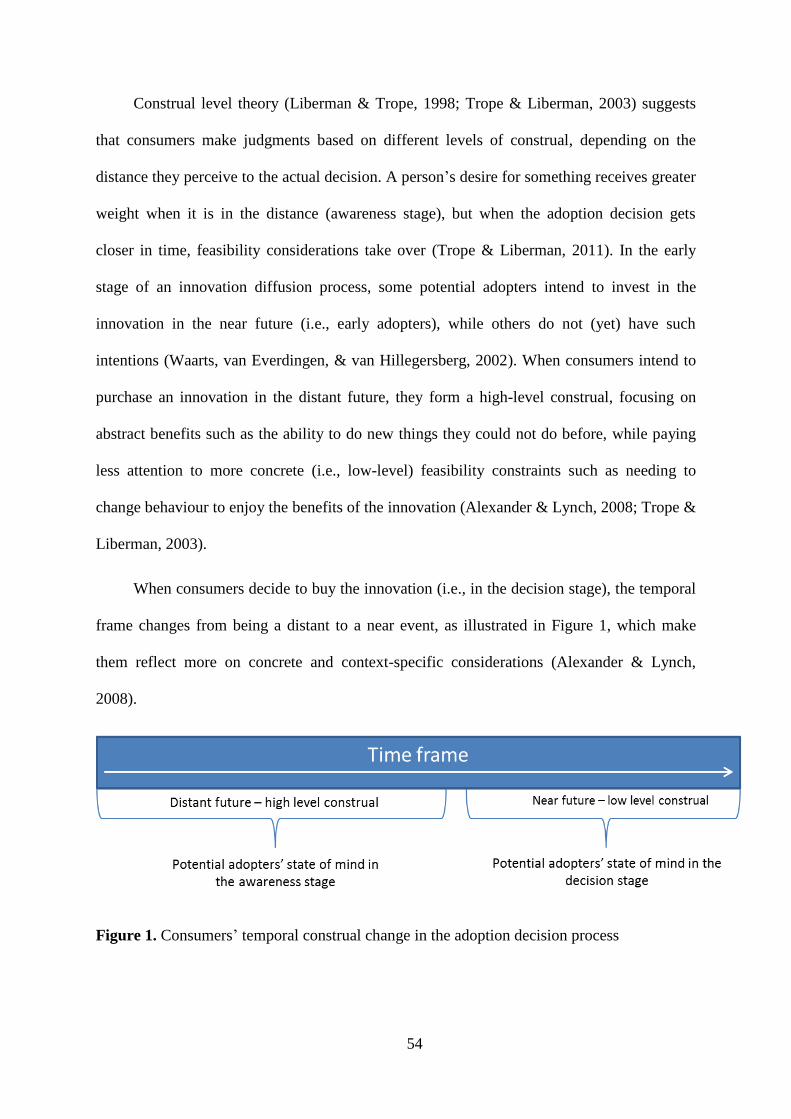
54
Construal level theory (Liberman & Trope, 1998; Trope & Liberman, 2003) suggests
that consumers make judgments based on different levels of construal, depending on the
distance they perceive to the actual decision. A person’s desire for something receives greater
weight when it is in the distance (awareness stage), but when the adoption decision gets
closer in time, feasibility considerations take over (Trope & Liberman, 2011). In the early
stage of an innovation diffusion process, some potential adopters intend to invest in the
innovation in the near future (i.e., early adopters), while others do not (yet) have such
intentions (Waarts, van Everdingen, & van Hillegersberg, 2002). When consumers intend to
purchase an innovation in the distant future, they form a high-level construal, focusing on
abstract benefits such as the ability to do new things they could not do before, while paying
less attention to more concrete (i.e., low-level) feasibility constraints such as needing to
change behaviour to enjoy the benefits of the innovation (Alexander & Lynch, 2008; Trope &
Liberman, 2003).
When consumers decide to buy the innovation (i.e., in the decision stage), the temporal
frame changes from being a distant to a near event, as illustrated in Figure 1, which make
them reflect more on concrete and context-specific considerations (Alexander & Lynch,
2008).
Figure 1. Consumers’ temporal construal change in the adoption decision process
55
For example, when consumers are asked about their intention to buy green power, they
often express high interest, but when the temporal construal frame changes due to entering the
stage where a purchasing decision is to be made, other considerations make the potential adopters
step back from adopting green power (cf., Gangale, Mengolini, & Onyeji, 2013).
In sum, the innovation’s characteristics in terms of relative advantage, compatibility
and complexity as well as the consumer’s innovativeness are most likely to affect adoption
intention and behaviour. Hence, the following empirical study pays special attention to these
characteristics when exploring who seem more willing than others to adopt Smart Grid
technology in this early stage.
3 Methodology and data
This study includes three groups of households that differ in their adoption of
sustainable energy technology. Group 1 and Group 2 heat their homes by means of a heat
pump and participants in Group 1 are also “trial” adopters of Smart Grid technology (SGT)
for regulating their heat pumps. Group 3 consists of households using a conventional oil-fired
boiler as their heating system. In-depth interviews were conducted with 42 individuals in 24
households; these also filled in a questionnaire. Hence, a mixed method was used for this
research, as recommended by Sovacool (2014). The number of households in each group is
shown in Figure 2.

56
Figure 2. Sample
3.1 Unit of analysis
Since energy consumption in a home is a social and collective process, it is advised to
focus on the household as the key unit of analysis rather than the individual consumer
(Hargreaves et al., 2010). Because households living in single-family houses consume, on
average, almost twice as much electricity as apartment households (Petersen & Gram-
Hanssen, 2005), meaning that their flexible capacity is larger, this study focuses specifically
on consumers living in single-family houses.
The few available studies on adoption of Smart Grid technology were conducted with
consumers that signed up for a Smart Grid test project. Hence, participants in those studies
are not likely to be “average” but rather households with a higher than average interest in the
topic or in new technology, or just in being part of something new. For this study, we
recruited this type of households as well, but also households that had not signed up for a
Smart Grid test project in order to get a more representative sample of households (living in
single-family houses) in Denmark.

57
3.2 Recruitment
The Building and Dwelling Register (BBR) was used to randomly choose 107
households in the Central Jutland region with either an oil-fired boiler or a heat pump. They
were contacted by phone and asked to participate in an interview. Fourteen did not have a
known telephone number, 25 did not answer the phone, 44 did not want to participate, or had
another type of heating system than the one registered by the BBR (i.e., neither a heat pump
nor an oil-fired boiler), and 11 had a photovoltaic system. Hence, only 13 fitted the screening
criteria and were willing to participate in an interview.
Households with a heat pump installed with Smart Grid technology were recruited from
the participants in two Danish projects testing this kind of technology.2 From these projects,
17 households were contacted, of which 11 were able and willing to participate. The 24
participating households are presented in Table 1.
Table 1. Background characteristics of the participating households
Note: Throughout this paper, the ID will be used to label quotations drawn from the interviews. *DNWI=Do not wish to inform
2 The READY project 10757 and the Improsume project no. 2010-1-10710
Families
ID Group definition
Gender of
participants
Age
group Civil status
Household
income before
tax (DKK)
Children
under 18
living at
home Type of house Heating system
Electricity
consumption
kWh/year
SGT1 Heat pump with SGT Both genders 26-35 - 25.000-79.000 5+ Single family house/villa Floorheating 8.0000+
SGT2 Heat pump with SGT Both genders 56-65 Married 25.000-79.000 1 Farmhouse Radiators 4.000-5.999
SGT3 Heat pump with SGT Both genders 46-55 Married 25.000-79.000 2 Farmhouse Floorheating 8.0000+
SGT4 Heat pump with SGT Both genders 26-35 Married 25.000-79.000 1 Single family house/villa Floorheating 8.0000+
SGT5 Heat pump with SGT Male 66+ Married 25.000-79.000 another type of permanent residence Floorheating 8.0000+
SGT6 Heat pump with SGT Both genders 36-45 Married 25.000-79.000 2 Farmhouse Floorheating 8.0000+
SGT7 Heat pump with SGT Female 66+ Married 25.000-79.000 1 Farmhouse Floorheating and radiators 8.0000+
SGT8 Heat pump with SGT Male 36-45 Married 25.000-79.000 2 Single family house/villa Floorheating 8.0000+
SGT9 Heat pump with SGT Both genders 46-55 Married 80.000-99.000 1 Single family house/villa Floorheating 8.0000+
SGT10 Heat pump with SGT Male 26-35 Divorced 25.000-79.000 Farmhouse Floorheating 8.0000+
SGT11 Heat pump with SGT Both genders 66+ Married 25.000-79.000 Single family house/villa Floorheating 8.0000+
HP1 Heat pump Both genders 66+ Married 150.000+ Farmhouse Floorheating and radiators 8.0000+
HP2 Heat pump Both genders 46-55 Married 25.000-79.000 Farmhouse Radiators Don't know
HP3 Heat pump Both genders 56-65 Married 25.000-79.000 Farmhouse Floorheating 8.0000+
HP4 Heat pump Both genders 46-55 Married DNWI* Single family house/villa Floorheating and radiators 8.0000+
HP5 Heat pump Both genders 46-55 Married 25.000-79.000 1 Single family house/villa Floorheating and radiators 8.0000+
HP6 Heat pump Both genders 36-45 Married 25.000-79.000 2 Farmhouse Floorheating 8.0000+
HP7 Heat pump Both genders 36-45 Married 80.000-99.000 3 Single family house/villa Floorheating and radiators 8.0000+
OFB1 Oil-fired boiler Both genders 56-65 Married 25.000-79.000 Farmhouse Radiators 4.000-5.999
OFB2 Oil-fired boiler Male 56-65 Married 25.000-79.000 1 Single family house/villa Radiators 6.000-7.999
OFB3 Oil-fired boiler Male 36-45 Partnership 25.000-79.000 Single family house/villa Floorheating 4.000-5.999
OFB4 Oil-fired boiler Both genders 46-55 Married 25.000-79.000 Farmhouse Floorheating and radiators 2.000-3.999
OFB5 Oil-fired boiler Both genders 36-45 Partnership 25.000-79.000 2 Single family house/villa Floorheating 4.000-5.999
OFB6 Oil-fired boiler Both genders 46-55 Married 25.000-79.000 2 Single family house/villa Floorheating 2.000-3.999

58
3.3 The interviews
From May to September 2013, the interviews were conducted as face-to-face in the
family’s home; they lasted approximately 90 minutes and were followed by a short
questionnaire.3 The questionnaire was used to measure problem awareness and personal
characteristics (especially innovativeness (Goldsmith, 2002) and value priorities (Schwartz,
2006)) that research has found to effect early adoption of innovations (Arts et al., 2011; Jager,
2006) and pro-environmental behaviour (de Groot & Steg, 2010) (see the appendix 1 for
measurements). The interviews were semi-structured in-depth interviews, which enables
comparisons between groups (Kjeldsen, 2010). Each interview was initiated by explaining to
the participants that they were part of a study exploring electricity consumers’ willingness to
take part in the future electricity system, also called the Smart Grid. Then the households
were told that in the future electricity consumers can adjust their consumption by, for
instance, using more electricity when the wind is blowing and hold back with consumption at
other times. To facilitate this adjustment of their consumption, they could have automatic-
controlled technology installed, a so-called Smart meter with remote control.
This was followed by an introduction to the fictitious family used in the vignettes; also
we clarified whether it was alright to record the interview and informed them about their
anonymity in the study.
In each interview, themes (i.e., adoption of Smart Grid technology, remote control and
flexibility in using electricity, and storing energy) were presented to the households using
vignettes (Grønhøj & Bech-Larsen, 2010 see examples in Appendix 2) . The vignettes make
it possible to examine the interviewed households’ reasoning about an issue in some detail
and with a shared reference point (Grønhøj & Bech-Larsen, 2010). Furthermore, the use of
3 Nine of the households with a heat pump with SGT filled out the questionnaire online before the
interview whereas the rest of the households filled out a printed questionnaire right after the interview.

59
vignettes helps the interviewees to situate the technology in their home and to imagine what it
will be like to use the technology and how it will influence their everyday life; using
vignettes is thus likely to increase the ecological validity of their responses (Bryman, 2008).
The vignettes were presented orally to the interviewees followed by questions about
what they thought about the Smart meter with remote control. Then followed questions about
whether they (OFB and HO groups) would like to have one installed; whether would they
agree to have the technology installed if they got it for free; whether would they would be
willing to pay for it, etc. The first question to the SGT group was about their experience with
the technology followed by the same questions as the OFB and HO groups got. After each
question they were probed about what they perceived as the advantages and disadvantages of
the technology and the use of it.4
3.4 Coding and analysis
The interviews were electronically recorded and transcribed. The analysis strategy
consisted of several steps. Following an inductive-deductive approach, the interviews were
coded by the first author in NVivo10 based on participants’ unique perspectives, and the
codes were grounded in the actual data, known as conventional content analysis (Hsieh &
Shannon, 2005). Content analysis is used to subjectively interpret the content of the data
through a systematic classification process of coding aiming to identifying themes or patterns
(Hsieh & Shannon, 2005; Miles, Huberman, & Saldaña, 2013). The individual cases were
first coded and analysed, followed by a cross-case comparison at the group level; the groups
were defined by their heating system (i.e., heat pump with SGT, only heat pump, or oil-fired
boiler). The coding process started with attribute coding, such as the interviewees’ gender,
age, group affiliation, marital status and other background information. Then followed an
4 Due to space concerns not all questions asked are included but the full interview guide can be acquired
from the authors.

60
open coding of the interviews and a systematic grouping of the open codes under themes that
were relevant for the analysis using hierarchal coding (Gibbs, 2007). In practice, this means
that the open codes were sorted into themes relevant for answering the research questions.
Along the coding, memos were used to write down ideas for relationships between codes and
a summary of the analysts’ reflections on the data from each household interviewed.
4 Results
4.1 Some characteristics of the families in the three groups
The families in all three groups scored high on Problem Awareness 5 (mean scores at
least 6 on a 7-point scale) and on Universalism (mean scores 4.5 on a 6-point scale) and low
on Achievement (mean scores between 3 and 4). Hence, the results indicate that there are no
differences between the groups as regards Problem Awareness, Universalism, and
Achievement values. However, there is a significant difference (p<.05) in Innovativeness
with regard to alternative energy technology between the group with a heat pump with SGT
(mean score 5.4) and the oil-fired boiler group (mean score 4.04). As expected, the mean
score for the heat-pump-only group (4.9) was in between the other two groups.
These results suggest that participants in all three groups are highly aware of the threats
that energy consumption poses on the environment and that they value protecting the welfare
of people and nature more than personal achievements. The participants’ choice of heating
system reflects their innovativeness with regard to alternative energy technology.
5 Problem awareness and innovativeness were measured on a scale from totally disagree (1) to totally agree (7).
Universalism and Achievement values were measured on a scale from: Not similar to me at all (1) to Exactly
like me (6). For more details, see appendix 1.
61
4.2 Potential adopters’ perception of Smart Grid technology
According to the diffusion of innovation theory, the innovation adoption process starts
with potential adopters becoming aware that the innovation exists. The first vignette
explained what Smart Grid technology is and how it works 6 (see appendix 2, vignette 1).
Then followed questions probing what they thought about this technology.
As expected, the participants with a heat pump with SGT had more knowledge about
this technology than the other two groups. However, it was evident that even in this group,
not everyone was certain about how it worked, as illustrated by this quote:
.. after he [the electrician] had left, I felt a bit like … well, what do I actually need this
for. And then I suddenly started to worry that he had installed something that would
enable to them to turn off my heat, and that the house would be left without heating.
SGT10 (male)
However, knowledge and interest in Smart Grid technology was found among
participants in all three groups. It appeared that it is usually a male responsibility to take care
of the heating system and technology related to it. Men tended to be most interested and had
most knowledge about the technology and how it worked. Some of the interviewed women
expressed that they found neither the heating system nor Smart Grid technology interesting.
……I don’t find it particularly interesting. I just think the heating should work and then
everything is fine. So it’s more my husband’s responsibility. SGT2 (woman)
One man said that even if he thought that his wife had more technical skills than he, he
was the one responsible for things related to the heat pump.
“…in fact, it doesn’t make sense that I should deal with these things because in fact
it’s Charlotte, who is .. She is much more technically minded than I am." SGT9 (male)
6 The group with heat pumps with Smart Grid technology was not presented with this vignette. Instead, they
were directly asked about their expectations of the technology.

62
However, in spite of men having most of the responsibility and knowledge, both men
and women expressed that it was a joint decision to have a new heating system and
technology installed.
4.2.1 Perceived relative advantage
The consumers’ perceived value of an innovation is the benefits that they expect from
the innovation relative to the costs of adoption (Waarts et al., 2002). In the following, the
main findings regarding participants’ expected benefits and costs or disadvantages related to
the adoption of Smart Grid technology are reported.
4.2.1.1 Benefits
After introducing the Smart Grid technology to the participants, they were asked what
they thought were its advantages and disadvantages. The participants with a heat pump with
SGT valued that Smart Grid technology gives them more insight into how their heat pump
works. They use it to check that the heat pump works as it should and to control the amount
of consumed hot water and electricity consumption, as expressed in this quote:
”…to check that your heat pump performs okay, I mean that you get the optimum
benefit or whether you’re looking at excessive spending. Or whether I can save some
money; if I save electricity, then I’ll save some money, and that’s always
interesting.”SGT1 (male)
The majority of households in this group (7/11) also mentioned the prospect of
reducing their electricity bill. Many also expected that this technology would contribute
something good to society and the environment.
Participants with a heat pump only did not expect that many advantages from Smart
Grid technology. It was mainly two of the seven households in this group that talked about

63
the advantages. These two families expected that they could save money and contribute to
society and the environment.
”Well, firstly, of course, that we can save on our electricity bill, but there’s also
something more overall – I want to support the use of renewable energy, and we’ll do
that in this way. Our CO2 emission will be lower by using wind power and solar energy
and by being able to exploit it better. I want to be a part of that. But having said that,
our primary goal, if we want to invest in this, is that we must be able to see some
economic benefits.” HP4 (male)
Participants with an oil-fired boiler also mentioned being able to save on the electricity
bill, in addition to having the newest technology on the market, as expressed in this quote:
”I imagine that if we want to replace our heat source, then we’ll want to find something
up-to-date, something that can monitor the entire system, right?”OFB4 (male)
Participants in this group also mentioned contributing to society and the environment.
4.2.1.2 Disadvantages
The participants who had adopted Smart Grid technology for a trial period perceived
several disadvantages of the technology, including loss of comfort in terms of too low indoor
temperature and not enough hot shower water:
“…if this is going to work in a family, then you have to take into consideration that the
family includes two teenagers who can easily spend 20 minutes each in the shower. So
when it’s mum’s and dad’s turn to shower afterwards then there’s no hot water left and
if it doesn’t resume working until two or three hours later – not good. Plus if there’s a
spell of cold weather then I don’t want to enter a cold bathroom and it doesn’t switch
on before the temperature is below 17o – that’s not good enough.” SGT3 (male)
Other disadvantages mentioned were the risk that the utility would increase the price
for a kWh (SGT9, SGT10) and an increase in electricity consumption due to the additional
communication and regulation equipment, as expressed in this quote:

64
“who’s going to pay for the electricity that the control unit is using? My measurements
tell me that the three boxes – there are two out by the heat pump and one at our
Internet – and they use about 6-7 watts each, that is 20 watts, which runs into 160-170
kW per year and we’re paying about 2 DKK per kW, right” SGT6 (male)
All the interviewees in the heat-pump-only group anticipated high installation costs and
also emphasized the importance of the return on investment or length of the payback period.
It was unclear to them how much it would cost to install Smart Grid technology and whether
the savings would cover the investment costs, as expressed in this quote:
“….I doubt that it will involve any real saving for us. It depends on how much the price
of electricity is going to fluctuate; if it’s only 2 or 3 øre or 5 per kWh then it isn’t that
interesting. If there were real savings in it, something with a real impact, but I doubt
that is the case”HP1 (male)
Some families in this group reasoned in much detail about what it would be like to live
with this technology in different situations, asking questions about how it works and what
happens if it breaks down when they are away on holiday, and who would then come in to
repair it?
“…it may break down or something. Like in the holidays, if it crashes or something,
who’s there to ensure that it’s up and running again? And if you’re done out in that
period, how is that sorted? This is what I’m thinking, with technology something is
bound to happen.”HP6 (female)
Some of the families in this group had already invested in heat pump gadgets, such as a
secondary meter, showing the electricity consumption of the heat pump. One family had
installed their heat pump with a steering system regulating the room temperature in each
room and lowering it during nighttime and when they went to work or on holiday. This
family was concerned whether the two different technologies were compatible:
“I can see some negative aspects – we’ve invested heavily in geothermal heat and new
??? – if I’m to invest in something new again, which probably isn’t compatible with the

65
other systems – that would be a downer. It’s the same as having three phones that don’t
work together or having three remote controls for your TV set or stereo. An all-purpose
thing would be neat.” HP7 (male)
Two thirds of the families with an oil-fired boiler mentioned the costs of adopting
Smart Grid technology. One family said that they did not want to invest in a heat pump and
Smart Grid technology because they thought it would be too expensive. In general,
participants in this group expected a lot of extra installations, did not perceive a heat pump as
a good heating system, and did not like to fully depend on electricity as a heating source, as
expressed in this quote:
“I know a lot of people who have geothermal heating and in the winter time they are
cold, so they have to have another energy source. Geothermal heating is not enough
when it’s cold. So it’s a big investment. And there’s the control box and everything, it
all runs into money. I truly don’t believe that even if the electricity is cheap that you’ll
get a return on investment” OFB1 (male)
4.2.1.3 Similarities and differences across groups
When comparing the three groups, it is clear that they all expect both benefits and
disadvantages from adopting Smart Grid technology. Participants in all groups mentioned the
benefit of being able to save money and energy and contribute to society and the
environment.
The groups differ more as to what the participants stress as being the disadvantages or
risks. Participants with a heat pump with SGT tended to emphasize, more than other
participants, the benefits of gaining control over the heat pump’s electricity consumption and
control over their electricity consumption in general. They also focus more on the risks of
comfort loss and increased electricity consumption. The technology was already installed in
this group’s homes at the time of the interview so the purchase and installation costs were not
an issue to them. The participants in the two other groups focused more on the costs related to
66
adoption and use of the technology. However, some participants in the heat pump with SGT
group stated that the incentives to continue the use of the technology might be too small.
There was even one household (SGT11) in this group where the Smart Grid technology was
not properly installed because, as the male in the family expressed it, they could not get a
contract with their utility company based on time-variable pricing. Therefore he did not see
the point in buying the extra cord that was missing to properly install the Smart Grid
technology.
NVIVO enables a quantification of how much participants elaborate on various aspects,
such as advantages and disadvantages, by counting the number of “coding instances” that are
labelled within a certain category. In NVIVO, a coding instance is the number of times text
has been coded under a specific node (e.g. under the parent node advantage or disadvantage).
The analysis of the average number of coding instances for each group shows that
participants with a heat pump with SGT elaborate relatively more on the advantages than on
the disadvantages of Smart Grid technology (see Figure 1). Participants in the two other
groups talked more, and equally much about disadvantages. Of the three groups, the heat-
pump-only group talked the least about benefits.
In sum, this analysis indicates that when households are ready to adopt Smart Grid
technology, they tend to focus mostly on the risks and less on the potential benefits, whereas
households that have already adopted it on a trial basis focus mostly on the benefits and less
on risks or disadvantages.

67
Figure 3. Perceived advantages and disadvantages of Smart Grid technology in the
three groups measured as coding instances corrected for sample size, N = 24
4.2.2 Perceived compatibility
The adoption rate of an innovation depends on its fit with the target market (Waarts et
al., 2002), that is, compatibility with the potential adopters’ needs, values, lifestyle and past
experience (Arts et al., 2011; Tornatzky & Klein, 1982). To explore how participants
perceived the fit of Smart Grid technology with their lifestyles and needs, they were
introduced to a vignette (see appendix 2, vignette 2) explaining the need for switching off
appliances in periods of high demand and two vignettes (see appendix 2, vignettes 3 and 4)
with examples of how Smart Grid technology work with a heat pump and a washing machine.
All households with a heat pump with SGT were positive towards having their
electricity consumption regulated by a utility company. They perceived this as something
they could adapt to in their everyday lifestyle. It appears that the type of heating system is a
matter of importance for this group’s willingness to have their heat pumps regulated. Seven
of these families’ houses had floor heating, and they did not expect loss in comfort because

68
floor heating reacts slowly and the heat accumulated in a concrete floor would heat the room
for quite some time if the heat pump is switched off.
Four of the 11 participants in this group (SGT7, SGT8, SGT10, SGT11) also expressed
an interest in new technology, as expressed in this quote:
“But generally I find new electronic gadgets and stuff like that fascinating. That’s why I
also thought it was fun having a control box fitted to the heat pump which enabled me
to check our consumption and perhaps even when I was out of the house, or that I could
fiddle with it even if I was not at home.” SGT10 (male)
Four of the seven households in the heat-pump-only group were positive towards
having their electricity consumption regulated, expressing that their lifestyle fitted with the
remote control (i.e., doing the laundry at night) and that they would regulate the consumption
themselves if the utility did not do it for them. The adverse households in this group lacked
trust in the utility company, as expressed in this quote:
“It starts looking a bit like banking and interests and what have we. You really have to
have confidence in your utility company to leave it to them. In principle they can fleece
the consumers if they want to.” HP5 (female)
Also, some families expressed reluctance to changing their laundry habits, as expressed
in these quotes:
“What if they switch the thing off in the morning, say at 10, and that’s when I want to
do the laundry because I’m going out later. Then I have a problem. Or perhaps it’s in
the afternoon – I’ve been at work all day and when I get home I want to get three
machines done before dinner – and I get can’t do that either. That would upset me, I’m
telling you. There’s not so much laundry to do as before. It would really be a nuisance
if I was kept from deciding when to do the laundry” HP2 (female)
“If I’ve been outside fixing something and my clothes are soiled, then I’ll toss them in
the washer – let’s say at about 5. Then I’ll want to start the machine straightaway.

69
Otherwise I would have to wait until 8. If so, we’d want a timer that would start it then.
But the machine wouldn’t be done until a quarter past nine and then I’ll need to remove
the clothes and hang them and you know. We might have gone out in the meantime so it
would cramp our room to maneuver.”HP3 (male)
Other participants in this group (HP1, HP2) had reservations with reference to the value
of being in control and having the freedom to decide when to use electricity.
Five out of the six households with an oil-fired boiler were positive towards having
their electricity consumption regulated by the utility company. They believed that they could
adapt their lifestyle, doing the laundry at other hours, and that it was clever to have the utility
to do the regulation because doing it themselves would be time-consuming. The household
(OFB1) that was opposed to Smart Grid technology did not perceive it as useful. They did not
find it safe having the washing machine run at night and did not trust the utility company to
regulate their consumption, and in general they did not see renewable power sources as a
good alternative. Four out of the six households in this group stated that they found the
technology interesting and one family said that without a doubt they would like to try it (if it
was for free):
“If somebody wants to give it to us for free, then we’re game, absolutely. We’re in”
OFB4 (male)
4.2.2.1 Similarities and differences across groups
All the households with a heat pump with SGT were positive towards having their
electricity consumption remotely controlled, and all except one of the oil-fired boiler
household. However, almost half of the families in the heat-pump-only group were opposed
to having their electricity consumption remotely controlled.
In general, all groups perceived washing machines, dishwashers and especially their
heating system as suitable for Smart Grid technology because it would be possible to adjust

70
habits and lifestyles with regard to the use of these appliances. Computers and TV sets were
mentioned as examples of equipment not suitable for Smart Grid technology as it is
inconceivable that you would stop watching a football game just because the utility company
wants to reduce electricity consumption at that point in time.
Interest in new technology was mentioned more by participants with an oil-fired boiler
(4/6) compared to the other two groups (heat pump w. SGT 4/11, heat pump only 1/7).
Participants with an oil-fired boiler often mentioned structural reasons for not having more
sustainable technologies installed. One family (OFB2) had thought about installing solar
panels on their house, but the roof faced in the wrong direction, and trees were in the way of
the sun. Another family (OFB4) had thought about different alternatives to their oil-fired
boiler, but was waiting for the village to decide whether district heating should be installed in
all houses. A third family was renovating their house and had not gotten as far as to changing
the heating system, but their plan was to have a solar heating system. Financial reasons were
also mentioned for not yet having invested in any kind of sustainable energy technology.
4.2.3 Perceived complexity
An innovation’s complexity has been found to be an important barrier for adoption
(Arts et al., 2011). With regard to Smart Grid technology, the complexity relates to the
product itself as well as to the use of the technology (i.e., having appliances remotely
controlled by the technology).
The families with a heat pump with SGT found it difficult to grasp how the setting of
the minimum temperature worked and how Smart Grid technology would operate with a
washing machine (for instance, when the washing machine would be switched off). Some of
these families found it difficult to understand how the remote control would work in practice,
who would be in charge of the remote control, and for how long the appliances would be
71
switched off. Mainly they were uncertain about how it would affect their heat and lacked
information about how to overrule the remote control.
Some of the families in the heat-pump-only group did not understand the need to be
remotely controlled and they were also uncertain about how that would be done in reality and
for how long, about which appliances could be connected to Smart Grid technology, how it
worked with fluctuating prices of electricity, and how that was linked to the demand for
electricity. Some were also uncertain about how the heat pump’s production of hot water
would be affected, whether they would need a buffer tank to allow regulation of their heat
pump’s electricity consumption, how their heat pump was switched off, and when the remote
control would take place. How to overrule the remote control was also an issue.
The families with an oil-fired boiler were mostly uncertain about why they should be
remotely controlled, how that would happen in practice and how the technology functioned
connected to a washing machine. Some families in this group also had questions about the
technicalities of the signals being sent via the Internet to the Smart Grid technology.
4.2.3.1 Similarities and differences across groups
Across groups, families perceive several uncertainties and difficulties when trying to
picture themselves adopting and using Smart Grid technology in their everyday lives. The
complexity also made the participants in the two groups with no Smart Grid technology
experience (i.e. the families with a heat-pump-only or an oil-fired boiler) uncertain about why
they should have their electricity consumption remotely controlled. Participants with a heat
pump with SGT mainly had questions about details such as how to set the minimum
temperature, how Smart Grid technology works with the washing machine, and the
information it provides. The quantitative analysis of coded instances of expressions of
complexity shows that the least uncertainty is expressed by those who have experience with

72
the technology (i.e., the heat pump with SGT group) and those whose heating system is not
yet ready for Smart Grid technology (the oil-fired boiler group) whereas the most inquisitive
group as regards the technology and its use is the one that is ready for it but which has no
experience (the heat pump only group; see Figure 4).
Figure 4. Perceived complexity of Smart Grid technology in the three groups measured
as coding instances corrected for sample size, N = 24
5 Discussion
Early adopters are crucial for the further diffusion of an innovation (Rogers, 2003).
Hence, knowledge about who are more willing than others to adopt an innovation in the early
stage is valuable to producers and marketers. Furthermore, understanding why some
consumers are more willing than others is useful when trying to convince potential adopters.
This study has contributed insight by showing that not all potential Smart Grid technology
adopters are equally willing and by suggesting why this is likely to be the case.
0
2
4
6
8
10
12
Heat pump with SGT Heat pump Oil-fired boiler
Ave
rage
co
din
g in
stan
ces
Group

73
As expected, this study suggests that households that have a heat pump and that have
adopted Smart Grid technology on a trial basis are more willing than others to adopt Smart
Grid technology. According to innovation diffusion theory, these consumers have reached the
“confirmation stage” of the innovation adoption process and will either continue towards full
adoption or reject the innovation after the trial period. According to construal level theory,
the fact that the households perceive the adoption decision as an imminent one makes them
focus on concrete details related to the technology adoption. Consistent with this prediction,
they mentioned potential risks, such as loss of comfort, and details about how the technology
works (e.g., the setting of a minimum temperature). However, due to their trial experience,
they focus more on benefits than on disadvantages, perceiving a higher level of relative
advantage than participants with no experience. This also indicates that they have overcome
some of the obstacles perceived by other segments, such as investment costs and not
understanding why remote control is necessary. They may also have gained new insights as
to the private benefits of Smart Grid technology, for example, useful knowledge about their
heat pump’s electricity consumption and function. Prior research found that many consumers
find heat pumps difficult to grasp and operate (Antropologerna.com, 2012). Smart Grid
technology gives these consumers a tool to better understand their heating system. Hence,
trial might reduce their perceived uncertainty and the complexity of the innovation.
The participants with an oil-fired boiler appear to perceive Smart Grid technology as
relatively more advantageous and less complex than participants with a heat-pump-only. This
is also in line with construal level theory. It can be assumed that families with an oil-fired
boiler perceive the decision about adopting Smart Grid technology to be an event in the
distant future whereas the families with a heat pump only are ready to adopt (because of the
heat pump) and therefore perceive the adoption decision to be imminent. According to
construal level theory, families with an oil-fired boiler focus more on the benefits and rate the

74
compatibility higher exactly because they are further away from the actual adoption decision,
whereas families with a heat pump focus more on the concrete consideration and risks
because they are ready to make the final decision.
5.1 Limitations
Smart Grid technology as defined here can be classified as a really new innovation because
there is no similar product on the private consumer market. Hence, when interpreting the findings
of this study, one must keep in mind that when an innovation is really new, it is difficult for
consumers to judge its usefulness (Alexander & Lynch, 2008). This adds an unknown amount of
uncertainty and randomness to information and judgments provided by participants. Possibly the
interviewer may affect participants’ judgments more in an interview conducted in an early stage
of an innovation’s diffusion process due to lack of personal experience with the innovation.
However, the use of a semi-structural interview guide and vignettes reduces the possible variation
in interviewer influence across participants.
5.2 Conclusions and implications
The objective of this study was to explore consumer willingness to adopt Smart Grid
technology in the early stage of its diffusion. This was achieved by comparing three groups of
households that vary in their adoption of sustainable energy technology: (1) Households with
a heat pump and Smart Grid technology, (2) households with a heat-pump-only, and (3)
households with an oil-fired boiler. Besides their adoption of sustainable energy technology,
these three groups of households do not differ significantly on their background
characteristics (Table 1).
The results show that the families in the three groups perceive the technology’s
characteristics differently. The families with a heat pump with SGT appear to perceive the
technology as having higher relative advantages and as being less complex, and they seem

75
more willing to have their electricity consumption remotely controlled than the two other
groups. Families with a heat pump only are the most hesitant of the three groups. The
families with heat pump with SGT also have the highest level of energy technology
innovativeness of the three groups and the families with a conventional oil-fired boiler the
lowest.
For companies and organizations promoting Smart Grid technology to private
households, the study suggests a segmentation of potential adopters in terms of both
structural and personality characteristics. It is relatively easy to identify the households
whose structural characteristics make them most “Smart Grid ready”. These would include
households with a heating system or other equipment with a high electricity consumption and
service flexibility, such as a heat pump. In terms of personality, the study shows that it is
indeed possible to identify the consumers with the highest willingness to try the new
technology using a well-established instrument to measure domain-specific innovativeness.
By combining these structural and personality characteristics, it is possible to identify a well-
defined target segment for promotion campaigns in the early stage of the development of the
Smart Grid technology market.
For the next stage, focus should be on those that are structurally ready but less
innovative, in this study represented by families with a heat-pump-only. From innovation
diffusion research we know that this group is influenced by the earliest adopters, both as
regards advice (in the close network) and, more importantly, in terms of demonstration and
“vicarious learning” (Bandura, 1977). The current study also shows that this group would
benefit from more information and from a possibility to experiment with the technology; this
would enhance their readiness because it would help them understand the technology (cf.,
Arts et al., 2011).

76
Acknowledgements
We gratefully acknowledge funding from Energinet.dk for the realization of the
READY project (no. 10757) and the Improsume project (no. 2010-1-10710) in which this
research has been conducted.
References
AlAbdulkarim, L. O. (2013). Acceptance-by-design. Elicitation of social requirements for
intelligent infrastructures. (PhD), Delft University of Technology, The Netherlands.
Alexander, D. L., & Lynch, J. G. (2008). As time goes by. Journal of marketing research, 45,
307-319.
Antropologerna.com. (2012). eFlex: Flexible electricity consumption (eFlex: Fleksibelt
elforbrug) (pp. 1-109). Copenhagen, Denmark.
Arts, J. W. C., Frambach, R. T., & Bijmolt, T. H. A. (2011). Generalizations on consumer
innovation adoption: A meta-analysis on drivers of intention and behavior.
International Journal of Research in Marketing, 28, 134-144.
Bandura, A. (1977). Social learning theory. Englewood Cliffs, N.J.: Prentice-Hall
Benzi, F., Anglani, N., Bassi, E., & Frosini, L. (2011). Electricity smart meters interfacing the
households. IEEE Transactions on Industrial Electronics, 58, 4487-4494.
Biegel, B., Hansen, L. H., Stoustrup, J., Andersen, P., & Harbo, S. (2014). Value of flexible
consumption in the electricity markets. Energy, 66, 354-362.
Bryman, A. (2008). Social research methods Social Research Methods (3 ed., pp. 31-34).
Oxford: Oxford University Press.
Christensen, H. T., Ascarza, A., & Throndsen, W. (2013). Country-specific factors for the
development of household Smart Grid solutions - comparison of the electricity
systems, energy policies and smart grid R&D and demonstration projects in Spain,
Norway and Denmark. Copenhagen, Denmark.
Claudy, M. C., Peterson, M., & O’Driscoll, A. (2012). “I like it, but I won’t buy it”:
Exploring the attitude-behaviour gap for renewable energy adoption. Paper presented
at the 37th Macromarketing Conference, Berlin, Germany.
Da Silva, P. G., Karnouskos, S., Griesemer, M., & Ilic, D. (2012, 18-20 June 2012). An
energy market for trading electricity in Smart Grid neighbourhoods. Paper presented
at the 6th IEEE International Conference on Digital Ecosystems Technologies
(DEST), Campione d'Italia, Italy.
Darby, S. (2010). Smart metering: What potential for householder engagement? Building
research & information, 38, 442-457.

77
de Groot, J. I. M., & Steg, L. (2010). Relationships between value orientations, self-
determined motivational types and pro-environmental behavioural intentions. Journal
of Environmental Psychology, 30, 368-378.
Dong Energy. ( 2012). Demand response - the eFlex project. Virum, Denmark.
Edenhofer O. et al. (2014). Climate change 2014: Mitigation of climate change. Working
group III contribution to the fifth assessment report of the Intergovernmental Panel on
Climate Change. UK and New York.
European Commission's Joint Research Centre. (2012). Energy efficiency status report -
electricity consumption and efficiency trends in the EU-27 In P. Bertoldi, B. Hirl &
N. Labanca (Eds.), JCR scientific and policy reports: European Commission.
Faiers, A., & Neame, C. (2006). Consumer attitudes towards domestic solar power systems.
Energy Policy, 34, 1797-1806.
Gangale, F., Mengolini, A., & Onyeji, I. (2013). Consumer engagement: An insight from
Smart Grid projects in Europe. Energy Policy, 60, 621-628.
Gibbs, G. R. (2007). Analyzing qualitative data. Los Angeles: Sage Publications.
Goldsmith, R. E. (2002). Explaining and predicting consumer intention to purchase over the
Internet: An exploratory study. Journal of Marketing Theory and Practice, 10, 22-28.
Goulden, M., Bedwell, B., Rennick-Egglestone, S., Rodden, T., & Spence, A. (2014). Smart
Grids, smart users? The role of the user in demand side management. Energy
Research & Social Science, 2, 21–29.
Grønhøj, A., & Bech-Larsen, T. (2010). Using vignettes to study family consumption
processes. Psychology and Marketing, 27, 445-464.
Gärling, A., & Thøgersen, J. (2001). Marketing of electric vehicles. Business Strategy & the
Environment, 10, 53-65.
Hamilton, B. A. (2010). Understanding the benefits of the Smart Grid - Smart Grid
implementation strategy. In B. A. Hamilton, J. Miller & B. Renz (Eds.). United
States: United States Department of Energy’s National Energy Technology
Laboratory.
Hargreaves, T., Nye, M., & Burgess, J. (2010). Making energy visible: A qualitative field
study of how householders interact with feedback from smart energy monitors.
Energy Policy, 38, 6111-6119.
He, X., Keyaerts, N., Azevedo, I., Meeus, L., Hancher, L., & Glachant, J.-M. (2013). How to
engage consumers in demand response: A contract perspective. Utilities Policy, 27,
108-122.
Hsieh, H.-F., & Shannon, S. E. (2005). Three approaches to qualitative content analysis.
Qualitative Health Research, 15, 1277-1288.
Jager, W. (2006). Stimulating the diffusion of photovoltaic systems: A behavioural
perspective. Energy Policy, 34, 1935-1943.
Karytsas, S., & Theodoropoulou, H. (2014). Public awareness and willingness to adopt
ground source heat pumps for domestic heating and cooling. Renewable and
Sustainable Energy Reviews, 34, 49-57.

78
Kjeldsen, A. M. (2010). A qualitative study of sector and occupational differences in public
service motivation: the importance of a multi-dimensional perspective. Paper
presented at the 14th Annual Conference of IRSPM.
Krishnamurti, T., Schwartz, D., Davis, A., Fischhoff, B., de Bruin, W. B., Lave, L., & Wang,
J. (2012). Preparing for Smart Grid technologies: A behavioral decision research
approach to understanding consumer expectations about smart meters. Energy Policy,
41, 790-797.
Liberman, N., & Trope, Y. (1998). The role of feasibility and desirability considerations in
near and distant future decisions: A test of temporal construal theory. Journal of
personality and social psychology, 75, 5-18.
Mah, D. N., Van der Vleuten, J. M., Hills, P., & Tao, J. (2012). Consumer perceptions of
Smart Grid development: Results of a Hong Kong survey and policy implications.
Energy Policy, 49, 204-216.
Midgley, D. (1977). Innovation and new product marketing. London, UK: Croom Helm.
Miles, M. B., Huberman, A. M., & Saldaña, J. (2013). Qualitative data analysis; a methods
sourcebook (3 ed.). Portland, United States: Sage Publications.
Paetz, A.-G., Dütschke, E., & Fichtner, W. (2012). Smart homes as a means to sustainable
energy consumption: A study of consumer perceptions. Journal of Consumer Policy,
35, 23-41.
Petersen, K. N., & Gram-Hanssen, K. (2005). Household energy and waterconsumption:
dependence on socio-economic background variables (Husholdningers energi- og
vandforbrug: afhængighed af socio-økonomiske baggrundsvariable) (1 ed.).
Hørsholm, Denmark: Statens Byggeforskningsinstitut (Danish Building Research
Institute).
Press, M., & Arnould, E. J. (2009). Constraints on sustainable energy consumption: market
system and public policy challenges and opportunities. Journal of Public Policy and
Marketing, 28, 102-113.
QSR International Pty Ltd (Producer). (2012). NVivo qualitative data analysis software,
version 10
Rogers, E. M. (2003). Diffusion of innovations (5 ed.). New York, USA: Free Press.
Rogers, E. M. (2004). A prospective and retrospective look at the diffusion model. Journal of
Health Communication, 9 13-19.
Schwartz, S. H. (2006). Basic human values : theory, measurement, and applications. Revue
Francaise De Sociologie, 47, 929-968.
Siano, P. (2014). Demand response and Smart Grids—A survey. Renewable and Sustainable
Energy Reviews, 30, 461-478.
Sovacool, B. K. (2014). What are we doing here? Analyzing fifteen years of energy
scholarship and proposing a social science research agenda. Energy Research &
Social Science, 1, 1-29.
Tornatzky, L. G., & Klein, K. J. (1982). Innovation characteristics and innovation adoption
implementation: A meta-analysis of findings. IEEE Transactions on Engineering
Management, 29, 29-43.
Trope, Y., & Liberman, N. (2003). Temporal construal. Psychological review, 110, 403-421.

79
Trope, Y., & Liberman, N. (2011). Construal Level Theory. In P. A. M. Van Lange, A. W.
Kruglanski & E. T. Higgins (Eds.), Handbook of Theories of Social Psychology (pp.
119-133). London, UK: SAGE Publications Ltd.
Wissner, M. (2011). The Smart Grid – A saucerful of secrets? Applied Energy, 88, 2509-
2518.
Waarts, E., van Everdingen, Y. M., & van Hillegersberg, J. (2002). The dynamics of factors
affecting the adoption of innovations. Journal of Product Innovation Management,
19, 412-423.

80
Appendix 1. Questionnaire measurements
Domain-specific innovativeness (Goldsmith, 2002)
1. Compared to the people I know, I have invested more in alternative energy
2. In general I am the last one in my social circle to invest in alternative energy
3. In general I am among the first one in my social circle to acquaint myself with alternative
energy technology
4. When I hear about new alternative energy technology, I’m interested in finding out
whether it’s my sort of thing
5. I know about new types of alternative energy before others do
Strongly agree - 7. Strongly disagree
Problem awareness (de Groot & Steg, 2010)
1. The use of electricity based on coal, oil and natural gas creates problems for society
2. By having a smart meter with remote control in my home, I can help balance the supply
and demand of electricity.
3. If more electricity is used in off-peak periods rather than in peak periods, it will benefit
the environment.
Strongly agree - 7. Strongly disagree
Basic human values (Schwartz, 2006), males received a version with “him”, females
received a version with “her”
1. He believes that it is important that everybody is treated equally. He wants justice for all,
even for people he does not know. (Universalism_humans)
2. It is important for him to listen to people who are different. Even when he disagrees with
them, he wants to understand them (Universalism_humans)
3. He believes that it is very important to prevent the polluting of nature
(Universalism_environment)
4. He has it at heart that you should protect nature. It is important to him to take care of the
environment (Universalism_environment)
5. It is very important to him to demonstrate what he is capable of. He likes that people
admire what he does (Achievement)
6. It is very important to him to be successful. He likes to impress (Achievement)
Not similar to me at all (1) to Exactly like me (6).

81
Appendix 2. Vignettes
Vignette 1
In this interview I would like to describe some situations that may arise in a family in
connection with the development of an intelligent energy system that Denmark is working on.
The family I want to depict is a fictitious family consisting of dad (Søren), mum (Helle) and
their two children, Christian and Freja aged 16 and 10 respectively.
The family’s heat pump has been fitted with an automatic control device – a so-called
smart meter with remote control. Energy consumption of the heat pump is regulated by
means of signals that the smart meter receives from the Internet. The utility company sends
out a signal when it is time to lower the energy consumptions. In future the price of electricity
will fluctuate round the clock according to the force of the wind and the general situation of
the power system.
The smart meter with remote control ensures that the heat pump is working mainly in
off-peak periods and when prices are low, e.g. when it is windy or at night. It switches off the
heat pump when it is important to reduce energy consumption when the price of electricity is
high. The household defines the minimum temperature they want in their house, meaning that
the remote control device only switches off the heat pump if the temperature keeps above the
fixed minimum temperature. If the temperature drops below the minimum temperature, the
heat pump is activated no matter what.
Example: Søren and Helle have set the minimum temperature at 19oC. So if the
temperature is 21oC and the electricity price is high, a signal is triggering that it is important
to reduce energy consumption, then the heat pump will switch off automatically. It will
resume working when the price drops or the temperature falls below 19oC.

82
Having a smart meter with remote control installed on to their heat pump allows the
family to keep abreast of the energy consumption of the heat pump in kWh and DKK on a
homepage or a smartphone. Both the costs and the saving derived from the optimized heat
pump are shown.
Vignette 2
Søren and Helle have allowed their utility company to monitor their high-electricity
appliances, e.g. the heat pump [the participants were shown an example of a homepage
illustrating how the family could allow the utility company to remotely control the electricity
consumption of the heat pump by checking a box stating: Optimize my electricity
consumption. I wish to have my heat pump be optimized so that its electricity consumption
will be reduced for short periods when the electricity price is high.]
This implies that the utility company can switch off the heat pump when it is important
to reduce electricity consumption. The household can cancel the utility company’s remote
control if they need to heat the house at a certain point (e.g. when having guests).
Vignette 3
In the morning, when the family is having breakfast there may be only 19oC, i.e. to or
three degrees colder that during the day. Freja is not quite awake yet – she’s still in her
nightie and she’s feeling cold.
Freja asks “Can’t we turn up the heat?”
Freja’s dad (Søren) “Sure we can”
Freja’s mum Helle does not agree “No, I don’t think we should. Electricity is expense
right now. Go and get dressed instead.”

83
Vignette 4
Helle has come home from work. She starts filling the washer while Søren does the
cooking. She fills the washing machine and pushes the start button, but nothing happens. The
display tells her that the machine will start at 22:00 when the capacity on the power system
allows it.
Helle wants to hang their clothes to dry before going to bed so she pushes the ignore-
button and the washing machine starts.
Later she thinks that she perhaps could have postponed washing her laundry.

84

85
5 RESPONSIBLE TECHNOLOGY ACCEPTANCE: MODEL DEVELOPMENT
AND APPLICATION TO CONSUMER ACCEPTANCE OF SMART GRID
TECHNOLOGY
Madeleine Broman Toft, Geertje Schuitema and John Thøgersen
Department of Business Administration, Aarhus University
Applied Energy
Abstract: As a response to climate change and the desire to gain independence from
imported fossil fuels, there is a pressure to increase the proportion of electricity from
renewable sources which is one of the reasons why electricity grids are currently being turned
into Smart Grids. In this paper, we focus on private consumers’ acceptance of having Smart
Grid technology installed in their home. We analyse acceptance in a combined framework of
the Technology Acceptance Model and the Norm Activation Model. We propose that
individuals are only likely to accept Smart Grid technology if they assess usefulness in terms
of a positive impact for society and the environment. Therefore, we expect that Smart Grid
technology acceptance can be better explained when the well-known technology acceptance
parameters included in the Technology Acceptance Model are supplemented by moral norms
as suggested by the Norm Activation Model. We tested this proposition by means of an
online survey of Danish (N=323), Norwegian (N=303) and Swiss (N=324) private
consumers. The study confirms that adding personal norms to the independent variables of
the Technology Acceptance Model leads to a significant increase in the explained variance in
consumer acceptance of Smart Grid technology in all three countries.
Keywords: Technology acceptance; Smart Grid; Personal norms

86
CHAPTER 5 – TABLE OF CONTENTS
1 Introduction ........................................................................................................................... 87
2 Acceptance of new technology – Theoretical framework ...................................... 91
2.1 The Technology Acceptance Model ...................................................................................... 91
2.2 The Norm Activation Model .................................................................................................... 92
2.3 The Responsible Technology Acceptance Model .............................................................. 93
2.4 Hypotheses .................................................................................................................................... 95
3 Method ..................................................................................................................................... 97
3.1 Participants and procedure ........................................................................................................ 97
3.2 Questionnaire ................................................................................................................................ 98
3.3 Measures ........................................................................................................................................ 99
4 Results ................................................................................................................................... 100
4.1 Descriptive statistics ................................................................................................................ 100
4.2 Measurement invariance across countries ......................................................................... 101
4.3 Hypotheses tests........................................................................................................................ 104
5 Discussion and conclusion ............................................................................................. 106
Acknowledgements .................................................................................................................... 109
References ..................................................................................................................................... 110
Appendix 1 .................................................................................................................................... 115

87
1 Introduction
The European Union’s commitment to substantially reduce CO2 emissions before 2020
entails, among other things, that more electricity must be generated from renewable power
sources such as wind, water and solar energy. However, when introducing a high percentage
of renewable electricity into the grid, there are a number of challenges to be dealt with
(Biegel, Hansen, Stoustrup, Andersen, & Harbo, 2014; Lund, 2007). One of the main
challenges is that the ability to supply power balancing services in the traditional sense
disappears because renewable sources for producing electricity are highly fluctuating (Biegel
et al., 2014). Hence, electricity demand needs to be shifted towards periods when power from
renewable sources is available (Broeer, Fuller, Tuffner, Chassin, & Djilali, 2014) (e.g. when
the sun is shining and the wind is blowing). By regulating (i.e., switching on/off and thereby
postponing) consumers’ electricity consumption, the demand pressure on the grid can be
relieved (Moura & de Almeida, 2010) obtaining a better balance between demand and supply
(IEA, 2011). Hence, as a means to a more secure and efficient electricity system, the
electricity grid is transformed into a “Smart Grid”. In Europe, a Smart Grid is commonly
defined as an “electricity network that can intelligently integrate the behaviour and actions of
all users connected to it – generators, consumers and those that do both – in order to
efficiently deliver sustainable, economic and secure electricity supplies” ((SmartGrids -
European Technology Platform, 2013), cf. also (Clastres, 2011; Wissner, 2011)).
Billions of Euros are currently being invested in the development of the Smart Grid,
forecasted by Pike Research to reach EUR 56.5 billion in Europe during the period 2010-
2020 (cf. European Commission´s Joint Research Centre, 2011). The primary focus of the
development of the Smart Grid is on the technology side whereas relatively little attention is
devoted to involving private electricity consumers (Gangale, Mengolini, & Onyeji, 2013),

88
despite the fact that the residential sector covers 29.71% of the total electricity consumption
in Europe and is rising (European Commission's Joint Research Centre, 2012). Potentially,
the residential sector could be an important asset when it comes to balancing the electricity
demand and supply on the grid, but this depends on households’ acceptance of new
technology, Smart Grid technology. In this paper, we use the term Smart Grid technology to
cover a digitalised electrical meter with remote control (also known as a Smart Meter) that
allows two-way information flows between the electricity supplier and the customer and
thereby interacting with in-house appliances. Smart Grid technology enables an electricity
supplier or distribution system operator to remotely control (switch on/off) household
appliances’ electricity consumption (see Wissner, 2011), for example, in order to shave off
peak loads.
However, consumers’ reservations towards Smart Grid technology can hamper the
implementation of this technology and, consequently, the development of the Smart Grid. As
pointed out by The Smart Grids task force (The Smart Grids task force, 2010 p. 5), “A lack of
consumer confidence or choice in the new systems will result in a failure to capture all of the
potential benefits of Smart Meters and Smart Grids”. Hence, in order to properly develop and
effectively spread this important new technology and to achieve the politically set goals
regarding the Smart Grid, research is needed to achieve a better understanding of what makes
consumers accept or reject Smart Grid technology.
Previous (limited) research on consumer perceptions of Smart Grid technology suggests
that many consumers perceive a variety of risks in connection with adoption of this
technology, such as reduced control over electricity usage (Accenture, 2010; Dong Energy,
2012) and violation of privacy (Krishnamurti et al., 2012). However, a recent review of 38
European Smart Grid projects concluded that consumer engagement in the Smart Grid

89
depends mainly on two factors (2013): short-term financial motives, such as reduction of and
control over the electricity bill, and environmental motives (i.e., protecting the environment).
Self-interest and concern for society and/or the environment represent different
rationales for decision-making which are the point of departure of different social-
psychological theories. Especially relevant for studying the acceptance of new technology,
the Technology Acceptance Model (TAM) (Davis, 1989) assumes that decisions are based on
rational self-interested motivation. However, in order to capture the importance of
environmental motives for the acceptance of Smart Grid technology, we propose that the
TAM be combined with the Norm Activation Model (NAM) (Shalom H. Schwartz, 1977),
which was developed for decisions where moral reasoning is the starting point.
Specifically, according to the TAM, acceptance of a new technology depends on
believing that the technology is easy to use and useful for achieving a personal goal (cf.
Davis, 1989). With regard to the use of Smart Grid technology, a personal goal might be a
lower electricity bill. However, only small monetary savings are expected for private
households from Smart Grid technology. For example, a case study in Denmark1 reports
potential annual savings for an average household of approximately €35 to €80 (Dong
Energy, 2012) or between 2.5% and 5.7% of the electricity bill.2 Some studies report larger
direct savings (EurActiv, 2012) while others predict negative net benefits for some
households depending on their electricity consumption (Frontier Economics, 2011). Since the
expected economic benefits most likely are too small to motivate households to accept the
1 In this case study, households were equipped with Smart Grid technology consisting of a home automation
system with an integrated control unit to interrupt the electricity use of a heat pump during peak periods. The
home automation system also offered customers the opportunity to closely monitor the electricity consumption
of various appliances and in addition to control them by means of an ordinary time scheme control. 2 Average electricity consumption of a four-person household in Denmark (without electric heating or water
heating) is 5,181 kWh/year (www.DongEnergy.dk) The average electricity price is about 26 €cent/kWh. It
should be noted that there might be additional private benefits in the long term as a result of increased grid
stability, flexibility or the inclusion of more renewables in the electricity mix. However, these benefits are
uncertain and difficult to quantify.

90
installation of Smart Grid technology in itself (Dong Energy, 2012), other benefits, such as
societal and environmental benefits, should be considered as motivational factors.
If the most important benefits offered by Smart Grid technology are societal (including
resource conservation and protecting the environment) rather than private (Hamilton, 2010),
acceptance of Smart Grid technology may be viewed as a pro-social act (Krupka & Weber,
2009; McCalley & Midden, 2002). Schwartz’ (1977) NAM proposes that people act in a pro-
social way based on a personal norm or feeling of moral obligation. In the area of technology
acceptance, for example, personal norms were found to be a strong predictor of the adoption
of alternative fuel vehicles (Jansson, Marell, & Nordlund, 2011), acceptance of hydrogen fuel
stations (Huijts, Molin, & van Wee, 2014), and of taking action for or against nuclear power
(de Groot & Steg, 2010). Hence, in accordance with the NAM we propose that consumers
accept Smart Grid technology at least partly because they feel a moral obligation to do so.
In sum, we expect that our ability to predict consumer acceptance of Smart Grid
technology, which is installed in their private homes, but primarily benefits society and the
environment, can be increased by combining a decision theory which is based on rational
self-interested motivation (the TAM) and on moral reasoning (the NAM). As antecedents of
acceptance, our integrated model considers both the individual’s functional usability
assessment and the individual’s feeling of moral obligation or duty as a responsible citizen.
We refer to this integrated model as the Responsible Technology Acceptance Model
(RTAM). In the following, we elaborate and employ this integrated model as the theoretical
framework for our study.

91
2 Acceptance of new technology – Theoretical framework
2.1 The Technology Acceptance Model
Popular theoretical frameworks for individual-level innovation adoption studies include
the Theory of Reasoned Action (TRA; Ajzen & Fishbein, 1980), the Theory of Planned
Behaviour (TPB; Ajzen, 1985) and the TAM (Davis, 1989; Davis, Bagozzi, & Warshaw,
1989). The TAM is a popular adaptation of the TRA for this particular field, and over the last
35 years, it has been employed in over 580 articles on acceptance of technology (Chang,
Chou, & Yang, 2010).
Davis (1989) suggests that an individual’s acceptance of a new technology depends on
(1) the degree to which the use of that particular technology is believed to enhance the
achievement of valued goals (perceived usefulness), and (2) the degree to which use of that
particular technology is believed to be easy and effortless (perceived ease-of-use). These
beliefs are assumed to determine a person’s attitude toward using the technology. If using a
new technology is evaluated favourably (i.e., the person’s attitude towards doing so is
positive), the person is expected to form an intention to use it (when made available to him or
her). When an intention to use a new technology is expressed in response to a request to use
it, this intention is often referred to as acceptance of the technology (Huijts, Molin, & Steg,
2012).
In this study, we investigate what makes people accept Smart Grid technology, i.e.,
agree to have these technologies installed in their home. We assume that those in favour of a
new technology and who accept to use it, when asked directly, are also going to use it, unless
something beyond their control prevents them from doing so. The intention to use or the
acceptance of a new technology will then have led to actual use (i.e., adoption of the

92
technology) (Ajzen, 1985; Waarts, van Everdingen, & van Hillegersberg, 2002). In our case,
adoption of Smart Grid technology has happened when the technology has been installed and
is in use.
2.2 The Norm Activation Model
There is reason to believe that acceptance of Smart Grid technology is at least partly
motivated by the positive outcome which the use of the technology is perceived to have for
the environment and its impact on society: i.e., acceptance of Smart Grid technology is a pro-
environmental, pro-social behaviour. The NAM (Shalom H. Schwartz, 1977; Schwartz &
Howard, 1981) has previously been employed to predict pro-environmental and pro-social
intentions and behaviours (e.g., Abrahamse, Steg, Gifford, & Vlek, 2009; Bamberg & Möser,
2007; Biel & Thøgersen, 2007; Huijts, De Groot, Molin, & van Wee, 2013; Thøgersen,
1996). Pro-environmental behaviours may be costly in terms of money, or they may involve
discomfort (e.g., being cold when saving on heat) or be time consuming (e.g., recycling glass,
paper, metal or plastic), which can be a barrier to perform these types of behaviours.
The NAM proposes that performing a behaviour that benefits others or the environment
is motivated by a moral self-expectation or personal norm – the key construct in Schwartz’s
NAM (Schwartz & Howard, 1981). A personal norm is defined as a feeling of moral
obligation to act in a particular way in a particular situation. Compared to other attitudinal
concepts that refer to evaluations based on material, social, and/or psychological payoffs,
“personal norms focus exclusively on the evaluation of acts in terms of their moral worth to
the self” (S. H. Schwartz & Howard, 1984 p. 245). The strength of a personal norm depends
on whether or not the person believes that an existing condition poses a threat of avoidable
harm to someone, i.e. awareness of consequences, and that their personal action or inaction
may prevent that harm (e.g., problem), i.e. ascription of responsibility (Gardner & Stern,

93
1996). Other determinants of norm strength are outcome efficacy (the belief that a particular
action will be effective in relieving the problem) and self-efficacy (own ability to carry out
actions to provide relief) (Steg & de Groot, 2010).
2.3 The Responsible Technology Acceptance Model
The technology in focus in this study is embodied in a physical product: a Smart Meter
with a remote control which was developed to regulate consumers’ electricity consumption.
The functionality of the equipment makes it likely that consumers perceive it as an
information system as it provides feedback about the household’s electricity consumption and
the price of electricity on a computer, a display or a smartphone. Hence, there is reason to
expect that perceived usefulness and perceived ease of use are important for consumers’
attitudes towards having Smart Grid technology installed in their home. Consequently, we
assume that the TAM will be part of an appropriate theoretical framework for this study. The
TAM has generally been found to have high explanatory power (Schepers & Wetzels, 2007)
and robustness (Sun & Zhang, 2006) in technology acceptance studies and has been
successfully applied in many areas, including the acceptance of Smart Appliances (i.e.,
appliances that can be programmed and that communicate with energy management systems
about appropriate hours to operate (Geelen, Reinders, & Keyson, 2013; Hauttekeete, Stragier,
Haerick, & De Marez, 2010; Stragier, Hauttekeete, & De Marez, 2010)). However, we have
not come across other studies employing the TAM for the study of acceptance of Smart Grid
technology.
The TAM shares with the TRA the underlying assumption that an individual’s decision
to accept or reject a new technology is based on “rational” deliberation and self-interested
motives. However, the near-term private benefits of adopting Smart Grid technology are
small (Dong Energy, 2012). Most benefits derive from an increasing share of electricity

94
generated from renewable sources and a more stable and flexible grid and, hence, occur in the
future and will be shared with everyone, irrespective of whether or not they have adopted the
technology. This suggests that if a private electricity consumer accepts and adopts Smart Grid
technology, this is hardly based on self-interested reasons alone, but most likely also on a
perceived duty or obligation towards society and the environment (cf. Accenture, 2010;
EcoPinion, 2011; Gangale et al., 2013).
In some previous studies, the TRA and its successor, the TPB (Fishbein & Ajzen,
1975), have been extended with theoretical constructs that capture pro-environmental and
pro-social motivations, including personal norms from the NAM. Schwartz and Tessler
(Shalom H. Schwartz & Tessler, 1972) published the first successful integration of the NAM
and the TRA in 1972 in a study of volunteering to become a bone marrow donor. Other more
recent examples include studies of travel mode choice (Bamberg, Hunecke, & Blöbaum,
2007; Bamberg & Schmidt, 2003; Klöckner & Blöbaum, 2010) and recycling and re-use
behaviour (Ellen Matthies, Selge, & Klöckner, 2012). Similar to these studies, we combine a
theoretical framework assuming that behaviour is based on “rational” choice (TAM) with a
framework assuming that certain behaviours are based on moral reasoning (NAM). To the
best of our knowledge, this is the first time the TAM has been combined or extended with
constructs that capture moral motivation.
Generally, the NAM and specifically personal norms have been found to be a good
predictor of pro-environmental and pro-social behaviour (Harland, Staats, & Wilke, 2007;
Huijts et al., 2013). A range of different pro-social (Steg & de Groot, 2010) and pro-
environmental behaviours have successfully been predicted by personal norms, including
energy conservation (Black, Stern, & Elworth, 1985), travel mode choice and water

95
conservation (Harland et al., 2007). However, to the best of our knowledge, the NAM has not
previously been employed in a study of the acceptance of Smart Grid technology.
In the realm of technology acceptance, adding the NAM, and particularly personal
norms (see Huijts et al., 2013), to a framework that focuses on self-interested outcomes only,
makes it possible to capture a possible moral aspect thereby increasing the prediction of
technology acceptance. We therefore propose such an integrated theoretical framework for
explaining the acceptance of Smart Grid technology. This new Responsible Technology
Acceptance Model (RTAM) is illustrated in Figure 1. Below, the specific paths of this model
are explained in detail.
Figure 1. A Responsible Technology Acceptance Model
2.4 Hypotheses
In the TAM it is suggested that beliefs regarding ease of use and usefulness shape
attitudes towards accepting a technology. Smart Grid technology is developed to regulate
electricity demand in order to match the variable supply from renewable energy sources (i.e.,
increase or decrease electricity consumption at a specific point of time). We expect that
consumers will find this technology useful if they believe that it will, for example, make their
electricity use more efficient and/or make them save on their electricity bill. Furthermore, we
96
also expect that a positive attitude towards the technology depends on whether or not its use
is perceived as easy and effortless. We therefore hypothesize that:
H1) A positive attitude towards Smart Grid technology depends on it being perceived as
useful and easy to use by potential adopters.
Awareness of harmful consequences of certain activities, such as the use of energy, as
well as of effective actions that can be taken to avoid such consequences, is likely to activate
personal norms about taking such action. Hence, if people believe that Smart Grid technology
is useful for preventing harm to society and/or the environment, they are likely to feel
morally obligated to accept this technology (i.e., to form a personal norm about doing so).
Moreover, if consumers believe that Smart Grid technology is easy to use and it enables them
to take effective action to prevent that harm, this also increases the likelihood of developing a
personal norm to accept Smart Grid technology. We therefore hypothesize that:
H2) If Smart Grid technology is perceived to be useful and easy to use, it is more likely that
a feeling of moral obligation to accept this technology (i.e., a personal norm) will be
activated.
Most models show limitations when applied outside the domain they were developed
for. Hence, in order to obtain a theoretical framework that effectively captures consumers’
motivation to perform a specific behaviour in the intersection of domains, which have
traditionally been studied with different models, an integration of predictors from different
models have been suggested (Klöckner & Blöbaum, 2010; E. Matthies, 2003). Specifically,
we expect that a positive attitude toward Smart Grid technology (from TAM) will increase its
acceptance. In addition, since Smart Grid technology entails large potential benefits for
society and the environment, we expect that a strong personal norm (from NAM) will also

97
increase the acceptance of Smart Grid technology, over and above that predicted by attitude.
We therefore hypothesize that:
H3) Acceptance of Smart Grid technology increases with a positive attitude towards Smart
Grid technology and with the strength of personal norms about accepting it.
3 Method
3.1 Participants and procedure
An online questionnaire was distributed in September and October 2011 among a
representative sample of Yougov’s panel members3 in Denmark (DK), Norway (NO) and the
German-speaking part of Switzerland (CH). The sample consisted of electricity consumers
between the age of 18 and 74 who paid their electricity bill directly to their electricity
company (so that they can be assumed to make the decision about installing Smart Grid
technology in their home). Respondents younger than 25 living with their parents were
assumed not to be responsible for decisions about installing Smart Grid technology, and they
were therefore discarded. It took about 35 minutes on average to complete the survey.
Therefore, respondents who completed the survey in less than 7 minutes were excluded from
the analysis as they were assumed to have answered randomly (see Table 1). The survey was
part of a large data collection which included various experimental manipulations that are
outside the scope of this paper (Broman Toft, Schuitema, & Thøgersen, 2014). For the
present study, we use a random subset of the total sample which served as a “neutral” control
group in the experimental study (about 30% of the total sample): 323 from Denmark (DK),
303 from Norway (NO) and 324 from Switzerland (CH).
3 Yougov’s panel consists of a total of 130,000 panel members in the Nordic countries incl. Estonia
(about 40,000 in DK, 40,000 in NO). Worldwide there are about 2.5 mill panel members. We chose the
German-speaking part of Switzerland because German is the most common language in Switzerland with 63.7%
of the Swiss population (www.denstoredanske.dk, 2013)

98
Table 1. Samples used for this study
Country DK NO CH
Surveys completed 1165 1251 1242
Not included in analysis
living with parents 50 59 88
did not pay electricity bill directly to electricity company 99 188 115
took <7 min to complete survey 60 103 94
experimental conditions beyond the scope of this paper 633 598 621
Sample included in analyses 323 303 324
The samples consisted of 49.5 % females and 50.5% males and the mean age was 47.
None of these background characteristics differ across the three countries.
3.2 Questionnaire
The questionnaire contained measures of technology acceptance, perceived ease of use,
perceived usefulness, personal norms and attitude towards Smart Grid technology in addition
to constructs not pertinent to the present study. After the screening questions (i.e., whether
they were living with parents and paying the electricity bill directly to the electricity
supplier), respondents were given a short text informing them about how the Smart Grid
technology works, what it implies, and which benefits it involves.4 After this description, the
participants were asked whether they would accept having Smart Grid technology installed in
their home (for more detail, see Appendix 1). The attitude items were presented next,
followed by perceived ease of use, perceived usefulness, and personal norms.
4 This description was varied randomly in a between subjects design in terms of types of benefits
mentioned (individual, public, or individual and public) and types of control (mentioning or not mentioning a
control button to override the technology’s remote control). None of these variations had a significant influence
on the acceptance of Smart Grid technology. Hence, they will not be discussed further. Due to space concerns,
the tests of mean differences are not reported, but they can be acquired from the authors.

99
3.3 Measures
Acceptance (ACCEPT) of Smart Grid technology was measured by asking participants
to imagine that their electricity company would like to install Smart Grid technology (e.g., a
Smart Meter with remote control) in their home (without any additional costs to the
homeowner); and if he or she would be willing to accept this. The answer possibilities were:
(1) Yes, I would like to have a Smart Meter with remote control installed in my home. (2)
No, I do not want to have a Smart Meter with remote control installed in my home.
Respondents could not proceed to the rest of the survey before answering this question.
The instruments used to measure perceived ease of use, perceived usefulness, attitude
and personal norms have all been validated in prior studies (Read, Robertson, & McQuilken,
2011; Steg, Dreijerink, & Abrahamse, 2005). All these constructs were measured with three
items each on seven-point scales. All items, except attitude items, were measured on Likert
scales ranging from strongly disagree (1) to strongly agree (7).
Perceived ease of use (PEU) was measured with the items: (1) It will be easy to use
Smart Meters with remote control; (2) I expect that having a Smart Meter with remote control
will not require any effort from me; (3) It will be easy to learn how to operate a Smart Meter
with remote control in my home. Cronbach's alpha: DK = 0.74, NO = 0.74, CH = 0.81.
Perceived usefulness (PU) was measured with the items: (1) A Smart Meter with
remote control will enhance the efficiency of my electricity use; (2) The Smart Meter with
remote control will enable me to adjust my electricity consumption so that I can benefit from
fluctuations in electricity prices; (3) The Smart Meter with remote control will contribute to a
reliable electricity supply. Cronbach's alpha: DK = 0.81, NO = 0.89, CH = 0.89.

100
Personal norms (PN) were measured with the items: (1) It is my duty to get a Smart
Meter with remote control installed if it is necessary for an environment friendly and well-
functioning electricity supply; (2) I feel a moral obligation to have a Smart Meter with remote
control installed regardless of what others do; (3) To have a Smart Meter with remote control
installed is the right thing to do. Cronbach's alpha: DK = 0.86, NO = 0.84, CH = 0.86.
Attitudes towards having Smart Grid technology installed (ATT) were measured with
three bipolar items on 7-point scales: Having a Smart Meter with remote control installed in
my home would be … (1) very negative - very positive; (2) very bad - very good; (3) very
unsafe - very safe. Cronbach's alpha: DK = 0.90, NO = 0.93, CH = 0.88.
4 Results
The hypotheses were tested by means of structural equation modelling (SEM) using the
Mplus version 5.21. The main advantage of SEM is that it is possible to explicitly account for
measurement error when a latent variable of interest is represented by multiple observed
measures. Measures of how well the implied variance-covariance matrix, based on the
parameter estimates, reflects the observed sample variance-covariance matrix can be used to
determine whether the hypothesized model gives an acceptable representation of the analysed
data.
4.1 Descriptive statistics
Table 2 presents the acceptance rates, the mean values and standard deviations for the
various constructs in the RTAM in Denmark, Norway and Switzerland. It appears that the
three samples are quite similar in these respects. The mean score for attitude is lower in
Norway than in Switzerland (p <.05), and the mean score for personal norms is lower in
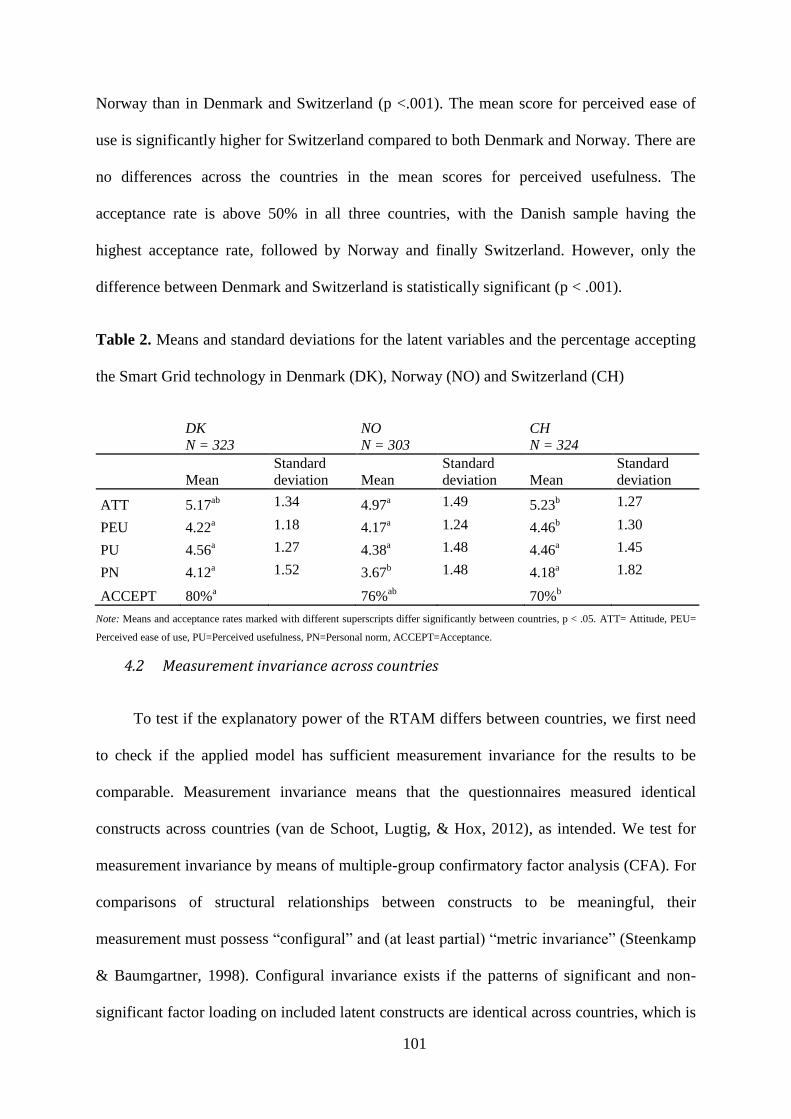
101
Norway than in Denmark and Switzerland (p <.001). The mean score for perceived ease of
use is significantly higher for Switzerland compared to both Denmark and Norway. There are
no differences across the countries in the mean scores for perceived usefulness. The
acceptance rate is above 50% in all three countries, with the Danish sample having the
highest acceptance rate, followed by Norway and finally Switzerland. However, only the
difference between Denmark and Switzerland is statistically significant (p < .001).
Table 2. Means and standard deviations for the latent variables and the percentage accepting
the Smart Grid technology in Denmark (DK), Norway (NO) and Switzerland (CH)
DK
N = 323
NO
N = 303
CH
N = 324
Mean
Standard
deviation Mean
Standard
deviation Mean
Standard
deviation
ATT 5.17ab 1.34 4.97
a 1.49 5.23b 1.27
PEU 4.22a 1.18 4.17
a 1.24 4.46b 1.30
PU 4.56a 1.27 4.38
a 1.48 4.46a 1.45
PN 4.12a 1.52 3.67
b 1.48 4.18a 1.82
ACCEPT 80%a 76%
ab 70%
b
Note: Means and acceptance rates marked with different superscripts differ significantly between countries, p < .05. ATT= Attitude, PEU=
Perceived ease of use, PU=Perceived usefulness, PN=Personal norm, ACCEPT=Acceptance.
4.2 Measurement invariance across countries
To test if the explanatory power of the RTAM differs between countries, we first need
to check if the applied model has sufficient measurement invariance for the results to be
comparable. Measurement invariance means that the questionnaires measured identical
constructs across countries (van de Schoot, Lugtig, & Hox, 2012), as intended. We test for
measurement invariance by means of multiple-group confirmatory factor analysis (CFA). For
comparisons of structural relationships between constructs to be meaningful, their
measurement must possess “configural” and (at least partial) “metric invariance” (Steenkamp
& Baumgartner, 1998). Configural invariance exists if the patterns of significant and non-
significant factor loading on included latent constructs are identical across countries, which is
102
documented by the same measurement model having an acceptable fit to the data in all three
countries. Metric invariance exists if factor loadings can be constrained to be equal across
countries, and partial metric invariance if at least two factor loadings per construct can be
constrained to be equal (Steenkamp & Baumgartner, 1998).
We did a CFA of the items supposed to measure the four multiple-item latent variables:
attitude, perceived ease of use, perceived usefulness and personal norm. (Acceptance is
measured with a single item categorical variable and is therefore only included in the
structural path analysis, section 4.3.) The modification indices suggested that the model fit
would improve significantly if we allowed the measurement errors of two of the three
personal norm items ([1] “It is my duty …” and [2] “I feel a moral obligation …”) to covary.
This residual covariation can be explained by the fact that these two items contain an explicit
reference to an aspect (i.e., moral duty) that is not explicit in the third item (“…the right thing
to do”). Therefore we found it justified to add this error covariance to the measurement
model.
The unconstrained CFA revealed that all factor loadings are highly significant in all
three countries, and the standardized factor loadings all exceed .6 (see Table 3). The
unconstrained model fitted the data well (see the test statistics for Model 1 in Table 4). The
chi-square per degree of freedom (2.16) is less than 3, the RMSEA less than .08 and the CFI
bigger than .90, thus all indicating a good fit according to commonly accepted thresholds (Hu
& Bentler, 1999). Hence, the measurement model has configural invariance across countries.
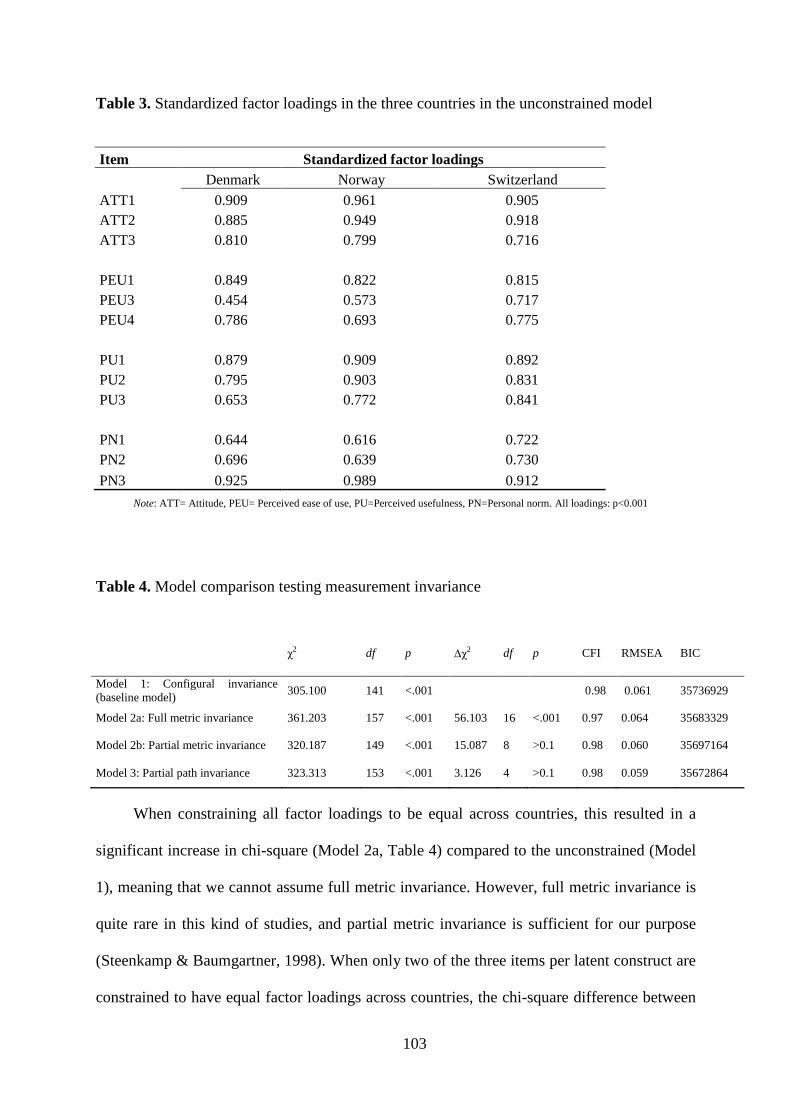
103
Table 3. Standardized factor loadings in the three countries in the unconstrained model
Item Standardized factor loadings
Denmark Norway Switzerland
ATT1 0.909 0.961 0.905
ATT2 0.885 0.949 0.918
ATT3 0.810 0.799 0.716
PEU1 0.849 0.822 0.815
PEU3 0.454 0.573 0.717
PEU4 0.786 0.693 0.775
PU1 0.879 0.909 0.892
PU2 0.795 0.903 0.831
PU3 0.653 0.772 0.841
PN1 0.644 0.616 0.722
PN2 0.696 0.639 0.730
PN3 0.925 0.989 0.912
Note: ATT= Attitude, PEU= Perceived ease of use, PU=Perceived usefulness, PN=Personal norm. All loadings: p<0.001
Table 4. Model comparison testing measurement invariance
χ2 df p χ2 df p CFI RMSEA BIC
Model 1: Configural invariance
(baseline model) 305.100 141 <.001 0.98 0.061 35736929
Model 2a: Full metric invariance 361.203 157 <.001 56.103 16 <.001 0.97 0.064 35683329
Model 2b: Partial metric invariance 320.187 149 <.001 15.087 8 >0.1 0.98 0.060 35697164
Model 3: Partial path invariance 323.313 153 <.001 3.126 4 >0.1 0.98 0.059 35672864
When constraining all factor loadings to be equal across countries, this resulted in a
significant increase in chi-square (Model 2a, Table 4) compared to the unconstrained (Model
1), meaning that we cannot assume full metric invariance. However, full metric invariance is
quite rare in this kind of studies, and partial metric invariance is sufficient for our purpose
(Steenkamp & Baumgartner, 1998). When only two of the three items per latent construct are
constrained to have equal factor loadings across countries, the chi-square difference between

104
the unconstrained and the constrained model is non-significant (Model 2b, Table 4) which
supports the partial metric invariance assumption. Hence, relationships between constructs
estimated in the context of our partial metric invariance model are comparable across
countries.
4.3 Hypotheses tests
Since partial metric invariance can reasonably be assumed for this model, it is possible
to test for path invariance to see if the relationships between the latent factors: perceived ease
of use, perceived usefulness, attitude and personal norm differ across the countries. The
cross-country invariance of the structural paths was tested one at the time. These tests
revealed that the model fit could be improved by constraining the paths between perceived
ease of use and attitude and perceived usefulness and attitude to be equal across countries.
These constraints resulted in a non-significant increase in chi-square (Model 3, Table 4).
Model 3 is also the model with the lowest BIC (Bayesian Information Criterion) value (and
AIC, not reported), suggesting the best trade-off between model fit and model complexity
(van de Schoot et al., 2012).
To complete our model, in the next step we included the dependent categorical variable
Acceptance (ACCEPT) of Smart Grid technology. The complete RTAM model has a good
fit, with a WRMR value less than 1.0 (Yu & Muthén, 2002) (Figure 2). Looking at the
relationships between constructs, perceived usefulness and perceived ease of use are
significant predictors of the attitude towards Smart Grid technology in all three countries,
consistent with Hypothesis 1. From 42% (NO) to 50% (DK and CH) of the variance in
attitudes is accounted for by these two independent variables. Perceived usefulness and
perceived ease of use are also significant predictors of the personal norm, thus confirming

105
Hypothesis 2, and accounting for an even larger amount of the variance in this construct than
for the attitude (76% (DK), 80% (NO) and 85% (CH)).
Note: ns=not significant, *p<.1 **p<.05, all other estimates: p<.001. The model shows the standardized structural parameters only, for
Denmark/Norway/Switzerland. The rest of the Mplus output can be acquired from the authors. Model fit: χ2 = 83.190, df = 36 p < .001. CFI
=.91, TLI = .98, RMSEA = .064, WRMR = .890
Figure 2. The Responsible Technology Acceptance Model for Denmark, Norway, and
Switzerland
As predicted in Hypothesis 3, both attitude and personal norm significantly predict the
acceptance of Smart Grid technology, together accounting for 63% (DK), 78% (NO), and
64% (CH) of the variance in acceptance.
The relationships between the personal norm and other variables in the model appear to
differ more across countries than the relationships between attitude and other variables. First,
it was possible to constrain the relationships between attitude and its predictor variables, but
not the equivalent relationships for personal norms, to be equal across the three countries.
Further, the estimated coefficients suggest that the impact of personal norms on acceptance
differ considerably more across countries than the impact of attitude. The path coefficient of
personal norms on acceptance is nearly/more than twice as big for Norway than for
Denmark/Switzerland.
106
5 Discussion and conclusion
In this paper, we propose a new framework to explain consumer acceptance of
societally beneficial technology such as Smart Grid technology: the Responsible Technology
Acceptance Model (RTAM). This framework is based on two extensively applied
psychological models, namely the TAM, which assumes that technology acceptance is based
on a rational cost-benefit evaluation, and the NAM, which is developed for situations where
moral normative considerations underlie people’s choices. In the proposed RTAM, these two
models are combined to allow accounting for both rational and moral considerations behind
technology acceptance.
In our empirical study, we find that the RTAM successfully predicts the acceptance of
Smart Grid technology in three countries. In line with previous studies, this study confirms
the importance of the technology being perceived as easy to use and useful (Belanche,
Casaló, & Flavián, 2012; Henderson & Divett, 2003; Holden & Karsh, 2010) In addition, as
the RTAM suggests, rational assessments are not the only considerations involved in the
acceptance of Smart Grid technology. Feelings of a moral obligation or responsibility
towards the environment and a positive contribution to society are important as well. Hence,
following up on other research finding that private and societal/environmental benefits
separately contribute to the acceptance of Smart Grid technology (Gangale et al., 2013), our
results confirm that moral motives are significant also when controlling for both types of
motives in the same model. This implies that, in contrast to what is often assumed, individual
benefits are not the only driver of technology acceptance. Societal and environmental
considerations are unique and significant drivers of acceptance of technologies that primarily
benefit the environment and society at large.

107
The confirmation of the predictions made on the basis of the RTAM has important
practical implications. For the promotion of Smart Grid technology, it particularly means that
not only the individual benefits, which are commonly stressed, but also the societal and
environmental benefits should be stressed in communication with potential adopters. This
conclusion is especially important in the light of recent research finding that it can be
counterproductive to stress individual benefits when promoting pro-environmental behaviour
(2013). Bolderdijk et al. (2013) found that communication stressing societal and
environmental benefits evokes positive feelings (i.e., people like to see themselves as
‘green’), but communication stressing private benefits (i.e., saving on the electricity bill) does
not. Instead, stressing financial benefits may evoke feelings of ‘greed’ which is not how most
people like to see themselves. As a result, stressing private benefits may sometimes backfire.
This is particularly important when the private benefits are limited and the societal and
environmental benefits are substantial which is the case for Smart Grid technology.
Data were collected in Denmark, Norway and Switzerland. When comparing the results
across countries, the similarities are more dominating than the differences. Our model has
sufficient measurement invariance across the three countries to make comparisons of
relationships between latent variables meaningful. Further, the path coefficients between
attitude towards Smart Grid technology and its antecedents could be constrained to be equal
across countries without loss of fit. Also, the acceptance rates and many of the estimated
relationships are of equal size across countries. Hence, we reach substantially identical
conclusions across the three countries which show that our model and its predictions possess
cross-national validity.
However, there are a couple of differences between countries that deserve mentioning.
First, the acceptance rate is significantly lower in Switzerland than in Denmark. This

108
difference cannot be explained by differences in the mean scores on the two proximal
antecedents in our model: attitudes and personal norms, since none of them differ between
the two countries. Since we can only speculate why the acceptance rate is lower in
Switzerland than in Denmark, we leave it to future research to illuminate this question.
Second, it seems that the motivation behind the acceptance of Smart Grid technology
differs somewhat between Norway and the other two countries. The average strength of
personal norms for accepting Smart Grid technology is significantly lower in Norway than in
Denmark and Switzerland and at the same time personal norms are a stronger predictor of
Smart Grid technology acceptance in Norway than in Denmark and Switzerland.
The former result indicates that the average Norwegian feels less morally obliged to
install Smart Grid technology than citizens in the other two countries. For example, Throne-
Holst et al. (2008) report that Norwegians value a large and comfortable home and focus little
on the environmental impact of electricity consumption. This might be rooted in the fact that
electricity traditionally has been abundant and cheap in Norway, as a vast majority was (and
still is) hydro-power generated. It is also possible that Norwegians believe that their main
electricity source (hydropower) is sustainable and therefore they do not feel a strong moral
obligation to support changes in the electricity system, including the installation of Smart
Grid technology.
This may seem at odds with the finding that personal norms are a stronger predictor of
Smart Grid technology acceptance in Norway than in Denmark and Switzerland, but it need
not be. In the light of the former, the latter result suggests that when personal norms are more
polarized and less skewed towards the high extreme, they make more of a difference for
technology acceptance.

109
Studying the acceptance of technologies at a very early stage of their diffusion, even
before they are on the market, is of course not without its challenges. In this early stage,
consumers lack knowledge and awareness which implies that they have not yet formed strong
opinions about the technology. Therefore, the information about Smart Grid technology that
the participants in this study were given might have biased their views. However, this
situation is similar to that of any technology in the early stages of its market introduction.
Hence, we do not consider this a serious threat to the ecological validity of our results.
This study shows that there is scope for motivating electricity consumers to accept
Smart Grid technology by communicating both individual and public benefits. We
demonstrated empirically in three countries and by employing the proposed RTAM that a
mixture of private and collective benefits motivates the acceptance of Smart Grid technology.
Specifically, our findings show that Smart Grid technology is more likely to be accepted if
potential adopters perceive it to be both easy and effortless to use and useful both in terms of
private and public outcomes, leading to a positive attitude as well as supportive personal
norms. To some extent, these perceptions depend on the physical characteristics of the
technology (i.e., how easy and effortless use is in practice), but since most of the desired
effects of this technology are not experienced directly by the individual, or is only
experienced with substantial delay, informing and educating potential adopters about these
effects becomes crucial.
Acknowledgements
We gratefully acknowledge funding for this project from Energinet.dk (project number
2010-1-10710).
110
References
Abrahamse, W., Steg, L., Gifford, R., & Vlek, C. (2009). Factors influencing car use and the intention
to reduce it: A question of morality? Transportation Research Part F: Traffic Psychology and
Behaviour, 12, 317-324.
Accenture. (2010). Understanding consumers preferences in energy efficiency.
Ajzen, I. (1985). From intentions to actions: A theory of planned behavior. In J. Kuhl & J. Beckmann
(Eds.), Action control (pp. 11-39): Springer Berlin Heidelberg.
Ajzen, I., & Fishbein, M. (1980). Understanding attitudes and predicting social behavior (1st ed.).
Englewood Cliffs, NJ: Prentice-Hall.
Bamberg, S., Hunecke, M., & Blöbaum, A. (2007). Social context, personal norms and the use of
public transportation: Two field studies. Journal of Environmental Psychology, 27, 190-203.
Bamberg, S., & Möser, G. (2007). Twenty years after Hines, Hungerford, and Tomera: A new meta-
analysis of psycho-social determinants of pro-environmental behaviour. Journal of
Environmental Psychology, 27, 14-25.
Bamberg, S., & Schmidt, P. (2003). Incentives, morality, or habit? Predicting students’ car use for
university routes with the models of Ajzen, Schwartz, and Triandis. Environment and
Behavior, 35, 264-285.
Belanche, D., Casaló, L. V., & Flavián, C. (2012). Integrating trust and personal values into the
Technology Acceptance Model: The case of e-government services adoption. Cuadernos de
Economía y Dirección de la Empresa, 15, 192 - 204.
Biegel, B., Hansen, L. H., Stoustrup, J., Andersen, P., & Harbo, S. (2014). Value of flexible
consumption in the electricity markets. Energy, 66, 354-362.
Biel, A., & Thøgersen, J. (2007). Activation of social norms in social dilemmas: A review of the
evidence and reflections on the implications for environmental behaviour. Journal of
Economic Psychology, 28, 93-112.
Black, J. S., Stern, P. C., & Elworth, J. T. (1985). Personal and contextual influences on househould
energy adaptations. Journal of Applied Psychology, 70, 3-21.
Bolderdijk, J. W., Steg, L., Geller, E. S., Lehman, P. K., & Postmes, T. (2013). Comparing the
effectiveness of monetary versus moral motives in environmental campaigning. Nature
Climate Change, 3, 413-416.
Broeer, T., Fuller, J., Tuffner, F., Chassin, D., & Djilali, N. (2014). Modeling framework and
validation of a Smart Grid and demand response system for wind power integration. Applied
Energy, 113, 199-207.
Broman Toft, M., Schuitema, G., & Thøgersen, J. (2014). The importance of framing for consumer
acceptance of the Smart Grid: A comparative study of Denmark, Norway and Switzerland.
Energy Research & Social Science, 3, 113-123.
111
Chang, S., Chou, C., & Yang, J. (2010). The literature review of technology acceptance model: A
study of the bibliometric distributions. Paper presented at the Pacific Asia Conference on
Information Systems, PACIS 2010 Taipei, Taiwan.
Clastres, C. (2011). Smart Grids: Another step towards competition, energy security and climate
change objectives. Energy Policy, 39, 5399-5408.
Davis, F. D. (1989). Perceived usefulness, perceived ease of use, and user acceptance. MIS Quarterly,
13, 319-340.
Davis, F. D., Bagozzi, R. P., & Warshaw, P. R. (1989). User acceptance of computer technology: A
comparison of two theoretical models. Management Science, 35, 982-1003.
de Groot, J. I. M., & Steg, L. (2010). Morality and nuclear energy: Perceptions of risks and benefits,
personal norms, and willingness to take action related to nuclear energy. Risk analysis, 30,
1363-1373.
Dong Energy. ( 2012). Demand response - the eFlex project. Virum, Denmark.
EcoPinion. (2011). Consumer cents for Smart Grid, survey report (pp. 1-23): Ecoalign.
EurActiv. (2012). Doubts cast over consumer benefits of smart meters. Retrieved from:
http://www.euractiv.com/specialreport-access-energy/consumers-weak-smart-meter-roll-
news-513445
European Commission's Joint Research Centre. (2012). Energy efficiency status report - electricity
consumption and efficiency trends in the EU-27 In P. Bertoldi, B. Hirl & N. Labanca (Eds.),
JCR scientific and policy reports: European Commission.
European Commission´s Joint Research Centre. (2011). Smart Grid projects in Europe: Lessons
learned and current developments. In V. Giordano, F. Gangale, G. Fulli & M. Jiménez (Eds.).
Luxembourg: Publications office of the European Union.
Fishbein, M., & Ajzen, I. (1975). Belief, attitude, intention, and behavior : An introduction to theory
and research. Reading, Mass.: Addison-Wesley Pub. Co.
Frontier Economics. (2011). Economic potential of smart electricity meters in Germany. London, UK.
Gangale, F., Mengolini, A., & Onyeji, I. (2013). Consumer engagement: An insight from Smart Grid
projects in Europe. Energy Policy, 60, 621-628.
Gardner, G. T., & Stern, P. C. (1996). Environmental problems and human behavior. Needham
Heights, MA, US: Allyn & Bacon.
Geelen, D., Reinders, A., & Keyson, D. (2013). Empowering the end-user in Smart Grids:
Recommendations for the design of products and services. Energy Policy, 61(0), 151-161.
Hamilton, B. A. (2010). Understanding the benefits of the Smart Grid - Smart Grid implementation
strategy. In B. A. Hamilton, J. Miller & B. Renz (Eds.). United States: United States
Department of Energy’s National Energy Technology Laboratory.
Harland, P., Staats, H. J., & Wilke, H. A. M. (2007). Situational and personality factors as direct or
personal norm mediated predictors of pro-environmental behavior: Questions derived from
norm-activation theory. Basic and Applied Social Psychology, 29, 323-334.

112
Hauttekeete, L., Stragier, J., Haerick, W., & De Marez, L. (2010). Smart, smarter, smartest.... the
consumer meets the smart electrical grid. Paper presented at the 9th Conference on
Telecommunications Internet and Media Techno Economics (CTTE).
Henderson, R., & Divett, M. J. (2003). Perceived usefulness, ease of use and electronic supermarket
use. International Journal of Human-Computer Studies, 59, 383-395.
Holden, R. J., & Karsh, B.-T. (2010). The technology acceptance model: Its past and its future in
health care. Journal of Biomedical Informatics, 43, 159-172.
Hu, L., & Bentler, P. M. (1999). Cutoff criteria for fit Indexes in covariance structure analysis:
conventional criteria versus new alternatives. Structural Equation Modeling, 6, 1 - 55.
Huijts, N. M. A., De Groot, J. I. M., Molin, E. J. E., & van Wee, B. (2013). Intention to act towards a
local hydrogen refueling facility: Moral considerations versus self-interest. Transportation
Research Part A: Policy and Practice, 48, 63-74.
Huijts, N. M. A., Molin, E. J. E., & Steg, L. (2012). Psychological factors influencing sustainable
energy technology acceptance: A review-based comprehensive framework. Renewable and
Sustainable Energy Reviews, 16, 525-531.
Huijts, N. M. A., Molin, E. J. E., & van Wee, B. (2014). Hydrogen fuel station acceptance: A
structural equation model based on the technology acceptance framework. Journal of
Environmental Psychology, 38, 153-166.
IEA. (2011). Smart Grid - Smart customer policy needs: International Energy Agency.
Jansson, J., Marell, A., & Nordlund, A. (2011). Exploring consumer adoption of a high involvement
eco-innovation using value-belief-norm theory. Journal of Consumer Behaviour, 10, 51-60.
Klöckner, C. A., & Blöbaum, A. (2010). A comprehensive action determination model: Toward a
broader understanding of ecological behaviour using the example of travel mode choice.
Journal of Environmental Psychology, 30, 574-586.
Krishnamurti, T., Schwartz, D., Davis, A., Fischhoff, B., de Bruin, W. B., Lave, L., & Wang, J.
(2012). Preparing for Smart Grid technologies: A behavioral decision research approach to
understanding consumer expectations about smart meters. Energy Policy, 41, 790-797.
Krupka, E., & Weber, R. A. (2009). The focusing and informational effects of norms on pro-social
behavior. Journal of Economic Psychology, 30, 307-307.
Lund, H. (2007). Renewable energy strategies for sustainable development. Energy, 32, 912-919.
Matthies, E. (2003). One to bind them all: How the modified moral decision making model can be
used for the integration of measures to promote pro-environmental travel mode choices. In T.
Craig (Ed.), Crossing boundaries - The value of interdisciplinary research (pp. 103-109).
Aberdeen, Scotland: Robert Gordon University.
Matthies, E., Selge, S., & Klöckner, C. A. (2012). The role of parental behaviour for the development
of behaviour specific environmental norms – The example of recycling and re-use behaviour.
Journal of Environmental Psychology, 32, 277-284.
McCalley, L. T., & Midden, C. J. H. (2002). Energy conservation through product-integrated
feedback: The role of goal-setting and social orientation. Journal of Economic Psychology,
23, 589-603.

113
Moura, P. S., & de Almeida, A. T. (2010). The role of demand-side management in the grid
integration of wind power. Applied Energy, 87, 2581-2588.
Read, W., Robertson, N., & McQuilken, L. (2011). A novel romance: The Technology Acceptance
Model with emotional attachment. Australasian Marketing Journal (AMJ), 19, 223-229.
Schepers, J., & Wetzels, M. (2007). A meta-analysis of the technology acceptance model:
Investigating subjective norm and moderation effects. Information & Management, 44, 90-
103.
Schwartz, S. H. (1977). Normative influences on altruism. In B. Leonard (Ed.), Advances in
experimental social psychology (pp. 221-279). Academic Press.
Schwartz , S. H., & Howard, J. A. (1981). A normative decision-making model of altruism. In J. P.
Rushton & R. M. Sorrentine (Eds.), Altruism and helping behaviour: Social, personality, and
developmental perspectives (pp. 189-211). Hillsdale, NJ: Lawrence Erlbaum.
Schwartz, S. H., & Howard, J. A. (1984). Internalized values as moderators of altruism. In E. Staub,
B.-T. Karylowski, J. & J. Reykowski (Eds.), Development and maintenance of prosocial
behavior: International perspectives on positive morality (pp. 229-255). New York: Plenum
Press.
Schwartz, S. H., & Tessler, R. C. (1972). A test of a model for reducing measured attitude-behavior
discrepancies. Journal of personality and social psychology, 24, 225-236.
SmartGrids - European Technology Platform. (2013). European technology platform for the
electricity networks of the future - FAQs about ETP Smart Grids. from
http://www.smartgrids.eu/FAQ#12
Steenkamp, J. B. E. M., & Baumgartner, H. (1998). Assessing measurement invariance in cross
national consumer research. Journal of Consumer Research, 25, 78-107.
Steg, L., & de Groot, J. I. M. (2010). Explaining prosocial intentions: testing causal relationships in
the norm activation model. British journal of social psychology, 49, 725-743.
Steg, L., Dreijerink, L., & Abrahamse, W. (2005). Factors influencing the acceptability of energy
policies: A test of VBN theory. Journal of Environmental Psychology, 25, 415-425.
Stragier, J., Hauttekeete, L., & De Marez, L. (2010, 27-29 Sept. 2010). Introducing Smart grids in
residential contexts: Consumers' perception of smart household appliances. Paper presented
at the IEEE Conference on Innovative Technologies for an Efficient and Reliable Electricity
Supply (CITRES).
Sun, H., & Zhang, P. (2006). The role of moderating factors in user technology acceptance.
International Journal of Human-Computer Studies, 64, 53-78.
The Smart Grids task force. (2010). European task force for the implementation of Smart Grids into
the European internal market - mission and work programme.
http://ec.europa.eu/energy/gas_electricity/smartgrids/doc/mission_and_workprogramme.pdf
Throne-Holst, H., Strandbakken, P., & Stø, E. (2008). Identification of households' barriers to energy
saving solutions. Management of Environmental Quality: An International Journal, 19, 55-
66.
114
Thøgersen, J. (1996). Recycling and morality: A critical review of the literature. Environment and
Behavior, 28, 536-558.
van de Schoot, R., Lugtig, P., & Hox, J. (2012). A checklist for testing measurement invariance.
European journal of developmental psychology, 9, 1-7.
Wissner, M. (2011). The Smart Grid – A saucerful of secrets? Applied Energy, 88, 2509-2518.
www.denstoredanske.dk. (2013). Den store danske - Gylendals åbne encyklopædi (eng. The great
Danish - Gylendals open encyclopedia) V. Winge (Ed.) Retrieved from
http://www.denstoredanske.dk/Sprog,_religion_og_filosofi/Sprog/Verdens_sprog/Schweiz_-
_sprog
www.DongEnergy.dk. Electricity consumption in houses (Elforbrug i hus). Retrieved 4 December,
2013,from
http://www.dongenergy.dk/privat/energitips/tjekditforbrug/gennemsnitsforbrug/Pages/elforbr
ugihus.aspx
Waarts, E., van Everdingen, Y. M., & van Hillegersberg, J. (2002). The dynamics of factors affecting
the adoption of innovations. Journal of Product Innovation Management, 19, 412-423.
Yu, C.-Y., & Muthén, B. (2002). Evaluation of model fit indices for latent variable models with
categorical and continuous outcomes. Paper presented at the Paper presented at the annual
meeting of the American Educational Research Association, New Orleans, LA.

115
Appendix 1
Information presented in the on-line questionnaire regarding Smart Grid
Technology
How does the new technology work?
There are periods of the day where the demand of electricity causes a great load on the grid, for example in the
morning hours and late afternoon where people starts cooking etc. Then there are periods where plenty of
electricity is generated but not met by enough demand, for example at night where most electricity is generated
by wind power. To tackle this imbalance between supply and demand on the grid a new technology is
introduced, so-called “Smart Meters”.
The fluctuations in supply and demand means that the market price for electricity varies over time: electricity
cost more in “peak periods” than in “off-peak periods”. Smart grid technology can help households to benefit
from this by automatically shift some of the household’s electricity consumption from peak periods to off peak
periods, without causing inconvenience for the household.
What does this mean for you?
Your old electricity meter will be replaced by a “Smart Meter,” which will:
automatically send information about your electricity consumption to your electricity company
give you more detailed information about your daily electricity consumption that is, information about
the amount of electricity you are currently using and how much it costs.
You will have access to this information on a website, on a smart phone or on a display that can be placed where
you choose in your home.
The Smart Meter enables your electricity company to automatically remote control and regulate electric devices
of your choice in your household, such as electricity heating, heat pumps or air condition. These appliances can
automatically be switched off during peak periods and turned on again during off-peak periods.
Example:
Imagine that you have electricity heating. Your electricity company are then able to remotely regulate
the heating of your house so that your heating system heats up during off-peak periods and switches off
during peak periods. The regulation of the temperature can be limited to a ‘comfort zone’ with a
maximum and a minimum temperature, decided by you.
Possibility to override
You will be able to take control over your electric devices at any time. If you do not want your electricity
company to switch off a device at a certain time, you can regulate that on a website or a display in your house. If
you wish, you can also receive a warning by e-mail or SMS 15 minutes before the electricity company switches
off a device.
What are the advantages of having these technologies installed?
Smart Meters contribute with securing the electricity supply and with improving the utilization of renewable
energy sources such as wind power. At the same time it optimizes the electricity consumption, so that the cost
per kilo watt hour is reduced. It is expected that an average family will be able to save 8-10 % on the electricity
bill in this way.
Imagine that your electricity company asks for permission to install a Smart Meter with remote control in your
house/apartment (without any expenses for you). Mark in one of the boxes below if you will accept to have it
installed, or not.
□ YES, I would like to have a Smart Meter with remote control installed in my home
□ NO, I would not like to have a Smart Meter with remote control installed in my home

116

117
THE IMPORTANCE OF FRAMING FOR CONSUMER ACCEPTANCE 6
OF THE SMART GRID: A COMPARATIVE STUDY OF DENMARK,
NORWAY AND SWITZERLAND
Madeleine Broman Toft, Geertje Schuitema and John Thøgersen
Department of Business Administration, Aarhus University
Energy Research & Social Science
Abstract: This study examines the impact of the careful choice of the default on
consumers’ participation in the Smart Grid. In an online experiment in three countries,
participants (N= 3802) were randomly assigned to three conditions, two of which (opt-in vs.
opt-out) implied different defaults and the third was “neutral” in terms of defaults (i.e.,
participants had to make an active choice). Next, the experiment was replicated in a field
setting with homeowners having a heat pump (N=140). An important finding from the field
experiment is that in practice it may not be possible to force people to make an active choice.
As expected, both studies find that an opt-out frame leads to a significantly higher
participation rate than an opt-in frame. When participants are forced to make an active choice
(neutral condition), the same level of participation as in the opt-out condition is found. This
suggests that the two conditions are equally effective at overcoming the temptation to
procrastinate and at stimulating a reasoned and deliberate choice process. Hence, when
promoting Smart Grid technology to private households an opt-out framing is superior to an
opt-in framing both in terms of effectiveness and stimulating a reasoned choice process.
Keywords: Smart Grid; default effect; consumer acceptance; behavioural economics.

118
CHAPTER 6 – TABLE OF CONTENTS
1 Introduction ......................................................................................................................... 119
2 Hypotheses ........................................................................................................................... 126
3 Study 1: Default effects in three countries ................................................................ 128
3.1 Method ............................................................................................................................................ 128
3.1.1 Participants and procedure ......................................................................................... 128
3.1.2 Study design ...................................................................................................................... 129
3.2 Results ............................................................................................................................................ 132
3.3 Discussion ...................................................................................................................................... 136
4 Study 2: Default effects in real life ............................................................................... 137
4.1 Method ............................................................................................................................................ 138
4.1.1 Participants and Procedure ......................................................................................... 138
4.1.2 Study Design ........................................................................................................................ 139
4.2 Results ............................................................................................................................................. 140
4.3 Discussion ...................................................................................................................................... 141
5 General discussion ............................................................................................................ 142
6 Limitations ........................................................................................................................... 145
7 Conclusion ............................................................................................................................ 146
Acknowledgements .................................................................................................................. 147
References ................................................................................................................................... 147
Appendix ...................................................................................................................................... 151

119
Introduction 1
Increasing demand (IEA, 2013), climate change, and nations’ desire to become more
sustainable and self-sufficient with respect to energy have resulted in a need to change electricity
production and consumption, including a radical increase in renewable sources of electricity
(GWEC, 2011). To allow a growth of renewable electricity sources and ensure a reliability grid,
there is a debate about the development of the electricity grid in terms of expanding it or developing
a more flexible system that better handles the challenges of balancing the supply and demand of
electricity, often referred to as a Smart Grid.1 With Smart Grid technology, electricity demand can
be shifted towards times of the day when electricity is plentiful, e.g., from wind, solar or
hydropower, and away from times when little electricity is generated from these sources (e.g.,
because the wind is not blowing and the sun is not shining).
For a Smart Grid to function optimally, electricity consumption must be flexible in time
(Norden, 2011), which is why electricity consumers play a key role in the development of the Smart
Grid. A sufficiently high share of the electricity consumed by homes and other electricity
consumers needs to be made available to net operators as flexible capacity that can be used to meet
inflexible demand for electricity when the supply from renewable sources is low. This means in
practice that consumers, as a minimum, must be willing to accept that part of their electricity
consumption can be remotely controlled by an electricity company or a net operator. The electricity
consumption of the residential sector in Europe increased by 40% between 1990 and 2010 and now
accounts for 30% of total electricity consumption (European Commission's Joint Research Centre,
2012), thereby representing a large potential for flexible capacity.
1 In Europe, a Smart Grid is commonly defined as an “electricity network that can intelligently integrate the
behaviour and actions of all users connected to it – generators, consumers and those that do both – in order to efficiently
deliver sustainable, economic and secure electricity supplies” (Clastres, 2011)
120
Remotely controlling electricity consumption in a Smart Grid requires the installation of a
“smart meter” with a remote control. The simplest type of smart meters is a digitalised electrical
meter that enables two-way communication between consumers’ electricity system and a utility
company, which makes on-site meter reading redundant (see Wissner, 2011, for further details
about possible features of smart meters). More advanced smart meters include features that enable
an electricity supplier or distribution system operator to remotely control in-house appliances’
electricity consumption (Da Silva, Karnouskos, Griesemer, & Ilic, 2012). With this technology, an
electricity supplier or system operator can manage electricity demand on the grid by, for example,
remotely switching off appliances when demand on the grid is high (a “peak-period”), and turn
them on again when demand is low (an “off-peak” period). When talking about Smart Grid
technology in the following, we refer to this latter type of advanced smart meters.
Since the Smart Grid makes it possible to change the composition of electricity sources
towards renewables (Mah, Van der Vleuten, Hills, & Tao, 2012), it benefits electricity consumers
and the society in the long term. Hence, if the costs are not too high, participation in the Smart Grid
is in the best interest of electricity consumers and society. However, because it is a complex issue
involving the physical installation of new technologies in the home, consumers face barriers for
participating and may have reservations (see Krishnamurti et al., 2012). Notably, people may resist
Smart Grid technology if they fear that there are risks (Ram & Sheth, 1989), like for example loss
of comfort or invasion of privacy. Moreover, only small financial gains are expected for private
electricity consumers from participating in the Smart Grid.
However, without discarding the significance of these structural conditions, behavioural and
experimental economists have in recent years successfully challenged the conventional view that
individual actors make decisions purely by trading off expected costs and benefits and suggested
that behavioural predictions should be based on a “bounded rationality” framework instead

121
(Menzel, 2013; Venkatachalam, 2008). Specifically with regard to the type of decision we study
here, scholars have highlighted the importance of studying how people make decisions about their
involvement in energy systems and the effects of different methods and framing techniques when
introducing them to new technologies (Sovacool, 2014; Stern, 2014).
Complexity makes people uncertain about the consequences of a choice, and when they are
uncertain they try to avoid choosing, which usually implies doing nothing (Anderson, 2003).
However, doing nothing is actually also a choice since it implies that one gets the option that
happens to be the default in the situation. By definition, a default is a condition that is imposed
when an individual fails to make a decision (Johnson & Goldstein, 2003).
Research and practice show that it is possible to significantly impact people’s behaviour by
carefully setting the default (Thaler & Sunstein, 2008). For example, when asking for consent to
store personal data online for marketing purposes, consent rates are higher when consent is the
default (i.e., a “presumed consent” model) compared to a situation where the default is no consent
(i.e., an “explicit consent” model) (Bellman, Johnson, & Lohse, 2001). Empirical studies in a wide
range of fields show that different default positions (i.e., where people have to “opt-in” vs. “opt-
out”) result in dramatically different participation rates, including choices regarding medical issues
(Junghans, Feder, Hemingway, Timmis, & Jones, 2005), saving plan enrolment (G. D. Carroll,
Choi, Laibson, Madrian, & Metrick, 2009), insurance (Johnson, Hershey, Meszaros, & Kunreuther,
1993), research participation (Johnson, Bellman, & Lohse, 2002), organ donation (Abadie & Gay,
2006; Johnson & Goldstein, 2003) and “green” electricity (Pichert & Katsikopoulos, 2008). In all of
these areas, research indicates that an opt-out framing2 creates a higher level of participation than an
opt-in framing, which is consistent with the proposition that people tend to stick to the default.
2 We use the terms “frame” and “framing” in a broad sense, referring to the typically unconscious structures
that we think in terms of and which are physically realized in neural circuits in the brain (Lakoff, 2010). According to

122
Some argue that people stick to the default because they are “cognitive misers” (Fiske &
Taylor, 2013), minimizing the cognitive effort when making decisions (Johnson & Goldstein,
2003). For example, when presenting people with the choice to become an organ donor (Johnson &
Goldstein, 2003), a range of complicated considerations might be involved (K. Carroll, 2005).
Hence, when asked to sign up, staying with the default is the easy way out (implying that the person
will not sign up to be an organ donor).
Choi, Labison & Metric (2003) argue that people tend to stay with the default due to
procrastination. Even when they want to make a change, people tend to delay that change longer
than they should, which may be costly for them in the long run. Others suggest that some people
stay with the default because they interpret it as a recommendation or a guideline from the person or
organization that established this option (Halpern, Ubel, & Asch, 2007; Johnson et al., 2002).
Park, Jun, and MacInnis (2000) believe that the default effect can sometimes be attributed to
loss aversion, arguing that people tend to use the presented default as reference point and therefore
experience a loss when subtracting something from the default. Empirically, they found that
consumers end up with a more expensive package when they are offered a “full package” with
additional options included in addition to a basic product than when they are offered a “basic
package” with the possibility of adding options. Because losses loom larger than gains (Tversky &
Kahneman, 1991), people feel a numerically bigger loss when deleting a feature than the gain they
experience from adding the same feature to the package. Similar results are reported by Herrmann
and colleagues (2011), who found that people tend to stay with the default option presented to them
when buying a racing bike.
Lakoff (2010, pp. 71-72), “(a)ll of our knowledge makes use of frames, and every word is defined through the frames it
neurally activates. All thinking and talking involves ‘framing.’ And since frames come in systems, a single word
typically activates not only its defining frame, but also much of the system its defining frame is in.”

123
Verplanken (2002) argues that when a risk or problem is not imminent or salient in people’s
everyday life it tends to be disregarded. People are usually only highly involved in a decision when
they expect immediate personal consequences (Thomsen, Borgida, & Lavine, 1995; Verplanken,
2002). People who fail to identify important personal consequences of the choice and who are
therefore less involved in making the decision are more likely to end up with the default. Following
this reasoning, since the benefits from participating in the Smart Grid are mainly societal and long
term, most people should not be expected to be highly involved in this decision, and many might
therefore end up with whatever is set to be the default.
The existence of a default effect is just one among a range of phenomena that question
whether people’s real preferences are necessarily revealed by their choices (Sen, 1977), as
commonly assumed by mainstream economists (referring back to Samuelson, 1938). It also means
that there is a risk that consumers are manipulated and taken advantage of by someone having the
power to set the default, which is an argument for consumer protection (e.g., Johnson et al., 2002).
The banning of the opt-out or “presumed consent” model in many contexts (e.g., in French and
German law regarding consumer privacy on the Internet) reflects the view that decision makers’
real preferences are less likely to be revealed when an opt-out frame than when an opt-in frame is
used (Bowie & Jamal, 2006). The basic reservation against the former is that it might trick
consumers to “sign up” although they would not want to, had they thought it through. Moreover,
people may be less committed to their “signing up” in an opt-out frame, and subsequently, they may
refuse to proceed with their “decision” afterwards (Cioffi & Garner, 1996) However, it has also
been argued that an opt-in frame often produces a result that is inconsistent with people’s real
preferences. Notably, in many instances people’s inclination to procrastinate and decision
avoidance means that they miss out on positive outcomes that “signing up” would have led to
(Keller, Harlam, Loewenstein, & Volpp, 2011).
124
We do not question that the opt-out approach (presumed consent) is indeed sometimes used
to manipulate people to passively choose a suggested option that is not in their own best interest,
but primarily benefits somebody else. However, the evidence, for example, about people’s
inclination to procrastinate even with regard to important decisions challenges the view that the opt-
out approach always produces a result that is less consistent with people’s real preferences than an
opt-in approach. We propose that there are identifiable, and quite common, circumstances under
which choices are likely to be more consistent with people’s real preferences when an opt-out
approach than when an opt-in approach is used. These circumstances include situations where short-
term individual and long-term collective interests are at odds, commonly referred to as social
dilemmas (Messick & Brewer, 1983), as well as situations where short-term and long-term
individual interests are at odds, sometimes referred to as individual temporal dilemmas (Van Lange
& Joireman, 2008).
As argued earlier, people are usually only highly involved in a decision when they expect
immediate personal consequences (Thomsen et al., 1995; Verplanken, 2002). Hence, people’s
involvement in a decision to participate in something that potentially entails personal costs or risks
here and now, but helps to avoid future problems or risks, be it to oneself, others or society, depends
on the framing of the request. People can avoid facing immediate personal consequences if an opt-
in approach is used, but not if an opt-out approach is used. Therefore, an opt-out approach is likely
to induce a higher personal involvement in the decision than an opt-in approach. A higher personal
involvement in the decision is likely to lead to a more thorough processing of information about the
consequences of choice alternatives (Fazio & Towles-Schwen, 1999; Petty & Cacioppo, 1986).
Hence, when facing a social or a temporal dilemma, if a person chooses the default, the choice is
more likely to be the product of thorough consideration when the default is set to participate rather
than when the default is set to do nothing.
125
Specifically regarding the case in focus here, installing Smart Grid technology might be
perceived to entail immediate personal risks (i.e., potential loss of comfort, violation of privacy,
complex installation). Therefore, consumers are likely to experience a higher involvement in the
decision when an opt-out than when an opt-in approach is used. Under the opt-out condition, not
making a decision (to opt-out) means accepting these personal risks, whereas under the opt-in
condition, not making a decision (to opt-in) has no immediate consequences for the individual (but
it means that substantial benefits for society are forgone). Therefore, we assume that people will be
more involved in the decision and be more motivated to invest the cognitive effort needed to make
the right decision when the decision is framed as a possibility to opt-out rather than when it is
framed as an invitation to opt-in. We further assume that the more cognitive effort people invest in
making the right decision, the more their choice will reflect their real preferences.
In this study, we investigate if the careful choice of the default (“opt-in” versus “opt-out”) is
an effective way to influence electricity consumers’ participation in the Smart Grid, as it has been
shown to be in many other contexts. Further, we test whether framing choices as “opt-out” rather
than as “opt-in” makes people more likely to choose an option that they do not truly prefer (Brown
& Krishna, 2004). We do this by including, as a benchmark, a “neutral” condition where the
“choice architecture” (Thaler & Sunstein, 2008) is free of potentially manipulating defaults. In the
neutral condition, having no default to fall back on, the participant is forced to make an “active
choice” (G. D. Carroll et al., 2009; Keller et al., 2011), investing cognitive effort in making the
decision. We do this by means of a combination of two methods that are both underrepresented in
this area of research (Sovacool, 2014): an online experiment in three countries and a real-life field
experiment, used to validate the results of the online experiment.
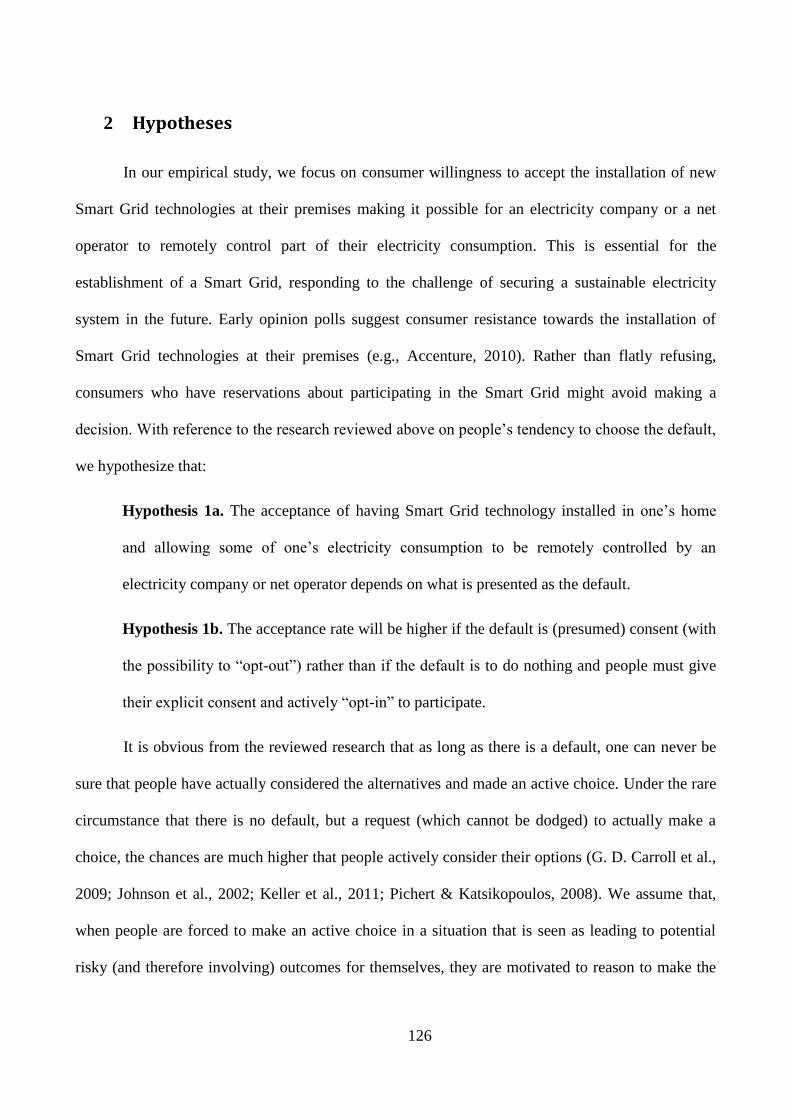
126
Hypotheses 2
In our empirical study, we focus on consumer willingness to accept the installation of new
Smart Grid technologies at their premises making it possible for an electricity company or a net
operator to remotely control part of their electricity consumption. This is essential for the
establishment of a Smart Grid, responding to the challenge of securing a sustainable electricity
system in the future. Early opinion polls suggest consumer resistance towards the installation of
Smart Grid technologies at their premises (e.g., Accenture, 2010). Rather than flatly refusing,
consumers who have reservations about participating in the Smart Grid might avoid making a
decision. With reference to the research reviewed above on people’s tendency to choose the default,
we hypothesize that:
Hypothesis 1a. The acceptance of having Smart Grid technology installed in one’s home
and allowing some of one’s electricity consumption to be remotely controlled by an
electricity company or net operator depends on what is presented as the default.
Hypothesis 1b. The acceptance rate will be higher if the default is (presumed) consent (with
the possibility to “opt-out”) rather than if the default is to do nothing and people must give
their explicit consent and actively “opt-in” to participate.
It is obvious from the reviewed research that as long as there is a default, one can never be
sure that people have actually considered the alternatives and made an active choice. Under the rare
circumstance that there is no default, but a request (which cannot be dodged) to actually make a
choice, the chances are much higher that people actively consider their options (G. D. Carroll et al.,
2009; Johnson et al., 2002; Keller et al., 2011; Pichert & Katsikopoulos, 2008). We assume that,
when people are forced to make an active choice in a situation that is seen as leading to potential
risky (and therefore involving) outcomes for themselves, they are motivated to reason to make the
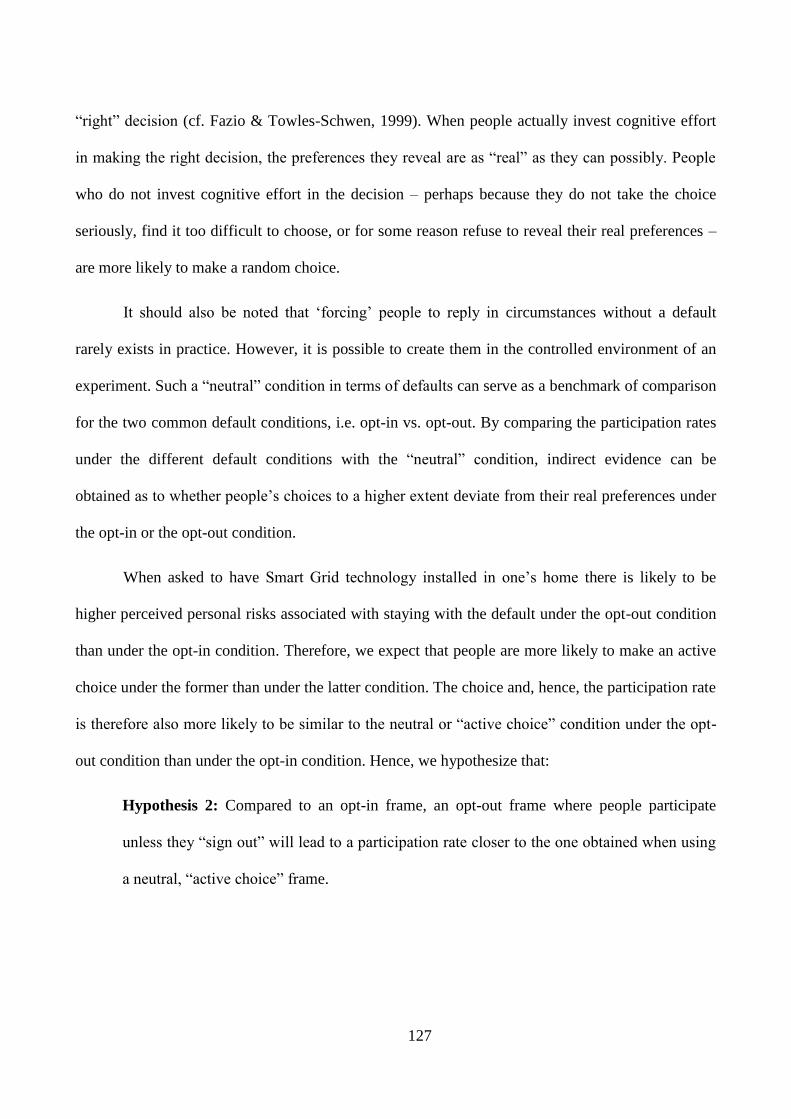
127
“right” decision (cf. Fazio & Towles-Schwen, 1999). When people actually invest cognitive effort
in making the right decision, the preferences they reveal are as “real” as they can possibly. People
who do not invest cognitive effort in the decision – perhaps because they do not take the choice
seriously, find it too difficult to choose, or for some reason refuse to reveal their real preferences –
are more likely to make a random choice.
It should also be noted that ‘forcing’ people to reply in circumstances without a default
rarely exists in practice. However, it is possible to create them in the controlled environment of an
experiment. Such a “neutral” condition in terms of defaults can serve as a benchmark of comparison
for the two common default conditions, i.e. opt-in vs. opt-out. By comparing the participation rates
under the different default conditions with the “neutral” condition, indirect evidence can be
obtained as to whether people’s choices to a higher extent deviate from their real preferences under
the opt-in or the opt-out condition.
When asked to have Smart Grid technology installed in one’s home there is likely to be
higher perceived personal risks associated with staying with the default under the opt-out condition
than under the opt-in condition. Therefore, we expect that people are more likely to make an active
choice under the former than under the latter condition. The choice and, hence, the participation rate
is therefore also more likely to be similar to the neutral or “active choice” condition under the opt-
out condition than under the opt-in condition. Hence, we hypothesize that:
Hypothesis 2: Compared to an opt-in frame, an opt-out frame where people participate
unless they “sign out” will lead to a participation rate closer to the one obtained when using
a neutral, “active choice” frame.

128
Study 1: Default effects in three countries 3
In Study 1, we test the effects of different framings on the adoption rate of Smart Grid
technology in three European countries: Denmark, Norway, and Switzerland. Smart Grid
technology is defined in this study as a ‘smart meter’ with a remote control that enables two-way
communication between the consumer’s electricity system and the utility company (see McDaniel
& McLaughlin, 2009). This definition is specific enough to test how participants respond under
different framing conditions (i.e., opt-in, opt-out, or an “active choice”), without having to explain
too much the various implications that such Smart Grid technologies have in the different countries.
In Study 1 we test our hypotheses under controlled, “laboratory” conditions embedded in an online
survey
3.1 Method
3.1.1 Participants and procedure
All European countries are likely to face the implementation of Smart meters with remote
control, but the issue is not equally salient in all countries. For Study 1, data were collected in
September–October 2011 by means of an online survey in three European countries where the issue
of energy transformation and Smart Grid is relatively high on the political agenda, but which differ
substantially with regard to the composition of their electricity supply (Hermwille, 2014; Sovacool,
2013; World Energy Council, 2013). Representative samples in terms of gender, age (+18) and
regions were recruited from YouGov’s online panel members in Denmark (DK), Norway (NO) and
(the German speaking part of) Switzerland (CH). YouGov rewards its panel members with 0.13
Euro per minute for each survey they spend time on. The purpose of this payment is to ensure that
samples are as representative as possible, and that responses are not tilted towards those
passionately interested in a subject of a particular survey. This recruitment method makes it

129
unlikely that the sample would be biased in a way that is related to their responding in this
particular study.
Participants were between 18 and 74 years old with an average age of 46 (NO) or 47 (DK
and CH); there is an equal gender distribution. Respondents under 25 were asked if they lived with
their parents. If they did, they were discarded together with those who did not pay their electricity
bill directly to an electricity company, since it was assumed that they were not responsible for
making decisions about installing Smart Grid technology in their home. The survey consisted of
five parts and took on average about thirty-five minutes to complete. Respondents who completed
the survey in less than seven minutes were excluded from the analysis (DK = 64, NO = 103, CH =
94) because they were assumed to have responded without paying attention to the questions. In
total, 956 (DK), 901 (NO) and 945 (CH) participants were used for the analysis.
3.1.2 Study design
The main focus of Study 1 was on the effects of the three different framings and default
conditions on consumers’ acceptance of Smart Grid technology. However, in our study design we
also controlled for two potentially confounding factors: the types of benefits that are salient in the
decision situation (public versus private) and the amount of control a household has over the
installed Smart Grid technology, see Table 1. Hence, a 3 (types of benefits mentioned) x 2 (personal
control mentioned or not) x 3 (framings) between subjects design with random allocation to groups
was used to test the effects of different framings of the choice task while controlling for outcome
and control information about Smart Grid technology.
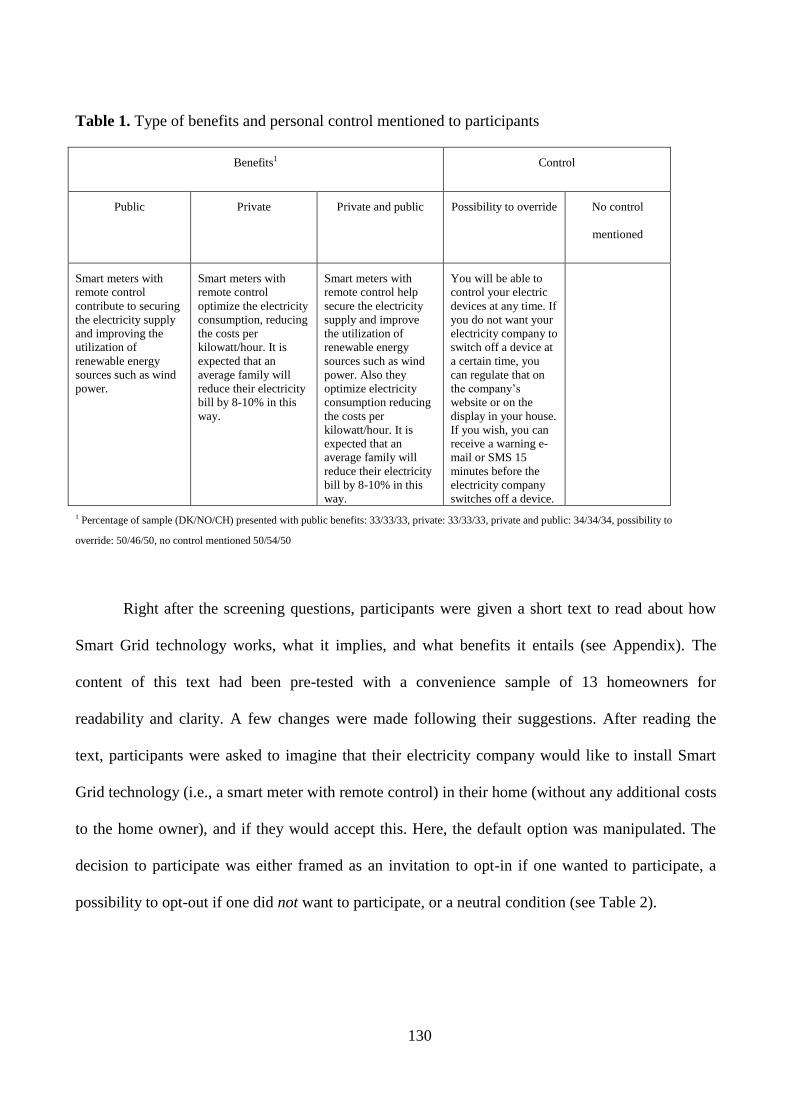
130
Table 1. Type of benefits and personal control mentioned to participants
Benefits1 Control
Public Private Private and public Possibility to override No control
mentioned
Smart meters with
remote control
contribute to securing
the electricity supply
and improving the
utilization of
renewable energy
sources such as wind
power.
Smart meters with
remote control
optimize the electricity
consumption, reducing
the costs per
kilowatt/hour. It is
expected that an
average family will
reduce their electricity
bill by 8-10% in this
way.
Smart meters with
remote control help
secure the electricity
supply and improve
the utilization of
renewable energy
sources such as wind
power. Also they
optimize electricity
consumption reducing
the costs per
kilowatt/hour. It is
expected that an
average family will
reduce their electricity
bill by 8-10% in this
way.
You will be able to
control your electric
devices at any time. If
you do not want your
electricity company to
switch off a device at
a certain time, you
can regulate that on
the company’s
website or on the
display in your house.
If you wish, you can
receive a warning e-
mail or SMS 15
minutes before the
electricity company
switches off a device.
1 Percentage of sample (DK/NO/CH) presented with public benefits: 33/33/33, private: 33/33/33, private and public: 34/34/34, possibility to
override: 50/46/50, no control mentioned 50/54/50
Right after the screening questions, participants were given a short text to read about how
Smart Grid technology works, what it implies, and what benefits it entails (see Appendix). The
content of this text had been pre-tested with a convenience sample of 13 homeowners for
readability and clarity. A few changes were made following their suggestions. After reading the
text, participants were asked to imagine that their electricity company would like to install Smart
Grid technology (i.e., a smart meter with remote control) in their home (without any additional costs
to the home owner), and if they would accept this. Here, the default option was manipulated. The
decision to participate was either framed as an invitation to opt-in if one wanted to participate, a
possibility to opt-out if one did not want to participate, or a neutral condition (see Table 2).

131
Table 2. Checkbox format questions for accepting the installation of a smart meter with remote
control installed in the home
Opt-in:
Imagine that your electricity company asks for permission to install a smart meter with remote control in your house/apartment
(without any expenses for you). Please check the box below if you would accept to have it installed. If you would not accept to have
it installed you just continue to the next question.
□ YES, I would like to have a smart meter with remote control installed in my home
Opt-out:
Imagine that your electricity company asks for permission to install a smart meter with remote control in your house/apartment
(without any expenses for you). Please check the box below if you would not accept to have it installed. If you would accept to have
it installed you just continue to the next question.
□ NO, I would not like to have a smart meter with remote control installed in my home
Neutral:
Imagine that your electricity company asks for permission to install a smart meter with remote control in your house/apartment
(without any expenses for you). Please check one of the boxes below if you would or would not accept to have it installed.
□ YES, I would like to have a smart meter with remote control installed in my home
□ NO, I would not like to have a smart meter with remote control installed in my home
In the neutral condition, no default was presented. Before they could continue with the
survey, participants in this condition had to make a decision and choose whether or not they wanted
the installation of a smart meter with remote control, by checking either yes or no. Hence, in this
condition, participants were “forced” to make a choice.

132
In the opt-in condition, participants were informed that they would not get a smart meter
installed unless they checked the box, thereby giving explicit consent to the installation. Here, not
getting this technology installed was the default. In the opt-out condition, the participant would get
a smart meter installed unless he or she opted out (presumed consent). Here, getting the technology
installed was the default.
Participants made their choices with a mouse click. A mouse click requires a minimum of
time and physical effort, compared to other possible methods, such as sending a letter, an e-mail or
making a phone call. Hence, it is hardly because it takes too much time and physical effort to make
a choice that the participants choose the default instead of the alternative option.
3.2 Results
The type(s) of benefits mentioned (individual versus collective) had no effect on
participants’ willingness to accept Smart Grid technology (χ2
(2) = 2.853, NS), nor did it moderate
the effects of framing condition or country of residence on acceptance (χ2 (12) = 5.881, NS).
Neither did the mentioning of a control button to override remote control moderate the effects of
framing condition or country of residence on acceptance (χ2 (8) = 7.897, NS), but it did have a
significant direct effect (Wald = 5.381 (1), p < .05). Surprisingly, the acceptance rate was (slightly,
but significantly) lower when the control button was mentioned. This suggests that when we
mentioned the control button, we reminded people about something negative, which some of them
did not think of when it was not mentioned, i.e. that their control over their electricity system might
be reduced. Since this effect was outside the focus of this article and does not influence the effects
we focused on, we will not discuss it any further.
A majority of the participants in each country expressed a willingness to have Smart Grid
technology installed (see Figure 1).

133
Figure 1. Acceptance rates in three countries in the opt-in, opt-out and neutral frames
The willingness to accept the installation of Smart Grid technology (Acceptance) is
significantly different from 50% in the opt-out and neutral conditions in all countries (two-sided
binomial test, p < .001), which shows that, although this was a hypothetical choice, responses were
not made at random under these conditions. In the opt-in condition, acceptance is significantly
different from 50% in Denmark and Norway (two-sided binomial tests, p < .01 and p < .05), but not
in Switzerland (two-sided binomial test, p = .14). Hence, if the hypothetical nature of the choice
made people choose randomly in any condition, that would be in the opt-in condition, which is also
where the involvement in the decision is likely to be lowest, as argued earlier.
A binary logistic regression analysis was carried out by means of SPSS21 to investigate if
participants’ acceptance of Smart Grid technology was related to the framing condition (opt-in, opt-
out, neutral) and/or country of residence (DK, NO, CH). The result showed that:

134
(1) Predicted logit of (Acceptance) = 0.401 + 0.917*Neutral + 0.973*Opt-out + (–
0.141)*NO + (–0.459)*CH;
with opt-in as reference condition and Denmark as reference country.
According to the model, the log of the odds of accepting Smart Grid technology is
significantly higher in both the Neutral and the Opt-out framing condition, compared to the Opt-in
framing condition (p < .001), and significantly lower in Switzerland than in Denmark (p < .001;
Table 3). The acceptance rate in Norway is not significantly different from Denmark and the
country-framing interaction is also not significant (not shown).
Table 3. Logistic Regression Analysis the Effects of Framing Condition and Country
Variables in
the regression
equation β S.E. Wald df p. Exp(β)
95% C.I.for
Exp(β)
Lower Upper
Framing
condition1
121.229 2 .001
neutral .917 .101 82.885 1 .001 2.502 2.054 3.048
opt-out .973 .102 90.964 1 .001 2.646 2.166 3.231
Country2
21.672 2 .001
Norway -.141 .105 1.797 1 .180 .868 .706 1.067
Switzerland -.459 .102 20.345 1 .001 .632 .518 .772
Constant .401 .089 20.346 1 .001 1.493
Tests3 χ
2 df p
Overall model evaluation
Likelihood ratio test 140.697 4 .001
Score test
Framing condition 122.170 2 .001
Country 19.255 2 .001 1 Reference condition: Opt-in. 2 Reference country: Denmark. 3 Cox and Snell R2 = .049, Nagelkerke R2=.069

135
The model gives a statistically significant prediction of participants’ choices (χ2 (4) =
140.697, p < .001), correctly classifying 68.9% of the cases, with Pseudo R2s of 5.0% (Cox and
Snell R2) and 7.0% (Nagelkerke R
2). The modest Pseudo R
2s indicate that the predictors in the
model only explain a small part of the variation in the acceptance of Smart Grid technology. This
suggests that there is either a large amount of random variance in individual choices or important
predictor variables are omitted from the model. Given that most of the participants can safely be
assumed to be both unfamiliar with and not very personally involved in Smart Grid technology,
especially the former of these possibilities seems highly likely. However, the Pseudo R2s should be
treated as supplementary to other, more useful indices for the interpretation of this model, such as
the overall evaluation of the model and individual regression coefficients (Peng, Lee, & Ingersoll,
2002). These indicators suggest a meaningful effect of framing condition on the acceptance of
Smart Grid technology.
In all three countries, the Opt-out condition generates a significantly (p < .001) higher
willingness to accept (79% DK, 76% NO, 74% CH) compared to the Opt-in condition (60% DK,
58% NO, 47% CH). The odds ratio for the Opt-out condition is 2.65, meaning that the opt-out
framing increases the odds that a person will accept the installation of Smart Grid technology more
than two-and-a-half times compared to the opt-in framing. The acceptance rate in the opt-out
condition does not differ significantly from the neutral condition (80% DK, 76% NO, 70% CH)
(Wald = .268 (1), NS), whereas the acceptance rate in the opt-in condition is significantly lower
than in the neutral condition (p< .001; Table 3).
Across countries, the acceptance rate is significantly lower in Switzerland than in Denmark
(Table 3) and Norway (CH-NO: Wald = 9.720 (1), p < .005). The difference in the acceptance rate
between Denmark and Norway is not significant (Table 3).
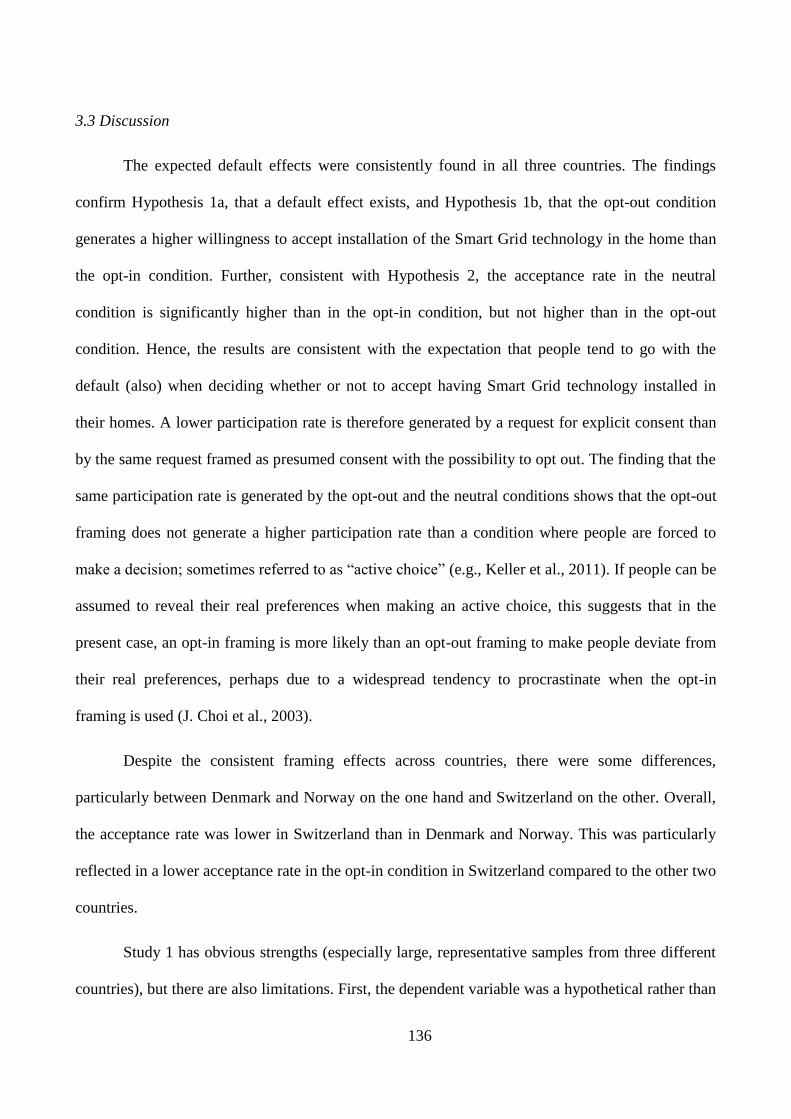
136
3.3 Discussion
The expected default effects were consistently found in all three countries. The findings
confirm Hypothesis 1a, that a default effect exists, and Hypothesis 1b, that the opt-out condition
generates a higher willingness to accept installation of the Smart Grid technology in the home than
the opt-in condition. Further, consistent with Hypothesis 2, the acceptance rate in the neutral
condition is significantly higher than in the opt-in condition, but not higher than in the opt-out
condition. Hence, the results are consistent with the expectation that people tend to go with the
default (also) when deciding whether or not to accept having Smart Grid technology installed in
their homes. A lower participation rate is therefore generated by a request for explicit consent than
by the same request framed as presumed consent with the possibility to opt out. The finding that the
same participation rate is generated by the opt-out and the neutral conditions shows that the opt-out
framing does not generate a higher participation rate than a condition where people are forced to
make a decision; sometimes referred to as “active choice” (e.g., Keller et al., 2011). If people can be
assumed to reveal their real preferences when making an active choice, this suggests that in the
present case, an opt-in framing is more likely than an opt-out framing to make people deviate from
their real preferences, perhaps due to a widespread tendency to procrastinate when the opt-in
framing is used (J. Choi et al., 2003).
Despite the consistent framing effects across countries, there were some differences,
particularly between Denmark and Norway on the one hand and Switzerland on the other. Overall,
the acceptance rate was lower in Switzerland than in Denmark and Norway. This was particularly
reflected in a lower acceptance rate in the opt-in condition in Switzerland compared to the other two
countries.
Study 1 has obvious strengths (especially large, representative samples from three different
countries), but there are also limitations. First, the dependent variable was a hypothetical rather than

137
a genuine choice. Second, people’s choices were made within the context of an online survey,
which only to a limited extent reflects the reality of choices of the analysed kind. If the hypothetical
nature of the choice meant that participants did not take it seriously, one would expect them to
choose randomly. Since our results in most conditions differed significantly from a 50-50
distribution of answers, it seems that participants took the choice seriously, despite its hypothetical
nature. Nevertheless, we tested the ecological validity of the key findings of Study 1 in a real life
field test with heat pump owners in Denmark, which were offered a real choice by their electricity
provider.
Study 2: Default effects in real life 4
The aim of Study 2 was to test the ecological validity of the key findings of Study 1 by
means of a replication in a real-life field-test, testing the default effect on a real rather than on a
hypothetical choice. The field test also helps clarify the practical implication and limitations of
using different default frames in reality. Without any mentioning of this being a research project,
potential participants were approached by their electricity provider with an offer to have Smart Grid
technology installed at their heat pump for free to remotely regulate it depending on supply and
demand of electricity in the grid.
The field test focuses on the regulation of heat pumps because they are a subsidized and
steeply growing heating appliance for detached houses in rural areas in Denmark and one of the
domestic appliances that is most promising in terms of providing flexibility for home electricity
consumption. Hence, in Study 2 we investigate the impact of the framing of the request on
consumer acceptance of Smart Grid technology for remotely controlling the electricity use of their
heat pump.
138
4.1 Method
4.1.1 Participants and Procedure
We collaborated with one of the market leaders for heat pumps in Denmark, Robert Bosch
A/S, to identify households whose homes were equipped with suitable heat pumps. Thirteen
independent dealers selling heat pumps from this producer provided 149 addresses where 140 of
these were private consumers who had at that time a suitable heat pump. As we only received the
addresses, socio-demographic or other data on these consumers are not available.
The 140 households received an information packages from their heat pump dealer by
physical mail, which was addressed to the person who was registered at the dealer. These
information packages were sent out between November 2012 and March 2013. The information
package consisted of a letter, an answering slip, a return envelope, and an information leaflet from
the electricity company. In the letter, receivers were informed that their electricity company, one of
the largest electricity companies of Denmark, offered them an upgrade of their heat pump – free of
charge – that would prepare it for the future. The upgrade, consisting of an “intelligent steering
unit”, would be installed during their next service check, provided that certain conditions were
fulfilled. It was noted in a footnote that they could only make use of this offer if their heat pump
was suitable for this upgrade and if their household had a Wi-Fi connection. Addressees were asked
to reply within two weeks. They could reply either by sending the included answering slip back in
the provided return envelope or online (a web link was provided). The included information leaflet
explained the technical details of the upgrade in more detail and how they would benefit from it.
The letter and answering slip were printed on paper from the addressees’ heat pump producer (see
Appendix); the electricity company provided the information leaflet and the return envelope. All
this to secure the participants perceived this as a real as opposed to a hypothetical offer.

139
Participants in Study 2 were randomly assigned to the same three different framings of the
request as in Study 1 with no reply being accepted as an (indirect) answer in the opt-in and opt-out
conditions (respectively no consent and consent to have a steering unit installed at their heat pump).
Unlike in Study 1, in practice it is not possible to force respondents in the neutral condition to
respond. Two weeks after receiving the information package, 11 addressees in the neutral condition
had replied (22.9%). The rest received a reminder after three weeks. This first reminder resulted in
another 16 replies, making the total response rate 56.2% in this condition. A second reminder was
sent after another three weeks, which lead to seven additional replies, increasing the response rate to
70.8%. The 14 addressees in the neutral condition who had not replied after two reminders received
a phone call, in which a reference to the information package was made and they were asked if were
interested in an upgrade of their heat pump or not. This resulted in two more answers. Ten people
did not pick up their phone (one attempt was made), and two addressees had a secret phone number
that could not be retrieved. Thus in total, 12 addressees in the neutral condition did not reply.
A majority (60%) of the replies was sent back via postal mail and 30% were made on the
website. The last 10% of the replies were given via phone or email, as contact details of a person at
the electricity company were given in case there were questions.
4.1.2 Study Design
The 140 participants were randomly assigned to one of the three conditions: opt-in (N=44),
opt-out (N=48) and neutral (N=48). They all received the same information package consisting of a
letter, answering slip, return envelope and information leaflet. The only differences were with
regard to the last sentences in the letter and the answering slip.
In the opt-in condition, the last part of the letter read: “If you want a steering unit installed
on your heat pump, please return the answering slip by using the stamped envelope. You can also
answer online by following this link [link provided]. Please answer before [date 2 weeks after send

140
date given]. If you do not wish an intelligent steering unit to be installed on your heat pump, you do
not have to do anything and just do not respond”. On the answering slip they could only check one
box “YES thank you, I would like to have a steering unit installed on my heat pump” and they were
asked to provide their signature and details (name, address, phone number, and email address). If
they followed the web link, they had to do the same digitally: check the box and provide the same
details.
In the opt-out condition, the last sentences of the letter were “If you do not want a steering
unit installed on your heat pump, please return the answering slip by using the stamped envelope.
You can also answer online by following this link [link provided]. Please answer before [date 2
weeks after send date given]. If you do wish an intelligent steering unit to be installed on your heat
pump, you do not have to do anything and just do not respond. Then we will contact you again after
two weeks.” On the answering slip and online form they could check one box “NO thank you, I do
not want a steering unit installed on my heat pump”; and sign and provide their details.
In the neutral condition, the letter ended with: “Simply check the box with your answer on
the answering slip below and send it back by using the stamped envelope. You can also answer
online by following this link [link provided]. Please answer before [date two weeks after send date
given]. On the answering slip and online form they could check either the box, “YES thank you, I
would like to have a steering unit installed on my heat pump,” or “NO thank you, I do not want a
steering unit installed on my heat pump”, and provide their signature and details.
4.2 Results
Table 4 shows the answering patterns of all respondents in the three conditions. Note that in
the opt-in and opt-out condition the ‘no reply’ category has a different meaning than the ‘no reply’
category in the neutral condition. In the opt-in and opt-out condition a ‘no reply’ indicates that
respondents implicitly did not or did, respectively, accept a steering unit.

141
Table 4. Answering patterns in 3 conditions
Opt-in Opt-out Neutral Total
Reply
Yes 17 - 25 42
No - 7 11 18
No reply 27 41 12 80
Total 44 48 48 140
Similar to Study 1, a higher acceptance rate was observed in the opt-out condition (41
respondents did not opt-out) than in the opt-in condition (17 respondents opted in) (2 (1) = 21.65, p
<.001). Thus, also this field test confirms the existence of a default effect (Hypothesis 1a) and that
using an opt-out frame generated a higher participation rate than an opt-in frame (Hypothesis 1b).
In the opt-out condition 7 (out of 48) respondents said ‘no’ to the steering unit, whereas 11
(out of 48) respondents said ‘no’ in the neutral condition. This difference is not significant (2 (1) =
1.09, NS), implying that in the opt-out and neutral condition the number of people refusing Smart
Grid technology does not differ. All this is consistent with what we found in Study 1. However, in
contrast to Study 1, the number of respondents saying ‘yes’ to the steering unit is not significantly
lower in the opt-in condition (17 out of 44) than in the neutral condition (25 out of 48) (2 (1) =
1.63, NS). Hence, in practice we apparently do not obtain a higher participation rate when using a
neutral frame compared to an opt-in frame when recruiting participants to the Smart Grid.
4.3 Discussion
Consistent with Study 1, Study 2 shows that more people will adopt Smart Grid technology
when an opt-out frame than when an opt-in frame is used in the recruitment letter. Hence, Study 2
also provides support for Hypothesis 1a and Hypothesis 1b. However, in contrast to Study 1, Study

142
2 did not provide unequivocal support for Hypothesis 2. The share of people who opted out under a
presumed consent condition did not differ significantly from the share of people who said “no”
when making an active choice in the neutral condition. However, at the same time the share of
people who said “yes” in the neutral condition was not significantly higher than the share that opted
in under explicit-consent conditions. We believe that the latter is due to it being virtually impossible
to force people to make a decision of this kind in a real-life situation, in contrast to the conditions of
an experimental survey design. We will elaborate on this in the general discussion.
General discussion 5
As expected, both the large, representative survey-based experiment in three countries and
the field test with ordinary homeowners in one of these countries find that the acceptance of Smart
Grid technology is significantly higher when the default is to participate (with the possibility to opt-
out), rather than to not participate (with the possibility to opt-in). This is inconsistent with an
“unbounded rationality” model of decision-making (Venkatachalam, 2008), but consistent with
earlier behavioural economics studies investigating the default effect in decision-making (S. M.
Choi & Rifon, 2002; Johnson & Goldstein, 2003; Johnson et al., 1993; Junghans et al., 2005; Keller
et al., 2011; Pichert & Katsikopoulos, 2008). Hence, when the goal is to generate a high
participation rate, for example, when promoting the Smart Grid to private households, it is not
irrelevant which, implicit or explicit, default option that a potentially procrastinating decision-
maker will fall back on (see also Menzel, 2013). Finding the exact same pattern across three
different countries strengthens our confidence in the generality of the findings and demonstrates
that the power of the default does not depend on cultural or other factors that might differ between
these countries. We also find that the default effect is independent of the types of benefits that are
salient in the decision situation and of the salience of beliefs about personal control over the
technology.

143
The strong default effect, generating substantially higher acceptance rates when an opt-out
approach is used, has led to an on-going discussion about the use of this approach, including for
important ethical decisions like organ donation. Supporters of the opt-out approach argue that it
could solve important welfare problems, such as those produced by organ shortage (English, 2007).
However, as mentioned earlier, others argue that the opt-out approach might lead to many people
participating without carefully considering the options. For example, in the case of organ donation,
it has been argued that the use of an opt-out approach might therefore lead to mistrust and negative
attitudes towards organ donation and the health system in general (e.g.,Wright, 2007). Others
express concern that, when yielding decisions through the inaction of the decision maker, as the
opt-out approach do, one is less likely to obtain the kind of committed follow-up from participants
that is often important for implementing the decision (Keller et al., 2011).
Similar arguments might be voiced against the use of the opt-out approach to increase
households’ acceptance of having Smart Grid technology in their homes. Installation of Smart Grid
technology primarily benefits the environment and society at large, whereas the personal benefits
are small. When asked, most people state that preserving the environment is important (European
Commission, 2011). However, for most people environmental consequences are less important than
issues that directly affect them in their everyday life, such as work, health or family (Verplanken,
2002). Whether or not to accept the installation is therefore not only difficult (i.e., a technically
complicated issue with potential risks regarding, for example, home comfort and privacy); it is also
a decision most people are not highly involved in. Hence, many people will most likely
procrastinate if they are asked to explicitly consent to the installation of Smart Grid technology in
their homes (i.e., the opt-in approach), even though they might consider the Smart Grid to be in
their own best interest and in accordance with their long-term goals.

144
In Study 1, the neutral or “active choice” condition generated the same acceptance rate as
the opt-out approach, which are both significantly higher that the participation rate in the opt-in
approach. Also, in Study 2 the share saying “no” to Smart Grid technology did not differ
significantly between the two former conditions. The most likely reason why the opt-in approach
generated between 30% (DK) and 58% (CH) less participation in the Smart Grid than the neutral
approach in Study 1 is that a large share of the population simply avoids making a decision if an
opt-in approach is used. By the same logic it seems that people do not procrastinate when an opt-out
approach is used to promote Smart Grid technology. This strongly suggests that when people accept
the default under the opt-out condition, it is not due to them avoiding making a decision, on the
contrary, they actively choose the default.
The practically identical acceptance rate in the opt-out and the neutral, forced choice
conditions in Study 1 suggests that, when asked to accept the installation of Smart Grid technology
in their home, the opt-out condition put the same level of pressure on potential participants to give
the issue as serious consideration and make an active choice as the neutral, forced choice condition.
As in other social or temporal dilemma cases, where the opt-out approach has been found to
generate the same participation rate as an active choice approach, neither more nor less (e.g.,
Johnson & Goldstein, 2003; Keller et al., 2011; Pichert & Katsikopoulos, 2008), staying with the
default in the opt-out condition entails immediate, personally relevant consequences (i.e., someone
will install Smart Grid technology in one’s home and one’s electricity use will be remotely
controlled) that can be perceived as risky, but not in the opt-in condition. Because of the immediate,
personally relevant consequences, people are motivated to invest time and effort in processing
information and to consider whether they prefer to stay with the default in the opt-out case, which
they are not in the opt-in case. This means that the opt-out approach is not only more effective in

145
generating a high participation rate than the opt-in approach; it is also obtains this effectiveness in
an ethically defensible way, without manipulating consumers.
It could be argued that the neutral, “active choice” approach should always be the preferred
method, since it preserves people’s free choice and (potentially) generates the same participation
rate as the opt-out approach. However, as illustrated by Study 2, the neutral approach has the
drawback that it is often difficult, sometimes impossible, in practice to force people to make a
choice. For example, it is likely that a large share of participants in Study 2 procrastinated when
they received the letter from their electricity provider presenting them with a choice framed in a
neutral way, which is why they did not reply. We have no reason to believe that the level of
procrastination in this case is higher than what should be expected. Furthermore, since Study 1
suggests that the opt-out method generates serious considerations before accepting the default, we
also find it likely that people recruited by means of this method will be just as committed to use
Smart Grid technology (i.e., respond to messages transmitted by the technology), as people who
have opted-in or made the choice under an “active choice” condition.
Limitations 6
The most important limitation of Study 1 is that participants responded to a hypothetical
question, which means that their acceptance of Smart Grid technology did not have any real
consequences for them. However, the findings show that at least in the opt-out and neutral
conditions, choices were not made at random and the key findings were replicated in a natural
setting in Study 2. Study 2 was only carried out in one country, but there is no reason to expect that
the default effect differs between countries. However, we did find a few other country differences in
Study 1. Especially, in Study 1 we found a lower absolute acceptance rate in Switzerland in the opt-
in condition compared to Denmark and Norway. This indicates that, although the effects of framing

146
conditions are likely to be similar in different countries, baseline public acceptance can differ and
should be taken into account.
In the present case, the overall acceptance rate in Denmark was higher in Study 1 (73%)
than in Study 2 (58%). Hence, both studies suggest that a majority of the population is positively
disposed towards participating in the Smart Grid. The percentages are also consistent with the
general expectation that the acceptance rate will be higher when people make a hypothetical choice
than when they make a choice with real personal consequences. However, since the samples differ
substantively between the two studies – basically a representative sample in Study 1 and a
convenience sample of heat pump owners in Study 2 – the percentages are not strictly comparable.
Conclusion 7
In conclusion, we present strong evidence showing that how the request is formulated makes
a significant difference when inviting electricity consumers to become active partners in the Smart
Grid. The participation rate will be substantially higher if the default is to participate rather than to
not participate. The standard opt-in framing makes inaction the default and many people
procrastinate because they are not motivated to invest the mental effort needed to make the
decision. This means that many people refrain from signing up even if this would be in their own
best interest. If the default is to participate (i.e. opt-out), this implies that if you do nothing,
something will actually happen to you personally, and the pressure to make a decision is therefore
more personal and is felt more strongly than if the default is to not take action. Hence, we conclude
that private households’ decision about participating in the Smart Grid belongs to a class of
decisions where the opt-out approach is not only more effective, but also more ethical than the opt-
in approach.

147
Acknowledgements
We gratefully acknowledge funding for this project from Energinet.dk (project number
2010-1-10710). Further, we thank our collaborators at SEAS-NVE, NOE Energi, GreenWave
Reality, and Robert Bosch A/S (department thermo technology) for their help with the data
collection of Study 2.
References
Abadie, A., & Gay, S. (2006). The impact of presumed consent legislation on cadaveric organ
donation: A cross-country study. Journal of Health Economics, 25, 599-620.
Accenture. (2010). Understanding consumers preferences in energy efficiency.
Anderson, C. J. (2003). The psychology of doing nothing: Forms of decision avoidance result from
reason and emotion. Psychological bulletin, 129, 139-166.
Bellman, S., Johnson, E. J., & Lohse, G. L. (2001). On site: To opt-in or opt-out? : It depends on the
question. Communications of the ACM, 44, 25-27.
Bowie, N. E., & Jamal, K. (2006). Privacy rights on the internet: Self-regulation or government
regulation? Business Ethics Quarterly, 16, 323-342.
Brown, C. L., & Krishna, A. (2004). The skeptical shopper: A metacognitive account for the effects
of default options on choice. Journal of Consumer Research, 31, 529-539.
Carroll, G. D., Choi, J. J., Laibson, D., Madrian, B., & Metrick, A. (2009). Optimal defaults and
active decisions. Quarterly Journal of Economics, 124, 1639-1674.
Carroll, K. (2005). Constructing the question: Does how we ask for organs determine whether
people decide to donate? http://virtualmentor.ama-assn.org/2005/09/pdf/jdsc1-0509.pdf
Choi, J., Labison, D., C., M. B., & Metric, A. (2003). Optimal Defaults. The American Economic
Review, 93, 180-185.
Choi, S. M., & Rifon, N. J. (2002). Antecedents and consequences of web advertising credibility: A
study of consumer response to banner ads Journal of Interactive Advertising, 3, 12-24.
Cioffi, D., & Garner, R. (1996). On doing the decision: Effects of active versus passive choice on
commitment and self-perception. Personality and Social Psychology Bulletin, 22, 133-147.
Clastres, C. (2011). Smart Grids: Another step towards competition, energy security and climate
change objectives. Energy Policy, 39, 5399-5408.
Da Silva, P. G., Karnouskos, S., Griesemer, M., & Ilic, D. (2012, 18-20 June 2012). An energy
market for trading electricity in smart grid neighbourhoods. Paper presented at the 6th IEEE
International Conference on Digital Ecosystems Technologies (DEST), Campione d'Italia,
Italy.
148
English, V. (2007). Is presumed consent the answer to organ shortages? Yes. BMJ: British Medical
Journal, 334, 1088.
European Commission's Joint Research Centre. (2012). Energy efficiency status report - electricity
consumption and efficiency trends in the EU-27 In P. Bertoldi, B. Hirl & N. Labanca (Eds.),
JCR scientific and policy reports: European Commission.
European Commission. (2011). Attitudes of European citizens towards the environment Special
Eurobarometer 365/ EB 75.2. Brussels: European Commission.
Fazio, R. H., & Towles-Schwen, T. (1999). The MODE model of attitude-behavior processes. In S.
Chaiken & Y. Trope (Eds.), Dual-process theories in social psychology (pp. 97-116). New
York, US: Guilford Press.
Fiske, S. T., & Taylor, S. E. (2013). Social cognition: From brains to culture (2 ed.). London: Sage
Publications.
GWEC. (2011). Global wind report - Annual market update 2010. Brussels: Global Wind Energy
Council.
Halpern, S. D., Ubel, P. A., & Asch, D. A. (2007). Harnessing the power of default options to
improve health care. The New England Journal of Medicine, 357, 1340-1344.
Hermwille, L. (2014). Energy transformation between conflicting interests. In B. Kofler & N.
Netzer (Eds.), Towards a global energy transformation (pp. 39-56). Berlin: Friedrich-Ebert-
Stiftung.
Herrmann, A., Goldstein, D. G., Stadler, R., Landwehr, J. R., Heitmann, M., Hofstetter, R., &
Huber, F. (2011). The effect of default options on choice - Evidence from online product
configurators. Journal of Retailing and Consumer Services, 18, 483-491.
IEA. (2013). World Energy Outlook 2013: IEA.
Johnson, E. J., Bellman, S., & Lohse, G. L. (2002). Defaults, framing and privacy: Why opting in-
opting out? Marketing Letters, 13, 5-15.
Johnson, E. J., & Goldstein, D. (2003). Do defaults save lives? Science, 302, 1338-1339.
Johnson, E. J., Hershey, J., Meszaros, J., & Kunreuther, H. (1993). Framing, probability distortions,
and insurance decisions. Journal of risk and uncertainty, 7, 35-51.
Junghans, C., Feder, G., Hemingway, H., Timmis, A., & Jones, M. (2005). Recruiting patients to
medical research: Double blind randomised trial of "opt-in" versus "opt-out" strategies.
British Medical Journal, 331, 940-942.
Keller, P. A., Harlam, B., Loewenstein, G., & Volpp, K. G. (2011). Enhanced active choice: A new
method to motivate behavior change. Journal of Consumer Psychology, 21, 376-383.
Krishnamurti, T., Schwartz, D., Davis, A., Fischhoff, B., de Bruin, W. B., Lave, L., & Wang, J.
(2012). Preparing for Smart Grid technologies: A behavioral decision research approach to
understanding consumer expectations about smart meters. Energy Policy, 41, 790-797.
Lakoff, G. (2010). Why it matters how we frame the environment. Environmental Communication:
A Journal of Nature and Culture, 4, 70-81
Mah, D. N., Van der Vleuten, J. M., Hills, P., & Tao, J. (2012). Consumer perceptions of Smart
Grid development: Results of a Hong Kong survey and policy implications. Energy Policy,
49, 204-216.

149
McDaniel, P., & McLaughlin, S. (2009). Security and privacy challenges in the Smart Grid. IEEE
Security and Privacy, 7, 75-77.
Menzel, S. (2013). Are emotions to blame? — The impact of non-analytical information processing
on decision-making and implications for fostering sustainability. Ecological Economics, 96,
71-78.
Messick, D. M., & Brewer, M. B. (1983). Solving social dilemmas: A review. In L. Wheeler & P.
Shaver (Eds.), Review of personality and social psychology (pp. 11-44). Beverly Hills: Sage.
Norden. (2011). The Nordic Region – leading in green growth, report by the Nordic prime
ministers´ working group for green growth. Copenhagen, Denmark.
Park, C. W., Jun, S. Y., & MacInnis, D. J. (2000). Choosing what I want versus rejecting what I do
not want: An application of decision framing to product option choice decisions. Journal of
marketing research, 37, 187-202.
Peng, C. J., Lee, K. L., & Ingersoll, G. M. (2002). An Introduction to logistic regression analysis
and reporting. The Journal of Educational Research, 96, 3-14.
Petty, R. E., & Cacioppo, J. T. (1986). Communication and persuasion: Central and peripheral
routes to attitude change. New York: Springer Verlag.
Pichert, D., & Katsikopoulos, K. V. (2008). Green defaults: Information presentation and pro-
environmental behaviour. Journal of Environmental Psychology, 28, 63-73.
Ram, S., & Sheth, J. N. (1989). Consumer resistance to innovations: The marketing problem and its
solutions. The Journal of Consumer Marketing, 6, 5-14.
Samuelson, P. A. (1938). A Note on the pure theory of consumer's behaviour. Economica, 5, 61-71.
Sen, A. K. (1977). Rational fools: A critique of the behavioral foundations of economic theory.
Philosophy & Public Affairs, 6, 317-344.
Sovacool, B. K. (2013). Energy policymaking in Denmark: Implications for global energy security
and sustainability. Energy Policy, 61, 829-839.
Sovacool, B. K. (2014). What are we doing here? Analyzing fifteen years of energy scholarship and
proposing a social science research agenda. Energy Research & Social Science, 1, 1-29.
Stern, P. C. (2014). Individual and household interactions with energy systems: Toward integrated
understanding. Energy Research & Social Science, 1, 41-48.
Thaler, R. H., & Sunstein, C. R. (2008). Nudge. Improving decisions about health, wealth and
happiness. London, UK: Penguin Books.
Thomsen, C. J., Borgida, E., & Lavine, H. (1995). The causes and consequences of personal
involvement. In R. E. Petty & J. A. Krosnick (Eds.), Attitude strength: Antecedents and
consequences (pp. 191–214 ). Mahwah: Erlbaum.
Tversky, A., & Kahneman, D. (1991). Loss aversion in riskless choice: A reference-dependent
model. The Quarterly Journal of Economics, 106, 1039-1061.
Van Lange, P. A. M., & Joireman, J. A. (2008). How we can promote behavior that serves all of us
in the future. Social issues and policy review, 2, 127-157.
Venkatachalam, L. (2008). Behavioral economics for environmental policy. Ecological Economics,
67, 640-645.

150
Verplanken, B. (2002). Environmental concern: The key to communication effects and behavioral
change. In G. C. Bartels & W. Nelissen (Eds.), Marketing for sustainability: Towards
transactional policy-making (pp. 213-222.). Amsterdam: IOS Press.
Wissner, M. (2011). The Smart Grid – A saucerful of secrets? Applied Energy, 88, 2509-2518.
World Energy Council. (2013). 2013 world energy issues monitor. London: World Energy Council.
Wright, L. (2007). Head to Head: Is presumed consent the answer to organ shortages? No. British
Medical Journal,, 334, 1089.

151
Appendix
Example letter (neutrally framed)1

152
1 The name and address is fictitious to ensure anonymity of our participants
Figure 1A. Example of neutrally framed letter and answering slip in Study 2

153
7 CONCLUSION AND IMPLICATIONS
Creating a change towards a more flexible and sustainable power system requires
consumers’ acceptance of a new, important sustainable energy technology. Hence, this PhD
thesis has dealt with research questions that, when answered, contribute to our knowledge
about what determines diffusion of sustainable energy technologies (i.e., Smart Grid
technology) among consumers and about how to speed up diffusion.
In past research, consumers were most often studied from one specific viewpoint
regarding how they make choices and decisions. Most studies are either based on the, explicit
or implicit, assumption that consumers use System 2 (the systematic approach) when making
decisions (e.g.,Greaves, Zibarras, & Stride, 2013; Henderson & Divett, 2003), or System 1
(the automatic approach) (Brown & Krishna, 2004; Dreier, 2010; Pichert & Katsikopoulos,
2008). On this backcloth, this PhD thesis contributes a set of studies that explore consumer
behaviour under the assumption that they sometimes use System 1, at other times System 2,
or both, when choosing between options and making decisions.
The overall research question of this thesis concerns what determines the diffusion of
Smart Grid technology among private consumers and how to speed up the diffusion. This was
investigated in a large research project using a mixture of methods (depth interviews with
prospective adopters combined with a questionnaire, an online survey with representative
samples of consumers from three countries, and a field test targeting the most promising
adopter group). The output from these data collections has been analysed and presented in
three research papers that are currently at different stages of publication in international
journals. The first paper explored which consumers are most willing to adopt Smart Grid

154
technology, comparing three different household segments, and which motives and barriers
consumers see in connection with the adoption of Smart Grid technology. The second paper
investigated what private consumers’ main motivations are for acceptance of Smart Grid
technology, and the third paper dealt with how the speed of adoption of Smart Grid
technology can be optimized. Hence, the papers collectively contribute to insight into what
can positively affect the diffusion of Smart Grid technology.
The most important contribution of this PhD thesis is the increased knowledge about
consumer acceptance and behaviour in relation to the diffusion of sustainable energy
technologies and especially Smart Grid technology with remote control: an under-researched
substantive area of tremendous practical political importance. It was found that both
structural and personality characteristics influence acceptance and willingness to adopt Smart
Grid technology and that acceptance not only depends on expected individual benefits but
also the importance of personal moral norms or obligations towards society and the
environment. It was also found that in order to maximize adoption of Smart Grid technology
among private consumers, it is important how the choice is presented to them. In particular,
by using an opt-out approach where the default is to participate, utilities can significantly
increase the adoption of Smart Grid technology.
Research shows that information alone is often not enough to change consumers’
behaviour (Abrahamse, Steg, Vlek, & Rothengatter, 2005; Staats, Wit, & Midden, 1996).
However, information is indispensable for making consumers understand the benefits of the
technology, which in turn prepares the grounds for acceptance of the technology (Huijts, De
Groot, Molin, & van Wee, 2013). Understanding is still important, also after the technology
has been installed in the consumer’s home. The findings in this thesis support the use of an

155
opt-out framing to achieve a behavioural effect among private consumers (Chapter 6).
However, an opt-out frame cannot stand alone. Information about the advantages of adopting
and using the technology must accompany the question of whether the consumer wishes to
opt-out. If the right information is given, e.g., a message that strengthens consumers’ moral
obligation (including that Smart Grid technology contributes to the environment and society
and that it is not difficult to use), it is possible to motivate consumers to make a decision and
thus increase their de-facto acceptance of the technology.
Furthermore, the findings of this PhD project shows that a ‘one size fits all’ approach
does not work; consumers differ. Therefore to obtain success, marketers and others
promoting Smart Grid technology should approach consumers differently depending on their
“Smart Grid readiness”. The thesis suggests that the segment of households that are most
“Smart Grid ready” (i.e., have a heat pump or similar installed) should be approached first.
However, it is important to take account of consumers’ different innovativeness as those with
the highest innovativeness level are most likely to become early adopters of the Smart Grid
technology.
In sum, the primary contribution of this PhD thesis is suggestions for an effective
strategy to accomplish not only motivation but also behavioural change among private
consumers to accept and adopt Smart Grid technology.
7.1 Specific research paper contributions
Chapter 4 explored consumers’ willingness to adopt Smart Grid technology in an early
stage of the technology’s diffusion as well as how they perceived the technology’s relative
advantage, complexity and compatibility. In line with Arts et al. (2011), the results show that
consumers’ construal levels (i.e., perceiving the adoption decision to be a near or distant

156
future event) influences how they evaluate the technology’s characteristics. Consequently,
consumers can be segmented into how “Smart Grid ready” they are: whether or not families
had Smart Grid technology installed for trial determines how willing they are to adopt Smart
Grid technology. This is an important finding because it suggests that learning by exposure is
a promising strategy to change attitudes and behaviour. Personality was also found to
influence consumers’ willingness to adopt. In line with research on early adoption of
photovoltaics (Schelly, 2014), this study showed that consumers with interest in new
technology have a higher willingness to adopt innovations.
This has practical implications for marketers who want to promote Smart Grid
technology to consumers. That a consumer by definition is “Smart Grid ready,” i.e., has a
household appliance installed that would contribute meaningfully with flexible capacity to
the Smart Grid, does not automatically mean “mentally Smart Grid ready”. As the study
revealed, consumers without trial experience focused on the potential disadvantages of using
the technology, probably because of their low construal level. However, results from the
study indicate that consumers can overcome perceived barriers if they are given the
possibility to try the technology before adopting it (see also, Jiun-Sheng & Hsing-Chi, 2011).
The contribution of Chapter 5 is the empirical test and confirmation of a new
theoretical framework, the Responsible Technology Acceptance Model, which is based on a
combination of frameworks emphasizing “moral” and “self-interest” factors from the Norm
Activation Model and the Technology Acceptance Model respectively. Earlier studies
suggest that Personal Norms have an important role to play in the Theory of Planned
Behavior (cf., Conner & Armitage, 1998; Harland et al., 1999) as they found personal norm
to be a significant predictor of behavioural intentions, after controlling for the Theory of

157
Planned Behavior constructs. These findings imply that moral norms are a useful addition to
theoretical models where “rational” choices underlie behaviour, at least for those behaviours
where moral considerations are likely to be important. Adding Personal Norm in this study
changed the influence of the Attitude on Acceptance, which decreased when Personal Norm
was added as a predictor variable.1 This effect from the Personal Norm is in line with other
studies that have investigated the role of personal norms as a predictor of pro-environmental
behavioural intention (see Harland et al., 1999; Huijts, Molin, & van Wee, 2014; Jansson,
2010).
It is obviously not new in research on decision-making or behaviour to combine
“rational” and “normative” theoretical frameworks. That has been done many times before, as
it also appears from the cited literature. However, to the best of my knowledge, this is the
first time the Technology Acceptance Model, which was specifically developed to predict
technology acceptance and has been shown to explain technology acceptance in numerous
studies over the years (Chang, Chou, & Yang, 2010) has been combined with the Norm
Activation Model. As discussed above, the Technology Acceptance Model differs quite
substantially from competing models, such as the Theory of Planned Behavior, especially by
being more focused and therefore more parsimonious.
Another important contribution of this study is its specific combination of theoretical
models applied to explain efficiency behaviour (i.e., a behaviour that implies a single action
or behaviour change on an infrequent basis (Steg, van den Berg, & de Groot, 2012)), here
acceptance of Smart Grid technology, which has rarely been done before. Most previous
1 This is additional information to what is reported in the research paper, in chapter 5. The attitudinal
influence on Acceptance was β=.82/.94/.80 and became weaker β=.62/.57/.67 after Personal Norm was added to
the model.

158
studies on pro-environmental behaviour have focused on curtailment behaviours, that is,
behaviours that are typically performed on a frequent basis (Steg et al., 2012).
The Responsible Technology Acceptance model contributes additional value to the
study of acceptance of new technologies that mainly benefit the society, rather than the
individual decision maker, by revealing that accepting this kind of technology increases with
the individual’s personal norm or feeling of obligation to do so. To illustrate, it means that if
two individuals have equally strong intentions to adopt Smart Grid technology, the one with a
stronger feeling of moral obligation is more likely to actually adopt the technology. This is
because Smart Grid technology is primarily beneficial for the environment and society
whereas the immediate private benefits are small. Furthermore, the study found that
consumers who are most likely to accept Smart Grid technology believe that the technology
requires a minimum of effort, which it is useful and beneficial in terms of financial and/or
environmental outcomes. This is in line with the findings of Gangale et al. (2013) and
Accenture (2010) on consumers’ reasons for engaging in the Smart Grid.
The Responsible Technology Acceptance Model successfully predicted consumers’
acceptance of Smart Grid technology in three countries, explaining 63% (DK), 78% (NO),
and 64% (CH) of the variance in acceptance. The fact that the findings were validated in
three European countries suggests that the Responsible Technology Acceptance Model not
only parsimonious, but also robust, allowing future application on other technologies that are
mostly beneficial for society and/or the environment.
Chapter 6 focuses on how consumers who initially were not motivated to make a
decision about adopting Smart Grid technology (cf. Fazio & Towles-Schwen, 1999) can be
persuaded to at least make a decision. The most important result of the study is that how the

159
question is framed makes a significant difference on the acceptance rate. In line with other
studies (Bellman, Johnson, & Lohse, 2001; Johnson et al., 2002; Park, Jun, & MacInnis,
2000), the acceptance rate is found to be higher when the default is a presumed consent with
the possibility to opt-out compared to when the default is no change, with the possibility to
opt-in. Furthermore, the opt-out frame leads to the same participation rate as the one obtained
using a “neutral”, active choice frame (see also, Carroll, Choi, Laibson, Madrian, & Metrick,
2009).
How to convince consumers to adopt Smart Grid technology and become active in the
Smart Grid is a question that is gaining importance in several countries because of the
political agenda to increase the share of renewables in the grid. However, research has found
that consumers have other priorities than looking at their electricity bill and engaging in the
energy system (Harper-Slaboszewicz et al., 2011). Therefore, it is probably a reasonable
assumption that many consumers lack motivation to engage in a decision about adopting
Smart Grid technology. Hence, it is important to find a method that motivates many more
consumers to take a stance and make a decision about adoption. The fact that the opt-out and
the neutral approach in this study generated the same level of acceptance is an essential
finding, because it shows that the opt-out approach perhaps is acceptable under these
circumstances. The critics argue that the opt-out approach is manipulative, tricking people to
make a decision they would not have made if they had thought it through. However, we argue
that the fact that the opt-out approach generates the same level of acceptance as the neutral
approach shows that it motivates consumers to make an active decision, and that the
motivation stems from the personal consequence of not opting out has for them (i.e., Smart
Grid technology will be installed in their home). In principle, the neutral approach is arguably
best at making consumers make an active choice, because it leaves it to them to decide

160
without any default. However, as the second study in Chapter 6 shows, in the “real” world it
is often not possible to force people to make a choice. Thus, because it seemingly creates
sufficient motivation to make an active choice, opt-out is most effective for increasing the
speed of diffusion of Smart Grid technology. To sum up, based not only on experimental
evidence from a hypothetical setting, but also from a “real life” setting with high ecological
validity, this study contributes insight into how consumers that are sparsely intrinsically
motivated to make a decision (and therefore use System 1) can be motivated to make a
decision anyway, through clever design of the choice architecture. As such, this PhD study
contributes to an exclusive and much acclaimed stream of consumer research (Simonson et
al., 2001).
Limitations
Studying acceptance of a new innovation comes with a challenge: the innovation is so
new that it can be difficult for consumers to get an accurate picture of what the innovation is
when being asked about it. This study also revealed that even some of the consumers who
have Smart Grid technology installed (on a trial basis) were uncertain about what it did and
how it worked, indicating that this technology is a difficult and complex concept to get
acquainted with. However, the situation under which this research has been conducted is not
different from any other situation where a new technology enters the market for the first time.
Hence, the inevitable high randomness in responses regarding a new technology is a common
fate for all innovation adoption studies. In this PhD project, this challenge was targeted by
means of a combination of different research approaches with different strengths and
weaknesses and especially by using field research methods with a high ecological validity. In
Chapter 6 different methods to motivate private consumers to make a decision about adopting

161
Smart Grid technology were studied. The study has some limitations that must be addressed
and explored in future research, however. Especially, in the field experiment the neutral and
the opt-out condition differed in terms of the number of reminders that were sent out (in the
neutral condition, but not in the opt-out condition, reminders were sent out if no reply had
been received before the due date). In the opt-out condition, non-response was interpreted as
acceptance, which might underestimate the number of households that would eventually
reject to participate under that condition.
7.2 Implications
Research implications
This PhD thesis demonstrates that when studying consumers’ acceptance of new
technology, consumers’ construal level must be taken into account. In Chapter 4, different
household segments approached reasoned differently about the technology depending on their
structural readiness to adopt it. It is important consider the consumers’ construal levels when
analysing their responses in order to make correct conclusions about the findings. The results
showed that among consumers having no experience with a new technology, those perceiving
the decision about adoption to be far off in the future (i.e., being in the “intention stage”) tend
to be more positive than those who would face the decision in the near future. The high
acceptance rates obtained in the survey reported in Chapter 5 may have been inflated due to
this phenomenon: Participants in the online survey are likely to perceive the real decision
about adoption to be far off in the future, in addition to the hypothetical nature of the survey
context.
This research has laid the foundation for further consumer focused studies in the area of
Smart Grid. There is still much more to explore as the technology develops and becomes
162
more established in the minds of consumers. For instance, it is important to further
investigate more ways to overcome the perceived barriers for households that are “Smart
Grid ready” (i.e., have household appliances with highly flexible capacity) and make them
join the Smart Grid. More research is also needed to field-test messages combined with
recruitment methods to get the most valid answers possible, taking into account that this
study has shown that consumers’ reasoning about a new technology changes depending on
how close in time they experience the adoption decision to be. It seems relevant to conduct
longitudinal studies to identify the motivations and barriers in different adoption stages and
design policies and other initiatives to lower the perceived barriers for adopting Smart Grid
technology and become active in the Smart Grid.
Theoretical implications
A new theoretical framework, the Responsible Technology Acceptance Model, was
proposed to explain the acceptance of Smart Grid technology. The results indicate that a
positive attitude towards Smart Grid technology depends on it being perceived as useful and
easy to use, and when the technology is perceived to be useful and easy to use, a feeling of
moral obligation (personal norm) to accept the technology is also activated in some
consumers. Personal norms and the attitude were strong predictors of acceptance in all three
countries that the framework was tested in. This indicates that it is a robust model that can be
applied to predict acceptance of other types of sustainable technologies as well. It is
debateable whether the Responsible Technology Acceptance Model is a “new” model or just
an extension to existing ones. However, the same can be said about many well-known and
used theories for explaining behaviour and behaviour change, including the Theory of
Planned Behavior (Ajzen, 1991), the Value of Belief Norm, (Stern, Dietz, Abel, Guagnano, &

163
Kalof, 1999), and the Technology Acceptance Model (Davis, 1985). Hence, I argue, just as
researchers have done before me, that the Responsible Technology Acceptance Model is a
“new” combination of important determinants of technology acceptance in cases where the
analysed technology primarily benefits society in general whereas the private benefits are
relatively small.
Further theoretical implications of this study result from the empirical testing of the
Construal Level Theory on consumers’ willingness to become early adopters of Smart Grid
technology. The study supports the statement of this theory, viz. that consumers reason
differently depending on their distance to the event.
Implications for policy making
This research project offers important practical implications for policy makers and
other stakeholders that wish to increase acceptance and adoption of sustainable energy
technologies, specifically Smart Grid technology. First of all, policy makers should inform
the public about Smart Grid technology to increase consumer acceptance. Informing
consumers about the environmental and societal benefits of Smart Grid technology alone will
probably not create behavioural change (Ölander & Thøgersen, 2014), but it is likely to affect
consumers’ reasoning when they face the actual adoption decision, activating a feeling of
personal norms. Furthermore, the results show that it is not only the private benefits that a
matter; doing something for society as a whole is also an important motivational factor.
However, they should also take into consideration that promoting both private (financial) and
societal benefits can have unintended negative effects because mentioning economic reasons
(for adopting) can reduce consumers’ intrinsic motivation to help society (Ariely, 2008;
164
Bolderdijk, Steg, Geller, Lehman, & Postmes, 2013; Frey, Oberholzer-Gee, & Eichenberger,
1996).
Secondly, the results of this thesis suggest that if policy makers or other stakeholders
make a careful segmentation analysis to identify which consumers to approach first (i.e., in
this case consumers who are structurally Smart Grid ready and have high innovativeness), it
will positively affect the diffusion of Smart Grid technology.
Finally, if policy makers combine information campaigns with the use of an opt-out
framing, such a combined approach is likely to motivate consumers not to procrastinate, but
make a decision about adopting, and actually adopt Smart Grid technology.
Concluding remarks
This PhD thesis has contributed to knowledge about what determines diffusion of Smart Grid
technology as well as input on how the diffusion can be speeded up. Hopefully, the research
conducted for this thesis can inspire others to do research in this area to further increase
knowledge about how we can achieve a quicker diffusion of important sustainable energy
technologies, such as Smart Grid technology.
.

165
References
Abrahamse, W., & Steg, L. (2009). How do socio-demographic and psychological factors
relate to households’ direct and indirect energy use and savings? Journal of Economic
Psychology, 30, 711-720.
Abrahamse, W., Steg, L., Gifford, R., & Vlek, C. (2009). Factors influencing car use and the
intention to reduce it: A question of morality? Transportation Research Part F:
Traffic Psychology and Behaviour, 12, 317-324.
Abrahamse, W., Steg, L., Vlek, C., & Rothengatter, T. (2005). A review of intervention
studies aimed at household energy conservation. Journal of Environmental
Psychology, 25, 273-291.
Accenture. (2010). Understanding consumers preferences in energy efficiency.
Ajzen, I. (1985). From intentions to actions: A theory of planned behavior. In J. Kuhl & J.
Beckmann (Eds.), Action control (pp. 11-39): Springer Berlin Heidelberg.
Ajzen, I. (1991). The theory of planned behavior. Organizational Behavior and Human
Decision Processes, 50, 179-211.
Ajzen, I., & Fishbein, M. (1980). Understanding attitudes and predicting social behavior (1st
ed.). Englewood Cliffs, NJ: Prentice-Hall.
AlAbdulkarim, L. O. (2013). Acceptance-by-design. Elicitation of social requirements for
intelligent infrastructures. (PhD), Delft University of Technology, The Netherlands.
Anderson, C. J. (2003). The psychology of doing nothing: Forms of decision avoidance result
from reason and emotion. Psychological bulletin, 129, 139-166.
Ariely, D. (2008). Predictably irrational: The hidden forces that shape our decisions.
London, UK Harper.
Arts, J. W. C., Frambach, R. T., & Bijmolt, T. H. A. (2011). Generalizations on consumer
innovation adoption: A meta-analysis on drivers of intention and behavior.
International Journal of Research in Marketing, 28, 134-144.
Bagozzi, R. P. (1982). A field investigation of causal relations among cognitions, affect,
intentions, and behavior. Journal of marketing research, 19, 562-583.
Bandura, A. (1977). Social learning theory. Englewood Cliffs, N.J.: Prentice-Hall
Bandura, A. (1982). Self-efficacy mechanism in human agency. American Psychologist, 37,
122-147.
Belanche, D., Casaló, L. V., & Flavián, C. (2012). Integrating trust and personal values into
the Technology Acceptance Model: The case of e-government services adoption.
Cuadernos de Economía y Dirección de la Empresa, 15, 192 - 204.
Bellman, S., Johnson, E. J., & Lohse, G. L. (2001). On site: To opt-in or opt-out? : It depends
on the question. Communications of the ACM, 44, 25-27.
Beyea, J. (2010). The smart electricity grid and scientific research. Science, 328, 979–980.

166
Biegel, B., Hansen, L. H., Stoustrup, J., Andersen, P., & Harbo, S. (2014). Value of flexible
consumption in the electricity markets. Energy, 66, 354-362.
Black, J. S., Stern, P. C., & Elworth, J. T. (1985). Personal and contextual influences on
househould energy adaptations. Journal of Applied Psychology, 70, 3-21.
Blumsack, S., & Fernandez, A. (2011). Ready or not, here comes the Smart Grid! Energy, 37,
61-68.
Boesch, M. E., Vadenbo, C., Saner, D., Huter, C., & Hellweg, S. (2014). An LCA model for
waste incineration enhanced with new technologies for metal recovery and application
to the case of Switzerland. Waste Management, 34, 378-389.
Bolderdijk, J. W., Steg, L., Geller, E. S., Lehman, P. K., & Postmes, T. (2013). Comparing
the effectiveness of monetary versus moral motives in environmental campaigning.
Nature Climate Change, 3, 413-416.
Brown, C. L., & Krishna, A. (2004). The skeptical shopper: A metacognitive account for the
effects of default options on choice. Journal of Consumer Research, 31, 529-539.
California Council on Science and Technology. (2011). Health impacts of radio frequency
exposure from smart meters. Sacramento, California, US: California Council on
Science and Technology.
Carroll, G. D., Choi, J. J., Laibson, D., Madrian, B., & Metrick, A. (2009). Optimal defaults
and active decisions. Quarterly Journal of Economics, 124, 1639-1674.
Chaiken, S., & Trope, Y. (1999). Dual-process theories in social psychology. New York,
U.S.: Guilford Press.
Chang, S., Chou, C., & Yang, J. (2010). The literature review of technology acceptance
model: A study of the bibliometric distributions. Paper presented at the Pacific Asia
Conference on Information Systems, PACIS 2010 Taipei, Taiwan.
Chao, C.-W., Reid, M., & Mavondo, F. T. (2012). Consumer innovativeness influence on
really new product adoption. Australasian Marketing Journal, 20, 211-217.
Chau, P. Y. K., & Hu, P. J.-H. (2001). Information technology acceptance by individual
professionals: A model comparison approach. Decision Sciences, 32, 699-719.
Chau, P. Y. K., & Hu, P. J.-H. (2002). Investigating healthcare professionals’ decisions to
accept telemedicine technology: An empirical test of competing theories. Information
& Management, 39, 297-311.
Chen, S.-C., Li, S.-H., & Li, C.-Y. (2011). Recent related research in technology acceptance
model: A literature review. Australian Journal of Business & Management Research,
1, 124-127.
Choi, J., Laibson, D., Madrian, B., & Metrick, A. (2002). Defined contribution pensions: Plan
rules, participant decisions, and the path of least resistance. In J. M. Poterba (Ed.),
Tax Policy and the Economy (pp. 67-113). Cambridge: MIT Press.
Chuttur, M. Y. (2009). Overview of the technology acceptance model: Origins, developments
and future directions. Working Papers on Information Systems, 9. Retrieved from
http://sprouts.aisnet.org/9-37

167
Clastres, C. (2011). Smart Grids: Another step towards competition, energy security and
climate change objectives. Energy Policy, 39, 5399-5408.
Claudy, M. C., Peterson, M., & O’Driscoll, A. (2012). “I like it, but I won’t buy it”:
Exploring the attitude-behaviour gap for renewable energy adoption. Paper presented
at the 37th Macromarketing Conference, Berlin, Germany.
Conner, M., & Armitage, C. J. (1998). Extending the theory of planned behavior: a review
and avenues for further research. Journal of Applied Social Psychology, 28, 1429-
1464.
Craigie, J. (2011). Thinking and feeling: Moral deliberation in a dual-process framework.
Philosophical Psychology, 24, 53-71.
Da Silva, P. G., Karnouskos, S., Griesemer, M., & Ilic, D. (2012, 18-20 June 2012). An
energy market for trading electricity in Smart Grid neighbourhoods. Paper presented
at the 6th IEEE International Conference on Digital Ecosystems Technologies
(DEST), Campione d'Italia, Italy.
Darby, S. (2010). Smart metering: What potential for householder engagement? Building
research & information, 38, 442-457.
Davis, F. D. (1985). A technology acceptance model for empirically testing new end-user
information systems: Theory and results. Massachusetts Institute of Technology.
Retrieved from http://hdl.handle.net/1721.1/15192
Davis, F. D. (1989). Perceived usefulness, perceived ease of use, and user acceptance. MIS
Quarterly, 13, 319-340.
Davis, F. D., Bagozzi, R. P., & Warshaw, P. R. (1989). User acceptance of computer
technology: A comparison of two theoretical models. Management Science, 35, 982-
1003.
de Groot, J. I. M., & Steg, L. (2010). Morality and nuclear energy: Perceptions of risks and
benefits, personal norms, and willingness to take action related to nuclear energy. Risk
analysis, 30, 1363-1373.
Delmas, M. A., Fischlein, M., & Asensio, O. I. (2013). Information strategies and energy
conservation behavior: A meta-analysis of experimental studies from 1975 to 2012.
Energy Policy, 61, 729-739.
Dong Energy. ( 2012). Demand response - the eFlex project. Virum, Denmark.
Dreier, T. (2010). "Opt in" and "opt out" mechanisms in the internet era - towards a common
theory. Computer Law & Security Review, 26, 144-150.
ea-energianalyse.dk. (2013). READY - Heat pumps in a Smart Grid future. Retrieved 29
June 2014, from http://www.ea-energianalyse.dk/projects-english/1236-READY-heat-
pumps.html
Edenhofer O. et al. (2014). Climate change 2014: Mitigation of climate change. Working
group III contribution to the fifth assessment report of the Intergovernmental Panel on
Climate Change. UK and New York.
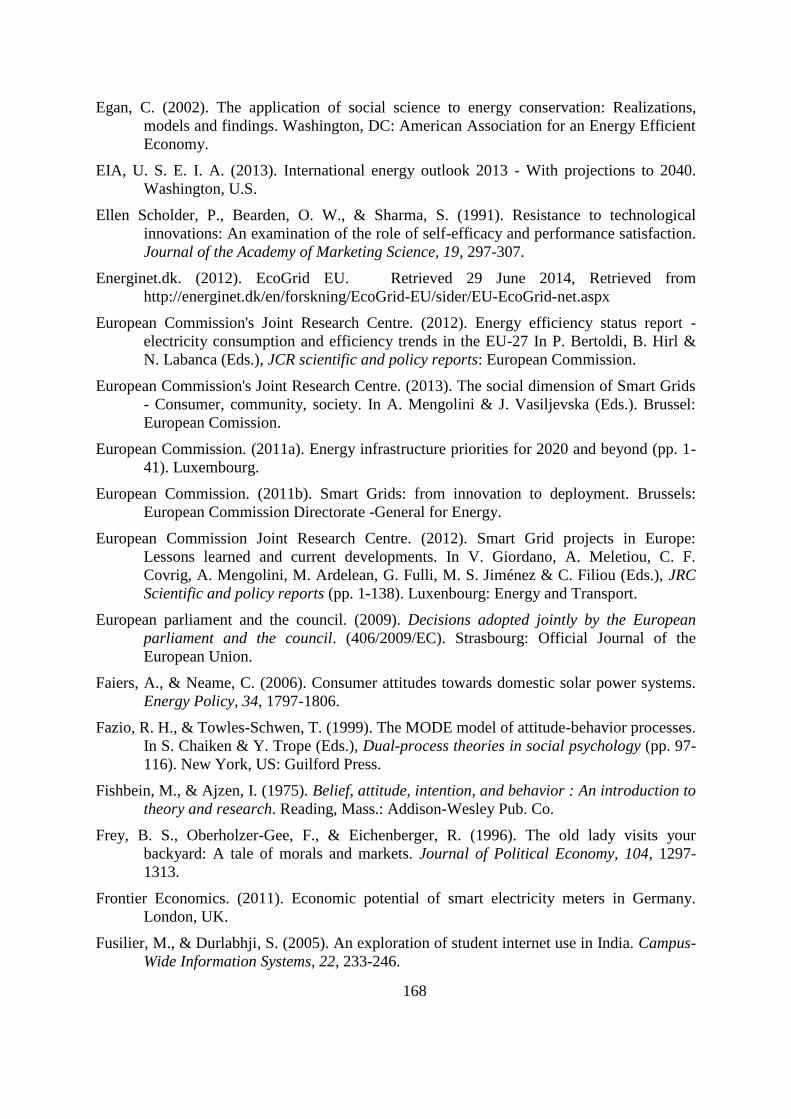
168
Egan, C. (2002). The application of social science to energy conservation: Realizations,
models and findings. Washington, DC: American Association for an Energy Efficient
Economy.
EIA, U. S. E. I. A. (2013). International energy outlook 2013 - With projections to 2040.
Washington, U.S.
Ellen Scholder, P., Bearden, O. W., & Sharma, S. (1991). Resistance to technological
innovations: An examination of the role of self-efficacy and performance satisfaction.
Journal of the Academy of Marketing Science, 19, 297-307.
Energinet.dk. (2012). EcoGrid EU. Retrieved 29 June 2014, Retrieved from
http://energinet.dk/en/forskning/EcoGrid-EU/sider/EU-EcoGrid-net.aspx
European Commission's Joint Research Centre. (2012). Energy efficiency status report -
electricity consumption and efficiency trends in the EU-27 In P. Bertoldi, B. Hirl &
N. Labanca (Eds.), JCR scientific and policy reports: European Commission.
European Commission's Joint Research Centre. (2013). The social dimension of Smart Grids
- Consumer, community, society. In A. Mengolini & J. Vasiljevska (Eds.). Brussel:
European Comission.
European Commission. (2011a). Energy infrastructure priorities for 2020 and beyond (pp. 1-
41). Luxembourg.
European Commission. (2011b). Smart Grids: from innovation to deployment. Brussels:
European Commission Directorate -General for Energy.
European Commission Joint Research Centre. (2012). Smart Grid projects in Europe:
Lessons learned and current developments. In V. Giordano, A. Meletiou, C. F.
Covrig, A. Mengolini, M. Ardelean, G. Fulli, M. S. Jiménez & C. Filiou (Eds.), JRC
Scientific and policy reports (pp. 1-138). Luxenbourg: Energy and Transport.
European parliament and the council. (2009). Decisions adopted jointly by the European
parliament and the council. (406/2009/EC). Strasbourg: Official Journal of the
European Union.
Faiers, A., & Neame, C. (2006). Consumer attitudes towards domestic solar power systems.
Energy Policy, 34, 1797-1806.
Fazio, R. H., & Towles-Schwen, T. (1999). The MODE model of attitude-behavior processes.
In S. Chaiken & Y. Trope (Eds.), Dual-process theories in social psychology (pp. 97-
116). New York, US: Guilford Press.
Fishbein, M., & Ajzen, I. (1975). Belief, attitude, intention, and behavior : An introduction to
theory and research. Reading, Mass.: Addison-Wesley Pub. Co.
Frey, B. S., Oberholzer-Gee, F., & Eichenberger, R. (1996). The old lady visits your
backyard: A tale of morals and markets. Journal of Political Economy, 104, 1297-
1313.
Frontier Economics. (2011). Economic potential of smart electricity meters in Germany.
London, UK.
Fusilier, M., & Durlabhji, S. (2005). An exploration of student internet use in India. Campus-
Wide Information Systems, 22, 233-246.

169
Gangale, F., Mengolini, A., & Onyeji, I. (2013). Consumer engagement: An insight from
Smart Grid projects in Europe. Energy Policy, 60, 621-628.
Garcia, R., Bardhi, F., & Friedrich, C. (2007). Overcoming consumer resistance to
innovation. MIT Sloan Management Review, 48, 82.
Gatignon, H., & Robertson, T. S. (1985). A propositional inventory for new diffusion
research. Journal of Consumer Research, 11, 849-867.
Gefen, D., Karahanna, E., & Straub, D. W. (2003). Trust and TAM in online shopping: An
integrated model. MIS Quarterly, 27, 51-90.
Geller, H. (2003). Energy revolution: Policies for a sustainable future. Washington, DC, US:
Island Press.
Greaves, M., Zibarras, L. D., & Stride, C. (2013). Using the theory of planned behavior to
explore environmental behavioral intentions in the workplace. Journal of
Environmental Psychology, 34, 109-120.
Greenwave Reality systems. (2012). Published in an information folder to SEAS-NVE
customers. Denmark: SEAS-NVE.
Guagnano, G., Hawkes, G. R., Acredolo, C., & White, N. (1986). Innovation perception and
adoption of solar heating technology. Journal of Consumer Affairs, 20, 48-64.
Gärling, A., & Thøgersen, J. (2001). Marketing of electric vehicles. Business Strategy & the
Environment, 10, 53-65.
Haidt, J. (2001). The emotional dog and its rational tail: A social intuitionist approach to
moral judgment. Psychological review, 108, 814-834.
Hamilton, B. A. (2010). Understanding the benefits of the Smart Grid - Smart Grid
implementation strategy. In B. A. Hamilton, J. Miller & B. Renz (Eds.). United
States: United States Department of Energy’s National Energy Technology
Laboratory.
Hargreaves, T., Nye, M., & Burgess, J. (2010). Making energy visible: A qualitative field
study of how householders interact with feedback from smart energy monitors.
Energy Policy, 38, 6111-6119.
Harland, P., Staats, H. J., & Wilke, H. A. M. (1999). Explaining proenvironmental intention
and behavior by personal norms and the theory of planned behavior. Journal of
Applied Social Psychology, 29, 2505 - 2528.
Harland, P., Staats, H. J., & Wilke, H. A. M. (2007). Situational and personality factors as
direct or personal norm mediated predictors of pro-environmental behavior: Questions
derived from norm-activation theory. Basic and Applied Social Psychology, 29, 323-
334.
Harper-Slaboszewicz, P., McGregor, T., & Sunderhauf, S. (2011). Customer View of Smart
Grid—Set and Forget? In F. P. Sioshansi (Ed.), Smart grid: integrating renewable,
distributed & efficient energy (pp. 371-395). St. Louis, US: Academic Press.
Hartwick, J., & Barki, H. (1994). Explaining the role of user participation in information
system use. Management Science, 40, 440-465.

170
Hedges, A. (1991). Attitudes to energy conservation in the home - Report on a qualitative
study. London, UK.
Henderson, R., & Divett, M. J. (2003). Perceived usefulness, ease of use and electronic
supermarket use. International Journal of Human-Computer Studies, 59, 383-395.
Hermwille, L. (2014). Energy transformation between conflicting interests. In B. Kofler & N.
Netzer (Eds.), Towards a global energy transformation (pp. 39-56). Berlin: Friedrich-
Ebert-Stiftung.
Hoyer, W. D., & MacInnis, D. J. (2006). Consumer Behaviour (4 ed.). Boston, MA.:
Houghton Mifflin.
Huijts, N. M. A., De Groot, J. I. M., Molin, E. J. E., & van Wee, B. (2013). Intention to act
towards a local hydrogen refueling facility: Moral considerations versus self-interest.
Transportation Research Part A: Policy and Practice, 48, 63-74.
Huijts, N. M. A., Molin, E. J. E., & Steg, L. (2012). Psychological factors influencing
sustainable energy technology acceptance: A review-based comprehensive
framework. Renewable and Sustainable Energy Reviews, 16, 525-531.
Huijts, N. M. A., Molin, E. J. E., & van Wee, B. (2014). Hydrogen fuel station acceptance: A
structural equation model based on the technology acceptance framework. Journal of
Environmental Psychology, 38, 153-166.
Hunecke, M., Blöbaum, A., Matthies, E., & Höger, R. (2001). Responsibility and
environment: Ecological norm orientation and external factors in the domain of travel
mode choice behavior. Environment and Behavior, 33, 830-852.
IEA. (2011). Smart Grid - Smart customer policy needs: International Energy Agency.
Jackson, J. D., Yi, M. Y., & Park, J. S. (2013). An empirical test of three mediation models
for the relationship between personal innovativeness and user acceptance of
technology. Information & Management, 50, 154-161.
Jackson, T. (2005). Motivating sustainable consumption a review of evidence on consumer
behaviour and behavioural change. Surrey, UK: Centre for Environmental Strategy.
Jager, W. (2006). Stimulating the diffusion of photovoltaic systems: A behavioural
perspective. Energy Policy, 34, 1935-1943.
Jansson, J., Marell, A. , Nordlund, A. (2010). Green consumer behavior: Determinants of
curtailment and eco-innovation adoption. Journal of Consumer Marketing, 27, 358 -
370.
Jiun-Sheng, C. L., & Hsing-Chi, C. (2011). The role of technology readiness in self-service
technology acceptance. Managing Service Quality, 21, 424-444.
Johnson, E. J., Bellman, S., & Lohse, G. L. (2002). Defaults, framing and privacy: Why
opting in-opting out? Marketing Letters, 13, 5-15.
Johnson, E. J., & Goldstein, D. (2003). Do defaults save lives? Science, 302, 1338-1339.
Kahneman, D. (2011). Thinking, fast and slow. London, UK: Allen Lane.

171
Karytsas, S., & Theodoropoulou, H. (2014). Public awareness and willingness to adopt
ground source heat pumps for domestic heating and cooling. Renewable and
Sustainable Energy Reviews, 34, 49-57.
Kaufmann, S., Künzel, K., & Loock, M. (2013). Customer value of smart metering:
Explorative evidence from a choice-based conjoint study in Switzerland. Energy
Policy, 53, 229-239.
Knabe, A. (2012). Applying ajzen's theory of planned behavior to a study of online course
adoption in public relations education. Marquette University, Milwaukee, Wisconsin.
Retrieved from http://epublications.marquette.edu/dissertations_mu/186 (Paper 186)
Kotler, P., & Roberto, E. L. (1989). Social marketing. Strategies for changing public
behavior New York: The Free Press.
Krishnamurti, T., Schwartz, D., Davis, A., Fischhoff, B., de Bruin, W. B., Lave, L., & Wang,
J. (2012). Preparing for Smart Grid technologies: A behavioral decision research
approach to understanding consumer expectations about smart meters. Energy Policy,
41, 790-797.
Lehman, P. K., & Geller, E. S. (2004). Behavior analysis and environmental protection:
Accomplishments and potential for more. Behavior and Social Issues, 13, 13-32.
Loock, C.-M., Staake, T., & Thiesse, F. (2013). Motivating energy-efficient behavior with
green IS: An investigation of goal setting and the role of defaults. MIS Quarterly, 37,
1313-1332.
Mármol, F. G., Sorge, C., Ugus, O., & Pérez, G. M. (2012). Do not snoop my habits:
Preserving privacy in the Smart Grid. Communications Magazine, IEEE, 50, 166-172.
Mathieson, K. (1991). Predicting user intentions: comparing the technology acceptance
model with the theory of planned behavior. Information Systems Research, 2, 173-
191.
Miles, M. B., Huberman, A. M., & Saldaña, J. (2013). Qualitative data analysis; a methods
sourcebook (3 ed.). Portland, United States: Sage Publications.
Moll, J. C. A., de Oliveira-Souza, R., & Eslinger, P. J. (2003). Morals and the human brain:
A working model. Neuroreport, 14, 299-305.
Moore, G. C. (1987). End user computing and office automation: A diffusion of innovations
perspective. Infor, 25, 214-235.
Nordlund, A. M., & Garvill, J. (2003). Effects of values, problem awareness, and personal
norm on willingness to reduce personal car use. Journal of Environmental
Psychology, 23, 339-347.
Olson, M. A., & Fazio, R. H. (2009). Implicit and explicit measures of attitudes: The
perspective of the MODE model In R. E. Petty, R. H. Fazio & P. Briñol (Eds.),
Attitudes: Insights from the new implicit measures. New York Psychology Press.
Paetz, A.-G., Dütschke, E., & Fichtner, W. (2012). Smart homes as a means to sustainable
energy consumption: A study of consumer perceptions. Journal of Consumer Policy,
35, 23-41.

172
Park, C. W., Jun, S. Y., & MacInnis, D. J. (2000). Choosing what I want versus rejecting
what I do not want: An application of decision framing to product option choice
decisions. Journal of marketing research, 37, 187-202.
Pichert, D., & Katsikopoulos, K. V. (2008). Green defaults: Information presentation and
pro-environmental behaviour. Journal of Environmental Psychology, 28, 63-73.
Rao, K. U., & Kishore, V. V. N. (2010). A review of technology diffusion models with
special reference to renewable energy technologies. Renewable and Sustainable
Energy Reviews, 14, 1070-1078.
Rogers, E. M. (2002). Diffusion of preventive innovations. Addictive Behaviors, 27, 989-993.
Rogers, E. M. (2003). Diffusion of innovations (5 ed.). New York, USA: Free Press.
Rogers, E. M. (2004). A prospective and retrospective look at the diffusion model. Journal of
Health Communication, 9 13-19.
Scarpa, R., & Willis, K. (2010). Willingness-to-pay for renewable energy: Primary and
discretionary choice of British households' for micro-generation technologies. Energy
Economics, 32, 129-136.
Schelly, C. (2014). Residential solar electricity adoption: What motivates, and what matters?
A case study of early adopters. Energy Research & Social Science, 2, 183–191.
Schiffman, L. G., Kanuk, L. L., & Hansen, H. (2012). Consumer behaviour: A European
outlook (2 ed.). Harlow, U.K. : Pearson.
Schwartz, S. H. (1977). Normative influences on altruism. In B. Leonard (Ed.), Advances in
experimental social psychology (pp. 221-279): by Academic Press.
Schwartz , S. H., & Howard, J. A. (1981). A normative decision-making model of altruism.
In J. P. Rushton & R. M. Sorrentine (Eds.), Altruism and helping behaviour: Social,
personality, and developmental perspectives (pp. 189-211). Hillsdale, NJ: Lawrence
Erlbaum.
Seljom, P., Rosenberg, E., Fidje, A., Haugen, J. E., Meir, M., Rekstad, J., & Jarlset, T.
(2011). Modelling the effects of climate change on the energy system—A case study
of Norway. Energy Policy, 39, 7310-7321.
Simon, H. A. (1996). The sciences of the artificial (3 ed.). Cambrige, Massachusetts: MIT
Press.
Simonson, I., Carmon, Z., Dhar, R., & Drolet, A. (2001). Consumer research: In search of
identity. Annual Review of Psychology, 52, 249-275.
Sovacool, B. K. (2013). Energy policymaking in Denmark: Implications for global energy
security and sustainability. Energy Policy, 61, 829-839.
Sovacool, B. K. (2014). What are we doing here? Analyzing fifteen years of energy
scholarship and proposing a social science research agenda. Energy Research &
Social Science, 1, 1-29.
Stamm, K. R., Clark, F., & Eblacas, P. R. (2000). Mass communication and public
understanding of environmental problems: The case of global warming. Public
undestanding of science, 9, 219-237.

173
Steel, P. (2007). The nature of procrastination: A meta-analytic and theoretical review of
quintessential self-regulatory failure. Psychological bulletin, 133, 65-94.
Steg, L. (2008). Promoting household energy conservation. Energy Policy, 36, 4449-4453.
Steg, L., & de Groot, J. (2010). Explaining prosocial intentions: Testing causal relationships
in the norm activation model. British journal of social psychology, 49, 725-743.
Steg, L., van den Berg, A. E., & de Groot, J. I. M. (2012). Environmental Psychology : An
Introduction Retrieved from http://asb.eblib.com/patron/FullRecord.aspx?p=888149
Stern, P. C. (2000). New environmental theories: Toward a coherent theory of
environmentally significant behavior. Journal of Social Issues, 56, 407-424.
Stern, P. C. (2014). Individual and household interactions with energy systems: Toward
integrated understanding. Energy Research & Social Science, 1, 41-48.
Stern, P. C., Dietz, T., Abel, G. A., Guagnano, G. A., & Kalof, L. (1999). A value-belief-
norm theory of support for social movements: The case of environmentalism. Human
Ecology review, 6, 81-97.
Staats, H. J., Wit, A. P., & Midden, C. Y. H. (1996). Communicating the greenhouse effect to
the public: Evaluation of a mass media campaign from a social dilemma perspective.
Journal of Environmental Management, 46, 189-203.
Sunstein, C. R., & Reisch, L. A. (2014). Automatically green: Behavioral economics and
environmental protection. Harvard Environmental Law Review, 38, 127-158.
Sunstein, C. R., & Thaler, R. H. (2003). Libertarian paternalism is not an oxymoron.
University of Chicago Law Review, Forthcoming.
Taylor, S., & Todd, P. A. (1995). Understanding information technology usage: A test of
competing models. Information Systems Research, 6, 144-176.
Thaler, R. H., & Sunstein, C. R. (2008). Nudge. Improving decisions about health, wealth
and happiness. London, UK: Penguin Books.
The Danish Ministry of Climate and Energy. (2011). Energy strategy 2050 - from coal, oil
and gas to green energy.
The Smart Grids task force. (2010). European task force for the implementation of Smart
Grids into the European internal market - mission and work programme.
http://ec.europa.eu/energy/gas_electricity/smartgrids/doc/mission_and_workprogram
me.pdf
Thomsen, C. J., Borgida, E., & Lavine, H. (1995). The causes and consequences of personal
involvement. In R. E. Petty & J. A. Krosnick (Eds.), Attitude strength: Antecedents
and consequences (pp. 191–214 ). Mahwah: Erlbaum.
Throne-Holst, H., Strandbakken, P., & Stø, E. (2008). Identification of households' barriers to
energy saving solutions. Management of Environmental Quality: An International
Journal, 19, 55-66.
Thøgersen, J. (1999). The ethical consumer. Moral norms and packaging choice. Journal of
Consumer Policy, 22, 439-460

174
Thøgersen, J. (2008). Social norms and cooperation in real-life social dilemmas. Journal of
Economic Psychology, 29, 458-472.
Thøgersen, J. (2014). Improsume. Retrieved 15 June 2014, from
http://badm.au.dk/research/research-groups/marketing-and-
sustainability/projects/ongoing-projects/improsume/
Toka, A., Iakovou, E., Vlachos, D., Tsolakis, N., & Grigoriadou, A.-L. (2014). Managing the
diffusion of biomass in the residential energy sector: An illustrative real-world case
study. Applied Energy, 129, 56-69.
Tornatzky, L. G., & Klein, K. J. (1982). Innovation characteristics and innovation adoption
implementation: A meta-analysis of findings. IEEE Transactions on Engineering
Management, 29, 29-43.
Trope, Y., & Liberman, N. (2003). Temporal construal. Psychological review, 110, 403-421.
United Nations Framework Convention on Climate Change. (2014). Kyoto Protocol.
Retrieved 10 august, 2014, from http://unfccc.int/kyoto_protocol/items/2830.php
Verplanken, B. (2002). Environmental concern: The key to communication effects and
behavioral change. In G. C. Bartels & W. Nelissen (Eds.), Marketing for
sustainability: Towards transactional policy-making (pp. 213-222.). Amsterdam: IOS
Press.
Williams, Y. (2014). Ecological validity in psychology: Definition, lesson & quiz. Retrieved
1 august 2014, from http://education-portal.com/academy/lesson/ecological-validity-
in-psychology-definition-lesson-quiz.html#lesson
Wissner, M. (2011). The Smart Grid – A saucerful of secrets? Applied Energy, 88, 2509-
2518.
Wolsink, M. (2012). The research agenda on social acceptance of distributed generation in
smart grids: Renewable as common pool resources. Renewable and Sustainable
Energy Reviews, 16, 822-835.
World Energy Council. (2013). 2013 world energy issues monitor. London: World Energy
Council.
Wu, I.-L., & Chen, J.-L. (2005). An extension of trust and TAM model with TPB in the
initial adoption of on-line tax: An empirical study. International Journal of Human-
Computer Studies, 62, 784-808.
Ölander, F., & Thøgersen, J. (2014). Informing versus nudging in environmental policy.
Journal of Consumer Policy, 37, 341 - 356.