construction seta - masterbuilders.org.za 2... · ceta sector skills plan for the construction...
TRANSCRIPT

1
CONSTRUCTION SETA

CETA Sector Skills Plan for the Construction Industry
Skills Perspective
Friday 02 September 2016, Durban ICC Hall 5 (10:15-10:45)
Thapelo Madibeng: Core Business Executive -CETA
“CLEAN AUDIT-ONE MORE BRICK IN THE RECONSTRUCTION AND EXPANSION OF THE CETA”

3
Strategic Overview of the CETA
Research Process and Methods
Chapter 1: Sector Profile(an overview of the sector economic, social and labour)
Chapter 2: Key Skills Issues(drivers of change, key skills issues impacting on economic performance)
Chapter 3: Extent of Skills Mismatches(imbalances on skills supply and demand)
Chapter 4: Sector Partnerships(who do we work with and why)
Chapter 5 Skills Priority Actions(what must we do)
www.limp.org.za, www.ceta.org.za www.dhet.gov.za
THE SSP HAS BEEN STRUCTURED AS FOLLOWS:
“CLEAN AUDIT-ONE MORE BRICK IN THE RECONSTRUCTION AND EXPANSION OF THE CETA”

4
VISION
To be a firm pillar of skills for all in construction and nation-building
MISSION
To create a solid skills base as a foundation for infrastructural development and economic
empowerment
VALUES
• Responsiveness
• Respect
• Integrity
• Professionalism
ESTABLISHMENT OF THE CETAThe Construction Education and Training Authority (CETA) is a Schedule 3A public entity which was
established as a SETA under Skills Development Act, 1998 by the Minister of Labour on 20 March 2000. In
2010, all SETAs’ functions were transferred to the Department of Higher Education and Training (DHET),
which resulted in the CETA subsequently being re-established by the Minister of Higher Education and
Training with its current licensing period expiring on 31 March 2018. CETA CFO has addressed 111th MBSA
congress on 01 Sep 2016 regarding the new SETA Landscape post March 2018.
STRATEGIC OVERVIEW OF THE CETA
“CLEAN AUDIT-ONE MORE BRICK IN THE RECONSTRUCTION AND EXPANSION OF THE CETA”

5
WHY DO WE EXIST AS THE CONSTRUCTION SETA?
• The mandate of the CETA is to facilitate and fund skills development in the construction sector
in South Africa
• Extended National Skills Development Strategy (NSDS) III, CETA Sector Skills Plan (SSP);
Strategic Plan and Annual Performance Plans
The CETA therefore is responsible for:
• Review, development and registration of qualifications;
• Accreditation of providers and the registration of practitioners;
• The implementation of quality assurance processes that will enhance and ensure quality
provision of training;
• Funding of critical and scarce skills in the sector through the allocation of discretionary grants;
• The disbursements of mandatory grants based on the submission of Workplace Skills Plans
(WSPs) and Annual Training Reports (ATRs) by levy paying companies in the construction
sector.
STRATEGIC OVERVIEW OF THE CETA: MANDATE
“CLEAN AUDIT-ONE MORE BRICK IN THE RECONSTRUCTION AND EXPANSION OF THE CETA”

6
% ALLOCATION OF LEVIES
“CLEAN AUDIT-ONE MORE BRICK IN THE RECONSTRUCTION AND EXPANSION OF THE CETA”
SETAs are financed from the skills development levy which is paid and distributed as follows as prescribed in the Grants Regulations and Skills Development Levies Act: % levies distribution as per the Gazette 35940 of SETA Grant Regulations of 03 December 2012, the new levy grants system guiding the CETA funding model:
Levy Grant system Element Allocation % Conditions
Total levy 100% 1% of Remuneration Costs
SARS Collection Fee 2.0% Maximum of 2%
NSF Administration 18% % prescribed by Minister
SETA Administration 10.5% Maximum of 0.5% is transferred by the CETA to QCTO
Mandatory Grant 20%
Unclaimed Mandatory Grants are transferred to
Discretionary Grants by 15 August
Discretionary Grant 49.5%Maximum of 80% is allocated by CETA to PIVOTAL and
20% to NON-PIVOTAL.

7
1: Desktop Research: (delving into and analysing secondary research sources)
2: Quantitative Research: (analysing and interpreting formal statistics)
3: Field Research (focus groups and interviews)
4: Action Research (data gathered as a source of intelligence leading to further analysis)
RESEARCH PROCESS:• The SSP Research is a continuous process commencing immediately after
submission for the next update. Stakeholders are invited to participate in this
review process.
• White Paper on Post School Education and Training System (PSET) & new
proposed SETA landscape emphasizes credible research to inform skills planning
and funding allocation.
• Labour market information intelligence project - LMIP
SSP RESEARCH WAS EXECUTED USING 4 METHODS:
“CLEAN AUDIT-ONE MORE BRICK IN THE RECONSTRUCTION AND EXPANSION OF THE CETA”

8
CHAPTER 1: SECTOR PROFILE
“CLEAN AUDIT-ONE MORE BRICK IN THE RECONSTRUCTION AND EXPANSION OF THE CETA”

9
CETA covers 72 SIC codes grouped under 4 sub-sectors representing 49 161 employers
• 1 Consolidated SSP for the Construction Sector.
• Regrouping or reclassification of the Codes per subsector
• OFO changes or new occupations – Industry OFO Workshop – WSP Feb 2016 (SDF)
* Registered with CETA as at 2016
** Includes Electrical Construction Contractors
CATEGORY # SIC CODES # EMPLOYERS*
Building Construction 13 10 461
Built Environment Professionals 16 7300
Roads and Civil Construction 27 27 553**
Materials Manufacturing 16 3 847
SIZE OF THE CONSTRUCTION SECTOR(By 4 Main Subsectors, Standard Industry Classification (SIC) Codes and CETA
registered Employers)
“CLEAN AUDIT - ONE MORE BRICK IN THE ONGOING RECONSTRUCTION AND EXPANSION OF THE CETA”
10
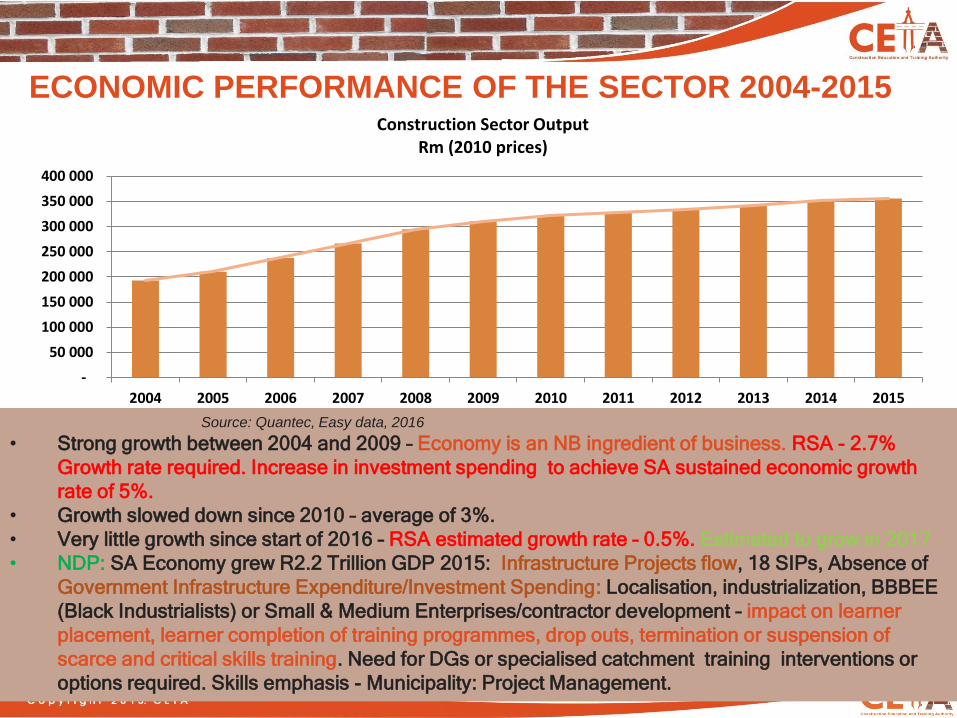
Source: Quantec, Easy data, 2016
• Strong growth between 2004 and 2009 – Economy is an NB ingredient of business. RSA - 2.7%
Growth rate required. Increase in investment spending to achieve SA sustained economic growth
rate of 5%.
• Growth slowed down since 2010 – average of 3%.
• Very little growth since start of 2016 – RSA estimated growth rate – 0.5%. Estimated to grow in 2017
• NDP: SA Economy grew R2.2 Trillion GDP 2015: Infrastructure Projects flow, 18 SIPs, Absence of
Government Infrastructure Expenditure/Investment Spending: Localisation, industrialization, BBBEE
(Black Industrialists) or Small & Medium Enterprises/contractor development – impact on learner
placement, learner completion of training programmes, drop outs, termination or suspension of
scarce and critical skills training. Need for DGs or specialised catchment training interventions or
options required. Skills emphasis - Municipality: Project Management.
-
50 000
100 000
150 000
200 000
250 000
300 000
350 000
400 000
2004 2005 2006 2007 2008 2009 2010 2011 2012 2013 2014 2015
Construction Sector OutputRm (2010 prices)
ECONOMIC PERFORMANCE OF THE SECTOR 2004-2015

11
Source :BIM 2016
• It is anticipated that most investment will happen in Mpumalanga, followed
by KZN and Limpopo
• Gauteng is expected to only attract 11% of investment
PROVINCIAL DISTRIBUTION OF INFRASTRUCTURE INVESTMENT
Gauteng11%
Limpopo22%
Mpumalanga37%
North West0%
KwaZulu-Natal16%
Eastern Cape4%
Western Cape6%
Northern Cape4%
Free State0%

12
• Grade 1 and 2 employers can be regarded as small and emerging entities • This is further amplified by CETA WSP data that the majority of firms fall within the micro to small
category – 97%• SSP Implication: micro, small enterprises do not pay levies, no MG disbursements and therefore
dependent on discretionary grants for training interventions; technical training, contractor development programmes, Interdependencies exists.
• Sustained small or emerging contractors that are expanding to provide more opportunities for employment, workplace training for learners.
• Contractor Development Programme – No formalised Programme and certification –CIDB -Individual vs entity skills development approach, Skills Standard – implementation? NC: Construction Contracting, NQF Level 2, CETA provide learning materials to providers – accreditation of training providers.
EMPLOYERS IN THE CONSTRUCTION SECTOR BY GRADING CATEGORY
Category Grade 1 Grade 2 Grade 3 Grade 4 Grade 5 Grade 6 Grade 7 Grade 8 Grade 9
TenderValue Limit(R)
200 000 500 000 2 mil 4 mil 6.5 mil 13 mil 40 mil 130 mil >130 mil
# Reg. 136 138 5 797 2 336 2 887 1 891 2 159 1229 459 216
% of Tot. 89% 3.8% 1.5% 1.9% 1.2% 1.4% 0.8% 0.3% 0.1%

13
CONSTRUCTION EMPLOYERS SUBMITTING WSP-ATR TO THE CETA
PROVINCE TOTAL STAKEHOLDERS IN ATTENDANCE
KwaZulu Natal 20
Free-State 6
Eastern Cape 23
Northern Cape 10
Western Cape 29
Limpopo 13
Gauteng 73
North West 21
Mpumalanga 22
The CETA trained 217 Skills Development Facilitators (SDFs) in the compilation and submission of their WSPs and ATRs. The training was done through capacity building workshops which were conducted in all nine (9) provinces.

14
EMPLOYMENT IN THE CONSTRUCTION SECTOR
200
400
600
800
1 000
1 200
1 400
1 600
Jan
-Mar
20
08
Ap
r-Ju
n 2
00
8
Jul-
Sep
20
08
Oct
-Dec
20
08
Jan
-Mar
20
09
Ap
r-Ju
n 2
00
9
Jul-
Sep
20
09
Oct
-Dec
20
09
Jan
-Mar
20
10
Ap
r-Ju
n 2
01
0
Jul-
Sep
20
10
Oct
-Dec
20
10
Jan
-Mar
20
11
Ap
r-Ju
n 2
01
1
Jul-
Sep
20
11
Oct
-Dec
20
11
Jan
-Mar
20
12
Ap
r-Ju
n 2
01
2
Jul-
Sep
20
12
Oct
-Dec
20
12
Jan
-Mar
20
13
Ap
r-Ju
n 2
01
3
Jul-
Sep
20
13
Oct
-Dec
20
13
Jan
-Mar
20
14
Ap
r-Ju
n 2
01
4
Jul-
Sep
20
14
Oct
-Dec
20
14
Jan
-Mar
20
15
Ap
r-Ju
n 2
01
5
Jul-
Sep
20
15
Oct
-Dec
20
15
Jan
-Mar
20
16
Source : StatsSA QLFS, Q1 of 2016
• From 2012 to the second quarter 2015 employment was growing strongly• As from third quarter 2015 a gradual decline in employment• An alarmingly sharp decline as from first quarter 2016• SA elevated unemployment rate – 35%

15
GENDER DISTRIBUTION OF EMPLOYEES
0%
10%
20%
30%
40%
50%60%
70%
80%
90%
100%
Jan
-Mar
20
08
Ap
r-Ju
n 2
00
8
Jul-
Sep
20
08
Oct
-Dec
20
08
Jan
-Mar
20
09
Ap
r-Ju
n 2
00
9
Jul-
Sep
20
09
Oct
-Dec
20
09
Jan
-Mar
20
10
Ap
r-Ju
n 2
01
0
Jul-
Sep
20
10
Oct
-Dec
20
10
Jan
-Mar
20
11
Ap
r-Ju
n 2
01
1
Jul-
Sep
20
11
Oct
-Dec
20
11
Jan
-Mar
20
12
Ap
r-Ju
n 2
01
2
Jul-
Sep
20
12
Oct
-Dec
20
12
Jan
-Mar
20
13
Ap
r-Ju
n 2
01
3
Jul-
Sep
20
13
Oct
-Dec
20
13
Jan
-Mar
20
14
Ap
r-Ju
n 2
01
4
Jul-
Sep
20
14
Oct
-Dec
20
14
Jan
-Mar
20
15
Ap
r-Ju
n 2
01
5
Jul-
Sep
20
15
Oct
-Dec
20
15
Jan
-Mar
20
16
Female Male
Source : StatsSA QLFS, Q1 of 2016
• Vast majority of employees are male (±𝟖𝟖%)• Marginal growth in female employees – from 9% in 2008 to 12% in 2016
• Vast majority of employees are male (±88%)• Marginal growth in female employees – from 9% in 2008 to 12% in 2016. United Nations Sustainable Goal No.
5 “Gender Equality” – 50-50 target female representivity at all occupational levels.• Transformation makes business sense, diverse workforce -16th Employment Equity Report shows
improvement in representation of women in top management. 51.2% white males terminated at Top Management re-enter through recruitment – 42,1%, not lost in the system but come back to different organisations at the same level.
• Trends in Skills Development is dissapointing at Top/Senior Management: white group benefitted from skills development (males – 47.7% and females - 13.4%) - preferential treatment to white group at the expense of designated group in terms of skills development.

16
Source : CETA WSP submissions, 2016
• Low, mid-level and unskilled occupations – 70% of workforce• Similar to South African profile – 46%semi-skilled and 29% low/unskilled• 65% employed in the construction sub-sector
MAJOR OCCUPATIONAL GROUPS PER SUB-SECTOR
OFO Major Category Building sector
Built Environment Professions
Construction Materials Manufacturing
Total
Clerical support workers 957 2960 9198 1531 15071
Elementary occupations 8078 3511 62383 13460 90990
Managers 2165 3339 14306 1825 22070
Plant and machine operators and assemblers
2161 1355 19789 6276 30820
Professionals 728 9014 8392 492 19273
Service and sales workers 306 563 2329 439 3655
Skilled agricultural, forestry, fishery, craft and related trades workers
4679 2496 23657 2710 33995
Technicians and associate professionals
1452 6280 17193 2042 27753
Total 20526 29518 157247 28775 243627

17
A SWOT ANALYSIS OF THE CONSTRUCTION SECTORStrengths Weaknesses
Recovery from economic slump evident-InfrastructureInvestment - NDP
Business rescue plan has helped some companiessurvive closure
Strong research culture among industry bodies Inter-dependencies between small and large companies
means they can sustain each other
Reliance on government for work and poor spendingrecord of government negatively affects work flow
Many small companies do not pay levies Capital outlay prior to payment for work Large informal sector Project by project work means no benefits for workers
& casualization of labour Slow transformation within built environment industry
Opportunities Threats
SIPs spending pegged at R4 trillion over the next 15years. Public and Private Infrastructure
Poor maintenance culture by government(particularlyat municipal level) of roads, and buildings(infrastructure)leads to work
Large companies have opportunities for expansioninternationally and regionally within SADC and rest ofAfrica through inter-Africa investment: PIDA –Programme for Infrastructure Development in Africa
Contractor development programmes can uplift lowergraded contractors and also focus on the developmentof rural contractors to position them for SIPs
Sector growth partly depends on economic growth andstability
Shortage of material e.g. bitumen can affect outcomes Reduction of public sector spending will affect the
sector – so far reduction of up to 30% since 2008 Unfair tender or supply chain practices Small companies rely on local government and this is
where most poor spending is . R800b allocated bygovernment to Infrastructure Projects, R300bdisbursed
Adverse national and sectoral reputational riskaffecting investor confidence in turn SMMEdevelopment

18
CHAPTER 2: KEY SKILLS ISSUES
“CLEAN AUDIT-ONE MORE BRICK IN THE RECONSTRUCTION AND EXPANSION OF THE CETA”

19
National Development Plan is a detailed blueprint for how the country can eliminate poverty
and reduce inequality by the year 2030.
Cutting across all infrastructural projects and initiatives is the operation and
maintenance of such infrastructure post establishment
DRIVERS OF CHANGE AND IMPLICATIONS FOR SKILLS PLANNING
DRIVERS OF CHANGE
Technological
advancement and
innovation-Advanced
mechanisation, robotics
and digitisation – new skills,
Dev. of localised
technology .
NDP Vision 2030 &
Campaign, National
Infrastructure Plan-
PICC (2011). 9 Point
Plan – Economic
Growth, Social
Development
Environmental
sustainability and Green
Economy-Curricula
review, top up skills for
technicians, artisans,
energy modelling
services
Occupational Health
and Safety – more
Specialised,
curricular review, top
up skills, changing
health and safety
stds, accredited
training
Construction Regulations -
Construction Health and
Safety (CHS) Professionals
– 3 Categories:Health and
Safety Agent (PrCHSA),
Health and Safety Manager
(CHSM), Health and Safety
Officer (CHSO)

20
IMPLICATIONS FOR SKILLS PLANNING
National Strategy/Plan CETA’s current and envisaged role
Strategic Infrastructure
Projects
• CETA will have to engage with all 18 SIPS as each has relevance to
construction industry.
• Skills forecasting for SIPS – skills development and WIL opportunities• SIPs Priority Occupations.• Presidential Infrastructure Coordinating Committee• Massive rail road infrastructure and water in Limpopo
National Development
Plan - NDP
• 40 High Impact Priority Projects includes Infrastructure to achieve high scale
economic impact to be implemented in 2017-18
• National Treasury – budget priorities on Infrastructure maintenance spend,
skills development.
• Sustainable social development and economic growth
• Strengthen public sector capacity to deliver on infrastructure• Procurement Bill – SMME, townships, rural, labour intensive Entities support• Procurement Plan – Office of Chief Procurement Officer, uniform single supply
chain office, modernized supply chain management
• CSD database and centralized procurement process, tax clearance
verification, verification processes.
• Reduction of red tape, compliance
• Commitment to SADC and rest of Africa, Presidential Champion Infrastructure
Coordination Committee (North South Corridor – 110 Projects, transport,
energy, water, mining projects. 87 Infrastructure Projects,
• DBSA’s role
• Reporting commitments to PICC

21
IMPLICATIONS FOR SKILLS PLANNING
National
Strategy/Plan
CETA’s current and envisaged role
Comprehensive Rural
Development
Programme
CETA to play role in registering rural contractors.
Facilitate training in supply chain management to assist in tendering
CETA Skills Development Centres are key.
Broad Based Black
Economic
Empowerment
• Prioritise skills development in small companies
• Assist large and medium enterprises in developing skills which
will assist with their BBBEE efforts
• Construction Charter Codes
• WSP-ATR Submissions approved by the CETA, BBBEE
Compliance Certificate is issued by the CETA
• Learning Programme Matrix emphases PIVITOAL Training
• Accredited training
• Grants Regulations – monitor/tracking of MG training by entities
National
Infrastructure
Maintenance Strat.
Municipal Infrastructure Maintenance. Engage with government,
especially local government on maintenance plans for infrastructure
to ensure that sufficient skills are available – Municipal services
activities to ensure infrastructure is delivered effectively, skills project
management, all government spheres to work together in planning
and coordination.

22
CHAPTER 3:
EXTENT OF SKILLS MISMATCHES
“CLEAN AUDIT-ONE MORE BRICK IN THE RECONSTRUCTION AND EXPANSION OF THE CETA”

23
Source : Career junction index, 2016
• Vacancies are down by 55% compared to June 2015
• This further illustrates the downturn in the construction economy
• Vacancies tend to exist in the higher skills echelons
VACANCIES IN THE CONSTRUCTION SECTOR
0
100
200
300
400
500
600
700
Jun-15 Jul-15 Aug-15 Sep-15 Oct-15 Nov-15 Dec-15 Jan-16 Feb-16 Mar-16 Apr-16 May-16 Jun-16
Building and Construction

24
Source : Quantec real data, 2016
Real wages tapered down after the construction boom in 2010 which
coincided with the world cup construction activities
WAGE TRENDS IN THE CONSTRUCTION SECTOR
-
5 000
10 000
15 000
20 000
25 000
30 000
35 000
40 000
45 000
50 000
2004 2005 2006 2007 2008 2009 2010 2011 2012 2013 2014
Real remuneration per employee

25
Salaries by OccupationHighest paid are engineers (structural and civil), followed by quantity surveying and then
artisans/technologists (e.g. Architectural, draftsman, electrician, plumbers, etc.)
Occupational ScarcityShortages listed in trades e.g.. Electrical, plumbing
Shortages relate specifically to QUALIFIED tradesmen – there is a reported difference in
quality between qualified and uncertified tradesmen
Conditions of EmploymentThe sector relies heavily on project work – negatively affect long term stability of
employment and security of employment and skills development (Diagram on next slide
illustrates this relationship)
Impact of MigrationMigration across borders – very high outflow of professionals from South Africa to
elsewhere in Africa and further abroad
Internal migration – rural people migrating to cities and especially so with professionals,
draining rural areas of its skills
OTHER LABOUR DEMAND SIDE FACTORS
“CLEAN AUDIT - ONE MORE BRICK IN THE ONGOING RECONSTRUCTION AND EXPANSION OF THE CETA”

26
PIVOTAL SCARCE AND CRITICAL
SKILLS LIST
“CLEAN AUDIT-ONE MORE BRICK IN THE RECONSTRUCTION AND EXPANSION OF THE CETA”

27
What are the top 10 scarce skills and how should the CETA intervene?
SCARCE SKILLS AND PIVOTAL INTERVENTIONS
OCCUPATION SPECIALISATION/ ALTERNATIVE TITLE INTERVENTION
Architects Building Architect Bursary (Degree); Internships;
Candidacy
Quantity Surveyor Construction Economist / Building Economist Degree; Candidacy
Civil Engineer Structural Engineer; Construction Engineer; Transportation and Urban
Planning Engineer; Site Design Engineer
Bursary (Degree); Candidacy
Construction Project Manager Construction Site Manager; Construction Manager; Property Development
Manager; Building and Construction Manager; Construction Project Director
Bursary (Certificate; Diploma;
Degree); Candidacy
Safety, Health, Environment
and Quality (SHE&Q)
Practitioner
Occupational Safety Advisor; Occupational Safety and Health (OSH) Advisor
/ Coordinator / Officer / Professional; Safety Coordinator; Health and Safety
Officer / Coordinator / Professional
Bursary (Certificate &
Diploma); Learnership
Building Associate Building Construction Supervisor; Clerk of Works Apprenticeship; Learnership;
Skills Programmes
Carpenter Construction Carpenter; Shutter hand; Carpenter Contractor Learnership; Apprenticeship
Plumber Hot Water System Installer; Plumbing Contractor; Maintenance Plumber Learnership; Apprenticeship
Electrician Electrical Fitter; Electrician (Engineering); Electrical Contractor Apprenticeship
Builder`s Worker Joinery Worker; Tiler hand; Road Construction / Maintenance Labourer;
Demolition Contractor / Labourer; Artisan Aide Building Trade; Bricklayer's
Assistant; Carpenter's Assistant; Pipe Layer
Learnership; Apprenticeship;
Skills Programmes

28
2016 SCARCE SKILLS AND WSP PIVOTAL INTEGRATION
WITH DG
“CLEAN AUDIT - ONE MORE BRICK IN THE ONGOING RECONSTRUCTION AND EXPANSION OF THE CETA”
SETA NAME
PERIOD OCCUPATION CODE
OCCUPATION QUANTITY NEEDED
Quantity projected to be supported by SETA – E.g Only Planning at Qual. Level
0-100 101-1000
1001 & ABOVE
CETA 2016/17 2015-216101 Architects 80 50 80
CETA 2016/17 2015-214904 Quantity Surveyor 50 50 50
CETA 2016/17 2015-214201 Civil Engineer 600 500 600
CETA 2016/17 2015-132301 Construction Project Manager 100 50 100
CETA 2016/17 2015-226302 Safety, Health, Environment and Quality (SHE&Q) Practitioner
50 50 50
CETA 2016/17 2015-312301 Building Associate 500 250 500
CETA 2016/17 2015-641502 Carpenter 150 150 150
CETA 2016/17 2015-642601 Plumber 100 100 100
CETA 2016/17 2015-671101 Electrician 100 100 100
CETA 2016/17 2015-831301 Builder`s Worker 150 150 150

29
CONDITIONS OF EMPLOYMENT AND ITS IMPACT
Nature of work contract - project based
• Limited time frame in line with tender/ contract
Employment type (limited duration)
• Temporary
• Fixed term
Impact on skills development (limited implementation to none)
• Shortened programmes in line with works contract
• As a result of project based nature of contracting, no stability in
employment
• Negative impact on morale, loyalty and labour productivity
“CLEAN AUDIT - ONE MORE BRICK IN THE ONGOING RECONSTRUCTION AND EXPANSION OF THE CETA”
30
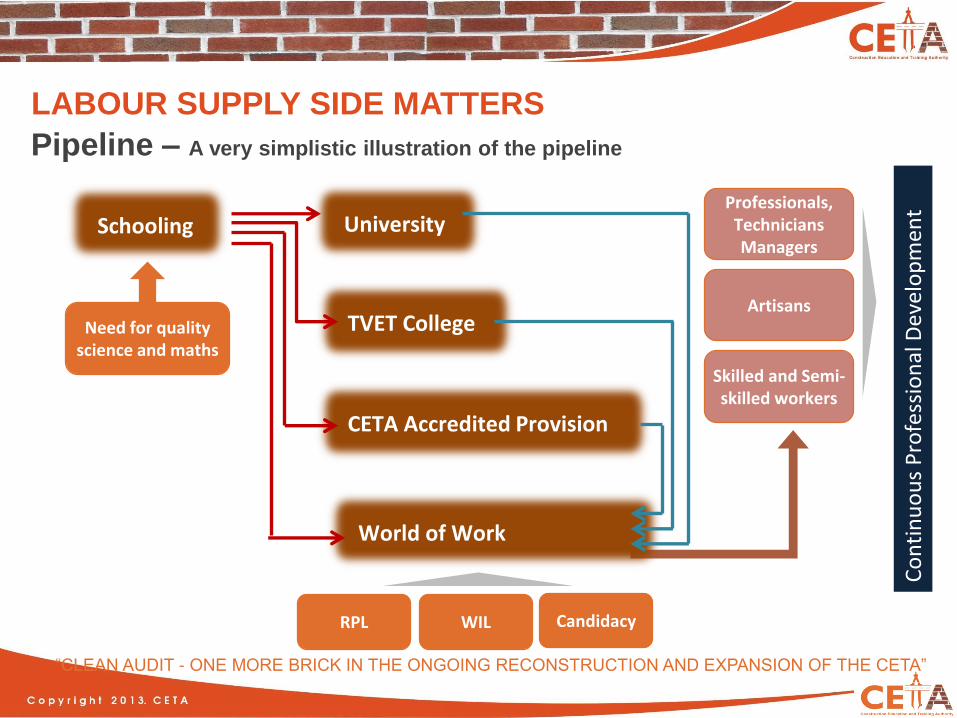
Pipeline – A very simplistic illustration of the pipeline
LABOUR SUPPLY SIDE MATTERS
Schooling University
TVET College
CETA Accredited Provision
World of Work
Co
nti
nu
ou
s P
rofe
ssio
nal
Dev
elo
pm
ent
Need for quality science and maths
RPL WIL Candidacy
Professionals,TechniciansManagers
Artisans
Skilled and Semi-skilled workers
“CLEAN AUDIT - ONE MORE BRICK IN THE ONGOING RECONSTRUCTION AND EXPANSION OF THE CETA”
31
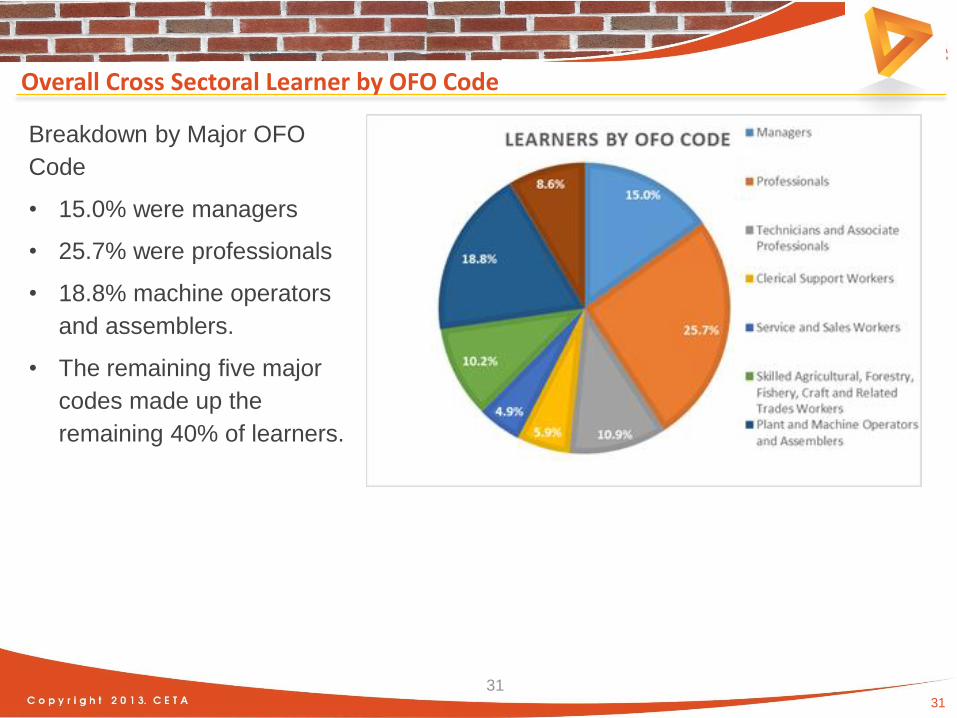
Overall Cross Sectoral Learner by OFO Code
Breakdown by Major OFO
Code
• 15.0% were managers
• 25.7% were professionals
• 18.8% machine operators
and assemblers.
• The remaining five major
codes made up the
remaining 40% of learners.
31

32
Alignment with Employment Vs Programmes implemented -SDPs
• Skills Development Providers Learners do not appear to be aligned to the
national employment breakdown
• Professional and Managers appear over represented
32

33
SAQA - Institutional Activity – Accredited Active SDPs – Upload?
Institutional activity (Institutions with at least one enrolled student) peaked in 2013 at
720, but has since started to drop to 606 in 2014 and 307 in 2015 => may point to
under- or late reporting of enrollments – In the construction sector to promote
upload of the learner assessments on the CETA MIS and in turn NLRD.
(blank)1900 1975 1978 1980 1990 1999 2000 2001 2002 2003 2004 2005 2006 2007 2008 2009 2010 2011 2012 2013 2014 2015 2016
Number of Active Institutions 135 64 2 1 3 2 2 12 23 66 133 203 242 361 387 393 561 572 639 678 720 606 307 3
2006 2007 2008 2009 2010 2011 2012 2013 2014 2015 2016
Number of Active Institutions 361 387 393 561 572 639 678 720 606 307 3

34
CETA SUPPLY
“CLEAN AUDIT-ONE MORE BRICK IN THE RECONSTRUCTION AND EXPANSION OF THE CETA”

35
CETA LEARNING PATHWAYS AND GRANT ALLOCATIONS
CETA SUPPLY:
Learning Intervention Cost per Learner Duration Total Grant
Learnerships 36 000 12 Months 36 000
Bursaries 60 000 3-4 Years 180 000
Internships 36 000 12 Months 36 000
Skills Programmes 13 500 3 Months 13 500
Artisan Development 50 000 3 Years 𝟏𝟓𝟎 𝟎𝟎𝟎
Candidacy Programmes 60 000 3 Years 180 000
RPL 3 500 1 Week - Month 𝟑𝟓𝟎𝟎
TVET Placements 36 000 12 – 24 Months 36 000
University Placements 36 000 12 Months 36 000
“CLEAN AUDIT - ONE MORE BRICK IN THE ONGOING RECONSTRUCTION AND EXPANSION OF THE CETA”

36
CETA SUPPLY - CETA LEARNING PATHWAYS..
Learning Intervention CHALLENGESSSP
Intervention
Learnerships • Opening of Workplaces, Qualified Mentors and dedication to learner
• Learner Tracer Study• Mentorship Programme• Skills Standard – access to workplace
learning – implementation process
Bursaries • “Fees Must Fall”; • Low throughput/completion rate;• Student Support, • study choices, oversupply of some
programmes,• Lecturer/Professionals non-
availability, lecturer development.
• NSFAS Intervention• CETA Managed Bursary Funding• Academic Development Programme
Internships • Opening of Workplaces• availability of Mentorships,• Liability insurance on site – H & S
• Mentorship Programme
Skills Programmes Non Credit bearing Programmes instead of SoR used in industry, learners not uploaded on CETA MIS, NLRD
• SDP Accreditation • Revised CETA MIS

37
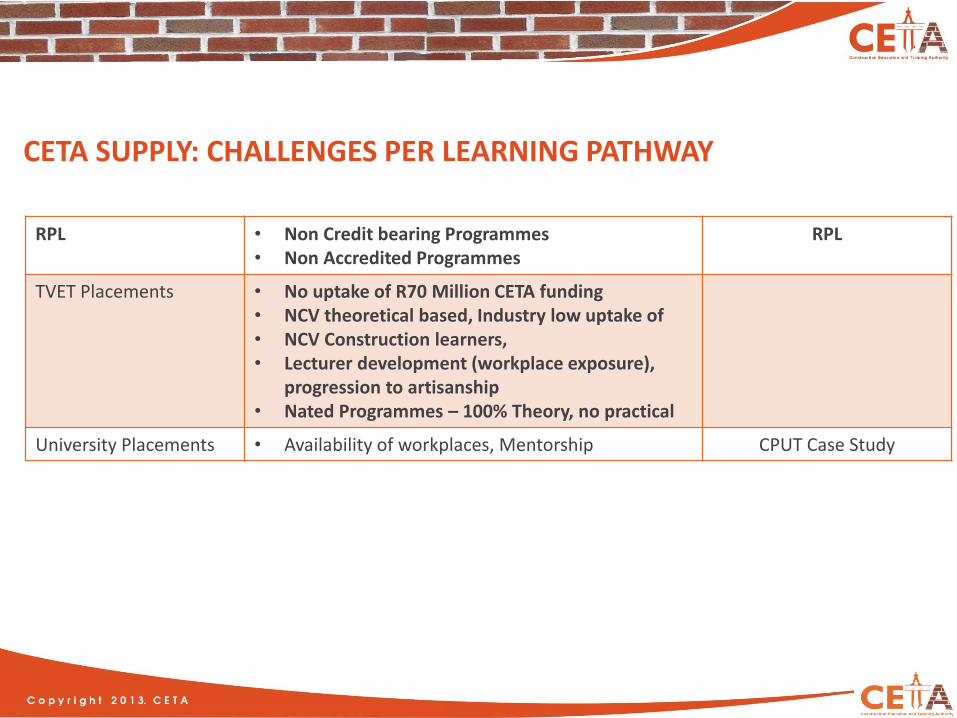
CETA SUPPLY: CHALLENGES PER LEARNING PATHWAY
Learning Intervention ChallengesSSP
Intervention
Artisan Development • Opening of workplaces for placement of apprentices by employers or low industry uptake within the building, civil and electrical contractors subsectors.
• Short term Projects vs. 3 year Apprenticeships • Mentorship for Apprentices – (Mentor Training- Logbooks)• RPL – Mentors with experience but not qualified artisans• Observations as part of on the job training• Outdated trade tasks• Impact assessment - no exit opportunities for qualified
learners.• Lack of Guaranteed Funding• Currently no DSAP pilot for construction sector
• Workplace CapacityEvaluation
• Trade Testing Preparation Support
• NAMB RPL Toolkits• Updated Checklists• Learner Tracer
Study• Multi-Year
Extension Funding, DSAP
Candidacy Programmes • Transformation of built environment industry -registration with built environ. council
• Coaching and Mentorship of Candidates• Quarterly reports submissions not monitored• No structured top up training and learning materials• Candidate drop out due to better salary or relocation to
province affects mentorship
• Mentorship• Candidacy
Guideline
38
CETA SUPPLY: CHALLENGES PER LEARNING PATHWAY
RPL • Non Credit bearing Programmes• Non Accredited Programmes
RPL
TVET Placements • No uptake of R70 Million CETA funding • NCV theoretical based, Industry low uptake of• NCV Construction learners, • Lecturer development (workplace exposure),
progression to artisanship• Nated Programmes – 100% Theory, no practical
University Placements • Availability of workplaces, Mentorship CPUT Case Study

39
WHAT HAS THE CETA DONE TO
SUPPORT TRAINING IN THE
SECTOR?
“CLEAN AUDIT-ONE MORE BRICK IN THE RECONSTRUCTION AND EXPANSION OF THE CETA”

40
CETA ON SKILLS DEVELOPMENT
CETA has made an allocation of more than R1.2 billion towards different skills development
interventions, through different types of entities, majority being public sector, covering all provinces.
Graph below depicts:
“CLEAN AUDIT - ONE MORE BRICK IN THE ONGOING RECONSTRUCTION AND EXPANSION OF THE CETA”
27%
4%
4%
3%24%
3%
14%
21%
Graph: Allocation Of Learner Per Learning Pathway
Apprenticeships Bursaries Candidacy
Internships Learnerships Work Integrated Learning

41
Where does CETA invest employers money?
CETA SUPPLY
Learning Intervention 2013/14 2014/15Δ % from 2013/14
2015/16Δ % from 2014/15
Learnerships 1039 3433 +230% 5045 +47%
Bursaries 2495 581 -77% 653 +12%
Internships 152 686 +351% 128 -81%
Skills Programmes 130 1289 +891% 2205 +71%
Artisan Development - 2982 ∞ 4541 +52%
Candidacy Programmes 557 342 -39% 507 +48%
RPL - 1218 ∞ 1234 +1%
TVET Placements 1655 58 -96% 29 -50%
University Placements 557 342 -39% 111 -68%
• Most of CETA’s funding flows towards learnerships, skills programmes, artisan development and RPL – in line with NSDS III objectives
• Largest growth in Learnerships, skills programmes, artisan development and candidacy – in line with call of Minister

42
CETA GRANT ALLOCATIONS
CETA SUPPLY:
Learning Intervention Total Allocation
Learnerships 36 000
Bursaries 60 000
Internships 36 000
Skills Programmes 13 500
Artisan Development 50 000
Candidacy Programmes 60 000
RPL 3 500
TVET Placements 36 000
University Placements 36 000
“CLEAN AUDIT - ONE MORE BRICK IN THE ONGOING RECONSTRUCTION AND EXPANSION OF THE CETA”

43
CETA SERVICE DELIVERY:
WHAT HAS THE CETA ACHIEVED?
“CLEAN AUDIT-ONE MORE BRICK IN THE RECONSTRUCTION AND EXPANSION OF THE CETA”
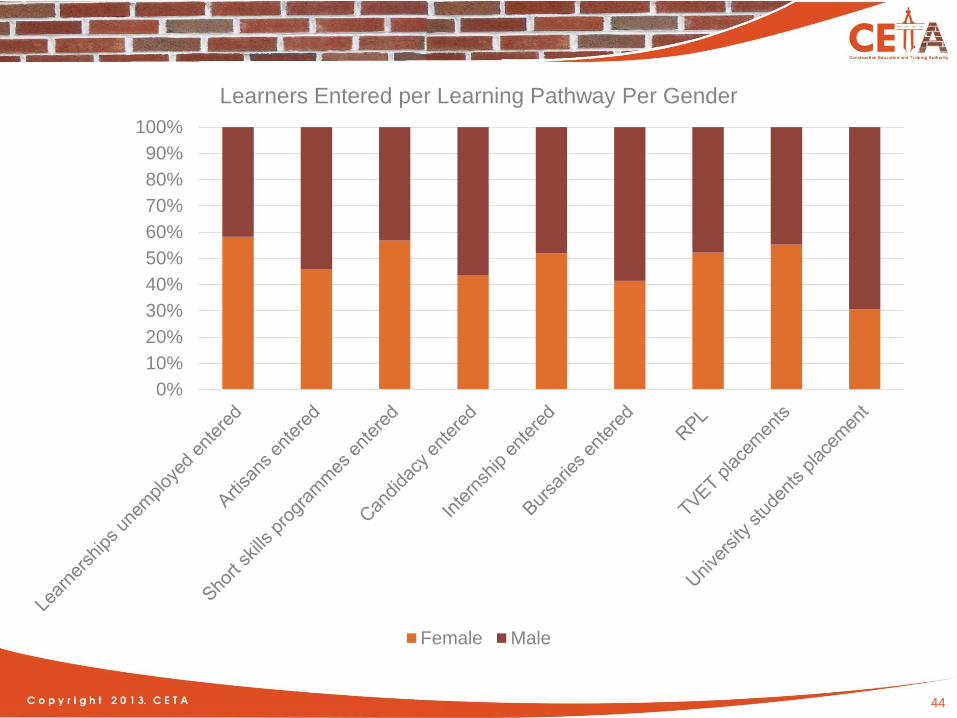
44
0%
10%
20%
30%
40%
50%
60%
70%
80%
90%
100%
Learners Entered per Learning Pathway Per Gender
Female Male

45
0
2000
4000
6000
8000
10000
12000
14000
16000
18000
3433
1289
2982
581 686 342 58 342
9713
5045
2205
4498
653128 507
29 111
16323
Total Learners Entered - 2014/15 vs 2015/16
Total Entered 2014/15 Total Entered 2015/16

46
0
1000
2000
3000
4000
5000
6000
2240
1037
108 0 20 0 0 0
1218
4623
16362131
775
94 0 0 0 0
1234
5870
Total Learners Completed - 2014/15 vs 2015/16
Total Completed 2014/15 Total Completed 2015/16

47
6
25
8
5
46
41
8
10
0
5
10
15
20
25
30
35
40
45
50
TVET Partnerships SMMEs supported NGOs supported Cooperativessupported
TVET partnerships, SMMEs, NGOs and Cooperatives supported
Target Achievement

48
Sector Attractiveness:Construction is not always the immediate career choice for youth but an alternative second or even third option
Inadequate Career Counselling:How do learners choose their career? Bursary funded learners changing study in second year or academically achieving students dropping out of first year at university or programmes or over supply in one programme
Pegging of Career Advice in the schooling sector:Career Advice Programmes are targeting grade 11 and 12 pupils. Start at Grade 10 or Grade 8?
Admission Requirements into Built Environment ProgrammesEligibility based on admission points and subject choice/combinations Existing
Existing Career Advice Activities: Construction (Not Coordinated) • Youth in Construction – Maths and Science – CIDB• Public Works Schools Programme• SAFCEC Career Expo• World Skills Competition – construction• DHET-Khetha Career Services – Radio in all SA languages• “Try A Skill” CETA SSP CAREER GUIDE – UPDATED – 34 CAREER EXHIBITIONS
CAREER ADVICE SERVICES – HOW ATTRACTIVE IS THE CONSTRUCTION SECTOR TO NEW ENTRANTS?

49
CETA-SECTOR PARTNERSHIPS
“CLEAN AUDIT-ONE MORE BRICK IN THE RECONSTRUCTION AND EXPANSION OF THE CETA”

50
KEY PARTNERSHIP ARRANGEMENTS
Partnerships
Public Sector support for Service
Delivery
Academia Development Programme
Innovative Qualification Development
Expanding Public TVET
Inter-SETA Collaboration
“CLEAN AUDIT - ONE MORE BRICK IN THE ONGOING RECONSTRUCTION AND EXPANSION OF THE CETA”

51
NO. 13 CETA SKILLS DEVELOPMENT CENTRESTVET COLLEGE CENTRE IS ALOCATED TO
PHYSICAL
LOCATION OF THE CENTRE
MUNICIPALITY
1. Gert Sibande TVET College Bethal Govan Mbeki
2. West Coast TVET College Vredendal Matsikama
3. UMgungundlovu TVET College Muden Umvoti
4. Esayidi TVET College Ixopo Ubuhlebezwe
5. Northern Cape Rural TVET College Springbok Namaqua
6. Mthashana TVET College Babanango UMzinyathi
7. Mnambithi TVET College Bergville UKhahlamba
8. Mthashana TVET College Phongola Phongola
9. University of Venda Venda Vhembe
10. Umfolozi TVET College Eskhawini Umhlathuze
11. Boland TVET College Bredasdorp Cape Agulhas
12. Mthashana TVET College Ingwavuma UMkhanyakude
13. Northern Cape Rural TVET College De Aar Pixley ka Seme

52
CETA/UNIVERSITY OF VENDA SKILLS DEVELOPMENT CENTRE
ARTISAN TRADES: Electrical Construction and Plumbing

53
CETA/VREDENDAL SKILLS DEVELOPMENT CENTRE
Linked to West Coast TVET College – Learnerships/Apprenticeships

54
CETA/ANENE BOOYSEN SKILLS DEVELOPMENT CENTRE
PSET: Pilot Community College, expansion to Boland TVET College Branch, SETA One Stop Shop Training; Potential forEvening/Part time Study Options, gender empowerment programmes.

55
Public Sector Support for Service Delivery
WITH WHOM? IN ORDER TO DO / ACHIEVE WHAT?
Dept. of Public Works Support Department with bursaries, candidacy programmes, learnerships and apprenticeships
Premiers’ OfficesSkills development relevant to Infrastructure delivery
DBE / DBSA – Pipeline as per SSP
Train local people to benefit Accelerated School Infrastructure Delivery Initiative
National Treasury –Pipeline as per SSP
Candidacy programmes to develop professionals to deliver on MIG
Dept. of Transport –Pipeline as per SSP
Forum for Integrated skills planning
“CLEAN AUDIT - ONE MORE BRICK IN THE ONGOING RECONSTRUCTION AND EXPANSION OF THE CETA”

56
PUBLIC UNIVERSITY PARTNERSHIP: BUILT ENVIRONMENT (Academia Development Programme : Masters & PHD Programmes)
WITH WHOM? IN ORDER TO DO / ACHIEVE WHAT?
UKZN: Develop academics for the country initially focusing
on BSc Property Development : 1 Prof, 2 Lecturers, 1 Senior
Lecturer/Associate Professor), bursaries for 116
undergraduate learners in BSc ProPDev.
WITS: BSc Construction Economics, BSc Construction
Planning. Academic Development Incubation Programme:
10 Professionals. PhD bursaries, paying salaries as junior
lecturers and funding their CPD and bursary for UKZN
UNIIVEN: 3 Masters Lecturers, 2 PHDs, Programme Dev. In
BSc in Construction Technology, bursaries for 27 learners,
Laboratory construction
Support their Civil Engineering, Geotechnical and
Transportation Departments. Laboratory
construction
• UKZN
• WITS
• UNIVEN
SUN and UP-
Pipeline
“CLEAN AUDIT - ONE MORE BRICK IN THE ONGOING RECONSTRUCTION AND EXPANSION OF THE CETA”

57
Expanding Public TVET Colleges
WITH WHOM? IN ORDER TO DO / ACHIEVE WHAT?
Capacitation through lecturer development
programmes and accreditation to deliver on CETA
occupational programmes – 46 out of 50 TVETs
accredited with the CETA.
Support 22 Public TVET Colleges with discretionary
grant funding to support a total of 6 866 learners in
construction learnerships, apprenticeships
programmes
Establish Skills Development Centres managed by
TVET colleges to the benefit of local communities –
13 such centres have already been established.
All TVET
Colleges
“CLEAN AUDIT - ONE MORE BRICK IN THE ONGOING RECONSTRUCTION AND EXPANSION OF THE CETA”
58
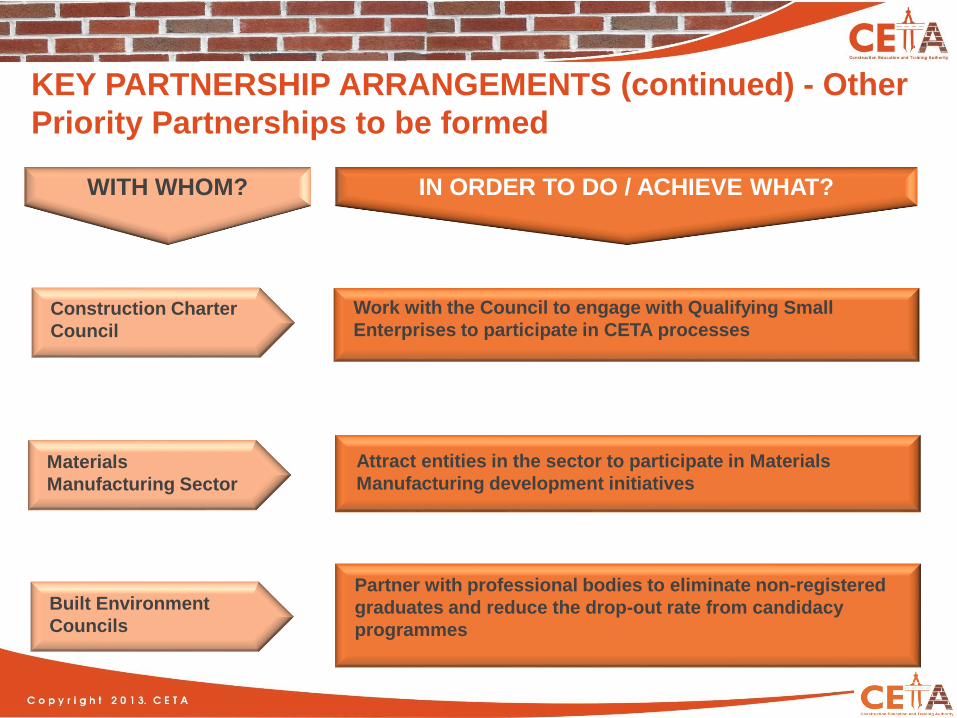
KEY PARTNERSHIP ARRANGEMENTS (continued) - Other
Priority Partnerships to be formed
WITH WHOM? IN ORDER TO DO / ACHIEVE WHAT?
Construction Charter
Council
Work with the Council to engage with Qualifying Small
Enterprises to participate in CETA processes
Materials
Manufacturing Sector
Attract entities in the sector to participate in Materials
Manufacturing development initiatives
Built Environment
Councils
Partner with professional bodies to eliminate non-registered
graduates and reduce the drop-out rate from candidacy
programmes

59
INTERSETA COLLABORATION – CETA-SERVICES SETA
“CLEAN AUDIT - ONE MORE BRICK IN THE ONGOING RECONSTRUCTION AND EXPANSION OF THE CETA”
Entity Projects Number of learners
1.Beaufort West Local Municipality Learnerships 508
Apprenticeship 103
Skills Centre
2. Inxuba Yathembe Local Municipality Apprenticeships 87
Learnerships 497
3. South African Military Veterans
Association (SANMVA)
Learnerships 833
4. Mining Development Agency (MDA) RPL 1000
Short Skills 111
Learnerships 82
Apprenticeship 58
Bursaries 170
5. Disabled People South Africa (DPSA) Short Skills 1500
Learnerships 700
6.Don Bosco Educational Project Learnership 175
Apprenticeship 200
Internship 10
Bursaries 50
Establishment of cooperatives 10
RPL 50
7. Motheo TVET College. Learnership 30
8. Mangaung Local Municipality Learnership 332
Apprenticeship 260
9.Sakhisiswe Local Municipality( Cala) Learnership 200
10. South African Homeless Peoples
Federation
Short Skills 111
Learnerships 165
Bursaries 10
11. Namaqua District Municipality Learnership 120
12. Prieska Learnership 200
13.Alexandra Bay Apprenticeship 100
OTHER SETA
PARTNERSHIPS
(joint MIS):
ETDP SETA, FP&M
SETA and
CATHSETA

60
INNOVATIVE QUALIFICATION DEVELOPMENT: FROM CURRENT TO NEW OCCUPATIONAL LANDSCAPE
WITH WHOM? IN ORDER TO DO / ACHIEVE WHAT?
PURPOSE: REPLACING OLD NQF CONSTRUCTION QUALIFICATIONS WITH INDUSTRY LED CURRICULUM DEVELOPMENT – Active June 2018
SAFCEC and FITA(Flooring
Industry Training Association)
MBSA, CESA Funded by CETA but current
no uptake.
“CLEAN AUDIT - ONE MORE BRICK IN THE ONGOING RECONSTRUCTION AND EXPANSION OF THE CETA”
CETA-SAFCEC PARTNERSHIP: Replacing: • NC: Construction Roadworks (24133), NQF Level 2• NC: Construction Roadworks (24173), NQF Level 3• NC: Construction Building and Civil Construction (65409), NQF Level 3With OFO-based: • Civil Road Construction Constructor• Civil Services Constructor• Civil Structures Construction Constructor (Incl. Construction Scafolding)
FITA: Replacing: NC in Flooring and Tiling, NQF Level 1

61
THE FUTURE: NEW CETA PILOT QUALITY ASSURANCE MODEL
• CETA pioneering Pilot AQP Model: Joint CETA-Industry Partner for quality of training,
quality of assessment, monitoring of training providers
• CETA is approved as an Assessment Quality Partner (AQP)
• CETA delegates the functions to an industry expert body
• CETA funds the quality assurance implementation
• Review of the First Phase of the AQP pilot model and make improvements where
required.
• Roll out of the AQP Model to other CETA new qualifications
“CLEAN AUDIT - ONE MORE BRICK IN THE ONGOING RECONSTRUCTION AND EXPANSION OF THE CETA”

62
CETA ON THE DRIVE TO MAINTAIN CLEAN ADMINISTRATION WHILE ENSURING SERVICE DELIVERY.
• Levies has increased from R551 million to R835 million in 2015/16,this reflects the level
of trust by the construction sector on skills development
• Mandatory grants of R248 million was paid to complying levy paying companies.
• 2190 number of companies submitted WSP’s and 1892 were approved and paid.
“CLEAN AUDIT - ONE MORE BRICK IN THE ONGOING RECONSTRUCTION AND EXPANSION OF THE CETA”
63
CONTINUOUS IMPROVEMENT PLAN
(CIP)
“CLEAN AUDIT-ONE MORE BRICK IN THE RECONSTRUCTION AND EXPANSION OF THE CETA”

64
SSP CONTINOUS IMPROVEMENT PLAN - CIP
• Subsector Skills Plan for each 4 construction subsector
(Subsector plans feed into the 1 Main SSP)
• Develop skills forecasting tool for Sector in partnership with a Public University
• Better use of previously research conducted by stakeholders
Improve data sources• Make extensive use of QLFS and HEMIS – ensure proper access
• Work with Councils to develop time series data for trend analysis, improve depth
• Expand research partners to improve labour information
Organising Framework for Occupations(OFO) and Sector PIVOTAL LIST• improve PIVOTAL skills submissions
Alignment to Government Policies/national imperatives• Work with stakeholders to identify policies that have an impact on skills development and
update CETA SSP
• Measure impact of partnerships on achieving aims of government programmes
Career Advice System – CETA SSP Career Guide• Partnerships with Councils to promote careers in the sector
• Supply side tracking tool for University and TVET graduates
Stakeholder participation, engagement and central coordination of activities-
SSP
Research agenda

65
THANK YOU!

66