construction of optimal portfolio using sharpe index model...
TRANSCRIPT

[ VOLUME 2 I ISSUE 2 I APRIL - JUNE 2015 ] E ISSN 2348 –1269, PRINT ISSN 2349-5138
168 IJRAR- International Journal of Research and Analytical Reviews Research Paper
Construction of Optimal Portfolio Using Sharpe Index Model
& Camp for BSE Top 15 Securities
Chintan A. Shah Assistant Professor
Bhagwan Mahavir College of Business Administration, Vesu – Surat.
Received June 2, 2015 Accepted June 7, 2015
ABSTRACT Portfolio is the combination of securities such as stocks, bonds and money market instruments. The process of blending together the broad asset classes so as to obtain optimum return with minimum risk if called portfolio construction. Diversification of investments helps to spread risk over many assets. Investment management, also referred to as portfolio management, is a complex process or activity that may be divided into seven broad phases. Markowitz Model had serious practical limitations due the rigors involved in compiling the expected returns, standard deviation, variance, covariance of each security to every other security in the portfolio. Sharpe Model has simplified this process by relating the return in a security to a single Market index. In the CAPM theory, the required rate return of an asset is having a linear relationship with asset’s beta value i.e. undiversifiable or systematic risk. For the fulfillment of our research objectives which are, to construct an optimal portfolio, evaluate the performance of BSE15, Rank the optimal portfolio constructed, and compares the performance of BSE15 securities through Sharpe Model. We have used the Descriptive Research Design and used the Secondary data collection methods. Finally, the results will be drawn out on the basis of expected risk & return with help of Sharpe index model and comparison between Sharpe index model & CAPM model.
Key Words: Portfolio, Securities, Diversification, Portfolio Management, Investment, Expected Risk & Return.
INTRODUCTION:
CONCEPT OF PORTFOLIO:
Portfolio is the combination of securities such as stocks, bonds and money market instruments.
The process of blending together the broad asset classes so as to obtain optimum return with
minimum risk if called portfolio construction.
CONSTRUCTION OF THE OPTIMAL PORTFOLIO
SHARPE MODEL
Markowitz Model had serious practical limitations due the rigors involved in compiling the
expected returns, standard deviation, variance, covariance of each security to every other security
in the portfolio. Sharpe Model has simplified this process by relating the return in a security to a
single Market index
Single Index Model

[ VOLUME 2 I ISSUE 2 I APRIL - JUNE 2015 ] E ISSN 2348 –1269, PRINT ISSN 2349-5138
Research Paper IJRAR- International Journal of Research and Analytical Reviews 169
The single index model is based on the assumption that stocks vary together because of
the common movement in the stock market and there are no effects beyond the market that
account the stocks co- movement. The expected return, standard deviation and co-variance of the
single index model represent the joint movement of securities.
𝐑𝐢 = 𝛂𝐢 + 𝛃𝐢𝐑𝐦 + 𝐞𝐢
Where,
Ri – expected return on security i
αi - intercept of the straight line or alpha co-efficient
βi- slope of straight line or beta co-efficient
Rm- the rate of return on market index
ei- error term
The variance of the security has two components namely, systematic risk or market risk and
unsystematic risk or unique risk. The variance explained by the index is referred to systematic
risk. The unexplained variance is called residual variance or unsystematic risk.
Systematic Risk = βi2 * Variance of market index
= βi2 * σ2m
Unsystematic Risk = Total variance – Systematic Risk
ei2 =σi_ Systematic Risk
Thus, Total Risk = Systematic Risk + Unsystematic Risk
= βi2 * σ2m + ei2
From this, the portfolio variance can be derived
𝛔 𝒑𝟐 = ∑𝐗𝐢𝛃𝐢
𝟐 𝛔𝟐𝐦 + ∑𝐗𝐢 𝟐𝛔𝟐𝐞𝐢
σ2p= Variance of Portfolio
σ2 =Expected Variance of Index
ei2= Variation in Security’s return not related to the market index
Xi = the portion of stock i in the portfolio
SHARPE’S OPTIMAL PORTFOLIO
Sharpe had provided model for the selection of appropriate securities in a portfolio. The
selection of any stock is directly related to its excess return-beta ratio.
Ri − Rf
βi
Where,
Ri = the expected return on stock i
Rf = the return on a riskless asset

[ VOLUME 2 I ISSUE 2 I APRIL - JUNE 2015 ] E ISSN 2348 –1269, PRINT ISSN 2349-5138
170 IJRAR- International Journal of Research and Analytical Reviews Research Paper
βi = the expected change in the rate of return on stock i associated with one unit change in
the market return.
CONSTRUCTION OF THE OPTIMAL PORTFOLIO
After determining the securities to be selected, the portfolio manager should find out how
much should be invested in each security. The percentage of funds to be invested in each security
can be estimated as follows.
X1 = Zi
N ∑i = 1 Zi
Zi = βi Ri − Rf
βi− C∗
The first expression indicates the weights on each security and they sum up to one. The second
shows the relative investment in each security. The residual variance or the unsystematic risk has
a role in determining the amount to be invested in each security.
RESEARCH METHODOLOGY:
A. Problem Statement :“To construct an optimal portfolio using Sharpe Index Model for BSE
Top 15 securities”
B. Research Objectives:
To construct an optimal portfolio using Sharpe Index Model and CAPM model.
To analyze the Portfolio risk and Portfolio return of stocks listed at BSE.
To analyze and compare the portfolios prepared through Sharpe Index Model & CAPM and
identify the difference in results.
C. Research Design: Here, researcher is used Descriptive Research Design because; in this
research design the researcher has got very specific objectives, clear-cut data requirements.
D. Literature Review:
1. Optimal Portfolio Construction in Stock Market- An Empirical Study on Selected Stocks in
Manufacturing Sectors of India
Dr. Sathya SwaroopDebasish, Jakki Samir Khan(December 2012)
2. Optimal Portfolio Construction by Using Sharpe’s Single Index Model (An Empirical Study on
Stocks of Some Selected Public Sector Enterprises in India)
Dr.Niranjan Mandal (2013)
3. Sharpe’s single index model and its application to construct optimal portfolio: an empirical
study
Niranjan Mandal
[ VOLUME 2 I ISSUE 2 I APRIL - JUNE 2015 ] E ISSN 2348 –1269, PRINT ISSN 2349-5138
Research Paper IJRAR- International Journal of Research and Analytical Reviews 171
E. Data Collection: In this research, majorly a data collection tool used by researcher is
secondary data. Secondary Data will be obtained from www.bseindia.com.
Data collected: Monthly data on BSE Top 15 securities on basis of market capitalisation.
Time period: Stock prices from January 2000 - March 2015
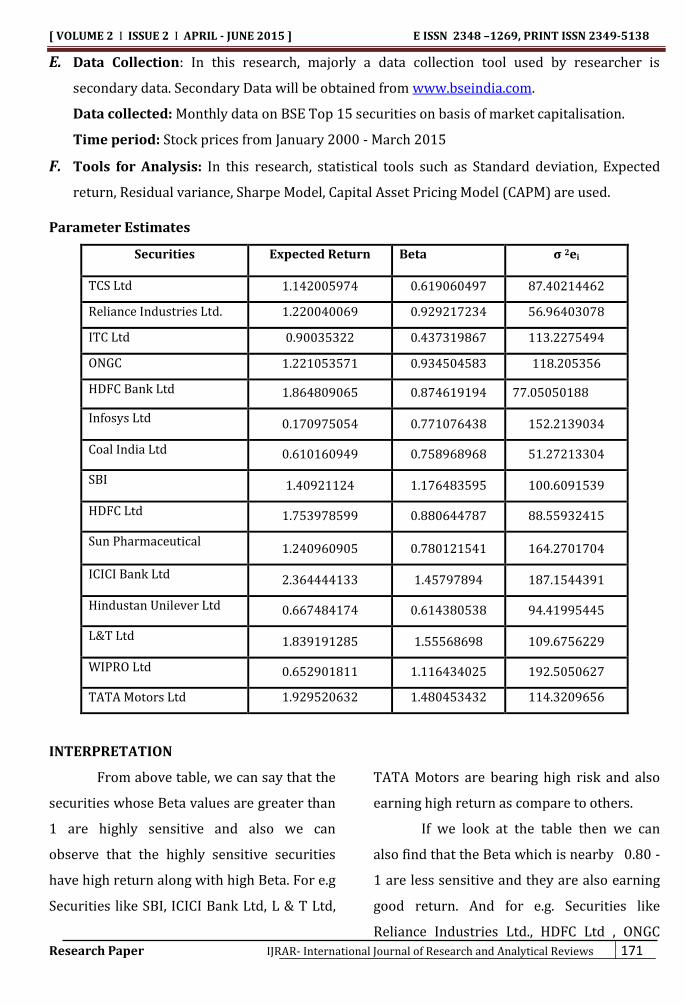
F. Tools for Analysis: In this research, statistical tools such as Standard deviation, Expected
return, Residual variance, Sharpe Model, Capital Asset Pricing Model (CAPM) are used.
Parameter Estimates
Securities Expected Return Beta σ 2ei
TCS Ltd 1.142005974 0.619060497 87.40214462
Reliance Industries Ltd. 1.220040069 0.929217234 56.96403078
ITC Ltd 0.90035322 0.437319867 113.2275494
ONGC 1.221053571 0.934504583 118.205356
HDFC Bank Ltd 1.864809065 0.874619194 77.05050188
Infosys Ltd 0.170975054 0.771076438 152.2139034
Coal India Ltd 0.610160949 0.758968968 51.27213304
SBI 1.40921124 1.176483595 100.6091539
HDFC Ltd 1.753978599 0.880644787 88.55932415
Sun Pharmaceutical 1.240960905 0.780121541 164.2701704
ICICI Bank Ltd 2.364444133 1.45797894 187.1544391
Hindustan Unilever Ltd 0.667484174 0.614380538 94.41995445
L&T Ltd 1.839191285 1.55568698 109.6756229
WIPRO Ltd 0.652901811 1.116434025 192.5050627
TATA Motors Ltd 1.929520632 1.480453432 114.3209656
INTERPRETATION
From above table, we can say that the
securities whose Beta values are greater than
1 are highly sensitive and also we can
observe that the highly sensitive securities
have high return along with high Beta. For e.g
Securities like SBI, ICICI Bank Ltd, L & T Ltd,
TATA Motors are bearing high risk and also
earning high return as compare to others.
If we look at the table then we can
also find that the Beta which is nearby 0.80 -
1 are less sensitive and they are also earning
good return. And for e.g. Securities like
Reliance Industries Ltd., HDFC Ltd , ONGC

[ VOLUME 2 I ISSUE 2 I APRIL - JUNE 2015 ] E ISSN 2348 –1269, PRINT ISSN 2349-5138
172 IJRAR- International Journal of Research and Analytical Reviews Research Paper
Ltd, HDFC Bank Ltd and are having beta less
than 1, so we can say that they are stable
earning securities with low level of risk.
1. Construction of an optimal portfolio
Step 1 : Find out the “ excess return to beta ” ratio for each stock under consideration.
Securities have to be ranked from the highest return to beta to the lowest
Securities Ri βi Ri-Rf Ri-Rf
βi
TCS Ltd 1.142005974 0.619060497 0.575616985
0.929823478
Reliance Industries
Ltd. 1.220040069 0.929217234
0.653651079
0.703442699
ITC Ltd 0.90035322 0.437319867
0.333964231
0.763661238
ONGC
1.221053571 0.934504583 0.654664582
0.700547214
HDFC Bank Ltd
1.864809065 0.874619194 1.298420075 1.484554746
Infosys Ltd
0.170975054 0.771076438 -0.395413935 -0.512807701
Coal India Ltd
0.610160949 0.758968968 0.04377196 0.057672924
SBI
1.40921124 1.176483595 0.842822251 0.716390993
HDFC Ltd
1.753978599 0.880644787 1.18758961 1.348545551
Sun Pharmaceutical
1.240960905 0.780121541 0.674571916 0.674571916
ICICI Bank Ltd 2.364444133 1.45797894 1.798055144 1.233251795
Hindustan Unilever
Ltd 0.667484174 0.614380538 0.101095184 0.164548155
L&T Ltd 1.839191285 1.55568698 1.272802295 0.818160923
WIPRO Ltd 0.652901811 1.116434025 0.048753555 0.043668998
TATA Motors Ltd 1.929520632 1.480453432 1.325372376 0.895247596
Step 2: Rank them from the highest to the lowest

[ VOLUME 2 I ISSUE 2 I APRIL - JUNE 2015 ] E ISSN 2348 –1269, PRINT ISSN 2349-5138
Research Paper IJRAR- International Journal of Research and Analytical Reviews 173
Ranked table
Securities Ri-Rf
βi
(Ri-Rf) βi
σ 2ei
∑(Ri-Rf)βi
σ 2ei
Βi2
σ 2ei
∑ Βi2
σ 2ei
C*
HDFC Bank Ltd
1.48455
0.01473 0.01473 0.00992 0.00992 0.48836
HDFC Ltd 1.34854 0.01180 0.02654 0.00875 0.01868 0.68182
ICICI Bank Ltd 1.23325 0.01400 0.04055 0.01135 0.03004 0.80635
TCS 0.92982 0.00407 0.04463 0.00438 0.03442 0.81625
TATA Motors Ltd 0.89524 0.01716 0.06179 0.01917 0.05359 0.8367
6 L&T 0.81816 0.01805 0.07985 0.02206 0.07566 0.83248
ITC Ltd 0.76366 0.00128 0.08113 0.00168 0.07735 0.83129
SBI 0.71639 0.00985 0.09099 0.01375 0.09111 0.81709
Reliance Industries
Ltd
0.70344 0.01066 0.10165 0.01515 0.10627 0.80348
ONGC 0.70054 0.00517 0.10683 0.00738 0.11365 0.79780
Sun Pharma 0.67457 0.00320 0.11003 0.00370 0.11736 0.79960
HUL 0.16454 0.00065 0.11069 0.00399 0.12136 0.78167
Coal India 0.05767 0.00064 0.11134 0.01123 0.13259 0.72845
Wipro 0.04366 0.00028 0.11162 0.00647 0.13907 0.70062
Infosys -0.51281 -0.0020 0.10962 0.00390 0.14297 0.67159
Step 3: Proceed to calculate Ci for all the stocks according to the ranked order using the following
formula.
C* =
σ2m N ∑i = 1 Ri – Rf βi
σ2ei
1+ σ2m N ∑i = 1βi2 (σ2m = 35.22)
C* = 0.836761963
Step 4: The cumulated values of Ci start declining after a particular Ci and that point is taken as
cut off point and that stock ratio is the cut off point C.
According to highest C*, the optimal portfolio consists of following securities.
1. HDFC Bank Ltd.
2. HDFC Ltd.

[ VOLUME 2 I ISSUE 2 I APRIL - JUNE 2015 ] E ISSN 2348 –1269, PRINT ISSN 2349-5138
174 IJRAR- International Journal of Research and Analytical Reviews Research Paper
3. ICICI Bank Ltd.
4. TCS
5. TATA Motors Ltd.
Construction of Optimal Portfolio:
The proportions are
X1 = Zi
N ∑i=1 Zi Zi = βi
Ri−Rf
βi− C∗
Zi = 0.01694778
PORTFOLIO RETURN
Rp = N ∑Xi( αi + βiRm )
Rp = 1.897367059%
PORTFOLIO VARIANCE
σ 𝑝2 = ∑Xiβi
2 σ2m + ∑Xi
2σ2ei
∑Xiβi 2
= 0.999763319 ∑Xiβi 2
σ2m = 49.3671097
∑Xi 2σ2ei = 29.06738784 σ2p = 78.43449754
PORTFOLIO RISK σp = 8.856325284
PORTFOLIO BETA βp = βi*Xi
∑βp = 0.999881652
INTERPRETATION:-
According to Sharpe Model, Portfolio
Return 1.89% it means an investor is getting
1.89% of Portfolio Return by constructing an
Portfolio of BSE Top 15 securities, and
against it he is bearing 8.86% Portfolio Risk.
Now, after constructing an Optimal
Portfolio of BSE Top 15 security with the help
of Sharpe Model, we have also applied Capital
Asset Pricing Model (CAPM) to select set of
securities that an investor should consider
for investment. This will help to investor for
taking buying and selling decisions by
comparing the output of both models.
CAPITAL ASSET PRICING MODEL (CAPM)
Markowitz, William Sharpe, John Lintner and Jan Mossin provided the basic structure for
the CAPM model. It is a model of linear general equilibrium return. In the CAPM theory, the
required rate return of an asset is having a linear relationship with asset’s beta value i.e.
undiversifiable or systematic risk.
The assumptions of CAPM are that the market is in equilibrium and the expected rate of
return is equal to the required rate of return for a given level of risk or Beta. CAPM presents a

[ VOLUME 2 I ISSUE 2 I APRIL - JUNE 2015 ] E ISSN 2348 –1269, PRINT ISSN 2349-5138
Research Paper IJRAR- International Journal of Research and Analytical Reviews 175
linear relationship between the required rate of return of a security and relates it to market
related risk or Beta, which cannot be avoided. The equation for the CAPM Theory is
Ri = Rf + βi ( Rm − Rf)
Ri = expected rate of return on security ‘i’.
Rf = risk free return
βi = Beta coefficient – a risk measure for the non-diversifiable part of total Risk.
Rm = Return on market portfolio
Rm - Rf = The excess return for the extra risk
2. CAPITAL ASSET PRICING MODEL
Securities
Estimated Return
Ri =∑Xi/N
Expected Return
Ri = Rf+ β (Rm - Rf )
Remarks
TCS 1.142005974 1.101489976 Underpriced
Reliance Industries Ltd. 1.220040069 1.151155013 Underpriced
ITC Ltd. 0.90035322 0.841598908 Underpriced
ONGC 1.221053571 0.691760465 Underpriced
HDFC Bank Ltd. 1.864809065 1.116795902 Underpriced
Infosys Ltd. 0.170975054 1.051635373 Overpriced
Coal India Ltd. 0.610160949 0.694913175 Overpriced
SBI 1.40921124 1.306762294 Underpriced
HDFC Ltd. 1.753978599 1.12058787 Underpriced
Sun Pharma 1.240960905 1.05732755 Underpriced
ICICI Bank Ltd 2.364444133 1.483910228 Underpriced
HUL 0.667484174 0.953025021 Overpriced
Larsen Turbro Ltd. 1.839191285 1.545398909 Underpriced
WIPRO Ltd. 0.652901811 1.264576014 Overpriced
TATA Motors Ltd. 1.929520632 1.479912089 Underpriced
Interpretation:
As we can see that above table is
showing the result of CAPM which emphasis
on individual security. As we can see that
some securities are overpriced and some are

[ VOLUME 2 I ISSUE 2 I APRIL - JUNE 2015 ] E ISSN 2348 –1269, PRINT ISSN 2349-5138
176 IJRAR- International Journal of Research and Analytical Reviews Research Paper
underpriced. The securities which are bold
indicate that they are underpriced and it
suggests that investors should invest in these
underpriced securities as there are chances of
return to be increased in the future. Whereas
the securities which are overpriced indicate
that they should not be purchased by
investors as it is overvalued.
3. Comparison of output of SHARPE Model and CAPM Model
Interpretation:-
As we know that Sharpe model
indicates the portfolio of securities whereas
CAPM emphasis on individual security. In
above table, CAPM consists of securities
which are underpriced; it means it says that
investors can purchase any of the above
mentioned 11 securities.
According to Sharpe model which
emphasis on Portfolio of securities rather
than holding an individual security. As we
know that investor is not always sure that
whether market trend will always support
him. So there are chances that market does
not perform well so if investor has invested in
individual securities based on CAPM then he
may incur a loss. Whereas in case of portfolio
constructed based on Sharpe model if any
securities make loss then it can be easily
covered by other securities which is not
possible by holding individual security as
specified by CAPM model.
SHARPE MODEL CAPM
1. HDFC Bank Ltd 1. TCS
2. HDFC Ltd 2. Reliance Industries Ltd.
3. ICICI Bank Ltd 3. ITC Ltd.
4. TCS 4. ONGC
5. TATA Motors Ltd. 5. HDFC Bank Ltd.
6. SBI
7. HDFC Ltd.
8. Sun Pharma
9. ICICI Bank Ltd
10. Larsen Turbro Ltd.
11. TATA Motors Ltd.

[ VOLUME 2 I ISSUE 2 I APRIL - JUNE 2015 ] E ISSN 2348 –1269, PRINT ISSN 2349-5138
Research Paper IJRAR- International Journal of Research and Analytical Reviews 177
FINDINGS:
As per Sharpe model, the portfolio will
consist of 5 securities and its weightage of
investment is as follows.
HDFC Bank Ltd. 43.39% , HDFC Ltd.
30.03%, ICICI Bank Ltd. 18.23%, TCS Ltd.
3.89%, and TATA Motors Ltd. 4.47%.
As per CAPM model, 11 securities are
undervalued and will be profitable for
investor if he invest in them. The
securities are TCS Ltd, Reliance Industries
Ltd., ITC Ltd., ONGC, HDFC Bank Ltd., SBI,
HDFC Ltd., Sun Pharma, ICICI Bank Ltd,
Larsen Turbro Ltd., TATA Motors Ltd.
According to Sharpe model, portfolio
return 1.89% it means an investor is
getting 1.89% of portfolio return by
constructing an portfolio of BSE top 15
securities, and against it he is bearing
8.86% portfolio risk.
According to Sharpe Model, portfolio
return 1.89% it means an investor is
getting 1.89% of portfolio return by
constructing an portfolio of BSE top 15
securities, and against it he is bearing
8.86% portfolio risk.
CONCLUSION:
Sharpe model gives exact number of
securities along with weightage for
investment, while this is not possible in CAPM
model.
CAPM model only suggest different securities
where investor can invest but it does not give
a particular portfolio and weightage to
investment in different securities.
From the comparison of Sharpe Model and
CAPM, it can be said that CAPM fails to
capture the return behaviour of BSE Top 15
individual security. Sharpe Model suggests
the portfolio of equities whereas CAPM
indicates individual securities, so in portfolio
of equities if some securities returns are
negative then investor can cover his loss from
other securities included in his portfolio.
SUGGESTION:
Based on the study of returns of top 15
BSE securities for past 16 years using
Sharpe Model, an investor can invest in
following securities.
HDFC Bank Ltd, HDFC Ltd., ICICI Bank
Ltd.,TCS, TATA Motors
From the comparison of Sharpe Model
and CAPM, investor should hold the
portfolio of equities suggested by Sharpe
Model rather than CAPM model.
BIBLIOGRAPHY:
BOOKS:
1. Berry G.C, (2000), “Marketing Research”, 3rd
Ed, Tata Mc Grew-hill co. ltd, New Delhi.
2. Punithvanthy Pandean, (3rd Ed) “Security
Analysis and Portfolio management”, Vikas
Publishing House Pvt. Ltd.
ARTICLE:

[ VOLUME 2 I ISSUE 2 I APRIL - JUNE 2015 ] E ISSN 2348 –1269, PRINT ISSN 2349-5138
178 IJRAR- International Journal of Research and Analytical Reviews Research Paper
1. http://is.muni.cz/do/econ/soubory/aktivity/
fai/35724989/FAI_issue2012_03_Kamal.pdf
2. http://www.oeconomica.uab.ro/upload/lucra
ri/1520132/19.pdf
3. http://www.cpmr.org.in/opinion/vol2/issue
2/articles/4.pdf
4. http://www.ijambu.in/assets/48_54.pdf
5. http://apjor.com/files/1383064654.pdf
http://ijbarr.com/downloads/2014/vol2-
issue3/16.pdf
6. http://www.theglobaljournals.com/ijar/file.p
hp?val=January_2014_1388584281_ee78c_84.
7. http://is.muni.cz/do/econ/soubory/aktivity/
fai/35724989/FAI_issue2012_03_Kamal.pdf
8. http://www.ipeindia.org/main/uploads/IPE/
JIPE/JIPE_36_12_2.pdf
9. http://www.ijmra.us/project%20doc/IJPSS_A
UGUST2012/IJMRA-PSS1409.pdf
10. http://www.wjsspapers.com/static/documen
ts/November/2013/6.%20Mokta.pdf
WEBSITE
1. www.bseindia.com in.investing.com/rate-
bonds/india-15-year-bond
2. http://www.torinwealth.com
Courage is going from failure to failure without losing enthusiasm.
– Winston Churchill