construction - kordamentha
TRANSCRIPT
Part 1 - Industry overview
August 2012Publication No. 12-03
Construction
1
2
3
4
5
Contents
Construction industry overviewThe construction industry has grown by 3% pa over the past five years although this general growth rate masks divergent growth rates between sectors.
Engineering constructionEngineering construction has risen to prominence in recent years on the back of unprecedented private sector investment by the resources sector and public sector investment in major infrastructure projects.
Non-residential building constructionThis sector has had mixed fortunes. Demand for commercial and industrial construction plummeted in the wake of the GFC, but fiscal stimulus measures drove significant growth in school construction.
Residential building constructionDespite strong population growth, residential construction has declined in recent years due to prevailing economic conditions anda winding back of government subsidies for home buyers.
Construction industry outlookThe outlook for the construction industry is difficult. Whilst residential and commercial construction activity is forecast to return to grow modestly, the end of the BER stimulus will drive institutional building activity down. Demand from the mining boom will continue to underpin engineering construction activity but there is some uncertainty over the value of new mining projects due to come on stream.

The Australian construction industry has overall revenue of $255 billion and contributes 8.5% to Australian GDP. The industry comprises a variety of sectors which have had mixed fortunes over recent years.
Industry overview1

4
The industry comprises residential construction (house construction, multi-unit apartment and townhouse construction), non-residential construction (commercial and industrial building construction and institutional building construction), engineering construction (heavy industry and other non-building construction and road and bridge construction) and construction support services. This paper focuses on the first three of these sectors.
The construction industry has grown by 3% pa over the past five years although this general growth rate masks divergent growth rates between sectors.
Residentialconstruction
Constructionsupportservices
Non-residentialconstruction
Engineeringconstruction
Construction industry revenue.
$255b
$42b
$81b$26b
$106b
Source: IBISWorld.
Construction historical revenue.
Source: IBISWorld.
2003 2004 2005 2006 2007 2008 2009 2010 2011 2012100
250
$300b
150
200
Construction annual growth (pa, past five years).
0
2.0%
-2.5%
9.0%
3.0%
7.5%
6.0%
Overall industry growth
Heavy industry and other non building construction
Institutional building construction
Road and bridge construction
Multi-unit apartment and townhouse construction
House construction
Commercial and industrial building construction -3.5%
Source: IBISWorld.
Over the past five years, engineering construction has outperformed the industry average (both heavy industry and road and bridge construction growth exceeded the industry average of 3% pa), whilst residential construction has under performed. Non-residential construction has had mixed fortunes, with institutional building construction out-performing, and commercial and industrial building construction under performing.

5Divergent trends within the construction sector over the past five years have changed the composition of the Australian construction industry.
Residentialconstruction
Residentialconstruction
Non-residentialconstruction
Non-residentialconstruction
Engineeringconstruction
Engineeringconstruction
Divergent trends.
2003 2011
35%
44%
21%
58%25%
17%
Source: ABS. Source: ABS.
The cornerstone of the construction industry over the past five years has been the construction of mineral and energy infrastructure servicing the booming resources sector. This has driven growth in both heavy industry and road and bridge construction.
Over the same period the negative impact of the GFC has reduced business confidence in, and the availability of funding for, commercial and industrial projects. Modest growth has still been achieved in Non-residential Construction, however, primarily due to Federal Government funding of schools through the Building the Education Revolution (BER) fiscal stimulus initiative.
Residential construction has declined despite population growth, largely as a result of a downturn in large scale multi-unit apartment developments, which struggled to attract investors and funding following the GFC.
Engineering construction.
05
10
15
20
25
$30b
2003 2004 2005 2006 2007 2008 2009 2010 2011
Source: ABS.
Residential construction.
05
10
15
20
25
$30b
2003 2004 2005 2006 2007 2008 2009 2010 2011
Source: ABS.
Non-residential construction.
05
10
15
20
25
$30b
2003 2004 2005 2006 2007 2008 2009 2010 2011
Source: ABS.

6The divergent trends have also resulted in a geographic imbalance in construction activity between the states and territories.
Construction activity heat map.
Percentage of national construction
Percentage of national population
Western Australia
Northern Territory
South Australia
New South Wales
Victoria
HotWarmNeutralCoolCold
23%10%
1%1%
5%7%
Queensland
24%20%
23%32%
20%25%
Source: ABS, IBISWorld.
Western Australia and Queensland are currently construction ‘hot spots’. Despite a combined 30% share of the total Australian population (and economic activity), construction activity in these two states represents almost half (47%) of construction activity nationwide. This is due to the phenomenal growth in engineering activity resulting primarily from the mining boom in these two states.
New South Wales is a ‘cold spot’, with only 23% of overall construction activity despite a 32% share of population. This not only reflects a lack of mining activity, but also weaker investment into housing than other non-mining states such as Victoria.

7A recent survey of construction industry participants identified a number of ongoing challenges, particularly in relation to subdued demand, planning and regulatory delays, skills shortages, and access to finance.
Planning and regulation.The industry perceives planning approval time frames to be protracted. On a state level, Queensland is rated as the worst (60% of respondents were concerned) whilst the best performer was Victoria. An overriding industry comment is earlier feedback from councils and other regulatory bodies would allow plans to be modified during the planning process.
Diminishing workload and confidence.The overall construction market is in decline and the immediate outlook does not look positive.
Skills shortages.The commodities boom is driving skills shortages across the resources and construction industries. The ongoing labour shortages, ranging from engineers to trades people (and particularly prevalent in relation to Construction and Project
Management Services), is increasing costs and delaying project completion within the construction industry (particularly Engineering Construction).
Increasing competition.The subdued demand in areas such as commercial and industrial building and new housing has resulted in very competitive pricing as market participants attempt to “buy” volume to satisfy their existing cost base. Not surprisingly, thin bid margins often compromise project profitability and leave little, if any buffer, to absorb the impact of cost overruns or completion delays. Aggressive bidding strategies have been particularly evident in large civil construction projects such as RiverCity Motorway, Airport Link and the Victorian desalination plant. The recent insolvencies of builders such as Reed Constructions and Galvin Construction have been linked, at least in part, to aggressive tendering.
Industrial relations.The recent deterioration in industrial relations is not anticipated to improve in the near term and there is a continuing disconnect between remuneration, productivity and project milestones.
Access to finance.Difficulties in accessing finance, particularly in the apartment, commercial and industrial sectors, has been a significant dampener of demand.
Planning and regulation
Diminishing workloadand confidence
Skills shortages
Increased competition
Industrial relations
Access to finance
Cost
Lack of Governmentspending
Perceived industry challenges.
11%
20%
22%
12%
11%
9%
8%
7%
Source: Davis Langdon.
8
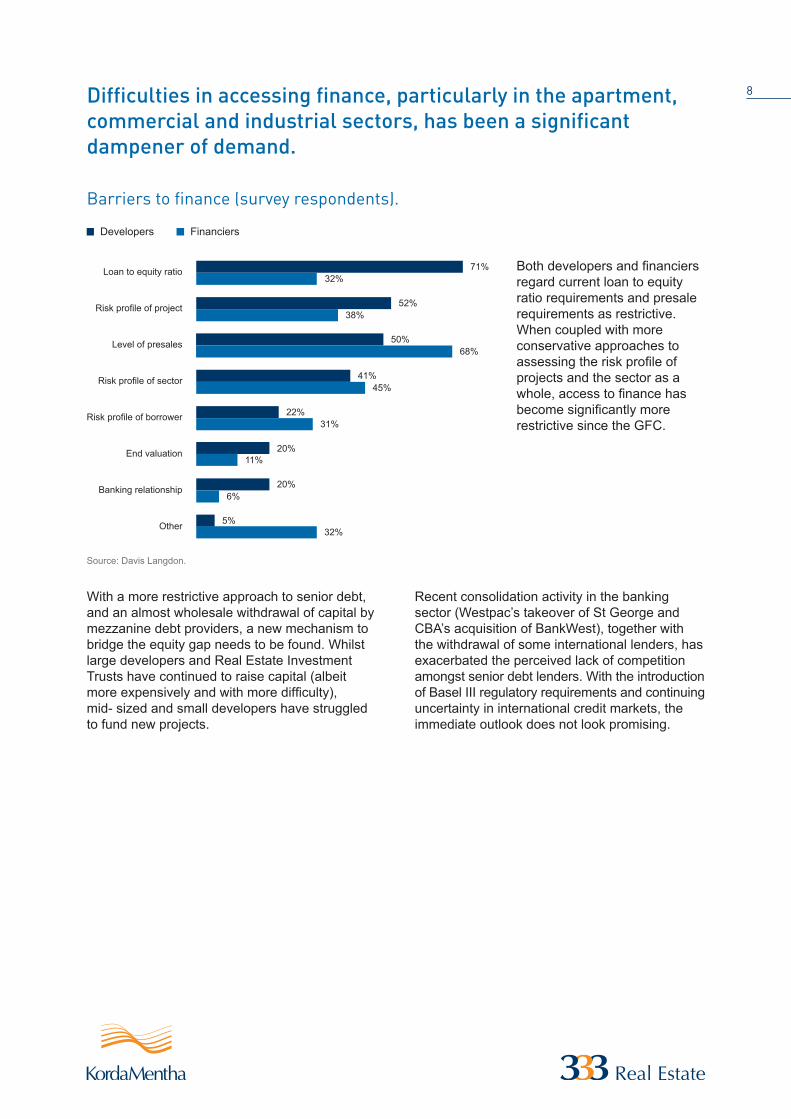
Barriers to finance (survey respondents).
22%31%
20%11%
52%38%
71%32%
50%68%
41%45%
Loan to equity ratio
Risk profile of project
Level of presales
Risk profile of sector
Risk profile of borrower
End valuation
Banking relationship
Other
20%6%
5%32%
Source: Davis Langdon.
FinanciersDevelopers
Difficulties in accessing finance, particularly in the apartment, commercial and industrial sectors, has been a significant dampener of demand.
With a more restrictive approach to senior debt, and an almost wholesale withdrawal of capital by mezzanine debt providers, a new mechanism to bridge the equity gap needs to be found. Whilst large developers and Real Estate Investment Trusts have continued to raise capital (albeit more expensively and with more difficulty), mid- sized and small developers have struggled to fund new projects.
Both developers and financiers regard current loan to equity ratio requirements and presale requirements as restrictive. When coupled with more conservative approaches to assessing the risk profile of projects and the sector as a whole, access to finance has become significantly more restrictive since the GFC.
Recent consolidation activity in the banking sector (Westpac’s takeover of St George and CBA’s acquisition of BankWest), together with the withdrawal of some international lenders, has exacerbated the perceived lack of competition amongst senior debt lenders. With the introduction of Basel III regulatory requirements and continuing uncertainty in international credit markets, the immediate outlook does not look promising.

9Industrial relations continues to be a major factor impacting productivity. A longer term historic improvement in relations appears to have reversed in recent years.
The construction industry has historically had a very high level of industrial disputes. Over the past ten years the level has fallen significantly although over the last two years there has been a resurgence in industrial action. This recent deterioration is not expected to improve in the near term. In a recent survey of industry participants, whilst 73% of respondents believed IR conditions were generally good, the number falls to 51% when asked about the next 12 month outlook.
Disputes in the Non-Residential sectors tend to be higher than in the Residential sector.
A continuing issue for industry participants is the relative disconnect between remuneration, productivity, and project milestones.
Industrial disputes.
Mar08 Sep08 Mar09 Sep09 Mar10 Sep10 Mar11 Sep11
0
10
20
30
40
50Workingdays lostper 1000employees
ConstructionAll industries
Source: ABS.

10The financial health of subcontractors is directly related to the financial viability of the head contractor, although union representation is often successful in protecting subcontractors in the event of insolvency.
The construction funding cycle.
Client Head contractor Sub contractors ATO
Subcontractor distress.
Subcontractors typically comprise around 70% of the value of a head contract. Head contractor financial difficulties and project performance issues will often impact the flow of funds and may result in subcontractor distress.
Subcontractor invoices head contractor for stage payments (often in advance of work done).
Utilise withheld ATO obligations as a funding line whilst awaiting payment from head contractor.
ATO will take action against the subcontractor if obligations continue to accrue and are not paid.
The Union will frequently represent subcontractors in the pursuit of unpaid monies as it would for individual members. This collective bargaining power typically improves the subcontractor position in the event of a head contractor withholding payment or in negotiating with a subsequently appointed Receiver or Voluntary Administrator.
The ATO has indicated a renewed focus on the tax positions of sectors that received support throughout the GFC. This is particularly relevant to construction subcontractors whose typically lumpy cash flow profiles often lead to the withholding of tax payments to fund short term working capital. The ability to continue to defer payment will likely be reduced going forward.
The Subcontractors Charges Act and Security for Payments Legislation protects subcontractors (by enabling the lodging of charges over head contractor funds in respect of unpaid work). However, this protection falls away in the event of insolvency.
Head contractexposure
Unionrepresentation
ATO liabilities
Protective legislation

11Profitability between construction sectors varies widely in response to downstream demand conditions and competition from firms in aligned markets.
Overall, the construction industry exhibits high levels of competitiveness, although at a firm level there are variations depending upon the size and focus of the contractor and given the lumpy and long term nature of many construction projects, the pipelines of particular firms. Not surprisingly, multi-disciplinary firms engaged on large scale engineering construction projects have exhibited less competitive behavior than smaller firms focused on smaller scale developments.
Profitability by sector (2011/12).
11.5%
10.6%
15.8%
12.5%
12.0%
11.8%
Overall construction industry
Heavy industry and other non building construction
Multi-unit apartment and townhouse construction
Institutional building construction
House construction
Road and bridge construction
Commercial and industrial building construction 4.5%
Source: IBISWorld.
The commercial and industrial building sectors are particularly competitive.
Many construction firms have managed to mitigate the full impact of low profitability in sectors such as commercial and industrial buildings by shifting activity across to higher profit aligned sectors such as institutional buildings.

Short term pain…The natural disasters in Queensland and Victoria in the summer of 2010/11 had a significantly disruptive impact on construction activity. In the six months to March 2011, over $21 billion of projects were put on hold. This compares with only $7.8 billion in the prior period.
The floods that occurred across Victoria had a much smaller impact on the state’s construction industry. The value of deferred projects actually decreased in the six months to March 2011 compared with the prior period.
…Longer term gain.Following the initial clean up and low level repair effort in the immediate aftermath of Cyclone Yasi and the floods, the full reconstruction effort gathered momentum in 2012 and is expected to continue into 2013 and 2014.
The primary beneficiaries of the $5.8 billion Cyclone Yasi reconstruction effort are house renovations and commercial buildings, as well as road and rail infrastructure and mining construction.
Of the $12 to $13 billion to be spent on flood reconstruction, around $4 to $5 billion will be directed towards housing (new constructions, repairs and renovations), $1.6 billion to non- residential building reconstruction (shops, warehouse, schools, hospitals etc.), $2.2 billion to engineering projects (mainly water supply and sewerage facilities and reconstruction of railways and harbours) and $2.7 billion to road and bridge reconstruction. The majority of these funds are expected to flow in 2012 and 2013.
$21.4 billionQueensland projects put on hold (six months to March 2011).
$5.8 billionEstimate of cost to reconstruct public infrastructure following Cyclone Yasi.
$12-13 billionEstimate of value of reconstruction activity following 2010/11 floods in Queensland and northern Victoria.
Natural disaster reconstruction beneficiaries.
7%
4%
23%
42%
18%
7%
Housing
Roads & bridges
Engineering
Commercial & industrial
Institutional
Other
Source: IBISWorld.
Natural disaster reconstruction:Short term pain, longer term gain.
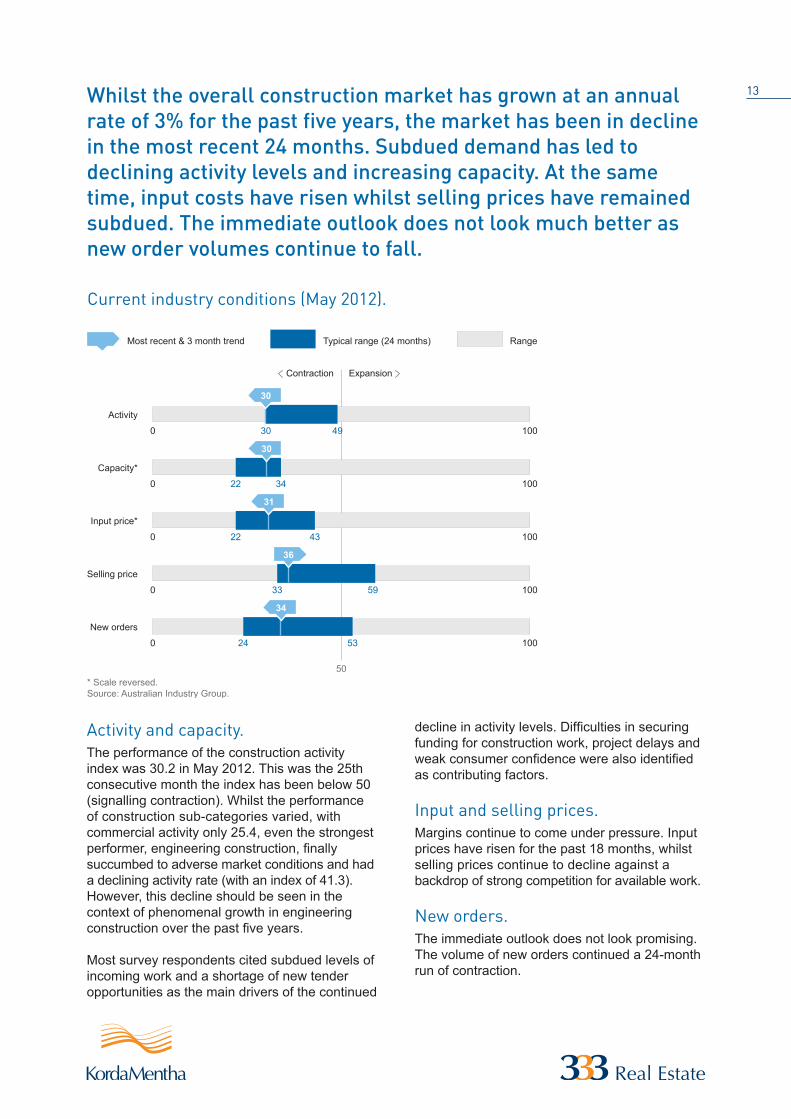
13Whilst the overall construction market has grown at an annual rate of 3% for the past five years, the market has been in decline in the most recent 24 months. Subdued demand has led to declining activity levels and increasing capacity. At the same time, input costs have risen whilst selling prices have remained subdued. The immediate outlook does not look much better as new order volumes continue to fall.
Activity and capacity.The performance of the construction activity index was 30.2 in May 2012. This was the 25th consecutive month the index has been below 50 (signalling contraction). Whilst the performance of construction sub-categories varied, with commercial activity only 25.4, even the strongest performer, engineering construction, finally succumbed to adverse market conditions and had a declining activity rate (with an index of 41.3). However, this decline should be seen in the context of phenomenal growth in engineering construction over the past five years.
Most survey respondents cited subdued levels of incoming work and a shortage of new tender opportunities as the main drivers of the continued
Current industry conditions (May 2012).
0 30 49 100
Activity
Most recent & 3 month trend Typical range (24 months)
ExpansionContraction
Range
0 3422 100
Capacity*
0 4322 100
Input price*
0 33 59 100
Selling price
0 24 53 100
50
New orders
34
36
31
30
30
* Scale reversed.Source: Australian Industry Group.
decline in activity levels. Difficulties in securing funding for construction work, project delays and weak consumer confidence were also identified as contributing factors.
Input and selling prices.Margins continue to come under pressure. Input prices have risen for the past 18 months, whilst selling prices continue to decline against a backdrop of strong competition for available work.
New orders.The immediate outlook does not look promising. The volume of new orders continued a 24-month run of contraction.

This publication, and the information contained therein, is prepared by KordaMentha Partners and staff. It is of a general nature and is not intended to address the circumstances of any particular individual or entity. It does not constitute advice, legal or otherwise, and should not be relied on as such. Professional advice should be sought prior to actions being taken on any of the information. The authors note that much of the material presented was originally prepared by others and this publication provides a summary of that material and the personal opinions of the authors.
Limited liability under a scheme approved under Professional Standards Legislation.
Contacts
MelbourneLevel 24333 Collins StreetMelbourne 3000Victoria, AustraliaTel: +61 3 8623 3333Fax: +61 3 8623 [email protected]
AdelaideLevel 470 Pirie StreetAdelaide 5000South Australia, AustraliaTel: +61 8 8212 6322Fax: +61 8 8212 [email protected]
Singapore30 Robinson RoadRobinson Towers#12-01Singapore 048546Tel: +65 6593 9333Fax: +65 6593 [email protected]
PerthLevel 1137 St Georges TerracePerth 6000Western Australia, AustraliaTel: +61 8 9220 9333Fax: +61 8 9220 [email protected]
TownsvilleLevel 675 Denham StreetTownsville 4810Queensland, AustraliaTel: +61 7 4724 5455Fax: +61 7 4724 [email protected]
SydneyLevel 5 Chifley Tower2 Chifley SquareSydney 2000New South Wales, AustraliaTel: +61 2 8257 3000Fax: +61 2 8257 [email protected]
BrisbaneLevel 1412 Creek StreetBrisbane 4000Queensland, Australia Tel: +61 7 3338 0222Fax: +61 7 3338 [email protected]
New ZealandLevel 16 Tower Centre45 Queen StreetAuckland 1010New ZealandTel: +64 9 307 7865Fax: +64 9 377 [email protected]