construction and start-up of the clewiston reverse osmosis ... · construction and start-up of the...
TRANSCRIPT
CONSTRUCTION AND START-UP OF THE CLEWISTON REVERSE OSMOSIS PLANT
Curtis “Kurt” A. Kiefer, P.E., BCEE, Vice President, CDM, Fort Lauderdale, FL
Kevin McCarthy, Utilities Director, City of Clewiston, Clewiston, FL Tom Hempstead, P.E., Project Engineer, CDM, Fort Lauderdale, FL
Frank A. Brinson, P.E., Vice President, McCafferty Brinson Consulting, Plantation, FL
1.0 Introduction
The City of Clewiston owns and operates the City's water distribution system; however, prior to completion of this project, the City purchased potable water from U.S. Sugar Corporation. The U.S. Sugar water treatment plant treats raw surface water drawn from Lake Okeechobee. The City of Clewiston is located on the south shore of Lake Okeechobee (as shown in Figure 1), which is Florida’s largest fresh water lake. In early 2003, the City began considering alternatives for discontinuing the use of Lake Okeechobee as a source of drinking water. Reasons cited for the proposed change include taste and odor problems related to algae blooms, reliability problems due to drought, and conflicts with the South Florida Water Management District (SFWMD) related to water management operations to control levels in the lake. In addition, on August 18, 2003, U.S. Sugar Corporation notified the City that they would like to discontinue the sale of potable water to the City in September 2006. U.S. Sugar Corporation subsequently postponed this date until September 2007. In 2003, the City commissioned a report that evaluated three alternatives for future potable water supply for the City. The report concluded that construction of a new Floridan aquifer raw water supply and low-pressure reverse osmosis water treatment plant (LPRO WTP), to be owned and operated by the City, was the most appropriate alternative to meet the City’s needs. The City requested Statements of Qualifications from qualified firms for professional engineering services associated with design and construction of the raw water supply, water treatment, and concentrate disposal facilities recommended in the preliminary engineering report. Pursuant to the selection process, on January 13, 2005, the City authorized Camp Dresser & McKee Inc. (CDM) to begin design of the facilities. CDM completed design of the facilities in October 2005. Construction of the facilities was completed, and the plant and other systems were brought on line in December 2007. The primary features of the project include:
• The raw water system consists of four upper Floridan aquifer wells, submersible well pumps, wellhead assemblies, raw water transmission piping to the WTP, and associated electrical and instrumentation improvements.
• The treatment process utilizes low-pressure reverse osmosis, with a design recovery rate of 75 percent and a raw water bypass blending rate of up to 7.5 percent.
• Concentrate disposal is through one new deep injection well (DIW), which is located at the City's wastewater treatment plant site.

• The WTP is located on a site adjacent to the City's public works facility which is located on the south side of the City.
• Plant improvements include one 1.5 million gallon (MG) finished water ground storage tank and four high service pumps, each of which has a capacity of 1,600 gpm, plus one jockey pump with a capacity of 750 gpm.
• Funding for the project was provided by the United States Department of Agriculture (USDA) Rural Development, United States Department of Commerce Economic Development Administration (EDA), and the South Florida Water Management District (SFWMD).
Figure 1 – Site Location Plan
2.0 Plant Design Concept As noted above, the Clewiston treatment process generally consists of a Floridan aquifer brackish raw water supply, low-pressure reverse osmosis with a 75 percent recovery rate and 7.5 percent raw water blend, product water degasification, and chemical post-treatment consisting of pH adjustment, disinfection, stabilization, and application of a corrosion inhibitor. Concentrate disposal is through a single Class I deep injection well system. The following subsections describe in detail the water quality goals and treatment objectives that were established during design for the project, as well as the individual process components and equipment.
2.1 Water Quality and Treatment Objectives Raw water for the plant is taken from four Floridan aquifer wells which are located both on and off the water treatment plant site. Because it is anticipated that water quality conditions may deteriorate over time as a result of continuous pumping of the wells, membrane performance projections were performed at both the initial and expected worst case (degraded) feed water quality. Membrane feed pumps and membranes were selected to meet water quality goals at the worst case raw water design conditions.
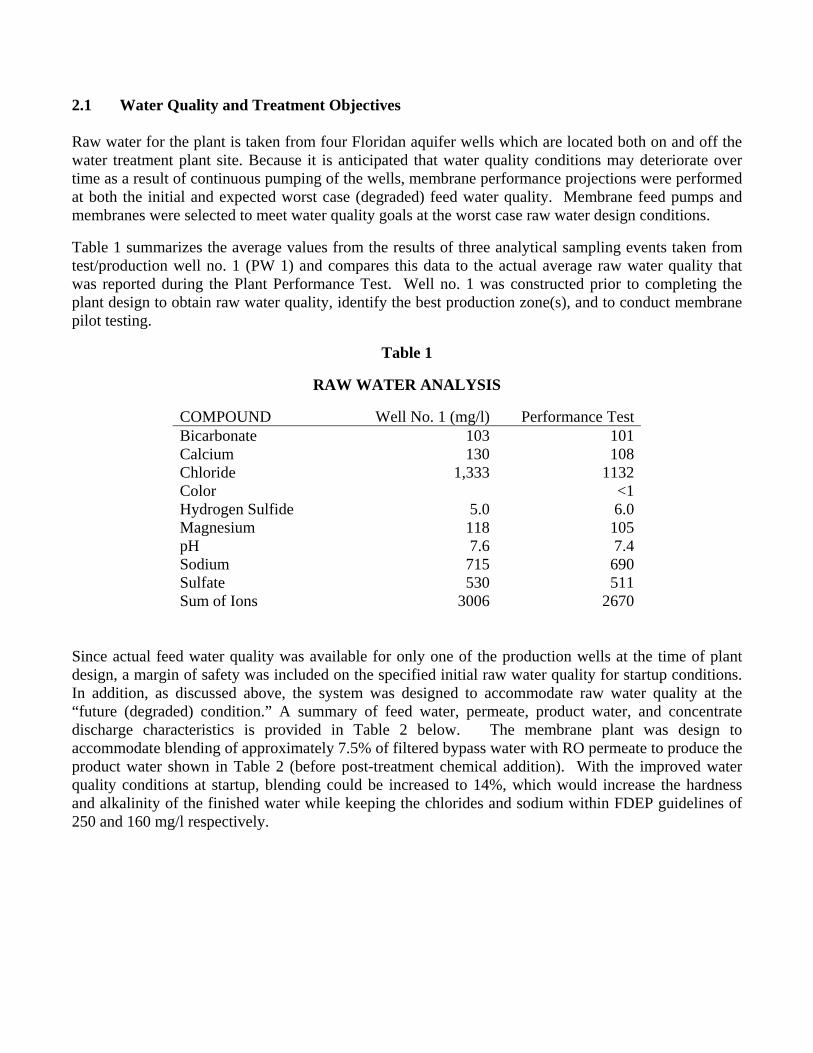
Table 1 summarizes the average values from the results of three analytical sampling events taken from test/production well no. 1 (PW 1) and compares this data to the actual average raw water quality that was reported during the Plant Performance Test. Well no. 1 was constructed prior to completing the plant design to obtain raw water quality, identify the best production zone(s), and to conduct membrane pilot testing.
Table 1
RAW WATER ANALYSIS
COMPOUND Well No. 1 (mg/l) Performance Test Bicarbonate 103 101 Calcium 130 108 Chloride 1,333 1132 Color <1 Hydrogen Sulfide 5.0 6.0 Magnesium 118 105 pH 7.6 7.4 Sodium 715 690 Sulfate 530 511 Sum of Ions 3006 2670
Since actual feed water quality was available for only one of the production wells at the time of plant design, a margin of safety was included on the specified initial raw water quality for startup conditions. In addition, as discussed above, the system was designed to accommodate raw water quality at the “future (degraded) condition.” A summary of feed water, permeate, product water, and concentrate discharge characteristics is provided in Table 2 below. The membrane plant was design to accommodate blending of approximately 7.5% of filtered bypass water with RO permeate to produce the product water shown in Table 2 (before post-treatment chemical addition). With the improved water quality conditions at startup, blending could be increased to 14%, which would increase the hardness and alkalinity of the finished water while keeping the chlorides and sodium within FDEP guidelines of 250 and 160 mg/l respectively.
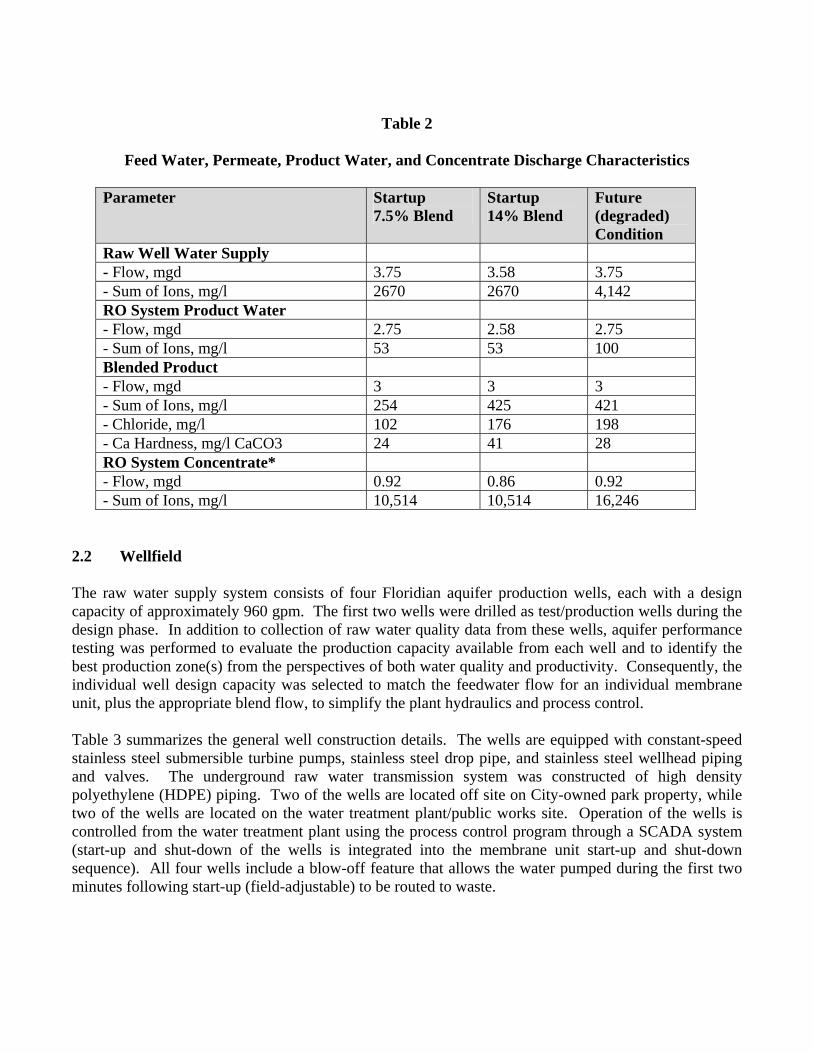
Table 2
Feed Water, Permeate, Product Water, and Concentrate Discharge Characteristics
Parameter Startup
7.5% Blend Startup 14% Blend
Future (degraded) Condition
Raw Well Water Supply - Flow, mgd 3.75 3.58 3.75 - Sum of Ions, mg/l 2670 2670 4,142 RO System Product Water - Flow, mgd 2.75 2.58 2.75 - Sum of Ions, mg/l 53 53 100 Blended Product - Flow, mgd 3 3 3 - Sum of Ions, mg/l 254 425 421 - Chloride, mg/l 102 176 198 - Ca Hardness, mg/l CaCO3 24 41 28 RO System Concentrate* - Flow, mgd 0.92 0.86 0.92 - Sum of Ions, mg/l 10,514 10,514 16,246
2.2 Wellfield The raw water supply system consists of four Floridian aquifer production wells, each with a design capacity of approximately 960 gpm. The first two wells were drilled as test/production wells during the design phase. In addition to collection of raw water quality data from these wells, aquifer performance testing was performed to evaluate the production capacity available from each well and to identify the best production zone(s) from the perspectives of both water quality and productivity. Consequently, the individual well design capacity was selected to match the feedwater flow for an individual membrane unit, plus the appropriate blend flow, to simplify the plant hydraulics and process control. Table 3 summarizes the general well construction details. The wells are equipped with constant-speed stainless steel submersible turbine pumps, stainless steel drop pipe, and stainless steel wellhead piping and valves. The underground raw water transmission system was constructed of high density polyethylene (HDPE) piping. Two of the wells are located off site on City-owned park property, while two of the wells are located on the water treatment plant/public works site. Operation of the wells is controlled from the water treatment plant using the process control program through a SCADA system (start-up and shut-down of the wells is integrated into the membrane unit start-up and shut-down sequence). All four wells include a blow-off feature that allows the water pumped during the first two minutes following start-up (field-adjustable) to be routed to waste.
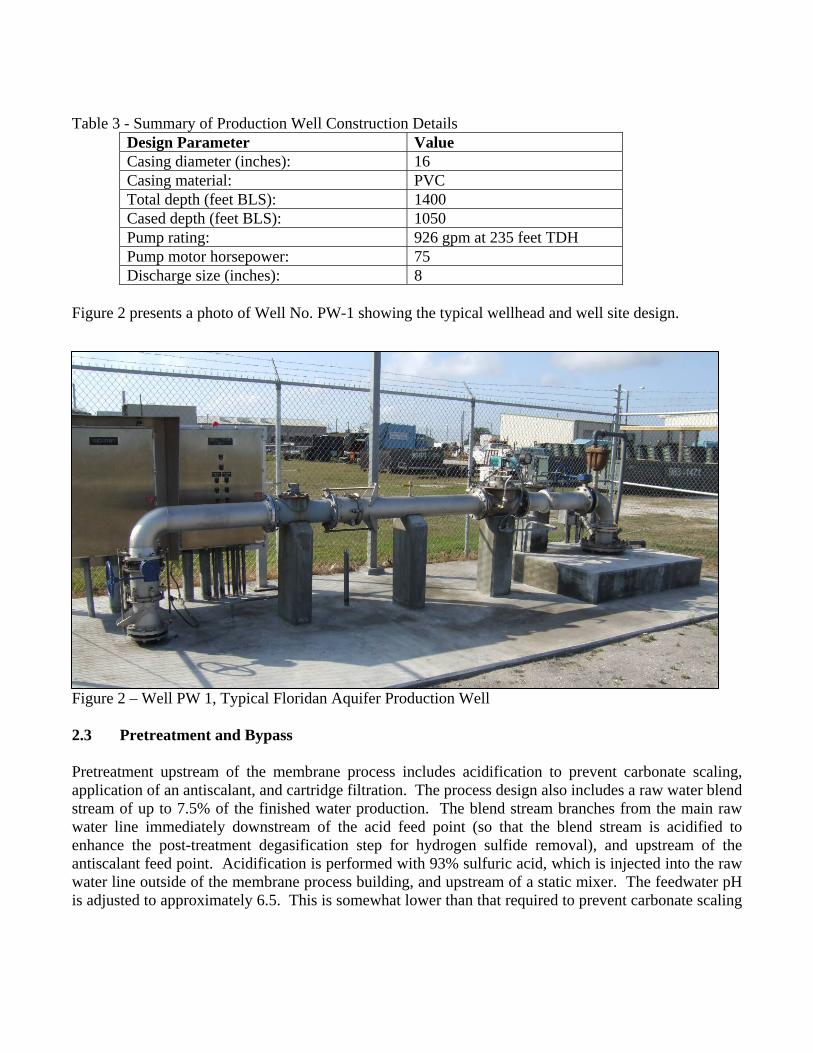
Table 3 - Summary of Production Well Construction Details
Design Parameter Value Casing diameter (inches): 16 Casing material: PVC Total depth (feet BLS): 1400 Cased depth (feet BLS): 1050 Pump rating: 926 gpm at 235 feet TDH Pump motor horsepower: 75 Discharge size (inches): 8
Figure 2 presents a photo of Well No. PW-1 showing the typical wellhead and well site design. Figure 2 – Well PW 1, Typical Floridan Aquifer Production Well 2.3 Pretreatment and Bypass Pretreatment upstream of the membrane process includes acidification to prevent carbonate scaling, application of an antiscalant, and cartridge filtration. The process design also includes a raw water blend stream of up to 7.5% of the finished water production. The blend stream branches from the main raw water line immediately downstream of the acid feed point (so that the blend stream is acidified to enhance the post-treatment degasification step for hydrogen sulfide removal), and upstream of the antiscalant feed point. Acidification is performed with 93% sulfuric acid, which is injected into the raw water line outside of the membrane process building, and upstream of a static mixer. The feedwater pH is adjusted to approximately 6.5. This is somewhat lower than that required to prevent carbonate scaling
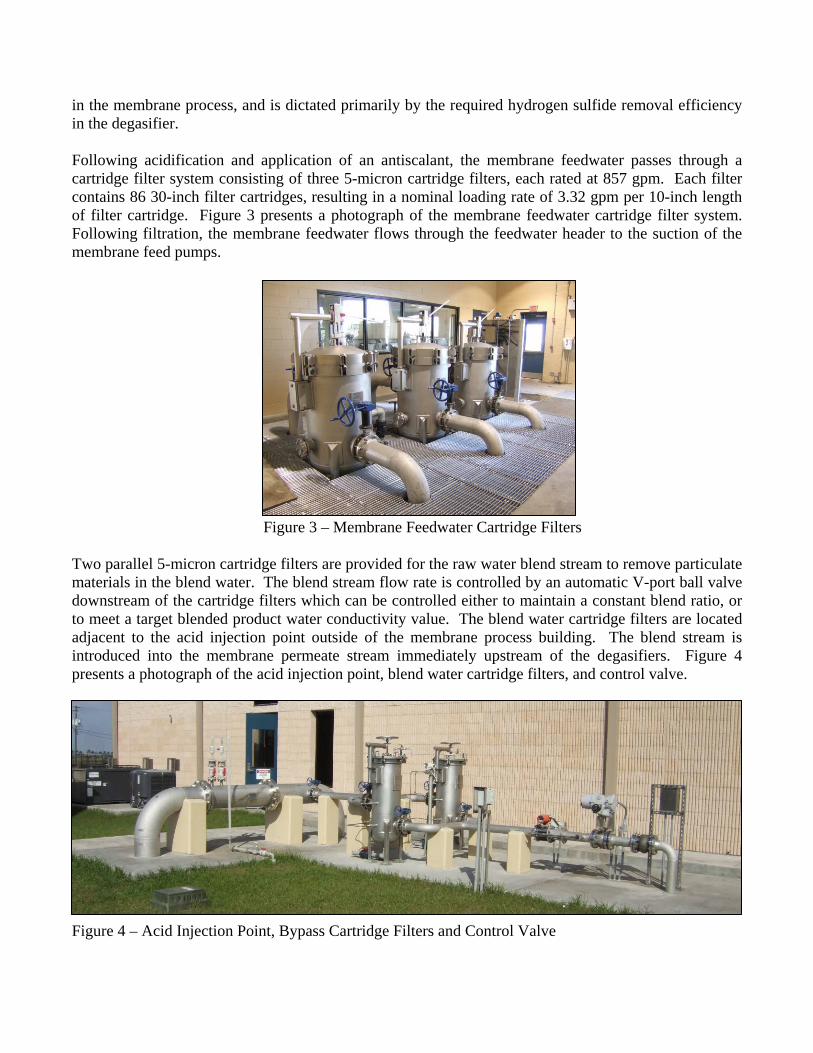
in the membrane process, and is dictated primarily by the required hydrogen sulfide removal efficiency in the degasifier. Following acidification and application of an antiscalant, the membrane feedwater passes through a cartridge filter system consisting of three 5-micron cartridge filters, each rated at 857 gpm. Each filter contains 86 30-inch filter cartridges, resulting in a nominal loading rate of 3.32 gpm per 10-inch length of filter cartridge. Figure 3 presents a photograph of the membrane feedwater cartridge filter system. Following filtration, the membrane feedwater flows through the feedwater header to the suction of the membrane feed pumps. Figure 3 – Membrane Feedwater Cartridge Filters Two parallel 5-micron cartridge filters are provided for the raw water blend stream to remove particulate materials in the blend water. The blend stream flow rate is controlled by an automatic V-port ball valve downstream of the cartridge filters which can be controlled either to maintain a constant blend ratio, or to meet a target blended product water conductivity value. The blend water cartridge filters are located adjacent to the acid injection point outside of the membrane process building. The blend stream is introduced into the membrane permeate stream immediately upstream of the degasifiers. Figure 4 presents a photograph of the acid injection point, blend water cartridge filters, and control valve. Figure 4 – Acid Injection Point, Bypass Cartridge Filters and Control Valve

2.4 Reverse Osmosis Plant Design features of the membrane treatment system are summarized in Table 4. The membrane system consists of three treatment units with a capacity of 925,000 gpd per unit. The combined capacity per unit including the 7.5 percent blend flow is 1 mgd. The membrane units are arranged in a 16:8 array. In addition, space has been provided in the building for the future addition of a fourth treatment unit.
Table 4 Reverse Osmosis System Design Basis
Membrane System Design and Operating Criteria
Membrane Feed Pumps Number of Membrane Feed Pumps Three Design Flow per Pump (gpm) 857 Total Installed Capacity (gpm) 3,429 Firm Capacity (gpm) 2,571 Design Discharge Pressure (ft) (TDH) 650 Pump Type Vertical Turbine Motor Size (HP) 200 Efficiency (%) 80 Drive Type Variable Frequency Membrane Treatment Skids Total Permeate Capacity (mgd) 2.775 Number of Skids 3 Capacity per Skid (mgd) 0.925 Design Recovery (%) 75 Number of Stages 2 Array Configuration 16:8 Elements per Pressure Vessel 7 Average Permeate Flux (gfd) 13.8 First Stage Permeate Backpressure (psi) 20 Total Permeate Backpressure (psi) 15
The membrane system design is based on a "dedicated" type pumping arrangement in which each membrane unit has its own dedicated feed pump, located adjacent to the unit. The dedicated pump arrangement allows the operator to adjust the output of the pump to meet the optimum performance of the associated membrane unit in terms of flow and pressure requirements based on the current conditions of the membranes in that unit. The membrane feed pumps are 316 stainless steel vertical turbine type mounted in 316 stainless steel suction barrels. Each membrane feed pump is equipped with a variable frequency drive (VFD). A membrane cleaning system is provided consisting of a stainless steel cleaning pump, two fiberglass cleaning tanks, stainless steel cartridge filter, and associated piping and valves.
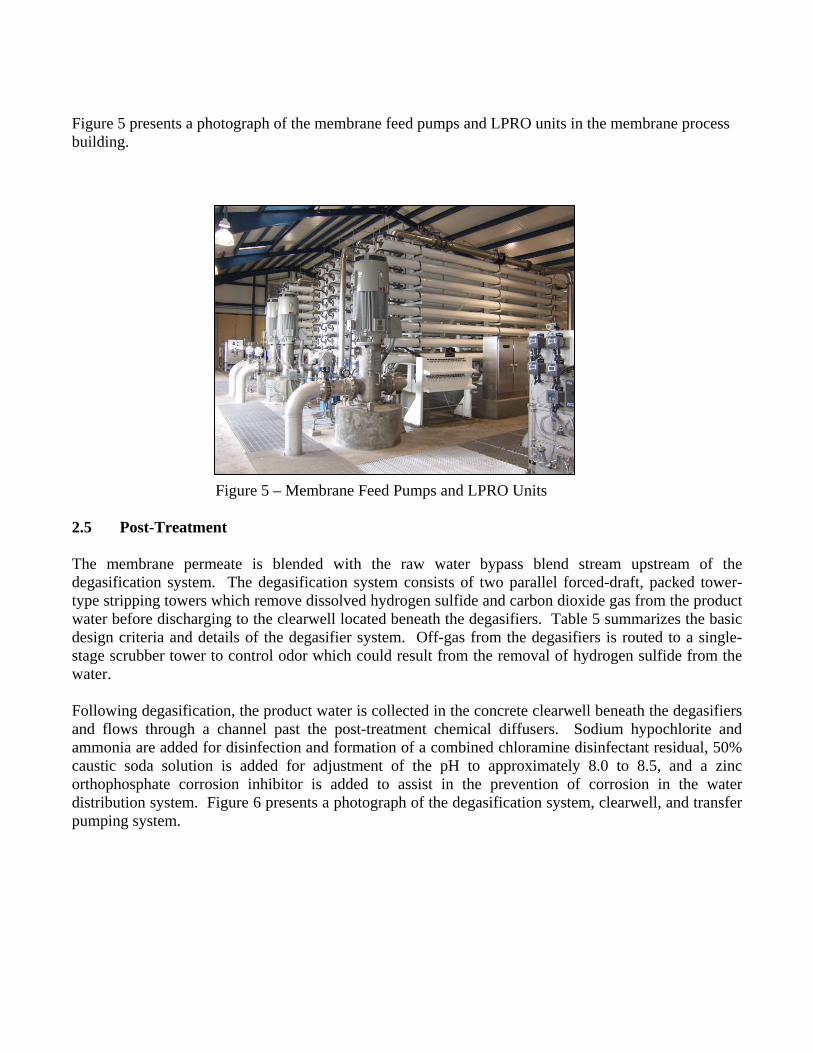
Figure 5 presents a photograph of the membrane feed pumps and LPRO units in the membrane process building. Figure 5 – Membrane Feed Pumps and LPRO Units 2.5 Post-Treatment The membrane permeate is blended with the raw water bypass blend stream upstream of the degasification system. The degasification system consists of two parallel forced-draft, packed tower-type stripping towers which remove dissolved hydrogen sulfide and carbon dioxide gas from the product water before discharging to the clearwell located beneath the degasifiers. Table 5 summarizes the basic design criteria and details of the degasifier system. Off-gas from the degasifiers is routed to a single-stage scrubber tower to control odor which could result from the removal of hydrogen sulfide from the water. Following degasification, the product water is collected in the concrete clearwell beneath the degasifiers and flows through a channel past the post-treatment chemical diffusers. Sodium hypochlorite and ammonia are added for disinfection and formation of a combined chloramine disinfectant residual, 50% caustic soda solution is added for adjustment of the pH to approximately 8.0 to 8.5, and a zinc orthophosphate corrosion inhibitor is added to assist in the prevention of corrosion in the water distribution system. Figure 6 presents a photograph of the degasification system, clearwell, and transfer pumping system.

Table 5 - Summary of Degasification System Design Design Parameter Value Number of units: Two Flow rate per unit: 1.5 mgd Inlet water pH: 6.5 Design hydrogen in inlet water: 5.0 mg/L Design hydrogen sulfide removal efficiency: 98 percent Design hydrogen sulfide in outlet water: 0.1 mg/L Design carbon dioxide in inlet water: 150 mg/L Design carbon dioxide removal efficiency: 90 percent Design carbon dioxide in outlet water: 15 mg/L Tower diameter: 7 feet Packing height: 9 feet Air-to-water ratio: >4.0 cfm per gpm Water loading rate: 29.4 gpm per square foot Air flow per vessel: 5,700 cfm Blower horsepower: 20
Figure 6 – Degasifiers, Clearwell, and Transfer Pumps

2.6 Storage and High Service Pump Station The degasified, post-treated product water flows through a serpentine channel in the clearwell to the transfer pumps, which pump the finished water to the 1.5 million gallon (MG) prestressed concrete finished water storage tank. The transfer pumping system consists of two vertical turbine pumps, each rated for 100% of the plant design capacity (3 mgd), and each equipped with a variable frequency drive (VFD). The VFDs are controlled to maintain a constant water level in the clearwell. The 1.5 MG ground storage tank provides storage of 50% of the system design maximum day demand (MDD). The finished water is pumped to distribution with the high service pump station, which consists of four horizontal split case high service pumps, each of which has a capacity of 1,600 gpm, plus one jockey pump with a capacity of 750 gpm. All of the high service pumps are equipped with VFDs, and the system is controlled to maintain a constant, operator-settable discharge pressure in the transmission/distribution system (approximately 65 to 70 psi). From the plant site, the City supplies water through individually metered connections to the City distribution system and the South Shore Water Association distribution system, which purchases water in bulk from the City. 2.7 Concentrate Disposal and Deep Injection Well As noted above, the membrane concentrate is disposed of in a Class I deep injection well (DIW) which is located on the City’s wastewater treatment plant site, approximately 1.5 miles south of the water treatment plant site. The concentrate is transported to the DIW through an 8-inch diameter HDPE concentrate transmission main. The residual concentrate pressure from the LPRO process at the plant is in excess of 100 psi, which is sufficient to transmit the concentrate through the transmission main and down the DIW without need of additional injection pumping. The injection well is a 10-inch diameter well with a tube-and-packer design. Table 6 presents a summary of the injection well design. Figure 7 presents a photograph of the completed injection well.
Figure 7 – Concentrate Disposal Deep Injection Well
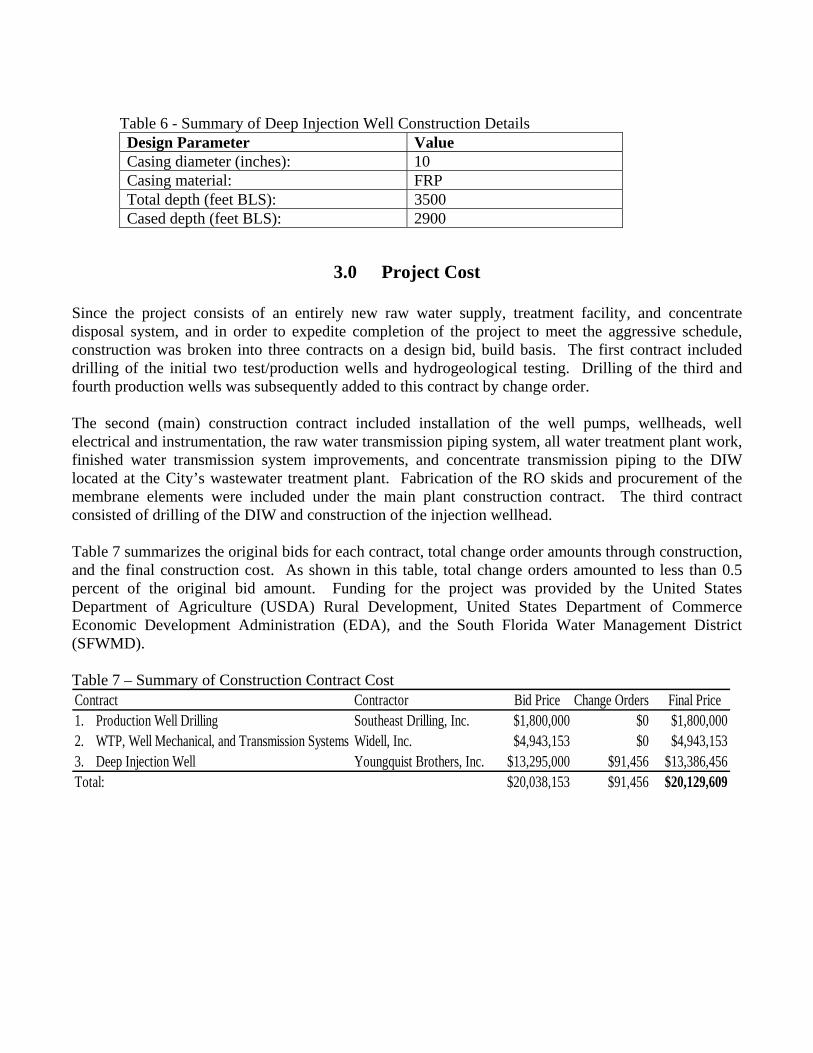
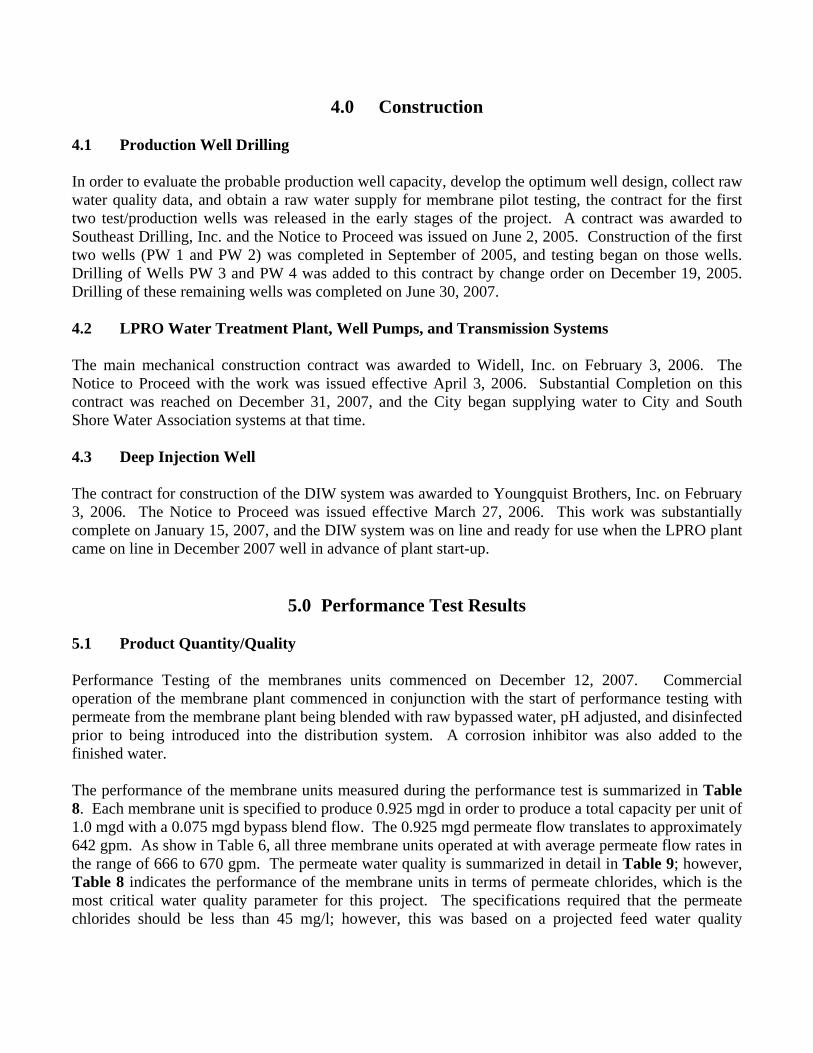
Table 6 - Summary of Deep Injection Well Construction Details
3.0 Project Cost
Since the project consists of an entirely new raw water supply, treatment facility, and concentrate disposal system, and in order to expedite completion of the project to meet the aggressive schedule, construction was broken into three contracts on a design bid, build basis. The first contract included drilling of the initial two test/production wells and hydrogeological testing. Drilling of the third and fourth production wells was subsequently added to this contract by change order. The second (main) construction contract included installation of the well pumps, wellheads, well electrical and instrumentation, the raw water transmission piping system, all water treatment plant work, finished water transmission system improvements, and concentrate transmission piping to the DIW located at the City’s wastewater treatment plant. Fabrication of the RO skids and procurement of the membrane elements were included under the main plant construction contract. The third contract consisted of drilling of the DIW and construction of the injection wellhead. Table 7 summarizes the original bids for each contract, total change order amounts through construction, and the final construction cost. As shown in this table, total change orders amounted to less than 0.5 percent of the original bid amount. Funding for the project was provided by the United States Department of Agriculture (USDA) Rural Development, United States Department of Commerce Economic Development Administration (EDA), and the South Florida Water Management District (SFWMD). Table 7 – Summary of Construction Contract Cost Contract Contractor Bid Price Change Orders Final Price 1. Production Well Drilling Southeast Drilling, Inc. $1,800,000 $0 $1,800,0002. WTP, Well Mechanical, and Transmission Systems Widell, Inc. $4,943,153 $0 $4,943,1533. Deep Injection Well Youngquist Brothers, Inc. $13,295,000 $91,456 $13,386,456Total: $20,038,153 $91,456 $20,129,609
Design Parameter Value Casing diameter (inches): 10 Casing material: FRP Total depth (feet BLS): 3500 Cased depth (feet BLS): 2900
4.0 Construction 4.1 Production Well Drilling In order to evaluate the probable production well capacity, develop the optimum well design, collect raw water quality data, and obtain a raw water supply for membrane pilot testing, the contract for the first two test/production wells was released in the early stages of the project. A contract was awarded to Southeast Drilling, Inc. and the Notice to Proceed was issued on June 2, 2005. Construction of the first two wells (PW 1 and PW 2) was completed in September of 2005, and testing began on those wells. Drilling of Wells PW 3 and PW 4 was added to this contract by change order on December 19, 2005. Drilling of these remaining wells was completed on June 30, 2007.
4.2 LPRO Water Treatment Plant, Well Pumps, and Transmission Systems The main mechanical construction contract was awarded to Widell, Inc. on February 3, 2006. The Notice to Proceed with the work was issued effective April 3, 2006. Substantial Completion on this contract was reached on December 31, 2007, and the City began supplying water to City and South Shore Water Association systems at that time. 4.3 Deep Injection Well The contract for construction of the DIW system was awarded to Youngquist Brothers, Inc. on February 3, 2006. The Notice to Proceed was issued effective March 27, 2006. This work was substantially complete on January 15, 2007, and the DIW system was on line and ready for use when the LPRO plant came on line in December 2007 well in advance of plant start-up.
5.0 Performance Test Results 5.1 Product Quantity/Quality Performance Testing of the membranes units commenced on December 12, 2007. Commercial operation of the membrane plant commenced in conjunction with the start of performance testing with permeate from the membrane plant being blended with raw bypassed water, pH adjusted, and disinfected prior to being introduced into the distribution system. A corrosion inhibitor was also added to the finished water. The performance of the membrane units measured during the performance test is summarized in Table 8. Each membrane unit is specified to produce 0.925 mgd in order to produce a total capacity per unit of 1.0 mgd with a 0.075 mgd bypass blend flow. The 0.925 mgd permeate flow translates to approximately 642 gpm. As show in Table 6, all three membrane units operated at with average permeate flow rates in the range of 666 to 670 gpm. The permeate water quality is summarized in detail in Table 9; however, Table 8 indicates the performance of the membrane units in terms of permeate chlorides, which is the most critical water quality parameter for this project. The specifications required that the permeate chlorides should be less than 45 mg/l; however, this was based on a projected feed water quality

containing 1500 mg/l of chlorides. Correcting the specified chloride concentration to reflect the actual feedwater quality at the time of the Performance Test results in a required permeate chloride concentration of less than 33 mg/l. As shown in Table 8, all three membrane units had permeate chlorides well below 33 mg/l in the range of 17.5 to 21.5 mg/l. As shown in Tale 8 the specified maximum transmembrane pressure for this project was 240 psi. This value was also corrected to adjust for differences in the design water quality versus the actual water quality at the time of Performance Testing. Based on the lower TDS water at the time of testing, the corrected required transmembrane pressure was 222 psi. As shown in Table 8 the actual transmembrane pressures for all membrane units were well below the 222 psi requirement and were in the range of 172 to 178 psi. Table 8 also indicates the specified system flux and the maximum first stage average flux. The higher overall system flux results from the fact that the units were operated at an average permeate flow closer to 668 gpm as compared to the design flow of 642 gpm. Similarly, the first stage flux is generally higher than specified because the units were operating at higher than the required production capacity. However, the Contractor will be instructed to adjust the permeate flow balance between the first and second stages to better balance the flux between stages. Table 8 Membrane System Design Criteria Parameter
Membrane Units
Unit 1 Unit 2 Unit 3
Permeate Capacity per Unit (mgd) 0.925 0.963 0.959 0.965 Permeate Capacity per Unit (gpm) 642 669 666 670 Required Permeate Chlorides - Spec Analysis
<45 20.8 21.5 17.5
Required Permeate Chlorides - Performance Test Conditions
<33 20.8 21.5 17.5
Design Recovery per Unit (%) 75 75 76 75 Maximum Transmembrane Pressure (psi) at design water quality
240 178 172 173
Maximum Transmembrane Pressure (psi) corrected for Performance Test conditions
222 178 172 173
Maximum Average Permeate Flux Rate per Unit (gfd)
13.8 14.3 14.3 14.4
Maximum Average Stage One Permeate Water Flux (gfd)
16.5 16.4 16.6 17
5.2 Analytical Results The analytical test results for the permeate, based on sample events performed during the Performance Test of the membrane units, are summarized in Table 9. In addition, the average feed water quality measured during the performance test was summarized in Table 1. The primary parameters of interest for this project are chloride, sodium, hardness, alkalinity, and hydrogen sulfide. As discussed previously

the specifications required that the permeate chloride concentration should be below 45 mg/l based on the design water analysis included in the specifications. Correcting this value to adjust for the actual water quality at the time of Performance testing versus the design water quality, the required permeate chloride concentration should be adjusted to 33 mg/l. The chloride concentration for all units was well below this concentration and ranged from 17.5 to 21.5 mg/l. On a similar basis the corrected sodium concentration should be less than 25 mg/l versus the actual permeate concentrations that were in the range of 12.8 to 15.3 mg/l.
TABLE 9. PERFORMANCE TESTING PROJECTED RAW WATER QUALITY AND REQUIRED PERMEATE QUALITY FOR RO
SYSTEM TEST RESULTS
Finished
Projected Membrane
Required Membrane
Permeate Water Parameter Unit Raw Water Permeate Train
1 Train
2 Train
3 Average Bicarbonate Mg/L 101 <40 10.4 11.5 9.5 10.5 19 Calcium Mg/L 108 <5 1.8 1.7 1.6 1.7 9.7 Chloride Mg/L 1500 <45 20.8 21.5 17.5 20 103 Cl2 Residual Mg/L 3 Color CU 5 <1 <1 <1 <1 <1 <1 Hardness CaCO3 813 <40 7.7 7.9 6.9 7.5 62 Hydrogen Sulfide Mg/L 5 <0.5 <0.05 <0.05 <0.05 <0.05 <0.05 Iron Mg/L 0.25 <0.05 <0.02 <0.02 <0.02 <0.02 <0.022 LSI 0.23 pH -- 7.8 6.7 6.7 6.7 6.7 8.2 Sodium Mg/L 865 <35 15.3 15.3 12.8 14.5 65 Sulfate Mg/L 530 <15 7.1 8.7 5.8 7.2 45 TDS Mg/L 3319 <110 52.8 56.0 45.3 53 254
TOC Mg/L as C 1 <1.0 <0.5 <0.5 <0.5 <0.5
THMFP Mg/l <0.028** 0.002 0.002 0.002 0.002 HAAFP Mg/l <0.022*** <0.001 <0.001 <0.001 <0.001
Removal of hardness and alkalinity is not an important design consideration for this project; instead, hardness and alkalinity are primarily of interest from the standpoint of using the bypass blend to increase hardness and alkalinity in the finished water. As shown in Table 9 calcium hardness is reduced to approximately 4.3 mg/l (1.7 mg/l as Ca) and alkalinity is reduced to 8.6 mg/l (10.5 mg/l as HCO3) in the
permeate. As shown in Table 2 with bypass blending, the calcium hardness can be increased to the range of 24 to 41 mg/l depending on the percentage of bypass employed. Hydrogen sulfide in the raw water was measured at approximately 6 mg/l versus the 5 mg/l which was originally anticipated. However, the results of the analyses that were performed on the permeate from the degasifiers indicates that the hydrogen sulfide was still reduced to less than 0.05 mg/l. The raw water for this project is low in TOC, trihalomethane formation potential (THMFP) and haloacetic acid formation potential (HAAFP) and as shown in Table 9 concentrations of these parameters are very low in the permeate. Permeate TOC is less than 0.5 mg/l and the concentrations of THMFP and HAAFP are 0.002 mg/l and <0.001 mg/l respectively.
6.0 Conclusion The City of Clewiston 3 mgd reverse osmosis plant is a grass roots facility that included new raw water supply wells, new water treatment plant, deep injection disposal well, 1.5 mg ground storage tank, high service pumping and the associated raw water and concentrate disposal transmission mains. The detailed design of the plant was completed in ten months and the plant was constructed in approximately two years. The total construction cost for the new grassroots facility including the wellfield, water treatment plant, and deep injection well was approximately $20.1 million dollars. The plant was constructed with the total value of change orders at less than 0.5 percent of the plant construction cost. The plant was commissioned and the Performance testing was completed in January of 2008. The plant met all of the specified performance requirements including rated capacity and all of the specified water quality parameters. The rated capacity was achieved at transmembrane pressures well below the specified values.