constraints on secular evolution in unbarred spiral
TRANSCRIPT

April 23rd 2012
Constraints on secular evolutionin unbarred spiral galaxies:
understanding bulge and disk formation
Marja Kristin Seidel
Instituto de Astrofísica de Canarias
www.iac.es/project/traces
Jesús Falcón - Barroso
July 10th 2012

April 23rd 2012
Constraints on secular evolutionin unbarred spiral galaxies:
understanding bulge and disk formation
Marja Kristin Seidel
Instituto de Astrofísica de Canarias
www.iac.es/project/traces
July 10th 2012
disentangling disk heating agents
Jesús Falcón - Barroso

talk on: www.iac.es/project/traces
Introduction: Disk heating
More than half of the stellar mass in the local Universe is found in disk galaxies (e.g. Driver et al. 2007) but we are far from understanding them.
Especially: What is driving the heating of the disk?
Investigate 3D-distribution of stellar velocity dispersionsellipsoid with axes ratios: σz/σR (and σϕ/σR) σz
σR
Possible disk heating agents:• encounters with giant molecular clouds (GMCs)• scattering by dark halo objects or globular clusters • perturbation by spiral structure • perturbation by stellar bars• dissolution of young stellar clusters• disturbances by satellite galaxies or minor mergers
(e.g. from Spitzer & Schwarzschild, 1951 to Saha et al. 2010)

talk on: www.iac.es/project/traces
Introduction: Disk heating
Model predictions
• encounters with GMCs (Sellwood, 2008): 3D agent • perturbation by spiral structure (Jenkins & Binney, 1990): σR
Age
• radial migration (e.g. Roskar et al. 2008): σR increases with age
Metallicity
• for an existing metallicity gradient (e.g. Sánchez-Blázquez, 2009)* : σz/σR increase with metallicity
*still present even with satellites!
But: in the solar neighborhood little evidence for the age-metallicity-relation (e.g. Feltzing et al., 2001)

talk on: www.iac.es/project/traces
Introduction: Our study
Our study focuses on:
• 6 disk galaxies across the Hubble sequence
• obtaining the ages and metallicities in different regions of the galaxies via full-spectrum fitting techniques
• relating these stellar population parameters with earlier kinematic results, i.e. σz/σR and the individual values (Shapiro & Gerssen 2003 and 2012)

talk on: www.iac.es/project/traces
Sample
NGC 4030 (Sbc)NGC 1068 (Sb) NGC 2775 (Sa/Sab)NGC 2460 (Sa)
NGC 2280 (Scd)NGC 3810 (Sc)
KPNO
NTT
Disk-heating (Shapiro & Gerssen 2003 and 2012)
credit: HST/WFPC2 image
spectra with resolutions of ~ 30 km s-1 and ~ 23 km s-1
different regions from radial surface brightness profiles and disk scale lengths: center bulge [trans] disk
Note: all our galaxies show central sigma drops!

gal_3810mj_cor.fits [Bin 1 ; x = -15.0 ; SN= 15.5]
0 500 1000 1500
2
4
6
8
10
12
V= 1062.6, != 2.0 km/s
0 500 1000 1500pixels
0
10
20
30
cou
nts
4800 5000 5200 5400Restwavelength [Angstroms]
0
2
4
6
8
10
Co
un
ts
H"
4
86
1.3
3
[OII
I]
4
95
8.9
1
[OII
I]
5
00
6.8
4
Mg
b
5
17
5.3
6
Fe
52
70
5
27
0.0
0
Fe
53
35
5
33
5.0
0
Fe
54
06
5
40
6.0
0
talk on: www.iac.es/project/traces
MethodspPXF (Cappellari & Emsellem, 2004) ; Gandalf (Sarzi et al. 2006)STARLIGHT (Cid Fernandes, 2007)
gal_3810mj_cor.fits [Bin 1 ; x = -15.0 ; SN= 15.5]
0 500 1000 1500
2
4
6
8
10
12
V= 1062.6, != 2.0 km/s
0 500 1000 1500pixels
0
10
20
30
cou
nts
4800 5000 5200 5400Restwavelength [Angstroms]
0
2
4
6
8
10
Co
un
ts
H"
4
86
1.3
3
[OII
I]
4
95
8.9
1
[OII
I]
5
00
6.8
4
Mg
b
5
17
5.3
6
Fe
52
70
5
27
0.0
0
Fe
53
35
5
33
5.0
0
Fe
54
06
5
40
6.0
0
NGC 3810 (Sc) DISK
pPXF
Gandalf+ELODIE
0.4
0.6
0.8
1
1.2
4800 5000 5200 5400
-0.2
0
0.2
0
20
40
0 5 10 15
0
20
400.4
0.6
0.8
1
1.2
4800 5000 5200 5400
-0.2
0
0.2
0
20
40
0 5 10 15
0
20
400.4
0.6
0.8
1
1.2
4800 5000 5200 5400
-0.2
0
0.2
0
20
40
0 5 10 15
0
20
400.4
0.6
0.8
1
1.2
4800 5000 5200 5400
-0.2
0
0.2
0
20
40
0 5 10 15
0
20
400.4
0.6
0.8
1
1.2
4800 5000 5200 5400
-0.2
0
0.2
0
20
40
0 5 10 15
0
20
40
Starlight + Miles models
(Prugniel et al. 2007)
(Sánchez-Blazquez et al.2006)
λ [Å]
Inte
nsi
ty [
arb.
un
its]
Analyze the stellar populations!
mass & luminosity weighted agesmetallicities
For all three regions in major and minor axes:

How can stellar populations help us to understand • secular evolution in spirals?
• disk heating processes?

talk on: www.iac.es/project/traces
Preliminary results: Ages and [Fe/H]
age [Gyr]
[Fe / H]
center centerbulge bulgedisk disk
Luminosity weighted Mass weighted
Young populations dominate the luminosity weighted age (e.g. Serra & Trager, 2006)We mostly confirm inside-out growth scenario (e.g. Muños-Mateos, 2007)In our sample: late types show stronger [Fe/H] gradients than the early types (adding to MacArthur et al., 2009)
0 5 10 15 20age [Gyr]
50
100
150
200
250
!R
SaSabSb
SbcSc
Scd
repr. error

0 5 10 15 20age [Gyr]
50
100
150
200
250
!R
SaSabSb
SbcSc
Scd
talk on: www.iac.es/project/traces
Preliminary results: Ages and [Fe/H]
age [Gyr]
[Fe / H]
center centerbulge bulgedisk disk
Luminosity weighted Mass weighted
Young populations dominate the luminosity weighted age (e.g. Serra & Trager, 2006)We mostly confirm inside-out growth scenario (e.g. Muños-Mateos, 2007)In our sample: late types show stronger [Fe/H] gradients than the early types (adding to MacArthur et al., 2009)
repr. error

6 J.Gerssen & K. Shapiro Griffin
Figure 4. Velocity ellipsoid ratio σz/σR as a function of galactictype (Hubble stage T). The solid points show the results thatwe obtained previously (Shapiro et al. 2003). The results that wederive in this paper for two late type spirals are shown as theopen circles. Horizontal errors represent the uncertainty inherentin galaxy classification (Naim et al. 1995). The filled square is thevalue in the Solar Neighbourhood derived from Hipparcos data(Dehnen & Binney 1998).
units (IFUs) to observe velocity dispersions in disk galaxies.This is observationally more efficient than obtaining long-slitspectra, one at a time, along two (or more) position angles.Additionally, since IFUs uniformly sample velocity disper-sions along both azimuth and radius across the disk, theassumption of the epicycle approximation, employed herefor long-slit data, can be relaxed. Noordermeer et al. (2008)use the PPAK IFU to explore velocity dispersions in diskgalaxies and to constrain the shape of the velocity ellipsoidin one system, NGC 2985. Their measurement of σz/σR
≈ 0.7 is consistent with our previous result for this sys-tem (0.75± 0.09; Gerssen et al. 2000) and confirms that theepicycle theory we assume is indeed applicable in this galaxy.
In a series of conference proceedings Westfall et al.(2008, 2010) present their ongoing work with the SparsePAKand PPAK IFUs to constrain the velocity ellipsoid shapeand its radial variation in a sample of spiral galaxies. Theseauthors find a strong dependence on their modelled veloc-ity ellipsoid shape with their measurement techniques andassumptions; they present and describe an analysis compa-rable to ours for a single galaxy, NGC 3982 (Sb), for whichthey find σz/σR = 0.31 − 0.73 over a radial range of 1− 2photometric scalelengths, broadly consistent with our resultsfor galaxies of similar Hubble type. These authors also findsome evidence for variation in the velocity ellipsoid ratiowith radius, indicating the potential of IFU data in futurestudies of the velocity ellipsoid in external galaxies.
4.4 The Velocity Ellipsoid across the Hubble
Sequence
The SAURON team has used the IFU of the same nameto study the kinematics of elliptical and lenticular galaxiesand have shown that many early-type galaxies, the so-called
Figure 5. Velocity ellipsoid ratio σz/σR as a function ofinclination- and extinction-corrected galaxy colour (available inHyperLeda for 7 of our 8 spirals and the fast-rotating E/S0s). Theblack points indicate our spiral galaxy data, and the red squaresare the data of Cappellari et al. (2007) for fast-rotating E andS0 galaxies. The linear fit (dashed line) is to the spiral galaxiesonly. The probability of no correlation, null hypothesis H0, is onepercent.
“fast rotators,” are bulge-dominated galaxies that neverthe-less contain a significant disk component (Kuntschner et al.2006; Krajnovic et al. 2008). It is therefore interesting toinvestigate how the disks of these early-type galaxies arerelated to those in spiral galaxies.
Cappellari et al. (2007) have used axisymmetricSchwarzschild dynamical models to extract the three-dimensional orbital structure of a subsample of theSAURON galaxies and measure the shape of their velocityellipsoids. These anisotropy measurements are luminosity-weighted, giving more weight to the high-density equatorialplane, and volume-averaged, giving more weight to largerradii; as a result, the global anisotropies (see table 2 ofCappellari et al. 2007) are dominated by the disks and aretherefore comparable to our measurements in later-typegalaxies (Cappellari et al. private communication). SinceHubble T-type is less meaningful in early-type galaxiesthan in spirals, we cannot add these points directly toFigure 4. Instead we use galaxy B−V colour as a proxy formorphological type and plot this quantity against σz/σR inFigure 5 for both the SAURON sample and our sample ofspiral galaxies. Colours are taken from HyperLeda2 and arelisted for our sample in Table 4.
The combined data span the Hubble sequence from Eto Scd and show the strong correlation between velocity el-lipsoid ratio and galaxy colour, as expected from Figure 4,given the known relationship between galaxy colour andHubble type. In Figure 5, we find a continuous trend of in-creasing anisotropy in bluer galaxies. Moreover, we find thatthe anisotropies of the E/S0 galaxies overlap with those ofthe earliest-type spirals in our sample. However, in the bluest
2 http://leda.univ-lyon1.fr/
c© 0000 RAS, MNRAS 000, 000–000
talk on: www.iac.es/project/traces
Preliminary results: Disk heating
Evolutionary stellar population synthesis 1659
Figure 17. Variation of Balmer line-strength indices with metallicity pre-dicted by our single stellar population models of 10 Gyr and Kroupa uni-versal IMF. Different line styles show predictions for indices measured atdifferent spectral resolutions, as in Fig. 14.
Figure 18. Comparison of the Hβ index computed on the basis of theempirical fitting functions of Worthey et al. (1994), using the models ofVazdekis et al. (1996), as updated in this work and transformed to the LIS-8.4 Å system following Table A2, with the index measured on the SSP SEDs,once smoothed to the LIS-8.4 Å resolution. For the lowest metallicity, weonly plot the results for SSPs older than 10 Gyr according to our qualitativeanalysis shown in the second panel of Fig. 6. However, for the sake ofthe discussion we also show the predictions based on the Lick/IDS fittingfunctions for [M/H] = −1.7, even though we do not consider them to be ofgood quality because of the low number of stars at those metallicities.
Figure 19. We plot the broad-band B − V colour derived from the SSPSEDs for different ages and metallicities (as indicated within the panel) andthe Kroupa universal IMF with the zero-point set with two different Vegaspectra in black (very thin) and red (thicker) (see the text for details). Thethickest green line represents the photometric colour computed by Vazdekiset al. (1996), as updated in this work, which is based on extensive empiricalphotometric stellar libraries.
of ∼4300 Å are significantly larger than for the redder part of thespectra for all the clusters. We do not discard possible effects due tothe fact that the Milky Way GCs show oxygen-enhanced abundanceratios for low metallicities. In fact, Cassisi et al. (2004) have shownthat such effects become relevant for the spectral ranges covered bythe B, and mostly U, broad-band filters. Therefore, an appropriatemodelling for these clusters requires working with such α-enhancedstellar evolutionary isochrones as well as the use of stellar spectrawith a similar abundance pattern. In addition, we also require touse specific stellar spectra with CN-strong absorption features andCN-enhanced isochrones.
In Fig. 21, we show our SED fit to the integrated spectrum ofthe standard open cluster M67 (Schiavon, Caldwell & Rose 2004).Unlike for the GCs of Fig. 20, these authors obtained the integratedspectrum for M67 by co-adding individual spectra of cluster mem-bers, weighted according to their luminosities and relative numbers.The age and metallicity obtained are in good agreement with theseauthors (see also Schiavon 2007) and with our isochrone fitting re-sults (Vazdekis et al. 1996) within the uncertainties. The residualsonly show a low-frequency pattern, which is related to differencesin the flux calibration. However, the higher frequency residuals arenegligible. It is particularly interesting that, unlike in Fig. 20, wedo not see the residuals bluewards of 4300 Å. This shows that allrelevant spectral types are present in the MILES library. Therefore,the residuals obtained for Galactic GCs can be attributed to thenon-solar abundance ratios present in these clusters. However, we
C© 2010 The Authors. Journal compilation C© 2010 RAS, MNRAS 404, 1639–1671
Gerssen & Shapiro, 2012 Vazdekis et al., 2010
With our stellar population results: is it possible to relate these two findings?
age [Gyr]
B-V
Z

talk on: www.iac.es/project/traces
Preliminary results: σz/σR
-1.2 -1.0 -0.8 -0.6 -0.4 -0.2 -0.0 0.2[MgFe]
0.0
0.2
0.4
0.6
0.8
1.0
1.2
1.4
!z/!
R
SaSabSbSbcScScd
So far, only tentative correlations for both, [Fe/H] being stronger.
0 5 10 15 20age [Gyr]
50
100
150
200
250
!R
SaSab
SbSbc
ScScd
0 5 10 15 20age [Gyr]
0.0
0.2
0.4
0.6
0.8
1.0
1.2
1.4
!z/!
R
SaSab
SbSbc
ScScd
H0 = 80% H0 = 20%
σ z/σ
R
[ km
s-1
]
age [Gyr] [Fe/H]0 5 10 15
1.4
1.2
1.0
0.8
0.6
0.4
0.2
0.0

talk on: www.iac.es/project/traces
Preliminary results: σR
Best correlation obtained for σR with age:
Consistent with simulated predictions (Roskar et al. 2008a, 2008b): if radial migration of stars is present, one expects an increase of σR with age
σR
[
km s
-1 ]
age [Gyr]0 5 10 15 20
age [Gyr]
50
100
150
200
250!
R
SaSabSb
SbcSc
Scd
0 5 10 15 20age [Gyr]
50
100
150
200
250
!R
SaSab
SbSbc
ScScd
H0 = 30%

talk on: www.iac.es/project/traces
Discussion: σR
Best correlation obtained for σR with age:
Consistent with simulated predictions (Roskar et al. 2008a, 2008b): if radial migration of stars is present, one expects an increase of σR with age
σR
[
km s
-1 ]
age [Gyr]
0 5 10 15 20age [Gyr]
50
100
150
200
250
!R
SaSabSb
SbcSc
Scd
0 5 10 15 20age [Gyr]
50
100
150
200
250
!R
SaSab
SbSbc
ScScd
L66 ROSKAR ET AL. Vol. 675
Fig. 1.—Azimuthally averaged properties of the disk at 1, 5, and 10 Gyr.The top panels show the stellar surface density profiles, with the dotted linesrepresenting double exponential fits. The two exponential components werefit simultaneously to the profile, excluding the innermost and outermost regions.The point of intersection of the two exponentials is taken as the break radius.In all panels, the vertical lines indicate the location of the break. The secondrow shows the surface density of cool gas. In the third row, we show the SFRdensity calculated from the stellar mass formed in the previous 10 Myr. Themean stellar age (normalized by time of output) as a function of radius isshown in the bottom row.
formation which is caused in our simulation by a rapid decreasein the surface density of cool gas; (3) the outer disk is populatedby stars that have migrated, on nearly circular orbits, from theinner disk, and consequently the break is associated with asharp change in the radial mean stellar age profile; and (4)break parameters agree with current observations.
2. SIMULATION METHODOLOGY
Resolved stellar population data in disk outskirts, which arenow becoming available (e.g., Ferguson et al. 2007; Barker etal. 2007; de Jong et al. 2007), provide strong constraints ontheories of break formation. Therefore, the inclusion of SF andfeedback is required to assess break formation models. For thisreason we have run simulations of gas cooling, collapsing, andforming stars inside a live dark matter halo within which thegas is initially in hydrostatic equilibrium. This has the furtheradvantage of making no assumptions about the angular mo-mentum distribution within the disk, which can strongly affectits subsequent evolution (Debattista et al. 2006).
We construct initial conditions as in Kaufmann et al. (2007).The initial system consists of a virialized spherical NFW darkmatter halo (Navarro et al. 1997) and an embedded sphericalhot baryonic component containing 10% of the total mass andfollowing the same density distribution, which at the end ofthe simulation yields a disk mass fraction of ∼5%. The masswithin the virial radius is M . A temperature gradient in1210 ,
the gas component ensures an initial gas pressure equilibriumfor an adiabatic equation of state. Velocities of gas particlesare initialized according to a cosmologically motivated specificangular momentum distribution with and an overall spinj ∝ rparameter (Bullock et al. 2001).3 1/2l p ( j/G)(FEF/M ) p 0.039
Each component is modeled by particles; the dark matter610halo is composed of two shells, with the inner halo of 9 #
particles (each of mass ∼1 # 106 M ) extending to 200510 ,
kpc and an outer halo of particles (each of mass ∼3.551 # 10# 106 M ) beyond. All gas particles initially have a mass of,
M . We use a softening length of 100 pc for all51.4 # 10 ,
dark matter particles and 50 pc for baryonic particles. We adoptthe best-fit values from Stinson et al. (2006) for the parametersgoverning the physics of star formation and feedback. Ourcooling prescriptions do not account for effects of UV back-ground or metal line cooling. The global criteria for SF arethat a gas particle has to have cm!3, T ! 15,000 K andn 1 0.1be a part of a converging flow; efficiency of star formation is0.05, i.e., 5% of gas eligible to form stars is converted intostars per dynamical time. Star particles form with an initialmass of 1/3 gas particle mass, which at our resolution corre-sponds to M . A gas particle may spawn multiple44.6 # 10 ,
star particles but to avoid gas particles of unreasonably smallmass, the minimum gas particle mass is restricted to 1/5 of theinitial mass. The simulation is evolved with the parallel SPHcode GASOLINE (Wadsley et al. 2004) for 10 Gyr.
We have also performed simulations with and par-5 710 10ticles per component, thus bracketing our fiducial run. Whilethe details of the gas cooling are somewhat resolution-depen-dent (Kaufmann et al. 2006), resulting in morphological dif-ferences, we find convergence in the modeling of overall halocooling, star formation and its dependence on gas surface den-sity, and disk dynamics. We therefore consider the conclusionsand predictions of this Letter numerically robust. The par-610ticle resolution used here represents a compromise betweenadequate statistics for detailed analysis in the outer disk andcomputational cost for 10 Gyr of evolution.
Our simulation should be thought of as modeling disk for-mation and evolution from the cooling of hot gas after the lastgas-rich major merger, as suggested by cosmological simula-tions (Brook et al. 2004, 2007). Although we make use ofsimplifications such as an initially spherical distribution of mat-ter, a lack of halo substructure, the ignoring of subsequentaccretion of dark matter and baryons, and an initial gas densityprofile that mimics that of the dark matter, studying the ide-alized isolated case allows us to analyze in detail the importantdynamical processes affecting the evolution of a massive iso-lated disk. The lessons we learn from this idealized case willlater be applied to galaxies evolved in a full cosmologicalcontext (R. Roskar et al., in preparation).
3. BREAK FORMATION AND THE OUTER DISK
In Figure 1, the break is already evident as soon as a stabledisk forms at 1 Gyr, moving outward as the disk grows andpersisting throughout the simulation. A sharp drop in the localSFR is always present at the break radius. The drop in SFR isnot due to a volume density threshold for star formation, butis instead associated with a rapid decrease in the gas surfacedensity (the star formation follows a Kennicutt-Schmidt law atall times) and a corresponding sharp increase in the Toomre Qparameter. We verified that the break is not seeded by our starformation recipe by running several simulations with differentvalues of the threshold density and found that the location ofthe break did not depend on the particular value used. Sincedensity is inversely proportional to radius, the cooling timeincreases outward. By construction, the angular momentum isdirectly proportional to cylindrical radius, which means thathigher angular momentum material will take longer to cool.
H0 = 30%

talk on: www.iac.es/project/traces
Discussion: Spiral structure - σR
Transcient spiral arms (Sellwood&Binney, 2002), no increase in σz, but increase in σR Comparison with arm-class (Gerssen & Shapiro, 2012): best for σR
10 J.Gerssen & K. Shapiro Griffin
Figure 7. The velocity ellipsoid shape and magnitudes as a function of the H2 gas surface density. Gas densities are estimated from theCO measurements of Young et al. (1995) and are computed as average values over the radii used in our kinematic analysis. Left: Thevelocity ellipsoid shapes are not correlated with the molecular gas surface density. Middle: There is a hint that the vertical componentof the velocity dispersion is correlated with ΣH2
, but the scatter is too large to state this conclusively. Right: The radial componentincreases with molecular gas density.
Figure 8. The velocity ellipsoid shape and magnitudes as a function of arm class, as defined in Elmegreen & Elmegreen (1987) toquantify the orderliness of spiral structure from flocculent (class 1) to grand-design (class 12). Note that there is no arm-class 10 and 11(cf., Figure 1 in Elmegreen & Elmegreen 1987). Left: The velocity ellipsoid shape is not correlated with arm class. Middle: The verticalmagnitude of the ellipsoid decreases with arm class.Right: There is a clear trend between arm class and radial component, as expectedfrom the Toomre Q criterion, see text. Note that for plotting purposes we have added small offsets to galaxies with the same arm class.
here. This research has made use of the Hyperleda database(http://leda.univ-lyon1.fr) and of the NASA/IPAC Extra-galactic Database, which is operated by the Jet PropulsionLaboratory, California Institute of Technology, under con-tract with the National Aeronautics and Space Administra-tion.
REFERENCES
Barbanis B., Woltjer L., 1967, ApJ, 150, 461Benson A. J., Lacey C. G., Frenk C. S., Baugh C. M., ColeS., 2004, MNRAS, 351, 1215
Binney J., 2012, ArXiv e-printsBinney J., Dehnen W., Bertelli G., 2000, MNRAS, 318, 658Cappellari M., Emsellem E., 2004, PASP, 116, 138Cappellari M., Emsellem E., Bacon R., Bureau M., DaviesR. L., de Zeeuw P. T., Falcon-Barroso J., Krajnovic D.,
Kuntschner H., McDermid R. M., Peletier R. F., Sarzi M.,van den Bosch R. C. E., van de Ven G., 2007, MNRAS,379, 418
Carlberg R. G., Dawson P. C., Hsu T., Vandenberg D. A.,1985, ApJ, 294, 674
Casetti-Dinescu D. I., Girard T. M., Korchagin V. I., vanAltena W. F., 2011, ApJ, 728, 7
Comeron S., Knapen J. H., Beckman J. E., 2008, A&A,485, 695
Dehnen W., Binney J. J., 1998, MNRAS, 298, 387
Driver S. P., Allen P. D., Liske J., Graham A. W., 2007,ApJ, 657, L85
Elmegreen D. M., Elmegreen B. G., 1987, ApJ, 314, 3
Eskridge P. B., Frogel J. A., Pogge R. W., Quillen A. C.,Berlind A. A., Davies R. L., DePoy D. L., Gilbert K. M.,Houdashelt M. L., Kuchinski L. E., Ramırez S. V., Sell-gren K., Stutz A., Terndrup D. M., Tiede G. P., 2002,
c© 0000 RAS, MNRAS 000, 000–000
BUT: trend for σz with both age, metallicity and arm-class found however, not as strong as for σR .
0 5 10 15 20age [Gyr]
50
100
150
200
250
!R
SaSab
SbSbc
ScScd
σ R
[ km
s-1
]
age [Gyr]0 5 10 15 20
age [Gyr]
50
100
150
200
250
!R
SaSab
SbSbc
ScScd
H0 = 30%
talk on: www.iac.es/project/traces
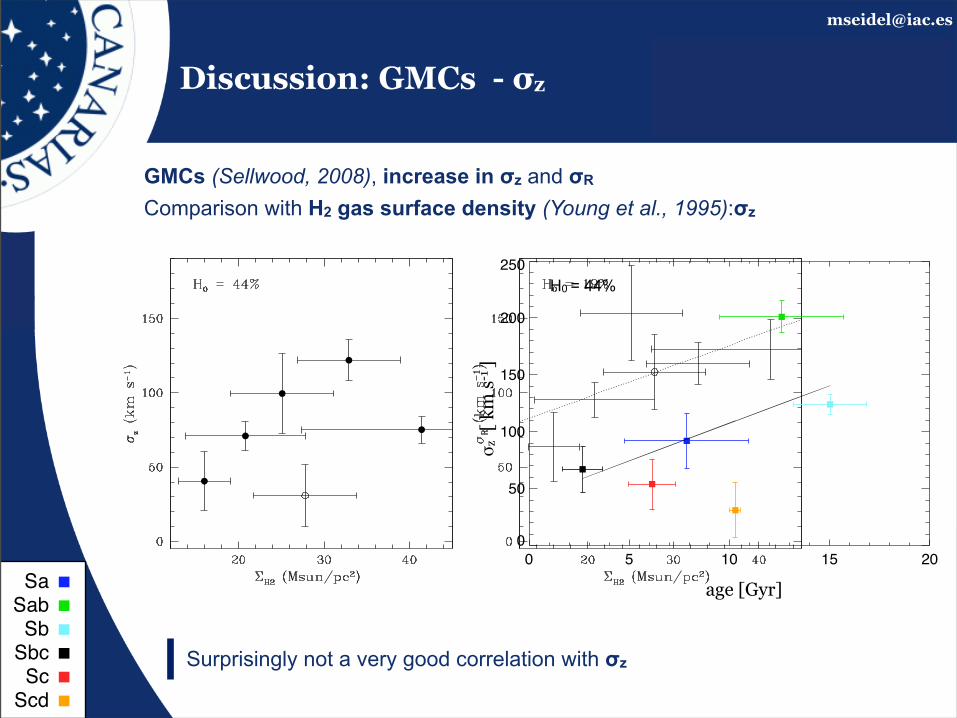
Discussion: GMCs - σz
GMCs (Sellwood, 2008), increase in σz and σR Comparison with H2 gas surface density (Young et al., 1995):σz 10 J.Gerssen & K. Shapiro Griffin
Figure 7. The velocity ellipsoid shape and magnitudes as a function of the H2 gas surface density. Gas densities are estimated from theCO measurements of Young et al. (1995) and are computed as average values over the radii used in our kinematic analysis. Left: Thevelocity ellipsoid shapes are not correlated with the molecular gas surface density. Middle: There is a hint that the vertical componentof the velocity dispersion is correlated with ΣH2
, but the scatter is too large to state this conclusively. Right: The radial componentincreases with molecular gas density.
Figure 8. The velocity ellipsoid shape and magnitudes as a function of arm class, as defined in Elmegreen & Elmegreen (1987) toquantify the orderliness of spiral structure from flocculent (class 1) to grand-design (class 12). Note that there is no arm-class 10 and 11(cf., Figure 1 in Elmegreen & Elmegreen 1987). Left: The velocity ellipsoid shape is not correlated with arm class. Middle: The verticalmagnitude of the ellipsoid decreases with arm class.Right: There is a clear trend between arm class and radial component, as expectedfrom the Toomre Q criterion, see text. Note that for plotting purposes we have added small offsets to galaxies with the same arm class.
here. This research has made use of the Hyperleda database(http://leda.univ-lyon1.fr) and of the NASA/IPAC Extra-galactic Database, which is operated by the Jet PropulsionLaboratory, California Institute of Technology, under con-tract with the National Aeronautics and Space Administra-tion.
REFERENCES
Barbanis B., Woltjer L., 1967, ApJ, 150, 461Benson A. J., Lacey C. G., Frenk C. S., Baugh C. M., ColeS., 2004, MNRAS, 351, 1215
Binney J., 2012, ArXiv e-printsBinney J., Dehnen W., Bertelli G., 2000, MNRAS, 318, 658Cappellari M., Emsellem E., 2004, PASP, 116, 138Cappellari M., Emsellem E., Bacon R., Bureau M., DaviesR. L., de Zeeuw P. T., Falcon-Barroso J., Krajnovic D.,
Kuntschner H., McDermid R. M., Peletier R. F., Sarzi M.,van den Bosch R. C. E., van de Ven G., 2007, MNRAS,379, 418
Carlberg R. G., Dawson P. C., Hsu T., Vandenberg D. A.,1985, ApJ, 294, 674
Casetti-Dinescu D. I., Girard T. M., Korchagin V. I., vanAltena W. F., 2011, ApJ, 728, 7
Comeron S., Knapen J. H., Beckman J. E., 2008, A&A,485, 695
Dehnen W., Binney J. J., 1998, MNRAS, 298, 387
Driver S. P., Allen P. D., Liske J., Graham A. W., 2007,ApJ, 657, L85
Elmegreen D. M., Elmegreen B. G., 1987, ApJ, 314, 3
Eskridge P. B., Frogel J. A., Pogge R. W., Quillen A. C.,Berlind A. A., Davies R. L., DePoy D. L., Gilbert K. M.,Houdashelt M. L., Kuchinski L. E., Ramırez S. V., Sell-gren K., Stutz A., Terndrup D. M., Tiede G. P., 2002,
c© 0000 RAS, MNRAS 000, 000–000
Surprisingly not a very good correlation with σz
0 5 10 15 20age [Gyr]
50
100
150
200
250
!R
SaSab
SbSbc
ScScd
0 5 10 15 20age [Gyr]
0
50
100
150
200
250
!z
SaSab
SbSbc
ScScd
σ z
[ km
s-1
]
age [Gyr]
H0 = 44%

talk on: www.iac.es/project/traces
Discussion: GMCs - σR
10 J.Gerssen & K. Shapiro Griffin
Figure 7. The velocity ellipsoid shape and magnitudes as a function of the H2 gas surface density. Gas densities are estimated from theCO measurements of Young et al. (1995) and are computed as average values over the radii used in our kinematic analysis. Left: Thevelocity ellipsoid shapes are not correlated with the molecular gas surface density. Middle: There is a hint that the vertical componentof the velocity dispersion is correlated with ΣH2
, but the scatter is too large to state this conclusively. Right: The radial componentincreases with molecular gas density.
Figure 8. The velocity ellipsoid shape and magnitudes as a function of arm class, as defined in Elmegreen & Elmegreen (1987) toquantify the orderliness of spiral structure from flocculent (class 1) to grand-design (class 12). Note that there is no arm-class 10 and 11(cf., Figure 1 in Elmegreen & Elmegreen 1987). Left: The velocity ellipsoid shape is not correlated with arm class. Middle: The verticalmagnitude of the ellipsoid decreases with arm class.Right: There is a clear trend between arm class and radial component, as expectedfrom the Toomre Q criterion, see text. Note that for plotting purposes we have added small offsets to galaxies with the same arm class.
here. This research has made use of the Hyperleda database(http://leda.univ-lyon1.fr) and of the NASA/IPAC Extra-galactic Database, which is operated by the Jet PropulsionLaboratory, California Institute of Technology, under con-tract with the National Aeronautics and Space Administra-tion.
REFERENCES
Barbanis B., Woltjer L., 1967, ApJ, 150, 461Benson A. J., Lacey C. G., Frenk C. S., Baugh C. M., ColeS., 2004, MNRAS, 351, 1215
Binney J., 2012, ArXiv e-printsBinney J., Dehnen W., Bertelli G., 2000, MNRAS, 318, 658Cappellari M., Emsellem E., 2004, PASP, 116, 138Cappellari M., Emsellem E., Bacon R., Bureau M., DaviesR. L., de Zeeuw P. T., Falcon-Barroso J., Krajnovic D.,
Kuntschner H., McDermid R. M., Peletier R. F., Sarzi M.,van den Bosch R. C. E., van de Ven G., 2007, MNRAS,379, 418
Carlberg R. G., Dawson P. C., Hsu T., Vandenberg D. A.,1985, ApJ, 294, 674
Casetti-Dinescu D. I., Girard T. M., Korchagin V. I., vanAltena W. F., 2011, ApJ, 728, 7
Comeron S., Knapen J. H., Beckman J. E., 2008, A&A,485, 695
Dehnen W., Binney J. J., 1998, MNRAS, 298, 387
Driver S. P., Allen P. D., Liske J., Graham A. W., 2007,ApJ, 657, L85
Elmegreen D. M., Elmegreen B. G., 1987, ApJ, 314, 3
Eskridge P. B., Frogel J. A., Pogge R. W., Quillen A. C.,Berlind A. A., Davies R. L., DePoy D. L., Gilbert K. M.,Houdashelt M. L., Kuchinski L. E., Ramırez S. V., Sell-gren K., Stutz A., Terndrup D. M., Tiede G. P., 2002,
c© 0000 RAS, MNRAS 000, 000–000
Correlation with σR better! Adding to spiral structure?
0 5 10 15 20age [Gyr]
50
100
150
200
250
!R
SaSab
SbSbc
ScScd
σ R
[ km
s-1
]
age [Gyr]0 5 10 15 20
age [Gyr]
50
100
150
200
250
!R
SaSab
SbSbc
ScScd
GMCs (Sellwood, 2008), increase in σz and σR Comparison with H2 gas surface density (Young et al., 1995): best for σR
H0 = 30%

talk on: www.iac.es/project/traces
Summary and Outlook
Potential relation between disk heating agents and stellar ages and Z. Strongest suspect: spiral structure in addition with GMCs:
However, it will be interesting to check:
• truly radial dependencies within the disk to even better compare with model predictions
• separate distinct populations in our SFHs to better understand the interplay of bulge, disk and individual components
• obtain a larger sample of galaxies in order to increase our statistics and the reliability of our results
check figure
Brad Gibson papers!!
1) best correlation for [Fe/H] with σz/σR 2) good correlation for age with σR

talk on: www.iac.es/project/traces
talk on: www.iac.es/project/traces
…any questions? - apart from this one...
talk on: www.iac.es/project/traces
!
Thank you for listening

talk on: www.iac.es/project/traces
Backup
MORE SLIDES TO ILLUSTRATE IF WANTED

talk on: www.iac.es/project/traces
Backup1990MNRAS.245..305J
(Jenkins & Binney, 1990)

talk on: www.iac.es/project/traces
Discussion: Disk heating
Comparison with Roskar et al. 2008 and Sánchez-Blázquez et al. 2009:
Consistent with both simulations, but:which can be the disk heating agent ?
L66 ROSKAR ET AL. Vol. 675
Fig. 1.—Azimuthally averaged properties of the disk at 1, 5, and 10 Gyr.The top panels show the stellar surface density profiles, with the dotted linesrepresenting double exponential fits. The two exponential components werefit simultaneously to the profile, excluding the innermost and outermost regions.The point of intersection of the two exponentials is taken as the break radius.In all panels, the vertical lines indicate the location of the break. The secondrow shows the surface density of cool gas. In the third row, we show the SFRdensity calculated from the stellar mass formed in the previous 10 Myr. Themean stellar age (normalized by time of output) as a function of radius isshown in the bottom row.
formation which is caused in our simulation by a rapid decreasein the surface density of cool gas; (3) the outer disk is populatedby stars that have migrated, on nearly circular orbits, from theinner disk, and consequently the break is associated with asharp change in the radial mean stellar age profile; and (4)break parameters agree with current observations.
2. SIMULATION METHODOLOGY
Resolved stellar population data in disk outskirts, which arenow becoming available (e.g., Ferguson et al. 2007; Barker etal. 2007; de Jong et al. 2007), provide strong constraints ontheories of break formation. Therefore, the inclusion of SF andfeedback is required to assess break formation models. For thisreason we have run simulations of gas cooling, collapsing, andforming stars inside a live dark matter halo within which thegas is initially in hydrostatic equilibrium. This has the furtheradvantage of making no assumptions about the angular mo-mentum distribution within the disk, which can strongly affectits subsequent evolution (Debattista et al. 2006).
We construct initial conditions as in Kaufmann et al. (2007).The initial system consists of a virialized spherical NFW darkmatter halo (Navarro et al. 1997) and an embedded sphericalhot baryonic component containing 10% of the total mass andfollowing the same density distribution, which at the end ofthe simulation yields a disk mass fraction of ∼5%. The masswithin the virial radius is M . A temperature gradient in1210 ,
the gas component ensures an initial gas pressure equilibriumfor an adiabatic equation of state. Velocities of gas particlesare initialized according to a cosmologically motivated specificangular momentum distribution with and an overall spinj ∝ rparameter (Bullock et al. 2001).3 1/2l p ( j/G)(FEF/M ) p 0.039
Each component is modeled by particles; the dark matter610halo is composed of two shells, with the inner halo of 9 #
particles (each of mass ∼1 # 106 M ) extending to 200510 ,
kpc and an outer halo of particles (each of mass ∼3.551 # 10# 106 M ) beyond. All gas particles initially have a mass of,
M . We use a softening length of 100 pc for all51.4 # 10 ,
dark matter particles and 50 pc for baryonic particles. We adoptthe best-fit values from Stinson et al. (2006) for the parametersgoverning the physics of star formation and feedback. Ourcooling prescriptions do not account for effects of UV back-ground or metal line cooling. The global criteria for SF arethat a gas particle has to have cm!3, T ! 15,000 K andn 1 0.1be a part of a converging flow; efficiency of star formation is0.05, i.e., 5% of gas eligible to form stars is converted intostars per dynamical time. Star particles form with an initialmass of 1/3 gas particle mass, which at our resolution corre-sponds to M . A gas particle may spawn multiple44.6 # 10 ,
star particles but to avoid gas particles of unreasonably smallmass, the minimum gas particle mass is restricted to 1/5 of theinitial mass. The simulation is evolved with the parallel SPHcode GASOLINE (Wadsley et al. 2004) for 10 Gyr.
We have also performed simulations with and par-5 710 10ticles per component, thus bracketing our fiducial run. Whilethe details of the gas cooling are somewhat resolution-depen-dent (Kaufmann et al. 2006), resulting in morphological dif-ferences, we find convergence in the modeling of overall halocooling, star formation and its dependence on gas surface den-sity, and disk dynamics. We therefore consider the conclusionsand predictions of this Letter numerically robust. The par-610ticle resolution used here represents a compromise betweenadequate statistics for detailed analysis in the outer disk andcomputational cost for 10 Gyr of evolution.
Our simulation should be thought of as modeling disk for-mation and evolution from the cooling of hot gas after the lastgas-rich major merger, as suggested by cosmological simula-tions (Brook et al. 2004, 2007). Although we make use ofsimplifications such as an initially spherical distribution of mat-ter, a lack of halo substructure, the ignoring of subsequentaccretion of dark matter and baryons, and an initial gas densityprofile that mimics that of the dark matter, studying the ide-alized isolated case allows us to analyze in detail the importantdynamical processes affecting the evolution of a massive iso-lated disk. The lessons we learn from this idealized case willlater be applied to galaxies evolved in a full cosmologicalcontext (R. Roskar et al., in preparation).
3. BREAK FORMATION AND THE OUTER DISK
In Figure 1, the break is already evident as soon as a stabledisk forms at 1 Gyr, moving outward as the disk grows andpersisting throughout the simulation. A sharp drop in the localSFR is always present at the break radius. The drop in SFR isnot due to a volume density threshold for star formation, butis instead associated with a rapid decrease in the gas surfacedensity (the star formation follows a Kennicutt-Schmidt law atall times) and a corresponding sharp increase in the Toomre Qparameter. We verified that the break is not seeded by our starformation recipe by running several simulations with differentvalues of the threshold density and found that the location ofthe break did not depend on the particular value used. Sincedensity is inversely proportional to radius, the cooling timeincreases outward. By construction, the angular momentum isdirectly proportional to cylindrical radius, which means thathigher angular momentum material will take longer to cool.
602 P. Sanchez-Blazquez et al.
Figure 19. Mass-weighted azimuthally averaged stellar age and metallicitygradients. Solid lines: theoretical gradient for the hypothetical case wherestars do not migrate from their birth place. Dash–dotted line: profile mea-sured in the final time-step of our simulation. Dotted line: profile measuredin the final time-step of the simulation after eliminating those stars whichformed outside the disc (those with initial Galactocentric radii in excess of25 kpc).
Figure 20. Comparison of the SFR density with time in four differentregions of the galaxy disc – black: between 10 and 15 kpc; dark red: between7 and 9 kpc; purple: between 5 and 7 kpc and orange between 3 and 5 kpc.
gradient Another way to appreciate this is by studying the radialprofile of the birth parameter, defined as the current versus aver-aged star formation rate b = (SFR/〈SFR〉) (Kennicutt, Tamblyn &Congdon 1994). Instead of plotting the current SFR, we averagedthe star formation over the last 1 Gyr. This is mainly due to therelative few number of particles with ages below this value outsidethe break radius. We plot, in Fig. 21, this parameter as a function of
Figure 21. Star formation over the last 1 Gyr divided by the total mass ofstars formed before this epoch (the so-called ‘birth rate’) as a function ofGalactocentric radius.
Galactocentric radius. As can be seen, b increases almost linearlywith radius, as expected for an inside-out formation scenario, untilthe break radius, where it reaches a plateau and then decreases. Theincrease in the error bars at the break radius reflects the asymme-tries in the age distribution of the stars beyond this radius (recallFig. 5).
We argue that the U-shape age profile is the direct consequenceof the existence of a break in the star formation density. If the starformation outside the break had not decreased suddenly, the agegradient would decrease, or remain constant, until the edge of theoptical disc. This is supported by the result of Bakos et al. (2008)who only found the telltale U-shaped colour profiles for galaxiespossessing a Type II profile. The galaxies with an essentially pureexponential profile within their sample showed a plateau (and notan upbend) in the colours at large radii. This upbending age profiledoes not mean that the disc did not form inside-out. In fact, the‘overall’ formation of the disc remains inside-out. However, in ourdisc, the decrease of star formation in the external parts – due to adecrease in the volume density of the gas – results in redder coloursbeyond the break radius.
In Fig. 19, we also compare the age profile of the galaxy with theone it would have if all the stars formed in the disc – i.e. if satelliteswere not accreted. It is apparent that for this case, the accretion ofsatellites has little effect on the stellar population gradients.
7.2.3 Metallicity gradient
The metallicity gradient in the disc and its evolution with time pro-vide constraints to our understanding of the formation and evolu-tion of galaxies. The presence of a metallicity gradient in the MilkyWay is widely accepted, although its exact slope and shape remaincontentious (Chiappini, Matteucci & Romano 2001; Andrievskyet al. 2002). A related issue is the evolution of this gradient withtime; this has been approached from both the theoretical (Goetz &Koeppen 1992; Koeppen 1994; Molla, Ferrini & Diaz 1997; Henry& Worthey 1999; Chiappini, Matteucci & Romano 2001) and obser-vational perspectives (Maciel 2001; Friel et al. 2002; Maciel, Costa& Uchida 2003; Stanghellini et al. 2006), but it is still not clearwhether the metallicity gradient in our Galaxy flattens or steepenswith time. Measurements using H II regions, B-stars and planetarynebulae find gradients ranging from ∼ −0.04 to ∼ −0.07 dex kpc−1
(Afflerbach, Churchwell & Werner 1997; Gummersbach et al. 1998;
C© 2009 The Authors. Journal compilation C© 2009 RAS, MNRAS 398, 591–606
R [kpc]
[Z/H
]A
ge [
Gyr
]

talk on: www.iac.es/project/traces
Vertical vel. disp. vs. Metallicity
-1.5 -1.0 -0.5 0.0 0.5[MgFe]
0
50
100
150
200
250!z
SaSabSbSbcScScd
NOTE: put ALL PLOTS YOU HAVE HERE!![
km s
-1 ]
[Fe/H]
0 5 10 15 20age [Gyr]
50
100
150
200
250
!R
SaSab
SbSbc
ScScd
talk on: www.iac.es/project/traces
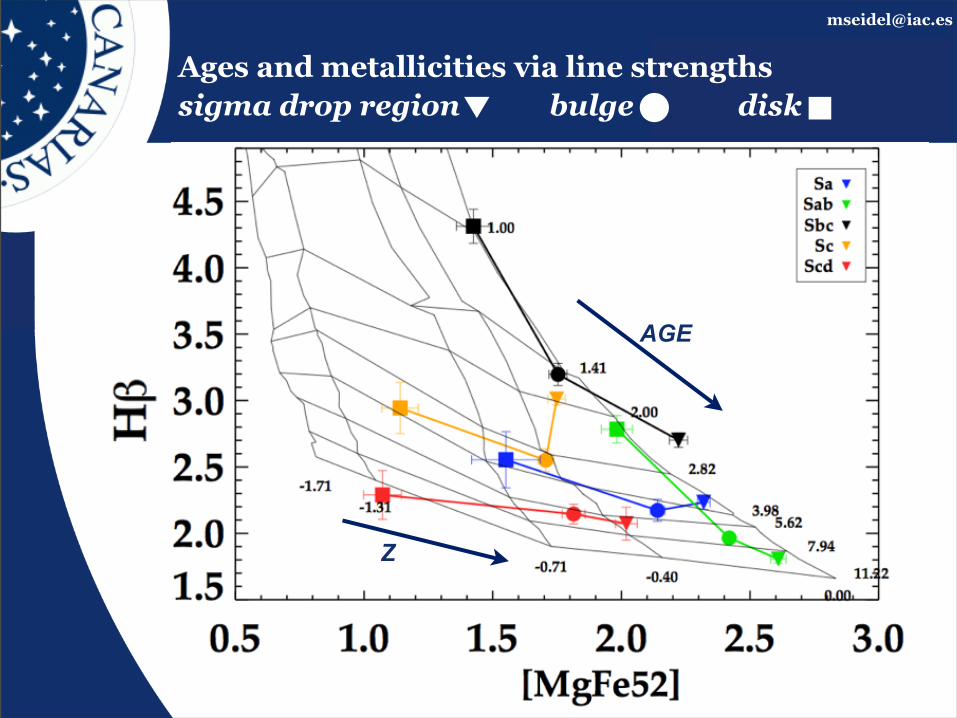
AGE
Z
Ages and metallicities via line strengthssigma drop region bulge disk

talk on: www.iac.es/project/traces
The idea
Unravelling the nature of bars & bulges: observing secular evolution in action
Use integral-field spectroscopic observations to study kinematics and stellar populations in two dimensions of (mainly) barred galaxiesReveal the mass distribution and star formation history of the chosen galaxiesLink the 2D stellar dynamics and stellar populations to constrain scenarios for the secular evolution of galaxies under the influence of bars

talk on: www.iac.es/project/traces
Observations performed
2 successful observation proposals and observation at the WHT
Data obtained and preliminarily reduced after the run: March 2012 for 3 out of 5 galaxies observed, binned to S/N = 40; SAURON mosaic on top of the photometric image from SDSS

talk on: www.iac.es/project/traces
Outlook
Unravelling evolution processes by comparing with simulations
From simulations: bars evolve and become stronger with time leaving an imprint in the LOSVDGrowth as a consequence of angular momentum transfer between the different components of the galaxy: disk, bar, dark matter halo. Different stages in the time evolution of an early-type barred galaxy in one of our numerical simulations (Martinez-Valpuesta et al. 2006) :

talk on: www.iac.es/project/traces
Control sample and disk heating focus
NGC 4030 (Sbc)NGC 1068 (Sb) NGC 2775 (Sa/Sab)NGC 2460 (Sa)
NGC 2280 (Scd)NGC 3810 (Sc)
KPNO
NTT
pPXF (Cappellari & Emsellem, 2004)Gandalf (Sarzi et al. 2006)
Disk-heating (Shapiro & Gerssen 2003 and 2012)
age [Gyr] Z
Mean ages and Z derived with Starlight (Roberto Cid Fernandes, 2007)

talk on: www.iac.es/project/traces
Outline
Introduction
Sample
Methods
Preliminary Results and Discussion
Outlook

talk on: www.iac.es/project/tracestalk on: www.iac.es/project/traces