constraints and solutions to maintain soil productivity: a
TRANSCRIPT
9
Constraints and Solutions to Maintain Soil Productivity
A Case Study from Central Europe
Witold Grzebisz and Jean Diatta Department of Agricultural Chemistry and Environmental Biogeochemistry
Poznan University of Life Sciences Poland
1 Introduction
Yield improvement in old farming areas has been recently recognized as a practice that will
further increase crop production One of the most important old farming areas is Europe
(EU 27) which accounts only for 4 of World agricultural area but at the end of the 20th
century produced 14 of total cereals and 20 of meat (Olesen amp Bindi 2002) At present
Europe has a very diversified level of agriculture development European agriculture is
currently divided into eight agricultural regions based on natural and socio-economic
factors Two of them ie the North Eastern region comprising Czech Republic Slovak
Republic Poland and the South Eastern region including Bulgaria Hungary Romania
Bosnia amp Herzegovina Croatia Macedonia Slovenia Serbia and Montenegro are of special
interest to this chapter Due to the ldquoplanned economyrdquo experiment which took place from
the end of the 1940s to the end of the 1980s these two regions are generally classified as
Central Europe (CE) This macro-region is considered nowadays as one of the most
important future producers of cereals (Rosegrant et al 2001 Kelch amp Osborne 2001)
The current level of agriculture production in the CE is much lower than in the Western part
of the continent Yield potential of winter wheat as the key crop in this region excluding
Bulgaria is at the level of ca 10 t ha-1 The ldquowater limitedrdquo yield for most countries of the
region shows the level of 65 t ha but for Bulgaria and Romania it has been assessed at 45 t
ha-1 However actual yields of all CE countries are much lower representing only from 55
to 71 of attainable yields (Rabbinge amp Diepen 2000 Supit et al 2010) Two main reasons
for this deep disparity
1 Natural climate and soil conditions 2 Political transformations at the beginning of the 1990s
The first group of factors is considered to be responsible for regional differences in volume of harvested yields expressed as the yield gap (YG) (Dobermann amp Casman 2002) Its assessment requires insight into factors affecting crop growth and production The realization of a plant yield potential ie exploitation of a crop variety capacity under fixed climatic conditions is undoubtedly related to the soil fertility level (Atkinson et al 2005
wwwintechopencom
Soil Fertility Improvement and Integrated Nutrient Management ndash A Global Perspective
160
Rabbinge 1993) The second reason of the YG between Western and Central Europe countries is strictly rooted into the history of both parts of the continent during the 20th century The general objective of agricultural growth in these two mega-regions was to reach food self-sufficiency after World War II In Western Europe due to the market-oriented economy system this target was achieved by the end of the 1970s In CE where the ldquoplanned economyrdquo ruled agricultural production for more than 40 years this key objective was also reached However it was based on a system of state subsidies prevailing as cheap prices of agricultural commodities such as fertilizers pesticides machinery The sudden cut of subsidies at the beginning of the 1990s and huge increase of production prices forced farm managers to restructure the farm economy The first step of its transformation into the market-oriented production system was to decrease the number of employees and reduce amount of applied fertilizers (Csatho amp Radimszky 2009) As a consequence the naturally-occurring yield differences among these macro-regions increased unexpectedly producing a new type of YG termed the temporary yield gap (TYG) (Grzebisz et al 2010)
The primary objective of this contribution is to outline key developments leading to
improved yields of wheat maize grain and sugar beet over a 23 year period from 1986 to
2008 in the CE countries Explanatory objectives for the present yield performance rely on
the fertilizer nitrogen (N) index (partial factor productivity of fertilizer N PFPN) It was used
(1) to calculate for each of indicatory crop indices of the yield gap expressed as the quantity
of (a) virtually lost yield andor (b) unassimilated fertilizer N and (2) to make a long-term
prognosis of crop yields on the basis of the developed set of yield gap indices The third
part of this chapter describes some conceptual solutions based on case studies aiming at
improving soil productivity
2 Natural constraints for crop production
The regionally diversified land productivity in Europe can be well assessed by using net
primary productivity (NPP) The NPP of CE land except the southern part of the Balkan
Peninsula ranges from 800 to 900 g m-2 y-1 ie it is lower by 200 to 300 g m-2 y-1 than in
Western Europe (Fronzek amp Carter 2007) Many reports discussing climate change stress the
increasing sensitivity of key crops to year-to-year weather variability including cereals
(barley wheat) grown in Central-Eastern Europe (Olesen et al 2011 Falloon amp Betts 2010
Supit et al 2010)
21 Climatic conditions
In agriculture climate is considered as the driving factor for crop plant adaptations to
prevailing weather conditions Yield potential is strongly influenced by radiation the sum of
daily temperature and precipitation and also on their distribution over the growth season The
first two factors as a rule are used for calculating yield potential ie a realization of crop
varietiesrsquo potential under undisturbed conditions of growth (Evans amp Fisher 1999) In real
production conditions (country or regional scales) a third climatic constraint ndash water limitation
- is the limiting factor of crop plant growth as discussed by Rabbinge (1993) Base on it the
ldquowater limitedrdquo yield (attainable yield) of a crop plant has been defined Taking into account
these factors Europe is divided into several environmental zones reflecting dominating
weather patterns (Jongman et al 2006) The Western part of the continent and British Islands
wwwintechopencom
Constraints and Solutions to Maintain Soil Productivity A Case Study from Central Europe
161
are characterized by a humid climate highly suitable for cultivating most of C3 crops Mild
winters and sufficiently high precipitation in spring are prerequisites for high yields of cereals
also supporting good yields of sugar beets potatoes and maize in summer months (Supit et al
2010) For example in Belgium and Germany harvested yields of wheat are about 75 of
wheat yield potential whereas French farmers reach about 85 of sugar beet yield potential
In Belgium and The Netherlands farmers are able to harvest ca 90 of maize yield potential
(FAOSTAT 2011)
Most of the CE area is located in the Continental zone which covers the northern part of the region and also northern part of the Balkan Peninsula The Pannonion zone extends from the Black Sea up to Alps The southern part of the region including Albania belongs to Mediterranean Mountains and Mediterranean North zones Main attributes of dominating climatic patterns are irregular precipitations in summer months and frequently occurring droughts negatively affecting plant growth and harvestable yield For example maize yield potential in Romania is calculated at the level of 130 t ha-1 but grain yields harvested by farmers within the period 2005-2009 amounted to 32 t ha-1 In Poland yield potential of potatoes is fixed at the level of ca 40 t ha-1 however tuber yields harvested by farmers are below 50 of this level (FAOSTAT 2011 Supit et al 2010) In spite of climatic disadvantages a spatial analysis of the YG for grain crops undertaken by Neumann et al (2010) indicates that CE is a region with great opportunity for intensifying the production of wheat and maize Therefore current yield gaps in this region cannot be explained solely by seasonal weather variability
22 Soil cover Origin and distribution
Soil cover in CE is not uniform taking into account prevailing soil types The gradient of diversification extends from north to the south in this mega region The natural borders of distinct soil types are Sudety and Carpathian Mountains They were the first natural barriers seriously limiting the transgression of Fenno-Scandian and Alprsquos ice sheets during the Pleistocene epoch towards south of Europe At the same time edges of both transgressing glaciations were natural borders of climatic zones The average annual temperature at the glacial edge was -6oC but on the permafrost zone extending several kilometres to the south or east close to 0oC Extremely low temperatures during ice-sheet transgression created a high pressure gradient favourable to long-distance transport of air-born silt particles Wind mineral deposits termed as loess covered large areas of CE mainly south of Carpathian and Sudety Loess became an excellent parent material for Chernozems and chernozem-like soils Severe climatic conditions in the permafrost zone resulted in intensive weathering of surface rock layer Consequently huge layers of loam materials were formed both in situ or transported as alluvial deposits being precursors in the development of Cambisols (Catt 2001 Plant et al 2005)
The mineralogical composition of soil parent material is therefore significantly different on both sides of Sudety and Carpathian Mountains European countries lying over the northern part ie Poland and also eastern part of Germany are dominated by soils originating from sands loamy sands and sandy loams Consequently the current soil cover is mostly consisted of associations of Luvisols and Podzoluvisols In addition in Poland ca 22 of the soil cover partly used by farmers is classified as associations of Arenosols and Podzols Soil cover in other countries of the CE represents mainly Cambisols (Czech Republic Serbia amp
wwwintechopencom
Soil Fertility Improvement and Integrated Nutrient Management ndash A Global Perspective
162
Montenegro Slovakia Slovenia) contributing to more than 20 Another attribute of the region south of Carpathians is associations of Chernozems (Bulgaria Hungary Romania Serbia amp Montenegro) (Table 1)
Countrysoil types Cambi-
sols1
Cherno-zems2
Fluvisols Luvisols3
Total carbon stock5 t ha-1
soil depth m
00 ndash 03 00 ndash 10
Albania (AL) 316 106 55 253 670 1310
Bulgaria (BU) 200 220 90 310 696 1462
Croatia (CR) 236 09 24 126 649 1178
Czech Republic (CZ) 451 132 59 193 693 1350
Hungary (HU) 108 218 174 65 811 1844
Macedonia (MC) 406 13 51 97 680 1248
Poland (PL) 146 35 47 273 620 1199
Romania (RO) 232 285 107 263 725 1550
Serbia amp Mt4 (SampM) 449 218 86 119 736 1498
Slovak Rep (SK) 468 116 65 290 671 1293
Albania (AL) 453 00 54 64 688 1245
1 amp vertisols2 amp Chernozems-like 3 amp Rendzinas 4Montenegro 5 based on Batjes (2002)
Table 1 Main soil associations (average coverage) of the Central European countries
Using soil potassium (K) supply as the key indicator of soil fertility level it can be assumed that soil type significantly reflects inherent parent material properties ie soil quality Nikolova (1998) has classified soils in three main groups based on their K-sorption characteristics (Table 2) The highest K-fixation capacity is attributed to soils originated from loess or loams from Pliocene and Quaternary deposits The lowest potential of K supply occurs in soils formed from sandy materials Therefore relatively to this rating CE countries may be additionally divided into two main groups ie Poland and parts of Bulgaria versus all other countries In Poland soils with low and even very low K sorption capacity are prevalent About 45 of the agricultural area in Poland is covered by soils originated from sands and loamy-sands This explains the serious limitation of crop productivity by insufficient soil K supply (Grzebisz amp Fotyma 2007)
K-sorption ability classes
Particleslt 001 mm
CECcmol(+) kg-1 soil
Soil types
High gt 50 gt 40 Vertisols PlanasolsKastanozems
Medium 30 - 50 20 - 40 Haplic amp Luvic Chernozems Molic Planasols
Low lt 30 lt 20 Luvisols Eutric Planasols
1Nikolova (1998)
Table 2 General potassium sorption characteristics of main soil types in Central Europe (source Nikolova 1998)
wwwintechopencom
Constraints and Solutions to Maintain Soil Productivity A Case Study from Central Europe
163
3 Agriculturally induced constraints - Fertilizer management
The recorded yield increase of most crops in the last 60 years is a result of two main factors The first is the progress in plant breeding which took place in the 60s and 70s during the Green Revolution (Sinclair et al 2004) However fulfilling nutritional requirements of modern high yielding varieties requires a well balanced supply of nutrients The second factor contributing to modern yield increases is fertilizer use In intensive agriculture it is related to the consumption of fertilizers such as N P and K Therefore a reliable estimation of agriculturally induced constraints for crop production in CE requires an insight into past and current nutrient management strategies
31 Long-term patterns of fertilizersrsquo consumption
Data on historical fertilizer consumption in the period 1986-2008 were obtained from the IFA databank (2011) Fertilizer use per hectare was calculated by dividing the total use of N P and K fertilizers in a given year per actual area of arable land as the target area of application The quantities of fertilizers annually used by farmers over the studied period were both nutrient and country specific (Table 3) During the period 1986-2008 total consumption of N-P-K fertilizers in CE countries has undergone significant changes with respect to
a the quantity of fertilizers annually applied per hectare b the structure of applied fertilizers as related to PN and KN ratios
Statistical parameters
Countries1
AL BampH BU CR CZ HU MC PL RO SampM SV SL
Nitrogen
Average 450 311 633 1007 931 724 467 710 399 458 703 2000
SD2 441 231 372 389 223 251 136 182 201 164 313 1299
CV3 979 742 588 386 239 346 290 257 505 357 445 649
RIN 866 753 680 533 414 526 458 377 629 510 609 800
Phosphorus
Average 149 144 152 440 322 213 228 305 165 144 304 698
SD2 147 121 232 154 323 214 810 163 131 121 333 337
CV3 987 845 1528 350 1005 1004 355 534 796 846 1094 483
RIP 914 812 976 425 839 854 531 657 800 838 866 641
Potassium
Average 24 139 71 481 303 260 175 366 64 157 291 851
SD2 21 113 106 209 343 269 93 183 85 100 348 461
CV3 874 814 1493 433 1133 1036 534 499 1324 641 1197 542
RIK 965 800 970 537 892 863 684 619 931 706 888 718
1 IFA data bank accessed 2011-05-24 2standard deviation 3coefficient of variation
Table 3 Consumption of N P and K fertilizers (in kg ha-1) in Central European countries during the period 1986-2008 and the reduction index (RI) for each nutrient ndash a statistical overview 1Country acronyms are provided in Table 1
wwwintechopencom
Soil Fertility Improvement and Integrated Nutrient Management ndash A Global Perspective
164
The long-term course of fertilizersrsquo consumption showed some resemblances Therefore the
whole investigated period has been divided into three well defined phases (1) High
Consumption Level (HCL) (2) Collapse and Transition (CT) (3) Post Transition (PT) (Fig 1)
Two distinct procedures have been applied to make a reliable estimate of the length of each
phase The HCL was separated from the CT when there was more than 25 change in the
baseline ndash yearly values The PT was established using a linear regression model assuming
statistically proven change
The key attribute of the first phase lasting from four to five years was characterized by high
levels of consumed fertilizers mainly N irrespective of the country (Fig 1) The
consumption of other nutrients ie P and K was country specific The CT phase was
characterized by a dramatic sudden decrease in use of each fertilizer This process occurred
for one or two years in some countries (Czech Republic Croatia Hungary Poland Slovakia
Slovenia) but in others up to 10 years showing prolonged depression The reason of this
drastic decline was well described in economy the scissor phenomena (Cochrane 2004) The PT
phase has been appearing in three distinct forms i) increase (PT-I above the baseline HCL
level) ii) restoration (PT-R significant trend but below the baseline HCL level) iii)
stagnation (PT-S no significant changes over time)
0
20
40
60
80
100
120
140
160
180
1985 1990 1995 2000 2005 2010
Consecutive years (CY)
Nit
rog
en c
onsu
mp
tion
(N
c)
kg
N h
a-1
CR
CZ
RO
Country
HCL CT PT
CR-Nc = 641CY + 12711 R2 = 075 P lt 0001
CZ-Nc = 242CY + 4763 R2 = 074 P lt 0001
Fig 1 Patterns of N fertilizersrsquo consumption in selected Central European countries - Croatia (CR) Czech Republic (CZ) and Romania (RO) during the 1986-2008 period (based on IFA database accessed 2011-05-24) Significant (Plt005) trends are indicated with solid lines and linear regression equations given The CT periods are marked with dashed lines
Nitrogen considered as the key nutrient in crop production but at the same time potentially unfriendly to the environment requires much deeper attention Its consumption in the HCL period was high varying around 100 kg N ha-1 for most countries in the region (Table 3) The lowest consumption (defined by 025 percentile) took place during the CT phase The degree of collapse can be simply assessed by using a fertilizer use reduction index (RI)
wwwintechopencom
Constraints and Solutions to Maintain Soil Productivity A Case Study from Central Europe
165
RI = [1- (025P09P) 100]
where 025P and 09P are the 25th and 90th percentiles of fertilizer consumption over the period 1986-2008
Fertilizer N management in CE during the PT phase relies on consumption trends evaluated for a period of 18 years ie since 1991 onwards On the basis of elaborated regression models countries of the region have been divided into three defined groups
1 Increase (PT-I) Croatia Slovenia 2 Restoration (PT-R) Czech Republic Hungary Poland Slovakia Slovenia 3 Stagnation(PT-S) Albania Bosnia amp Herzegovina Macedonia Bulgaria Romania
Serbia amp Montenegro
Phosphorus is a nutrient of basic importance for any crop plant because all seed crops are highly sensitive to its deficiency during the onset of ripening In the HCL phase the consumption of P fertilizers was in the range of ca 35 to 95 kg P2O5 ha-1 (Table 3) During the period of study its use underwent a great mostly negative change Its consumption trends evaluated for years 1991-2008 showed much greater variability compared to N fertilizersrsquo use in CE countries
1 Increase Croatia Slovenia 2 Restoration Poland Hungary Macedonia 3 Stagnation Albania Czech Slovakia Serbia amp Montenegro 4 Recession Bosnia amp Herzegovina Bulgaria Romania
The occurrence of the fourth group stresses the fact that P fertilizersrsquo consumption was below the levels required to support current crop production leading to nutrient mining in three countries of the region
Potassium is generally considered as a nutrient significantly affecting water management in plants during their life cycle (Cakmak 2005) Therefore this nutrient requires special care on farm in regions like CE that experience frequent drought during the vegetative growth period (Falloon amp Betts 2010) Potassium fertilizersrsquo consumption during the HCL period varied among countries of the region from ca 5 kg K2O ha-1 (Albania) to more than 100 kg K2O ha-1 (former Czechoslovakia) (Table 3) As in the case of P the greatest decline in K consumption occurred in countries significantly increasing the use of nitrogen like the Czech and Slovak Republics and also Hungary (estimated from the potassium fertilizer use reduction index RIK)
The second indicator of fertilizer management is in the proportions of macronutrients consumed indicated during the study by the PN and KN ratios The PN ratio did not show a clear trend for two countries Albania and Bosnia amp Herzegovina In other countries negative tendencies were detected appearing as the increasing value of PN ratio meaning that proportionately more N fertilizer than P fertilizer was applied by farmers This process took place mainly during CT and PT phases Its course during the PT phase outlines three decisive patterns of P fertilizersrsquo management
a negative Czech Republic Croatia Serbia amp Montenegro Romania b positive Hungary Macedonia Poland c stagnation Slovakia
wwwintechopencom
Soil Fertility Improvement and Integrated Nutrient Management ndash A Global Perspective
166
The first trend covers the whole study period differing only in the annual rate of decrease
as indicated by the coefficient of the linear regression equation In the case of Romania it
was almost four times faster than for Croatia (Fig 2) The second pattern occurred in
countries like Hungary and Poland showing a slightly positive trend since 1991
Trends of KN ratios show similar patterns as described for PN ratios (Fig 3) Three
patterns of ratios can be also distinguished but comprising different sets of countries
a negative Macedonia Slovenia
b positive Hungary
c stagnation Croatia Czech Poland Slovakia Bulgaria and Romania (since 1993) Serbia
amp Montenegro (since 2000)
All above-described attributes of long-term fertilizersrsquo consumption were evaluated in Table 4
to develop a ranking based on three types of nutrient management in CE countries as
follows
1 Extensive generally showing low consumption of all fertilizers including N the most
negative attribute is the low P and K inputs leading to crop plants reliance on inherent
soil P and K supply and potentially leading to nutrient mining (Albania Bulgaria
Macedonia Serbia amp Montenegro Romania)
2 Unbalanced high consumption of fertilizer N but at the same time not balanced by
adequate use of other nutrients such as P and K at least (Croatia Czech Slovakia
Slovenia)
3 Balanced high consumption of N fertilizer which is in part balanced by relatively high
consumption of P and K fertilizers (Hungary Poland)
0
01
02
03
04
05
06
07
08
1985 1990 1995 2000 2005 2010
Consecutive years CY
PN
rel
atio
nsh
ip
P
N
CR
PL
RO
Country
PN1-PL = -0053CY + 1076 R2 = 081 P lt 0001
PN2-PL = 0006CY ndash 105 R2 = 038 P lt 001
PN-CR = -0005CY + 105 R2 = 032 P lt 0001
PN-RO = -0019CY + 374 R2 = 081 P lt 0001
Fig 2 Typical patterns of PN ratios in selected Central European countries - Croatia (CR) Poland (PL) and Romania (RO) during the period 1986-2008 Significant (Plt005) negative linear equations are shown for CR and RO while the PL data fitted to a negative linear equation in the period 1986-1996 and thereafter showed a positive linear relationship
wwwintechopencom
Constraints and Solutions to Maintain Soil Productivity A Case Study from Central Europe
167
0
01
02
03
04
05
06
07
08
09
1985 1990 1995 2000 2005 2010
Consecutive years CY
KN
rel
atio
nsh
ip
K
N
CR
PL
RO
Country KN1-PL = -0066CY + 1323 R2 = 070 P lt 001
KN1-RO = -0044CY + 873 R2 = 083 P lt 0001
Fig 3 Typical patterns of KN ratios in selected Central European countries - Croatia (CR) Poland (PL) and Romania (RO) in the period 1986-2008 Significant (Plt005) negative linear equations are shown for CR and RO in the 1986-1992 period thereafter showed non-significant trends For CR the KN trend was non-significant for the whole period
Estimated Parameters
Country3
AL BampH BU CR CZ HU MC PL RO SampM SK SL
Nitrogen 01 0 0 ++ + + 0 + 0 0 + +-
Phosphorus 0 - - ++ 0 + + + - 0 0 +-
Potassium 0 0 0 ++ 0 + 0 + 0 0 0 0
PN 0 0 0 - - + 0 ++ - 0 0 -
KN 0 0 0 0 0 + - 0 0 0 0 -
Ranking2 0 0 0 2 2 1 0 1 0 0 2 2
1evaluation of trends ++ - increase +- restoration 0 - stagnation - - decrease +- - time variable 2 fertilizer management ranking 0 ndash extensive 1 ndash balanced 2 ndash unbalanced 3 Country acronyms are provided in Table 1
Table 4 Fertilizer consumption trends ndashsummary and country management ranking for countries in Central Europe during the period 1986 to 2008
32 Soil fertility status
Soil is considered as a slowly renewable or non-renewable resource that requires the same
level of protection as other limited resources like phosphorus rock There is strong
agreement that productivity of arable land depends on both a soilrsquos fertility potential (soil
quality inherent soil fertility) and present state of soil properties (soil health) to sustain
wwwintechopencom
Soil Fertility Improvement and Integrated Nutrient Management ndash A Global Perspective
168
primary production and other ecological functions The minimum data set to describe
current fertility status of arable land ie soil health should contain indicators reflecting
both past and actual organic matter content soil pH and management of nutrient soil
resources (Atkinson et al 2005 Karlen et al 2003)
Total organic carbon (TOC) stock in the topsoil (00-03 m) or its content () in arable soils is
a good descriptor of short-term trends in soil organic matter (SOM) management However
the organic carbon stock measured to a depth of 1 m in the soil profile can be considered as
an indicator of soil fertility potential The actual content of TOC in an averaged arable soil
unit was calculated by weighted mean content of organic carbon for main soil types (Batjes
2002) and its percentage share in the soil cover for each CE country (see Table 1) Analysis of
this data showed that TOC in the average topsoil unit of CE countries is insufficient ranging
from ca 60 (Poland) to 80 (Hungary) t TOC ha-1 ie about 14 to 18 TOC Differences
between CE countries can be evaluated by TOC stock in the soil profile to a depth of 1 m
Based on this criterion countries can be classified into three groups
a low ( le 120 t TOC ha-1) Croatia Poland b medium (121-160 t TOC ha-1 ) Albania Bulgaria Czech Republic Macedonia
Romania Serbia amp Montenegro Slovakia Slovenia c high (gt 161 t TOC ha-1) Hungary
Phosphorus and Potassium are key nutrients for achieving high productivity of arable soils
Available resources of both nutrients are the most important indicators of soil health ie its
current productivity The country status of current soil nutrient management was evaluated
by means of soil fertility index (SFI) expressed as the sum of the percentage share of arable
land characterised by the very high high and half of medium rating of available P or K
(Grzebisz amp Fotyma 2007) It has been assumed that SFI for P and K exceeding 70 of
arable land share is a prerequisite for high yield of any crop In the 1980s this target was
achieved in many countries of the region like Czechoslovakia Hungary and some countries
of the former Yugoslavia (Serbia amp Montenegro Slovenia) (Fig 4) In these countries the
rates of applied fertilizers were far in excess of crop removal capacity Poland in spite of
currently high K consumption differs from other CE countries The sufficiency level for P
and K of 70 was never reached due to much lower inherent soil potential for nutrient
supply At the beginning of 2000 significant changes of P and K fertility were recorded The
increase of the P sufficiency level was recorded only in Slovenia and Poland In Slovenia the
reason was high consumption of P fertilizers at the beginning of the 21st century In Poland
the increase is related to sufficiently well balanced use of N and P fertilizers and slightly
lower yields than in the 80s In all other CE countries the percentage of P-fertile soils
generally decreased nevertheless the rate of the decrease differed across the region A
slight decrease occurred in Czech and Slovak Republics as well as in Hungary The greatest
drop was recorded in Bulgaria followed by Serbia and Montenegro The potassium SFI
presents much more alarming trend As reported by Grzebisz amp Fotyma (2007) for countries
of the Northern Agricultural Zone (Czech Hungary Poland Slovakia) the K sufficiency
level decreased below the target value within two decades Based on K fertilizersrsquo
consumption trends it can be assumed that the same trend occurs also in the Southern
Zone
wwwintechopencom
Constraints and Solutions to Maintain Soil Productivity A Case Study from Central Europe
169
0
10
20
30
40
50
60
70
80
90
100
AL BU CZ H PL RO SE SK SL
Countries
P s
oil
fert
ility
in
de
x
A
L
1980s
2000s
Sufficiency level
Fig 4 Phosphorus soil fertility indices (expressed as the percentage of arable land AL) for selected CE countries during the period 1986 - 2008 (based on Csatho et al 2007) The sufficiency level was assumed to be 70 as described by Grzebisz amp Fotyma (2007) Country acronyms are given in Table 1
4 Soil productivity assessment
41 Long-term trends in crop yields
All CE countries grow the same crops and cereal species predominate The area sown with cereals occupies 64 of arable land in Croatia 52 - in the Czech Republic 68 - in Poland and 59 ndash in Romania In the Czech Republic cerealsrsquo production is dominated by wheat and barley but in Poland by wheat and rye In Romania and Croatia maize is the key grain crop Sugar beets due to EU regulation in the last 10 years are of minor importance but this crop is a good indicator of soil quality Therefore it has been assumed that these crops would reflect fairly well changes in current soil fertility status as a consequence of applied nutrient management strategies This assumption is well documented by observed variability of yields of wheat maize and sugar beets in selected countries of CE (Table 5) The highest variability was found for Romania and the lowest for Poland Romania is a country with an extensive pattern of fertilizersrsquo management typical in the Southern Agricultural Zone of Europe Poland belongs to countries of the Northern Zone but presents a balanced patterns of fertilizersrsquo management (Poland Hungary) Other selected countries are members of the Unbalanced fertilizing group of CE countries
The long-term yield trend can be used as an indicator of key crops sensitivity to past and current fertilizersrsquo management As in the case of fertilizersrsquo consumption trends three consecutive phases of yield development over the period 1986-2008 may be distinguished
1 Actual-Standard (AS) 2 Recession (RC) 3 Restoration (RS) or Stagnation (SG)
The observed trends of harvested yields were most pronounced for wheat other cereals and for seed crops like oil-seed rape (Grzebisz et al 2010) In the first phase of the study taking
wwwintechopencom
Soil Fertility Improvement and Integrated Nutrient Management ndash A Global Perspective
170
place at the end of the 80s yields of wheat reached on average the highest recorded levels Therefore this particular period is considered as a standard level (AS) for evaluating subsequent phases (Fig 5) The highest yield decline ie the recession phase (RC) in response to the collapse in fertilizer consumption took place in the Northern Zone but
Crops Croatia Czech Republic Poland Romania
x plusmn SD5 CV6 x plusmn SD CV x plusmn SD CV x plusmn SD CV
Wheat 40plusmn052
39plusmn033
44plusmn094
125
86
216
48plusmn05
51plusmn04
52plusmn06
102
78
113
36plusmn03
37plusmn02
39plusmn04
90
56
100
27plusmn06
31plusmn04
29plusmn08
212
141
265
Maize 49plusmn10
40plusmn09
55plusmn13
205
217
229
58plusmn13
51plusmn05
69plusmn05
214
93
76
52plusmn08
49plusmn02
56plusmn08
143
41
157
31plusmn08
29plusmn05
34plusmn11
244
180
315
Sugar
beet
404plusmn77
398plusmn49
487plusmn52
192
123
108
424plusmn76
345plusmn15
531plusmn49
180
42
49
381plusmn55
346plusmn19
451plusmn39
145
56
88
228plusmn51
213plusmn29
304plusmn33
222
136
108
1FAOSTAT available online 2011-05-24 21986-2008 31986-1990 42004-2008 5standard deviation 6coefficient of variation
Table 5 Statistical overview of key cropsrsquo yields (t ha-1) in selected Central European
countries during the period 1986-2008 in comparison to the AS phase and the 2004-2008
periods
0
1
2
3
4
5
6
7
1985 1990 1995 2000 2005 2010
Consecutive years CY
Gra
in y
ield
(Y
) t
ha-1
CZ
RO
Country
AS RC RE or ST
Y-CZ = 0056CY + 1089 R2 = 028 P lt 005
TYG
TYG
Legend level of harvested yield AS Actual-Standard RC Recession RE Restoration ST Stagnation
Dashed line refers to AS level of yield ie an average yield harvested in the period 1986-1990 TYG
Temporary Yield Gap
Fig 5 Long-term trends of wheat production in the Czech Republic (CZ) and Romania (RO)
during the period 1986-2008 Significant (Plt005) positive linear trend is shown for the
Czech Republic whereas non-significant for Romania in the period 1992-2008
wwwintechopencom
Constraints and Solutions to Maintain Soil Productivity A Case Study from Central Europe
171
lasted for only two or three years In other countries mainly representing the Southern Zone it was also fast or showed sustained depression The third phase of yield development was manifested in two distinct trends The first ldquorestorationrdquo trend has shown a positive yield gain since yield recession It was revealed in the Northern Zone countries and also for Croatia and Slovenia The second trend has not shown any significant change in yield since the recession resulting in yield stagnation The most interesting attribute of this trend is its high year-to-year variability The difference between the actually harvested and the AS yield has been termed as the temporary yield gap (TYG) (Fig 5) The time required to recover to the AS level was long but country specific In the Northern Zone it lasted for ca 10-12 years exceeding the AS level in 2004 or 2005 In most other countries representing the Southern Zone it has not been reached up to 2008 For maize and sugar beets the recession was also observed In the recovery period maize yields were generally positive but the rate of the yield increase was much higher in the Balanced and Unbalanced groups than in the Extensive group Sugar beets yield increase was very high at the beginning of the 90s exceeding the level reported in the 80s The main reason was a reduction in area sown with sugar beets which forced farmers to cultivate this crop on more fertile soils
42 The concept of partial factor fertilizer nitrogen productivity (PFPN)
This part of the study relies on two main conceptual pillars The first one assumes that each hectare of arable soil regardless of the current crop is supplied with the same amount of nutrients including nitrogen The second assumption takes into account the fact that the unit productivity of in-season applied fertilizer N known as PFPN is a reliable scientific tool to make simple but quick discrimination of factors limiting attainable crop yield (Dobermann amp Casman 2002) Therefore the PFPN index was used to evaluate some but selected CE countries that represent the three patterns of current fertilizer management (Table 4) Croatia and the Czech Republic have been selected as examples for the Unbalanced group whereas Poland is the Balanced group and Romania represents the Extensive group of fertilizersrsquo use
The PFPN index was obtained by dividing the actual yield of a respective crop harvested within a given year by the annual amount of N fertilizers consumed by the country assuming it was applied at an equal rate for all currently cultivated crops Operationally the PFPN index consists of two components
a yield of crop (Y) expressed in kg or t ha-1 b nitrogen fertilizer rate (FN) expressed as kg N ha-1
PFPN = YFN
Based on the long-term trends of PFPN indices for each of the key crops two different types of PFPN indices can be distinguished
1 The real partial factor productivity of applied N ndash (rPFPN) it reflects actual yields as limited by both water and N availability
2 The maximal partial factor productivity of applied N (mPFPN) it was calculated as the 4th quartile of rPFPN indices it refers to yields obtained under ample water supply
To make a reliable estimate of the yield gap for some crops cultivated in the CE the corrected partial factor productivity of applied N (cPFPN) instead of mPFPN has been applied
wwwintechopencom
Soil Fertility Improvement and Integrated Nutrient Management ndash A Global Perspective
172
Operationally it has been calculated as the average of the 4th quartile but excluding extremely elevated rPFPN values which emerged in most of investigated countries at the beginning of the 90s Indices of N productivity (PFPN rPFPN and cPFPN) were then used to calculate the yield gap
The calculated rPFPN indices showed as expected high year-to-year variability for all tested crops (Table 6) They were crop and country specific when averaged over the 1986-2008 period
a wheat CR lt CZ = PL lt RO b maize CR lt CZ lt PL lt RO c sugar beets CR = CZ lt PL lt RO
These ranges are not in line with long-term average yields of all crops which followed generally the order CZ gt CR gt PL gt RO
Maximum productivity of tested crops as evaluated for the 4th quartile of rPFPN indices was
much higher rising on average by 43 However the increase was country specific and
represents 63 for Croatia 28 for the Czech Republic 30 for Poland and 48 for
Romania The concept of mPFPN assumes an increase of rPFPN indices pursuant to higher
efficiency of applied fertilizer nitrogen due to ample water supply Its reliability has been
corroborated by low coefficients of variation implicitly indicating the potential productivity
of applied fertilizer nitrogen on the background of soil quality The sequences of countries
for each crop are as follows
a wheat CZ = PL lt CR lt RO b maize CR = CZ lt PL lt RO c sugar beets CZ lt PL lt CR lt RO
As presented in Table 6 coefficients of variations of cPFPN indices were significantly lower in comparison to mPFPN stressing on the reliability of the conducted analysis
Relationships between sets of developed rPFPN and applied fertilizer nitrogen rates can also be a useful tool for making long-term assessment of nitrogen efficiency This relationship fits the best the power function
rPFPN = 9112N-067 for R2 = 077 and n = 92
where N ndash annual rate of fertilizer nitrogen consumption kg N ha-1
Analysis of the general curve shape reveals decreasing yield per unit of N fertilizer applied with highest values of rPFPN It has been observed that irrespective of the applied N rate long-term productivity of fertilizer nitrogen increased in the order Romania lt Poland lt Croatia lt the Czech Republic However the obtained high rPFPN values are as a rule related to lower yields of harvested crops This pattern of crop response refers mostly to Bulgaria Romania and former Yugoslavia countries excluding Croatia and Slovenia As pointed out by Fixen (2004) the target of efficient N fertilizer management based on high fertilizer N use efficiency is counter-productive In this N supply system plants are forced to take up an appreciable amount of N from its soil resources which decreases their rate of growth in critical stages of yield performance Therefore ldquothe elevatedrdquo level of the PFPN could be used as an attribute of the extensive type of agriculture production
wwwintechopencom
Constraints and Solutions to Maintain Soil Productivity A Case Study from Central Europe
173
PFPN
index
Croatia Czech Republic Poland Romania
x plusmn SD1 CV2 x plusmn SD CV x plusmn SD CV x plusmn SD CV
Wheat kg yield kg N-1
rPFPN 48plusmn24 498 54plusmn13 235 54plusmn15 275 81plusmn33 405
mPFPN 80plusmn23 288 70plusmn11 160 72plusmn15 212 121plusmn14 119
cPFPN 63plusmn11 174 62plusmn4 59 62plusmn2 30 112plusmn8 69
Maize kg yield kg N-1
rPFPN 56plusmn26 464 66plusmn18 281 78plusmn21 263 95plusmn45 478
mPFPN 89plusmn29 288 89plusmn7 76 103plusmn11 102 149plusmn20 135
cPFPN 69plusmn10 151 89plusmn7 76 96plusmn2 24 137plusmn9 66
Sugar beets kg yield kg N-1
rPFPN 471plusmn224 477 478plusmn120 250 566plusmn136 240 695plusmn266 383
mPFPN 766plusmn218 285 588plusmn49 825 728plusmn67 93 977plusmn122 125
cPFPN 613plusmn86 141 588plusmn49 825 675plusmn35 52 905plusmn36 40
1standard deviation 2coefficient of variation
Table 6 Partial factor fertilizer N productivity statistics for key crops in selected Central European countries with unbalanced (Croatia Czech Republic) balanced (Poland) and extensive (Romania) fertilizersrsquo management during the period 1986-2008
43 Yield gap (YG) and its attributes
Actual yields of crops harvested by farmers in all areas of the world are much lower than
the yield potential of currently cultivated varieties under defined soil and climatic
conditions This ldquovirtualrdquo un-harvested portion of yield is generally termed the yield gap
(YG) (Evans amp Fisher 1999 Dobermann amp Cassman 2002) However the CE countries
experience another phenomenon known as the temporary yield gap (TYG) (Grzebisz et al
2010) The main reason of its emergence is the collapse in fertilizer use leading to elevation
of the rPFPN index Dibb (2000) relates extremely high N efficiency to low yield and this
trend was fully corroborated by the crop yield data from countries with extensive fertilizer
management Nevertheless the countries of the Northern Agricultural Zone (Czech
Republic Hungary Poland Slovakia) in spite of drastic decrease of consumed fertilizers in
the early 90s were characterized by high yields of wheat and other cereal crops (FAOSTAT
2011 Grzebisz et al 2010) The observed rPFPN indices extremely elevated at the beginning
of the 90s were a result of the residual effect of applied fertilizer N This phenomenon could
be manifested only under growth conditions created by ample water and sufficiently high
supply of immobile nutrients such as P and K in turn balancing N use by currently growing
crops
In the first step of yield gap calculation the cPFPN index was applied to assess the maximal
attainable yield (YAM) The yield gap was then calculated as a difference between really
harvestable yield (YA) and YAM
wwwintechopencom
Soil Fertility Improvement and Integrated Nutrient Management ndash A Global Perspective
174
YAM = cPFPN middot DN
YG = YA ndash YAM
where
DN is the rate of annually applied fertilizer N (kg N ha-1) YA is the actual yield in t ha-1 for a
given year and YAM is the maximal attainable yield (t ha-1)
The observed similarities of the general yield gap pattern over time for key crops allow to
distinguish three consecutive phases of its development in the period 1986-2008 (Fig 6)
1 First ndash primary deep yield gap to the left of the transition point (TP) 2 Second ndash point of extra yield gain TP 3 Third- secondary yield gap to the right of the TP alternatively yield gap stagnation as
indicated by the lack of significant (P lt 005) linear trend response
-7
-6
-5
-4
-3
-2
-1
0
1
2
1985 1990 1995 2000 2005 2010
Consecutive years CY
Yie
ld g
ap
(Y
G)
t h
a-1
CZ
RO
TP
YGd-CZ = 079CY - 1573 R2 = 070 P lt 001
YGd-RO = 068CY - 1354 R2 = 072 P lt 0001
YGr-CZ = -012CY + 2354 R2 = 046 P lt 0001
Country
Legend TP - Transition Point YGd - yield gap decline YGr - yield gap restoration
Fig 6 Evolution of the yield gap in wheat in the Czech Republic (CZ) and Romania (RO) during the period 1986 -2008 Significant (Plt005) positive linear equations are shown for the Czech Republic in the period 1986-92 and for Romania in the period 1986-1995 thereafter showed a negative linear relationship for the Czech Republic and non-significant trend for Romania
Wheat is the best example of the yield gap course in the CE countries stressing on the
difference in fertilizer management The main dissimilarities among countries do not refer
to the first phase The YG was deep in spite of relatively high yield indicating thus a low
capacity of contemporary cultivated varieties to achieve further gains in yield Much more
important were YG length and number of years to reach the TP The time to reach the TP
was shorter (6(7) years) in countries such as the Czech and Slovak Republics Hungary and
Poland and also in Croatia and Slovenia corresponding to rapid rebuilding of fertilizer
wwwintechopencom
Constraints and Solutions to Maintain Soil Productivity A Case Study from Central Europe
175
markets in these countries In countries with extensive fertilizersrsquo management the length of
the first phase extended up to mid-90s
The YG evaluation shows that the current nutrient management in CE countries can
overcome this phenomenon especially in the case of wheat and maize A TYG can be most
easily negated in countries belonging to Unbalanced or Balanced nutrient management
groups such as the Czech and Slovak Republics Hungary and Poland and also Croatia and
Slovenia In countries with extensive fertilizersrsquo management the TYG has not been
overcome and enters the third phase of yield development stagnation due to low use of
fertilizers in turn resulting in the very low and unstable level of annually harvested yields
44 Yield prognosis ndash The unassimilated nitrogen concept
The medium or long-term food and environmental policy strategies for any country or
particular region are supported by yield prognosis considered as an operational tool
However the ex-ante prognosis depends on the reliability of the data used Two approaches
both relying on the unit productivity of fertilizer nitrogen (PFPN) have been considered The
first assumes extrapolation of real and improved yields based on the linear model (Reilly amp
Fuglie 1998) The second one is based on long term trends of the YG but transformed into
unit of temporarily lost fertilizer nitrogen termed for the purposes of this study as
unassimilated nitrogen This approach as related to nitrogen management has been used to
make a prognosis of yields of key crops in the CE countries
Operationally the concept presented in this chapter assumes that the total amount of
applied fertilizer nitrogen (FN) is simply divided into three main pools i) assimilated
(FaN) ndash nitrogen taken up by meanwhile grown crop ii) unassimilated nitrogen (FuaN) ndash
temporary out of use by plants andor iii) lost from the field (FLN) The quantitative
assessment of the FuaN pool relies on the defined YG procedure individually related to
each investigated crop
FN = FaN + F uaN + FLN
FuaN = YGcPFPN
where
FuaN ndash unassimilated nitrogen kg N ha-1 YG - yield gap cPFPN ndash the corrected partial factor productivity of applied N kg yield kg N-1
In the first step of yield prognosis the Unassimilated Nitrogen Indices (IuaN) should be computed Therefore the original set of YG data for each of the studied crops was transformed into a quantitative amount of nitrogen lost temporarily from the system marked as minus (-IuaN) In the second step of the analysis both sets of actual (YA) and maximum attainable yields (YM) of each crop were regressed against corresponding set of
uaN indices The obtained regression models clearly show that actual yields over the period of 20 years did not respond significantly to the IuaN as reported in Fig 7 for wheat in Romania The positive and simultaneously significant trends were however achieved when the maximum attainable yield (YM) instead of the actual yield (YA) was introduced into the regression model It can be therefore hypothesized that any virtual loss of nitrogen
wwwintechopencom
Soil Fertility Improvement and Integrated Nutrient Management ndash A Global Perspective
176
ie the negative uaN indices reflect the potential status for a yield increase and vice versa Unfortunately the positive indices of the uaN simply describe a state of N soil mining which in turn causes direct yield decline This is consistent with the opinion of Dibb (2000) and typical for many parts of the world including most CE countries
YM = -0114uaN + 2703 R2 = 093 P lt 0001
0
1
2
3
4
5
6
7
8
9
10
-60 -50 -40 -30 -20 -10 0 10
Gra
in y
ield
(Y
) t
ha-1
YA
YM
Yield
type
Unassimilated nitrogen (uaN) kg N ha-1
Fig 7 Yield prognosis of winter wheat based on residual nitrogen - a case of Romania (RO) Significant (Plt005) linear equation represents the trend for the attainable yields in the 1986-2008 period Legend YA ndash actual yield YM ndash maximum yield
Reliable yield prognosis can be performed assuming a certain level of expected yield or by focusing any improvement of production technology on higher N use efficiency The first approach can be best presented for wheat The maximum attainable yield for this crop in Poland and the Czech Republic is fixed at the level of 65 t ha-1 but for Romania at 45 t ha-1 (Rabbinge amp van Diepen 2000) The amount of uaN required to be incorporated into grain yield was calculated by the models and amounted to 48 27 and 33 kg ha-1 respectively It is equal to 58 27 and 100 of annual N rate applied in these countries and does not seem a realistic approach The same rules refer to other key crops in the study Therefore the second concept relying on the ability of currently cultivated crops to fix an extra amount of
uaN seems to be a more realistic approach for making any reliable yield prognosis (Table 7) This assumption is highly promising especially for countries presenting an extensive type of agriculture production for example Romania The expected wheat increase in response to the use of extra 20 kg N ha-1 is possible considering the water limited yield fixed at 45 t ha-1 The prognosis for the Czech Republic is still below the water limited yield being at 65 t ha-1 In Poland the calculated yields are at the same level as Romania but soils are less suitable for wheat production Therefore any grain yield increase seems to be a great challenge for farmers in all countries of the CE In the light of yields prognosis for sugar beets the fixed level of uaN at 20 kg N ha-1 is generally too low The level of 60 t ha-1 of beets seems to be the most reliable short-term target Thereby the amount of uaN successfully managed should be established at the level of 30 kg ha-1
wwwintechopencom
Constraints and Solutions to Maintain Soil Productivity A Case Study from Central Europe
177
CropCountry Linear regression model Yield at 20 kg uaN t ha-1
Wheat
Croatia YM = -0064 uaN + 3989 for R2 = 096 527
Czech Rep YM = -0063 uaN + 4777 for R2 = 088 604
Poland YM = -0060 uaN + 3623 for R2 = 092 482
Romania YM = -0114 uaN + 2703 for R2 = 093 498
Maize
Croatia YM = -0069 uaN + 4852 for R2 = 086 623
Czech Rep YM = -0064 uaN + 6470 for R2 = 069 776
Poland YM = -0085 uaN + 5431 for R2 = 083 713
Romania YM = -0121 uaN + 3348 for R2 = 094 578
Sugar beets
Croatia YM = -0605 uaN + 40677 for R2 = 089 5278
Czech Rep YM = -0458 uaN + 45872 for R2 = 076 5503
Poland YM = -0609 uaN + 39801 for R2 = 081 5198
Romania YM = -0822 uaN + 24046 for R2 = 093 4049
Table 7 Yield prognosis based on the unassimilated quantity of nitrogen (uaN)
5 Soil productivity improvements The concept of NPK fertilizers balance
The simple comparison of CE countries with respect to nutrient management clearly shows
that annual inputs of nitrogen are too high with respect to phosphorus and potassium
Therefore the main reasons of general yield stagnation in most of the CE countries are long-
term negative balances of P and K caused by low input of both mineral and organic
fertilizers As a consequence of soil P and K long-term mining the percentage share of soils
rich in both nutrients declined in the last two decades below the sufficiency level which was
achieved in many countries in 80s (Csatho at al 2007 Grzebisz amp Fotyma 2007)
It has been clearly stressed that in the transition phase of yield development the PFPN indices
reached the highest values resulting in yield gain This phenomenon emerged in years 1990
1991 for Poland and Hungary and in 1991 1992 for the Czech and Slovak Republics In all
these years the supply of P and K fertilizers was low In the Czech Republic ratios between
amounts of applied N-P-K fertilizers expressed as NP2O5K2O was 1025025 on average
This structure in spite of decreased fertilizersrsquo consumption allowed farmers to achieve the
same yields of all crops as in the period 1986-1990 The present structure of nutrient use is as
1015015 for the Czech Republic and 10404 for Poland These disparate nutrient ratios
stress the importance of NPK balance for high crop production The proposed NPK ratio
for the Czech Republic based on the cPFPN index can be established at the level of
1025025 in good years ie under ample water supply or 1025050 in unfavorable years ie
under expected water stress Hence keeping the current level of fertilizers consumption on
arable land ca 130 kg ha-1 one can predict the right amount of nutrients to apply In Poland
the total amount of currently consumed fertilizers is almost the same as in the Czech
wwwintechopencom
Soil Fertility Improvement and Integrated Nutrient Management ndash A Global Perspective
178
Republic Unfortunately soils in Poland are much poorer in potassium and also in
phosphorus being therefore highly sensitive to external supply of nutrients This
conclusion is corroborated by positive trends of yields in response to P and K fertilizers
application as found for all crops since 1991 onwards Consequently under favorable
weather conditions or on soils naturally rich in potassium the suggested formulation of N-
P-K fertilizers is as follows 1033066 but in years with high probability of drought or on
areas sensitive to drought a slightly different formulation is recommended namely
100510
It is not easy to formulate any efficient fertilizing strategy for Romania Since mid- 90s maize and wheat have shown yield stagnation at a very low level The main factors responsible for this situation are i) low N fertilization rates ii) imbalanced use of P and K fertilizers Therefore yields of these two crops are in fact dependent only on the seasonal weather course fluctuating for ca 100 on a yearly scale basis The main reason is unbalanced consumption of basic fertilizers which leads to permanent soil mining especially potassium The NP2O5K2O relationships averaged for the period 2004-2008 as 1027009 is not sufficient to get any yield increase or even its stabilization Potassium accumulates in plant tissues in much higher amounts and is considered as useful nutrient in water management (Cakmak 2005) Thereby this nutrient seems to be crucial for crop production in Romania even taking into account that almost 50 of land area is covered by soil naturally rich in minerals containing K In spite of low N consumption but unbalanced nutrient management there is still a space for an extra N loss for both key crops ie wheat and maize (see Fig 7) Therefore it could be concluded that any yield increase depends on both significant N rate rise and simultaneous change of fertilizer formulations The operational N-P-K fertilizers ratios suggested for Romania are as follows 1033017 in favorable and 10404 in unfavorable years The second scenario should aim at increasing plant survival under drought conditions
6 Thoughts and prospects
The new era of agriculture development in the Central Europe revealed how actual
agriculture outcomes in this region depend on three key factors presented in descending
order i) weather conditions during the growth season ii) inherent soil fertility iii) nitrogen
fertilizer consumption At present the first factor is decisive for crop production High year-
to-year yield variability reflects the imbalanced use of soil and external resources such as
fertilizers Therefore maximum attainable yields ie limited by water supply for example
for wheat are not attainable in all countries of the region In Germany also part of the
Central European region actual yields are above the ldquowater limitedrdquo level (Rabbinge amp
Diepen 2000 Supit et al 2010)
Inherent differences in the nature of soil quality between the CE countries as a background
of nutrient management are strictly related to the soil origin (Plant et al 2005) Except for
Poland all other countries are relatively rich in soils originated from loams (Cambisols) and
loess (Chernozems) These soils exhibit a high inherent potential for supplying K and other
cations such as calcium and magnesium (Nikolova 1998)
However at present nutritional requirements of high yielding crops most of the CE countries are almost entirely oriented on the third yield forming factor ie nitrogen
wwwintechopencom
Constraints and Solutions to Maintain Soil Productivity A Case Study from Central Europe
179
fertilizer use It has been well recognized that a balanced supply of external sources of slowly mobile elements such as phosphorus and potassium is broadly expected (Atkinson et al 2005 Struik amp Bonciarelli 1997) Consequently the average actual and attainable yields of main crops in CE countries are much more related to the soil-adjusted potential than to amounts of currently applied fertilizers As a result CE countries show at present much greater differences in agricultural production than at the end of the 80s
The observed unfavorable patterns of N fertilizer long-term consumption creates problems not only for agriculture production but are also potentially dangerous for the environment as a potential source of reactive nitrogen (Roberts 2006) There are three main questions to be urgently answered by specialists in all countries of the CE region i) do farmers really recognize an increasing yield gap ii) what is the reason for farmers and their advisory services to tolerate low efficiency of nitrogen iii) do farmers and advisory services recognize environmental aspects of the increasing amount of residual nitrogen In order to get answers to these questions one has to be familiar with factors contributing to the improvement in N fertilizer use efficiency
1 Farm management of N in terms of i) N rate quantification ii) time of N fertilizers application and iii) method of N fertilizers application
2 Management of nutrients responsible for the efficiency of N uptake and it in-plant transformation
3 Management of production factors other than N
The first problem is not only of technical nature because it affects in-season nitrogen use
efficiency and in turn actual yieldsrsquo variability However CE countries representing the
restoration type of yield development but at the same time unbalanced pattern of
consumed fertilizers do not indicate needs for increasing actually applied N rates This
strategy is to some extent the core of yield improvement in countries presenting stagnated
type of fertilizersrsquo management provided that any increase in N use will be compensated by
adequate amounts of applied phosphorus and potassium
It could finally be concluded that the realization of both goals of agricultural production in
the CE countries ie i) long-term yield stabilization and even its increase and ii) unit
productivity of the applied fertilizer N increase in turn decreasing amounts of the residual
N requires in the coming future changes in the structure of fertilizersrsquo consumption
keeping in the Unbalanced group of countries the same level of applied fertilizers The
problem of nutrients supply to a growing plant does not however refer only to the balanced
amounts of the applied fertilizers but also to the crop accessibility to soil natural nutrient
pools This problem is inherently related to conditions of root system growth in the soil
body There are a lot of factors limiting roots accessibility to water and nutrients even in
soils of high natural fertility which have been forgotten in the last 50 years but the most
important is soil acidy and related toxicity of aluminum (Atkinson et al 2005 Diatta et al
2010 Marschner 1991 Struik and Bonciarelli 1997) The key strategic target for farmers is to
increase soil volume directly occupied by plant roots in order to improve their access to
unavailable pools of nutrients Three main areas of soil productivity improvement via
increasing crop plants accessibility to nutrients in the subsoil at least may be considered i)
regulation of soil reaction ii) increase of organic matter content iii) removing of any kind of
hardpans It seems highly probable that in the case of Poland all three groups of measures
wwwintechopencom
Soil Fertility Improvement and Integrated Nutrient Management ndash A Global Perspective
180
are important In other countries of the CE soil acidity should be considered as an
agronomical problem for farmers conducting production on Luvisols
7 References
Atkinson A Black K amp Dawson L (2005) Prospects advantages and limitations of future crop production systems dependent upon the management processes Annals of Applied Biology Vol 146 pp 203-215 ISSN 1744-7348
Batjes H (2002) Carbon and nitrogen stocks in the soils of Central and Eastern Europe Soil Use Management Vol 18 pp 324-329 ISSN 1475-2743
Cakmak I (2005) The role of potassium in alleviating detrimental effects of abiotic stresses in plants Journal of Plant Nutrition Soil Science Vol 168 pp 521-530 ISSN 1436-8730
Catt J (2001) The agricultural importance of loess Earth-Science Reviews Vol 54 pp 213-229 ISSN 0012-8252
Cochrane N (2004) EU Enlargement Implications for US_EU agricultural relations US-EU Food and Agriculture ComaprisonWRS-04-04 78-86 Available online at
httpwwwersusdagovpublicationsWRS0404WRS0404pdf (Access 20110524)
Csatho P Sisak I amp Radimszky L (2007) Agriculture as a source of phosphorus causing eutrophication in Central and Eastern Europe Soil Use management Vol 23 (suppl 1) pp 36-56 ISSN 1475-2743
Csatho P amp Radimszky L (2009) Two Worlds within EU27 Sharp Contrasts in Organic and Mineral Nitrogen-Phosphorus Use Nitrogen-Phosphorus Balances and Soil Phosphorus Status Widening and Deepening Gap between Western and Central Europe Communications in Soil Science and Plant Analysis Vol 40 pp 999-1019 ISSN 0010-3624
Diatta J Bocianowski J amp Skubiszewska A (2010) Sulphate-based aluminum phytotoxicity mitigation under strong soil acidification Fresenius Environmental Bulletin Vol 19 No 12b pp 3185-3192 ISSN 1018-4619
Dibb D (2000) The mysteries (myths) of nutrient use efficiency Better Crops Vol 84 No 3 pp 3ndash5 ISSN 0006-0089
Dobermann A amp Cassman K (2002) Plant nutrient management for enhanced productivity in intensive grain production systems of the United States and Asia Plant and Soil Vol 247 pp 153-175 ISSN 1573-5036
Evans L amp Fisher R (1999) Yield potential its definition measurement and significance Crop Science Vol 39 pp 1544-1551 ISSN 1896-0782
Falloon P amp Betts R (2010) Climate impacts on European agriculture and water management in the context of adaptation and mitigation ndash the importance of integrated approach Science of Total Environment Vol 408 pp 5667-5687 ISSN 0048-9697
FAOSTAT Available online at httpfaostatfaoorgdefaultaspx (Access 20110524) Fixen P (2004) Phases in narrowing the yield gap Better Crops Vol 88 No 4 p 3 ISSN
0006-0089 Fronzek S amp Carter T (2007) Assessing uncertainties in climate change impacts on
resource potential for Europe based on projections from RCMs and GCMs Climate Change Vol 81 pp 357-371 ISSN 1758-6798
wwwintechopencom
Constraints and Solutions to Maintain Soil Productivity A Case Study from Central Europe
181
Grzebisz W amp Fotyma M (2007) Recommendations and use of potassium fertilizers in Central-Eastern Europe (CEE) In Proceedings International Fertiliser Society No 621 York UK pp 24 ISBN 978-0-85310-258-8
Grzebisz W Diatta J amp Haerdter R (2010) Fertilizer consumption patterns in Central European countries ndash effect on actual yield development trends in 1986-2005 years - a comparative study of the Czech Republic and Poland Journal of Central European Agriculture Vol 11 No 1 pp 73-82 ISSN 1332-9049
IFADATA Statistics online (2011) wwwfertilizerorgifastatisticsifadata datalineasp (Access 20110524)
Jongman R Bunce R amp Metzger R (2006) Objectives and applications of a statistical environmental stratification of Europe Landscape Ecology 21 409-419 ISSN 1572-9761
Karlen D Ditzler C amp Andrews S (2003) Soil quality why and how Geoderma Vol 114 pp 145-156 ISSN 0016-7061
Kelch D amp Osborne S (2001) Crop production capacity in EuropePrime Economic Research ServiceUSDA Agricultural outlookMarch 2001 19-23 ISSN 0099-1066
Marschner H (1991) Mechanisms of adaptation of plants to acid soils Plant and Soil 134 1-20 ISSN 1573-5036
Neumann K Verburg P amp Stehfest E (2010) The yield gap of global production a spatial analysis Agricultural Systems Vol 103 pp 316-326 ISSN 0308-521X
Nikolova M (1998) The soil potassium resources and the efficiency of potassium fertilizers in Bulgaria Nikola Poushkarow Inst of Soil Science and Agroecology Sofia Bulgaria IPI Country Report 12 39 pp
Olesen J amp Bindi M (2002) Consequences of climate change for European agricultural productivity land use and policy European Journal of Agronomy Vol 16 pp 239-262 ISSN 1161-0301
Olesen J Trnka M amp Kersebaum K (2011) Impacts and adaptation of European crop production systems to climate change European Journal of Agronomy Vol 34 pp 96-112 ISSN 1161-0301
Plant J Whittaker A amp Demitriades B (2005) The geological and tectonic framework of Europe Geochemical Atlas of Europe Part 1 Background Information Methodology Ed Salminen R Maps GTK FOREGS 20 pp ISBN 951-690-956-6
Rabbinge R (1993) The ecological background of food production In Crop protection and sustainable agriculture Wiley Chichester (Ciba Foundation Symposium 177 2-29 ISBN 10 0471939447
Rabbinge R amp Diepen C (2000) Changes in agriculture and land use in Europe European Journal of Agronomy Vol 13 pp 85-100 ISSN 1161-0301
Reilly J Fuglie K (1998) Future yield growth in field crops what evidence exists Soil amp Tillage Research Vol 47 pp 275-290 ISSN 0168-1987
Roberts T (2006) Improving Nutrient Use Efficiency Proceedings of the IFA Agriculture Conference Optimizing Resource Use Efficiency for Sustainable Intensification of Agriculture 27 february-2 March 2006 Kunming China pp 8
Rosegrant M Paisner M amp Meijer S (2001) Global Food Projections to 2020 Emerging trends and alternative futures IFPRI pp 206 ISBN 0-89629-640-7
wwwintechopencom
Soil Fertility Improvement and Integrated Nutrient Management ndash A Global Perspective
182
Sinclair T Purcell L amp Sneller C (2004) Crop transformation and the challenge to increase yield potential Trends in Plant Science Vol 9 No 2 pp 70-75 ISSN 136085
Struik P amp Bonciarelli F (1997) Resource use at the cropping system level European Journal of Agronomy Vol 7 pp 133-143 ISSN 1161-0301
Supit I van Diepen C amp de Wit A (2010) Recent changes in the climatic yield potential of various crops in Europe Agricultural Systems Vol 103 pp 683-694 ISSN 0308-521X
wwwintechopencom
Soil Fertility Improvement and Integrated Nutrient Management - AGlobal PerspectiveEdited by Dr Joann Whalen
ISBN 978-953-307-945-5Hard cover 306 pagesPublisher InTechPublished online 24 February 2012Published in print edition February 2012
InTech EuropeUniversity Campus STeP Ri Slavka Krautzeka 83A 51000 Rijeka Croatia Phone +385 (51) 770 447 Fax +385 (51) 686 166wwwintechopencom
InTech ChinaUnit 405 Office Block Hotel Equatorial Shanghai No65 Yan An Road (West) Shanghai 200040 China
Phone +86-21-62489820 Fax +86-21-62489821
Soil Fertility Improvement and Integrated Nutrient Management A Global Perspective presents 15 invitedchapters written by leading soil fertility experts The book is organized around three themes The first theme isSoil Mapping and Soil Fertility Testing describing spatial heterogeneity in soil nutrients within natural andmanaged ecosystems as well as up-to-date soil testing methods and information on how soil fertility indicatorsrespond to agricultural practices The second theme Organic and Inorganic Amendments for Soil FertilityImprovement describes fertilizing materials that provide important amounts of essential nutrients forplantsThe third theme Integrated Nutrient Management Planning Case Studies From Central Europe SouthAmerica and Africa highlights the principles of integrated nutrient management Additionally it gives casestudies explaining how this approach has been implemented successfully across large geographic regionsand at local scales to improve the productivity of staple crops and forages
How to referenceIn order to correctly reference this scholarly work feel free to copy and paste the following
Witold Grzebisz and Jean Diatta (2012) Constraints and Solutions to Maintain Soil Productivity A Case Studyfrom Central Europe Soil Fertility Improvement and Integrated Nutrient Management - A Global PerspectiveDr Joann Whalen (Ed) ISBN 978-953-307-945-5 InTech Available fromhttpwwwintechopencombookssoil-fertility-improvement-and-integrated-nutrient-management-a-global-perspectiveconstraints-and-solutions-to-maintain-soil-productivity-a-case-study-from-central-europe
copy 2012 The Author(s) Licensee IntechOpen This is an open access articledistributed under the terms of the Creative Commons Attribution 30License which permits unrestricted use distribution and reproduction inany medium provided the original work is properly cited
Soil Fertility Improvement and Integrated Nutrient Management ndash A Global Perspective
160
Rabbinge 1993) The second reason of the YG between Western and Central Europe countries is strictly rooted into the history of both parts of the continent during the 20th century The general objective of agricultural growth in these two mega-regions was to reach food self-sufficiency after World War II In Western Europe due to the market-oriented economy system this target was achieved by the end of the 1970s In CE where the ldquoplanned economyrdquo ruled agricultural production for more than 40 years this key objective was also reached However it was based on a system of state subsidies prevailing as cheap prices of agricultural commodities such as fertilizers pesticides machinery The sudden cut of subsidies at the beginning of the 1990s and huge increase of production prices forced farm managers to restructure the farm economy The first step of its transformation into the market-oriented production system was to decrease the number of employees and reduce amount of applied fertilizers (Csatho amp Radimszky 2009) As a consequence the naturally-occurring yield differences among these macro-regions increased unexpectedly producing a new type of YG termed the temporary yield gap (TYG) (Grzebisz et al 2010)
The primary objective of this contribution is to outline key developments leading to
improved yields of wheat maize grain and sugar beet over a 23 year period from 1986 to
2008 in the CE countries Explanatory objectives for the present yield performance rely on
the fertilizer nitrogen (N) index (partial factor productivity of fertilizer N PFPN) It was used
(1) to calculate for each of indicatory crop indices of the yield gap expressed as the quantity
of (a) virtually lost yield andor (b) unassimilated fertilizer N and (2) to make a long-term
prognosis of crop yields on the basis of the developed set of yield gap indices The third
part of this chapter describes some conceptual solutions based on case studies aiming at
improving soil productivity
2 Natural constraints for crop production
The regionally diversified land productivity in Europe can be well assessed by using net
primary productivity (NPP) The NPP of CE land except the southern part of the Balkan
Peninsula ranges from 800 to 900 g m-2 y-1 ie it is lower by 200 to 300 g m-2 y-1 than in
Western Europe (Fronzek amp Carter 2007) Many reports discussing climate change stress the
increasing sensitivity of key crops to year-to-year weather variability including cereals
(barley wheat) grown in Central-Eastern Europe (Olesen et al 2011 Falloon amp Betts 2010
Supit et al 2010)
21 Climatic conditions
In agriculture climate is considered as the driving factor for crop plant adaptations to
prevailing weather conditions Yield potential is strongly influenced by radiation the sum of
daily temperature and precipitation and also on their distribution over the growth season The
first two factors as a rule are used for calculating yield potential ie a realization of crop
varietiesrsquo potential under undisturbed conditions of growth (Evans amp Fisher 1999) In real
production conditions (country or regional scales) a third climatic constraint ndash water limitation
- is the limiting factor of crop plant growth as discussed by Rabbinge (1993) Base on it the
ldquowater limitedrdquo yield (attainable yield) of a crop plant has been defined Taking into account
these factors Europe is divided into several environmental zones reflecting dominating
weather patterns (Jongman et al 2006) The Western part of the continent and British Islands
wwwintechopencom
Constraints and Solutions to Maintain Soil Productivity A Case Study from Central Europe
161
are characterized by a humid climate highly suitable for cultivating most of C3 crops Mild
winters and sufficiently high precipitation in spring are prerequisites for high yields of cereals
also supporting good yields of sugar beets potatoes and maize in summer months (Supit et al
2010) For example in Belgium and Germany harvested yields of wheat are about 75 of
wheat yield potential whereas French farmers reach about 85 of sugar beet yield potential
In Belgium and The Netherlands farmers are able to harvest ca 90 of maize yield potential
(FAOSTAT 2011)
Most of the CE area is located in the Continental zone which covers the northern part of the region and also northern part of the Balkan Peninsula The Pannonion zone extends from the Black Sea up to Alps The southern part of the region including Albania belongs to Mediterranean Mountains and Mediterranean North zones Main attributes of dominating climatic patterns are irregular precipitations in summer months and frequently occurring droughts negatively affecting plant growth and harvestable yield For example maize yield potential in Romania is calculated at the level of 130 t ha-1 but grain yields harvested by farmers within the period 2005-2009 amounted to 32 t ha-1 In Poland yield potential of potatoes is fixed at the level of ca 40 t ha-1 however tuber yields harvested by farmers are below 50 of this level (FAOSTAT 2011 Supit et al 2010) In spite of climatic disadvantages a spatial analysis of the YG for grain crops undertaken by Neumann et al (2010) indicates that CE is a region with great opportunity for intensifying the production of wheat and maize Therefore current yield gaps in this region cannot be explained solely by seasonal weather variability
22 Soil cover Origin and distribution
Soil cover in CE is not uniform taking into account prevailing soil types The gradient of diversification extends from north to the south in this mega region The natural borders of distinct soil types are Sudety and Carpathian Mountains They were the first natural barriers seriously limiting the transgression of Fenno-Scandian and Alprsquos ice sheets during the Pleistocene epoch towards south of Europe At the same time edges of both transgressing glaciations were natural borders of climatic zones The average annual temperature at the glacial edge was -6oC but on the permafrost zone extending several kilometres to the south or east close to 0oC Extremely low temperatures during ice-sheet transgression created a high pressure gradient favourable to long-distance transport of air-born silt particles Wind mineral deposits termed as loess covered large areas of CE mainly south of Carpathian and Sudety Loess became an excellent parent material for Chernozems and chernozem-like soils Severe climatic conditions in the permafrost zone resulted in intensive weathering of surface rock layer Consequently huge layers of loam materials were formed both in situ or transported as alluvial deposits being precursors in the development of Cambisols (Catt 2001 Plant et al 2005)
The mineralogical composition of soil parent material is therefore significantly different on both sides of Sudety and Carpathian Mountains European countries lying over the northern part ie Poland and also eastern part of Germany are dominated by soils originating from sands loamy sands and sandy loams Consequently the current soil cover is mostly consisted of associations of Luvisols and Podzoluvisols In addition in Poland ca 22 of the soil cover partly used by farmers is classified as associations of Arenosols and Podzols Soil cover in other countries of the CE represents mainly Cambisols (Czech Republic Serbia amp
wwwintechopencom
Soil Fertility Improvement and Integrated Nutrient Management ndash A Global Perspective
162
Montenegro Slovakia Slovenia) contributing to more than 20 Another attribute of the region south of Carpathians is associations of Chernozems (Bulgaria Hungary Romania Serbia amp Montenegro) (Table 1)
Countrysoil types Cambi-
sols1
Cherno-zems2
Fluvisols Luvisols3
Total carbon stock5 t ha-1
soil depth m
00 ndash 03 00 ndash 10
Albania (AL) 316 106 55 253 670 1310
Bulgaria (BU) 200 220 90 310 696 1462
Croatia (CR) 236 09 24 126 649 1178
Czech Republic (CZ) 451 132 59 193 693 1350
Hungary (HU) 108 218 174 65 811 1844
Macedonia (MC) 406 13 51 97 680 1248
Poland (PL) 146 35 47 273 620 1199
Romania (RO) 232 285 107 263 725 1550
Serbia amp Mt4 (SampM) 449 218 86 119 736 1498
Slovak Rep (SK) 468 116 65 290 671 1293
Albania (AL) 453 00 54 64 688 1245
1 amp vertisols2 amp Chernozems-like 3 amp Rendzinas 4Montenegro 5 based on Batjes (2002)
Table 1 Main soil associations (average coverage) of the Central European countries
Using soil potassium (K) supply as the key indicator of soil fertility level it can be assumed that soil type significantly reflects inherent parent material properties ie soil quality Nikolova (1998) has classified soils in three main groups based on their K-sorption characteristics (Table 2) The highest K-fixation capacity is attributed to soils originated from loess or loams from Pliocene and Quaternary deposits The lowest potential of K supply occurs in soils formed from sandy materials Therefore relatively to this rating CE countries may be additionally divided into two main groups ie Poland and parts of Bulgaria versus all other countries In Poland soils with low and even very low K sorption capacity are prevalent About 45 of the agricultural area in Poland is covered by soils originated from sands and loamy-sands This explains the serious limitation of crop productivity by insufficient soil K supply (Grzebisz amp Fotyma 2007)
K-sorption ability classes
Particleslt 001 mm
CECcmol(+) kg-1 soil
Soil types
High gt 50 gt 40 Vertisols PlanasolsKastanozems
Medium 30 - 50 20 - 40 Haplic amp Luvic Chernozems Molic Planasols
Low lt 30 lt 20 Luvisols Eutric Planasols
1Nikolova (1998)
Table 2 General potassium sorption characteristics of main soil types in Central Europe (source Nikolova 1998)
wwwintechopencom
Constraints and Solutions to Maintain Soil Productivity A Case Study from Central Europe
163
3 Agriculturally induced constraints - Fertilizer management
The recorded yield increase of most crops in the last 60 years is a result of two main factors The first is the progress in plant breeding which took place in the 60s and 70s during the Green Revolution (Sinclair et al 2004) However fulfilling nutritional requirements of modern high yielding varieties requires a well balanced supply of nutrients The second factor contributing to modern yield increases is fertilizer use In intensive agriculture it is related to the consumption of fertilizers such as N P and K Therefore a reliable estimation of agriculturally induced constraints for crop production in CE requires an insight into past and current nutrient management strategies
31 Long-term patterns of fertilizersrsquo consumption
Data on historical fertilizer consumption in the period 1986-2008 were obtained from the IFA databank (2011) Fertilizer use per hectare was calculated by dividing the total use of N P and K fertilizers in a given year per actual area of arable land as the target area of application The quantities of fertilizers annually used by farmers over the studied period were both nutrient and country specific (Table 3) During the period 1986-2008 total consumption of N-P-K fertilizers in CE countries has undergone significant changes with respect to
a the quantity of fertilizers annually applied per hectare b the structure of applied fertilizers as related to PN and KN ratios
Statistical parameters
Countries1
AL BampH BU CR CZ HU MC PL RO SampM SV SL
Nitrogen
Average 450 311 633 1007 931 724 467 710 399 458 703 2000
SD2 441 231 372 389 223 251 136 182 201 164 313 1299
CV3 979 742 588 386 239 346 290 257 505 357 445 649
RIN 866 753 680 533 414 526 458 377 629 510 609 800
Phosphorus
Average 149 144 152 440 322 213 228 305 165 144 304 698
SD2 147 121 232 154 323 214 810 163 131 121 333 337
CV3 987 845 1528 350 1005 1004 355 534 796 846 1094 483
RIP 914 812 976 425 839 854 531 657 800 838 866 641
Potassium
Average 24 139 71 481 303 260 175 366 64 157 291 851
SD2 21 113 106 209 343 269 93 183 85 100 348 461
CV3 874 814 1493 433 1133 1036 534 499 1324 641 1197 542
RIK 965 800 970 537 892 863 684 619 931 706 888 718
1 IFA data bank accessed 2011-05-24 2standard deviation 3coefficient of variation
Table 3 Consumption of N P and K fertilizers (in kg ha-1) in Central European countries during the period 1986-2008 and the reduction index (RI) for each nutrient ndash a statistical overview 1Country acronyms are provided in Table 1
wwwintechopencom
Soil Fertility Improvement and Integrated Nutrient Management ndash A Global Perspective
164
The long-term course of fertilizersrsquo consumption showed some resemblances Therefore the
whole investigated period has been divided into three well defined phases (1) High
Consumption Level (HCL) (2) Collapse and Transition (CT) (3) Post Transition (PT) (Fig 1)
Two distinct procedures have been applied to make a reliable estimate of the length of each
phase The HCL was separated from the CT when there was more than 25 change in the
baseline ndash yearly values The PT was established using a linear regression model assuming
statistically proven change
The key attribute of the first phase lasting from four to five years was characterized by high
levels of consumed fertilizers mainly N irrespective of the country (Fig 1) The
consumption of other nutrients ie P and K was country specific The CT phase was
characterized by a dramatic sudden decrease in use of each fertilizer This process occurred
for one or two years in some countries (Czech Republic Croatia Hungary Poland Slovakia
Slovenia) but in others up to 10 years showing prolonged depression The reason of this
drastic decline was well described in economy the scissor phenomena (Cochrane 2004) The PT
phase has been appearing in three distinct forms i) increase (PT-I above the baseline HCL
level) ii) restoration (PT-R significant trend but below the baseline HCL level) iii)
stagnation (PT-S no significant changes over time)
0
20
40
60
80
100
120
140
160
180
1985 1990 1995 2000 2005 2010
Consecutive years (CY)
Nit
rog
en c
onsu
mp
tion
(N
c)
kg
N h
a-1
CR
CZ
RO
Country
HCL CT PT
CR-Nc = 641CY + 12711 R2 = 075 P lt 0001
CZ-Nc = 242CY + 4763 R2 = 074 P lt 0001
Fig 1 Patterns of N fertilizersrsquo consumption in selected Central European countries - Croatia (CR) Czech Republic (CZ) and Romania (RO) during the 1986-2008 period (based on IFA database accessed 2011-05-24) Significant (Plt005) trends are indicated with solid lines and linear regression equations given The CT periods are marked with dashed lines
Nitrogen considered as the key nutrient in crop production but at the same time potentially unfriendly to the environment requires much deeper attention Its consumption in the HCL period was high varying around 100 kg N ha-1 for most countries in the region (Table 3) The lowest consumption (defined by 025 percentile) took place during the CT phase The degree of collapse can be simply assessed by using a fertilizer use reduction index (RI)
wwwintechopencom
Constraints and Solutions to Maintain Soil Productivity A Case Study from Central Europe
165
RI = [1- (025P09P) 100]
where 025P and 09P are the 25th and 90th percentiles of fertilizer consumption over the period 1986-2008
Fertilizer N management in CE during the PT phase relies on consumption trends evaluated for a period of 18 years ie since 1991 onwards On the basis of elaborated regression models countries of the region have been divided into three defined groups
1 Increase (PT-I) Croatia Slovenia 2 Restoration (PT-R) Czech Republic Hungary Poland Slovakia Slovenia 3 Stagnation(PT-S) Albania Bosnia amp Herzegovina Macedonia Bulgaria Romania
Serbia amp Montenegro
Phosphorus is a nutrient of basic importance for any crop plant because all seed crops are highly sensitive to its deficiency during the onset of ripening In the HCL phase the consumption of P fertilizers was in the range of ca 35 to 95 kg P2O5 ha-1 (Table 3) During the period of study its use underwent a great mostly negative change Its consumption trends evaluated for years 1991-2008 showed much greater variability compared to N fertilizersrsquo use in CE countries
1 Increase Croatia Slovenia 2 Restoration Poland Hungary Macedonia 3 Stagnation Albania Czech Slovakia Serbia amp Montenegro 4 Recession Bosnia amp Herzegovina Bulgaria Romania
The occurrence of the fourth group stresses the fact that P fertilizersrsquo consumption was below the levels required to support current crop production leading to nutrient mining in three countries of the region
Potassium is generally considered as a nutrient significantly affecting water management in plants during their life cycle (Cakmak 2005) Therefore this nutrient requires special care on farm in regions like CE that experience frequent drought during the vegetative growth period (Falloon amp Betts 2010) Potassium fertilizersrsquo consumption during the HCL period varied among countries of the region from ca 5 kg K2O ha-1 (Albania) to more than 100 kg K2O ha-1 (former Czechoslovakia) (Table 3) As in the case of P the greatest decline in K consumption occurred in countries significantly increasing the use of nitrogen like the Czech and Slovak Republics and also Hungary (estimated from the potassium fertilizer use reduction index RIK)
The second indicator of fertilizer management is in the proportions of macronutrients consumed indicated during the study by the PN and KN ratios The PN ratio did not show a clear trend for two countries Albania and Bosnia amp Herzegovina In other countries negative tendencies were detected appearing as the increasing value of PN ratio meaning that proportionately more N fertilizer than P fertilizer was applied by farmers This process took place mainly during CT and PT phases Its course during the PT phase outlines three decisive patterns of P fertilizersrsquo management
a negative Czech Republic Croatia Serbia amp Montenegro Romania b positive Hungary Macedonia Poland c stagnation Slovakia
wwwintechopencom
Soil Fertility Improvement and Integrated Nutrient Management ndash A Global Perspective
166
The first trend covers the whole study period differing only in the annual rate of decrease
as indicated by the coefficient of the linear regression equation In the case of Romania it
was almost four times faster than for Croatia (Fig 2) The second pattern occurred in
countries like Hungary and Poland showing a slightly positive trend since 1991
Trends of KN ratios show similar patterns as described for PN ratios (Fig 3) Three
patterns of ratios can be also distinguished but comprising different sets of countries
a negative Macedonia Slovenia
b positive Hungary
c stagnation Croatia Czech Poland Slovakia Bulgaria and Romania (since 1993) Serbia
amp Montenegro (since 2000)
All above-described attributes of long-term fertilizersrsquo consumption were evaluated in Table 4
to develop a ranking based on three types of nutrient management in CE countries as
follows
1 Extensive generally showing low consumption of all fertilizers including N the most
negative attribute is the low P and K inputs leading to crop plants reliance on inherent
soil P and K supply and potentially leading to nutrient mining (Albania Bulgaria
Macedonia Serbia amp Montenegro Romania)
2 Unbalanced high consumption of fertilizer N but at the same time not balanced by
adequate use of other nutrients such as P and K at least (Croatia Czech Slovakia
Slovenia)
3 Balanced high consumption of N fertilizer which is in part balanced by relatively high
consumption of P and K fertilizers (Hungary Poland)
0
01
02
03
04
05
06
07
08
1985 1990 1995 2000 2005 2010
Consecutive years CY
PN
rel
atio
nsh
ip
P
N
CR
PL
RO
Country
PN1-PL = -0053CY + 1076 R2 = 081 P lt 0001
PN2-PL = 0006CY ndash 105 R2 = 038 P lt 001
PN-CR = -0005CY + 105 R2 = 032 P lt 0001
PN-RO = -0019CY + 374 R2 = 081 P lt 0001
Fig 2 Typical patterns of PN ratios in selected Central European countries - Croatia (CR) Poland (PL) and Romania (RO) during the period 1986-2008 Significant (Plt005) negative linear equations are shown for CR and RO while the PL data fitted to a negative linear equation in the period 1986-1996 and thereafter showed a positive linear relationship
wwwintechopencom
Constraints and Solutions to Maintain Soil Productivity A Case Study from Central Europe
167
0
01
02
03
04
05
06
07
08
09
1985 1990 1995 2000 2005 2010
Consecutive years CY
KN
rel
atio
nsh
ip
K
N
CR
PL
RO
Country KN1-PL = -0066CY + 1323 R2 = 070 P lt 001
KN1-RO = -0044CY + 873 R2 = 083 P lt 0001
Fig 3 Typical patterns of KN ratios in selected Central European countries - Croatia (CR) Poland (PL) and Romania (RO) in the period 1986-2008 Significant (Plt005) negative linear equations are shown for CR and RO in the 1986-1992 period thereafter showed non-significant trends For CR the KN trend was non-significant for the whole period
Estimated Parameters
Country3
AL BampH BU CR CZ HU MC PL RO SampM SK SL
Nitrogen 01 0 0 ++ + + 0 + 0 0 + +-
Phosphorus 0 - - ++ 0 + + + - 0 0 +-
Potassium 0 0 0 ++ 0 + 0 + 0 0 0 0
PN 0 0 0 - - + 0 ++ - 0 0 -
KN 0 0 0 0 0 + - 0 0 0 0 -
Ranking2 0 0 0 2 2 1 0 1 0 0 2 2
1evaluation of trends ++ - increase +- restoration 0 - stagnation - - decrease +- - time variable 2 fertilizer management ranking 0 ndash extensive 1 ndash balanced 2 ndash unbalanced 3 Country acronyms are provided in Table 1
Table 4 Fertilizer consumption trends ndashsummary and country management ranking for countries in Central Europe during the period 1986 to 2008
32 Soil fertility status
Soil is considered as a slowly renewable or non-renewable resource that requires the same
level of protection as other limited resources like phosphorus rock There is strong
agreement that productivity of arable land depends on both a soilrsquos fertility potential (soil
quality inherent soil fertility) and present state of soil properties (soil health) to sustain
wwwintechopencom
Soil Fertility Improvement and Integrated Nutrient Management ndash A Global Perspective
168
primary production and other ecological functions The minimum data set to describe
current fertility status of arable land ie soil health should contain indicators reflecting
both past and actual organic matter content soil pH and management of nutrient soil
resources (Atkinson et al 2005 Karlen et al 2003)
Total organic carbon (TOC) stock in the topsoil (00-03 m) or its content () in arable soils is
a good descriptor of short-term trends in soil organic matter (SOM) management However
the organic carbon stock measured to a depth of 1 m in the soil profile can be considered as
an indicator of soil fertility potential The actual content of TOC in an averaged arable soil
unit was calculated by weighted mean content of organic carbon for main soil types (Batjes
2002) and its percentage share in the soil cover for each CE country (see Table 1) Analysis of
this data showed that TOC in the average topsoil unit of CE countries is insufficient ranging
from ca 60 (Poland) to 80 (Hungary) t TOC ha-1 ie about 14 to 18 TOC Differences
between CE countries can be evaluated by TOC stock in the soil profile to a depth of 1 m
Based on this criterion countries can be classified into three groups
a low ( le 120 t TOC ha-1) Croatia Poland b medium (121-160 t TOC ha-1 ) Albania Bulgaria Czech Republic Macedonia
Romania Serbia amp Montenegro Slovakia Slovenia c high (gt 161 t TOC ha-1) Hungary
Phosphorus and Potassium are key nutrients for achieving high productivity of arable soils
Available resources of both nutrients are the most important indicators of soil health ie its
current productivity The country status of current soil nutrient management was evaluated
by means of soil fertility index (SFI) expressed as the sum of the percentage share of arable
land characterised by the very high high and half of medium rating of available P or K
(Grzebisz amp Fotyma 2007) It has been assumed that SFI for P and K exceeding 70 of
arable land share is a prerequisite for high yield of any crop In the 1980s this target was
achieved in many countries of the region like Czechoslovakia Hungary and some countries
of the former Yugoslavia (Serbia amp Montenegro Slovenia) (Fig 4) In these countries the
rates of applied fertilizers were far in excess of crop removal capacity Poland in spite of
currently high K consumption differs from other CE countries The sufficiency level for P
and K of 70 was never reached due to much lower inherent soil potential for nutrient
supply At the beginning of 2000 significant changes of P and K fertility were recorded The
increase of the P sufficiency level was recorded only in Slovenia and Poland In Slovenia the
reason was high consumption of P fertilizers at the beginning of the 21st century In Poland
the increase is related to sufficiently well balanced use of N and P fertilizers and slightly
lower yields than in the 80s In all other CE countries the percentage of P-fertile soils
generally decreased nevertheless the rate of the decrease differed across the region A
slight decrease occurred in Czech and Slovak Republics as well as in Hungary The greatest
drop was recorded in Bulgaria followed by Serbia and Montenegro The potassium SFI
presents much more alarming trend As reported by Grzebisz amp Fotyma (2007) for countries
of the Northern Agricultural Zone (Czech Hungary Poland Slovakia) the K sufficiency
level decreased below the target value within two decades Based on K fertilizersrsquo
consumption trends it can be assumed that the same trend occurs also in the Southern
Zone
wwwintechopencom
Constraints and Solutions to Maintain Soil Productivity A Case Study from Central Europe
169
0
10
20
30
40
50
60
70
80
90
100
AL BU CZ H PL RO SE SK SL
Countries
P s
oil
fert
ility
in
de
x
A
L
1980s
2000s
Sufficiency level
Fig 4 Phosphorus soil fertility indices (expressed as the percentage of arable land AL) for selected CE countries during the period 1986 - 2008 (based on Csatho et al 2007) The sufficiency level was assumed to be 70 as described by Grzebisz amp Fotyma (2007) Country acronyms are given in Table 1
4 Soil productivity assessment
41 Long-term trends in crop yields
All CE countries grow the same crops and cereal species predominate The area sown with cereals occupies 64 of arable land in Croatia 52 - in the Czech Republic 68 - in Poland and 59 ndash in Romania In the Czech Republic cerealsrsquo production is dominated by wheat and barley but in Poland by wheat and rye In Romania and Croatia maize is the key grain crop Sugar beets due to EU regulation in the last 10 years are of minor importance but this crop is a good indicator of soil quality Therefore it has been assumed that these crops would reflect fairly well changes in current soil fertility status as a consequence of applied nutrient management strategies This assumption is well documented by observed variability of yields of wheat maize and sugar beets in selected countries of CE (Table 5) The highest variability was found for Romania and the lowest for Poland Romania is a country with an extensive pattern of fertilizersrsquo management typical in the Southern Agricultural Zone of Europe Poland belongs to countries of the Northern Zone but presents a balanced patterns of fertilizersrsquo management (Poland Hungary) Other selected countries are members of the Unbalanced fertilizing group of CE countries
The long-term yield trend can be used as an indicator of key crops sensitivity to past and current fertilizersrsquo management As in the case of fertilizersrsquo consumption trends three consecutive phases of yield development over the period 1986-2008 may be distinguished
1 Actual-Standard (AS) 2 Recession (RC) 3 Restoration (RS) or Stagnation (SG)
The observed trends of harvested yields were most pronounced for wheat other cereals and for seed crops like oil-seed rape (Grzebisz et al 2010) In the first phase of the study taking
wwwintechopencom
Soil Fertility Improvement and Integrated Nutrient Management ndash A Global Perspective
170
place at the end of the 80s yields of wheat reached on average the highest recorded levels Therefore this particular period is considered as a standard level (AS) for evaluating subsequent phases (Fig 5) The highest yield decline ie the recession phase (RC) in response to the collapse in fertilizer consumption took place in the Northern Zone but
Crops Croatia Czech Republic Poland Romania
x plusmn SD5 CV6 x plusmn SD CV x plusmn SD CV x plusmn SD CV
Wheat 40plusmn052
39plusmn033
44plusmn094
125
86
216
48plusmn05
51plusmn04
52plusmn06
102
78
113
36plusmn03
37plusmn02
39plusmn04
90
56
100
27plusmn06
31plusmn04
29plusmn08
212
141
265
Maize 49plusmn10
40plusmn09
55plusmn13
205
217
229
58plusmn13
51plusmn05
69plusmn05
214
93
76
52plusmn08
49plusmn02
56plusmn08
143
41
157
31plusmn08
29plusmn05
34plusmn11
244
180
315
Sugar
beet
404plusmn77
398plusmn49
487plusmn52
192
123
108
424plusmn76
345plusmn15
531plusmn49
180
42
49
381plusmn55
346plusmn19
451plusmn39
145
56
88
228plusmn51
213plusmn29
304plusmn33
222
136
108
1FAOSTAT available online 2011-05-24 21986-2008 31986-1990 42004-2008 5standard deviation 6coefficient of variation
Table 5 Statistical overview of key cropsrsquo yields (t ha-1) in selected Central European
countries during the period 1986-2008 in comparison to the AS phase and the 2004-2008
periods
0
1
2
3
4
5
6
7
1985 1990 1995 2000 2005 2010
Consecutive years CY
Gra
in y
ield
(Y
) t
ha-1
CZ
RO
Country
AS RC RE or ST
Y-CZ = 0056CY + 1089 R2 = 028 P lt 005
TYG
TYG
Legend level of harvested yield AS Actual-Standard RC Recession RE Restoration ST Stagnation
Dashed line refers to AS level of yield ie an average yield harvested in the period 1986-1990 TYG
Temporary Yield Gap
Fig 5 Long-term trends of wheat production in the Czech Republic (CZ) and Romania (RO)
during the period 1986-2008 Significant (Plt005) positive linear trend is shown for the
Czech Republic whereas non-significant for Romania in the period 1992-2008
wwwintechopencom
Constraints and Solutions to Maintain Soil Productivity A Case Study from Central Europe
171
lasted for only two or three years In other countries mainly representing the Southern Zone it was also fast or showed sustained depression The third phase of yield development was manifested in two distinct trends The first ldquorestorationrdquo trend has shown a positive yield gain since yield recession It was revealed in the Northern Zone countries and also for Croatia and Slovenia The second trend has not shown any significant change in yield since the recession resulting in yield stagnation The most interesting attribute of this trend is its high year-to-year variability The difference between the actually harvested and the AS yield has been termed as the temporary yield gap (TYG) (Fig 5) The time required to recover to the AS level was long but country specific In the Northern Zone it lasted for ca 10-12 years exceeding the AS level in 2004 or 2005 In most other countries representing the Southern Zone it has not been reached up to 2008 For maize and sugar beets the recession was also observed In the recovery period maize yields were generally positive but the rate of the yield increase was much higher in the Balanced and Unbalanced groups than in the Extensive group Sugar beets yield increase was very high at the beginning of the 90s exceeding the level reported in the 80s The main reason was a reduction in area sown with sugar beets which forced farmers to cultivate this crop on more fertile soils
42 The concept of partial factor fertilizer nitrogen productivity (PFPN)
This part of the study relies on two main conceptual pillars The first one assumes that each hectare of arable soil regardless of the current crop is supplied with the same amount of nutrients including nitrogen The second assumption takes into account the fact that the unit productivity of in-season applied fertilizer N known as PFPN is a reliable scientific tool to make simple but quick discrimination of factors limiting attainable crop yield (Dobermann amp Casman 2002) Therefore the PFPN index was used to evaluate some but selected CE countries that represent the three patterns of current fertilizer management (Table 4) Croatia and the Czech Republic have been selected as examples for the Unbalanced group whereas Poland is the Balanced group and Romania represents the Extensive group of fertilizersrsquo use
The PFPN index was obtained by dividing the actual yield of a respective crop harvested within a given year by the annual amount of N fertilizers consumed by the country assuming it was applied at an equal rate for all currently cultivated crops Operationally the PFPN index consists of two components
a yield of crop (Y) expressed in kg or t ha-1 b nitrogen fertilizer rate (FN) expressed as kg N ha-1
PFPN = YFN
Based on the long-term trends of PFPN indices for each of the key crops two different types of PFPN indices can be distinguished
1 The real partial factor productivity of applied N ndash (rPFPN) it reflects actual yields as limited by both water and N availability
2 The maximal partial factor productivity of applied N (mPFPN) it was calculated as the 4th quartile of rPFPN indices it refers to yields obtained under ample water supply
To make a reliable estimate of the yield gap for some crops cultivated in the CE the corrected partial factor productivity of applied N (cPFPN) instead of mPFPN has been applied
wwwintechopencom
Soil Fertility Improvement and Integrated Nutrient Management ndash A Global Perspective
172
Operationally it has been calculated as the average of the 4th quartile but excluding extremely elevated rPFPN values which emerged in most of investigated countries at the beginning of the 90s Indices of N productivity (PFPN rPFPN and cPFPN) were then used to calculate the yield gap
The calculated rPFPN indices showed as expected high year-to-year variability for all tested crops (Table 6) They were crop and country specific when averaged over the 1986-2008 period
a wheat CR lt CZ = PL lt RO b maize CR lt CZ lt PL lt RO c sugar beets CR = CZ lt PL lt RO
These ranges are not in line with long-term average yields of all crops which followed generally the order CZ gt CR gt PL gt RO
Maximum productivity of tested crops as evaluated for the 4th quartile of rPFPN indices was
much higher rising on average by 43 However the increase was country specific and
represents 63 for Croatia 28 for the Czech Republic 30 for Poland and 48 for
Romania The concept of mPFPN assumes an increase of rPFPN indices pursuant to higher
efficiency of applied fertilizer nitrogen due to ample water supply Its reliability has been
corroborated by low coefficients of variation implicitly indicating the potential productivity
of applied fertilizer nitrogen on the background of soil quality The sequences of countries
for each crop are as follows
a wheat CZ = PL lt CR lt RO b maize CR = CZ lt PL lt RO c sugar beets CZ lt PL lt CR lt RO
As presented in Table 6 coefficients of variations of cPFPN indices were significantly lower in comparison to mPFPN stressing on the reliability of the conducted analysis
Relationships between sets of developed rPFPN and applied fertilizer nitrogen rates can also be a useful tool for making long-term assessment of nitrogen efficiency This relationship fits the best the power function
rPFPN = 9112N-067 for R2 = 077 and n = 92
where N ndash annual rate of fertilizer nitrogen consumption kg N ha-1
Analysis of the general curve shape reveals decreasing yield per unit of N fertilizer applied with highest values of rPFPN It has been observed that irrespective of the applied N rate long-term productivity of fertilizer nitrogen increased in the order Romania lt Poland lt Croatia lt the Czech Republic However the obtained high rPFPN values are as a rule related to lower yields of harvested crops This pattern of crop response refers mostly to Bulgaria Romania and former Yugoslavia countries excluding Croatia and Slovenia As pointed out by Fixen (2004) the target of efficient N fertilizer management based on high fertilizer N use efficiency is counter-productive In this N supply system plants are forced to take up an appreciable amount of N from its soil resources which decreases their rate of growth in critical stages of yield performance Therefore ldquothe elevatedrdquo level of the PFPN could be used as an attribute of the extensive type of agriculture production
wwwintechopencom
Constraints and Solutions to Maintain Soil Productivity A Case Study from Central Europe
173
PFPN
index
Croatia Czech Republic Poland Romania
x plusmn SD1 CV2 x plusmn SD CV x plusmn SD CV x plusmn SD CV
Wheat kg yield kg N-1
rPFPN 48plusmn24 498 54plusmn13 235 54plusmn15 275 81plusmn33 405
mPFPN 80plusmn23 288 70plusmn11 160 72plusmn15 212 121plusmn14 119
cPFPN 63plusmn11 174 62plusmn4 59 62plusmn2 30 112plusmn8 69
Maize kg yield kg N-1
rPFPN 56plusmn26 464 66plusmn18 281 78plusmn21 263 95plusmn45 478
mPFPN 89plusmn29 288 89plusmn7 76 103plusmn11 102 149plusmn20 135
cPFPN 69plusmn10 151 89plusmn7 76 96plusmn2 24 137plusmn9 66
Sugar beets kg yield kg N-1
rPFPN 471plusmn224 477 478plusmn120 250 566plusmn136 240 695plusmn266 383
mPFPN 766plusmn218 285 588plusmn49 825 728plusmn67 93 977plusmn122 125
cPFPN 613plusmn86 141 588plusmn49 825 675plusmn35 52 905plusmn36 40
1standard deviation 2coefficient of variation
Table 6 Partial factor fertilizer N productivity statistics for key crops in selected Central European countries with unbalanced (Croatia Czech Republic) balanced (Poland) and extensive (Romania) fertilizersrsquo management during the period 1986-2008
43 Yield gap (YG) and its attributes
Actual yields of crops harvested by farmers in all areas of the world are much lower than
the yield potential of currently cultivated varieties under defined soil and climatic
conditions This ldquovirtualrdquo un-harvested portion of yield is generally termed the yield gap
(YG) (Evans amp Fisher 1999 Dobermann amp Cassman 2002) However the CE countries
experience another phenomenon known as the temporary yield gap (TYG) (Grzebisz et al
2010) The main reason of its emergence is the collapse in fertilizer use leading to elevation
of the rPFPN index Dibb (2000) relates extremely high N efficiency to low yield and this
trend was fully corroborated by the crop yield data from countries with extensive fertilizer
management Nevertheless the countries of the Northern Agricultural Zone (Czech
Republic Hungary Poland Slovakia) in spite of drastic decrease of consumed fertilizers in
the early 90s were characterized by high yields of wheat and other cereal crops (FAOSTAT
2011 Grzebisz et al 2010) The observed rPFPN indices extremely elevated at the beginning
of the 90s were a result of the residual effect of applied fertilizer N This phenomenon could
be manifested only under growth conditions created by ample water and sufficiently high
supply of immobile nutrients such as P and K in turn balancing N use by currently growing
crops
In the first step of yield gap calculation the cPFPN index was applied to assess the maximal
attainable yield (YAM) The yield gap was then calculated as a difference between really
harvestable yield (YA) and YAM
wwwintechopencom
Soil Fertility Improvement and Integrated Nutrient Management ndash A Global Perspective
174
YAM = cPFPN middot DN
YG = YA ndash YAM
where
DN is the rate of annually applied fertilizer N (kg N ha-1) YA is the actual yield in t ha-1 for a
given year and YAM is the maximal attainable yield (t ha-1)
The observed similarities of the general yield gap pattern over time for key crops allow to
distinguish three consecutive phases of its development in the period 1986-2008 (Fig 6)
1 First ndash primary deep yield gap to the left of the transition point (TP) 2 Second ndash point of extra yield gain TP 3 Third- secondary yield gap to the right of the TP alternatively yield gap stagnation as
indicated by the lack of significant (P lt 005) linear trend response
-7
-6
-5
-4
-3
-2
-1
0
1
2
1985 1990 1995 2000 2005 2010
Consecutive years CY
Yie
ld g
ap
(Y
G)
t h
a-1
CZ
RO
TP
YGd-CZ = 079CY - 1573 R2 = 070 P lt 001
YGd-RO = 068CY - 1354 R2 = 072 P lt 0001
YGr-CZ = -012CY + 2354 R2 = 046 P lt 0001
Country
Legend TP - Transition Point YGd - yield gap decline YGr - yield gap restoration
Fig 6 Evolution of the yield gap in wheat in the Czech Republic (CZ) and Romania (RO) during the period 1986 -2008 Significant (Plt005) positive linear equations are shown for the Czech Republic in the period 1986-92 and for Romania in the period 1986-1995 thereafter showed a negative linear relationship for the Czech Republic and non-significant trend for Romania
Wheat is the best example of the yield gap course in the CE countries stressing on the
difference in fertilizer management The main dissimilarities among countries do not refer
to the first phase The YG was deep in spite of relatively high yield indicating thus a low
capacity of contemporary cultivated varieties to achieve further gains in yield Much more
important were YG length and number of years to reach the TP The time to reach the TP
was shorter (6(7) years) in countries such as the Czech and Slovak Republics Hungary and
Poland and also in Croatia and Slovenia corresponding to rapid rebuilding of fertilizer
wwwintechopencom
Constraints and Solutions to Maintain Soil Productivity A Case Study from Central Europe
175
markets in these countries In countries with extensive fertilizersrsquo management the length of
the first phase extended up to mid-90s
The YG evaluation shows that the current nutrient management in CE countries can
overcome this phenomenon especially in the case of wheat and maize A TYG can be most
easily negated in countries belonging to Unbalanced or Balanced nutrient management
groups such as the Czech and Slovak Republics Hungary and Poland and also Croatia and
Slovenia In countries with extensive fertilizersrsquo management the TYG has not been
overcome and enters the third phase of yield development stagnation due to low use of
fertilizers in turn resulting in the very low and unstable level of annually harvested yields
44 Yield prognosis ndash The unassimilated nitrogen concept
The medium or long-term food and environmental policy strategies for any country or
particular region are supported by yield prognosis considered as an operational tool
However the ex-ante prognosis depends on the reliability of the data used Two approaches
both relying on the unit productivity of fertilizer nitrogen (PFPN) have been considered The
first assumes extrapolation of real and improved yields based on the linear model (Reilly amp
Fuglie 1998) The second one is based on long term trends of the YG but transformed into
unit of temporarily lost fertilizer nitrogen termed for the purposes of this study as
unassimilated nitrogen This approach as related to nitrogen management has been used to
make a prognosis of yields of key crops in the CE countries
Operationally the concept presented in this chapter assumes that the total amount of
applied fertilizer nitrogen (FN) is simply divided into three main pools i) assimilated
(FaN) ndash nitrogen taken up by meanwhile grown crop ii) unassimilated nitrogen (FuaN) ndash
temporary out of use by plants andor iii) lost from the field (FLN) The quantitative
assessment of the FuaN pool relies on the defined YG procedure individually related to
each investigated crop
FN = FaN + F uaN + FLN
FuaN = YGcPFPN
where
FuaN ndash unassimilated nitrogen kg N ha-1 YG - yield gap cPFPN ndash the corrected partial factor productivity of applied N kg yield kg N-1
In the first step of yield prognosis the Unassimilated Nitrogen Indices (IuaN) should be computed Therefore the original set of YG data for each of the studied crops was transformed into a quantitative amount of nitrogen lost temporarily from the system marked as minus (-IuaN) In the second step of the analysis both sets of actual (YA) and maximum attainable yields (YM) of each crop were regressed against corresponding set of
uaN indices The obtained regression models clearly show that actual yields over the period of 20 years did not respond significantly to the IuaN as reported in Fig 7 for wheat in Romania The positive and simultaneously significant trends were however achieved when the maximum attainable yield (YM) instead of the actual yield (YA) was introduced into the regression model It can be therefore hypothesized that any virtual loss of nitrogen
wwwintechopencom
Soil Fertility Improvement and Integrated Nutrient Management ndash A Global Perspective
176
ie the negative uaN indices reflect the potential status for a yield increase and vice versa Unfortunately the positive indices of the uaN simply describe a state of N soil mining which in turn causes direct yield decline This is consistent with the opinion of Dibb (2000) and typical for many parts of the world including most CE countries
YM = -0114uaN + 2703 R2 = 093 P lt 0001
0
1
2
3
4
5
6
7
8
9
10
-60 -50 -40 -30 -20 -10 0 10
Gra
in y
ield
(Y
) t
ha-1
YA
YM
Yield
type
Unassimilated nitrogen (uaN) kg N ha-1
Fig 7 Yield prognosis of winter wheat based on residual nitrogen - a case of Romania (RO) Significant (Plt005) linear equation represents the trend for the attainable yields in the 1986-2008 period Legend YA ndash actual yield YM ndash maximum yield
Reliable yield prognosis can be performed assuming a certain level of expected yield or by focusing any improvement of production technology on higher N use efficiency The first approach can be best presented for wheat The maximum attainable yield for this crop in Poland and the Czech Republic is fixed at the level of 65 t ha-1 but for Romania at 45 t ha-1 (Rabbinge amp van Diepen 2000) The amount of uaN required to be incorporated into grain yield was calculated by the models and amounted to 48 27 and 33 kg ha-1 respectively It is equal to 58 27 and 100 of annual N rate applied in these countries and does not seem a realistic approach The same rules refer to other key crops in the study Therefore the second concept relying on the ability of currently cultivated crops to fix an extra amount of
uaN seems to be a more realistic approach for making any reliable yield prognosis (Table 7) This assumption is highly promising especially for countries presenting an extensive type of agriculture production for example Romania The expected wheat increase in response to the use of extra 20 kg N ha-1 is possible considering the water limited yield fixed at 45 t ha-1 The prognosis for the Czech Republic is still below the water limited yield being at 65 t ha-1 In Poland the calculated yields are at the same level as Romania but soils are less suitable for wheat production Therefore any grain yield increase seems to be a great challenge for farmers in all countries of the CE In the light of yields prognosis for sugar beets the fixed level of uaN at 20 kg N ha-1 is generally too low The level of 60 t ha-1 of beets seems to be the most reliable short-term target Thereby the amount of uaN successfully managed should be established at the level of 30 kg ha-1
wwwintechopencom
Constraints and Solutions to Maintain Soil Productivity A Case Study from Central Europe
177
CropCountry Linear regression model Yield at 20 kg uaN t ha-1
Wheat
Croatia YM = -0064 uaN + 3989 for R2 = 096 527
Czech Rep YM = -0063 uaN + 4777 for R2 = 088 604
Poland YM = -0060 uaN + 3623 for R2 = 092 482
Romania YM = -0114 uaN + 2703 for R2 = 093 498
Maize
Croatia YM = -0069 uaN + 4852 for R2 = 086 623
Czech Rep YM = -0064 uaN + 6470 for R2 = 069 776
Poland YM = -0085 uaN + 5431 for R2 = 083 713
Romania YM = -0121 uaN + 3348 for R2 = 094 578
Sugar beets
Croatia YM = -0605 uaN + 40677 for R2 = 089 5278
Czech Rep YM = -0458 uaN + 45872 for R2 = 076 5503
Poland YM = -0609 uaN + 39801 for R2 = 081 5198
Romania YM = -0822 uaN + 24046 for R2 = 093 4049
Table 7 Yield prognosis based on the unassimilated quantity of nitrogen (uaN)
5 Soil productivity improvements The concept of NPK fertilizers balance
The simple comparison of CE countries with respect to nutrient management clearly shows
that annual inputs of nitrogen are too high with respect to phosphorus and potassium
Therefore the main reasons of general yield stagnation in most of the CE countries are long-
term negative balances of P and K caused by low input of both mineral and organic
fertilizers As a consequence of soil P and K long-term mining the percentage share of soils
rich in both nutrients declined in the last two decades below the sufficiency level which was
achieved in many countries in 80s (Csatho at al 2007 Grzebisz amp Fotyma 2007)
It has been clearly stressed that in the transition phase of yield development the PFPN indices
reached the highest values resulting in yield gain This phenomenon emerged in years 1990
1991 for Poland and Hungary and in 1991 1992 for the Czech and Slovak Republics In all
these years the supply of P and K fertilizers was low In the Czech Republic ratios between
amounts of applied N-P-K fertilizers expressed as NP2O5K2O was 1025025 on average
This structure in spite of decreased fertilizersrsquo consumption allowed farmers to achieve the
same yields of all crops as in the period 1986-1990 The present structure of nutrient use is as
1015015 for the Czech Republic and 10404 for Poland These disparate nutrient ratios
stress the importance of NPK balance for high crop production The proposed NPK ratio
for the Czech Republic based on the cPFPN index can be established at the level of
1025025 in good years ie under ample water supply or 1025050 in unfavorable years ie
under expected water stress Hence keeping the current level of fertilizers consumption on
arable land ca 130 kg ha-1 one can predict the right amount of nutrients to apply In Poland
the total amount of currently consumed fertilizers is almost the same as in the Czech
wwwintechopencom
Soil Fertility Improvement and Integrated Nutrient Management ndash A Global Perspective
178
Republic Unfortunately soils in Poland are much poorer in potassium and also in
phosphorus being therefore highly sensitive to external supply of nutrients This
conclusion is corroborated by positive trends of yields in response to P and K fertilizers
application as found for all crops since 1991 onwards Consequently under favorable
weather conditions or on soils naturally rich in potassium the suggested formulation of N-
P-K fertilizers is as follows 1033066 but in years with high probability of drought or on
areas sensitive to drought a slightly different formulation is recommended namely
100510
It is not easy to formulate any efficient fertilizing strategy for Romania Since mid- 90s maize and wheat have shown yield stagnation at a very low level The main factors responsible for this situation are i) low N fertilization rates ii) imbalanced use of P and K fertilizers Therefore yields of these two crops are in fact dependent only on the seasonal weather course fluctuating for ca 100 on a yearly scale basis The main reason is unbalanced consumption of basic fertilizers which leads to permanent soil mining especially potassium The NP2O5K2O relationships averaged for the period 2004-2008 as 1027009 is not sufficient to get any yield increase or even its stabilization Potassium accumulates in plant tissues in much higher amounts and is considered as useful nutrient in water management (Cakmak 2005) Thereby this nutrient seems to be crucial for crop production in Romania even taking into account that almost 50 of land area is covered by soil naturally rich in minerals containing K In spite of low N consumption but unbalanced nutrient management there is still a space for an extra N loss for both key crops ie wheat and maize (see Fig 7) Therefore it could be concluded that any yield increase depends on both significant N rate rise and simultaneous change of fertilizer formulations The operational N-P-K fertilizers ratios suggested for Romania are as follows 1033017 in favorable and 10404 in unfavorable years The second scenario should aim at increasing plant survival under drought conditions
6 Thoughts and prospects
The new era of agriculture development in the Central Europe revealed how actual
agriculture outcomes in this region depend on three key factors presented in descending
order i) weather conditions during the growth season ii) inherent soil fertility iii) nitrogen
fertilizer consumption At present the first factor is decisive for crop production High year-
to-year yield variability reflects the imbalanced use of soil and external resources such as
fertilizers Therefore maximum attainable yields ie limited by water supply for example
for wheat are not attainable in all countries of the region In Germany also part of the
Central European region actual yields are above the ldquowater limitedrdquo level (Rabbinge amp
Diepen 2000 Supit et al 2010)
Inherent differences in the nature of soil quality between the CE countries as a background
of nutrient management are strictly related to the soil origin (Plant et al 2005) Except for
Poland all other countries are relatively rich in soils originated from loams (Cambisols) and
loess (Chernozems) These soils exhibit a high inherent potential for supplying K and other
cations such as calcium and magnesium (Nikolova 1998)
However at present nutritional requirements of high yielding crops most of the CE countries are almost entirely oriented on the third yield forming factor ie nitrogen
wwwintechopencom
Constraints and Solutions to Maintain Soil Productivity A Case Study from Central Europe
179
fertilizer use It has been well recognized that a balanced supply of external sources of slowly mobile elements such as phosphorus and potassium is broadly expected (Atkinson et al 2005 Struik amp Bonciarelli 1997) Consequently the average actual and attainable yields of main crops in CE countries are much more related to the soil-adjusted potential than to amounts of currently applied fertilizers As a result CE countries show at present much greater differences in agricultural production than at the end of the 80s
The observed unfavorable patterns of N fertilizer long-term consumption creates problems not only for agriculture production but are also potentially dangerous for the environment as a potential source of reactive nitrogen (Roberts 2006) There are three main questions to be urgently answered by specialists in all countries of the CE region i) do farmers really recognize an increasing yield gap ii) what is the reason for farmers and their advisory services to tolerate low efficiency of nitrogen iii) do farmers and advisory services recognize environmental aspects of the increasing amount of residual nitrogen In order to get answers to these questions one has to be familiar with factors contributing to the improvement in N fertilizer use efficiency
1 Farm management of N in terms of i) N rate quantification ii) time of N fertilizers application and iii) method of N fertilizers application
2 Management of nutrients responsible for the efficiency of N uptake and it in-plant transformation
3 Management of production factors other than N
The first problem is not only of technical nature because it affects in-season nitrogen use
efficiency and in turn actual yieldsrsquo variability However CE countries representing the
restoration type of yield development but at the same time unbalanced pattern of
consumed fertilizers do not indicate needs for increasing actually applied N rates This
strategy is to some extent the core of yield improvement in countries presenting stagnated
type of fertilizersrsquo management provided that any increase in N use will be compensated by
adequate amounts of applied phosphorus and potassium
It could finally be concluded that the realization of both goals of agricultural production in
the CE countries ie i) long-term yield stabilization and even its increase and ii) unit
productivity of the applied fertilizer N increase in turn decreasing amounts of the residual
N requires in the coming future changes in the structure of fertilizersrsquo consumption
keeping in the Unbalanced group of countries the same level of applied fertilizers The
problem of nutrients supply to a growing plant does not however refer only to the balanced
amounts of the applied fertilizers but also to the crop accessibility to soil natural nutrient
pools This problem is inherently related to conditions of root system growth in the soil
body There are a lot of factors limiting roots accessibility to water and nutrients even in
soils of high natural fertility which have been forgotten in the last 50 years but the most
important is soil acidy and related toxicity of aluminum (Atkinson et al 2005 Diatta et al
2010 Marschner 1991 Struik and Bonciarelli 1997) The key strategic target for farmers is to
increase soil volume directly occupied by plant roots in order to improve their access to
unavailable pools of nutrients Three main areas of soil productivity improvement via
increasing crop plants accessibility to nutrients in the subsoil at least may be considered i)
regulation of soil reaction ii) increase of organic matter content iii) removing of any kind of
hardpans It seems highly probable that in the case of Poland all three groups of measures
wwwintechopencom
Soil Fertility Improvement and Integrated Nutrient Management ndash A Global Perspective
180
are important In other countries of the CE soil acidity should be considered as an
agronomical problem for farmers conducting production on Luvisols
7 References
Atkinson A Black K amp Dawson L (2005) Prospects advantages and limitations of future crop production systems dependent upon the management processes Annals of Applied Biology Vol 146 pp 203-215 ISSN 1744-7348
Batjes H (2002) Carbon and nitrogen stocks in the soils of Central and Eastern Europe Soil Use Management Vol 18 pp 324-329 ISSN 1475-2743
Cakmak I (2005) The role of potassium in alleviating detrimental effects of abiotic stresses in plants Journal of Plant Nutrition Soil Science Vol 168 pp 521-530 ISSN 1436-8730
Catt J (2001) The agricultural importance of loess Earth-Science Reviews Vol 54 pp 213-229 ISSN 0012-8252
Cochrane N (2004) EU Enlargement Implications for US_EU agricultural relations US-EU Food and Agriculture ComaprisonWRS-04-04 78-86 Available online at
httpwwwersusdagovpublicationsWRS0404WRS0404pdf (Access 20110524)
Csatho P Sisak I amp Radimszky L (2007) Agriculture as a source of phosphorus causing eutrophication in Central and Eastern Europe Soil Use management Vol 23 (suppl 1) pp 36-56 ISSN 1475-2743
Csatho P amp Radimszky L (2009) Two Worlds within EU27 Sharp Contrasts in Organic and Mineral Nitrogen-Phosphorus Use Nitrogen-Phosphorus Balances and Soil Phosphorus Status Widening and Deepening Gap between Western and Central Europe Communications in Soil Science and Plant Analysis Vol 40 pp 999-1019 ISSN 0010-3624
Diatta J Bocianowski J amp Skubiszewska A (2010) Sulphate-based aluminum phytotoxicity mitigation under strong soil acidification Fresenius Environmental Bulletin Vol 19 No 12b pp 3185-3192 ISSN 1018-4619
Dibb D (2000) The mysteries (myths) of nutrient use efficiency Better Crops Vol 84 No 3 pp 3ndash5 ISSN 0006-0089
Dobermann A amp Cassman K (2002) Plant nutrient management for enhanced productivity in intensive grain production systems of the United States and Asia Plant and Soil Vol 247 pp 153-175 ISSN 1573-5036
Evans L amp Fisher R (1999) Yield potential its definition measurement and significance Crop Science Vol 39 pp 1544-1551 ISSN 1896-0782
Falloon P amp Betts R (2010) Climate impacts on European agriculture and water management in the context of adaptation and mitigation ndash the importance of integrated approach Science of Total Environment Vol 408 pp 5667-5687 ISSN 0048-9697
FAOSTAT Available online at httpfaostatfaoorgdefaultaspx (Access 20110524) Fixen P (2004) Phases in narrowing the yield gap Better Crops Vol 88 No 4 p 3 ISSN
0006-0089 Fronzek S amp Carter T (2007) Assessing uncertainties in climate change impacts on
resource potential for Europe based on projections from RCMs and GCMs Climate Change Vol 81 pp 357-371 ISSN 1758-6798
wwwintechopencom
Constraints and Solutions to Maintain Soil Productivity A Case Study from Central Europe
181
Grzebisz W amp Fotyma M (2007) Recommendations and use of potassium fertilizers in Central-Eastern Europe (CEE) In Proceedings International Fertiliser Society No 621 York UK pp 24 ISBN 978-0-85310-258-8
Grzebisz W Diatta J amp Haerdter R (2010) Fertilizer consumption patterns in Central European countries ndash effect on actual yield development trends in 1986-2005 years - a comparative study of the Czech Republic and Poland Journal of Central European Agriculture Vol 11 No 1 pp 73-82 ISSN 1332-9049
IFADATA Statistics online (2011) wwwfertilizerorgifastatisticsifadata datalineasp (Access 20110524)
Jongman R Bunce R amp Metzger R (2006) Objectives and applications of a statistical environmental stratification of Europe Landscape Ecology 21 409-419 ISSN 1572-9761
Karlen D Ditzler C amp Andrews S (2003) Soil quality why and how Geoderma Vol 114 pp 145-156 ISSN 0016-7061
Kelch D amp Osborne S (2001) Crop production capacity in EuropePrime Economic Research ServiceUSDA Agricultural outlookMarch 2001 19-23 ISSN 0099-1066
Marschner H (1991) Mechanisms of adaptation of plants to acid soils Plant and Soil 134 1-20 ISSN 1573-5036
Neumann K Verburg P amp Stehfest E (2010) The yield gap of global production a spatial analysis Agricultural Systems Vol 103 pp 316-326 ISSN 0308-521X
Nikolova M (1998) The soil potassium resources and the efficiency of potassium fertilizers in Bulgaria Nikola Poushkarow Inst of Soil Science and Agroecology Sofia Bulgaria IPI Country Report 12 39 pp
Olesen J amp Bindi M (2002) Consequences of climate change for European agricultural productivity land use and policy European Journal of Agronomy Vol 16 pp 239-262 ISSN 1161-0301
Olesen J Trnka M amp Kersebaum K (2011) Impacts and adaptation of European crop production systems to climate change European Journal of Agronomy Vol 34 pp 96-112 ISSN 1161-0301
Plant J Whittaker A amp Demitriades B (2005) The geological and tectonic framework of Europe Geochemical Atlas of Europe Part 1 Background Information Methodology Ed Salminen R Maps GTK FOREGS 20 pp ISBN 951-690-956-6
Rabbinge R (1993) The ecological background of food production In Crop protection and sustainable agriculture Wiley Chichester (Ciba Foundation Symposium 177 2-29 ISBN 10 0471939447
Rabbinge R amp Diepen C (2000) Changes in agriculture and land use in Europe European Journal of Agronomy Vol 13 pp 85-100 ISSN 1161-0301
Reilly J Fuglie K (1998) Future yield growth in field crops what evidence exists Soil amp Tillage Research Vol 47 pp 275-290 ISSN 0168-1987
Roberts T (2006) Improving Nutrient Use Efficiency Proceedings of the IFA Agriculture Conference Optimizing Resource Use Efficiency for Sustainable Intensification of Agriculture 27 february-2 March 2006 Kunming China pp 8
Rosegrant M Paisner M amp Meijer S (2001) Global Food Projections to 2020 Emerging trends and alternative futures IFPRI pp 206 ISBN 0-89629-640-7
wwwintechopencom
Soil Fertility Improvement and Integrated Nutrient Management ndash A Global Perspective
182
Sinclair T Purcell L amp Sneller C (2004) Crop transformation and the challenge to increase yield potential Trends in Plant Science Vol 9 No 2 pp 70-75 ISSN 136085
Struik P amp Bonciarelli F (1997) Resource use at the cropping system level European Journal of Agronomy Vol 7 pp 133-143 ISSN 1161-0301
Supit I van Diepen C amp de Wit A (2010) Recent changes in the climatic yield potential of various crops in Europe Agricultural Systems Vol 103 pp 683-694 ISSN 0308-521X
wwwintechopencom
Soil Fertility Improvement and Integrated Nutrient Management - AGlobal PerspectiveEdited by Dr Joann Whalen
ISBN 978-953-307-945-5Hard cover 306 pagesPublisher InTechPublished online 24 February 2012Published in print edition February 2012
InTech EuropeUniversity Campus STeP Ri Slavka Krautzeka 83A 51000 Rijeka Croatia Phone +385 (51) 770 447 Fax +385 (51) 686 166wwwintechopencom
InTech ChinaUnit 405 Office Block Hotel Equatorial Shanghai No65 Yan An Road (West) Shanghai 200040 China
Phone +86-21-62489820 Fax +86-21-62489821
Soil Fertility Improvement and Integrated Nutrient Management A Global Perspective presents 15 invitedchapters written by leading soil fertility experts The book is organized around three themes The first theme isSoil Mapping and Soil Fertility Testing describing spatial heterogeneity in soil nutrients within natural andmanaged ecosystems as well as up-to-date soil testing methods and information on how soil fertility indicatorsrespond to agricultural practices The second theme Organic and Inorganic Amendments for Soil FertilityImprovement describes fertilizing materials that provide important amounts of essential nutrients forplantsThe third theme Integrated Nutrient Management Planning Case Studies From Central Europe SouthAmerica and Africa highlights the principles of integrated nutrient management Additionally it gives casestudies explaining how this approach has been implemented successfully across large geographic regionsand at local scales to improve the productivity of staple crops and forages
How to referenceIn order to correctly reference this scholarly work feel free to copy and paste the following
Witold Grzebisz and Jean Diatta (2012) Constraints and Solutions to Maintain Soil Productivity A Case Studyfrom Central Europe Soil Fertility Improvement and Integrated Nutrient Management - A Global PerspectiveDr Joann Whalen (Ed) ISBN 978-953-307-945-5 InTech Available fromhttpwwwintechopencombookssoil-fertility-improvement-and-integrated-nutrient-management-a-global-perspectiveconstraints-and-solutions-to-maintain-soil-productivity-a-case-study-from-central-europe
copy 2012 The Author(s) Licensee IntechOpen This is an open access articledistributed under the terms of the Creative Commons Attribution 30License which permits unrestricted use distribution and reproduction inany medium provided the original work is properly cited
Constraints and Solutions to Maintain Soil Productivity A Case Study from Central Europe
161
are characterized by a humid climate highly suitable for cultivating most of C3 crops Mild
winters and sufficiently high precipitation in spring are prerequisites for high yields of cereals
also supporting good yields of sugar beets potatoes and maize in summer months (Supit et al
2010) For example in Belgium and Germany harvested yields of wheat are about 75 of
wheat yield potential whereas French farmers reach about 85 of sugar beet yield potential
In Belgium and The Netherlands farmers are able to harvest ca 90 of maize yield potential
(FAOSTAT 2011)
Most of the CE area is located in the Continental zone which covers the northern part of the region and also northern part of the Balkan Peninsula The Pannonion zone extends from the Black Sea up to Alps The southern part of the region including Albania belongs to Mediterranean Mountains and Mediterranean North zones Main attributes of dominating climatic patterns are irregular precipitations in summer months and frequently occurring droughts negatively affecting plant growth and harvestable yield For example maize yield potential in Romania is calculated at the level of 130 t ha-1 but grain yields harvested by farmers within the period 2005-2009 amounted to 32 t ha-1 In Poland yield potential of potatoes is fixed at the level of ca 40 t ha-1 however tuber yields harvested by farmers are below 50 of this level (FAOSTAT 2011 Supit et al 2010) In spite of climatic disadvantages a spatial analysis of the YG for grain crops undertaken by Neumann et al (2010) indicates that CE is a region with great opportunity for intensifying the production of wheat and maize Therefore current yield gaps in this region cannot be explained solely by seasonal weather variability
22 Soil cover Origin and distribution
Soil cover in CE is not uniform taking into account prevailing soil types The gradient of diversification extends from north to the south in this mega region The natural borders of distinct soil types are Sudety and Carpathian Mountains They were the first natural barriers seriously limiting the transgression of Fenno-Scandian and Alprsquos ice sheets during the Pleistocene epoch towards south of Europe At the same time edges of both transgressing glaciations were natural borders of climatic zones The average annual temperature at the glacial edge was -6oC but on the permafrost zone extending several kilometres to the south or east close to 0oC Extremely low temperatures during ice-sheet transgression created a high pressure gradient favourable to long-distance transport of air-born silt particles Wind mineral deposits termed as loess covered large areas of CE mainly south of Carpathian and Sudety Loess became an excellent parent material for Chernozems and chernozem-like soils Severe climatic conditions in the permafrost zone resulted in intensive weathering of surface rock layer Consequently huge layers of loam materials were formed both in situ or transported as alluvial deposits being precursors in the development of Cambisols (Catt 2001 Plant et al 2005)
The mineralogical composition of soil parent material is therefore significantly different on both sides of Sudety and Carpathian Mountains European countries lying over the northern part ie Poland and also eastern part of Germany are dominated by soils originating from sands loamy sands and sandy loams Consequently the current soil cover is mostly consisted of associations of Luvisols and Podzoluvisols In addition in Poland ca 22 of the soil cover partly used by farmers is classified as associations of Arenosols and Podzols Soil cover in other countries of the CE represents mainly Cambisols (Czech Republic Serbia amp
wwwintechopencom
Soil Fertility Improvement and Integrated Nutrient Management ndash A Global Perspective
162
Montenegro Slovakia Slovenia) contributing to more than 20 Another attribute of the region south of Carpathians is associations of Chernozems (Bulgaria Hungary Romania Serbia amp Montenegro) (Table 1)
Countrysoil types Cambi-
sols1
Cherno-zems2
Fluvisols Luvisols3
Total carbon stock5 t ha-1
soil depth m
00 ndash 03 00 ndash 10
Albania (AL) 316 106 55 253 670 1310
Bulgaria (BU) 200 220 90 310 696 1462
Croatia (CR) 236 09 24 126 649 1178
Czech Republic (CZ) 451 132 59 193 693 1350
Hungary (HU) 108 218 174 65 811 1844
Macedonia (MC) 406 13 51 97 680 1248
Poland (PL) 146 35 47 273 620 1199
Romania (RO) 232 285 107 263 725 1550
Serbia amp Mt4 (SampM) 449 218 86 119 736 1498
Slovak Rep (SK) 468 116 65 290 671 1293
Albania (AL) 453 00 54 64 688 1245
1 amp vertisols2 amp Chernozems-like 3 amp Rendzinas 4Montenegro 5 based on Batjes (2002)
Table 1 Main soil associations (average coverage) of the Central European countries
Using soil potassium (K) supply as the key indicator of soil fertility level it can be assumed that soil type significantly reflects inherent parent material properties ie soil quality Nikolova (1998) has classified soils in three main groups based on their K-sorption characteristics (Table 2) The highest K-fixation capacity is attributed to soils originated from loess or loams from Pliocene and Quaternary deposits The lowest potential of K supply occurs in soils formed from sandy materials Therefore relatively to this rating CE countries may be additionally divided into two main groups ie Poland and parts of Bulgaria versus all other countries In Poland soils with low and even very low K sorption capacity are prevalent About 45 of the agricultural area in Poland is covered by soils originated from sands and loamy-sands This explains the serious limitation of crop productivity by insufficient soil K supply (Grzebisz amp Fotyma 2007)
K-sorption ability classes
Particleslt 001 mm
CECcmol(+) kg-1 soil
Soil types
High gt 50 gt 40 Vertisols PlanasolsKastanozems
Medium 30 - 50 20 - 40 Haplic amp Luvic Chernozems Molic Planasols
Low lt 30 lt 20 Luvisols Eutric Planasols
1Nikolova (1998)
Table 2 General potassium sorption characteristics of main soil types in Central Europe (source Nikolova 1998)
wwwintechopencom
Constraints and Solutions to Maintain Soil Productivity A Case Study from Central Europe
163
3 Agriculturally induced constraints - Fertilizer management
The recorded yield increase of most crops in the last 60 years is a result of two main factors The first is the progress in plant breeding which took place in the 60s and 70s during the Green Revolution (Sinclair et al 2004) However fulfilling nutritional requirements of modern high yielding varieties requires a well balanced supply of nutrients The second factor contributing to modern yield increases is fertilizer use In intensive agriculture it is related to the consumption of fertilizers such as N P and K Therefore a reliable estimation of agriculturally induced constraints for crop production in CE requires an insight into past and current nutrient management strategies
31 Long-term patterns of fertilizersrsquo consumption
Data on historical fertilizer consumption in the period 1986-2008 were obtained from the IFA databank (2011) Fertilizer use per hectare was calculated by dividing the total use of N P and K fertilizers in a given year per actual area of arable land as the target area of application The quantities of fertilizers annually used by farmers over the studied period were both nutrient and country specific (Table 3) During the period 1986-2008 total consumption of N-P-K fertilizers in CE countries has undergone significant changes with respect to
a the quantity of fertilizers annually applied per hectare b the structure of applied fertilizers as related to PN and KN ratios
Statistical parameters
Countries1
AL BampH BU CR CZ HU MC PL RO SampM SV SL
Nitrogen
Average 450 311 633 1007 931 724 467 710 399 458 703 2000
SD2 441 231 372 389 223 251 136 182 201 164 313 1299
CV3 979 742 588 386 239 346 290 257 505 357 445 649
RIN 866 753 680 533 414 526 458 377 629 510 609 800
Phosphorus
Average 149 144 152 440 322 213 228 305 165 144 304 698
SD2 147 121 232 154 323 214 810 163 131 121 333 337
CV3 987 845 1528 350 1005 1004 355 534 796 846 1094 483
RIP 914 812 976 425 839 854 531 657 800 838 866 641
Potassium
Average 24 139 71 481 303 260 175 366 64 157 291 851
SD2 21 113 106 209 343 269 93 183 85 100 348 461
CV3 874 814 1493 433 1133 1036 534 499 1324 641 1197 542
RIK 965 800 970 537 892 863 684 619 931 706 888 718
1 IFA data bank accessed 2011-05-24 2standard deviation 3coefficient of variation
Table 3 Consumption of N P and K fertilizers (in kg ha-1) in Central European countries during the period 1986-2008 and the reduction index (RI) for each nutrient ndash a statistical overview 1Country acronyms are provided in Table 1
wwwintechopencom
Soil Fertility Improvement and Integrated Nutrient Management ndash A Global Perspective
164
The long-term course of fertilizersrsquo consumption showed some resemblances Therefore the
whole investigated period has been divided into three well defined phases (1) High
Consumption Level (HCL) (2) Collapse and Transition (CT) (3) Post Transition (PT) (Fig 1)
Two distinct procedures have been applied to make a reliable estimate of the length of each
phase The HCL was separated from the CT when there was more than 25 change in the
baseline ndash yearly values The PT was established using a linear regression model assuming
statistically proven change
The key attribute of the first phase lasting from four to five years was characterized by high
levels of consumed fertilizers mainly N irrespective of the country (Fig 1) The
consumption of other nutrients ie P and K was country specific The CT phase was
characterized by a dramatic sudden decrease in use of each fertilizer This process occurred
for one or two years in some countries (Czech Republic Croatia Hungary Poland Slovakia
Slovenia) but in others up to 10 years showing prolonged depression The reason of this
drastic decline was well described in economy the scissor phenomena (Cochrane 2004) The PT
phase has been appearing in three distinct forms i) increase (PT-I above the baseline HCL
level) ii) restoration (PT-R significant trend but below the baseline HCL level) iii)
stagnation (PT-S no significant changes over time)
0
20
40
60
80
100
120
140
160
180
1985 1990 1995 2000 2005 2010
Consecutive years (CY)
Nit
rog
en c
onsu
mp
tion
(N
c)
kg
N h
a-1
CR
CZ
RO
Country
HCL CT PT
CR-Nc = 641CY + 12711 R2 = 075 P lt 0001
CZ-Nc = 242CY + 4763 R2 = 074 P lt 0001
Fig 1 Patterns of N fertilizersrsquo consumption in selected Central European countries - Croatia (CR) Czech Republic (CZ) and Romania (RO) during the 1986-2008 period (based on IFA database accessed 2011-05-24) Significant (Plt005) trends are indicated with solid lines and linear regression equations given The CT periods are marked with dashed lines
Nitrogen considered as the key nutrient in crop production but at the same time potentially unfriendly to the environment requires much deeper attention Its consumption in the HCL period was high varying around 100 kg N ha-1 for most countries in the region (Table 3) The lowest consumption (defined by 025 percentile) took place during the CT phase The degree of collapse can be simply assessed by using a fertilizer use reduction index (RI)
wwwintechopencom
Constraints and Solutions to Maintain Soil Productivity A Case Study from Central Europe
165
RI = [1- (025P09P) 100]
where 025P and 09P are the 25th and 90th percentiles of fertilizer consumption over the period 1986-2008
Fertilizer N management in CE during the PT phase relies on consumption trends evaluated for a period of 18 years ie since 1991 onwards On the basis of elaborated regression models countries of the region have been divided into three defined groups
1 Increase (PT-I) Croatia Slovenia 2 Restoration (PT-R) Czech Republic Hungary Poland Slovakia Slovenia 3 Stagnation(PT-S) Albania Bosnia amp Herzegovina Macedonia Bulgaria Romania
Serbia amp Montenegro
Phosphorus is a nutrient of basic importance for any crop plant because all seed crops are highly sensitive to its deficiency during the onset of ripening In the HCL phase the consumption of P fertilizers was in the range of ca 35 to 95 kg P2O5 ha-1 (Table 3) During the period of study its use underwent a great mostly negative change Its consumption trends evaluated for years 1991-2008 showed much greater variability compared to N fertilizersrsquo use in CE countries
1 Increase Croatia Slovenia 2 Restoration Poland Hungary Macedonia 3 Stagnation Albania Czech Slovakia Serbia amp Montenegro 4 Recession Bosnia amp Herzegovina Bulgaria Romania
The occurrence of the fourth group stresses the fact that P fertilizersrsquo consumption was below the levels required to support current crop production leading to nutrient mining in three countries of the region
Potassium is generally considered as a nutrient significantly affecting water management in plants during their life cycle (Cakmak 2005) Therefore this nutrient requires special care on farm in regions like CE that experience frequent drought during the vegetative growth period (Falloon amp Betts 2010) Potassium fertilizersrsquo consumption during the HCL period varied among countries of the region from ca 5 kg K2O ha-1 (Albania) to more than 100 kg K2O ha-1 (former Czechoslovakia) (Table 3) As in the case of P the greatest decline in K consumption occurred in countries significantly increasing the use of nitrogen like the Czech and Slovak Republics and also Hungary (estimated from the potassium fertilizer use reduction index RIK)
The second indicator of fertilizer management is in the proportions of macronutrients consumed indicated during the study by the PN and KN ratios The PN ratio did not show a clear trend for two countries Albania and Bosnia amp Herzegovina In other countries negative tendencies were detected appearing as the increasing value of PN ratio meaning that proportionately more N fertilizer than P fertilizer was applied by farmers This process took place mainly during CT and PT phases Its course during the PT phase outlines three decisive patterns of P fertilizersrsquo management
a negative Czech Republic Croatia Serbia amp Montenegro Romania b positive Hungary Macedonia Poland c stagnation Slovakia
wwwintechopencom
Soil Fertility Improvement and Integrated Nutrient Management ndash A Global Perspective
166
The first trend covers the whole study period differing only in the annual rate of decrease
as indicated by the coefficient of the linear regression equation In the case of Romania it
was almost four times faster than for Croatia (Fig 2) The second pattern occurred in
countries like Hungary and Poland showing a slightly positive trend since 1991
Trends of KN ratios show similar patterns as described for PN ratios (Fig 3) Three
patterns of ratios can be also distinguished but comprising different sets of countries
a negative Macedonia Slovenia
b positive Hungary
c stagnation Croatia Czech Poland Slovakia Bulgaria and Romania (since 1993) Serbia
amp Montenegro (since 2000)
All above-described attributes of long-term fertilizersrsquo consumption were evaluated in Table 4
to develop a ranking based on three types of nutrient management in CE countries as
follows
1 Extensive generally showing low consumption of all fertilizers including N the most
negative attribute is the low P and K inputs leading to crop plants reliance on inherent
soil P and K supply and potentially leading to nutrient mining (Albania Bulgaria
Macedonia Serbia amp Montenegro Romania)
2 Unbalanced high consumption of fertilizer N but at the same time not balanced by
adequate use of other nutrients such as P and K at least (Croatia Czech Slovakia
Slovenia)
3 Balanced high consumption of N fertilizer which is in part balanced by relatively high
consumption of P and K fertilizers (Hungary Poland)
0
01
02
03
04
05
06
07
08
1985 1990 1995 2000 2005 2010
Consecutive years CY
PN
rel
atio
nsh
ip
P
N
CR
PL
RO
Country
PN1-PL = -0053CY + 1076 R2 = 081 P lt 0001
PN2-PL = 0006CY ndash 105 R2 = 038 P lt 001
PN-CR = -0005CY + 105 R2 = 032 P lt 0001
PN-RO = -0019CY + 374 R2 = 081 P lt 0001
Fig 2 Typical patterns of PN ratios in selected Central European countries - Croatia (CR) Poland (PL) and Romania (RO) during the period 1986-2008 Significant (Plt005) negative linear equations are shown for CR and RO while the PL data fitted to a negative linear equation in the period 1986-1996 and thereafter showed a positive linear relationship
wwwintechopencom
Constraints and Solutions to Maintain Soil Productivity A Case Study from Central Europe
167
0
01
02
03
04
05
06
07
08
09
1985 1990 1995 2000 2005 2010
Consecutive years CY
KN
rel
atio
nsh
ip
K
N
CR
PL
RO
Country KN1-PL = -0066CY + 1323 R2 = 070 P lt 001
KN1-RO = -0044CY + 873 R2 = 083 P lt 0001
Fig 3 Typical patterns of KN ratios in selected Central European countries - Croatia (CR) Poland (PL) and Romania (RO) in the period 1986-2008 Significant (Plt005) negative linear equations are shown for CR and RO in the 1986-1992 period thereafter showed non-significant trends For CR the KN trend was non-significant for the whole period
Estimated Parameters
Country3
AL BampH BU CR CZ HU MC PL RO SampM SK SL
Nitrogen 01 0 0 ++ + + 0 + 0 0 + +-
Phosphorus 0 - - ++ 0 + + + - 0 0 +-
Potassium 0 0 0 ++ 0 + 0 + 0 0 0 0
PN 0 0 0 - - + 0 ++ - 0 0 -
KN 0 0 0 0 0 + - 0 0 0 0 -
Ranking2 0 0 0 2 2 1 0 1 0 0 2 2
1evaluation of trends ++ - increase +- restoration 0 - stagnation - - decrease +- - time variable 2 fertilizer management ranking 0 ndash extensive 1 ndash balanced 2 ndash unbalanced 3 Country acronyms are provided in Table 1
Table 4 Fertilizer consumption trends ndashsummary and country management ranking for countries in Central Europe during the period 1986 to 2008
32 Soil fertility status
Soil is considered as a slowly renewable or non-renewable resource that requires the same
level of protection as other limited resources like phosphorus rock There is strong
agreement that productivity of arable land depends on both a soilrsquos fertility potential (soil
quality inherent soil fertility) and present state of soil properties (soil health) to sustain
wwwintechopencom
Soil Fertility Improvement and Integrated Nutrient Management ndash A Global Perspective
168
primary production and other ecological functions The minimum data set to describe
current fertility status of arable land ie soil health should contain indicators reflecting
both past and actual organic matter content soil pH and management of nutrient soil
resources (Atkinson et al 2005 Karlen et al 2003)
Total organic carbon (TOC) stock in the topsoil (00-03 m) or its content () in arable soils is
a good descriptor of short-term trends in soil organic matter (SOM) management However
the organic carbon stock measured to a depth of 1 m in the soil profile can be considered as
an indicator of soil fertility potential The actual content of TOC in an averaged arable soil
unit was calculated by weighted mean content of organic carbon for main soil types (Batjes
2002) and its percentage share in the soil cover for each CE country (see Table 1) Analysis of
this data showed that TOC in the average topsoil unit of CE countries is insufficient ranging
from ca 60 (Poland) to 80 (Hungary) t TOC ha-1 ie about 14 to 18 TOC Differences
between CE countries can be evaluated by TOC stock in the soil profile to a depth of 1 m
Based on this criterion countries can be classified into three groups
a low ( le 120 t TOC ha-1) Croatia Poland b medium (121-160 t TOC ha-1 ) Albania Bulgaria Czech Republic Macedonia
Romania Serbia amp Montenegro Slovakia Slovenia c high (gt 161 t TOC ha-1) Hungary
Phosphorus and Potassium are key nutrients for achieving high productivity of arable soils
Available resources of both nutrients are the most important indicators of soil health ie its
current productivity The country status of current soil nutrient management was evaluated
by means of soil fertility index (SFI) expressed as the sum of the percentage share of arable
land characterised by the very high high and half of medium rating of available P or K
(Grzebisz amp Fotyma 2007) It has been assumed that SFI for P and K exceeding 70 of
arable land share is a prerequisite for high yield of any crop In the 1980s this target was
achieved in many countries of the region like Czechoslovakia Hungary and some countries
of the former Yugoslavia (Serbia amp Montenegro Slovenia) (Fig 4) In these countries the
rates of applied fertilizers were far in excess of crop removal capacity Poland in spite of
currently high K consumption differs from other CE countries The sufficiency level for P
and K of 70 was never reached due to much lower inherent soil potential for nutrient
supply At the beginning of 2000 significant changes of P and K fertility were recorded The
increase of the P sufficiency level was recorded only in Slovenia and Poland In Slovenia the
reason was high consumption of P fertilizers at the beginning of the 21st century In Poland
the increase is related to sufficiently well balanced use of N and P fertilizers and slightly
lower yields than in the 80s In all other CE countries the percentage of P-fertile soils
generally decreased nevertheless the rate of the decrease differed across the region A
slight decrease occurred in Czech and Slovak Republics as well as in Hungary The greatest
drop was recorded in Bulgaria followed by Serbia and Montenegro The potassium SFI
presents much more alarming trend As reported by Grzebisz amp Fotyma (2007) for countries
of the Northern Agricultural Zone (Czech Hungary Poland Slovakia) the K sufficiency
level decreased below the target value within two decades Based on K fertilizersrsquo
consumption trends it can be assumed that the same trend occurs also in the Southern
Zone
wwwintechopencom
Constraints and Solutions to Maintain Soil Productivity A Case Study from Central Europe
169
0
10
20
30
40
50
60
70
80
90
100
AL BU CZ H PL RO SE SK SL
Countries
P s
oil
fert
ility
in
de
x
A
L
1980s
2000s
Sufficiency level
Fig 4 Phosphorus soil fertility indices (expressed as the percentage of arable land AL) for selected CE countries during the period 1986 - 2008 (based on Csatho et al 2007) The sufficiency level was assumed to be 70 as described by Grzebisz amp Fotyma (2007) Country acronyms are given in Table 1
4 Soil productivity assessment
41 Long-term trends in crop yields
All CE countries grow the same crops and cereal species predominate The area sown with cereals occupies 64 of arable land in Croatia 52 - in the Czech Republic 68 - in Poland and 59 ndash in Romania In the Czech Republic cerealsrsquo production is dominated by wheat and barley but in Poland by wheat and rye In Romania and Croatia maize is the key grain crop Sugar beets due to EU regulation in the last 10 years are of minor importance but this crop is a good indicator of soil quality Therefore it has been assumed that these crops would reflect fairly well changes in current soil fertility status as a consequence of applied nutrient management strategies This assumption is well documented by observed variability of yields of wheat maize and sugar beets in selected countries of CE (Table 5) The highest variability was found for Romania and the lowest for Poland Romania is a country with an extensive pattern of fertilizersrsquo management typical in the Southern Agricultural Zone of Europe Poland belongs to countries of the Northern Zone but presents a balanced patterns of fertilizersrsquo management (Poland Hungary) Other selected countries are members of the Unbalanced fertilizing group of CE countries
The long-term yield trend can be used as an indicator of key crops sensitivity to past and current fertilizersrsquo management As in the case of fertilizersrsquo consumption trends three consecutive phases of yield development over the period 1986-2008 may be distinguished
1 Actual-Standard (AS) 2 Recession (RC) 3 Restoration (RS) or Stagnation (SG)
The observed trends of harvested yields were most pronounced for wheat other cereals and for seed crops like oil-seed rape (Grzebisz et al 2010) In the first phase of the study taking
wwwintechopencom
Soil Fertility Improvement and Integrated Nutrient Management ndash A Global Perspective
170
place at the end of the 80s yields of wheat reached on average the highest recorded levels Therefore this particular period is considered as a standard level (AS) for evaluating subsequent phases (Fig 5) The highest yield decline ie the recession phase (RC) in response to the collapse in fertilizer consumption took place in the Northern Zone but
Crops Croatia Czech Republic Poland Romania
x plusmn SD5 CV6 x plusmn SD CV x plusmn SD CV x plusmn SD CV
Wheat 40plusmn052
39plusmn033
44plusmn094
125
86
216
48plusmn05
51plusmn04
52plusmn06
102
78
113
36plusmn03
37plusmn02
39plusmn04
90
56
100
27plusmn06
31plusmn04
29plusmn08
212
141
265
Maize 49plusmn10
40plusmn09
55plusmn13
205
217
229
58plusmn13
51plusmn05
69plusmn05
214
93
76
52plusmn08
49plusmn02
56plusmn08
143
41
157
31plusmn08
29plusmn05
34plusmn11
244
180
315
Sugar
beet
404plusmn77
398plusmn49
487plusmn52
192
123
108
424plusmn76
345plusmn15
531plusmn49
180
42
49
381plusmn55
346plusmn19
451plusmn39
145
56
88
228plusmn51
213plusmn29
304plusmn33
222
136
108
1FAOSTAT available online 2011-05-24 21986-2008 31986-1990 42004-2008 5standard deviation 6coefficient of variation
Table 5 Statistical overview of key cropsrsquo yields (t ha-1) in selected Central European
countries during the period 1986-2008 in comparison to the AS phase and the 2004-2008
periods
0
1
2
3
4
5
6
7
1985 1990 1995 2000 2005 2010
Consecutive years CY
Gra
in y
ield
(Y
) t
ha-1
CZ
RO
Country
AS RC RE or ST
Y-CZ = 0056CY + 1089 R2 = 028 P lt 005
TYG
TYG
Legend level of harvested yield AS Actual-Standard RC Recession RE Restoration ST Stagnation
Dashed line refers to AS level of yield ie an average yield harvested in the period 1986-1990 TYG
Temporary Yield Gap
Fig 5 Long-term trends of wheat production in the Czech Republic (CZ) and Romania (RO)
during the period 1986-2008 Significant (Plt005) positive linear trend is shown for the
Czech Republic whereas non-significant for Romania in the period 1992-2008
wwwintechopencom
Constraints and Solutions to Maintain Soil Productivity A Case Study from Central Europe
171
lasted for only two or three years In other countries mainly representing the Southern Zone it was also fast or showed sustained depression The third phase of yield development was manifested in two distinct trends The first ldquorestorationrdquo trend has shown a positive yield gain since yield recession It was revealed in the Northern Zone countries and also for Croatia and Slovenia The second trend has not shown any significant change in yield since the recession resulting in yield stagnation The most interesting attribute of this trend is its high year-to-year variability The difference between the actually harvested and the AS yield has been termed as the temporary yield gap (TYG) (Fig 5) The time required to recover to the AS level was long but country specific In the Northern Zone it lasted for ca 10-12 years exceeding the AS level in 2004 or 2005 In most other countries representing the Southern Zone it has not been reached up to 2008 For maize and sugar beets the recession was also observed In the recovery period maize yields were generally positive but the rate of the yield increase was much higher in the Balanced and Unbalanced groups than in the Extensive group Sugar beets yield increase was very high at the beginning of the 90s exceeding the level reported in the 80s The main reason was a reduction in area sown with sugar beets which forced farmers to cultivate this crop on more fertile soils
42 The concept of partial factor fertilizer nitrogen productivity (PFPN)
This part of the study relies on two main conceptual pillars The first one assumes that each hectare of arable soil regardless of the current crop is supplied with the same amount of nutrients including nitrogen The second assumption takes into account the fact that the unit productivity of in-season applied fertilizer N known as PFPN is a reliable scientific tool to make simple but quick discrimination of factors limiting attainable crop yield (Dobermann amp Casman 2002) Therefore the PFPN index was used to evaluate some but selected CE countries that represent the three patterns of current fertilizer management (Table 4) Croatia and the Czech Republic have been selected as examples for the Unbalanced group whereas Poland is the Balanced group and Romania represents the Extensive group of fertilizersrsquo use
The PFPN index was obtained by dividing the actual yield of a respective crop harvested within a given year by the annual amount of N fertilizers consumed by the country assuming it was applied at an equal rate for all currently cultivated crops Operationally the PFPN index consists of two components
a yield of crop (Y) expressed in kg or t ha-1 b nitrogen fertilizer rate (FN) expressed as kg N ha-1
PFPN = YFN
Based on the long-term trends of PFPN indices for each of the key crops two different types of PFPN indices can be distinguished
1 The real partial factor productivity of applied N ndash (rPFPN) it reflects actual yields as limited by both water and N availability
2 The maximal partial factor productivity of applied N (mPFPN) it was calculated as the 4th quartile of rPFPN indices it refers to yields obtained under ample water supply
To make a reliable estimate of the yield gap for some crops cultivated in the CE the corrected partial factor productivity of applied N (cPFPN) instead of mPFPN has been applied
wwwintechopencom
Soil Fertility Improvement and Integrated Nutrient Management ndash A Global Perspective
172
Operationally it has been calculated as the average of the 4th quartile but excluding extremely elevated rPFPN values which emerged in most of investigated countries at the beginning of the 90s Indices of N productivity (PFPN rPFPN and cPFPN) were then used to calculate the yield gap
The calculated rPFPN indices showed as expected high year-to-year variability for all tested crops (Table 6) They were crop and country specific when averaged over the 1986-2008 period
a wheat CR lt CZ = PL lt RO b maize CR lt CZ lt PL lt RO c sugar beets CR = CZ lt PL lt RO
These ranges are not in line with long-term average yields of all crops which followed generally the order CZ gt CR gt PL gt RO
Maximum productivity of tested crops as evaluated for the 4th quartile of rPFPN indices was
much higher rising on average by 43 However the increase was country specific and
represents 63 for Croatia 28 for the Czech Republic 30 for Poland and 48 for
Romania The concept of mPFPN assumes an increase of rPFPN indices pursuant to higher
efficiency of applied fertilizer nitrogen due to ample water supply Its reliability has been
corroborated by low coefficients of variation implicitly indicating the potential productivity
of applied fertilizer nitrogen on the background of soil quality The sequences of countries
for each crop are as follows
a wheat CZ = PL lt CR lt RO b maize CR = CZ lt PL lt RO c sugar beets CZ lt PL lt CR lt RO
As presented in Table 6 coefficients of variations of cPFPN indices were significantly lower in comparison to mPFPN stressing on the reliability of the conducted analysis
Relationships between sets of developed rPFPN and applied fertilizer nitrogen rates can also be a useful tool for making long-term assessment of nitrogen efficiency This relationship fits the best the power function
rPFPN = 9112N-067 for R2 = 077 and n = 92
where N ndash annual rate of fertilizer nitrogen consumption kg N ha-1
Analysis of the general curve shape reveals decreasing yield per unit of N fertilizer applied with highest values of rPFPN It has been observed that irrespective of the applied N rate long-term productivity of fertilizer nitrogen increased in the order Romania lt Poland lt Croatia lt the Czech Republic However the obtained high rPFPN values are as a rule related to lower yields of harvested crops This pattern of crop response refers mostly to Bulgaria Romania and former Yugoslavia countries excluding Croatia and Slovenia As pointed out by Fixen (2004) the target of efficient N fertilizer management based on high fertilizer N use efficiency is counter-productive In this N supply system plants are forced to take up an appreciable amount of N from its soil resources which decreases their rate of growth in critical stages of yield performance Therefore ldquothe elevatedrdquo level of the PFPN could be used as an attribute of the extensive type of agriculture production
wwwintechopencom
Constraints and Solutions to Maintain Soil Productivity A Case Study from Central Europe
173
PFPN
index
Croatia Czech Republic Poland Romania
x plusmn SD1 CV2 x plusmn SD CV x plusmn SD CV x plusmn SD CV
Wheat kg yield kg N-1
rPFPN 48plusmn24 498 54plusmn13 235 54plusmn15 275 81plusmn33 405
mPFPN 80plusmn23 288 70plusmn11 160 72plusmn15 212 121plusmn14 119
cPFPN 63plusmn11 174 62plusmn4 59 62plusmn2 30 112plusmn8 69
Maize kg yield kg N-1
rPFPN 56plusmn26 464 66plusmn18 281 78plusmn21 263 95plusmn45 478
mPFPN 89plusmn29 288 89plusmn7 76 103plusmn11 102 149plusmn20 135
cPFPN 69plusmn10 151 89plusmn7 76 96plusmn2 24 137plusmn9 66
Sugar beets kg yield kg N-1
rPFPN 471plusmn224 477 478plusmn120 250 566plusmn136 240 695plusmn266 383
mPFPN 766plusmn218 285 588plusmn49 825 728plusmn67 93 977plusmn122 125
cPFPN 613plusmn86 141 588plusmn49 825 675plusmn35 52 905plusmn36 40
1standard deviation 2coefficient of variation
Table 6 Partial factor fertilizer N productivity statistics for key crops in selected Central European countries with unbalanced (Croatia Czech Republic) balanced (Poland) and extensive (Romania) fertilizersrsquo management during the period 1986-2008
43 Yield gap (YG) and its attributes
Actual yields of crops harvested by farmers in all areas of the world are much lower than
the yield potential of currently cultivated varieties under defined soil and climatic
conditions This ldquovirtualrdquo un-harvested portion of yield is generally termed the yield gap
(YG) (Evans amp Fisher 1999 Dobermann amp Cassman 2002) However the CE countries
experience another phenomenon known as the temporary yield gap (TYG) (Grzebisz et al
2010) The main reason of its emergence is the collapse in fertilizer use leading to elevation
of the rPFPN index Dibb (2000) relates extremely high N efficiency to low yield and this
trend was fully corroborated by the crop yield data from countries with extensive fertilizer
management Nevertheless the countries of the Northern Agricultural Zone (Czech
Republic Hungary Poland Slovakia) in spite of drastic decrease of consumed fertilizers in
the early 90s were characterized by high yields of wheat and other cereal crops (FAOSTAT
2011 Grzebisz et al 2010) The observed rPFPN indices extremely elevated at the beginning
of the 90s were a result of the residual effect of applied fertilizer N This phenomenon could
be manifested only under growth conditions created by ample water and sufficiently high
supply of immobile nutrients such as P and K in turn balancing N use by currently growing
crops
In the first step of yield gap calculation the cPFPN index was applied to assess the maximal
attainable yield (YAM) The yield gap was then calculated as a difference between really
harvestable yield (YA) and YAM
wwwintechopencom
Soil Fertility Improvement and Integrated Nutrient Management ndash A Global Perspective
174
YAM = cPFPN middot DN
YG = YA ndash YAM
where
DN is the rate of annually applied fertilizer N (kg N ha-1) YA is the actual yield in t ha-1 for a
given year and YAM is the maximal attainable yield (t ha-1)
The observed similarities of the general yield gap pattern over time for key crops allow to
distinguish three consecutive phases of its development in the period 1986-2008 (Fig 6)
1 First ndash primary deep yield gap to the left of the transition point (TP) 2 Second ndash point of extra yield gain TP 3 Third- secondary yield gap to the right of the TP alternatively yield gap stagnation as
indicated by the lack of significant (P lt 005) linear trend response
-7
-6
-5
-4
-3
-2
-1
0
1
2
1985 1990 1995 2000 2005 2010
Consecutive years CY
Yie
ld g
ap
(Y
G)
t h
a-1
CZ
RO
TP
YGd-CZ = 079CY - 1573 R2 = 070 P lt 001
YGd-RO = 068CY - 1354 R2 = 072 P lt 0001
YGr-CZ = -012CY + 2354 R2 = 046 P lt 0001
Country
Legend TP - Transition Point YGd - yield gap decline YGr - yield gap restoration
Fig 6 Evolution of the yield gap in wheat in the Czech Republic (CZ) and Romania (RO) during the period 1986 -2008 Significant (Plt005) positive linear equations are shown for the Czech Republic in the period 1986-92 and for Romania in the period 1986-1995 thereafter showed a negative linear relationship for the Czech Republic and non-significant trend for Romania
Wheat is the best example of the yield gap course in the CE countries stressing on the
difference in fertilizer management The main dissimilarities among countries do not refer
to the first phase The YG was deep in spite of relatively high yield indicating thus a low
capacity of contemporary cultivated varieties to achieve further gains in yield Much more
important were YG length and number of years to reach the TP The time to reach the TP
was shorter (6(7) years) in countries such as the Czech and Slovak Republics Hungary and
Poland and also in Croatia and Slovenia corresponding to rapid rebuilding of fertilizer
wwwintechopencom
Constraints and Solutions to Maintain Soil Productivity A Case Study from Central Europe
175
markets in these countries In countries with extensive fertilizersrsquo management the length of
the first phase extended up to mid-90s
The YG evaluation shows that the current nutrient management in CE countries can
overcome this phenomenon especially in the case of wheat and maize A TYG can be most
easily negated in countries belonging to Unbalanced or Balanced nutrient management
groups such as the Czech and Slovak Republics Hungary and Poland and also Croatia and
Slovenia In countries with extensive fertilizersrsquo management the TYG has not been
overcome and enters the third phase of yield development stagnation due to low use of
fertilizers in turn resulting in the very low and unstable level of annually harvested yields
44 Yield prognosis ndash The unassimilated nitrogen concept
The medium or long-term food and environmental policy strategies for any country or
particular region are supported by yield prognosis considered as an operational tool
However the ex-ante prognosis depends on the reliability of the data used Two approaches
both relying on the unit productivity of fertilizer nitrogen (PFPN) have been considered The
first assumes extrapolation of real and improved yields based on the linear model (Reilly amp
Fuglie 1998) The second one is based on long term trends of the YG but transformed into
unit of temporarily lost fertilizer nitrogen termed for the purposes of this study as
unassimilated nitrogen This approach as related to nitrogen management has been used to
make a prognosis of yields of key crops in the CE countries
Operationally the concept presented in this chapter assumes that the total amount of
applied fertilizer nitrogen (FN) is simply divided into three main pools i) assimilated
(FaN) ndash nitrogen taken up by meanwhile grown crop ii) unassimilated nitrogen (FuaN) ndash
temporary out of use by plants andor iii) lost from the field (FLN) The quantitative
assessment of the FuaN pool relies on the defined YG procedure individually related to
each investigated crop
FN = FaN + F uaN + FLN
FuaN = YGcPFPN
where
FuaN ndash unassimilated nitrogen kg N ha-1 YG - yield gap cPFPN ndash the corrected partial factor productivity of applied N kg yield kg N-1
In the first step of yield prognosis the Unassimilated Nitrogen Indices (IuaN) should be computed Therefore the original set of YG data for each of the studied crops was transformed into a quantitative amount of nitrogen lost temporarily from the system marked as minus (-IuaN) In the second step of the analysis both sets of actual (YA) and maximum attainable yields (YM) of each crop were regressed against corresponding set of
uaN indices The obtained regression models clearly show that actual yields over the period of 20 years did not respond significantly to the IuaN as reported in Fig 7 for wheat in Romania The positive and simultaneously significant trends were however achieved when the maximum attainable yield (YM) instead of the actual yield (YA) was introduced into the regression model It can be therefore hypothesized that any virtual loss of nitrogen
wwwintechopencom
Soil Fertility Improvement and Integrated Nutrient Management ndash A Global Perspective
176
ie the negative uaN indices reflect the potential status for a yield increase and vice versa Unfortunately the positive indices of the uaN simply describe a state of N soil mining which in turn causes direct yield decline This is consistent with the opinion of Dibb (2000) and typical for many parts of the world including most CE countries
YM = -0114uaN + 2703 R2 = 093 P lt 0001
0
1
2
3
4
5
6
7
8
9
10
-60 -50 -40 -30 -20 -10 0 10
Gra
in y
ield
(Y
) t
ha-1
YA
YM
Yield
type
Unassimilated nitrogen (uaN) kg N ha-1
Fig 7 Yield prognosis of winter wheat based on residual nitrogen - a case of Romania (RO) Significant (Plt005) linear equation represents the trend for the attainable yields in the 1986-2008 period Legend YA ndash actual yield YM ndash maximum yield
Reliable yield prognosis can be performed assuming a certain level of expected yield or by focusing any improvement of production technology on higher N use efficiency The first approach can be best presented for wheat The maximum attainable yield for this crop in Poland and the Czech Republic is fixed at the level of 65 t ha-1 but for Romania at 45 t ha-1 (Rabbinge amp van Diepen 2000) The amount of uaN required to be incorporated into grain yield was calculated by the models and amounted to 48 27 and 33 kg ha-1 respectively It is equal to 58 27 and 100 of annual N rate applied in these countries and does not seem a realistic approach The same rules refer to other key crops in the study Therefore the second concept relying on the ability of currently cultivated crops to fix an extra amount of
uaN seems to be a more realistic approach for making any reliable yield prognosis (Table 7) This assumption is highly promising especially for countries presenting an extensive type of agriculture production for example Romania The expected wheat increase in response to the use of extra 20 kg N ha-1 is possible considering the water limited yield fixed at 45 t ha-1 The prognosis for the Czech Republic is still below the water limited yield being at 65 t ha-1 In Poland the calculated yields are at the same level as Romania but soils are less suitable for wheat production Therefore any grain yield increase seems to be a great challenge for farmers in all countries of the CE In the light of yields prognosis for sugar beets the fixed level of uaN at 20 kg N ha-1 is generally too low The level of 60 t ha-1 of beets seems to be the most reliable short-term target Thereby the amount of uaN successfully managed should be established at the level of 30 kg ha-1
wwwintechopencom
Constraints and Solutions to Maintain Soil Productivity A Case Study from Central Europe
177
CropCountry Linear regression model Yield at 20 kg uaN t ha-1
Wheat
Croatia YM = -0064 uaN + 3989 for R2 = 096 527
Czech Rep YM = -0063 uaN + 4777 for R2 = 088 604
Poland YM = -0060 uaN + 3623 for R2 = 092 482
Romania YM = -0114 uaN + 2703 for R2 = 093 498
Maize
Croatia YM = -0069 uaN + 4852 for R2 = 086 623
Czech Rep YM = -0064 uaN + 6470 for R2 = 069 776
Poland YM = -0085 uaN + 5431 for R2 = 083 713
Romania YM = -0121 uaN + 3348 for R2 = 094 578
Sugar beets
Croatia YM = -0605 uaN + 40677 for R2 = 089 5278
Czech Rep YM = -0458 uaN + 45872 for R2 = 076 5503
Poland YM = -0609 uaN + 39801 for R2 = 081 5198
Romania YM = -0822 uaN + 24046 for R2 = 093 4049
Table 7 Yield prognosis based on the unassimilated quantity of nitrogen (uaN)
5 Soil productivity improvements The concept of NPK fertilizers balance
The simple comparison of CE countries with respect to nutrient management clearly shows
that annual inputs of nitrogen are too high with respect to phosphorus and potassium
Therefore the main reasons of general yield stagnation in most of the CE countries are long-
term negative balances of P and K caused by low input of both mineral and organic
fertilizers As a consequence of soil P and K long-term mining the percentage share of soils
rich in both nutrients declined in the last two decades below the sufficiency level which was
achieved in many countries in 80s (Csatho at al 2007 Grzebisz amp Fotyma 2007)
It has been clearly stressed that in the transition phase of yield development the PFPN indices
reached the highest values resulting in yield gain This phenomenon emerged in years 1990
1991 for Poland and Hungary and in 1991 1992 for the Czech and Slovak Republics In all
these years the supply of P and K fertilizers was low In the Czech Republic ratios between
amounts of applied N-P-K fertilizers expressed as NP2O5K2O was 1025025 on average
This structure in spite of decreased fertilizersrsquo consumption allowed farmers to achieve the
same yields of all crops as in the period 1986-1990 The present structure of nutrient use is as
1015015 for the Czech Republic and 10404 for Poland These disparate nutrient ratios
stress the importance of NPK balance for high crop production The proposed NPK ratio
for the Czech Republic based on the cPFPN index can be established at the level of
1025025 in good years ie under ample water supply or 1025050 in unfavorable years ie
under expected water stress Hence keeping the current level of fertilizers consumption on
arable land ca 130 kg ha-1 one can predict the right amount of nutrients to apply In Poland
the total amount of currently consumed fertilizers is almost the same as in the Czech
wwwintechopencom
Soil Fertility Improvement and Integrated Nutrient Management ndash A Global Perspective
178
Republic Unfortunately soils in Poland are much poorer in potassium and also in
phosphorus being therefore highly sensitive to external supply of nutrients This
conclusion is corroborated by positive trends of yields in response to P and K fertilizers
application as found for all crops since 1991 onwards Consequently under favorable
weather conditions or on soils naturally rich in potassium the suggested formulation of N-
P-K fertilizers is as follows 1033066 but in years with high probability of drought or on
areas sensitive to drought a slightly different formulation is recommended namely
100510
It is not easy to formulate any efficient fertilizing strategy for Romania Since mid- 90s maize and wheat have shown yield stagnation at a very low level The main factors responsible for this situation are i) low N fertilization rates ii) imbalanced use of P and K fertilizers Therefore yields of these two crops are in fact dependent only on the seasonal weather course fluctuating for ca 100 on a yearly scale basis The main reason is unbalanced consumption of basic fertilizers which leads to permanent soil mining especially potassium The NP2O5K2O relationships averaged for the period 2004-2008 as 1027009 is not sufficient to get any yield increase or even its stabilization Potassium accumulates in plant tissues in much higher amounts and is considered as useful nutrient in water management (Cakmak 2005) Thereby this nutrient seems to be crucial for crop production in Romania even taking into account that almost 50 of land area is covered by soil naturally rich in minerals containing K In spite of low N consumption but unbalanced nutrient management there is still a space for an extra N loss for both key crops ie wheat and maize (see Fig 7) Therefore it could be concluded that any yield increase depends on both significant N rate rise and simultaneous change of fertilizer formulations The operational N-P-K fertilizers ratios suggested for Romania are as follows 1033017 in favorable and 10404 in unfavorable years The second scenario should aim at increasing plant survival under drought conditions
6 Thoughts and prospects
The new era of agriculture development in the Central Europe revealed how actual
agriculture outcomes in this region depend on three key factors presented in descending
order i) weather conditions during the growth season ii) inherent soil fertility iii) nitrogen
fertilizer consumption At present the first factor is decisive for crop production High year-
to-year yield variability reflects the imbalanced use of soil and external resources such as
fertilizers Therefore maximum attainable yields ie limited by water supply for example
for wheat are not attainable in all countries of the region In Germany also part of the
Central European region actual yields are above the ldquowater limitedrdquo level (Rabbinge amp
Diepen 2000 Supit et al 2010)
Inherent differences in the nature of soil quality between the CE countries as a background
of nutrient management are strictly related to the soil origin (Plant et al 2005) Except for
Poland all other countries are relatively rich in soils originated from loams (Cambisols) and
loess (Chernozems) These soils exhibit a high inherent potential for supplying K and other
cations such as calcium and magnesium (Nikolova 1998)
However at present nutritional requirements of high yielding crops most of the CE countries are almost entirely oriented on the third yield forming factor ie nitrogen
wwwintechopencom
Constraints and Solutions to Maintain Soil Productivity A Case Study from Central Europe
179
fertilizer use It has been well recognized that a balanced supply of external sources of slowly mobile elements such as phosphorus and potassium is broadly expected (Atkinson et al 2005 Struik amp Bonciarelli 1997) Consequently the average actual and attainable yields of main crops in CE countries are much more related to the soil-adjusted potential than to amounts of currently applied fertilizers As a result CE countries show at present much greater differences in agricultural production than at the end of the 80s
The observed unfavorable patterns of N fertilizer long-term consumption creates problems not only for agriculture production but are also potentially dangerous for the environment as a potential source of reactive nitrogen (Roberts 2006) There are three main questions to be urgently answered by specialists in all countries of the CE region i) do farmers really recognize an increasing yield gap ii) what is the reason for farmers and their advisory services to tolerate low efficiency of nitrogen iii) do farmers and advisory services recognize environmental aspects of the increasing amount of residual nitrogen In order to get answers to these questions one has to be familiar with factors contributing to the improvement in N fertilizer use efficiency
1 Farm management of N in terms of i) N rate quantification ii) time of N fertilizers application and iii) method of N fertilizers application
2 Management of nutrients responsible for the efficiency of N uptake and it in-plant transformation
3 Management of production factors other than N
The first problem is not only of technical nature because it affects in-season nitrogen use
efficiency and in turn actual yieldsrsquo variability However CE countries representing the
restoration type of yield development but at the same time unbalanced pattern of
consumed fertilizers do not indicate needs for increasing actually applied N rates This
strategy is to some extent the core of yield improvement in countries presenting stagnated
type of fertilizersrsquo management provided that any increase in N use will be compensated by
adequate amounts of applied phosphorus and potassium
It could finally be concluded that the realization of both goals of agricultural production in
the CE countries ie i) long-term yield stabilization and even its increase and ii) unit
productivity of the applied fertilizer N increase in turn decreasing amounts of the residual
N requires in the coming future changes in the structure of fertilizersrsquo consumption
keeping in the Unbalanced group of countries the same level of applied fertilizers The
problem of nutrients supply to a growing plant does not however refer only to the balanced
amounts of the applied fertilizers but also to the crop accessibility to soil natural nutrient
pools This problem is inherently related to conditions of root system growth in the soil
body There are a lot of factors limiting roots accessibility to water and nutrients even in
soils of high natural fertility which have been forgotten in the last 50 years but the most
important is soil acidy and related toxicity of aluminum (Atkinson et al 2005 Diatta et al
2010 Marschner 1991 Struik and Bonciarelli 1997) The key strategic target for farmers is to
increase soil volume directly occupied by plant roots in order to improve their access to
unavailable pools of nutrients Three main areas of soil productivity improvement via
increasing crop plants accessibility to nutrients in the subsoil at least may be considered i)
regulation of soil reaction ii) increase of organic matter content iii) removing of any kind of
hardpans It seems highly probable that in the case of Poland all three groups of measures
wwwintechopencom
Soil Fertility Improvement and Integrated Nutrient Management ndash A Global Perspective
180
are important In other countries of the CE soil acidity should be considered as an
agronomical problem for farmers conducting production on Luvisols
7 References
Atkinson A Black K amp Dawson L (2005) Prospects advantages and limitations of future crop production systems dependent upon the management processes Annals of Applied Biology Vol 146 pp 203-215 ISSN 1744-7348
Batjes H (2002) Carbon and nitrogen stocks in the soils of Central and Eastern Europe Soil Use Management Vol 18 pp 324-329 ISSN 1475-2743
Cakmak I (2005) The role of potassium in alleviating detrimental effects of abiotic stresses in plants Journal of Plant Nutrition Soil Science Vol 168 pp 521-530 ISSN 1436-8730
Catt J (2001) The agricultural importance of loess Earth-Science Reviews Vol 54 pp 213-229 ISSN 0012-8252
Cochrane N (2004) EU Enlargement Implications for US_EU agricultural relations US-EU Food and Agriculture ComaprisonWRS-04-04 78-86 Available online at
httpwwwersusdagovpublicationsWRS0404WRS0404pdf (Access 20110524)
Csatho P Sisak I amp Radimszky L (2007) Agriculture as a source of phosphorus causing eutrophication in Central and Eastern Europe Soil Use management Vol 23 (suppl 1) pp 36-56 ISSN 1475-2743
Csatho P amp Radimszky L (2009) Two Worlds within EU27 Sharp Contrasts in Organic and Mineral Nitrogen-Phosphorus Use Nitrogen-Phosphorus Balances and Soil Phosphorus Status Widening and Deepening Gap between Western and Central Europe Communications in Soil Science and Plant Analysis Vol 40 pp 999-1019 ISSN 0010-3624
Diatta J Bocianowski J amp Skubiszewska A (2010) Sulphate-based aluminum phytotoxicity mitigation under strong soil acidification Fresenius Environmental Bulletin Vol 19 No 12b pp 3185-3192 ISSN 1018-4619
Dibb D (2000) The mysteries (myths) of nutrient use efficiency Better Crops Vol 84 No 3 pp 3ndash5 ISSN 0006-0089
Dobermann A amp Cassman K (2002) Plant nutrient management for enhanced productivity in intensive grain production systems of the United States and Asia Plant and Soil Vol 247 pp 153-175 ISSN 1573-5036
Evans L amp Fisher R (1999) Yield potential its definition measurement and significance Crop Science Vol 39 pp 1544-1551 ISSN 1896-0782
Falloon P amp Betts R (2010) Climate impacts on European agriculture and water management in the context of adaptation and mitigation ndash the importance of integrated approach Science of Total Environment Vol 408 pp 5667-5687 ISSN 0048-9697
FAOSTAT Available online at httpfaostatfaoorgdefaultaspx (Access 20110524) Fixen P (2004) Phases in narrowing the yield gap Better Crops Vol 88 No 4 p 3 ISSN
0006-0089 Fronzek S amp Carter T (2007) Assessing uncertainties in climate change impacts on
resource potential for Europe based on projections from RCMs and GCMs Climate Change Vol 81 pp 357-371 ISSN 1758-6798
wwwintechopencom
Constraints and Solutions to Maintain Soil Productivity A Case Study from Central Europe
181
Grzebisz W amp Fotyma M (2007) Recommendations and use of potassium fertilizers in Central-Eastern Europe (CEE) In Proceedings International Fertiliser Society No 621 York UK pp 24 ISBN 978-0-85310-258-8
Grzebisz W Diatta J amp Haerdter R (2010) Fertilizer consumption patterns in Central European countries ndash effect on actual yield development trends in 1986-2005 years - a comparative study of the Czech Republic and Poland Journal of Central European Agriculture Vol 11 No 1 pp 73-82 ISSN 1332-9049
IFADATA Statistics online (2011) wwwfertilizerorgifastatisticsifadata datalineasp (Access 20110524)
Jongman R Bunce R amp Metzger R (2006) Objectives and applications of a statistical environmental stratification of Europe Landscape Ecology 21 409-419 ISSN 1572-9761
Karlen D Ditzler C amp Andrews S (2003) Soil quality why and how Geoderma Vol 114 pp 145-156 ISSN 0016-7061
Kelch D amp Osborne S (2001) Crop production capacity in EuropePrime Economic Research ServiceUSDA Agricultural outlookMarch 2001 19-23 ISSN 0099-1066
Marschner H (1991) Mechanisms of adaptation of plants to acid soils Plant and Soil 134 1-20 ISSN 1573-5036
Neumann K Verburg P amp Stehfest E (2010) The yield gap of global production a spatial analysis Agricultural Systems Vol 103 pp 316-326 ISSN 0308-521X
Nikolova M (1998) The soil potassium resources and the efficiency of potassium fertilizers in Bulgaria Nikola Poushkarow Inst of Soil Science and Agroecology Sofia Bulgaria IPI Country Report 12 39 pp
Olesen J amp Bindi M (2002) Consequences of climate change for European agricultural productivity land use and policy European Journal of Agronomy Vol 16 pp 239-262 ISSN 1161-0301
Olesen J Trnka M amp Kersebaum K (2011) Impacts and adaptation of European crop production systems to climate change European Journal of Agronomy Vol 34 pp 96-112 ISSN 1161-0301
Plant J Whittaker A amp Demitriades B (2005) The geological and tectonic framework of Europe Geochemical Atlas of Europe Part 1 Background Information Methodology Ed Salminen R Maps GTK FOREGS 20 pp ISBN 951-690-956-6
Rabbinge R (1993) The ecological background of food production In Crop protection and sustainable agriculture Wiley Chichester (Ciba Foundation Symposium 177 2-29 ISBN 10 0471939447
Rabbinge R amp Diepen C (2000) Changes in agriculture and land use in Europe European Journal of Agronomy Vol 13 pp 85-100 ISSN 1161-0301
Reilly J Fuglie K (1998) Future yield growth in field crops what evidence exists Soil amp Tillage Research Vol 47 pp 275-290 ISSN 0168-1987
Roberts T (2006) Improving Nutrient Use Efficiency Proceedings of the IFA Agriculture Conference Optimizing Resource Use Efficiency for Sustainable Intensification of Agriculture 27 february-2 March 2006 Kunming China pp 8
Rosegrant M Paisner M amp Meijer S (2001) Global Food Projections to 2020 Emerging trends and alternative futures IFPRI pp 206 ISBN 0-89629-640-7
wwwintechopencom
Soil Fertility Improvement and Integrated Nutrient Management ndash A Global Perspective
182
Sinclair T Purcell L amp Sneller C (2004) Crop transformation and the challenge to increase yield potential Trends in Plant Science Vol 9 No 2 pp 70-75 ISSN 136085
Struik P amp Bonciarelli F (1997) Resource use at the cropping system level European Journal of Agronomy Vol 7 pp 133-143 ISSN 1161-0301
Supit I van Diepen C amp de Wit A (2010) Recent changes in the climatic yield potential of various crops in Europe Agricultural Systems Vol 103 pp 683-694 ISSN 0308-521X
wwwintechopencom
Soil Fertility Improvement and Integrated Nutrient Management - AGlobal PerspectiveEdited by Dr Joann Whalen
ISBN 978-953-307-945-5Hard cover 306 pagesPublisher InTechPublished online 24 February 2012Published in print edition February 2012
InTech EuropeUniversity Campus STeP Ri Slavka Krautzeka 83A 51000 Rijeka Croatia Phone +385 (51) 770 447 Fax +385 (51) 686 166wwwintechopencom
InTech ChinaUnit 405 Office Block Hotel Equatorial Shanghai No65 Yan An Road (West) Shanghai 200040 China
Phone +86-21-62489820 Fax +86-21-62489821
Soil Fertility Improvement and Integrated Nutrient Management A Global Perspective presents 15 invitedchapters written by leading soil fertility experts The book is organized around three themes The first theme isSoil Mapping and Soil Fertility Testing describing spatial heterogeneity in soil nutrients within natural andmanaged ecosystems as well as up-to-date soil testing methods and information on how soil fertility indicatorsrespond to agricultural practices The second theme Organic and Inorganic Amendments for Soil FertilityImprovement describes fertilizing materials that provide important amounts of essential nutrients forplantsThe third theme Integrated Nutrient Management Planning Case Studies From Central Europe SouthAmerica and Africa highlights the principles of integrated nutrient management Additionally it gives casestudies explaining how this approach has been implemented successfully across large geographic regionsand at local scales to improve the productivity of staple crops and forages
How to referenceIn order to correctly reference this scholarly work feel free to copy and paste the following
Witold Grzebisz and Jean Diatta (2012) Constraints and Solutions to Maintain Soil Productivity A Case Studyfrom Central Europe Soil Fertility Improvement and Integrated Nutrient Management - A Global PerspectiveDr Joann Whalen (Ed) ISBN 978-953-307-945-5 InTech Available fromhttpwwwintechopencombookssoil-fertility-improvement-and-integrated-nutrient-management-a-global-perspectiveconstraints-and-solutions-to-maintain-soil-productivity-a-case-study-from-central-europe
copy 2012 The Author(s) Licensee IntechOpen This is an open access articledistributed under the terms of the Creative Commons Attribution 30License which permits unrestricted use distribution and reproduction inany medium provided the original work is properly cited
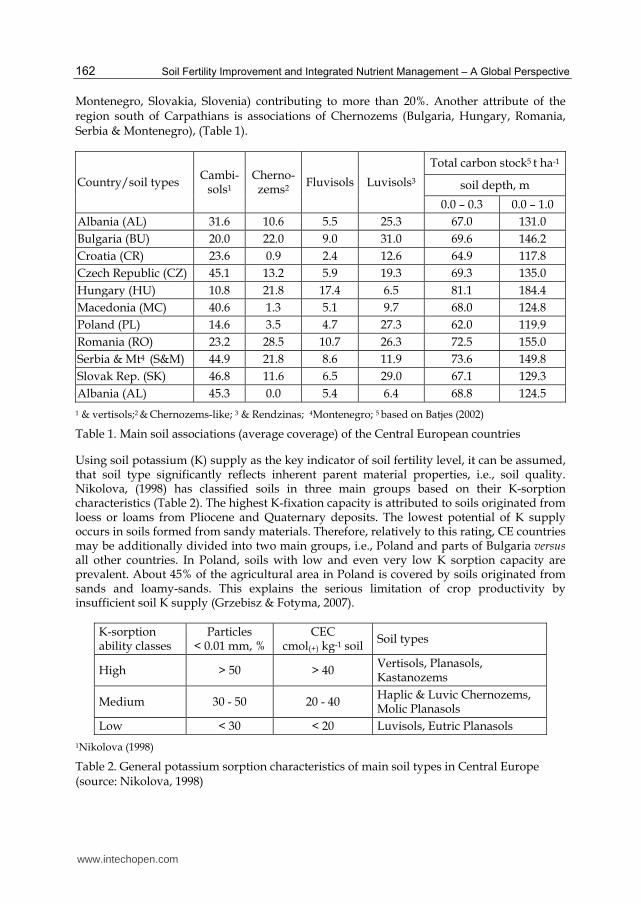
Soil Fertility Improvement and Integrated Nutrient Management ndash A Global Perspective
162
Montenegro Slovakia Slovenia) contributing to more than 20 Another attribute of the region south of Carpathians is associations of Chernozems (Bulgaria Hungary Romania Serbia amp Montenegro) (Table 1)
Countrysoil types Cambi-
sols1
Cherno-zems2
Fluvisols Luvisols3
Total carbon stock5 t ha-1
soil depth m
00 ndash 03 00 ndash 10
Albania (AL) 316 106 55 253 670 1310
Bulgaria (BU) 200 220 90 310 696 1462
Croatia (CR) 236 09 24 126 649 1178
Czech Republic (CZ) 451 132 59 193 693 1350
Hungary (HU) 108 218 174 65 811 1844
Macedonia (MC) 406 13 51 97 680 1248
Poland (PL) 146 35 47 273 620 1199
Romania (RO) 232 285 107 263 725 1550
Serbia amp Mt4 (SampM) 449 218 86 119 736 1498
Slovak Rep (SK) 468 116 65 290 671 1293
Albania (AL) 453 00 54 64 688 1245
1 amp vertisols2 amp Chernozems-like 3 amp Rendzinas 4Montenegro 5 based on Batjes (2002)
Table 1 Main soil associations (average coverage) of the Central European countries
Using soil potassium (K) supply as the key indicator of soil fertility level it can be assumed that soil type significantly reflects inherent parent material properties ie soil quality Nikolova (1998) has classified soils in three main groups based on their K-sorption characteristics (Table 2) The highest K-fixation capacity is attributed to soils originated from loess or loams from Pliocene and Quaternary deposits The lowest potential of K supply occurs in soils formed from sandy materials Therefore relatively to this rating CE countries may be additionally divided into two main groups ie Poland and parts of Bulgaria versus all other countries In Poland soils with low and even very low K sorption capacity are prevalent About 45 of the agricultural area in Poland is covered by soils originated from sands and loamy-sands This explains the serious limitation of crop productivity by insufficient soil K supply (Grzebisz amp Fotyma 2007)
K-sorption ability classes
Particleslt 001 mm
CECcmol(+) kg-1 soil
Soil types
High gt 50 gt 40 Vertisols PlanasolsKastanozems
Medium 30 - 50 20 - 40 Haplic amp Luvic Chernozems Molic Planasols
Low lt 30 lt 20 Luvisols Eutric Planasols
1Nikolova (1998)
Table 2 General potassium sorption characteristics of main soil types in Central Europe (source Nikolova 1998)
wwwintechopencom
Constraints and Solutions to Maintain Soil Productivity A Case Study from Central Europe
163
3 Agriculturally induced constraints - Fertilizer management
The recorded yield increase of most crops in the last 60 years is a result of two main factors The first is the progress in plant breeding which took place in the 60s and 70s during the Green Revolution (Sinclair et al 2004) However fulfilling nutritional requirements of modern high yielding varieties requires a well balanced supply of nutrients The second factor contributing to modern yield increases is fertilizer use In intensive agriculture it is related to the consumption of fertilizers such as N P and K Therefore a reliable estimation of agriculturally induced constraints for crop production in CE requires an insight into past and current nutrient management strategies
31 Long-term patterns of fertilizersrsquo consumption
Data on historical fertilizer consumption in the period 1986-2008 were obtained from the IFA databank (2011) Fertilizer use per hectare was calculated by dividing the total use of N P and K fertilizers in a given year per actual area of arable land as the target area of application The quantities of fertilizers annually used by farmers over the studied period were both nutrient and country specific (Table 3) During the period 1986-2008 total consumption of N-P-K fertilizers in CE countries has undergone significant changes with respect to
a the quantity of fertilizers annually applied per hectare b the structure of applied fertilizers as related to PN and KN ratios
Statistical parameters
Countries1
AL BampH BU CR CZ HU MC PL RO SampM SV SL
Nitrogen
Average 450 311 633 1007 931 724 467 710 399 458 703 2000
SD2 441 231 372 389 223 251 136 182 201 164 313 1299
CV3 979 742 588 386 239 346 290 257 505 357 445 649
RIN 866 753 680 533 414 526 458 377 629 510 609 800
Phosphorus
Average 149 144 152 440 322 213 228 305 165 144 304 698
SD2 147 121 232 154 323 214 810 163 131 121 333 337
CV3 987 845 1528 350 1005 1004 355 534 796 846 1094 483
RIP 914 812 976 425 839 854 531 657 800 838 866 641
Potassium
Average 24 139 71 481 303 260 175 366 64 157 291 851
SD2 21 113 106 209 343 269 93 183 85 100 348 461
CV3 874 814 1493 433 1133 1036 534 499 1324 641 1197 542
RIK 965 800 970 537 892 863 684 619 931 706 888 718
1 IFA data bank accessed 2011-05-24 2standard deviation 3coefficient of variation
Table 3 Consumption of N P and K fertilizers (in kg ha-1) in Central European countries during the period 1986-2008 and the reduction index (RI) for each nutrient ndash a statistical overview 1Country acronyms are provided in Table 1
wwwintechopencom
Soil Fertility Improvement and Integrated Nutrient Management ndash A Global Perspective
164
The long-term course of fertilizersrsquo consumption showed some resemblances Therefore the
whole investigated period has been divided into three well defined phases (1) High
Consumption Level (HCL) (2) Collapse and Transition (CT) (3) Post Transition (PT) (Fig 1)
Two distinct procedures have been applied to make a reliable estimate of the length of each
phase The HCL was separated from the CT when there was more than 25 change in the
baseline ndash yearly values The PT was established using a linear regression model assuming
statistically proven change
The key attribute of the first phase lasting from four to five years was characterized by high
levels of consumed fertilizers mainly N irrespective of the country (Fig 1) The
consumption of other nutrients ie P and K was country specific The CT phase was
characterized by a dramatic sudden decrease in use of each fertilizer This process occurred
for one or two years in some countries (Czech Republic Croatia Hungary Poland Slovakia
Slovenia) but in others up to 10 years showing prolonged depression The reason of this
drastic decline was well described in economy the scissor phenomena (Cochrane 2004) The PT
phase has been appearing in three distinct forms i) increase (PT-I above the baseline HCL
level) ii) restoration (PT-R significant trend but below the baseline HCL level) iii)
stagnation (PT-S no significant changes over time)
0
20
40
60
80
100
120
140
160
180
1985 1990 1995 2000 2005 2010
Consecutive years (CY)
Nit
rog
en c
onsu
mp
tion
(N
c)
kg
N h
a-1
CR
CZ
RO
Country
HCL CT PT
CR-Nc = 641CY + 12711 R2 = 075 P lt 0001
CZ-Nc = 242CY + 4763 R2 = 074 P lt 0001
Fig 1 Patterns of N fertilizersrsquo consumption in selected Central European countries - Croatia (CR) Czech Republic (CZ) and Romania (RO) during the 1986-2008 period (based on IFA database accessed 2011-05-24) Significant (Plt005) trends are indicated with solid lines and linear regression equations given The CT periods are marked with dashed lines
Nitrogen considered as the key nutrient in crop production but at the same time potentially unfriendly to the environment requires much deeper attention Its consumption in the HCL period was high varying around 100 kg N ha-1 for most countries in the region (Table 3) The lowest consumption (defined by 025 percentile) took place during the CT phase The degree of collapse can be simply assessed by using a fertilizer use reduction index (RI)
wwwintechopencom
Constraints and Solutions to Maintain Soil Productivity A Case Study from Central Europe
165
RI = [1- (025P09P) 100]
where 025P and 09P are the 25th and 90th percentiles of fertilizer consumption over the period 1986-2008
Fertilizer N management in CE during the PT phase relies on consumption trends evaluated for a period of 18 years ie since 1991 onwards On the basis of elaborated regression models countries of the region have been divided into three defined groups
1 Increase (PT-I) Croatia Slovenia 2 Restoration (PT-R) Czech Republic Hungary Poland Slovakia Slovenia 3 Stagnation(PT-S) Albania Bosnia amp Herzegovina Macedonia Bulgaria Romania
Serbia amp Montenegro
Phosphorus is a nutrient of basic importance for any crop plant because all seed crops are highly sensitive to its deficiency during the onset of ripening In the HCL phase the consumption of P fertilizers was in the range of ca 35 to 95 kg P2O5 ha-1 (Table 3) During the period of study its use underwent a great mostly negative change Its consumption trends evaluated for years 1991-2008 showed much greater variability compared to N fertilizersrsquo use in CE countries
1 Increase Croatia Slovenia 2 Restoration Poland Hungary Macedonia 3 Stagnation Albania Czech Slovakia Serbia amp Montenegro 4 Recession Bosnia amp Herzegovina Bulgaria Romania
The occurrence of the fourth group stresses the fact that P fertilizersrsquo consumption was below the levels required to support current crop production leading to nutrient mining in three countries of the region
Potassium is generally considered as a nutrient significantly affecting water management in plants during their life cycle (Cakmak 2005) Therefore this nutrient requires special care on farm in regions like CE that experience frequent drought during the vegetative growth period (Falloon amp Betts 2010) Potassium fertilizersrsquo consumption during the HCL period varied among countries of the region from ca 5 kg K2O ha-1 (Albania) to more than 100 kg K2O ha-1 (former Czechoslovakia) (Table 3) As in the case of P the greatest decline in K consumption occurred in countries significantly increasing the use of nitrogen like the Czech and Slovak Republics and also Hungary (estimated from the potassium fertilizer use reduction index RIK)
The second indicator of fertilizer management is in the proportions of macronutrients consumed indicated during the study by the PN and KN ratios The PN ratio did not show a clear trend for two countries Albania and Bosnia amp Herzegovina In other countries negative tendencies were detected appearing as the increasing value of PN ratio meaning that proportionately more N fertilizer than P fertilizer was applied by farmers This process took place mainly during CT and PT phases Its course during the PT phase outlines three decisive patterns of P fertilizersrsquo management
a negative Czech Republic Croatia Serbia amp Montenegro Romania b positive Hungary Macedonia Poland c stagnation Slovakia
wwwintechopencom
Soil Fertility Improvement and Integrated Nutrient Management ndash A Global Perspective
166
The first trend covers the whole study period differing only in the annual rate of decrease
as indicated by the coefficient of the linear regression equation In the case of Romania it
was almost four times faster than for Croatia (Fig 2) The second pattern occurred in
countries like Hungary and Poland showing a slightly positive trend since 1991
Trends of KN ratios show similar patterns as described for PN ratios (Fig 3) Three
patterns of ratios can be also distinguished but comprising different sets of countries
a negative Macedonia Slovenia
b positive Hungary
c stagnation Croatia Czech Poland Slovakia Bulgaria and Romania (since 1993) Serbia
amp Montenegro (since 2000)
All above-described attributes of long-term fertilizersrsquo consumption were evaluated in Table 4
to develop a ranking based on three types of nutrient management in CE countries as
follows
1 Extensive generally showing low consumption of all fertilizers including N the most
negative attribute is the low P and K inputs leading to crop plants reliance on inherent
soil P and K supply and potentially leading to nutrient mining (Albania Bulgaria
Macedonia Serbia amp Montenegro Romania)
2 Unbalanced high consumption of fertilizer N but at the same time not balanced by
adequate use of other nutrients such as P and K at least (Croatia Czech Slovakia
Slovenia)
3 Balanced high consumption of N fertilizer which is in part balanced by relatively high
consumption of P and K fertilizers (Hungary Poland)
0
01
02
03
04
05
06
07
08
1985 1990 1995 2000 2005 2010
Consecutive years CY
PN
rel
atio
nsh
ip
P
N
CR
PL
RO
Country
PN1-PL = -0053CY + 1076 R2 = 081 P lt 0001
PN2-PL = 0006CY ndash 105 R2 = 038 P lt 001
PN-CR = -0005CY + 105 R2 = 032 P lt 0001
PN-RO = -0019CY + 374 R2 = 081 P lt 0001
Fig 2 Typical patterns of PN ratios in selected Central European countries - Croatia (CR) Poland (PL) and Romania (RO) during the period 1986-2008 Significant (Plt005) negative linear equations are shown for CR and RO while the PL data fitted to a negative linear equation in the period 1986-1996 and thereafter showed a positive linear relationship
wwwintechopencom
Constraints and Solutions to Maintain Soil Productivity A Case Study from Central Europe
167
0
01
02
03
04
05
06
07
08
09
1985 1990 1995 2000 2005 2010
Consecutive years CY
KN
rel
atio
nsh
ip
K
N
CR
PL
RO
Country KN1-PL = -0066CY + 1323 R2 = 070 P lt 001
KN1-RO = -0044CY + 873 R2 = 083 P lt 0001
Fig 3 Typical patterns of KN ratios in selected Central European countries - Croatia (CR) Poland (PL) and Romania (RO) in the period 1986-2008 Significant (Plt005) negative linear equations are shown for CR and RO in the 1986-1992 period thereafter showed non-significant trends For CR the KN trend was non-significant for the whole period
Estimated Parameters
Country3
AL BampH BU CR CZ HU MC PL RO SampM SK SL
Nitrogen 01 0 0 ++ + + 0 + 0 0 + +-
Phosphorus 0 - - ++ 0 + + + - 0 0 +-
Potassium 0 0 0 ++ 0 + 0 + 0 0 0 0
PN 0 0 0 - - + 0 ++ - 0 0 -
KN 0 0 0 0 0 + - 0 0 0 0 -
Ranking2 0 0 0 2 2 1 0 1 0 0 2 2
1evaluation of trends ++ - increase +- restoration 0 - stagnation - - decrease +- - time variable 2 fertilizer management ranking 0 ndash extensive 1 ndash balanced 2 ndash unbalanced 3 Country acronyms are provided in Table 1
Table 4 Fertilizer consumption trends ndashsummary and country management ranking for countries in Central Europe during the period 1986 to 2008
32 Soil fertility status
Soil is considered as a slowly renewable or non-renewable resource that requires the same
level of protection as other limited resources like phosphorus rock There is strong
agreement that productivity of arable land depends on both a soilrsquos fertility potential (soil
quality inherent soil fertility) and present state of soil properties (soil health) to sustain
wwwintechopencom
Soil Fertility Improvement and Integrated Nutrient Management ndash A Global Perspective
168
primary production and other ecological functions The minimum data set to describe
current fertility status of arable land ie soil health should contain indicators reflecting
both past and actual organic matter content soil pH and management of nutrient soil
resources (Atkinson et al 2005 Karlen et al 2003)
Total organic carbon (TOC) stock in the topsoil (00-03 m) or its content () in arable soils is
a good descriptor of short-term trends in soil organic matter (SOM) management However
the organic carbon stock measured to a depth of 1 m in the soil profile can be considered as
an indicator of soil fertility potential The actual content of TOC in an averaged arable soil
unit was calculated by weighted mean content of organic carbon for main soil types (Batjes
2002) and its percentage share in the soil cover for each CE country (see Table 1) Analysis of
this data showed that TOC in the average topsoil unit of CE countries is insufficient ranging
from ca 60 (Poland) to 80 (Hungary) t TOC ha-1 ie about 14 to 18 TOC Differences
between CE countries can be evaluated by TOC stock in the soil profile to a depth of 1 m
Based on this criterion countries can be classified into three groups
a low ( le 120 t TOC ha-1) Croatia Poland b medium (121-160 t TOC ha-1 ) Albania Bulgaria Czech Republic Macedonia
Romania Serbia amp Montenegro Slovakia Slovenia c high (gt 161 t TOC ha-1) Hungary
Phosphorus and Potassium are key nutrients for achieving high productivity of arable soils
Available resources of both nutrients are the most important indicators of soil health ie its
current productivity The country status of current soil nutrient management was evaluated
by means of soil fertility index (SFI) expressed as the sum of the percentage share of arable
land characterised by the very high high and half of medium rating of available P or K
(Grzebisz amp Fotyma 2007) It has been assumed that SFI for P and K exceeding 70 of
arable land share is a prerequisite for high yield of any crop In the 1980s this target was
achieved in many countries of the region like Czechoslovakia Hungary and some countries
of the former Yugoslavia (Serbia amp Montenegro Slovenia) (Fig 4) In these countries the
rates of applied fertilizers were far in excess of crop removal capacity Poland in spite of
currently high K consumption differs from other CE countries The sufficiency level for P
and K of 70 was never reached due to much lower inherent soil potential for nutrient
supply At the beginning of 2000 significant changes of P and K fertility were recorded The
increase of the P sufficiency level was recorded only in Slovenia and Poland In Slovenia the
reason was high consumption of P fertilizers at the beginning of the 21st century In Poland
the increase is related to sufficiently well balanced use of N and P fertilizers and slightly
lower yields than in the 80s In all other CE countries the percentage of P-fertile soils
generally decreased nevertheless the rate of the decrease differed across the region A
slight decrease occurred in Czech and Slovak Republics as well as in Hungary The greatest
drop was recorded in Bulgaria followed by Serbia and Montenegro The potassium SFI
presents much more alarming trend As reported by Grzebisz amp Fotyma (2007) for countries
of the Northern Agricultural Zone (Czech Hungary Poland Slovakia) the K sufficiency
level decreased below the target value within two decades Based on K fertilizersrsquo
consumption trends it can be assumed that the same trend occurs also in the Southern
Zone
wwwintechopencom
Constraints and Solutions to Maintain Soil Productivity A Case Study from Central Europe
169
0
10
20
30
40
50
60
70
80
90
100
AL BU CZ H PL RO SE SK SL
Countries
P s
oil
fert
ility
in
de
x
A
L
1980s
2000s
Sufficiency level
Fig 4 Phosphorus soil fertility indices (expressed as the percentage of arable land AL) for selected CE countries during the period 1986 - 2008 (based on Csatho et al 2007) The sufficiency level was assumed to be 70 as described by Grzebisz amp Fotyma (2007) Country acronyms are given in Table 1
4 Soil productivity assessment
41 Long-term trends in crop yields
All CE countries grow the same crops and cereal species predominate The area sown with cereals occupies 64 of arable land in Croatia 52 - in the Czech Republic 68 - in Poland and 59 ndash in Romania In the Czech Republic cerealsrsquo production is dominated by wheat and barley but in Poland by wheat and rye In Romania and Croatia maize is the key grain crop Sugar beets due to EU regulation in the last 10 years are of minor importance but this crop is a good indicator of soil quality Therefore it has been assumed that these crops would reflect fairly well changes in current soil fertility status as a consequence of applied nutrient management strategies This assumption is well documented by observed variability of yields of wheat maize and sugar beets in selected countries of CE (Table 5) The highest variability was found for Romania and the lowest for Poland Romania is a country with an extensive pattern of fertilizersrsquo management typical in the Southern Agricultural Zone of Europe Poland belongs to countries of the Northern Zone but presents a balanced patterns of fertilizersrsquo management (Poland Hungary) Other selected countries are members of the Unbalanced fertilizing group of CE countries
The long-term yield trend can be used as an indicator of key crops sensitivity to past and current fertilizersrsquo management As in the case of fertilizersrsquo consumption trends three consecutive phases of yield development over the period 1986-2008 may be distinguished
1 Actual-Standard (AS) 2 Recession (RC) 3 Restoration (RS) or Stagnation (SG)
The observed trends of harvested yields were most pronounced for wheat other cereals and for seed crops like oil-seed rape (Grzebisz et al 2010) In the first phase of the study taking
wwwintechopencom
Soil Fertility Improvement and Integrated Nutrient Management ndash A Global Perspective
170
place at the end of the 80s yields of wheat reached on average the highest recorded levels Therefore this particular period is considered as a standard level (AS) for evaluating subsequent phases (Fig 5) The highest yield decline ie the recession phase (RC) in response to the collapse in fertilizer consumption took place in the Northern Zone but
Crops Croatia Czech Republic Poland Romania
x plusmn SD5 CV6 x plusmn SD CV x plusmn SD CV x plusmn SD CV
Wheat 40plusmn052
39plusmn033
44plusmn094
125
86
216
48plusmn05
51plusmn04
52plusmn06
102
78
113
36plusmn03
37plusmn02
39plusmn04
90
56
100
27plusmn06
31plusmn04
29plusmn08
212
141
265
Maize 49plusmn10
40plusmn09
55plusmn13
205
217
229
58plusmn13
51plusmn05
69plusmn05
214
93
76
52plusmn08
49plusmn02
56plusmn08
143
41
157
31plusmn08
29plusmn05
34plusmn11
244
180
315
Sugar
beet
404plusmn77
398plusmn49
487plusmn52
192
123
108
424plusmn76
345plusmn15
531plusmn49
180
42
49
381plusmn55
346plusmn19
451plusmn39
145
56
88
228plusmn51
213plusmn29
304plusmn33
222
136
108
1FAOSTAT available online 2011-05-24 21986-2008 31986-1990 42004-2008 5standard deviation 6coefficient of variation
Table 5 Statistical overview of key cropsrsquo yields (t ha-1) in selected Central European
countries during the period 1986-2008 in comparison to the AS phase and the 2004-2008
periods
0
1
2
3
4
5
6
7
1985 1990 1995 2000 2005 2010
Consecutive years CY
Gra
in y
ield
(Y
) t
ha-1
CZ
RO
Country
AS RC RE or ST
Y-CZ = 0056CY + 1089 R2 = 028 P lt 005
TYG
TYG
Legend level of harvested yield AS Actual-Standard RC Recession RE Restoration ST Stagnation
Dashed line refers to AS level of yield ie an average yield harvested in the period 1986-1990 TYG
Temporary Yield Gap
Fig 5 Long-term trends of wheat production in the Czech Republic (CZ) and Romania (RO)
during the period 1986-2008 Significant (Plt005) positive linear trend is shown for the
Czech Republic whereas non-significant for Romania in the period 1992-2008
wwwintechopencom
Constraints and Solutions to Maintain Soil Productivity A Case Study from Central Europe
171
lasted for only two or three years In other countries mainly representing the Southern Zone it was also fast or showed sustained depression The third phase of yield development was manifested in two distinct trends The first ldquorestorationrdquo trend has shown a positive yield gain since yield recession It was revealed in the Northern Zone countries and also for Croatia and Slovenia The second trend has not shown any significant change in yield since the recession resulting in yield stagnation The most interesting attribute of this trend is its high year-to-year variability The difference between the actually harvested and the AS yield has been termed as the temporary yield gap (TYG) (Fig 5) The time required to recover to the AS level was long but country specific In the Northern Zone it lasted for ca 10-12 years exceeding the AS level in 2004 or 2005 In most other countries representing the Southern Zone it has not been reached up to 2008 For maize and sugar beets the recession was also observed In the recovery period maize yields were generally positive but the rate of the yield increase was much higher in the Balanced and Unbalanced groups than in the Extensive group Sugar beets yield increase was very high at the beginning of the 90s exceeding the level reported in the 80s The main reason was a reduction in area sown with sugar beets which forced farmers to cultivate this crop on more fertile soils
42 The concept of partial factor fertilizer nitrogen productivity (PFPN)
This part of the study relies on two main conceptual pillars The first one assumes that each hectare of arable soil regardless of the current crop is supplied with the same amount of nutrients including nitrogen The second assumption takes into account the fact that the unit productivity of in-season applied fertilizer N known as PFPN is a reliable scientific tool to make simple but quick discrimination of factors limiting attainable crop yield (Dobermann amp Casman 2002) Therefore the PFPN index was used to evaluate some but selected CE countries that represent the three patterns of current fertilizer management (Table 4) Croatia and the Czech Republic have been selected as examples for the Unbalanced group whereas Poland is the Balanced group and Romania represents the Extensive group of fertilizersrsquo use
The PFPN index was obtained by dividing the actual yield of a respective crop harvested within a given year by the annual amount of N fertilizers consumed by the country assuming it was applied at an equal rate for all currently cultivated crops Operationally the PFPN index consists of two components
a yield of crop (Y) expressed in kg or t ha-1 b nitrogen fertilizer rate (FN) expressed as kg N ha-1
PFPN = YFN
Based on the long-term trends of PFPN indices for each of the key crops two different types of PFPN indices can be distinguished
1 The real partial factor productivity of applied N ndash (rPFPN) it reflects actual yields as limited by both water and N availability
2 The maximal partial factor productivity of applied N (mPFPN) it was calculated as the 4th quartile of rPFPN indices it refers to yields obtained under ample water supply
To make a reliable estimate of the yield gap for some crops cultivated in the CE the corrected partial factor productivity of applied N (cPFPN) instead of mPFPN has been applied
wwwintechopencom
Soil Fertility Improvement and Integrated Nutrient Management ndash A Global Perspective
172
Operationally it has been calculated as the average of the 4th quartile but excluding extremely elevated rPFPN values which emerged in most of investigated countries at the beginning of the 90s Indices of N productivity (PFPN rPFPN and cPFPN) were then used to calculate the yield gap
The calculated rPFPN indices showed as expected high year-to-year variability for all tested crops (Table 6) They were crop and country specific when averaged over the 1986-2008 period
a wheat CR lt CZ = PL lt RO b maize CR lt CZ lt PL lt RO c sugar beets CR = CZ lt PL lt RO
These ranges are not in line with long-term average yields of all crops which followed generally the order CZ gt CR gt PL gt RO
Maximum productivity of tested crops as evaluated for the 4th quartile of rPFPN indices was
much higher rising on average by 43 However the increase was country specific and
represents 63 for Croatia 28 for the Czech Republic 30 for Poland and 48 for
Romania The concept of mPFPN assumes an increase of rPFPN indices pursuant to higher
efficiency of applied fertilizer nitrogen due to ample water supply Its reliability has been
corroborated by low coefficients of variation implicitly indicating the potential productivity
of applied fertilizer nitrogen on the background of soil quality The sequences of countries
for each crop are as follows
a wheat CZ = PL lt CR lt RO b maize CR = CZ lt PL lt RO c sugar beets CZ lt PL lt CR lt RO
As presented in Table 6 coefficients of variations of cPFPN indices were significantly lower in comparison to mPFPN stressing on the reliability of the conducted analysis
Relationships between sets of developed rPFPN and applied fertilizer nitrogen rates can also be a useful tool for making long-term assessment of nitrogen efficiency This relationship fits the best the power function
rPFPN = 9112N-067 for R2 = 077 and n = 92
where N ndash annual rate of fertilizer nitrogen consumption kg N ha-1
Analysis of the general curve shape reveals decreasing yield per unit of N fertilizer applied with highest values of rPFPN It has been observed that irrespective of the applied N rate long-term productivity of fertilizer nitrogen increased in the order Romania lt Poland lt Croatia lt the Czech Republic However the obtained high rPFPN values are as a rule related to lower yields of harvested crops This pattern of crop response refers mostly to Bulgaria Romania and former Yugoslavia countries excluding Croatia and Slovenia As pointed out by Fixen (2004) the target of efficient N fertilizer management based on high fertilizer N use efficiency is counter-productive In this N supply system plants are forced to take up an appreciable amount of N from its soil resources which decreases their rate of growth in critical stages of yield performance Therefore ldquothe elevatedrdquo level of the PFPN could be used as an attribute of the extensive type of agriculture production
wwwintechopencom
Constraints and Solutions to Maintain Soil Productivity A Case Study from Central Europe
173
PFPN
index
Croatia Czech Republic Poland Romania
x plusmn SD1 CV2 x plusmn SD CV x plusmn SD CV x plusmn SD CV
Wheat kg yield kg N-1
rPFPN 48plusmn24 498 54plusmn13 235 54plusmn15 275 81plusmn33 405
mPFPN 80plusmn23 288 70plusmn11 160 72plusmn15 212 121plusmn14 119
cPFPN 63plusmn11 174 62plusmn4 59 62plusmn2 30 112plusmn8 69
Maize kg yield kg N-1
rPFPN 56plusmn26 464 66plusmn18 281 78plusmn21 263 95plusmn45 478
mPFPN 89plusmn29 288 89plusmn7 76 103plusmn11 102 149plusmn20 135
cPFPN 69plusmn10 151 89plusmn7 76 96plusmn2 24 137plusmn9 66
Sugar beets kg yield kg N-1
rPFPN 471plusmn224 477 478plusmn120 250 566plusmn136 240 695plusmn266 383
mPFPN 766plusmn218 285 588plusmn49 825 728plusmn67 93 977plusmn122 125
cPFPN 613plusmn86 141 588plusmn49 825 675plusmn35 52 905plusmn36 40
1standard deviation 2coefficient of variation
Table 6 Partial factor fertilizer N productivity statistics for key crops in selected Central European countries with unbalanced (Croatia Czech Republic) balanced (Poland) and extensive (Romania) fertilizersrsquo management during the period 1986-2008
43 Yield gap (YG) and its attributes
Actual yields of crops harvested by farmers in all areas of the world are much lower than
the yield potential of currently cultivated varieties under defined soil and climatic
conditions This ldquovirtualrdquo un-harvested portion of yield is generally termed the yield gap
(YG) (Evans amp Fisher 1999 Dobermann amp Cassman 2002) However the CE countries
experience another phenomenon known as the temporary yield gap (TYG) (Grzebisz et al
2010) The main reason of its emergence is the collapse in fertilizer use leading to elevation
of the rPFPN index Dibb (2000) relates extremely high N efficiency to low yield and this
trend was fully corroborated by the crop yield data from countries with extensive fertilizer
management Nevertheless the countries of the Northern Agricultural Zone (Czech
Republic Hungary Poland Slovakia) in spite of drastic decrease of consumed fertilizers in
the early 90s were characterized by high yields of wheat and other cereal crops (FAOSTAT
2011 Grzebisz et al 2010) The observed rPFPN indices extremely elevated at the beginning
of the 90s were a result of the residual effect of applied fertilizer N This phenomenon could
be manifested only under growth conditions created by ample water and sufficiently high
supply of immobile nutrients such as P and K in turn balancing N use by currently growing
crops
In the first step of yield gap calculation the cPFPN index was applied to assess the maximal
attainable yield (YAM) The yield gap was then calculated as a difference between really
harvestable yield (YA) and YAM
wwwintechopencom
Soil Fertility Improvement and Integrated Nutrient Management ndash A Global Perspective
174
YAM = cPFPN middot DN
YG = YA ndash YAM
where
DN is the rate of annually applied fertilizer N (kg N ha-1) YA is the actual yield in t ha-1 for a
given year and YAM is the maximal attainable yield (t ha-1)
The observed similarities of the general yield gap pattern over time for key crops allow to
distinguish three consecutive phases of its development in the period 1986-2008 (Fig 6)
1 First ndash primary deep yield gap to the left of the transition point (TP) 2 Second ndash point of extra yield gain TP 3 Third- secondary yield gap to the right of the TP alternatively yield gap stagnation as
indicated by the lack of significant (P lt 005) linear trend response
-7
-6
-5
-4
-3
-2
-1
0
1
2
1985 1990 1995 2000 2005 2010
Consecutive years CY
Yie
ld g
ap
(Y
G)
t h
a-1
CZ
RO
TP
YGd-CZ = 079CY - 1573 R2 = 070 P lt 001
YGd-RO = 068CY - 1354 R2 = 072 P lt 0001
YGr-CZ = -012CY + 2354 R2 = 046 P lt 0001
Country
Legend TP - Transition Point YGd - yield gap decline YGr - yield gap restoration
Fig 6 Evolution of the yield gap in wheat in the Czech Republic (CZ) and Romania (RO) during the period 1986 -2008 Significant (Plt005) positive linear equations are shown for the Czech Republic in the period 1986-92 and for Romania in the period 1986-1995 thereafter showed a negative linear relationship for the Czech Republic and non-significant trend for Romania
Wheat is the best example of the yield gap course in the CE countries stressing on the
difference in fertilizer management The main dissimilarities among countries do not refer
to the first phase The YG was deep in spite of relatively high yield indicating thus a low
capacity of contemporary cultivated varieties to achieve further gains in yield Much more
important were YG length and number of years to reach the TP The time to reach the TP
was shorter (6(7) years) in countries such as the Czech and Slovak Republics Hungary and
Poland and also in Croatia and Slovenia corresponding to rapid rebuilding of fertilizer
wwwintechopencom
Constraints and Solutions to Maintain Soil Productivity A Case Study from Central Europe
175
markets in these countries In countries with extensive fertilizersrsquo management the length of
the first phase extended up to mid-90s
The YG evaluation shows that the current nutrient management in CE countries can
overcome this phenomenon especially in the case of wheat and maize A TYG can be most
easily negated in countries belonging to Unbalanced or Balanced nutrient management
groups such as the Czech and Slovak Republics Hungary and Poland and also Croatia and
Slovenia In countries with extensive fertilizersrsquo management the TYG has not been
overcome and enters the third phase of yield development stagnation due to low use of
fertilizers in turn resulting in the very low and unstable level of annually harvested yields
44 Yield prognosis ndash The unassimilated nitrogen concept
The medium or long-term food and environmental policy strategies for any country or
particular region are supported by yield prognosis considered as an operational tool
However the ex-ante prognosis depends on the reliability of the data used Two approaches
both relying on the unit productivity of fertilizer nitrogen (PFPN) have been considered The
first assumes extrapolation of real and improved yields based on the linear model (Reilly amp
Fuglie 1998) The second one is based on long term trends of the YG but transformed into
unit of temporarily lost fertilizer nitrogen termed for the purposes of this study as
unassimilated nitrogen This approach as related to nitrogen management has been used to
make a prognosis of yields of key crops in the CE countries
Operationally the concept presented in this chapter assumes that the total amount of
applied fertilizer nitrogen (FN) is simply divided into three main pools i) assimilated
(FaN) ndash nitrogen taken up by meanwhile grown crop ii) unassimilated nitrogen (FuaN) ndash
temporary out of use by plants andor iii) lost from the field (FLN) The quantitative
assessment of the FuaN pool relies on the defined YG procedure individually related to
each investigated crop
FN = FaN + F uaN + FLN
FuaN = YGcPFPN
where
FuaN ndash unassimilated nitrogen kg N ha-1 YG - yield gap cPFPN ndash the corrected partial factor productivity of applied N kg yield kg N-1
In the first step of yield prognosis the Unassimilated Nitrogen Indices (IuaN) should be computed Therefore the original set of YG data for each of the studied crops was transformed into a quantitative amount of nitrogen lost temporarily from the system marked as minus (-IuaN) In the second step of the analysis both sets of actual (YA) and maximum attainable yields (YM) of each crop were regressed against corresponding set of
uaN indices The obtained regression models clearly show that actual yields over the period of 20 years did not respond significantly to the IuaN as reported in Fig 7 for wheat in Romania The positive and simultaneously significant trends were however achieved when the maximum attainable yield (YM) instead of the actual yield (YA) was introduced into the regression model It can be therefore hypothesized that any virtual loss of nitrogen
wwwintechopencom
Soil Fertility Improvement and Integrated Nutrient Management ndash A Global Perspective
176
ie the negative uaN indices reflect the potential status for a yield increase and vice versa Unfortunately the positive indices of the uaN simply describe a state of N soil mining which in turn causes direct yield decline This is consistent with the opinion of Dibb (2000) and typical for many parts of the world including most CE countries
YM = -0114uaN + 2703 R2 = 093 P lt 0001
0
1
2
3
4
5
6
7
8
9
10
-60 -50 -40 -30 -20 -10 0 10
Gra
in y
ield
(Y
) t
ha-1
YA
YM
Yield
type
Unassimilated nitrogen (uaN) kg N ha-1
Fig 7 Yield prognosis of winter wheat based on residual nitrogen - a case of Romania (RO) Significant (Plt005) linear equation represents the trend for the attainable yields in the 1986-2008 period Legend YA ndash actual yield YM ndash maximum yield
Reliable yield prognosis can be performed assuming a certain level of expected yield or by focusing any improvement of production technology on higher N use efficiency The first approach can be best presented for wheat The maximum attainable yield for this crop in Poland and the Czech Republic is fixed at the level of 65 t ha-1 but for Romania at 45 t ha-1 (Rabbinge amp van Diepen 2000) The amount of uaN required to be incorporated into grain yield was calculated by the models and amounted to 48 27 and 33 kg ha-1 respectively It is equal to 58 27 and 100 of annual N rate applied in these countries and does not seem a realistic approach The same rules refer to other key crops in the study Therefore the second concept relying on the ability of currently cultivated crops to fix an extra amount of
uaN seems to be a more realistic approach for making any reliable yield prognosis (Table 7) This assumption is highly promising especially for countries presenting an extensive type of agriculture production for example Romania The expected wheat increase in response to the use of extra 20 kg N ha-1 is possible considering the water limited yield fixed at 45 t ha-1 The prognosis for the Czech Republic is still below the water limited yield being at 65 t ha-1 In Poland the calculated yields are at the same level as Romania but soils are less suitable for wheat production Therefore any grain yield increase seems to be a great challenge for farmers in all countries of the CE In the light of yields prognosis for sugar beets the fixed level of uaN at 20 kg N ha-1 is generally too low The level of 60 t ha-1 of beets seems to be the most reliable short-term target Thereby the amount of uaN successfully managed should be established at the level of 30 kg ha-1
wwwintechopencom
Constraints and Solutions to Maintain Soil Productivity A Case Study from Central Europe
177
CropCountry Linear regression model Yield at 20 kg uaN t ha-1
Wheat
Croatia YM = -0064 uaN + 3989 for R2 = 096 527
Czech Rep YM = -0063 uaN + 4777 for R2 = 088 604
Poland YM = -0060 uaN + 3623 for R2 = 092 482
Romania YM = -0114 uaN + 2703 for R2 = 093 498
Maize
Croatia YM = -0069 uaN + 4852 for R2 = 086 623
Czech Rep YM = -0064 uaN + 6470 for R2 = 069 776
Poland YM = -0085 uaN + 5431 for R2 = 083 713
Romania YM = -0121 uaN + 3348 for R2 = 094 578
Sugar beets
Croatia YM = -0605 uaN + 40677 for R2 = 089 5278
Czech Rep YM = -0458 uaN + 45872 for R2 = 076 5503
Poland YM = -0609 uaN + 39801 for R2 = 081 5198
Romania YM = -0822 uaN + 24046 for R2 = 093 4049
Table 7 Yield prognosis based on the unassimilated quantity of nitrogen (uaN)
5 Soil productivity improvements The concept of NPK fertilizers balance
The simple comparison of CE countries with respect to nutrient management clearly shows
that annual inputs of nitrogen are too high with respect to phosphorus and potassium
Therefore the main reasons of general yield stagnation in most of the CE countries are long-
term negative balances of P and K caused by low input of both mineral and organic
fertilizers As a consequence of soil P and K long-term mining the percentage share of soils
rich in both nutrients declined in the last two decades below the sufficiency level which was
achieved in many countries in 80s (Csatho at al 2007 Grzebisz amp Fotyma 2007)
It has been clearly stressed that in the transition phase of yield development the PFPN indices
reached the highest values resulting in yield gain This phenomenon emerged in years 1990
1991 for Poland and Hungary and in 1991 1992 for the Czech and Slovak Republics In all
these years the supply of P and K fertilizers was low In the Czech Republic ratios between
amounts of applied N-P-K fertilizers expressed as NP2O5K2O was 1025025 on average
This structure in spite of decreased fertilizersrsquo consumption allowed farmers to achieve the
same yields of all crops as in the period 1986-1990 The present structure of nutrient use is as
1015015 for the Czech Republic and 10404 for Poland These disparate nutrient ratios
stress the importance of NPK balance for high crop production The proposed NPK ratio
for the Czech Republic based on the cPFPN index can be established at the level of
1025025 in good years ie under ample water supply or 1025050 in unfavorable years ie
under expected water stress Hence keeping the current level of fertilizers consumption on
arable land ca 130 kg ha-1 one can predict the right amount of nutrients to apply In Poland
the total amount of currently consumed fertilizers is almost the same as in the Czech
wwwintechopencom
Soil Fertility Improvement and Integrated Nutrient Management ndash A Global Perspective
178
Republic Unfortunately soils in Poland are much poorer in potassium and also in
phosphorus being therefore highly sensitive to external supply of nutrients This
conclusion is corroborated by positive trends of yields in response to P and K fertilizers
application as found for all crops since 1991 onwards Consequently under favorable
weather conditions or on soils naturally rich in potassium the suggested formulation of N-
P-K fertilizers is as follows 1033066 but in years with high probability of drought or on
areas sensitive to drought a slightly different formulation is recommended namely
100510
It is not easy to formulate any efficient fertilizing strategy for Romania Since mid- 90s maize and wheat have shown yield stagnation at a very low level The main factors responsible for this situation are i) low N fertilization rates ii) imbalanced use of P and K fertilizers Therefore yields of these two crops are in fact dependent only on the seasonal weather course fluctuating for ca 100 on a yearly scale basis The main reason is unbalanced consumption of basic fertilizers which leads to permanent soil mining especially potassium The NP2O5K2O relationships averaged for the period 2004-2008 as 1027009 is not sufficient to get any yield increase or even its stabilization Potassium accumulates in plant tissues in much higher amounts and is considered as useful nutrient in water management (Cakmak 2005) Thereby this nutrient seems to be crucial for crop production in Romania even taking into account that almost 50 of land area is covered by soil naturally rich in minerals containing K In spite of low N consumption but unbalanced nutrient management there is still a space for an extra N loss for both key crops ie wheat and maize (see Fig 7) Therefore it could be concluded that any yield increase depends on both significant N rate rise and simultaneous change of fertilizer formulations The operational N-P-K fertilizers ratios suggested for Romania are as follows 1033017 in favorable and 10404 in unfavorable years The second scenario should aim at increasing plant survival under drought conditions
6 Thoughts and prospects
The new era of agriculture development in the Central Europe revealed how actual
agriculture outcomes in this region depend on three key factors presented in descending
order i) weather conditions during the growth season ii) inherent soil fertility iii) nitrogen
fertilizer consumption At present the first factor is decisive for crop production High year-
to-year yield variability reflects the imbalanced use of soil and external resources such as
fertilizers Therefore maximum attainable yields ie limited by water supply for example
for wheat are not attainable in all countries of the region In Germany also part of the
Central European region actual yields are above the ldquowater limitedrdquo level (Rabbinge amp
Diepen 2000 Supit et al 2010)
Inherent differences in the nature of soil quality between the CE countries as a background
of nutrient management are strictly related to the soil origin (Plant et al 2005) Except for
Poland all other countries are relatively rich in soils originated from loams (Cambisols) and
loess (Chernozems) These soils exhibit a high inherent potential for supplying K and other
cations such as calcium and magnesium (Nikolova 1998)
However at present nutritional requirements of high yielding crops most of the CE countries are almost entirely oriented on the third yield forming factor ie nitrogen
wwwintechopencom
Constraints and Solutions to Maintain Soil Productivity A Case Study from Central Europe
179
fertilizer use It has been well recognized that a balanced supply of external sources of slowly mobile elements such as phosphorus and potassium is broadly expected (Atkinson et al 2005 Struik amp Bonciarelli 1997) Consequently the average actual and attainable yields of main crops in CE countries are much more related to the soil-adjusted potential than to amounts of currently applied fertilizers As a result CE countries show at present much greater differences in agricultural production than at the end of the 80s
The observed unfavorable patterns of N fertilizer long-term consumption creates problems not only for agriculture production but are also potentially dangerous for the environment as a potential source of reactive nitrogen (Roberts 2006) There are three main questions to be urgently answered by specialists in all countries of the CE region i) do farmers really recognize an increasing yield gap ii) what is the reason for farmers and their advisory services to tolerate low efficiency of nitrogen iii) do farmers and advisory services recognize environmental aspects of the increasing amount of residual nitrogen In order to get answers to these questions one has to be familiar with factors contributing to the improvement in N fertilizer use efficiency
1 Farm management of N in terms of i) N rate quantification ii) time of N fertilizers application and iii) method of N fertilizers application
2 Management of nutrients responsible for the efficiency of N uptake and it in-plant transformation
3 Management of production factors other than N
The first problem is not only of technical nature because it affects in-season nitrogen use
efficiency and in turn actual yieldsrsquo variability However CE countries representing the
restoration type of yield development but at the same time unbalanced pattern of
consumed fertilizers do not indicate needs for increasing actually applied N rates This
strategy is to some extent the core of yield improvement in countries presenting stagnated
type of fertilizersrsquo management provided that any increase in N use will be compensated by
adequate amounts of applied phosphorus and potassium
It could finally be concluded that the realization of both goals of agricultural production in
the CE countries ie i) long-term yield stabilization and even its increase and ii) unit
productivity of the applied fertilizer N increase in turn decreasing amounts of the residual
N requires in the coming future changes in the structure of fertilizersrsquo consumption
keeping in the Unbalanced group of countries the same level of applied fertilizers The
problem of nutrients supply to a growing plant does not however refer only to the balanced
amounts of the applied fertilizers but also to the crop accessibility to soil natural nutrient
pools This problem is inherently related to conditions of root system growth in the soil
body There are a lot of factors limiting roots accessibility to water and nutrients even in
soils of high natural fertility which have been forgotten in the last 50 years but the most
important is soil acidy and related toxicity of aluminum (Atkinson et al 2005 Diatta et al
2010 Marschner 1991 Struik and Bonciarelli 1997) The key strategic target for farmers is to
increase soil volume directly occupied by plant roots in order to improve their access to
unavailable pools of nutrients Three main areas of soil productivity improvement via
increasing crop plants accessibility to nutrients in the subsoil at least may be considered i)
regulation of soil reaction ii) increase of organic matter content iii) removing of any kind of
hardpans It seems highly probable that in the case of Poland all three groups of measures
wwwintechopencom
Soil Fertility Improvement and Integrated Nutrient Management ndash A Global Perspective
180
are important In other countries of the CE soil acidity should be considered as an
agronomical problem for farmers conducting production on Luvisols
7 References
Atkinson A Black K amp Dawson L (2005) Prospects advantages and limitations of future crop production systems dependent upon the management processes Annals of Applied Biology Vol 146 pp 203-215 ISSN 1744-7348
Batjes H (2002) Carbon and nitrogen stocks in the soils of Central and Eastern Europe Soil Use Management Vol 18 pp 324-329 ISSN 1475-2743
Cakmak I (2005) The role of potassium in alleviating detrimental effects of abiotic stresses in plants Journal of Plant Nutrition Soil Science Vol 168 pp 521-530 ISSN 1436-8730
Catt J (2001) The agricultural importance of loess Earth-Science Reviews Vol 54 pp 213-229 ISSN 0012-8252
Cochrane N (2004) EU Enlargement Implications for US_EU agricultural relations US-EU Food and Agriculture ComaprisonWRS-04-04 78-86 Available online at
httpwwwersusdagovpublicationsWRS0404WRS0404pdf (Access 20110524)
Csatho P Sisak I amp Radimszky L (2007) Agriculture as a source of phosphorus causing eutrophication in Central and Eastern Europe Soil Use management Vol 23 (suppl 1) pp 36-56 ISSN 1475-2743
Csatho P amp Radimszky L (2009) Two Worlds within EU27 Sharp Contrasts in Organic and Mineral Nitrogen-Phosphorus Use Nitrogen-Phosphorus Balances and Soil Phosphorus Status Widening and Deepening Gap between Western and Central Europe Communications in Soil Science and Plant Analysis Vol 40 pp 999-1019 ISSN 0010-3624
Diatta J Bocianowski J amp Skubiszewska A (2010) Sulphate-based aluminum phytotoxicity mitigation under strong soil acidification Fresenius Environmental Bulletin Vol 19 No 12b pp 3185-3192 ISSN 1018-4619
Dibb D (2000) The mysteries (myths) of nutrient use efficiency Better Crops Vol 84 No 3 pp 3ndash5 ISSN 0006-0089
Dobermann A amp Cassman K (2002) Plant nutrient management for enhanced productivity in intensive grain production systems of the United States and Asia Plant and Soil Vol 247 pp 153-175 ISSN 1573-5036
Evans L amp Fisher R (1999) Yield potential its definition measurement and significance Crop Science Vol 39 pp 1544-1551 ISSN 1896-0782
Falloon P amp Betts R (2010) Climate impacts on European agriculture and water management in the context of adaptation and mitigation ndash the importance of integrated approach Science of Total Environment Vol 408 pp 5667-5687 ISSN 0048-9697
FAOSTAT Available online at httpfaostatfaoorgdefaultaspx (Access 20110524) Fixen P (2004) Phases in narrowing the yield gap Better Crops Vol 88 No 4 p 3 ISSN
0006-0089 Fronzek S amp Carter T (2007) Assessing uncertainties in climate change impacts on
resource potential for Europe based on projections from RCMs and GCMs Climate Change Vol 81 pp 357-371 ISSN 1758-6798
wwwintechopencom
Constraints and Solutions to Maintain Soil Productivity A Case Study from Central Europe
181
Grzebisz W amp Fotyma M (2007) Recommendations and use of potassium fertilizers in Central-Eastern Europe (CEE) In Proceedings International Fertiliser Society No 621 York UK pp 24 ISBN 978-0-85310-258-8
Grzebisz W Diatta J amp Haerdter R (2010) Fertilizer consumption patterns in Central European countries ndash effect on actual yield development trends in 1986-2005 years - a comparative study of the Czech Republic and Poland Journal of Central European Agriculture Vol 11 No 1 pp 73-82 ISSN 1332-9049
IFADATA Statistics online (2011) wwwfertilizerorgifastatisticsifadata datalineasp (Access 20110524)
Jongman R Bunce R amp Metzger R (2006) Objectives and applications of a statistical environmental stratification of Europe Landscape Ecology 21 409-419 ISSN 1572-9761
Karlen D Ditzler C amp Andrews S (2003) Soil quality why and how Geoderma Vol 114 pp 145-156 ISSN 0016-7061
Kelch D amp Osborne S (2001) Crop production capacity in EuropePrime Economic Research ServiceUSDA Agricultural outlookMarch 2001 19-23 ISSN 0099-1066
Marschner H (1991) Mechanisms of adaptation of plants to acid soils Plant and Soil 134 1-20 ISSN 1573-5036
Neumann K Verburg P amp Stehfest E (2010) The yield gap of global production a spatial analysis Agricultural Systems Vol 103 pp 316-326 ISSN 0308-521X
Nikolova M (1998) The soil potassium resources and the efficiency of potassium fertilizers in Bulgaria Nikola Poushkarow Inst of Soil Science and Agroecology Sofia Bulgaria IPI Country Report 12 39 pp
Olesen J amp Bindi M (2002) Consequences of climate change for European agricultural productivity land use and policy European Journal of Agronomy Vol 16 pp 239-262 ISSN 1161-0301
Olesen J Trnka M amp Kersebaum K (2011) Impacts and adaptation of European crop production systems to climate change European Journal of Agronomy Vol 34 pp 96-112 ISSN 1161-0301
Plant J Whittaker A amp Demitriades B (2005) The geological and tectonic framework of Europe Geochemical Atlas of Europe Part 1 Background Information Methodology Ed Salminen R Maps GTK FOREGS 20 pp ISBN 951-690-956-6
Rabbinge R (1993) The ecological background of food production In Crop protection and sustainable agriculture Wiley Chichester (Ciba Foundation Symposium 177 2-29 ISBN 10 0471939447
Rabbinge R amp Diepen C (2000) Changes in agriculture and land use in Europe European Journal of Agronomy Vol 13 pp 85-100 ISSN 1161-0301
Reilly J Fuglie K (1998) Future yield growth in field crops what evidence exists Soil amp Tillage Research Vol 47 pp 275-290 ISSN 0168-1987
Roberts T (2006) Improving Nutrient Use Efficiency Proceedings of the IFA Agriculture Conference Optimizing Resource Use Efficiency for Sustainable Intensification of Agriculture 27 february-2 March 2006 Kunming China pp 8
Rosegrant M Paisner M amp Meijer S (2001) Global Food Projections to 2020 Emerging trends and alternative futures IFPRI pp 206 ISBN 0-89629-640-7
wwwintechopencom
Soil Fertility Improvement and Integrated Nutrient Management ndash A Global Perspective
182
Sinclair T Purcell L amp Sneller C (2004) Crop transformation and the challenge to increase yield potential Trends in Plant Science Vol 9 No 2 pp 70-75 ISSN 136085
Struik P amp Bonciarelli F (1997) Resource use at the cropping system level European Journal of Agronomy Vol 7 pp 133-143 ISSN 1161-0301
Supit I van Diepen C amp de Wit A (2010) Recent changes in the climatic yield potential of various crops in Europe Agricultural Systems Vol 103 pp 683-694 ISSN 0308-521X
wwwintechopencom
Soil Fertility Improvement and Integrated Nutrient Management - AGlobal PerspectiveEdited by Dr Joann Whalen
ISBN 978-953-307-945-5Hard cover 306 pagesPublisher InTechPublished online 24 February 2012Published in print edition February 2012
InTech EuropeUniversity Campus STeP Ri Slavka Krautzeka 83A 51000 Rijeka Croatia Phone +385 (51) 770 447 Fax +385 (51) 686 166wwwintechopencom
InTech ChinaUnit 405 Office Block Hotel Equatorial Shanghai No65 Yan An Road (West) Shanghai 200040 China
Phone +86-21-62489820 Fax +86-21-62489821
Soil Fertility Improvement and Integrated Nutrient Management A Global Perspective presents 15 invitedchapters written by leading soil fertility experts The book is organized around three themes The first theme isSoil Mapping and Soil Fertility Testing describing spatial heterogeneity in soil nutrients within natural andmanaged ecosystems as well as up-to-date soil testing methods and information on how soil fertility indicatorsrespond to agricultural practices The second theme Organic and Inorganic Amendments for Soil FertilityImprovement describes fertilizing materials that provide important amounts of essential nutrients forplantsThe third theme Integrated Nutrient Management Planning Case Studies From Central Europe SouthAmerica and Africa highlights the principles of integrated nutrient management Additionally it gives casestudies explaining how this approach has been implemented successfully across large geographic regionsand at local scales to improve the productivity of staple crops and forages
How to referenceIn order to correctly reference this scholarly work feel free to copy and paste the following
Witold Grzebisz and Jean Diatta (2012) Constraints and Solutions to Maintain Soil Productivity A Case Studyfrom Central Europe Soil Fertility Improvement and Integrated Nutrient Management - A Global PerspectiveDr Joann Whalen (Ed) ISBN 978-953-307-945-5 InTech Available fromhttpwwwintechopencombookssoil-fertility-improvement-and-integrated-nutrient-management-a-global-perspectiveconstraints-and-solutions-to-maintain-soil-productivity-a-case-study-from-central-europe
copy 2012 The Author(s) Licensee IntechOpen This is an open access articledistributed under the terms of the Creative Commons Attribution 30License which permits unrestricted use distribution and reproduction inany medium provided the original work is properly cited
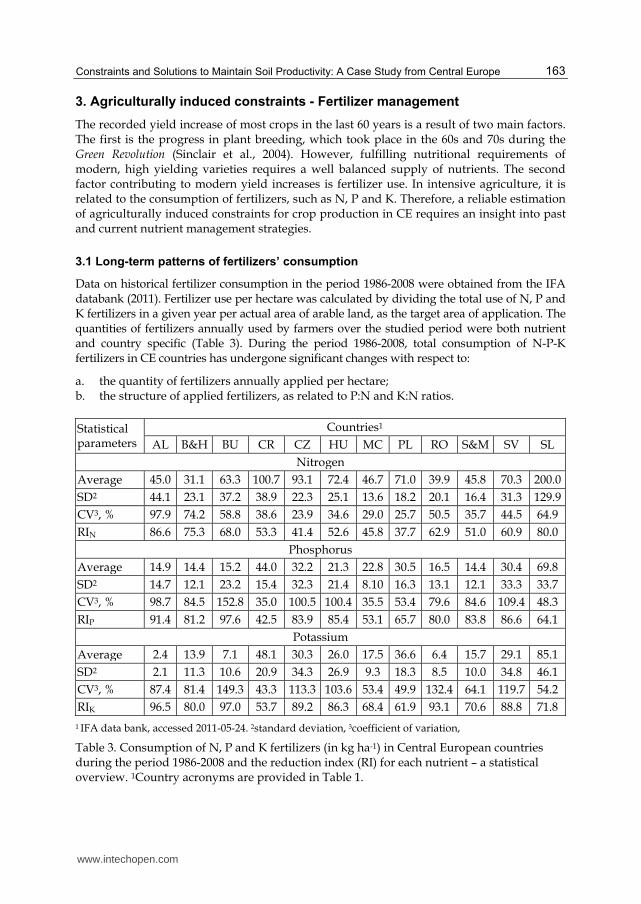
Constraints and Solutions to Maintain Soil Productivity A Case Study from Central Europe
163
3 Agriculturally induced constraints - Fertilizer management
The recorded yield increase of most crops in the last 60 years is a result of two main factors The first is the progress in plant breeding which took place in the 60s and 70s during the Green Revolution (Sinclair et al 2004) However fulfilling nutritional requirements of modern high yielding varieties requires a well balanced supply of nutrients The second factor contributing to modern yield increases is fertilizer use In intensive agriculture it is related to the consumption of fertilizers such as N P and K Therefore a reliable estimation of agriculturally induced constraints for crop production in CE requires an insight into past and current nutrient management strategies
31 Long-term patterns of fertilizersrsquo consumption
Data on historical fertilizer consumption in the period 1986-2008 were obtained from the IFA databank (2011) Fertilizer use per hectare was calculated by dividing the total use of N P and K fertilizers in a given year per actual area of arable land as the target area of application The quantities of fertilizers annually used by farmers over the studied period were both nutrient and country specific (Table 3) During the period 1986-2008 total consumption of N-P-K fertilizers in CE countries has undergone significant changes with respect to
a the quantity of fertilizers annually applied per hectare b the structure of applied fertilizers as related to PN and KN ratios
Statistical parameters
Countries1
AL BampH BU CR CZ HU MC PL RO SampM SV SL
Nitrogen
Average 450 311 633 1007 931 724 467 710 399 458 703 2000
SD2 441 231 372 389 223 251 136 182 201 164 313 1299
CV3 979 742 588 386 239 346 290 257 505 357 445 649
RIN 866 753 680 533 414 526 458 377 629 510 609 800
Phosphorus
Average 149 144 152 440 322 213 228 305 165 144 304 698
SD2 147 121 232 154 323 214 810 163 131 121 333 337
CV3 987 845 1528 350 1005 1004 355 534 796 846 1094 483
RIP 914 812 976 425 839 854 531 657 800 838 866 641
Potassium
Average 24 139 71 481 303 260 175 366 64 157 291 851
SD2 21 113 106 209 343 269 93 183 85 100 348 461
CV3 874 814 1493 433 1133 1036 534 499 1324 641 1197 542
RIK 965 800 970 537 892 863 684 619 931 706 888 718
1 IFA data bank accessed 2011-05-24 2standard deviation 3coefficient of variation
Table 3 Consumption of N P and K fertilizers (in kg ha-1) in Central European countries during the period 1986-2008 and the reduction index (RI) for each nutrient ndash a statistical overview 1Country acronyms are provided in Table 1
wwwintechopencom
Soil Fertility Improvement and Integrated Nutrient Management ndash A Global Perspective
164
The long-term course of fertilizersrsquo consumption showed some resemblances Therefore the
whole investigated period has been divided into three well defined phases (1) High
Consumption Level (HCL) (2) Collapse and Transition (CT) (3) Post Transition (PT) (Fig 1)
Two distinct procedures have been applied to make a reliable estimate of the length of each
phase The HCL was separated from the CT when there was more than 25 change in the
baseline ndash yearly values The PT was established using a linear regression model assuming
statistically proven change
The key attribute of the first phase lasting from four to five years was characterized by high
levels of consumed fertilizers mainly N irrespective of the country (Fig 1) The
consumption of other nutrients ie P and K was country specific The CT phase was
characterized by a dramatic sudden decrease in use of each fertilizer This process occurred
for one or two years in some countries (Czech Republic Croatia Hungary Poland Slovakia
Slovenia) but in others up to 10 years showing prolonged depression The reason of this
drastic decline was well described in economy the scissor phenomena (Cochrane 2004) The PT
phase has been appearing in three distinct forms i) increase (PT-I above the baseline HCL
level) ii) restoration (PT-R significant trend but below the baseline HCL level) iii)
stagnation (PT-S no significant changes over time)
0
20
40
60
80
100
120
140
160
180
1985 1990 1995 2000 2005 2010
Consecutive years (CY)
Nit
rog
en c
onsu
mp
tion
(N
c)
kg
N h
a-1
CR
CZ
RO
Country
HCL CT PT
CR-Nc = 641CY + 12711 R2 = 075 P lt 0001
CZ-Nc = 242CY + 4763 R2 = 074 P lt 0001
Fig 1 Patterns of N fertilizersrsquo consumption in selected Central European countries - Croatia (CR) Czech Republic (CZ) and Romania (RO) during the 1986-2008 period (based on IFA database accessed 2011-05-24) Significant (Plt005) trends are indicated with solid lines and linear regression equations given The CT periods are marked with dashed lines
Nitrogen considered as the key nutrient in crop production but at the same time potentially unfriendly to the environment requires much deeper attention Its consumption in the HCL period was high varying around 100 kg N ha-1 for most countries in the region (Table 3) The lowest consumption (defined by 025 percentile) took place during the CT phase The degree of collapse can be simply assessed by using a fertilizer use reduction index (RI)
wwwintechopencom
Constraints and Solutions to Maintain Soil Productivity A Case Study from Central Europe
165
RI = [1- (025P09P) 100]
where 025P and 09P are the 25th and 90th percentiles of fertilizer consumption over the period 1986-2008
Fertilizer N management in CE during the PT phase relies on consumption trends evaluated for a period of 18 years ie since 1991 onwards On the basis of elaborated regression models countries of the region have been divided into three defined groups
1 Increase (PT-I) Croatia Slovenia 2 Restoration (PT-R) Czech Republic Hungary Poland Slovakia Slovenia 3 Stagnation(PT-S) Albania Bosnia amp Herzegovina Macedonia Bulgaria Romania
Serbia amp Montenegro
Phosphorus is a nutrient of basic importance for any crop plant because all seed crops are highly sensitive to its deficiency during the onset of ripening In the HCL phase the consumption of P fertilizers was in the range of ca 35 to 95 kg P2O5 ha-1 (Table 3) During the period of study its use underwent a great mostly negative change Its consumption trends evaluated for years 1991-2008 showed much greater variability compared to N fertilizersrsquo use in CE countries
1 Increase Croatia Slovenia 2 Restoration Poland Hungary Macedonia 3 Stagnation Albania Czech Slovakia Serbia amp Montenegro 4 Recession Bosnia amp Herzegovina Bulgaria Romania
The occurrence of the fourth group stresses the fact that P fertilizersrsquo consumption was below the levels required to support current crop production leading to nutrient mining in three countries of the region
Potassium is generally considered as a nutrient significantly affecting water management in plants during their life cycle (Cakmak 2005) Therefore this nutrient requires special care on farm in regions like CE that experience frequent drought during the vegetative growth period (Falloon amp Betts 2010) Potassium fertilizersrsquo consumption during the HCL period varied among countries of the region from ca 5 kg K2O ha-1 (Albania) to more than 100 kg K2O ha-1 (former Czechoslovakia) (Table 3) As in the case of P the greatest decline in K consumption occurred in countries significantly increasing the use of nitrogen like the Czech and Slovak Republics and also Hungary (estimated from the potassium fertilizer use reduction index RIK)
The second indicator of fertilizer management is in the proportions of macronutrients consumed indicated during the study by the PN and KN ratios The PN ratio did not show a clear trend for two countries Albania and Bosnia amp Herzegovina In other countries negative tendencies were detected appearing as the increasing value of PN ratio meaning that proportionately more N fertilizer than P fertilizer was applied by farmers This process took place mainly during CT and PT phases Its course during the PT phase outlines three decisive patterns of P fertilizersrsquo management
a negative Czech Republic Croatia Serbia amp Montenegro Romania b positive Hungary Macedonia Poland c stagnation Slovakia
wwwintechopencom
Soil Fertility Improvement and Integrated Nutrient Management ndash A Global Perspective
166
The first trend covers the whole study period differing only in the annual rate of decrease
as indicated by the coefficient of the linear regression equation In the case of Romania it
was almost four times faster than for Croatia (Fig 2) The second pattern occurred in
countries like Hungary and Poland showing a slightly positive trend since 1991
Trends of KN ratios show similar patterns as described for PN ratios (Fig 3) Three
patterns of ratios can be also distinguished but comprising different sets of countries
a negative Macedonia Slovenia
b positive Hungary
c stagnation Croatia Czech Poland Slovakia Bulgaria and Romania (since 1993) Serbia
amp Montenegro (since 2000)
All above-described attributes of long-term fertilizersrsquo consumption were evaluated in Table 4
to develop a ranking based on three types of nutrient management in CE countries as
follows
1 Extensive generally showing low consumption of all fertilizers including N the most
negative attribute is the low P and K inputs leading to crop plants reliance on inherent
soil P and K supply and potentially leading to nutrient mining (Albania Bulgaria
Macedonia Serbia amp Montenegro Romania)
2 Unbalanced high consumption of fertilizer N but at the same time not balanced by
adequate use of other nutrients such as P and K at least (Croatia Czech Slovakia
Slovenia)
3 Balanced high consumption of N fertilizer which is in part balanced by relatively high
consumption of P and K fertilizers (Hungary Poland)
0
01
02
03
04
05
06
07
08
1985 1990 1995 2000 2005 2010
Consecutive years CY
PN
rel
atio
nsh
ip
P
N
CR
PL
RO
Country
PN1-PL = -0053CY + 1076 R2 = 081 P lt 0001
PN2-PL = 0006CY ndash 105 R2 = 038 P lt 001
PN-CR = -0005CY + 105 R2 = 032 P lt 0001
PN-RO = -0019CY + 374 R2 = 081 P lt 0001
Fig 2 Typical patterns of PN ratios in selected Central European countries - Croatia (CR) Poland (PL) and Romania (RO) during the period 1986-2008 Significant (Plt005) negative linear equations are shown for CR and RO while the PL data fitted to a negative linear equation in the period 1986-1996 and thereafter showed a positive linear relationship
wwwintechopencom
Constraints and Solutions to Maintain Soil Productivity A Case Study from Central Europe
167
0
01
02
03
04
05
06
07
08
09
1985 1990 1995 2000 2005 2010
Consecutive years CY
KN
rel
atio
nsh
ip
K
N
CR
PL
RO
Country KN1-PL = -0066CY + 1323 R2 = 070 P lt 001
KN1-RO = -0044CY + 873 R2 = 083 P lt 0001
Fig 3 Typical patterns of KN ratios in selected Central European countries - Croatia (CR) Poland (PL) and Romania (RO) in the period 1986-2008 Significant (Plt005) negative linear equations are shown for CR and RO in the 1986-1992 period thereafter showed non-significant trends For CR the KN trend was non-significant for the whole period
Estimated Parameters
Country3
AL BampH BU CR CZ HU MC PL RO SampM SK SL
Nitrogen 01 0 0 ++ + + 0 + 0 0 + +-
Phosphorus 0 - - ++ 0 + + + - 0 0 +-
Potassium 0 0 0 ++ 0 + 0 + 0 0 0 0
PN 0 0 0 - - + 0 ++ - 0 0 -
KN 0 0 0 0 0 + - 0 0 0 0 -
Ranking2 0 0 0 2 2 1 0 1 0 0 2 2
1evaluation of trends ++ - increase +- restoration 0 - stagnation - - decrease +- - time variable 2 fertilizer management ranking 0 ndash extensive 1 ndash balanced 2 ndash unbalanced 3 Country acronyms are provided in Table 1
Table 4 Fertilizer consumption trends ndashsummary and country management ranking for countries in Central Europe during the period 1986 to 2008
32 Soil fertility status
Soil is considered as a slowly renewable or non-renewable resource that requires the same
level of protection as other limited resources like phosphorus rock There is strong
agreement that productivity of arable land depends on both a soilrsquos fertility potential (soil
quality inherent soil fertility) and present state of soil properties (soil health) to sustain
wwwintechopencom
Soil Fertility Improvement and Integrated Nutrient Management ndash A Global Perspective
168
primary production and other ecological functions The minimum data set to describe
current fertility status of arable land ie soil health should contain indicators reflecting
both past and actual organic matter content soil pH and management of nutrient soil
resources (Atkinson et al 2005 Karlen et al 2003)
Total organic carbon (TOC) stock in the topsoil (00-03 m) or its content () in arable soils is
a good descriptor of short-term trends in soil organic matter (SOM) management However
the organic carbon stock measured to a depth of 1 m in the soil profile can be considered as
an indicator of soil fertility potential The actual content of TOC in an averaged arable soil
unit was calculated by weighted mean content of organic carbon for main soil types (Batjes
2002) and its percentage share in the soil cover for each CE country (see Table 1) Analysis of
this data showed that TOC in the average topsoil unit of CE countries is insufficient ranging
from ca 60 (Poland) to 80 (Hungary) t TOC ha-1 ie about 14 to 18 TOC Differences
between CE countries can be evaluated by TOC stock in the soil profile to a depth of 1 m
Based on this criterion countries can be classified into three groups
a low ( le 120 t TOC ha-1) Croatia Poland b medium (121-160 t TOC ha-1 ) Albania Bulgaria Czech Republic Macedonia
Romania Serbia amp Montenegro Slovakia Slovenia c high (gt 161 t TOC ha-1) Hungary
Phosphorus and Potassium are key nutrients for achieving high productivity of arable soils
Available resources of both nutrients are the most important indicators of soil health ie its
current productivity The country status of current soil nutrient management was evaluated
by means of soil fertility index (SFI) expressed as the sum of the percentage share of arable
land characterised by the very high high and half of medium rating of available P or K
(Grzebisz amp Fotyma 2007) It has been assumed that SFI for P and K exceeding 70 of
arable land share is a prerequisite for high yield of any crop In the 1980s this target was
achieved in many countries of the region like Czechoslovakia Hungary and some countries
of the former Yugoslavia (Serbia amp Montenegro Slovenia) (Fig 4) In these countries the
rates of applied fertilizers were far in excess of crop removal capacity Poland in spite of
currently high K consumption differs from other CE countries The sufficiency level for P
and K of 70 was never reached due to much lower inherent soil potential for nutrient
supply At the beginning of 2000 significant changes of P and K fertility were recorded The
increase of the P sufficiency level was recorded only in Slovenia and Poland In Slovenia the
reason was high consumption of P fertilizers at the beginning of the 21st century In Poland
the increase is related to sufficiently well balanced use of N and P fertilizers and slightly
lower yields than in the 80s In all other CE countries the percentage of P-fertile soils
generally decreased nevertheless the rate of the decrease differed across the region A
slight decrease occurred in Czech and Slovak Republics as well as in Hungary The greatest
drop was recorded in Bulgaria followed by Serbia and Montenegro The potassium SFI
presents much more alarming trend As reported by Grzebisz amp Fotyma (2007) for countries
of the Northern Agricultural Zone (Czech Hungary Poland Slovakia) the K sufficiency
level decreased below the target value within two decades Based on K fertilizersrsquo
consumption trends it can be assumed that the same trend occurs also in the Southern
Zone
wwwintechopencom
Constraints and Solutions to Maintain Soil Productivity A Case Study from Central Europe
169
0
10
20
30
40
50
60
70
80
90
100
AL BU CZ H PL RO SE SK SL
Countries
P s
oil
fert
ility
in
de
x
A
L
1980s
2000s
Sufficiency level
Fig 4 Phosphorus soil fertility indices (expressed as the percentage of arable land AL) for selected CE countries during the period 1986 - 2008 (based on Csatho et al 2007) The sufficiency level was assumed to be 70 as described by Grzebisz amp Fotyma (2007) Country acronyms are given in Table 1
4 Soil productivity assessment
41 Long-term trends in crop yields
All CE countries grow the same crops and cereal species predominate The area sown with cereals occupies 64 of arable land in Croatia 52 - in the Czech Republic 68 - in Poland and 59 ndash in Romania In the Czech Republic cerealsrsquo production is dominated by wheat and barley but in Poland by wheat and rye In Romania and Croatia maize is the key grain crop Sugar beets due to EU regulation in the last 10 years are of minor importance but this crop is a good indicator of soil quality Therefore it has been assumed that these crops would reflect fairly well changes in current soil fertility status as a consequence of applied nutrient management strategies This assumption is well documented by observed variability of yields of wheat maize and sugar beets in selected countries of CE (Table 5) The highest variability was found for Romania and the lowest for Poland Romania is a country with an extensive pattern of fertilizersrsquo management typical in the Southern Agricultural Zone of Europe Poland belongs to countries of the Northern Zone but presents a balanced patterns of fertilizersrsquo management (Poland Hungary) Other selected countries are members of the Unbalanced fertilizing group of CE countries
The long-term yield trend can be used as an indicator of key crops sensitivity to past and current fertilizersrsquo management As in the case of fertilizersrsquo consumption trends three consecutive phases of yield development over the period 1986-2008 may be distinguished
1 Actual-Standard (AS) 2 Recession (RC) 3 Restoration (RS) or Stagnation (SG)
The observed trends of harvested yields were most pronounced for wheat other cereals and for seed crops like oil-seed rape (Grzebisz et al 2010) In the first phase of the study taking
wwwintechopencom
Soil Fertility Improvement and Integrated Nutrient Management ndash A Global Perspective
170
place at the end of the 80s yields of wheat reached on average the highest recorded levels Therefore this particular period is considered as a standard level (AS) for evaluating subsequent phases (Fig 5) The highest yield decline ie the recession phase (RC) in response to the collapse in fertilizer consumption took place in the Northern Zone but
Crops Croatia Czech Republic Poland Romania
x plusmn SD5 CV6 x plusmn SD CV x plusmn SD CV x plusmn SD CV
Wheat 40plusmn052
39plusmn033
44plusmn094
125
86
216
48plusmn05
51plusmn04
52plusmn06
102
78
113
36plusmn03
37plusmn02
39plusmn04
90
56
100
27plusmn06
31plusmn04
29plusmn08
212
141
265
Maize 49plusmn10
40plusmn09
55plusmn13
205
217
229
58plusmn13
51plusmn05
69plusmn05
214
93
76
52plusmn08
49plusmn02
56plusmn08
143
41
157
31plusmn08
29plusmn05
34plusmn11
244
180
315
Sugar
beet
404plusmn77
398plusmn49
487plusmn52
192
123
108
424plusmn76
345plusmn15
531plusmn49
180
42
49
381plusmn55
346plusmn19
451plusmn39
145
56
88
228plusmn51
213plusmn29
304plusmn33
222
136
108
1FAOSTAT available online 2011-05-24 21986-2008 31986-1990 42004-2008 5standard deviation 6coefficient of variation
Table 5 Statistical overview of key cropsrsquo yields (t ha-1) in selected Central European
countries during the period 1986-2008 in comparison to the AS phase and the 2004-2008
periods
0
1
2
3
4
5
6
7
1985 1990 1995 2000 2005 2010
Consecutive years CY
Gra
in y
ield
(Y
) t
ha-1
CZ
RO
Country
AS RC RE or ST
Y-CZ = 0056CY + 1089 R2 = 028 P lt 005
TYG
TYG
Legend level of harvested yield AS Actual-Standard RC Recession RE Restoration ST Stagnation
Dashed line refers to AS level of yield ie an average yield harvested in the period 1986-1990 TYG
Temporary Yield Gap
Fig 5 Long-term trends of wheat production in the Czech Republic (CZ) and Romania (RO)
during the period 1986-2008 Significant (Plt005) positive linear trend is shown for the
Czech Republic whereas non-significant for Romania in the period 1992-2008
wwwintechopencom
Constraints and Solutions to Maintain Soil Productivity A Case Study from Central Europe
171
lasted for only two or three years In other countries mainly representing the Southern Zone it was also fast or showed sustained depression The third phase of yield development was manifested in two distinct trends The first ldquorestorationrdquo trend has shown a positive yield gain since yield recession It was revealed in the Northern Zone countries and also for Croatia and Slovenia The second trend has not shown any significant change in yield since the recession resulting in yield stagnation The most interesting attribute of this trend is its high year-to-year variability The difference between the actually harvested and the AS yield has been termed as the temporary yield gap (TYG) (Fig 5) The time required to recover to the AS level was long but country specific In the Northern Zone it lasted for ca 10-12 years exceeding the AS level in 2004 or 2005 In most other countries representing the Southern Zone it has not been reached up to 2008 For maize and sugar beets the recession was also observed In the recovery period maize yields were generally positive but the rate of the yield increase was much higher in the Balanced and Unbalanced groups than in the Extensive group Sugar beets yield increase was very high at the beginning of the 90s exceeding the level reported in the 80s The main reason was a reduction in area sown with sugar beets which forced farmers to cultivate this crop on more fertile soils
42 The concept of partial factor fertilizer nitrogen productivity (PFPN)
This part of the study relies on two main conceptual pillars The first one assumes that each hectare of arable soil regardless of the current crop is supplied with the same amount of nutrients including nitrogen The second assumption takes into account the fact that the unit productivity of in-season applied fertilizer N known as PFPN is a reliable scientific tool to make simple but quick discrimination of factors limiting attainable crop yield (Dobermann amp Casman 2002) Therefore the PFPN index was used to evaluate some but selected CE countries that represent the three patterns of current fertilizer management (Table 4) Croatia and the Czech Republic have been selected as examples for the Unbalanced group whereas Poland is the Balanced group and Romania represents the Extensive group of fertilizersrsquo use
The PFPN index was obtained by dividing the actual yield of a respective crop harvested within a given year by the annual amount of N fertilizers consumed by the country assuming it was applied at an equal rate for all currently cultivated crops Operationally the PFPN index consists of two components
a yield of crop (Y) expressed in kg or t ha-1 b nitrogen fertilizer rate (FN) expressed as kg N ha-1
PFPN = YFN
Based on the long-term trends of PFPN indices for each of the key crops two different types of PFPN indices can be distinguished
1 The real partial factor productivity of applied N ndash (rPFPN) it reflects actual yields as limited by both water and N availability
2 The maximal partial factor productivity of applied N (mPFPN) it was calculated as the 4th quartile of rPFPN indices it refers to yields obtained under ample water supply
To make a reliable estimate of the yield gap for some crops cultivated in the CE the corrected partial factor productivity of applied N (cPFPN) instead of mPFPN has been applied
wwwintechopencom
Soil Fertility Improvement and Integrated Nutrient Management ndash A Global Perspective
172
Operationally it has been calculated as the average of the 4th quartile but excluding extremely elevated rPFPN values which emerged in most of investigated countries at the beginning of the 90s Indices of N productivity (PFPN rPFPN and cPFPN) were then used to calculate the yield gap
The calculated rPFPN indices showed as expected high year-to-year variability for all tested crops (Table 6) They were crop and country specific when averaged over the 1986-2008 period
a wheat CR lt CZ = PL lt RO b maize CR lt CZ lt PL lt RO c sugar beets CR = CZ lt PL lt RO
These ranges are not in line with long-term average yields of all crops which followed generally the order CZ gt CR gt PL gt RO
Maximum productivity of tested crops as evaluated for the 4th quartile of rPFPN indices was
much higher rising on average by 43 However the increase was country specific and
represents 63 for Croatia 28 for the Czech Republic 30 for Poland and 48 for
Romania The concept of mPFPN assumes an increase of rPFPN indices pursuant to higher
efficiency of applied fertilizer nitrogen due to ample water supply Its reliability has been
corroborated by low coefficients of variation implicitly indicating the potential productivity
of applied fertilizer nitrogen on the background of soil quality The sequences of countries
for each crop are as follows
a wheat CZ = PL lt CR lt RO b maize CR = CZ lt PL lt RO c sugar beets CZ lt PL lt CR lt RO
As presented in Table 6 coefficients of variations of cPFPN indices were significantly lower in comparison to mPFPN stressing on the reliability of the conducted analysis
Relationships between sets of developed rPFPN and applied fertilizer nitrogen rates can also be a useful tool for making long-term assessment of nitrogen efficiency This relationship fits the best the power function
rPFPN = 9112N-067 for R2 = 077 and n = 92
where N ndash annual rate of fertilizer nitrogen consumption kg N ha-1
Analysis of the general curve shape reveals decreasing yield per unit of N fertilizer applied with highest values of rPFPN It has been observed that irrespective of the applied N rate long-term productivity of fertilizer nitrogen increased in the order Romania lt Poland lt Croatia lt the Czech Republic However the obtained high rPFPN values are as a rule related to lower yields of harvested crops This pattern of crop response refers mostly to Bulgaria Romania and former Yugoslavia countries excluding Croatia and Slovenia As pointed out by Fixen (2004) the target of efficient N fertilizer management based on high fertilizer N use efficiency is counter-productive In this N supply system plants are forced to take up an appreciable amount of N from its soil resources which decreases their rate of growth in critical stages of yield performance Therefore ldquothe elevatedrdquo level of the PFPN could be used as an attribute of the extensive type of agriculture production
wwwintechopencom
Constraints and Solutions to Maintain Soil Productivity A Case Study from Central Europe
173
PFPN
index
Croatia Czech Republic Poland Romania
x plusmn SD1 CV2 x plusmn SD CV x plusmn SD CV x plusmn SD CV
Wheat kg yield kg N-1
rPFPN 48plusmn24 498 54plusmn13 235 54plusmn15 275 81plusmn33 405
mPFPN 80plusmn23 288 70plusmn11 160 72plusmn15 212 121plusmn14 119
cPFPN 63plusmn11 174 62plusmn4 59 62plusmn2 30 112plusmn8 69
Maize kg yield kg N-1
rPFPN 56plusmn26 464 66plusmn18 281 78plusmn21 263 95plusmn45 478
mPFPN 89plusmn29 288 89plusmn7 76 103plusmn11 102 149plusmn20 135
cPFPN 69plusmn10 151 89plusmn7 76 96plusmn2 24 137plusmn9 66
Sugar beets kg yield kg N-1
rPFPN 471plusmn224 477 478plusmn120 250 566plusmn136 240 695plusmn266 383
mPFPN 766plusmn218 285 588plusmn49 825 728plusmn67 93 977plusmn122 125
cPFPN 613plusmn86 141 588plusmn49 825 675plusmn35 52 905plusmn36 40
1standard deviation 2coefficient of variation
Table 6 Partial factor fertilizer N productivity statistics for key crops in selected Central European countries with unbalanced (Croatia Czech Republic) balanced (Poland) and extensive (Romania) fertilizersrsquo management during the period 1986-2008
43 Yield gap (YG) and its attributes
Actual yields of crops harvested by farmers in all areas of the world are much lower than
the yield potential of currently cultivated varieties under defined soil and climatic
conditions This ldquovirtualrdquo un-harvested portion of yield is generally termed the yield gap
(YG) (Evans amp Fisher 1999 Dobermann amp Cassman 2002) However the CE countries
experience another phenomenon known as the temporary yield gap (TYG) (Grzebisz et al
2010) The main reason of its emergence is the collapse in fertilizer use leading to elevation
of the rPFPN index Dibb (2000) relates extremely high N efficiency to low yield and this
trend was fully corroborated by the crop yield data from countries with extensive fertilizer
management Nevertheless the countries of the Northern Agricultural Zone (Czech
Republic Hungary Poland Slovakia) in spite of drastic decrease of consumed fertilizers in
the early 90s were characterized by high yields of wheat and other cereal crops (FAOSTAT
2011 Grzebisz et al 2010) The observed rPFPN indices extremely elevated at the beginning
of the 90s were a result of the residual effect of applied fertilizer N This phenomenon could
be manifested only under growth conditions created by ample water and sufficiently high
supply of immobile nutrients such as P and K in turn balancing N use by currently growing
crops
In the first step of yield gap calculation the cPFPN index was applied to assess the maximal
attainable yield (YAM) The yield gap was then calculated as a difference between really
harvestable yield (YA) and YAM
wwwintechopencom
Soil Fertility Improvement and Integrated Nutrient Management ndash A Global Perspective
174
YAM = cPFPN middot DN
YG = YA ndash YAM
where
DN is the rate of annually applied fertilizer N (kg N ha-1) YA is the actual yield in t ha-1 for a
given year and YAM is the maximal attainable yield (t ha-1)
The observed similarities of the general yield gap pattern over time for key crops allow to
distinguish three consecutive phases of its development in the period 1986-2008 (Fig 6)
1 First ndash primary deep yield gap to the left of the transition point (TP) 2 Second ndash point of extra yield gain TP 3 Third- secondary yield gap to the right of the TP alternatively yield gap stagnation as
indicated by the lack of significant (P lt 005) linear trend response
-7
-6
-5
-4
-3
-2
-1
0
1
2
1985 1990 1995 2000 2005 2010
Consecutive years CY
Yie
ld g
ap
(Y
G)
t h
a-1
CZ
RO
TP
YGd-CZ = 079CY - 1573 R2 = 070 P lt 001
YGd-RO = 068CY - 1354 R2 = 072 P lt 0001
YGr-CZ = -012CY + 2354 R2 = 046 P lt 0001
Country
Legend TP - Transition Point YGd - yield gap decline YGr - yield gap restoration
Fig 6 Evolution of the yield gap in wheat in the Czech Republic (CZ) and Romania (RO) during the period 1986 -2008 Significant (Plt005) positive linear equations are shown for the Czech Republic in the period 1986-92 and for Romania in the period 1986-1995 thereafter showed a negative linear relationship for the Czech Republic and non-significant trend for Romania
Wheat is the best example of the yield gap course in the CE countries stressing on the
difference in fertilizer management The main dissimilarities among countries do not refer
to the first phase The YG was deep in spite of relatively high yield indicating thus a low
capacity of contemporary cultivated varieties to achieve further gains in yield Much more
important were YG length and number of years to reach the TP The time to reach the TP
was shorter (6(7) years) in countries such as the Czech and Slovak Republics Hungary and
Poland and also in Croatia and Slovenia corresponding to rapid rebuilding of fertilizer
wwwintechopencom
Constraints and Solutions to Maintain Soil Productivity A Case Study from Central Europe
175
markets in these countries In countries with extensive fertilizersrsquo management the length of
the first phase extended up to mid-90s
The YG evaluation shows that the current nutrient management in CE countries can
overcome this phenomenon especially in the case of wheat and maize A TYG can be most
easily negated in countries belonging to Unbalanced or Balanced nutrient management
groups such as the Czech and Slovak Republics Hungary and Poland and also Croatia and
Slovenia In countries with extensive fertilizersrsquo management the TYG has not been
overcome and enters the third phase of yield development stagnation due to low use of
fertilizers in turn resulting in the very low and unstable level of annually harvested yields
44 Yield prognosis ndash The unassimilated nitrogen concept
The medium or long-term food and environmental policy strategies for any country or
particular region are supported by yield prognosis considered as an operational tool
However the ex-ante prognosis depends on the reliability of the data used Two approaches
both relying on the unit productivity of fertilizer nitrogen (PFPN) have been considered The
first assumes extrapolation of real and improved yields based on the linear model (Reilly amp
Fuglie 1998) The second one is based on long term trends of the YG but transformed into
unit of temporarily lost fertilizer nitrogen termed for the purposes of this study as
unassimilated nitrogen This approach as related to nitrogen management has been used to
make a prognosis of yields of key crops in the CE countries
Operationally the concept presented in this chapter assumes that the total amount of
applied fertilizer nitrogen (FN) is simply divided into three main pools i) assimilated
(FaN) ndash nitrogen taken up by meanwhile grown crop ii) unassimilated nitrogen (FuaN) ndash
temporary out of use by plants andor iii) lost from the field (FLN) The quantitative
assessment of the FuaN pool relies on the defined YG procedure individually related to
each investigated crop
FN = FaN + F uaN + FLN
FuaN = YGcPFPN
where
FuaN ndash unassimilated nitrogen kg N ha-1 YG - yield gap cPFPN ndash the corrected partial factor productivity of applied N kg yield kg N-1
In the first step of yield prognosis the Unassimilated Nitrogen Indices (IuaN) should be computed Therefore the original set of YG data for each of the studied crops was transformed into a quantitative amount of nitrogen lost temporarily from the system marked as minus (-IuaN) In the second step of the analysis both sets of actual (YA) and maximum attainable yields (YM) of each crop were regressed against corresponding set of
uaN indices The obtained regression models clearly show that actual yields over the period of 20 years did not respond significantly to the IuaN as reported in Fig 7 for wheat in Romania The positive and simultaneously significant trends were however achieved when the maximum attainable yield (YM) instead of the actual yield (YA) was introduced into the regression model It can be therefore hypothesized that any virtual loss of nitrogen
wwwintechopencom
Soil Fertility Improvement and Integrated Nutrient Management ndash A Global Perspective
176
ie the negative uaN indices reflect the potential status for a yield increase and vice versa Unfortunately the positive indices of the uaN simply describe a state of N soil mining which in turn causes direct yield decline This is consistent with the opinion of Dibb (2000) and typical for many parts of the world including most CE countries
YM = -0114uaN + 2703 R2 = 093 P lt 0001
0
1
2
3
4
5
6
7
8
9
10
-60 -50 -40 -30 -20 -10 0 10
Gra
in y
ield
(Y
) t
ha-1
YA
YM
Yield
type
Unassimilated nitrogen (uaN) kg N ha-1
Fig 7 Yield prognosis of winter wheat based on residual nitrogen - a case of Romania (RO) Significant (Plt005) linear equation represents the trend for the attainable yields in the 1986-2008 period Legend YA ndash actual yield YM ndash maximum yield
Reliable yield prognosis can be performed assuming a certain level of expected yield or by focusing any improvement of production technology on higher N use efficiency The first approach can be best presented for wheat The maximum attainable yield for this crop in Poland and the Czech Republic is fixed at the level of 65 t ha-1 but for Romania at 45 t ha-1 (Rabbinge amp van Diepen 2000) The amount of uaN required to be incorporated into grain yield was calculated by the models and amounted to 48 27 and 33 kg ha-1 respectively It is equal to 58 27 and 100 of annual N rate applied in these countries and does not seem a realistic approach The same rules refer to other key crops in the study Therefore the second concept relying on the ability of currently cultivated crops to fix an extra amount of
uaN seems to be a more realistic approach for making any reliable yield prognosis (Table 7) This assumption is highly promising especially for countries presenting an extensive type of agriculture production for example Romania The expected wheat increase in response to the use of extra 20 kg N ha-1 is possible considering the water limited yield fixed at 45 t ha-1 The prognosis for the Czech Republic is still below the water limited yield being at 65 t ha-1 In Poland the calculated yields are at the same level as Romania but soils are less suitable for wheat production Therefore any grain yield increase seems to be a great challenge for farmers in all countries of the CE In the light of yields prognosis for sugar beets the fixed level of uaN at 20 kg N ha-1 is generally too low The level of 60 t ha-1 of beets seems to be the most reliable short-term target Thereby the amount of uaN successfully managed should be established at the level of 30 kg ha-1
wwwintechopencom
Constraints and Solutions to Maintain Soil Productivity A Case Study from Central Europe
177
CropCountry Linear regression model Yield at 20 kg uaN t ha-1
Wheat
Croatia YM = -0064 uaN + 3989 for R2 = 096 527
Czech Rep YM = -0063 uaN + 4777 for R2 = 088 604
Poland YM = -0060 uaN + 3623 for R2 = 092 482
Romania YM = -0114 uaN + 2703 for R2 = 093 498
Maize
Croatia YM = -0069 uaN + 4852 for R2 = 086 623
Czech Rep YM = -0064 uaN + 6470 for R2 = 069 776
Poland YM = -0085 uaN + 5431 for R2 = 083 713
Romania YM = -0121 uaN + 3348 for R2 = 094 578
Sugar beets
Croatia YM = -0605 uaN + 40677 for R2 = 089 5278
Czech Rep YM = -0458 uaN + 45872 for R2 = 076 5503
Poland YM = -0609 uaN + 39801 for R2 = 081 5198
Romania YM = -0822 uaN + 24046 for R2 = 093 4049
Table 7 Yield prognosis based on the unassimilated quantity of nitrogen (uaN)
5 Soil productivity improvements The concept of NPK fertilizers balance
The simple comparison of CE countries with respect to nutrient management clearly shows
that annual inputs of nitrogen are too high with respect to phosphorus and potassium
Therefore the main reasons of general yield stagnation in most of the CE countries are long-
term negative balances of P and K caused by low input of both mineral and organic
fertilizers As a consequence of soil P and K long-term mining the percentage share of soils
rich in both nutrients declined in the last two decades below the sufficiency level which was
achieved in many countries in 80s (Csatho at al 2007 Grzebisz amp Fotyma 2007)
It has been clearly stressed that in the transition phase of yield development the PFPN indices
reached the highest values resulting in yield gain This phenomenon emerged in years 1990
1991 for Poland and Hungary and in 1991 1992 for the Czech and Slovak Republics In all
these years the supply of P and K fertilizers was low In the Czech Republic ratios between
amounts of applied N-P-K fertilizers expressed as NP2O5K2O was 1025025 on average
This structure in spite of decreased fertilizersrsquo consumption allowed farmers to achieve the
same yields of all crops as in the period 1986-1990 The present structure of nutrient use is as
1015015 for the Czech Republic and 10404 for Poland These disparate nutrient ratios
stress the importance of NPK balance for high crop production The proposed NPK ratio
for the Czech Republic based on the cPFPN index can be established at the level of
1025025 in good years ie under ample water supply or 1025050 in unfavorable years ie
under expected water stress Hence keeping the current level of fertilizers consumption on
arable land ca 130 kg ha-1 one can predict the right amount of nutrients to apply In Poland
the total amount of currently consumed fertilizers is almost the same as in the Czech
wwwintechopencom
Soil Fertility Improvement and Integrated Nutrient Management ndash A Global Perspective
178
Republic Unfortunately soils in Poland are much poorer in potassium and also in
phosphorus being therefore highly sensitive to external supply of nutrients This
conclusion is corroborated by positive trends of yields in response to P and K fertilizers
application as found for all crops since 1991 onwards Consequently under favorable
weather conditions or on soils naturally rich in potassium the suggested formulation of N-
P-K fertilizers is as follows 1033066 but in years with high probability of drought or on
areas sensitive to drought a slightly different formulation is recommended namely
100510
It is not easy to formulate any efficient fertilizing strategy for Romania Since mid- 90s maize and wheat have shown yield stagnation at a very low level The main factors responsible for this situation are i) low N fertilization rates ii) imbalanced use of P and K fertilizers Therefore yields of these two crops are in fact dependent only on the seasonal weather course fluctuating for ca 100 on a yearly scale basis The main reason is unbalanced consumption of basic fertilizers which leads to permanent soil mining especially potassium The NP2O5K2O relationships averaged for the period 2004-2008 as 1027009 is not sufficient to get any yield increase or even its stabilization Potassium accumulates in plant tissues in much higher amounts and is considered as useful nutrient in water management (Cakmak 2005) Thereby this nutrient seems to be crucial for crop production in Romania even taking into account that almost 50 of land area is covered by soil naturally rich in minerals containing K In spite of low N consumption but unbalanced nutrient management there is still a space for an extra N loss for both key crops ie wheat and maize (see Fig 7) Therefore it could be concluded that any yield increase depends on both significant N rate rise and simultaneous change of fertilizer formulations The operational N-P-K fertilizers ratios suggested for Romania are as follows 1033017 in favorable and 10404 in unfavorable years The second scenario should aim at increasing plant survival under drought conditions
6 Thoughts and prospects
The new era of agriculture development in the Central Europe revealed how actual
agriculture outcomes in this region depend on three key factors presented in descending
order i) weather conditions during the growth season ii) inherent soil fertility iii) nitrogen
fertilizer consumption At present the first factor is decisive for crop production High year-
to-year yield variability reflects the imbalanced use of soil and external resources such as
fertilizers Therefore maximum attainable yields ie limited by water supply for example
for wheat are not attainable in all countries of the region In Germany also part of the
Central European region actual yields are above the ldquowater limitedrdquo level (Rabbinge amp
Diepen 2000 Supit et al 2010)
Inherent differences in the nature of soil quality between the CE countries as a background
of nutrient management are strictly related to the soil origin (Plant et al 2005) Except for
Poland all other countries are relatively rich in soils originated from loams (Cambisols) and
loess (Chernozems) These soils exhibit a high inherent potential for supplying K and other
cations such as calcium and magnesium (Nikolova 1998)
However at present nutritional requirements of high yielding crops most of the CE countries are almost entirely oriented on the third yield forming factor ie nitrogen
wwwintechopencom
Constraints and Solutions to Maintain Soil Productivity A Case Study from Central Europe
179
fertilizer use It has been well recognized that a balanced supply of external sources of slowly mobile elements such as phosphorus and potassium is broadly expected (Atkinson et al 2005 Struik amp Bonciarelli 1997) Consequently the average actual and attainable yields of main crops in CE countries are much more related to the soil-adjusted potential than to amounts of currently applied fertilizers As a result CE countries show at present much greater differences in agricultural production than at the end of the 80s
The observed unfavorable patterns of N fertilizer long-term consumption creates problems not only for agriculture production but are also potentially dangerous for the environment as a potential source of reactive nitrogen (Roberts 2006) There are three main questions to be urgently answered by specialists in all countries of the CE region i) do farmers really recognize an increasing yield gap ii) what is the reason for farmers and their advisory services to tolerate low efficiency of nitrogen iii) do farmers and advisory services recognize environmental aspects of the increasing amount of residual nitrogen In order to get answers to these questions one has to be familiar with factors contributing to the improvement in N fertilizer use efficiency
1 Farm management of N in terms of i) N rate quantification ii) time of N fertilizers application and iii) method of N fertilizers application
2 Management of nutrients responsible for the efficiency of N uptake and it in-plant transformation
3 Management of production factors other than N
The first problem is not only of technical nature because it affects in-season nitrogen use
efficiency and in turn actual yieldsrsquo variability However CE countries representing the
restoration type of yield development but at the same time unbalanced pattern of
consumed fertilizers do not indicate needs for increasing actually applied N rates This
strategy is to some extent the core of yield improvement in countries presenting stagnated
type of fertilizersrsquo management provided that any increase in N use will be compensated by
adequate amounts of applied phosphorus and potassium
It could finally be concluded that the realization of both goals of agricultural production in
the CE countries ie i) long-term yield stabilization and even its increase and ii) unit
productivity of the applied fertilizer N increase in turn decreasing amounts of the residual
N requires in the coming future changes in the structure of fertilizersrsquo consumption
keeping in the Unbalanced group of countries the same level of applied fertilizers The
problem of nutrients supply to a growing plant does not however refer only to the balanced
amounts of the applied fertilizers but also to the crop accessibility to soil natural nutrient
pools This problem is inherently related to conditions of root system growth in the soil
body There are a lot of factors limiting roots accessibility to water and nutrients even in
soils of high natural fertility which have been forgotten in the last 50 years but the most
important is soil acidy and related toxicity of aluminum (Atkinson et al 2005 Diatta et al
2010 Marschner 1991 Struik and Bonciarelli 1997) The key strategic target for farmers is to
increase soil volume directly occupied by plant roots in order to improve their access to
unavailable pools of nutrients Three main areas of soil productivity improvement via
increasing crop plants accessibility to nutrients in the subsoil at least may be considered i)
regulation of soil reaction ii) increase of organic matter content iii) removing of any kind of
hardpans It seems highly probable that in the case of Poland all three groups of measures
wwwintechopencom
Soil Fertility Improvement and Integrated Nutrient Management ndash A Global Perspective
180
are important In other countries of the CE soil acidity should be considered as an
agronomical problem for farmers conducting production on Luvisols
7 References
Atkinson A Black K amp Dawson L (2005) Prospects advantages and limitations of future crop production systems dependent upon the management processes Annals of Applied Biology Vol 146 pp 203-215 ISSN 1744-7348
Batjes H (2002) Carbon and nitrogen stocks in the soils of Central and Eastern Europe Soil Use Management Vol 18 pp 324-329 ISSN 1475-2743
Cakmak I (2005) The role of potassium in alleviating detrimental effects of abiotic stresses in plants Journal of Plant Nutrition Soil Science Vol 168 pp 521-530 ISSN 1436-8730
Catt J (2001) The agricultural importance of loess Earth-Science Reviews Vol 54 pp 213-229 ISSN 0012-8252
Cochrane N (2004) EU Enlargement Implications for US_EU agricultural relations US-EU Food and Agriculture ComaprisonWRS-04-04 78-86 Available online at
httpwwwersusdagovpublicationsWRS0404WRS0404pdf (Access 20110524)
Csatho P Sisak I amp Radimszky L (2007) Agriculture as a source of phosphorus causing eutrophication in Central and Eastern Europe Soil Use management Vol 23 (suppl 1) pp 36-56 ISSN 1475-2743
Csatho P amp Radimszky L (2009) Two Worlds within EU27 Sharp Contrasts in Organic and Mineral Nitrogen-Phosphorus Use Nitrogen-Phosphorus Balances and Soil Phosphorus Status Widening and Deepening Gap between Western and Central Europe Communications in Soil Science and Plant Analysis Vol 40 pp 999-1019 ISSN 0010-3624
Diatta J Bocianowski J amp Skubiszewska A (2010) Sulphate-based aluminum phytotoxicity mitigation under strong soil acidification Fresenius Environmental Bulletin Vol 19 No 12b pp 3185-3192 ISSN 1018-4619
Dibb D (2000) The mysteries (myths) of nutrient use efficiency Better Crops Vol 84 No 3 pp 3ndash5 ISSN 0006-0089
Dobermann A amp Cassman K (2002) Plant nutrient management for enhanced productivity in intensive grain production systems of the United States and Asia Plant and Soil Vol 247 pp 153-175 ISSN 1573-5036
Evans L amp Fisher R (1999) Yield potential its definition measurement and significance Crop Science Vol 39 pp 1544-1551 ISSN 1896-0782
Falloon P amp Betts R (2010) Climate impacts on European agriculture and water management in the context of adaptation and mitigation ndash the importance of integrated approach Science of Total Environment Vol 408 pp 5667-5687 ISSN 0048-9697
FAOSTAT Available online at httpfaostatfaoorgdefaultaspx (Access 20110524) Fixen P (2004) Phases in narrowing the yield gap Better Crops Vol 88 No 4 p 3 ISSN
0006-0089 Fronzek S amp Carter T (2007) Assessing uncertainties in climate change impacts on
resource potential for Europe based on projections from RCMs and GCMs Climate Change Vol 81 pp 357-371 ISSN 1758-6798
wwwintechopencom
Constraints and Solutions to Maintain Soil Productivity A Case Study from Central Europe
181
Grzebisz W amp Fotyma M (2007) Recommendations and use of potassium fertilizers in Central-Eastern Europe (CEE) In Proceedings International Fertiliser Society No 621 York UK pp 24 ISBN 978-0-85310-258-8
Grzebisz W Diatta J amp Haerdter R (2010) Fertilizer consumption patterns in Central European countries ndash effect on actual yield development trends in 1986-2005 years - a comparative study of the Czech Republic and Poland Journal of Central European Agriculture Vol 11 No 1 pp 73-82 ISSN 1332-9049
IFADATA Statistics online (2011) wwwfertilizerorgifastatisticsifadata datalineasp (Access 20110524)
Jongman R Bunce R amp Metzger R (2006) Objectives and applications of a statistical environmental stratification of Europe Landscape Ecology 21 409-419 ISSN 1572-9761
Karlen D Ditzler C amp Andrews S (2003) Soil quality why and how Geoderma Vol 114 pp 145-156 ISSN 0016-7061
Kelch D amp Osborne S (2001) Crop production capacity in EuropePrime Economic Research ServiceUSDA Agricultural outlookMarch 2001 19-23 ISSN 0099-1066
Marschner H (1991) Mechanisms of adaptation of plants to acid soils Plant and Soil 134 1-20 ISSN 1573-5036
Neumann K Verburg P amp Stehfest E (2010) The yield gap of global production a spatial analysis Agricultural Systems Vol 103 pp 316-326 ISSN 0308-521X
Nikolova M (1998) The soil potassium resources and the efficiency of potassium fertilizers in Bulgaria Nikola Poushkarow Inst of Soil Science and Agroecology Sofia Bulgaria IPI Country Report 12 39 pp
Olesen J amp Bindi M (2002) Consequences of climate change for European agricultural productivity land use and policy European Journal of Agronomy Vol 16 pp 239-262 ISSN 1161-0301
Olesen J Trnka M amp Kersebaum K (2011) Impacts and adaptation of European crop production systems to climate change European Journal of Agronomy Vol 34 pp 96-112 ISSN 1161-0301
Plant J Whittaker A amp Demitriades B (2005) The geological and tectonic framework of Europe Geochemical Atlas of Europe Part 1 Background Information Methodology Ed Salminen R Maps GTK FOREGS 20 pp ISBN 951-690-956-6
Rabbinge R (1993) The ecological background of food production In Crop protection and sustainable agriculture Wiley Chichester (Ciba Foundation Symposium 177 2-29 ISBN 10 0471939447
Rabbinge R amp Diepen C (2000) Changes in agriculture and land use in Europe European Journal of Agronomy Vol 13 pp 85-100 ISSN 1161-0301
Reilly J Fuglie K (1998) Future yield growth in field crops what evidence exists Soil amp Tillage Research Vol 47 pp 275-290 ISSN 0168-1987
Roberts T (2006) Improving Nutrient Use Efficiency Proceedings of the IFA Agriculture Conference Optimizing Resource Use Efficiency for Sustainable Intensification of Agriculture 27 february-2 March 2006 Kunming China pp 8
Rosegrant M Paisner M amp Meijer S (2001) Global Food Projections to 2020 Emerging trends and alternative futures IFPRI pp 206 ISBN 0-89629-640-7
wwwintechopencom
Soil Fertility Improvement and Integrated Nutrient Management ndash A Global Perspective
182
Sinclair T Purcell L amp Sneller C (2004) Crop transformation and the challenge to increase yield potential Trends in Plant Science Vol 9 No 2 pp 70-75 ISSN 136085
Struik P amp Bonciarelli F (1997) Resource use at the cropping system level European Journal of Agronomy Vol 7 pp 133-143 ISSN 1161-0301
Supit I van Diepen C amp de Wit A (2010) Recent changes in the climatic yield potential of various crops in Europe Agricultural Systems Vol 103 pp 683-694 ISSN 0308-521X
wwwintechopencom
Soil Fertility Improvement and Integrated Nutrient Management - AGlobal PerspectiveEdited by Dr Joann Whalen
ISBN 978-953-307-945-5Hard cover 306 pagesPublisher InTechPublished online 24 February 2012Published in print edition February 2012
InTech EuropeUniversity Campus STeP Ri Slavka Krautzeka 83A 51000 Rijeka Croatia Phone +385 (51) 770 447 Fax +385 (51) 686 166wwwintechopencom
InTech ChinaUnit 405 Office Block Hotel Equatorial Shanghai No65 Yan An Road (West) Shanghai 200040 China
Phone +86-21-62489820 Fax +86-21-62489821
Soil Fertility Improvement and Integrated Nutrient Management A Global Perspective presents 15 invitedchapters written by leading soil fertility experts The book is organized around three themes The first theme isSoil Mapping and Soil Fertility Testing describing spatial heterogeneity in soil nutrients within natural andmanaged ecosystems as well as up-to-date soil testing methods and information on how soil fertility indicatorsrespond to agricultural practices The second theme Organic and Inorganic Amendments for Soil FertilityImprovement describes fertilizing materials that provide important amounts of essential nutrients forplantsThe third theme Integrated Nutrient Management Planning Case Studies From Central Europe SouthAmerica and Africa highlights the principles of integrated nutrient management Additionally it gives casestudies explaining how this approach has been implemented successfully across large geographic regionsand at local scales to improve the productivity of staple crops and forages
How to referenceIn order to correctly reference this scholarly work feel free to copy and paste the following
Witold Grzebisz and Jean Diatta (2012) Constraints and Solutions to Maintain Soil Productivity A Case Studyfrom Central Europe Soil Fertility Improvement and Integrated Nutrient Management - A Global PerspectiveDr Joann Whalen (Ed) ISBN 978-953-307-945-5 InTech Available fromhttpwwwintechopencombookssoil-fertility-improvement-and-integrated-nutrient-management-a-global-perspectiveconstraints-and-solutions-to-maintain-soil-productivity-a-case-study-from-central-europe
copy 2012 The Author(s) Licensee IntechOpen This is an open access articledistributed under the terms of the Creative Commons Attribution 30License which permits unrestricted use distribution and reproduction inany medium provided the original work is properly cited
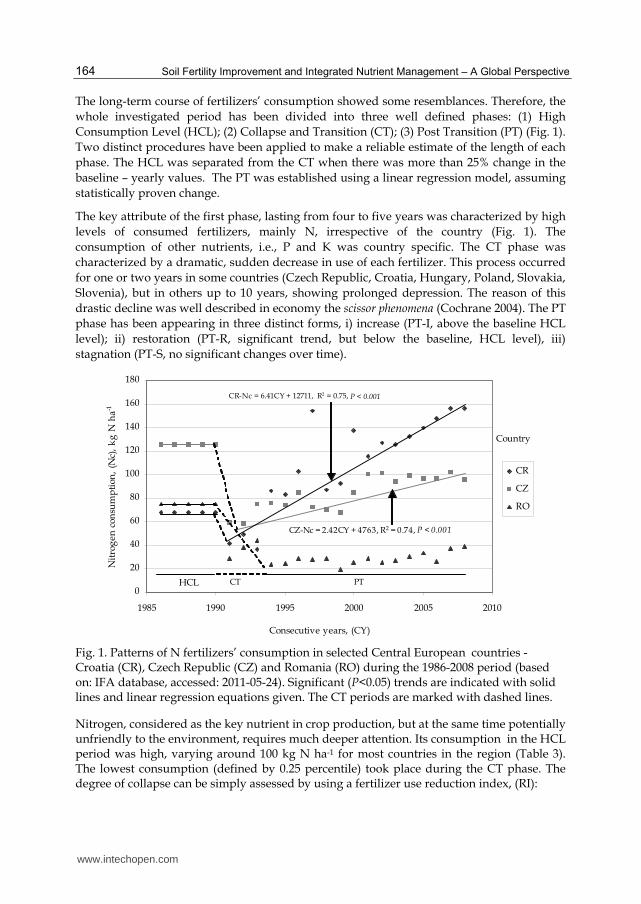
Soil Fertility Improvement and Integrated Nutrient Management ndash A Global Perspective
164
The long-term course of fertilizersrsquo consumption showed some resemblances Therefore the
whole investigated period has been divided into three well defined phases (1) High
Consumption Level (HCL) (2) Collapse and Transition (CT) (3) Post Transition (PT) (Fig 1)
Two distinct procedures have been applied to make a reliable estimate of the length of each
phase The HCL was separated from the CT when there was more than 25 change in the
baseline ndash yearly values The PT was established using a linear regression model assuming
statistically proven change
The key attribute of the first phase lasting from four to five years was characterized by high
levels of consumed fertilizers mainly N irrespective of the country (Fig 1) The
consumption of other nutrients ie P and K was country specific The CT phase was
characterized by a dramatic sudden decrease in use of each fertilizer This process occurred
for one or two years in some countries (Czech Republic Croatia Hungary Poland Slovakia
Slovenia) but in others up to 10 years showing prolonged depression The reason of this
drastic decline was well described in economy the scissor phenomena (Cochrane 2004) The PT
phase has been appearing in three distinct forms i) increase (PT-I above the baseline HCL
level) ii) restoration (PT-R significant trend but below the baseline HCL level) iii)
stagnation (PT-S no significant changes over time)
0
20
40
60
80
100
120
140
160
180
1985 1990 1995 2000 2005 2010
Consecutive years (CY)
Nit
rog
en c
onsu
mp
tion
(N
c)
kg
N h
a-1
CR
CZ
RO
Country
HCL CT PT
CR-Nc = 641CY + 12711 R2 = 075 P lt 0001
CZ-Nc = 242CY + 4763 R2 = 074 P lt 0001
Fig 1 Patterns of N fertilizersrsquo consumption in selected Central European countries - Croatia (CR) Czech Republic (CZ) and Romania (RO) during the 1986-2008 period (based on IFA database accessed 2011-05-24) Significant (Plt005) trends are indicated with solid lines and linear regression equations given The CT periods are marked with dashed lines
Nitrogen considered as the key nutrient in crop production but at the same time potentially unfriendly to the environment requires much deeper attention Its consumption in the HCL period was high varying around 100 kg N ha-1 for most countries in the region (Table 3) The lowest consumption (defined by 025 percentile) took place during the CT phase The degree of collapse can be simply assessed by using a fertilizer use reduction index (RI)
wwwintechopencom
Constraints and Solutions to Maintain Soil Productivity A Case Study from Central Europe
165
RI = [1- (025P09P) 100]
where 025P and 09P are the 25th and 90th percentiles of fertilizer consumption over the period 1986-2008
Fertilizer N management in CE during the PT phase relies on consumption trends evaluated for a period of 18 years ie since 1991 onwards On the basis of elaborated regression models countries of the region have been divided into three defined groups
1 Increase (PT-I) Croatia Slovenia 2 Restoration (PT-R) Czech Republic Hungary Poland Slovakia Slovenia 3 Stagnation(PT-S) Albania Bosnia amp Herzegovina Macedonia Bulgaria Romania
Serbia amp Montenegro
Phosphorus is a nutrient of basic importance for any crop plant because all seed crops are highly sensitive to its deficiency during the onset of ripening In the HCL phase the consumption of P fertilizers was in the range of ca 35 to 95 kg P2O5 ha-1 (Table 3) During the period of study its use underwent a great mostly negative change Its consumption trends evaluated for years 1991-2008 showed much greater variability compared to N fertilizersrsquo use in CE countries
1 Increase Croatia Slovenia 2 Restoration Poland Hungary Macedonia 3 Stagnation Albania Czech Slovakia Serbia amp Montenegro 4 Recession Bosnia amp Herzegovina Bulgaria Romania
The occurrence of the fourth group stresses the fact that P fertilizersrsquo consumption was below the levels required to support current crop production leading to nutrient mining in three countries of the region
Potassium is generally considered as a nutrient significantly affecting water management in plants during their life cycle (Cakmak 2005) Therefore this nutrient requires special care on farm in regions like CE that experience frequent drought during the vegetative growth period (Falloon amp Betts 2010) Potassium fertilizersrsquo consumption during the HCL period varied among countries of the region from ca 5 kg K2O ha-1 (Albania) to more than 100 kg K2O ha-1 (former Czechoslovakia) (Table 3) As in the case of P the greatest decline in K consumption occurred in countries significantly increasing the use of nitrogen like the Czech and Slovak Republics and also Hungary (estimated from the potassium fertilizer use reduction index RIK)
The second indicator of fertilizer management is in the proportions of macronutrients consumed indicated during the study by the PN and KN ratios The PN ratio did not show a clear trend for two countries Albania and Bosnia amp Herzegovina In other countries negative tendencies were detected appearing as the increasing value of PN ratio meaning that proportionately more N fertilizer than P fertilizer was applied by farmers This process took place mainly during CT and PT phases Its course during the PT phase outlines three decisive patterns of P fertilizersrsquo management
a negative Czech Republic Croatia Serbia amp Montenegro Romania b positive Hungary Macedonia Poland c stagnation Slovakia
wwwintechopencom
Soil Fertility Improvement and Integrated Nutrient Management ndash A Global Perspective
166
The first trend covers the whole study period differing only in the annual rate of decrease
as indicated by the coefficient of the linear regression equation In the case of Romania it
was almost four times faster than for Croatia (Fig 2) The second pattern occurred in
countries like Hungary and Poland showing a slightly positive trend since 1991
Trends of KN ratios show similar patterns as described for PN ratios (Fig 3) Three
patterns of ratios can be also distinguished but comprising different sets of countries
a negative Macedonia Slovenia
b positive Hungary
c stagnation Croatia Czech Poland Slovakia Bulgaria and Romania (since 1993) Serbia
amp Montenegro (since 2000)
All above-described attributes of long-term fertilizersrsquo consumption were evaluated in Table 4
to develop a ranking based on three types of nutrient management in CE countries as
follows
1 Extensive generally showing low consumption of all fertilizers including N the most
negative attribute is the low P and K inputs leading to crop plants reliance on inherent
soil P and K supply and potentially leading to nutrient mining (Albania Bulgaria
Macedonia Serbia amp Montenegro Romania)
2 Unbalanced high consumption of fertilizer N but at the same time not balanced by
adequate use of other nutrients such as P and K at least (Croatia Czech Slovakia
Slovenia)
3 Balanced high consumption of N fertilizer which is in part balanced by relatively high
consumption of P and K fertilizers (Hungary Poland)
0
01
02
03
04
05
06
07
08
1985 1990 1995 2000 2005 2010
Consecutive years CY
PN
rel
atio
nsh
ip
P
N
CR
PL
RO
Country
PN1-PL = -0053CY + 1076 R2 = 081 P lt 0001
PN2-PL = 0006CY ndash 105 R2 = 038 P lt 001
PN-CR = -0005CY + 105 R2 = 032 P lt 0001
PN-RO = -0019CY + 374 R2 = 081 P lt 0001
Fig 2 Typical patterns of PN ratios in selected Central European countries - Croatia (CR) Poland (PL) and Romania (RO) during the period 1986-2008 Significant (Plt005) negative linear equations are shown for CR and RO while the PL data fitted to a negative linear equation in the period 1986-1996 and thereafter showed a positive linear relationship
wwwintechopencom
Constraints and Solutions to Maintain Soil Productivity A Case Study from Central Europe
167
0
01
02
03
04
05
06
07
08
09
1985 1990 1995 2000 2005 2010
Consecutive years CY
KN
rel
atio
nsh
ip
K
N
CR
PL
RO
Country KN1-PL = -0066CY + 1323 R2 = 070 P lt 001
KN1-RO = -0044CY + 873 R2 = 083 P lt 0001
Fig 3 Typical patterns of KN ratios in selected Central European countries - Croatia (CR) Poland (PL) and Romania (RO) in the period 1986-2008 Significant (Plt005) negative linear equations are shown for CR and RO in the 1986-1992 period thereafter showed non-significant trends For CR the KN trend was non-significant for the whole period
Estimated Parameters
Country3
AL BampH BU CR CZ HU MC PL RO SampM SK SL
Nitrogen 01 0 0 ++ + + 0 + 0 0 + +-
Phosphorus 0 - - ++ 0 + + + - 0 0 +-
Potassium 0 0 0 ++ 0 + 0 + 0 0 0 0
PN 0 0 0 - - + 0 ++ - 0 0 -
KN 0 0 0 0 0 + - 0 0 0 0 -
Ranking2 0 0 0 2 2 1 0 1 0 0 2 2
1evaluation of trends ++ - increase +- restoration 0 - stagnation - - decrease +- - time variable 2 fertilizer management ranking 0 ndash extensive 1 ndash balanced 2 ndash unbalanced 3 Country acronyms are provided in Table 1
Table 4 Fertilizer consumption trends ndashsummary and country management ranking for countries in Central Europe during the period 1986 to 2008
32 Soil fertility status
Soil is considered as a slowly renewable or non-renewable resource that requires the same
level of protection as other limited resources like phosphorus rock There is strong
agreement that productivity of arable land depends on both a soilrsquos fertility potential (soil
quality inherent soil fertility) and present state of soil properties (soil health) to sustain
wwwintechopencom
Soil Fertility Improvement and Integrated Nutrient Management ndash A Global Perspective
168
primary production and other ecological functions The minimum data set to describe
current fertility status of arable land ie soil health should contain indicators reflecting
both past and actual organic matter content soil pH and management of nutrient soil
resources (Atkinson et al 2005 Karlen et al 2003)
Total organic carbon (TOC) stock in the topsoil (00-03 m) or its content () in arable soils is
a good descriptor of short-term trends in soil organic matter (SOM) management However
the organic carbon stock measured to a depth of 1 m in the soil profile can be considered as
an indicator of soil fertility potential The actual content of TOC in an averaged arable soil
unit was calculated by weighted mean content of organic carbon for main soil types (Batjes
2002) and its percentage share in the soil cover for each CE country (see Table 1) Analysis of
this data showed that TOC in the average topsoil unit of CE countries is insufficient ranging
from ca 60 (Poland) to 80 (Hungary) t TOC ha-1 ie about 14 to 18 TOC Differences
between CE countries can be evaluated by TOC stock in the soil profile to a depth of 1 m
Based on this criterion countries can be classified into three groups
a low ( le 120 t TOC ha-1) Croatia Poland b medium (121-160 t TOC ha-1 ) Albania Bulgaria Czech Republic Macedonia
Romania Serbia amp Montenegro Slovakia Slovenia c high (gt 161 t TOC ha-1) Hungary
Phosphorus and Potassium are key nutrients for achieving high productivity of arable soils
Available resources of both nutrients are the most important indicators of soil health ie its
current productivity The country status of current soil nutrient management was evaluated
by means of soil fertility index (SFI) expressed as the sum of the percentage share of arable
land characterised by the very high high and half of medium rating of available P or K
(Grzebisz amp Fotyma 2007) It has been assumed that SFI for P and K exceeding 70 of
arable land share is a prerequisite for high yield of any crop In the 1980s this target was
achieved in many countries of the region like Czechoslovakia Hungary and some countries
of the former Yugoslavia (Serbia amp Montenegro Slovenia) (Fig 4) In these countries the
rates of applied fertilizers were far in excess of crop removal capacity Poland in spite of
currently high K consumption differs from other CE countries The sufficiency level for P
and K of 70 was never reached due to much lower inherent soil potential for nutrient
supply At the beginning of 2000 significant changes of P and K fertility were recorded The
increase of the P sufficiency level was recorded only in Slovenia and Poland In Slovenia the
reason was high consumption of P fertilizers at the beginning of the 21st century In Poland
the increase is related to sufficiently well balanced use of N and P fertilizers and slightly
lower yields than in the 80s In all other CE countries the percentage of P-fertile soils
generally decreased nevertheless the rate of the decrease differed across the region A
slight decrease occurred in Czech and Slovak Republics as well as in Hungary The greatest
drop was recorded in Bulgaria followed by Serbia and Montenegro The potassium SFI
presents much more alarming trend As reported by Grzebisz amp Fotyma (2007) for countries
of the Northern Agricultural Zone (Czech Hungary Poland Slovakia) the K sufficiency
level decreased below the target value within two decades Based on K fertilizersrsquo
consumption trends it can be assumed that the same trend occurs also in the Southern
Zone
wwwintechopencom
Constraints and Solutions to Maintain Soil Productivity A Case Study from Central Europe
169
0
10
20
30
40
50
60
70
80
90
100
AL BU CZ H PL RO SE SK SL
Countries
P s
oil
fert
ility
in
de
x
A
L
1980s
2000s
Sufficiency level
Fig 4 Phosphorus soil fertility indices (expressed as the percentage of arable land AL) for selected CE countries during the period 1986 - 2008 (based on Csatho et al 2007) The sufficiency level was assumed to be 70 as described by Grzebisz amp Fotyma (2007) Country acronyms are given in Table 1
4 Soil productivity assessment
41 Long-term trends in crop yields
All CE countries grow the same crops and cereal species predominate The area sown with cereals occupies 64 of arable land in Croatia 52 - in the Czech Republic 68 - in Poland and 59 ndash in Romania In the Czech Republic cerealsrsquo production is dominated by wheat and barley but in Poland by wheat and rye In Romania and Croatia maize is the key grain crop Sugar beets due to EU regulation in the last 10 years are of minor importance but this crop is a good indicator of soil quality Therefore it has been assumed that these crops would reflect fairly well changes in current soil fertility status as a consequence of applied nutrient management strategies This assumption is well documented by observed variability of yields of wheat maize and sugar beets in selected countries of CE (Table 5) The highest variability was found for Romania and the lowest for Poland Romania is a country with an extensive pattern of fertilizersrsquo management typical in the Southern Agricultural Zone of Europe Poland belongs to countries of the Northern Zone but presents a balanced patterns of fertilizersrsquo management (Poland Hungary) Other selected countries are members of the Unbalanced fertilizing group of CE countries
The long-term yield trend can be used as an indicator of key crops sensitivity to past and current fertilizersrsquo management As in the case of fertilizersrsquo consumption trends three consecutive phases of yield development over the period 1986-2008 may be distinguished
1 Actual-Standard (AS) 2 Recession (RC) 3 Restoration (RS) or Stagnation (SG)
The observed trends of harvested yields were most pronounced for wheat other cereals and for seed crops like oil-seed rape (Grzebisz et al 2010) In the first phase of the study taking
wwwintechopencom
Soil Fertility Improvement and Integrated Nutrient Management ndash A Global Perspective
170
place at the end of the 80s yields of wheat reached on average the highest recorded levels Therefore this particular period is considered as a standard level (AS) for evaluating subsequent phases (Fig 5) The highest yield decline ie the recession phase (RC) in response to the collapse in fertilizer consumption took place in the Northern Zone but
Crops Croatia Czech Republic Poland Romania
x plusmn SD5 CV6 x plusmn SD CV x plusmn SD CV x plusmn SD CV
Wheat 40plusmn052
39plusmn033
44plusmn094
125
86
216
48plusmn05
51plusmn04
52plusmn06
102
78
113
36plusmn03
37plusmn02
39plusmn04
90
56
100
27plusmn06
31plusmn04
29plusmn08
212
141
265
Maize 49plusmn10
40plusmn09
55plusmn13
205
217
229
58plusmn13
51plusmn05
69plusmn05
214
93
76
52plusmn08
49plusmn02
56plusmn08
143
41
157
31plusmn08
29plusmn05
34plusmn11
244
180
315
Sugar
beet
404plusmn77
398plusmn49
487plusmn52
192
123
108
424plusmn76
345plusmn15
531plusmn49
180
42
49
381plusmn55
346plusmn19
451plusmn39
145
56
88
228plusmn51
213plusmn29
304plusmn33
222
136
108
1FAOSTAT available online 2011-05-24 21986-2008 31986-1990 42004-2008 5standard deviation 6coefficient of variation
Table 5 Statistical overview of key cropsrsquo yields (t ha-1) in selected Central European
countries during the period 1986-2008 in comparison to the AS phase and the 2004-2008
periods
0
1
2
3
4
5
6
7
1985 1990 1995 2000 2005 2010
Consecutive years CY
Gra
in y
ield
(Y
) t
ha-1
CZ
RO
Country
AS RC RE or ST
Y-CZ = 0056CY + 1089 R2 = 028 P lt 005
TYG
TYG
Legend level of harvested yield AS Actual-Standard RC Recession RE Restoration ST Stagnation
Dashed line refers to AS level of yield ie an average yield harvested in the period 1986-1990 TYG
Temporary Yield Gap
Fig 5 Long-term trends of wheat production in the Czech Republic (CZ) and Romania (RO)
during the period 1986-2008 Significant (Plt005) positive linear trend is shown for the
Czech Republic whereas non-significant for Romania in the period 1992-2008
wwwintechopencom
Constraints and Solutions to Maintain Soil Productivity A Case Study from Central Europe
171
lasted for only two or three years In other countries mainly representing the Southern Zone it was also fast or showed sustained depression The third phase of yield development was manifested in two distinct trends The first ldquorestorationrdquo trend has shown a positive yield gain since yield recession It was revealed in the Northern Zone countries and also for Croatia and Slovenia The second trend has not shown any significant change in yield since the recession resulting in yield stagnation The most interesting attribute of this trend is its high year-to-year variability The difference between the actually harvested and the AS yield has been termed as the temporary yield gap (TYG) (Fig 5) The time required to recover to the AS level was long but country specific In the Northern Zone it lasted for ca 10-12 years exceeding the AS level in 2004 or 2005 In most other countries representing the Southern Zone it has not been reached up to 2008 For maize and sugar beets the recession was also observed In the recovery period maize yields were generally positive but the rate of the yield increase was much higher in the Balanced and Unbalanced groups than in the Extensive group Sugar beets yield increase was very high at the beginning of the 90s exceeding the level reported in the 80s The main reason was a reduction in area sown with sugar beets which forced farmers to cultivate this crop on more fertile soils
42 The concept of partial factor fertilizer nitrogen productivity (PFPN)
This part of the study relies on two main conceptual pillars The first one assumes that each hectare of arable soil regardless of the current crop is supplied with the same amount of nutrients including nitrogen The second assumption takes into account the fact that the unit productivity of in-season applied fertilizer N known as PFPN is a reliable scientific tool to make simple but quick discrimination of factors limiting attainable crop yield (Dobermann amp Casman 2002) Therefore the PFPN index was used to evaluate some but selected CE countries that represent the three patterns of current fertilizer management (Table 4) Croatia and the Czech Republic have been selected as examples for the Unbalanced group whereas Poland is the Balanced group and Romania represents the Extensive group of fertilizersrsquo use
The PFPN index was obtained by dividing the actual yield of a respective crop harvested within a given year by the annual amount of N fertilizers consumed by the country assuming it was applied at an equal rate for all currently cultivated crops Operationally the PFPN index consists of two components
a yield of crop (Y) expressed in kg or t ha-1 b nitrogen fertilizer rate (FN) expressed as kg N ha-1
PFPN = YFN
Based on the long-term trends of PFPN indices for each of the key crops two different types of PFPN indices can be distinguished
1 The real partial factor productivity of applied N ndash (rPFPN) it reflects actual yields as limited by both water and N availability
2 The maximal partial factor productivity of applied N (mPFPN) it was calculated as the 4th quartile of rPFPN indices it refers to yields obtained under ample water supply
To make a reliable estimate of the yield gap for some crops cultivated in the CE the corrected partial factor productivity of applied N (cPFPN) instead of mPFPN has been applied
wwwintechopencom
Soil Fertility Improvement and Integrated Nutrient Management ndash A Global Perspective
172
Operationally it has been calculated as the average of the 4th quartile but excluding extremely elevated rPFPN values which emerged in most of investigated countries at the beginning of the 90s Indices of N productivity (PFPN rPFPN and cPFPN) were then used to calculate the yield gap
The calculated rPFPN indices showed as expected high year-to-year variability for all tested crops (Table 6) They were crop and country specific when averaged over the 1986-2008 period
a wheat CR lt CZ = PL lt RO b maize CR lt CZ lt PL lt RO c sugar beets CR = CZ lt PL lt RO
These ranges are not in line with long-term average yields of all crops which followed generally the order CZ gt CR gt PL gt RO
Maximum productivity of tested crops as evaluated for the 4th quartile of rPFPN indices was
much higher rising on average by 43 However the increase was country specific and
represents 63 for Croatia 28 for the Czech Republic 30 for Poland and 48 for
Romania The concept of mPFPN assumes an increase of rPFPN indices pursuant to higher
efficiency of applied fertilizer nitrogen due to ample water supply Its reliability has been
corroborated by low coefficients of variation implicitly indicating the potential productivity
of applied fertilizer nitrogen on the background of soil quality The sequences of countries
for each crop are as follows
a wheat CZ = PL lt CR lt RO b maize CR = CZ lt PL lt RO c sugar beets CZ lt PL lt CR lt RO
As presented in Table 6 coefficients of variations of cPFPN indices were significantly lower in comparison to mPFPN stressing on the reliability of the conducted analysis
Relationships between sets of developed rPFPN and applied fertilizer nitrogen rates can also be a useful tool for making long-term assessment of nitrogen efficiency This relationship fits the best the power function
rPFPN = 9112N-067 for R2 = 077 and n = 92
where N ndash annual rate of fertilizer nitrogen consumption kg N ha-1
Analysis of the general curve shape reveals decreasing yield per unit of N fertilizer applied with highest values of rPFPN It has been observed that irrespective of the applied N rate long-term productivity of fertilizer nitrogen increased in the order Romania lt Poland lt Croatia lt the Czech Republic However the obtained high rPFPN values are as a rule related to lower yields of harvested crops This pattern of crop response refers mostly to Bulgaria Romania and former Yugoslavia countries excluding Croatia and Slovenia As pointed out by Fixen (2004) the target of efficient N fertilizer management based on high fertilizer N use efficiency is counter-productive In this N supply system plants are forced to take up an appreciable amount of N from its soil resources which decreases their rate of growth in critical stages of yield performance Therefore ldquothe elevatedrdquo level of the PFPN could be used as an attribute of the extensive type of agriculture production
wwwintechopencom
Constraints and Solutions to Maintain Soil Productivity A Case Study from Central Europe
173
PFPN
index
Croatia Czech Republic Poland Romania
x plusmn SD1 CV2 x plusmn SD CV x plusmn SD CV x plusmn SD CV
Wheat kg yield kg N-1
rPFPN 48plusmn24 498 54plusmn13 235 54plusmn15 275 81plusmn33 405
mPFPN 80plusmn23 288 70plusmn11 160 72plusmn15 212 121plusmn14 119
cPFPN 63plusmn11 174 62plusmn4 59 62plusmn2 30 112plusmn8 69
Maize kg yield kg N-1
rPFPN 56plusmn26 464 66plusmn18 281 78plusmn21 263 95plusmn45 478
mPFPN 89plusmn29 288 89plusmn7 76 103plusmn11 102 149plusmn20 135
cPFPN 69plusmn10 151 89plusmn7 76 96plusmn2 24 137plusmn9 66
Sugar beets kg yield kg N-1
rPFPN 471plusmn224 477 478plusmn120 250 566plusmn136 240 695plusmn266 383
mPFPN 766plusmn218 285 588plusmn49 825 728plusmn67 93 977plusmn122 125
cPFPN 613plusmn86 141 588plusmn49 825 675plusmn35 52 905plusmn36 40
1standard deviation 2coefficient of variation
Table 6 Partial factor fertilizer N productivity statistics for key crops in selected Central European countries with unbalanced (Croatia Czech Republic) balanced (Poland) and extensive (Romania) fertilizersrsquo management during the period 1986-2008
43 Yield gap (YG) and its attributes
Actual yields of crops harvested by farmers in all areas of the world are much lower than
the yield potential of currently cultivated varieties under defined soil and climatic
conditions This ldquovirtualrdquo un-harvested portion of yield is generally termed the yield gap
(YG) (Evans amp Fisher 1999 Dobermann amp Cassman 2002) However the CE countries
experience another phenomenon known as the temporary yield gap (TYG) (Grzebisz et al
2010) The main reason of its emergence is the collapse in fertilizer use leading to elevation
of the rPFPN index Dibb (2000) relates extremely high N efficiency to low yield and this
trend was fully corroborated by the crop yield data from countries with extensive fertilizer
management Nevertheless the countries of the Northern Agricultural Zone (Czech
Republic Hungary Poland Slovakia) in spite of drastic decrease of consumed fertilizers in
the early 90s were characterized by high yields of wheat and other cereal crops (FAOSTAT
2011 Grzebisz et al 2010) The observed rPFPN indices extremely elevated at the beginning
of the 90s were a result of the residual effect of applied fertilizer N This phenomenon could
be manifested only under growth conditions created by ample water and sufficiently high
supply of immobile nutrients such as P and K in turn balancing N use by currently growing
crops
In the first step of yield gap calculation the cPFPN index was applied to assess the maximal
attainable yield (YAM) The yield gap was then calculated as a difference between really
harvestable yield (YA) and YAM
wwwintechopencom
Soil Fertility Improvement and Integrated Nutrient Management ndash A Global Perspective
174
YAM = cPFPN middot DN
YG = YA ndash YAM
where
DN is the rate of annually applied fertilizer N (kg N ha-1) YA is the actual yield in t ha-1 for a
given year and YAM is the maximal attainable yield (t ha-1)
The observed similarities of the general yield gap pattern over time for key crops allow to
distinguish three consecutive phases of its development in the period 1986-2008 (Fig 6)
1 First ndash primary deep yield gap to the left of the transition point (TP) 2 Second ndash point of extra yield gain TP 3 Third- secondary yield gap to the right of the TP alternatively yield gap stagnation as
indicated by the lack of significant (P lt 005) linear trend response
-7
-6
-5
-4
-3
-2
-1
0
1
2
1985 1990 1995 2000 2005 2010
Consecutive years CY
Yie
ld g
ap
(Y
G)
t h
a-1
CZ
RO
TP
YGd-CZ = 079CY - 1573 R2 = 070 P lt 001
YGd-RO = 068CY - 1354 R2 = 072 P lt 0001
YGr-CZ = -012CY + 2354 R2 = 046 P lt 0001
Country
Legend TP - Transition Point YGd - yield gap decline YGr - yield gap restoration
Fig 6 Evolution of the yield gap in wheat in the Czech Republic (CZ) and Romania (RO) during the period 1986 -2008 Significant (Plt005) positive linear equations are shown for the Czech Republic in the period 1986-92 and for Romania in the period 1986-1995 thereafter showed a negative linear relationship for the Czech Republic and non-significant trend for Romania
Wheat is the best example of the yield gap course in the CE countries stressing on the
difference in fertilizer management The main dissimilarities among countries do not refer
to the first phase The YG was deep in spite of relatively high yield indicating thus a low
capacity of contemporary cultivated varieties to achieve further gains in yield Much more
important were YG length and number of years to reach the TP The time to reach the TP
was shorter (6(7) years) in countries such as the Czech and Slovak Republics Hungary and
Poland and also in Croatia and Slovenia corresponding to rapid rebuilding of fertilizer
wwwintechopencom
Constraints and Solutions to Maintain Soil Productivity A Case Study from Central Europe
175
markets in these countries In countries with extensive fertilizersrsquo management the length of
the first phase extended up to mid-90s
The YG evaluation shows that the current nutrient management in CE countries can
overcome this phenomenon especially in the case of wheat and maize A TYG can be most
easily negated in countries belonging to Unbalanced or Balanced nutrient management
groups such as the Czech and Slovak Republics Hungary and Poland and also Croatia and
Slovenia In countries with extensive fertilizersrsquo management the TYG has not been
overcome and enters the third phase of yield development stagnation due to low use of
fertilizers in turn resulting in the very low and unstable level of annually harvested yields
44 Yield prognosis ndash The unassimilated nitrogen concept
The medium or long-term food and environmental policy strategies for any country or
particular region are supported by yield prognosis considered as an operational tool
However the ex-ante prognosis depends on the reliability of the data used Two approaches
both relying on the unit productivity of fertilizer nitrogen (PFPN) have been considered The
first assumes extrapolation of real and improved yields based on the linear model (Reilly amp
Fuglie 1998) The second one is based on long term trends of the YG but transformed into
unit of temporarily lost fertilizer nitrogen termed for the purposes of this study as
unassimilated nitrogen This approach as related to nitrogen management has been used to
make a prognosis of yields of key crops in the CE countries
Operationally the concept presented in this chapter assumes that the total amount of
applied fertilizer nitrogen (FN) is simply divided into three main pools i) assimilated
(FaN) ndash nitrogen taken up by meanwhile grown crop ii) unassimilated nitrogen (FuaN) ndash
temporary out of use by plants andor iii) lost from the field (FLN) The quantitative
assessment of the FuaN pool relies on the defined YG procedure individually related to
each investigated crop
FN = FaN + F uaN + FLN
FuaN = YGcPFPN
where
FuaN ndash unassimilated nitrogen kg N ha-1 YG - yield gap cPFPN ndash the corrected partial factor productivity of applied N kg yield kg N-1
In the first step of yield prognosis the Unassimilated Nitrogen Indices (IuaN) should be computed Therefore the original set of YG data for each of the studied crops was transformed into a quantitative amount of nitrogen lost temporarily from the system marked as minus (-IuaN) In the second step of the analysis both sets of actual (YA) and maximum attainable yields (YM) of each crop were regressed against corresponding set of
uaN indices The obtained regression models clearly show that actual yields over the period of 20 years did not respond significantly to the IuaN as reported in Fig 7 for wheat in Romania The positive and simultaneously significant trends were however achieved when the maximum attainable yield (YM) instead of the actual yield (YA) was introduced into the regression model It can be therefore hypothesized that any virtual loss of nitrogen
wwwintechopencom
Soil Fertility Improvement and Integrated Nutrient Management ndash A Global Perspective
176
ie the negative uaN indices reflect the potential status for a yield increase and vice versa Unfortunately the positive indices of the uaN simply describe a state of N soil mining which in turn causes direct yield decline This is consistent with the opinion of Dibb (2000) and typical for many parts of the world including most CE countries
YM = -0114uaN + 2703 R2 = 093 P lt 0001
0
1
2
3
4
5
6
7
8
9
10
-60 -50 -40 -30 -20 -10 0 10
Gra
in y
ield
(Y
) t
ha-1
YA
YM
Yield
type
Unassimilated nitrogen (uaN) kg N ha-1
Fig 7 Yield prognosis of winter wheat based on residual nitrogen - a case of Romania (RO) Significant (Plt005) linear equation represents the trend for the attainable yields in the 1986-2008 period Legend YA ndash actual yield YM ndash maximum yield
Reliable yield prognosis can be performed assuming a certain level of expected yield or by focusing any improvement of production technology on higher N use efficiency The first approach can be best presented for wheat The maximum attainable yield for this crop in Poland and the Czech Republic is fixed at the level of 65 t ha-1 but for Romania at 45 t ha-1 (Rabbinge amp van Diepen 2000) The amount of uaN required to be incorporated into grain yield was calculated by the models and amounted to 48 27 and 33 kg ha-1 respectively It is equal to 58 27 and 100 of annual N rate applied in these countries and does not seem a realistic approach The same rules refer to other key crops in the study Therefore the second concept relying on the ability of currently cultivated crops to fix an extra amount of
uaN seems to be a more realistic approach for making any reliable yield prognosis (Table 7) This assumption is highly promising especially for countries presenting an extensive type of agriculture production for example Romania The expected wheat increase in response to the use of extra 20 kg N ha-1 is possible considering the water limited yield fixed at 45 t ha-1 The prognosis for the Czech Republic is still below the water limited yield being at 65 t ha-1 In Poland the calculated yields are at the same level as Romania but soils are less suitable for wheat production Therefore any grain yield increase seems to be a great challenge for farmers in all countries of the CE In the light of yields prognosis for sugar beets the fixed level of uaN at 20 kg N ha-1 is generally too low The level of 60 t ha-1 of beets seems to be the most reliable short-term target Thereby the amount of uaN successfully managed should be established at the level of 30 kg ha-1
wwwintechopencom
Constraints and Solutions to Maintain Soil Productivity A Case Study from Central Europe
177
CropCountry Linear regression model Yield at 20 kg uaN t ha-1
Wheat
Croatia YM = -0064 uaN + 3989 for R2 = 096 527
Czech Rep YM = -0063 uaN + 4777 for R2 = 088 604
Poland YM = -0060 uaN + 3623 for R2 = 092 482
Romania YM = -0114 uaN + 2703 for R2 = 093 498
Maize
Croatia YM = -0069 uaN + 4852 for R2 = 086 623
Czech Rep YM = -0064 uaN + 6470 for R2 = 069 776
Poland YM = -0085 uaN + 5431 for R2 = 083 713
Romania YM = -0121 uaN + 3348 for R2 = 094 578
Sugar beets
Croatia YM = -0605 uaN + 40677 for R2 = 089 5278
Czech Rep YM = -0458 uaN + 45872 for R2 = 076 5503
Poland YM = -0609 uaN + 39801 for R2 = 081 5198
Romania YM = -0822 uaN + 24046 for R2 = 093 4049
Table 7 Yield prognosis based on the unassimilated quantity of nitrogen (uaN)
5 Soil productivity improvements The concept of NPK fertilizers balance
The simple comparison of CE countries with respect to nutrient management clearly shows
that annual inputs of nitrogen are too high with respect to phosphorus and potassium
Therefore the main reasons of general yield stagnation in most of the CE countries are long-
term negative balances of P and K caused by low input of both mineral and organic
fertilizers As a consequence of soil P and K long-term mining the percentage share of soils
rich in both nutrients declined in the last two decades below the sufficiency level which was
achieved in many countries in 80s (Csatho at al 2007 Grzebisz amp Fotyma 2007)
It has been clearly stressed that in the transition phase of yield development the PFPN indices
reached the highest values resulting in yield gain This phenomenon emerged in years 1990
1991 for Poland and Hungary and in 1991 1992 for the Czech and Slovak Republics In all
these years the supply of P and K fertilizers was low In the Czech Republic ratios between
amounts of applied N-P-K fertilizers expressed as NP2O5K2O was 1025025 on average
This structure in spite of decreased fertilizersrsquo consumption allowed farmers to achieve the
same yields of all crops as in the period 1986-1990 The present structure of nutrient use is as
1015015 for the Czech Republic and 10404 for Poland These disparate nutrient ratios
stress the importance of NPK balance for high crop production The proposed NPK ratio
for the Czech Republic based on the cPFPN index can be established at the level of
1025025 in good years ie under ample water supply or 1025050 in unfavorable years ie
under expected water stress Hence keeping the current level of fertilizers consumption on
arable land ca 130 kg ha-1 one can predict the right amount of nutrients to apply In Poland
the total amount of currently consumed fertilizers is almost the same as in the Czech
wwwintechopencom
Soil Fertility Improvement and Integrated Nutrient Management ndash A Global Perspective
178
Republic Unfortunately soils in Poland are much poorer in potassium and also in
phosphorus being therefore highly sensitive to external supply of nutrients This
conclusion is corroborated by positive trends of yields in response to P and K fertilizers
application as found for all crops since 1991 onwards Consequently under favorable
weather conditions or on soils naturally rich in potassium the suggested formulation of N-
P-K fertilizers is as follows 1033066 but in years with high probability of drought or on
areas sensitive to drought a slightly different formulation is recommended namely
100510
It is not easy to formulate any efficient fertilizing strategy for Romania Since mid- 90s maize and wheat have shown yield stagnation at a very low level The main factors responsible for this situation are i) low N fertilization rates ii) imbalanced use of P and K fertilizers Therefore yields of these two crops are in fact dependent only on the seasonal weather course fluctuating for ca 100 on a yearly scale basis The main reason is unbalanced consumption of basic fertilizers which leads to permanent soil mining especially potassium The NP2O5K2O relationships averaged for the period 2004-2008 as 1027009 is not sufficient to get any yield increase or even its stabilization Potassium accumulates in plant tissues in much higher amounts and is considered as useful nutrient in water management (Cakmak 2005) Thereby this nutrient seems to be crucial for crop production in Romania even taking into account that almost 50 of land area is covered by soil naturally rich in minerals containing K In spite of low N consumption but unbalanced nutrient management there is still a space for an extra N loss for both key crops ie wheat and maize (see Fig 7) Therefore it could be concluded that any yield increase depends on both significant N rate rise and simultaneous change of fertilizer formulations The operational N-P-K fertilizers ratios suggested for Romania are as follows 1033017 in favorable and 10404 in unfavorable years The second scenario should aim at increasing plant survival under drought conditions
6 Thoughts and prospects
The new era of agriculture development in the Central Europe revealed how actual
agriculture outcomes in this region depend on three key factors presented in descending
order i) weather conditions during the growth season ii) inherent soil fertility iii) nitrogen
fertilizer consumption At present the first factor is decisive for crop production High year-
to-year yield variability reflects the imbalanced use of soil and external resources such as
fertilizers Therefore maximum attainable yields ie limited by water supply for example
for wheat are not attainable in all countries of the region In Germany also part of the
Central European region actual yields are above the ldquowater limitedrdquo level (Rabbinge amp
Diepen 2000 Supit et al 2010)
Inherent differences in the nature of soil quality between the CE countries as a background
of nutrient management are strictly related to the soil origin (Plant et al 2005) Except for
Poland all other countries are relatively rich in soils originated from loams (Cambisols) and
loess (Chernozems) These soils exhibit a high inherent potential for supplying K and other
cations such as calcium and magnesium (Nikolova 1998)
However at present nutritional requirements of high yielding crops most of the CE countries are almost entirely oriented on the third yield forming factor ie nitrogen
wwwintechopencom
Constraints and Solutions to Maintain Soil Productivity A Case Study from Central Europe
179
fertilizer use It has been well recognized that a balanced supply of external sources of slowly mobile elements such as phosphorus and potassium is broadly expected (Atkinson et al 2005 Struik amp Bonciarelli 1997) Consequently the average actual and attainable yields of main crops in CE countries are much more related to the soil-adjusted potential than to amounts of currently applied fertilizers As a result CE countries show at present much greater differences in agricultural production than at the end of the 80s
The observed unfavorable patterns of N fertilizer long-term consumption creates problems not only for agriculture production but are also potentially dangerous for the environment as a potential source of reactive nitrogen (Roberts 2006) There are three main questions to be urgently answered by specialists in all countries of the CE region i) do farmers really recognize an increasing yield gap ii) what is the reason for farmers and their advisory services to tolerate low efficiency of nitrogen iii) do farmers and advisory services recognize environmental aspects of the increasing amount of residual nitrogen In order to get answers to these questions one has to be familiar with factors contributing to the improvement in N fertilizer use efficiency
1 Farm management of N in terms of i) N rate quantification ii) time of N fertilizers application and iii) method of N fertilizers application
2 Management of nutrients responsible for the efficiency of N uptake and it in-plant transformation
3 Management of production factors other than N
The first problem is not only of technical nature because it affects in-season nitrogen use
efficiency and in turn actual yieldsrsquo variability However CE countries representing the
restoration type of yield development but at the same time unbalanced pattern of
consumed fertilizers do not indicate needs for increasing actually applied N rates This
strategy is to some extent the core of yield improvement in countries presenting stagnated
type of fertilizersrsquo management provided that any increase in N use will be compensated by
adequate amounts of applied phosphorus and potassium
It could finally be concluded that the realization of both goals of agricultural production in
the CE countries ie i) long-term yield stabilization and even its increase and ii) unit
productivity of the applied fertilizer N increase in turn decreasing amounts of the residual
N requires in the coming future changes in the structure of fertilizersrsquo consumption
keeping in the Unbalanced group of countries the same level of applied fertilizers The
problem of nutrients supply to a growing plant does not however refer only to the balanced
amounts of the applied fertilizers but also to the crop accessibility to soil natural nutrient
pools This problem is inherently related to conditions of root system growth in the soil
body There are a lot of factors limiting roots accessibility to water and nutrients even in
soils of high natural fertility which have been forgotten in the last 50 years but the most
important is soil acidy and related toxicity of aluminum (Atkinson et al 2005 Diatta et al
2010 Marschner 1991 Struik and Bonciarelli 1997) The key strategic target for farmers is to
increase soil volume directly occupied by plant roots in order to improve their access to
unavailable pools of nutrients Three main areas of soil productivity improvement via
increasing crop plants accessibility to nutrients in the subsoil at least may be considered i)
regulation of soil reaction ii) increase of organic matter content iii) removing of any kind of
hardpans It seems highly probable that in the case of Poland all three groups of measures
wwwintechopencom
Soil Fertility Improvement and Integrated Nutrient Management ndash A Global Perspective
180
are important In other countries of the CE soil acidity should be considered as an
agronomical problem for farmers conducting production on Luvisols
7 References
Atkinson A Black K amp Dawson L (2005) Prospects advantages and limitations of future crop production systems dependent upon the management processes Annals of Applied Biology Vol 146 pp 203-215 ISSN 1744-7348
Batjes H (2002) Carbon and nitrogen stocks in the soils of Central and Eastern Europe Soil Use Management Vol 18 pp 324-329 ISSN 1475-2743
Cakmak I (2005) The role of potassium in alleviating detrimental effects of abiotic stresses in plants Journal of Plant Nutrition Soil Science Vol 168 pp 521-530 ISSN 1436-8730
Catt J (2001) The agricultural importance of loess Earth-Science Reviews Vol 54 pp 213-229 ISSN 0012-8252
Cochrane N (2004) EU Enlargement Implications for US_EU agricultural relations US-EU Food and Agriculture ComaprisonWRS-04-04 78-86 Available online at
httpwwwersusdagovpublicationsWRS0404WRS0404pdf (Access 20110524)
Csatho P Sisak I amp Radimszky L (2007) Agriculture as a source of phosphorus causing eutrophication in Central and Eastern Europe Soil Use management Vol 23 (suppl 1) pp 36-56 ISSN 1475-2743
Csatho P amp Radimszky L (2009) Two Worlds within EU27 Sharp Contrasts in Organic and Mineral Nitrogen-Phosphorus Use Nitrogen-Phosphorus Balances and Soil Phosphorus Status Widening and Deepening Gap between Western and Central Europe Communications in Soil Science and Plant Analysis Vol 40 pp 999-1019 ISSN 0010-3624
Diatta J Bocianowski J amp Skubiszewska A (2010) Sulphate-based aluminum phytotoxicity mitigation under strong soil acidification Fresenius Environmental Bulletin Vol 19 No 12b pp 3185-3192 ISSN 1018-4619
Dibb D (2000) The mysteries (myths) of nutrient use efficiency Better Crops Vol 84 No 3 pp 3ndash5 ISSN 0006-0089
Dobermann A amp Cassman K (2002) Plant nutrient management for enhanced productivity in intensive grain production systems of the United States and Asia Plant and Soil Vol 247 pp 153-175 ISSN 1573-5036
Evans L amp Fisher R (1999) Yield potential its definition measurement and significance Crop Science Vol 39 pp 1544-1551 ISSN 1896-0782
Falloon P amp Betts R (2010) Climate impacts on European agriculture and water management in the context of adaptation and mitigation ndash the importance of integrated approach Science of Total Environment Vol 408 pp 5667-5687 ISSN 0048-9697
FAOSTAT Available online at httpfaostatfaoorgdefaultaspx (Access 20110524) Fixen P (2004) Phases in narrowing the yield gap Better Crops Vol 88 No 4 p 3 ISSN
0006-0089 Fronzek S amp Carter T (2007) Assessing uncertainties in climate change impacts on
resource potential for Europe based on projections from RCMs and GCMs Climate Change Vol 81 pp 357-371 ISSN 1758-6798
wwwintechopencom
Constraints and Solutions to Maintain Soil Productivity A Case Study from Central Europe
181
Grzebisz W amp Fotyma M (2007) Recommendations and use of potassium fertilizers in Central-Eastern Europe (CEE) In Proceedings International Fertiliser Society No 621 York UK pp 24 ISBN 978-0-85310-258-8
Grzebisz W Diatta J amp Haerdter R (2010) Fertilizer consumption patterns in Central European countries ndash effect on actual yield development trends in 1986-2005 years - a comparative study of the Czech Republic and Poland Journal of Central European Agriculture Vol 11 No 1 pp 73-82 ISSN 1332-9049
IFADATA Statistics online (2011) wwwfertilizerorgifastatisticsifadata datalineasp (Access 20110524)
Jongman R Bunce R amp Metzger R (2006) Objectives and applications of a statistical environmental stratification of Europe Landscape Ecology 21 409-419 ISSN 1572-9761
Karlen D Ditzler C amp Andrews S (2003) Soil quality why and how Geoderma Vol 114 pp 145-156 ISSN 0016-7061
Kelch D amp Osborne S (2001) Crop production capacity in EuropePrime Economic Research ServiceUSDA Agricultural outlookMarch 2001 19-23 ISSN 0099-1066
Marschner H (1991) Mechanisms of adaptation of plants to acid soils Plant and Soil 134 1-20 ISSN 1573-5036
Neumann K Verburg P amp Stehfest E (2010) The yield gap of global production a spatial analysis Agricultural Systems Vol 103 pp 316-326 ISSN 0308-521X
Nikolova M (1998) The soil potassium resources and the efficiency of potassium fertilizers in Bulgaria Nikola Poushkarow Inst of Soil Science and Agroecology Sofia Bulgaria IPI Country Report 12 39 pp
Olesen J amp Bindi M (2002) Consequences of climate change for European agricultural productivity land use and policy European Journal of Agronomy Vol 16 pp 239-262 ISSN 1161-0301
Olesen J Trnka M amp Kersebaum K (2011) Impacts and adaptation of European crop production systems to climate change European Journal of Agronomy Vol 34 pp 96-112 ISSN 1161-0301
Plant J Whittaker A amp Demitriades B (2005) The geological and tectonic framework of Europe Geochemical Atlas of Europe Part 1 Background Information Methodology Ed Salminen R Maps GTK FOREGS 20 pp ISBN 951-690-956-6
Rabbinge R (1993) The ecological background of food production In Crop protection and sustainable agriculture Wiley Chichester (Ciba Foundation Symposium 177 2-29 ISBN 10 0471939447
Rabbinge R amp Diepen C (2000) Changes in agriculture and land use in Europe European Journal of Agronomy Vol 13 pp 85-100 ISSN 1161-0301
Reilly J Fuglie K (1998) Future yield growth in field crops what evidence exists Soil amp Tillage Research Vol 47 pp 275-290 ISSN 0168-1987
Roberts T (2006) Improving Nutrient Use Efficiency Proceedings of the IFA Agriculture Conference Optimizing Resource Use Efficiency for Sustainable Intensification of Agriculture 27 february-2 March 2006 Kunming China pp 8
Rosegrant M Paisner M amp Meijer S (2001) Global Food Projections to 2020 Emerging trends and alternative futures IFPRI pp 206 ISBN 0-89629-640-7
wwwintechopencom
Soil Fertility Improvement and Integrated Nutrient Management ndash A Global Perspective
182
Sinclair T Purcell L amp Sneller C (2004) Crop transformation and the challenge to increase yield potential Trends in Plant Science Vol 9 No 2 pp 70-75 ISSN 136085
Struik P amp Bonciarelli F (1997) Resource use at the cropping system level European Journal of Agronomy Vol 7 pp 133-143 ISSN 1161-0301
Supit I van Diepen C amp de Wit A (2010) Recent changes in the climatic yield potential of various crops in Europe Agricultural Systems Vol 103 pp 683-694 ISSN 0308-521X
wwwintechopencom
Soil Fertility Improvement and Integrated Nutrient Management - AGlobal PerspectiveEdited by Dr Joann Whalen
ISBN 978-953-307-945-5Hard cover 306 pagesPublisher InTechPublished online 24 February 2012Published in print edition February 2012
InTech EuropeUniversity Campus STeP Ri Slavka Krautzeka 83A 51000 Rijeka Croatia Phone +385 (51) 770 447 Fax +385 (51) 686 166wwwintechopencom
InTech ChinaUnit 405 Office Block Hotel Equatorial Shanghai No65 Yan An Road (West) Shanghai 200040 China
Phone +86-21-62489820 Fax +86-21-62489821
Soil Fertility Improvement and Integrated Nutrient Management A Global Perspective presents 15 invitedchapters written by leading soil fertility experts The book is organized around three themes The first theme isSoil Mapping and Soil Fertility Testing describing spatial heterogeneity in soil nutrients within natural andmanaged ecosystems as well as up-to-date soil testing methods and information on how soil fertility indicatorsrespond to agricultural practices The second theme Organic and Inorganic Amendments for Soil FertilityImprovement describes fertilizing materials that provide important amounts of essential nutrients forplantsThe third theme Integrated Nutrient Management Planning Case Studies From Central Europe SouthAmerica and Africa highlights the principles of integrated nutrient management Additionally it gives casestudies explaining how this approach has been implemented successfully across large geographic regionsand at local scales to improve the productivity of staple crops and forages
How to referenceIn order to correctly reference this scholarly work feel free to copy and paste the following
Witold Grzebisz and Jean Diatta (2012) Constraints and Solutions to Maintain Soil Productivity A Case Studyfrom Central Europe Soil Fertility Improvement and Integrated Nutrient Management - A Global PerspectiveDr Joann Whalen (Ed) ISBN 978-953-307-945-5 InTech Available fromhttpwwwintechopencombookssoil-fertility-improvement-and-integrated-nutrient-management-a-global-perspectiveconstraints-and-solutions-to-maintain-soil-productivity-a-case-study-from-central-europe
copy 2012 The Author(s) Licensee IntechOpen This is an open access articledistributed under the terms of the Creative Commons Attribution 30License which permits unrestricted use distribution and reproduction inany medium provided the original work is properly cited
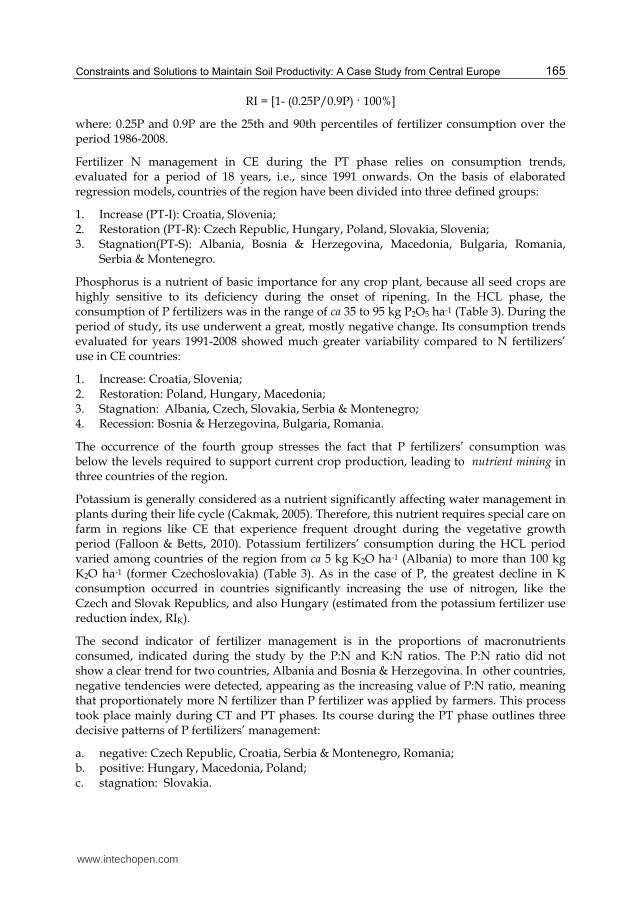
Constraints and Solutions to Maintain Soil Productivity A Case Study from Central Europe
165
RI = [1- (025P09P) 100]
where 025P and 09P are the 25th and 90th percentiles of fertilizer consumption over the period 1986-2008
Fertilizer N management in CE during the PT phase relies on consumption trends evaluated for a period of 18 years ie since 1991 onwards On the basis of elaborated regression models countries of the region have been divided into three defined groups
1 Increase (PT-I) Croatia Slovenia 2 Restoration (PT-R) Czech Republic Hungary Poland Slovakia Slovenia 3 Stagnation(PT-S) Albania Bosnia amp Herzegovina Macedonia Bulgaria Romania
Serbia amp Montenegro
Phosphorus is a nutrient of basic importance for any crop plant because all seed crops are highly sensitive to its deficiency during the onset of ripening In the HCL phase the consumption of P fertilizers was in the range of ca 35 to 95 kg P2O5 ha-1 (Table 3) During the period of study its use underwent a great mostly negative change Its consumption trends evaluated for years 1991-2008 showed much greater variability compared to N fertilizersrsquo use in CE countries
1 Increase Croatia Slovenia 2 Restoration Poland Hungary Macedonia 3 Stagnation Albania Czech Slovakia Serbia amp Montenegro 4 Recession Bosnia amp Herzegovina Bulgaria Romania
The occurrence of the fourth group stresses the fact that P fertilizersrsquo consumption was below the levels required to support current crop production leading to nutrient mining in three countries of the region
Potassium is generally considered as a nutrient significantly affecting water management in plants during their life cycle (Cakmak 2005) Therefore this nutrient requires special care on farm in regions like CE that experience frequent drought during the vegetative growth period (Falloon amp Betts 2010) Potassium fertilizersrsquo consumption during the HCL period varied among countries of the region from ca 5 kg K2O ha-1 (Albania) to more than 100 kg K2O ha-1 (former Czechoslovakia) (Table 3) As in the case of P the greatest decline in K consumption occurred in countries significantly increasing the use of nitrogen like the Czech and Slovak Republics and also Hungary (estimated from the potassium fertilizer use reduction index RIK)
The second indicator of fertilizer management is in the proportions of macronutrients consumed indicated during the study by the PN and KN ratios The PN ratio did not show a clear trend for two countries Albania and Bosnia amp Herzegovina In other countries negative tendencies were detected appearing as the increasing value of PN ratio meaning that proportionately more N fertilizer than P fertilizer was applied by farmers This process took place mainly during CT and PT phases Its course during the PT phase outlines three decisive patterns of P fertilizersrsquo management
a negative Czech Republic Croatia Serbia amp Montenegro Romania b positive Hungary Macedonia Poland c stagnation Slovakia
wwwintechopencom
Soil Fertility Improvement and Integrated Nutrient Management ndash A Global Perspective
166
The first trend covers the whole study period differing only in the annual rate of decrease
as indicated by the coefficient of the linear regression equation In the case of Romania it
was almost four times faster than for Croatia (Fig 2) The second pattern occurred in
countries like Hungary and Poland showing a slightly positive trend since 1991
Trends of KN ratios show similar patterns as described for PN ratios (Fig 3) Three
patterns of ratios can be also distinguished but comprising different sets of countries
a negative Macedonia Slovenia
b positive Hungary
c stagnation Croatia Czech Poland Slovakia Bulgaria and Romania (since 1993) Serbia
amp Montenegro (since 2000)
All above-described attributes of long-term fertilizersrsquo consumption were evaluated in Table 4
to develop a ranking based on three types of nutrient management in CE countries as
follows
1 Extensive generally showing low consumption of all fertilizers including N the most
negative attribute is the low P and K inputs leading to crop plants reliance on inherent
soil P and K supply and potentially leading to nutrient mining (Albania Bulgaria
Macedonia Serbia amp Montenegro Romania)
2 Unbalanced high consumption of fertilizer N but at the same time not balanced by
adequate use of other nutrients such as P and K at least (Croatia Czech Slovakia
Slovenia)
3 Balanced high consumption of N fertilizer which is in part balanced by relatively high
consumption of P and K fertilizers (Hungary Poland)
0
01
02
03
04
05
06
07
08
1985 1990 1995 2000 2005 2010
Consecutive years CY
PN
rel
atio
nsh
ip
P
N
CR
PL
RO
Country
PN1-PL = -0053CY + 1076 R2 = 081 P lt 0001
PN2-PL = 0006CY ndash 105 R2 = 038 P lt 001
PN-CR = -0005CY + 105 R2 = 032 P lt 0001
PN-RO = -0019CY + 374 R2 = 081 P lt 0001
Fig 2 Typical patterns of PN ratios in selected Central European countries - Croatia (CR) Poland (PL) and Romania (RO) during the period 1986-2008 Significant (Plt005) negative linear equations are shown for CR and RO while the PL data fitted to a negative linear equation in the period 1986-1996 and thereafter showed a positive linear relationship
wwwintechopencom
Constraints and Solutions to Maintain Soil Productivity A Case Study from Central Europe
167
0
01
02
03
04
05
06
07
08
09
1985 1990 1995 2000 2005 2010
Consecutive years CY
KN
rel
atio
nsh
ip
K
N
CR
PL
RO
Country KN1-PL = -0066CY + 1323 R2 = 070 P lt 001
KN1-RO = -0044CY + 873 R2 = 083 P lt 0001
Fig 3 Typical patterns of KN ratios in selected Central European countries - Croatia (CR) Poland (PL) and Romania (RO) in the period 1986-2008 Significant (Plt005) negative linear equations are shown for CR and RO in the 1986-1992 period thereafter showed non-significant trends For CR the KN trend was non-significant for the whole period
Estimated Parameters
Country3
AL BampH BU CR CZ HU MC PL RO SampM SK SL
Nitrogen 01 0 0 ++ + + 0 + 0 0 + +-
Phosphorus 0 - - ++ 0 + + + - 0 0 +-
Potassium 0 0 0 ++ 0 + 0 + 0 0 0 0
PN 0 0 0 - - + 0 ++ - 0 0 -
KN 0 0 0 0 0 + - 0 0 0 0 -
Ranking2 0 0 0 2 2 1 0 1 0 0 2 2
1evaluation of trends ++ - increase +- restoration 0 - stagnation - - decrease +- - time variable 2 fertilizer management ranking 0 ndash extensive 1 ndash balanced 2 ndash unbalanced 3 Country acronyms are provided in Table 1
Table 4 Fertilizer consumption trends ndashsummary and country management ranking for countries in Central Europe during the period 1986 to 2008
32 Soil fertility status
Soil is considered as a slowly renewable or non-renewable resource that requires the same
level of protection as other limited resources like phosphorus rock There is strong
agreement that productivity of arable land depends on both a soilrsquos fertility potential (soil
quality inherent soil fertility) and present state of soil properties (soil health) to sustain
wwwintechopencom
Soil Fertility Improvement and Integrated Nutrient Management ndash A Global Perspective
168
primary production and other ecological functions The minimum data set to describe
current fertility status of arable land ie soil health should contain indicators reflecting
both past and actual organic matter content soil pH and management of nutrient soil
resources (Atkinson et al 2005 Karlen et al 2003)
Total organic carbon (TOC) stock in the topsoil (00-03 m) or its content () in arable soils is
a good descriptor of short-term trends in soil organic matter (SOM) management However
the organic carbon stock measured to a depth of 1 m in the soil profile can be considered as
an indicator of soil fertility potential The actual content of TOC in an averaged arable soil
unit was calculated by weighted mean content of organic carbon for main soil types (Batjes
2002) and its percentage share in the soil cover for each CE country (see Table 1) Analysis of
this data showed that TOC in the average topsoil unit of CE countries is insufficient ranging
from ca 60 (Poland) to 80 (Hungary) t TOC ha-1 ie about 14 to 18 TOC Differences
between CE countries can be evaluated by TOC stock in the soil profile to a depth of 1 m
Based on this criterion countries can be classified into three groups
a low ( le 120 t TOC ha-1) Croatia Poland b medium (121-160 t TOC ha-1 ) Albania Bulgaria Czech Republic Macedonia
Romania Serbia amp Montenegro Slovakia Slovenia c high (gt 161 t TOC ha-1) Hungary
Phosphorus and Potassium are key nutrients for achieving high productivity of arable soils
Available resources of both nutrients are the most important indicators of soil health ie its
current productivity The country status of current soil nutrient management was evaluated
by means of soil fertility index (SFI) expressed as the sum of the percentage share of arable
land characterised by the very high high and half of medium rating of available P or K
(Grzebisz amp Fotyma 2007) It has been assumed that SFI for P and K exceeding 70 of
arable land share is a prerequisite for high yield of any crop In the 1980s this target was
achieved in many countries of the region like Czechoslovakia Hungary and some countries
of the former Yugoslavia (Serbia amp Montenegro Slovenia) (Fig 4) In these countries the
rates of applied fertilizers were far in excess of crop removal capacity Poland in spite of
currently high K consumption differs from other CE countries The sufficiency level for P
and K of 70 was never reached due to much lower inherent soil potential for nutrient
supply At the beginning of 2000 significant changes of P and K fertility were recorded The
increase of the P sufficiency level was recorded only in Slovenia and Poland In Slovenia the
reason was high consumption of P fertilizers at the beginning of the 21st century In Poland
the increase is related to sufficiently well balanced use of N and P fertilizers and slightly
lower yields than in the 80s In all other CE countries the percentage of P-fertile soils
generally decreased nevertheless the rate of the decrease differed across the region A
slight decrease occurred in Czech and Slovak Republics as well as in Hungary The greatest
drop was recorded in Bulgaria followed by Serbia and Montenegro The potassium SFI
presents much more alarming trend As reported by Grzebisz amp Fotyma (2007) for countries
of the Northern Agricultural Zone (Czech Hungary Poland Slovakia) the K sufficiency
level decreased below the target value within two decades Based on K fertilizersrsquo
consumption trends it can be assumed that the same trend occurs also in the Southern
Zone
wwwintechopencom
Constraints and Solutions to Maintain Soil Productivity A Case Study from Central Europe
169
0
10
20
30
40
50
60
70
80
90
100
AL BU CZ H PL RO SE SK SL
Countries
P s
oil
fert
ility
in
de
x
A
L
1980s
2000s
Sufficiency level
Fig 4 Phosphorus soil fertility indices (expressed as the percentage of arable land AL) for selected CE countries during the period 1986 - 2008 (based on Csatho et al 2007) The sufficiency level was assumed to be 70 as described by Grzebisz amp Fotyma (2007) Country acronyms are given in Table 1
4 Soil productivity assessment
41 Long-term trends in crop yields
All CE countries grow the same crops and cereal species predominate The area sown with cereals occupies 64 of arable land in Croatia 52 - in the Czech Republic 68 - in Poland and 59 ndash in Romania In the Czech Republic cerealsrsquo production is dominated by wheat and barley but in Poland by wheat and rye In Romania and Croatia maize is the key grain crop Sugar beets due to EU regulation in the last 10 years are of minor importance but this crop is a good indicator of soil quality Therefore it has been assumed that these crops would reflect fairly well changes in current soil fertility status as a consequence of applied nutrient management strategies This assumption is well documented by observed variability of yields of wheat maize and sugar beets in selected countries of CE (Table 5) The highest variability was found for Romania and the lowest for Poland Romania is a country with an extensive pattern of fertilizersrsquo management typical in the Southern Agricultural Zone of Europe Poland belongs to countries of the Northern Zone but presents a balanced patterns of fertilizersrsquo management (Poland Hungary) Other selected countries are members of the Unbalanced fertilizing group of CE countries
The long-term yield trend can be used as an indicator of key crops sensitivity to past and current fertilizersrsquo management As in the case of fertilizersrsquo consumption trends three consecutive phases of yield development over the period 1986-2008 may be distinguished
1 Actual-Standard (AS) 2 Recession (RC) 3 Restoration (RS) or Stagnation (SG)
The observed trends of harvested yields were most pronounced for wheat other cereals and for seed crops like oil-seed rape (Grzebisz et al 2010) In the first phase of the study taking
wwwintechopencom
Soil Fertility Improvement and Integrated Nutrient Management ndash A Global Perspective
170
place at the end of the 80s yields of wheat reached on average the highest recorded levels Therefore this particular period is considered as a standard level (AS) for evaluating subsequent phases (Fig 5) The highest yield decline ie the recession phase (RC) in response to the collapse in fertilizer consumption took place in the Northern Zone but
Crops Croatia Czech Republic Poland Romania
x plusmn SD5 CV6 x plusmn SD CV x plusmn SD CV x plusmn SD CV
Wheat 40plusmn052
39plusmn033
44plusmn094
125
86
216
48plusmn05
51plusmn04
52plusmn06
102
78
113
36plusmn03
37plusmn02
39plusmn04
90
56
100
27plusmn06
31plusmn04
29plusmn08
212
141
265
Maize 49plusmn10
40plusmn09
55plusmn13
205
217
229
58plusmn13
51plusmn05
69plusmn05
214
93
76
52plusmn08
49plusmn02
56plusmn08
143
41
157
31plusmn08
29plusmn05
34plusmn11
244
180
315
Sugar
beet
404plusmn77
398plusmn49
487plusmn52
192
123
108
424plusmn76
345plusmn15
531plusmn49
180
42
49
381plusmn55
346plusmn19
451plusmn39
145
56
88
228plusmn51
213plusmn29
304plusmn33
222
136
108
1FAOSTAT available online 2011-05-24 21986-2008 31986-1990 42004-2008 5standard deviation 6coefficient of variation
Table 5 Statistical overview of key cropsrsquo yields (t ha-1) in selected Central European
countries during the period 1986-2008 in comparison to the AS phase and the 2004-2008
periods
0
1
2
3
4
5
6
7
1985 1990 1995 2000 2005 2010
Consecutive years CY
Gra
in y
ield
(Y
) t
ha-1
CZ
RO
Country
AS RC RE or ST
Y-CZ = 0056CY + 1089 R2 = 028 P lt 005
TYG
TYG
Legend level of harvested yield AS Actual-Standard RC Recession RE Restoration ST Stagnation
Dashed line refers to AS level of yield ie an average yield harvested in the period 1986-1990 TYG
Temporary Yield Gap
Fig 5 Long-term trends of wheat production in the Czech Republic (CZ) and Romania (RO)
during the period 1986-2008 Significant (Plt005) positive linear trend is shown for the
Czech Republic whereas non-significant for Romania in the period 1992-2008
wwwintechopencom
Constraints and Solutions to Maintain Soil Productivity A Case Study from Central Europe
171
lasted for only two or three years In other countries mainly representing the Southern Zone it was also fast or showed sustained depression The third phase of yield development was manifested in two distinct trends The first ldquorestorationrdquo trend has shown a positive yield gain since yield recession It was revealed in the Northern Zone countries and also for Croatia and Slovenia The second trend has not shown any significant change in yield since the recession resulting in yield stagnation The most interesting attribute of this trend is its high year-to-year variability The difference between the actually harvested and the AS yield has been termed as the temporary yield gap (TYG) (Fig 5) The time required to recover to the AS level was long but country specific In the Northern Zone it lasted for ca 10-12 years exceeding the AS level in 2004 or 2005 In most other countries representing the Southern Zone it has not been reached up to 2008 For maize and sugar beets the recession was also observed In the recovery period maize yields were generally positive but the rate of the yield increase was much higher in the Balanced and Unbalanced groups than in the Extensive group Sugar beets yield increase was very high at the beginning of the 90s exceeding the level reported in the 80s The main reason was a reduction in area sown with sugar beets which forced farmers to cultivate this crop on more fertile soils
42 The concept of partial factor fertilizer nitrogen productivity (PFPN)
This part of the study relies on two main conceptual pillars The first one assumes that each hectare of arable soil regardless of the current crop is supplied with the same amount of nutrients including nitrogen The second assumption takes into account the fact that the unit productivity of in-season applied fertilizer N known as PFPN is a reliable scientific tool to make simple but quick discrimination of factors limiting attainable crop yield (Dobermann amp Casman 2002) Therefore the PFPN index was used to evaluate some but selected CE countries that represent the three patterns of current fertilizer management (Table 4) Croatia and the Czech Republic have been selected as examples for the Unbalanced group whereas Poland is the Balanced group and Romania represents the Extensive group of fertilizersrsquo use
The PFPN index was obtained by dividing the actual yield of a respective crop harvested within a given year by the annual amount of N fertilizers consumed by the country assuming it was applied at an equal rate for all currently cultivated crops Operationally the PFPN index consists of two components
a yield of crop (Y) expressed in kg or t ha-1 b nitrogen fertilizer rate (FN) expressed as kg N ha-1
PFPN = YFN
Based on the long-term trends of PFPN indices for each of the key crops two different types of PFPN indices can be distinguished
1 The real partial factor productivity of applied N ndash (rPFPN) it reflects actual yields as limited by both water and N availability
2 The maximal partial factor productivity of applied N (mPFPN) it was calculated as the 4th quartile of rPFPN indices it refers to yields obtained under ample water supply
To make a reliable estimate of the yield gap for some crops cultivated in the CE the corrected partial factor productivity of applied N (cPFPN) instead of mPFPN has been applied
wwwintechopencom
Soil Fertility Improvement and Integrated Nutrient Management ndash A Global Perspective
172
Operationally it has been calculated as the average of the 4th quartile but excluding extremely elevated rPFPN values which emerged in most of investigated countries at the beginning of the 90s Indices of N productivity (PFPN rPFPN and cPFPN) were then used to calculate the yield gap
The calculated rPFPN indices showed as expected high year-to-year variability for all tested crops (Table 6) They were crop and country specific when averaged over the 1986-2008 period
a wheat CR lt CZ = PL lt RO b maize CR lt CZ lt PL lt RO c sugar beets CR = CZ lt PL lt RO
These ranges are not in line with long-term average yields of all crops which followed generally the order CZ gt CR gt PL gt RO
Maximum productivity of tested crops as evaluated for the 4th quartile of rPFPN indices was
much higher rising on average by 43 However the increase was country specific and
represents 63 for Croatia 28 for the Czech Republic 30 for Poland and 48 for
Romania The concept of mPFPN assumes an increase of rPFPN indices pursuant to higher
efficiency of applied fertilizer nitrogen due to ample water supply Its reliability has been
corroborated by low coefficients of variation implicitly indicating the potential productivity
of applied fertilizer nitrogen on the background of soil quality The sequences of countries
for each crop are as follows
a wheat CZ = PL lt CR lt RO b maize CR = CZ lt PL lt RO c sugar beets CZ lt PL lt CR lt RO
As presented in Table 6 coefficients of variations of cPFPN indices were significantly lower in comparison to mPFPN stressing on the reliability of the conducted analysis
Relationships between sets of developed rPFPN and applied fertilizer nitrogen rates can also be a useful tool for making long-term assessment of nitrogen efficiency This relationship fits the best the power function
rPFPN = 9112N-067 for R2 = 077 and n = 92
where N ndash annual rate of fertilizer nitrogen consumption kg N ha-1
Analysis of the general curve shape reveals decreasing yield per unit of N fertilizer applied with highest values of rPFPN It has been observed that irrespective of the applied N rate long-term productivity of fertilizer nitrogen increased in the order Romania lt Poland lt Croatia lt the Czech Republic However the obtained high rPFPN values are as a rule related to lower yields of harvested crops This pattern of crop response refers mostly to Bulgaria Romania and former Yugoslavia countries excluding Croatia and Slovenia As pointed out by Fixen (2004) the target of efficient N fertilizer management based on high fertilizer N use efficiency is counter-productive In this N supply system plants are forced to take up an appreciable amount of N from its soil resources which decreases their rate of growth in critical stages of yield performance Therefore ldquothe elevatedrdquo level of the PFPN could be used as an attribute of the extensive type of agriculture production
wwwintechopencom
Constraints and Solutions to Maintain Soil Productivity A Case Study from Central Europe
173
PFPN
index
Croatia Czech Republic Poland Romania
x plusmn SD1 CV2 x plusmn SD CV x plusmn SD CV x plusmn SD CV
Wheat kg yield kg N-1
rPFPN 48plusmn24 498 54plusmn13 235 54plusmn15 275 81plusmn33 405
mPFPN 80plusmn23 288 70plusmn11 160 72plusmn15 212 121plusmn14 119
cPFPN 63plusmn11 174 62plusmn4 59 62plusmn2 30 112plusmn8 69
Maize kg yield kg N-1
rPFPN 56plusmn26 464 66plusmn18 281 78plusmn21 263 95plusmn45 478
mPFPN 89plusmn29 288 89plusmn7 76 103plusmn11 102 149plusmn20 135
cPFPN 69plusmn10 151 89plusmn7 76 96plusmn2 24 137plusmn9 66
Sugar beets kg yield kg N-1
rPFPN 471plusmn224 477 478plusmn120 250 566plusmn136 240 695plusmn266 383
mPFPN 766plusmn218 285 588plusmn49 825 728plusmn67 93 977plusmn122 125
cPFPN 613plusmn86 141 588plusmn49 825 675plusmn35 52 905plusmn36 40
1standard deviation 2coefficient of variation
Table 6 Partial factor fertilizer N productivity statistics for key crops in selected Central European countries with unbalanced (Croatia Czech Republic) balanced (Poland) and extensive (Romania) fertilizersrsquo management during the period 1986-2008
43 Yield gap (YG) and its attributes
Actual yields of crops harvested by farmers in all areas of the world are much lower than
the yield potential of currently cultivated varieties under defined soil and climatic
conditions This ldquovirtualrdquo un-harvested portion of yield is generally termed the yield gap
(YG) (Evans amp Fisher 1999 Dobermann amp Cassman 2002) However the CE countries
experience another phenomenon known as the temporary yield gap (TYG) (Grzebisz et al
2010) The main reason of its emergence is the collapse in fertilizer use leading to elevation
of the rPFPN index Dibb (2000) relates extremely high N efficiency to low yield and this
trend was fully corroborated by the crop yield data from countries with extensive fertilizer
management Nevertheless the countries of the Northern Agricultural Zone (Czech
Republic Hungary Poland Slovakia) in spite of drastic decrease of consumed fertilizers in
the early 90s were characterized by high yields of wheat and other cereal crops (FAOSTAT
2011 Grzebisz et al 2010) The observed rPFPN indices extremely elevated at the beginning
of the 90s were a result of the residual effect of applied fertilizer N This phenomenon could
be manifested only under growth conditions created by ample water and sufficiently high
supply of immobile nutrients such as P and K in turn balancing N use by currently growing
crops
In the first step of yield gap calculation the cPFPN index was applied to assess the maximal
attainable yield (YAM) The yield gap was then calculated as a difference between really
harvestable yield (YA) and YAM
wwwintechopencom
Soil Fertility Improvement and Integrated Nutrient Management ndash A Global Perspective
174
YAM = cPFPN middot DN
YG = YA ndash YAM
where
DN is the rate of annually applied fertilizer N (kg N ha-1) YA is the actual yield in t ha-1 for a
given year and YAM is the maximal attainable yield (t ha-1)
The observed similarities of the general yield gap pattern over time for key crops allow to
distinguish three consecutive phases of its development in the period 1986-2008 (Fig 6)
1 First ndash primary deep yield gap to the left of the transition point (TP) 2 Second ndash point of extra yield gain TP 3 Third- secondary yield gap to the right of the TP alternatively yield gap stagnation as
indicated by the lack of significant (P lt 005) linear trend response
-7
-6
-5
-4
-3
-2
-1
0
1
2
1985 1990 1995 2000 2005 2010
Consecutive years CY
Yie
ld g
ap
(Y
G)
t h
a-1
CZ
RO
TP
YGd-CZ = 079CY - 1573 R2 = 070 P lt 001
YGd-RO = 068CY - 1354 R2 = 072 P lt 0001
YGr-CZ = -012CY + 2354 R2 = 046 P lt 0001
Country
Legend TP - Transition Point YGd - yield gap decline YGr - yield gap restoration
Fig 6 Evolution of the yield gap in wheat in the Czech Republic (CZ) and Romania (RO) during the period 1986 -2008 Significant (Plt005) positive linear equations are shown for the Czech Republic in the period 1986-92 and for Romania in the period 1986-1995 thereafter showed a negative linear relationship for the Czech Republic and non-significant trend for Romania
Wheat is the best example of the yield gap course in the CE countries stressing on the
difference in fertilizer management The main dissimilarities among countries do not refer
to the first phase The YG was deep in spite of relatively high yield indicating thus a low
capacity of contemporary cultivated varieties to achieve further gains in yield Much more
important were YG length and number of years to reach the TP The time to reach the TP
was shorter (6(7) years) in countries such as the Czech and Slovak Republics Hungary and
Poland and also in Croatia and Slovenia corresponding to rapid rebuilding of fertilizer
wwwintechopencom
Constraints and Solutions to Maintain Soil Productivity A Case Study from Central Europe
175
markets in these countries In countries with extensive fertilizersrsquo management the length of
the first phase extended up to mid-90s
The YG evaluation shows that the current nutrient management in CE countries can
overcome this phenomenon especially in the case of wheat and maize A TYG can be most
easily negated in countries belonging to Unbalanced or Balanced nutrient management
groups such as the Czech and Slovak Republics Hungary and Poland and also Croatia and
Slovenia In countries with extensive fertilizersrsquo management the TYG has not been
overcome and enters the third phase of yield development stagnation due to low use of
fertilizers in turn resulting in the very low and unstable level of annually harvested yields
44 Yield prognosis ndash The unassimilated nitrogen concept
The medium or long-term food and environmental policy strategies for any country or
particular region are supported by yield prognosis considered as an operational tool
However the ex-ante prognosis depends on the reliability of the data used Two approaches
both relying on the unit productivity of fertilizer nitrogen (PFPN) have been considered The
first assumes extrapolation of real and improved yields based on the linear model (Reilly amp
Fuglie 1998) The second one is based on long term trends of the YG but transformed into
unit of temporarily lost fertilizer nitrogen termed for the purposes of this study as
unassimilated nitrogen This approach as related to nitrogen management has been used to
make a prognosis of yields of key crops in the CE countries
Operationally the concept presented in this chapter assumes that the total amount of
applied fertilizer nitrogen (FN) is simply divided into three main pools i) assimilated
(FaN) ndash nitrogen taken up by meanwhile grown crop ii) unassimilated nitrogen (FuaN) ndash
temporary out of use by plants andor iii) lost from the field (FLN) The quantitative
assessment of the FuaN pool relies on the defined YG procedure individually related to
each investigated crop
FN = FaN + F uaN + FLN
FuaN = YGcPFPN
where
FuaN ndash unassimilated nitrogen kg N ha-1 YG - yield gap cPFPN ndash the corrected partial factor productivity of applied N kg yield kg N-1
In the first step of yield prognosis the Unassimilated Nitrogen Indices (IuaN) should be computed Therefore the original set of YG data for each of the studied crops was transformed into a quantitative amount of nitrogen lost temporarily from the system marked as minus (-IuaN) In the second step of the analysis both sets of actual (YA) and maximum attainable yields (YM) of each crop were regressed against corresponding set of
uaN indices The obtained regression models clearly show that actual yields over the period of 20 years did not respond significantly to the IuaN as reported in Fig 7 for wheat in Romania The positive and simultaneously significant trends were however achieved when the maximum attainable yield (YM) instead of the actual yield (YA) was introduced into the regression model It can be therefore hypothesized that any virtual loss of nitrogen
wwwintechopencom
Soil Fertility Improvement and Integrated Nutrient Management ndash A Global Perspective
176
ie the negative uaN indices reflect the potential status for a yield increase and vice versa Unfortunately the positive indices of the uaN simply describe a state of N soil mining which in turn causes direct yield decline This is consistent with the opinion of Dibb (2000) and typical for many parts of the world including most CE countries
YM = -0114uaN + 2703 R2 = 093 P lt 0001
0
1
2
3
4
5
6
7
8
9
10
-60 -50 -40 -30 -20 -10 0 10
Gra
in y
ield
(Y
) t
ha-1
YA
YM
Yield
type
Unassimilated nitrogen (uaN) kg N ha-1
Fig 7 Yield prognosis of winter wheat based on residual nitrogen - a case of Romania (RO) Significant (Plt005) linear equation represents the trend for the attainable yields in the 1986-2008 period Legend YA ndash actual yield YM ndash maximum yield
Reliable yield prognosis can be performed assuming a certain level of expected yield or by focusing any improvement of production technology on higher N use efficiency The first approach can be best presented for wheat The maximum attainable yield for this crop in Poland and the Czech Republic is fixed at the level of 65 t ha-1 but for Romania at 45 t ha-1 (Rabbinge amp van Diepen 2000) The amount of uaN required to be incorporated into grain yield was calculated by the models and amounted to 48 27 and 33 kg ha-1 respectively It is equal to 58 27 and 100 of annual N rate applied in these countries and does not seem a realistic approach The same rules refer to other key crops in the study Therefore the second concept relying on the ability of currently cultivated crops to fix an extra amount of
uaN seems to be a more realistic approach for making any reliable yield prognosis (Table 7) This assumption is highly promising especially for countries presenting an extensive type of agriculture production for example Romania The expected wheat increase in response to the use of extra 20 kg N ha-1 is possible considering the water limited yield fixed at 45 t ha-1 The prognosis for the Czech Republic is still below the water limited yield being at 65 t ha-1 In Poland the calculated yields are at the same level as Romania but soils are less suitable for wheat production Therefore any grain yield increase seems to be a great challenge for farmers in all countries of the CE In the light of yields prognosis for sugar beets the fixed level of uaN at 20 kg N ha-1 is generally too low The level of 60 t ha-1 of beets seems to be the most reliable short-term target Thereby the amount of uaN successfully managed should be established at the level of 30 kg ha-1
wwwintechopencom
Constraints and Solutions to Maintain Soil Productivity A Case Study from Central Europe
177
CropCountry Linear regression model Yield at 20 kg uaN t ha-1
Wheat
Croatia YM = -0064 uaN + 3989 for R2 = 096 527
Czech Rep YM = -0063 uaN + 4777 for R2 = 088 604
Poland YM = -0060 uaN + 3623 for R2 = 092 482
Romania YM = -0114 uaN + 2703 for R2 = 093 498
Maize
Croatia YM = -0069 uaN + 4852 for R2 = 086 623
Czech Rep YM = -0064 uaN + 6470 for R2 = 069 776
Poland YM = -0085 uaN + 5431 for R2 = 083 713
Romania YM = -0121 uaN + 3348 for R2 = 094 578
Sugar beets
Croatia YM = -0605 uaN + 40677 for R2 = 089 5278
Czech Rep YM = -0458 uaN + 45872 for R2 = 076 5503
Poland YM = -0609 uaN + 39801 for R2 = 081 5198
Romania YM = -0822 uaN + 24046 for R2 = 093 4049
Table 7 Yield prognosis based on the unassimilated quantity of nitrogen (uaN)
5 Soil productivity improvements The concept of NPK fertilizers balance
The simple comparison of CE countries with respect to nutrient management clearly shows
that annual inputs of nitrogen are too high with respect to phosphorus and potassium
Therefore the main reasons of general yield stagnation in most of the CE countries are long-
term negative balances of P and K caused by low input of both mineral and organic
fertilizers As a consequence of soil P and K long-term mining the percentage share of soils
rich in both nutrients declined in the last two decades below the sufficiency level which was
achieved in many countries in 80s (Csatho at al 2007 Grzebisz amp Fotyma 2007)
It has been clearly stressed that in the transition phase of yield development the PFPN indices
reached the highest values resulting in yield gain This phenomenon emerged in years 1990
1991 for Poland and Hungary and in 1991 1992 for the Czech and Slovak Republics In all
these years the supply of P and K fertilizers was low In the Czech Republic ratios between
amounts of applied N-P-K fertilizers expressed as NP2O5K2O was 1025025 on average
This structure in spite of decreased fertilizersrsquo consumption allowed farmers to achieve the
same yields of all crops as in the period 1986-1990 The present structure of nutrient use is as
1015015 for the Czech Republic and 10404 for Poland These disparate nutrient ratios
stress the importance of NPK balance for high crop production The proposed NPK ratio
for the Czech Republic based on the cPFPN index can be established at the level of
1025025 in good years ie under ample water supply or 1025050 in unfavorable years ie
under expected water stress Hence keeping the current level of fertilizers consumption on
arable land ca 130 kg ha-1 one can predict the right amount of nutrients to apply In Poland
the total amount of currently consumed fertilizers is almost the same as in the Czech
wwwintechopencom
Soil Fertility Improvement and Integrated Nutrient Management ndash A Global Perspective
178
Republic Unfortunately soils in Poland are much poorer in potassium and also in
phosphorus being therefore highly sensitive to external supply of nutrients This
conclusion is corroborated by positive trends of yields in response to P and K fertilizers
application as found for all crops since 1991 onwards Consequently under favorable
weather conditions or on soils naturally rich in potassium the suggested formulation of N-
P-K fertilizers is as follows 1033066 but in years with high probability of drought or on
areas sensitive to drought a slightly different formulation is recommended namely
100510
It is not easy to formulate any efficient fertilizing strategy for Romania Since mid- 90s maize and wheat have shown yield stagnation at a very low level The main factors responsible for this situation are i) low N fertilization rates ii) imbalanced use of P and K fertilizers Therefore yields of these two crops are in fact dependent only on the seasonal weather course fluctuating for ca 100 on a yearly scale basis The main reason is unbalanced consumption of basic fertilizers which leads to permanent soil mining especially potassium The NP2O5K2O relationships averaged for the period 2004-2008 as 1027009 is not sufficient to get any yield increase or even its stabilization Potassium accumulates in plant tissues in much higher amounts and is considered as useful nutrient in water management (Cakmak 2005) Thereby this nutrient seems to be crucial for crop production in Romania even taking into account that almost 50 of land area is covered by soil naturally rich in minerals containing K In spite of low N consumption but unbalanced nutrient management there is still a space for an extra N loss for both key crops ie wheat and maize (see Fig 7) Therefore it could be concluded that any yield increase depends on both significant N rate rise and simultaneous change of fertilizer formulations The operational N-P-K fertilizers ratios suggested for Romania are as follows 1033017 in favorable and 10404 in unfavorable years The second scenario should aim at increasing plant survival under drought conditions
6 Thoughts and prospects
The new era of agriculture development in the Central Europe revealed how actual
agriculture outcomes in this region depend on three key factors presented in descending
order i) weather conditions during the growth season ii) inherent soil fertility iii) nitrogen
fertilizer consumption At present the first factor is decisive for crop production High year-
to-year yield variability reflects the imbalanced use of soil and external resources such as
fertilizers Therefore maximum attainable yields ie limited by water supply for example
for wheat are not attainable in all countries of the region In Germany also part of the
Central European region actual yields are above the ldquowater limitedrdquo level (Rabbinge amp
Diepen 2000 Supit et al 2010)
Inherent differences in the nature of soil quality between the CE countries as a background
of nutrient management are strictly related to the soil origin (Plant et al 2005) Except for
Poland all other countries are relatively rich in soils originated from loams (Cambisols) and
loess (Chernozems) These soils exhibit a high inherent potential for supplying K and other
cations such as calcium and magnesium (Nikolova 1998)
However at present nutritional requirements of high yielding crops most of the CE countries are almost entirely oriented on the third yield forming factor ie nitrogen
wwwintechopencom
Constraints and Solutions to Maintain Soil Productivity A Case Study from Central Europe
179
fertilizer use It has been well recognized that a balanced supply of external sources of slowly mobile elements such as phosphorus and potassium is broadly expected (Atkinson et al 2005 Struik amp Bonciarelli 1997) Consequently the average actual and attainable yields of main crops in CE countries are much more related to the soil-adjusted potential than to amounts of currently applied fertilizers As a result CE countries show at present much greater differences in agricultural production than at the end of the 80s
The observed unfavorable patterns of N fertilizer long-term consumption creates problems not only for agriculture production but are also potentially dangerous for the environment as a potential source of reactive nitrogen (Roberts 2006) There are three main questions to be urgently answered by specialists in all countries of the CE region i) do farmers really recognize an increasing yield gap ii) what is the reason for farmers and their advisory services to tolerate low efficiency of nitrogen iii) do farmers and advisory services recognize environmental aspects of the increasing amount of residual nitrogen In order to get answers to these questions one has to be familiar with factors contributing to the improvement in N fertilizer use efficiency
1 Farm management of N in terms of i) N rate quantification ii) time of N fertilizers application and iii) method of N fertilizers application
2 Management of nutrients responsible for the efficiency of N uptake and it in-plant transformation
3 Management of production factors other than N
The first problem is not only of technical nature because it affects in-season nitrogen use
efficiency and in turn actual yieldsrsquo variability However CE countries representing the
restoration type of yield development but at the same time unbalanced pattern of
consumed fertilizers do not indicate needs for increasing actually applied N rates This
strategy is to some extent the core of yield improvement in countries presenting stagnated
type of fertilizersrsquo management provided that any increase in N use will be compensated by
adequate amounts of applied phosphorus and potassium
It could finally be concluded that the realization of both goals of agricultural production in
the CE countries ie i) long-term yield stabilization and even its increase and ii) unit
productivity of the applied fertilizer N increase in turn decreasing amounts of the residual
N requires in the coming future changes in the structure of fertilizersrsquo consumption
keeping in the Unbalanced group of countries the same level of applied fertilizers The
problem of nutrients supply to a growing plant does not however refer only to the balanced
amounts of the applied fertilizers but also to the crop accessibility to soil natural nutrient
pools This problem is inherently related to conditions of root system growth in the soil
body There are a lot of factors limiting roots accessibility to water and nutrients even in
soils of high natural fertility which have been forgotten in the last 50 years but the most
important is soil acidy and related toxicity of aluminum (Atkinson et al 2005 Diatta et al
2010 Marschner 1991 Struik and Bonciarelli 1997) The key strategic target for farmers is to
increase soil volume directly occupied by plant roots in order to improve their access to
unavailable pools of nutrients Three main areas of soil productivity improvement via
increasing crop plants accessibility to nutrients in the subsoil at least may be considered i)
regulation of soil reaction ii) increase of organic matter content iii) removing of any kind of
hardpans It seems highly probable that in the case of Poland all three groups of measures
wwwintechopencom
Soil Fertility Improvement and Integrated Nutrient Management ndash A Global Perspective
180
are important In other countries of the CE soil acidity should be considered as an
agronomical problem for farmers conducting production on Luvisols
7 References
Atkinson A Black K amp Dawson L (2005) Prospects advantages and limitations of future crop production systems dependent upon the management processes Annals of Applied Biology Vol 146 pp 203-215 ISSN 1744-7348
Batjes H (2002) Carbon and nitrogen stocks in the soils of Central and Eastern Europe Soil Use Management Vol 18 pp 324-329 ISSN 1475-2743
Cakmak I (2005) The role of potassium in alleviating detrimental effects of abiotic stresses in plants Journal of Plant Nutrition Soil Science Vol 168 pp 521-530 ISSN 1436-8730
Catt J (2001) The agricultural importance of loess Earth-Science Reviews Vol 54 pp 213-229 ISSN 0012-8252
Cochrane N (2004) EU Enlargement Implications for US_EU agricultural relations US-EU Food and Agriculture ComaprisonWRS-04-04 78-86 Available online at
httpwwwersusdagovpublicationsWRS0404WRS0404pdf (Access 20110524)
Csatho P Sisak I amp Radimszky L (2007) Agriculture as a source of phosphorus causing eutrophication in Central and Eastern Europe Soil Use management Vol 23 (suppl 1) pp 36-56 ISSN 1475-2743
Csatho P amp Radimszky L (2009) Two Worlds within EU27 Sharp Contrasts in Organic and Mineral Nitrogen-Phosphorus Use Nitrogen-Phosphorus Balances and Soil Phosphorus Status Widening and Deepening Gap between Western and Central Europe Communications in Soil Science and Plant Analysis Vol 40 pp 999-1019 ISSN 0010-3624
Diatta J Bocianowski J amp Skubiszewska A (2010) Sulphate-based aluminum phytotoxicity mitigation under strong soil acidification Fresenius Environmental Bulletin Vol 19 No 12b pp 3185-3192 ISSN 1018-4619
Dibb D (2000) The mysteries (myths) of nutrient use efficiency Better Crops Vol 84 No 3 pp 3ndash5 ISSN 0006-0089
Dobermann A amp Cassman K (2002) Plant nutrient management for enhanced productivity in intensive grain production systems of the United States and Asia Plant and Soil Vol 247 pp 153-175 ISSN 1573-5036
Evans L amp Fisher R (1999) Yield potential its definition measurement and significance Crop Science Vol 39 pp 1544-1551 ISSN 1896-0782
Falloon P amp Betts R (2010) Climate impacts on European agriculture and water management in the context of adaptation and mitigation ndash the importance of integrated approach Science of Total Environment Vol 408 pp 5667-5687 ISSN 0048-9697
FAOSTAT Available online at httpfaostatfaoorgdefaultaspx (Access 20110524) Fixen P (2004) Phases in narrowing the yield gap Better Crops Vol 88 No 4 p 3 ISSN
0006-0089 Fronzek S amp Carter T (2007) Assessing uncertainties in climate change impacts on
resource potential for Europe based on projections from RCMs and GCMs Climate Change Vol 81 pp 357-371 ISSN 1758-6798
wwwintechopencom
Constraints and Solutions to Maintain Soil Productivity A Case Study from Central Europe
181
Grzebisz W amp Fotyma M (2007) Recommendations and use of potassium fertilizers in Central-Eastern Europe (CEE) In Proceedings International Fertiliser Society No 621 York UK pp 24 ISBN 978-0-85310-258-8
Grzebisz W Diatta J amp Haerdter R (2010) Fertilizer consumption patterns in Central European countries ndash effect on actual yield development trends in 1986-2005 years - a comparative study of the Czech Republic and Poland Journal of Central European Agriculture Vol 11 No 1 pp 73-82 ISSN 1332-9049
IFADATA Statistics online (2011) wwwfertilizerorgifastatisticsifadata datalineasp (Access 20110524)
Jongman R Bunce R amp Metzger R (2006) Objectives and applications of a statistical environmental stratification of Europe Landscape Ecology 21 409-419 ISSN 1572-9761
Karlen D Ditzler C amp Andrews S (2003) Soil quality why and how Geoderma Vol 114 pp 145-156 ISSN 0016-7061
Kelch D amp Osborne S (2001) Crop production capacity in EuropePrime Economic Research ServiceUSDA Agricultural outlookMarch 2001 19-23 ISSN 0099-1066
Marschner H (1991) Mechanisms of adaptation of plants to acid soils Plant and Soil 134 1-20 ISSN 1573-5036
Neumann K Verburg P amp Stehfest E (2010) The yield gap of global production a spatial analysis Agricultural Systems Vol 103 pp 316-326 ISSN 0308-521X
Nikolova M (1998) The soil potassium resources and the efficiency of potassium fertilizers in Bulgaria Nikola Poushkarow Inst of Soil Science and Agroecology Sofia Bulgaria IPI Country Report 12 39 pp
Olesen J amp Bindi M (2002) Consequences of climate change for European agricultural productivity land use and policy European Journal of Agronomy Vol 16 pp 239-262 ISSN 1161-0301
Olesen J Trnka M amp Kersebaum K (2011) Impacts and adaptation of European crop production systems to climate change European Journal of Agronomy Vol 34 pp 96-112 ISSN 1161-0301
Plant J Whittaker A amp Demitriades B (2005) The geological and tectonic framework of Europe Geochemical Atlas of Europe Part 1 Background Information Methodology Ed Salminen R Maps GTK FOREGS 20 pp ISBN 951-690-956-6
Rabbinge R (1993) The ecological background of food production In Crop protection and sustainable agriculture Wiley Chichester (Ciba Foundation Symposium 177 2-29 ISBN 10 0471939447
Rabbinge R amp Diepen C (2000) Changes in agriculture and land use in Europe European Journal of Agronomy Vol 13 pp 85-100 ISSN 1161-0301
Reilly J Fuglie K (1998) Future yield growth in field crops what evidence exists Soil amp Tillage Research Vol 47 pp 275-290 ISSN 0168-1987
Roberts T (2006) Improving Nutrient Use Efficiency Proceedings of the IFA Agriculture Conference Optimizing Resource Use Efficiency for Sustainable Intensification of Agriculture 27 february-2 March 2006 Kunming China pp 8
Rosegrant M Paisner M amp Meijer S (2001) Global Food Projections to 2020 Emerging trends and alternative futures IFPRI pp 206 ISBN 0-89629-640-7
wwwintechopencom
Soil Fertility Improvement and Integrated Nutrient Management ndash A Global Perspective
182
Sinclair T Purcell L amp Sneller C (2004) Crop transformation and the challenge to increase yield potential Trends in Plant Science Vol 9 No 2 pp 70-75 ISSN 136085
Struik P amp Bonciarelli F (1997) Resource use at the cropping system level European Journal of Agronomy Vol 7 pp 133-143 ISSN 1161-0301
Supit I van Diepen C amp de Wit A (2010) Recent changes in the climatic yield potential of various crops in Europe Agricultural Systems Vol 103 pp 683-694 ISSN 0308-521X
wwwintechopencom
Soil Fertility Improvement and Integrated Nutrient Management - AGlobal PerspectiveEdited by Dr Joann Whalen
ISBN 978-953-307-945-5Hard cover 306 pagesPublisher InTechPublished online 24 February 2012Published in print edition February 2012
InTech EuropeUniversity Campus STeP Ri Slavka Krautzeka 83A 51000 Rijeka Croatia Phone +385 (51) 770 447 Fax +385 (51) 686 166wwwintechopencom
InTech ChinaUnit 405 Office Block Hotel Equatorial Shanghai No65 Yan An Road (West) Shanghai 200040 China
Phone +86-21-62489820 Fax +86-21-62489821
Soil Fertility Improvement and Integrated Nutrient Management A Global Perspective presents 15 invitedchapters written by leading soil fertility experts The book is organized around three themes The first theme isSoil Mapping and Soil Fertility Testing describing spatial heterogeneity in soil nutrients within natural andmanaged ecosystems as well as up-to-date soil testing methods and information on how soil fertility indicatorsrespond to agricultural practices The second theme Organic and Inorganic Amendments for Soil FertilityImprovement describes fertilizing materials that provide important amounts of essential nutrients forplantsThe third theme Integrated Nutrient Management Planning Case Studies From Central Europe SouthAmerica and Africa highlights the principles of integrated nutrient management Additionally it gives casestudies explaining how this approach has been implemented successfully across large geographic regionsand at local scales to improve the productivity of staple crops and forages
How to referenceIn order to correctly reference this scholarly work feel free to copy and paste the following
Witold Grzebisz and Jean Diatta (2012) Constraints and Solutions to Maintain Soil Productivity A Case Studyfrom Central Europe Soil Fertility Improvement and Integrated Nutrient Management - A Global PerspectiveDr Joann Whalen (Ed) ISBN 978-953-307-945-5 InTech Available fromhttpwwwintechopencombookssoil-fertility-improvement-and-integrated-nutrient-management-a-global-perspectiveconstraints-and-solutions-to-maintain-soil-productivity-a-case-study-from-central-europe
copy 2012 The Author(s) Licensee IntechOpen This is an open access articledistributed under the terms of the Creative Commons Attribution 30License which permits unrestricted use distribution and reproduction inany medium provided the original work is properly cited
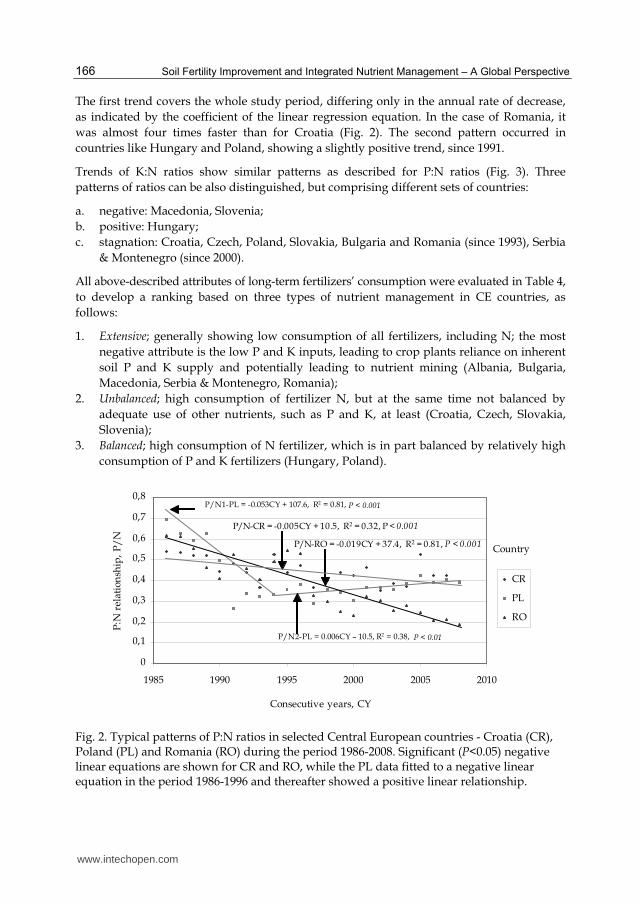
Soil Fertility Improvement and Integrated Nutrient Management ndash A Global Perspective
166
The first trend covers the whole study period differing only in the annual rate of decrease
as indicated by the coefficient of the linear regression equation In the case of Romania it
was almost four times faster than for Croatia (Fig 2) The second pattern occurred in
countries like Hungary and Poland showing a slightly positive trend since 1991
Trends of KN ratios show similar patterns as described for PN ratios (Fig 3) Three
patterns of ratios can be also distinguished but comprising different sets of countries
a negative Macedonia Slovenia
b positive Hungary
c stagnation Croatia Czech Poland Slovakia Bulgaria and Romania (since 1993) Serbia
amp Montenegro (since 2000)
All above-described attributes of long-term fertilizersrsquo consumption were evaluated in Table 4
to develop a ranking based on three types of nutrient management in CE countries as
follows
1 Extensive generally showing low consumption of all fertilizers including N the most
negative attribute is the low P and K inputs leading to crop plants reliance on inherent
soil P and K supply and potentially leading to nutrient mining (Albania Bulgaria
Macedonia Serbia amp Montenegro Romania)
2 Unbalanced high consumption of fertilizer N but at the same time not balanced by
adequate use of other nutrients such as P and K at least (Croatia Czech Slovakia
Slovenia)
3 Balanced high consumption of N fertilizer which is in part balanced by relatively high
consumption of P and K fertilizers (Hungary Poland)
0
01
02
03
04
05
06
07
08
1985 1990 1995 2000 2005 2010
Consecutive years CY
PN
rel
atio
nsh
ip
P
N
CR
PL
RO
Country
PN1-PL = -0053CY + 1076 R2 = 081 P lt 0001
PN2-PL = 0006CY ndash 105 R2 = 038 P lt 001
PN-CR = -0005CY + 105 R2 = 032 P lt 0001
PN-RO = -0019CY + 374 R2 = 081 P lt 0001
Fig 2 Typical patterns of PN ratios in selected Central European countries - Croatia (CR) Poland (PL) and Romania (RO) during the period 1986-2008 Significant (Plt005) negative linear equations are shown for CR and RO while the PL data fitted to a negative linear equation in the period 1986-1996 and thereafter showed a positive linear relationship
wwwintechopencom
Constraints and Solutions to Maintain Soil Productivity A Case Study from Central Europe
167
0
01
02
03
04
05
06
07
08
09
1985 1990 1995 2000 2005 2010
Consecutive years CY
KN
rel
atio
nsh
ip
K
N
CR
PL
RO
Country KN1-PL = -0066CY + 1323 R2 = 070 P lt 001
KN1-RO = -0044CY + 873 R2 = 083 P lt 0001
Fig 3 Typical patterns of KN ratios in selected Central European countries - Croatia (CR) Poland (PL) and Romania (RO) in the period 1986-2008 Significant (Plt005) negative linear equations are shown for CR and RO in the 1986-1992 period thereafter showed non-significant trends For CR the KN trend was non-significant for the whole period
Estimated Parameters
Country3
AL BampH BU CR CZ HU MC PL RO SampM SK SL
Nitrogen 01 0 0 ++ + + 0 + 0 0 + +-
Phosphorus 0 - - ++ 0 + + + - 0 0 +-
Potassium 0 0 0 ++ 0 + 0 + 0 0 0 0
PN 0 0 0 - - + 0 ++ - 0 0 -
KN 0 0 0 0 0 + - 0 0 0 0 -
Ranking2 0 0 0 2 2 1 0 1 0 0 2 2
1evaluation of trends ++ - increase +- restoration 0 - stagnation - - decrease +- - time variable 2 fertilizer management ranking 0 ndash extensive 1 ndash balanced 2 ndash unbalanced 3 Country acronyms are provided in Table 1
Table 4 Fertilizer consumption trends ndashsummary and country management ranking for countries in Central Europe during the period 1986 to 2008
32 Soil fertility status
Soil is considered as a slowly renewable or non-renewable resource that requires the same
level of protection as other limited resources like phosphorus rock There is strong
agreement that productivity of arable land depends on both a soilrsquos fertility potential (soil
quality inherent soil fertility) and present state of soil properties (soil health) to sustain
wwwintechopencom
Soil Fertility Improvement and Integrated Nutrient Management ndash A Global Perspective
168
primary production and other ecological functions The minimum data set to describe
current fertility status of arable land ie soil health should contain indicators reflecting
both past and actual organic matter content soil pH and management of nutrient soil
resources (Atkinson et al 2005 Karlen et al 2003)
Total organic carbon (TOC) stock in the topsoil (00-03 m) or its content () in arable soils is
a good descriptor of short-term trends in soil organic matter (SOM) management However
the organic carbon stock measured to a depth of 1 m in the soil profile can be considered as
an indicator of soil fertility potential The actual content of TOC in an averaged arable soil
unit was calculated by weighted mean content of organic carbon for main soil types (Batjes
2002) and its percentage share in the soil cover for each CE country (see Table 1) Analysis of
this data showed that TOC in the average topsoil unit of CE countries is insufficient ranging
from ca 60 (Poland) to 80 (Hungary) t TOC ha-1 ie about 14 to 18 TOC Differences
between CE countries can be evaluated by TOC stock in the soil profile to a depth of 1 m
Based on this criterion countries can be classified into three groups
a low ( le 120 t TOC ha-1) Croatia Poland b medium (121-160 t TOC ha-1 ) Albania Bulgaria Czech Republic Macedonia
Romania Serbia amp Montenegro Slovakia Slovenia c high (gt 161 t TOC ha-1) Hungary
Phosphorus and Potassium are key nutrients for achieving high productivity of arable soils
Available resources of both nutrients are the most important indicators of soil health ie its
current productivity The country status of current soil nutrient management was evaluated
by means of soil fertility index (SFI) expressed as the sum of the percentage share of arable
land characterised by the very high high and half of medium rating of available P or K
(Grzebisz amp Fotyma 2007) It has been assumed that SFI for P and K exceeding 70 of
arable land share is a prerequisite for high yield of any crop In the 1980s this target was
achieved in many countries of the region like Czechoslovakia Hungary and some countries
of the former Yugoslavia (Serbia amp Montenegro Slovenia) (Fig 4) In these countries the
rates of applied fertilizers were far in excess of crop removal capacity Poland in spite of
currently high K consumption differs from other CE countries The sufficiency level for P
and K of 70 was never reached due to much lower inherent soil potential for nutrient
supply At the beginning of 2000 significant changes of P and K fertility were recorded The
increase of the P sufficiency level was recorded only in Slovenia and Poland In Slovenia the
reason was high consumption of P fertilizers at the beginning of the 21st century In Poland
the increase is related to sufficiently well balanced use of N and P fertilizers and slightly
lower yields than in the 80s In all other CE countries the percentage of P-fertile soils
generally decreased nevertheless the rate of the decrease differed across the region A
slight decrease occurred in Czech and Slovak Republics as well as in Hungary The greatest
drop was recorded in Bulgaria followed by Serbia and Montenegro The potassium SFI
presents much more alarming trend As reported by Grzebisz amp Fotyma (2007) for countries
of the Northern Agricultural Zone (Czech Hungary Poland Slovakia) the K sufficiency
level decreased below the target value within two decades Based on K fertilizersrsquo
consumption trends it can be assumed that the same trend occurs also in the Southern
Zone
wwwintechopencom
Constraints and Solutions to Maintain Soil Productivity A Case Study from Central Europe
169
0
10
20
30
40
50
60
70
80
90
100
AL BU CZ H PL RO SE SK SL
Countries
P s
oil
fert
ility
in
de
x
A
L
1980s
2000s
Sufficiency level
Fig 4 Phosphorus soil fertility indices (expressed as the percentage of arable land AL) for selected CE countries during the period 1986 - 2008 (based on Csatho et al 2007) The sufficiency level was assumed to be 70 as described by Grzebisz amp Fotyma (2007) Country acronyms are given in Table 1
4 Soil productivity assessment
41 Long-term trends in crop yields
All CE countries grow the same crops and cereal species predominate The area sown with cereals occupies 64 of arable land in Croatia 52 - in the Czech Republic 68 - in Poland and 59 ndash in Romania In the Czech Republic cerealsrsquo production is dominated by wheat and barley but in Poland by wheat and rye In Romania and Croatia maize is the key grain crop Sugar beets due to EU regulation in the last 10 years are of minor importance but this crop is a good indicator of soil quality Therefore it has been assumed that these crops would reflect fairly well changes in current soil fertility status as a consequence of applied nutrient management strategies This assumption is well documented by observed variability of yields of wheat maize and sugar beets in selected countries of CE (Table 5) The highest variability was found for Romania and the lowest for Poland Romania is a country with an extensive pattern of fertilizersrsquo management typical in the Southern Agricultural Zone of Europe Poland belongs to countries of the Northern Zone but presents a balanced patterns of fertilizersrsquo management (Poland Hungary) Other selected countries are members of the Unbalanced fertilizing group of CE countries
The long-term yield trend can be used as an indicator of key crops sensitivity to past and current fertilizersrsquo management As in the case of fertilizersrsquo consumption trends three consecutive phases of yield development over the period 1986-2008 may be distinguished
1 Actual-Standard (AS) 2 Recession (RC) 3 Restoration (RS) or Stagnation (SG)
The observed trends of harvested yields were most pronounced for wheat other cereals and for seed crops like oil-seed rape (Grzebisz et al 2010) In the first phase of the study taking
wwwintechopencom
Soil Fertility Improvement and Integrated Nutrient Management ndash A Global Perspective
170
place at the end of the 80s yields of wheat reached on average the highest recorded levels Therefore this particular period is considered as a standard level (AS) for evaluating subsequent phases (Fig 5) The highest yield decline ie the recession phase (RC) in response to the collapse in fertilizer consumption took place in the Northern Zone but
Crops Croatia Czech Republic Poland Romania
x plusmn SD5 CV6 x plusmn SD CV x plusmn SD CV x plusmn SD CV
Wheat 40plusmn052
39plusmn033
44plusmn094
125
86
216
48plusmn05
51plusmn04
52plusmn06
102
78
113
36plusmn03
37plusmn02
39plusmn04
90
56
100
27plusmn06
31plusmn04
29plusmn08
212
141
265
Maize 49plusmn10
40plusmn09
55plusmn13
205
217
229
58plusmn13
51plusmn05
69plusmn05
214
93
76
52plusmn08
49plusmn02
56plusmn08
143
41
157
31plusmn08
29plusmn05
34plusmn11
244
180
315
Sugar
beet
404plusmn77
398plusmn49
487plusmn52
192
123
108
424plusmn76
345plusmn15
531plusmn49
180
42
49
381plusmn55
346plusmn19
451plusmn39
145
56
88
228plusmn51
213plusmn29
304plusmn33
222
136
108
1FAOSTAT available online 2011-05-24 21986-2008 31986-1990 42004-2008 5standard deviation 6coefficient of variation
Table 5 Statistical overview of key cropsrsquo yields (t ha-1) in selected Central European
countries during the period 1986-2008 in comparison to the AS phase and the 2004-2008
periods
0
1
2
3
4
5
6
7
1985 1990 1995 2000 2005 2010
Consecutive years CY
Gra
in y
ield
(Y
) t
ha-1
CZ
RO
Country
AS RC RE or ST
Y-CZ = 0056CY + 1089 R2 = 028 P lt 005
TYG
TYG
Legend level of harvested yield AS Actual-Standard RC Recession RE Restoration ST Stagnation
Dashed line refers to AS level of yield ie an average yield harvested in the period 1986-1990 TYG
Temporary Yield Gap
Fig 5 Long-term trends of wheat production in the Czech Republic (CZ) and Romania (RO)
during the period 1986-2008 Significant (Plt005) positive linear trend is shown for the
Czech Republic whereas non-significant for Romania in the period 1992-2008
wwwintechopencom
Constraints and Solutions to Maintain Soil Productivity A Case Study from Central Europe
171
lasted for only two or three years In other countries mainly representing the Southern Zone it was also fast or showed sustained depression The third phase of yield development was manifested in two distinct trends The first ldquorestorationrdquo trend has shown a positive yield gain since yield recession It was revealed in the Northern Zone countries and also for Croatia and Slovenia The second trend has not shown any significant change in yield since the recession resulting in yield stagnation The most interesting attribute of this trend is its high year-to-year variability The difference between the actually harvested and the AS yield has been termed as the temporary yield gap (TYG) (Fig 5) The time required to recover to the AS level was long but country specific In the Northern Zone it lasted for ca 10-12 years exceeding the AS level in 2004 or 2005 In most other countries representing the Southern Zone it has not been reached up to 2008 For maize and sugar beets the recession was also observed In the recovery period maize yields were generally positive but the rate of the yield increase was much higher in the Balanced and Unbalanced groups than in the Extensive group Sugar beets yield increase was very high at the beginning of the 90s exceeding the level reported in the 80s The main reason was a reduction in area sown with sugar beets which forced farmers to cultivate this crop on more fertile soils
42 The concept of partial factor fertilizer nitrogen productivity (PFPN)
This part of the study relies on two main conceptual pillars The first one assumes that each hectare of arable soil regardless of the current crop is supplied with the same amount of nutrients including nitrogen The second assumption takes into account the fact that the unit productivity of in-season applied fertilizer N known as PFPN is a reliable scientific tool to make simple but quick discrimination of factors limiting attainable crop yield (Dobermann amp Casman 2002) Therefore the PFPN index was used to evaluate some but selected CE countries that represent the three patterns of current fertilizer management (Table 4) Croatia and the Czech Republic have been selected as examples for the Unbalanced group whereas Poland is the Balanced group and Romania represents the Extensive group of fertilizersrsquo use
The PFPN index was obtained by dividing the actual yield of a respective crop harvested within a given year by the annual amount of N fertilizers consumed by the country assuming it was applied at an equal rate for all currently cultivated crops Operationally the PFPN index consists of two components
a yield of crop (Y) expressed in kg or t ha-1 b nitrogen fertilizer rate (FN) expressed as kg N ha-1
PFPN = YFN
Based on the long-term trends of PFPN indices for each of the key crops two different types of PFPN indices can be distinguished
1 The real partial factor productivity of applied N ndash (rPFPN) it reflects actual yields as limited by both water and N availability
2 The maximal partial factor productivity of applied N (mPFPN) it was calculated as the 4th quartile of rPFPN indices it refers to yields obtained under ample water supply
To make a reliable estimate of the yield gap for some crops cultivated in the CE the corrected partial factor productivity of applied N (cPFPN) instead of mPFPN has been applied
wwwintechopencom
Soil Fertility Improvement and Integrated Nutrient Management ndash A Global Perspective
172
Operationally it has been calculated as the average of the 4th quartile but excluding extremely elevated rPFPN values which emerged in most of investigated countries at the beginning of the 90s Indices of N productivity (PFPN rPFPN and cPFPN) were then used to calculate the yield gap
The calculated rPFPN indices showed as expected high year-to-year variability for all tested crops (Table 6) They were crop and country specific when averaged over the 1986-2008 period
a wheat CR lt CZ = PL lt RO b maize CR lt CZ lt PL lt RO c sugar beets CR = CZ lt PL lt RO
These ranges are not in line with long-term average yields of all crops which followed generally the order CZ gt CR gt PL gt RO
Maximum productivity of tested crops as evaluated for the 4th quartile of rPFPN indices was
much higher rising on average by 43 However the increase was country specific and
represents 63 for Croatia 28 for the Czech Republic 30 for Poland and 48 for
Romania The concept of mPFPN assumes an increase of rPFPN indices pursuant to higher
efficiency of applied fertilizer nitrogen due to ample water supply Its reliability has been
corroborated by low coefficients of variation implicitly indicating the potential productivity
of applied fertilizer nitrogen on the background of soil quality The sequences of countries
for each crop are as follows
a wheat CZ = PL lt CR lt RO b maize CR = CZ lt PL lt RO c sugar beets CZ lt PL lt CR lt RO
As presented in Table 6 coefficients of variations of cPFPN indices were significantly lower in comparison to mPFPN stressing on the reliability of the conducted analysis
Relationships between sets of developed rPFPN and applied fertilizer nitrogen rates can also be a useful tool for making long-term assessment of nitrogen efficiency This relationship fits the best the power function
rPFPN = 9112N-067 for R2 = 077 and n = 92
where N ndash annual rate of fertilizer nitrogen consumption kg N ha-1
Analysis of the general curve shape reveals decreasing yield per unit of N fertilizer applied with highest values of rPFPN It has been observed that irrespective of the applied N rate long-term productivity of fertilizer nitrogen increased in the order Romania lt Poland lt Croatia lt the Czech Republic However the obtained high rPFPN values are as a rule related to lower yields of harvested crops This pattern of crop response refers mostly to Bulgaria Romania and former Yugoslavia countries excluding Croatia and Slovenia As pointed out by Fixen (2004) the target of efficient N fertilizer management based on high fertilizer N use efficiency is counter-productive In this N supply system plants are forced to take up an appreciable amount of N from its soil resources which decreases their rate of growth in critical stages of yield performance Therefore ldquothe elevatedrdquo level of the PFPN could be used as an attribute of the extensive type of agriculture production
wwwintechopencom
Constraints and Solutions to Maintain Soil Productivity A Case Study from Central Europe
173
PFPN
index
Croatia Czech Republic Poland Romania
x plusmn SD1 CV2 x plusmn SD CV x plusmn SD CV x plusmn SD CV
Wheat kg yield kg N-1
rPFPN 48plusmn24 498 54plusmn13 235 54plusmn15 275 81plusmn33 405
mPFPN 80plusmn23 288 70plusmn11 160 72plusmn15 212 121plusmn14 119
cPFPN 63plusmn11 174 62plusmn4 59 62plusmn2 30 112plusmn8 69
Maize kg yield kg N-1
rPFPN 56plusmn26 464 66plusmn18 281 78plusmn21 263 95plusmn45 478
mPFPN 89plusmn29 288 89plusmn7 76 103plusmn11 102 149plusmn20 135
cPFPN 69plusmn10 151 89plusmn7 76 96plusmn2 24 137plusmn9 66
Sugar beets kg yield kg N-1
rPFPN 471plusmn224 477 478plusmn120 250 566plusmn136 240 695plusmn266 383
mPFPN 766plusmn218 285 588plusmn49 825 728plusmn67 93 977plusmn122 125
cPFPN 613plusmn86 141 588plusmn49 825 675plusmn35 52 905plusmn36 40
1standard deviation 2coefficient of variation
Table 6 Partial factor fertilizer N productivity statistics for key crops in selected Central European countries with unbalanced (Croatia Czech Republic) balanced (Poland) and extensive (Romania) fertilizersrsquo management during the period 1986-2008
43 Yield gap (YG) and its attributes
Actual yields of crops harvested by farmers in all areas of the world are much lower than
the yield potential of currently cultivated varieties under defined soil and climatic
conditions This ldquovirtualrdquo un-harvested portion of yield is generally termed the yield gap
(YG) (Evans amp Fisher 1999 Dobermann amp Cassman 2002) However the CE countries
experience another phenomenon known as the temporary yield gap (TYG) (Grzebisz et al
2010) The main reason of its emergence is the collapse in fertilizer use leading to elevation
of the rPFPN index Dibb (2000) relates extremely high N efficiency to low yield and this
trend was fully corroborated by the crop yield data from countries with extensive fertilizer
management Nevertheless the countries of the Northern Agricultural Zone (Czech
Republic Hungary Poland Slovakia) in spite of drastic decrease of consumed fertilizers in
the early 90s were characterized by high yields of wheat and other cereal crops (FAOSTAT
2011 Grzebisz et al 2010) The observed rPFPN indices extremely elevated at the beginning
of the 90s were a result of the residual effect of applied fertilizer N This phenomenon could
be manifested only under growth conditions created by ample water and sufficiently high
supply of immobile nutrients such as P and K in turn balancing N use by currently growing
crops
In the first step of yield gap calculation the cPFPN index was applied to assess the maximal
attainable yield (YAM) The yield gap was then calculated as a difference between really
harvestable yield (YA) and YAM
wwwintechopencom
Soil Fertility Improvement and Integrated Nutrient Management ndash A Global Perspective
174
YAM = cPFPN middot DN
YG = YA ndash YAM
where
DN is the rate of annually applied fertilizer N (kg N ha-1) YA is the actual yield in t ha-1 for a
given year and YAM is the maximal attainable yield (t ha-1)
The observed similarities of the general yield gap pattern over time for key crops allow to
distinguish three consecutive phases of its development in the period 1986-2008 (Fig 6)
1 First ndash primary deep yield gap to the left of the transition point (TP) 2 Second ndash point of extra yield gain TP 3 Third- secondary yield gap to the right of the TP alternatively yield gap stagnation as
indicated by the lack of significant (P lt 005) linear trend response
-7
-6
-5
-4
-3
-2
-1
0
1
2
1985 1990 1995 2000 2005 2010
Consecutive years CY
Yie
ld g
ap
(Y
G)
t h
a-1
CZ
RO
TP
YGd-CZ = 079CY - 1573 R2 = 070 P lt 001
YGd-RO = 068CY - 1354 R2 = 072 P lt 0001
YGr-CZ = -012CY + 2354 R2 = 046 P lt 0001
Country
Legend TP - Transition Point YGd - yield gap decline YGr - yield gap restoration
Fig 6 Evolution of the yield gap in wheat in the Czech Republic (CZ) and Romania (RO) during the period 1986 -2008 Significant (Plt005) positive linear equations are shown for the Czech Republic in the period 1986-92 and for Romania in the period 1986-1995 thereafter showed a negative linear relationship for the Czech Republic and non-significant trend for Romania
Wheat is the best example of the yield gap course in the CE countries stressing on the
difference in fertilizer management The main dissimilarities among countries do not refer
to the first phase The YG was deep in spite of relatively high yield indicating thus a low
capacity of contemporary cultivated varieties to achieve further gains in yield Much more
important were YG length and number of years to reach the TP The time to reach the TP
was shorter (6(7) years) in countries such as the Czech and Slovak Republics Hungary and
Poland and also in Croatia and Slovenia corresponding to rapid rebuilding of fertilizer
wwwintechopencom
Constraints and Solutions to Maintain Soil Productivity A Case Study from Central Europe
175
markets in these countries In countries with extensive fertilizersrsquo management the length of
the first phase extended up to mid-90s
The YG evaluation shows that the current nutrient management in CE countries can
overcome this phenomenon especially in the case of wheat and maize A TYG can be most
easily negated in countries belonging to Unbalanced or Balanced nutrient management
groups such as the Czech and Slovak Republics Hungary and Poland and also Croatia and
Slovenia In countries with extensive fertilizersrsquo management the TYG has not been
overcome and enters the third phase of yield development stagnation due to low use of
fertilizers in turn resulting in the very low and unstable level of annually harvested yields
44 Yield prognosis ndash The unassimilated nitrogen concept
The medium or long-term food and environmental policy strategies for any country or
particular region are supported by yield prognosis considered as an operational tool
However the ex-ante prognosis depends on the reliability of the data used Two approaches
both relying on the unit productivity of fertilizer nitrogen (PFPN) have been considered The
first assumes extrapolation of real and improved yields based on the linear model (Reilly amp
Fuglie 1998) The second one is based on long term trends of the YG but transformed into
unit of temporarily lost fertilizer nitrogen termed for the purposes of this study as
unassimilated nitrogen This approach as related to nitrogen management has been used to
make a prognosis of yields of key crops in the CE countries
Operationally the concept presented in this chapter assumes that the total amount of
applied fertilizer nitrogen (FN) is simply divided into three main pools i) assimilated
(FaN) ndash nitrogen taken up by meanwhile grown crop ii) unassimilated nitrogen (FuaN) ndash
temporary out of use by plants andor iii) lost from the field (FLN) The quantitative
assessment of the FuaN pool relies on the defined YG procedure individually related to
each investigated crop
FN = FaN + F uaN + FLN
FuaN = YGcPFPN
where
FuaN ndash unassimilated nitrogen kg N ha-1 YG - yield gap cPFPN ndash the corrected partial factor productivity of applied N kg yield kg N-1
In the first step of yield prognosis the Unassimilated Nitrogen Indices (IuaN) should be computed Therefore the original set of YG data for each of the studied crops was transformed into a quantitative amount of nitrogen lost temporarily from the system marked as minus (-IuaN) In the second step of the analysis both sets of actual (YA) and maximum attainable yields (YM) of each crop were regressed against corresponding set of
uaN indices The obtained regression models clearly show that actual yields over the period of 20 years did not respond significantly to the IuaN as reported in Fig 7 for wheat in Romania The positive and simultaneously significant trends were however achieved when the maximum attainable yield (YM) instead of the actual yield (YA) was introduced into the regression model It can be therefore hypothesized that any virtual loss of nitrogen
wwwintechopencom
Soil Fertility Improvement and Integrated Nutrient Management ndash A Global Perspective
176
ie the negative uaN indices reflect the potential status for a yield increase and vice versa Unfortunately the positive indices of the uaN simply describe a state of N soil mining which in turn causes direct yield decline This is consistent with the opinion of Dibb (2000) and typical for many parts of the world including most CE countries
YM = -0114uaN + 2703 R2 = 093 P lt 0001
0
1
2
3
4
5
6
7
8
9
10
-60 -50 -40 -30 -20 -10 0 10
Gra
in y
ield
(Y
) t
ha-1
YA
YM
Yield
type
Unassimilated nitrogen (uaN) kg N ha-1
Fig 7 Yield prognosis of winter wheat based on residual nitrogen - a case of Romania (RO) Significant (Plt005) linear equation represents the trend for the attainable yields in the 1986-2008 period Legend YA ndash actual yield YM ndash maximum yield
Reliable yield prognosis can be performed assuming a certain level of expected yield or by focusing any improvement of production technology on higher N use efficiency The first approach can be best presented for wheat The maximum attainable yield for this crop in Poland and the Czech Republic is fixed at the level of 65 t ha-1 but for Romania at 45 t ha-1 (Rabbinge amp van Diepen 2000) The amount of uaN required to be incorporated into grain yield was calculated by the models and amounted to 48 27 and 33 kg ha-1 respectively It is equal to 58 27 and 100 of annual N rate applied in these countries and does not seem a realistic approach The same rules refer to other key crops in the study Therefore the second concept relying on the ability of currently cultivated crops to fix an extra amount of
uaN seems to be a more realistic approach for making any reliable yield prognosis (Table 7) This assumption is highly promising especially for countries presenting an extensive type of agriculture production for example Romania The expected wheat increase in response to the use of extra 20 kg N ha-1 is possible considering the water limited yield fixed at 45 t ha-1 The prognosis for the Czech Republic is still below the water limited yield being at 65 t ha-1 In Poland the calculated yields are at the same level as Romania but soils are less suitable for wheat production Therefore any grain yield increase seems to be a great challenge for farmers in all countries of the CE In the light of yields prognosis for sugar beets the fixed level of uaN at 20 kg N ha-1 is generally too low The level of 60 t ha-1 of beets seems to be the most reliable short-term target Thereby the amount of uaN successfully managed should be established at the level of 30 kg ha-1
wwwintechopencom
Constraints and Solutions to Maintain Soil Productivity A Case Study from Central Europe
177
CropCountry Linear regression model Yield at 20 kg uaN t ha-1
Wheat
Croatia YM = -0064 uaN + 3989 for R2 = 096 527
Czech Rep YM = -0063 uaN + 4777 for R2 = 088 604
Poland YM = -0060 uaN + 3623 for R2 = 092 482
Romania YM = -0114 uaN + 2703 for R2 = 093 498
Maize
Croatia YM = -0069 uaN + 4852 for R2 = 086 623
Czech Rep YM = -0064 uaN + 6470 for R2 = 069 776
Poland YM = -0085 uaN + 5431 for R2 = 083 713
Romania YM = -0121 uaN + 3348 for R2 = 094 578
Sugar beets
Croatia YM = -0605 uaN + 40677 for R2 = 089 5278
Czech Rep YM = -0458 uaN + 45872 for R2 = 076 5503
Poland YM = -0609 uaN + 39801 for R2 = 081 5198
Romania YM = -0822 uaN + 24046 for R2 = 093 4049
Table 7 Yield prognosis based on the unassimilated quantity of nitrogen (uaN)
5 Soil productivity improvements The concept of NPK fertilizers balance
The simple comparison of CE countries with respect to nutrient management clearly shows
that annual inputs of nitrogen are too high with respect to phosphorus and potassium
Therefore the main reasons of general yield stagnation in most of the CE countries are long-
term negative balances of P and K caused by low input of both mineral and organic
fertilizers As a consequence of soil P and K long-term mining the percentage share of soils
rich in both nutrients declined in the last two decades below the sufficiency level which was
achieved in many countries in 80s (Csatho at al 2007 Grzebisz amp Fotyma 2007)
It has been clearly stressed that in the transition phase of yield development the PFPN indices
reached the highest values resulting in yield gain This phenomenon emerged in years 1990
1991 for Poland and Hungary and in 1991 1992 for the Czech and Slovak Republics In all
these years the supply of P and K fertilizers was low In the Czech Republic ratios between
amounts of applied N-P-K fertilizers expressed as NP2O5K2O was 1025025 on average
This structure in spite of decreased fertilizersrsquo consumption allowed farmers to achieve the
same yields of all crops as in the period 1986-1990 The present structure of nutrient use is as
1015015 for the Czech Republic and 10404 for Poland These disparate nutrient ratios
stress the importance of NPK balance for high crop production The proposed NPK ratio
for the Czech Republic based on the cPFPN index can be established at the level of
1025025 in good years ie under ample water supply or 1025050 in unfavorable years ie
under expected water stress Hence keeping the current level of fertilizers consumption on
arable land ca 130 kg ha-1 one can predict the right amount of nutrients to apply In Poland
the total amount of currently consumed fertilizers is almost the same as in the Czech
wwwintechopencom
Soil Fertility Improvement and Integrated Nutrient Management ndash A Global Perspective
178
Republic Unfortunately soils in Poland are much poorer in potassium and also in
phosphorus being therefore highly sensitive to external supply of nutrients This
conclusion is corroborated by positive trends of yields in response to P and K fertilizers
application as found for all crops since 1991 onwards Consequently under favorable
weather conditions or on soils naturally rich in potassium the suggested formulation of N-
P-K fertilizers is as follows 1033066 but in years with high probability of drought or on
areas sensitive to drought a slightly different formulation is recommended namely
100510
It is not easy to formulate any efficient fertilizing strategy for Romania Since mid- 90s maize and wheat have shown yield stagnation at a very low level The main factors responsible for this situation are i) low N fertilization rates ii) imbalanced use of P and K fertilizers Therefore yields of these two crops are in fact dependent only on the seasonal weather course fluctuating for ca 100 on a yearly scale basis The main reason is unbalanced consumption of basic fertilizers which leads to permanent soil mining especially potassium The NP2O5K2O relationships averaged for the period 2004-2008 as 1027009 is not sufficient to get any yield increase or even its stabilization Potassium accumulates in plant tissues in much higher amounts and is considered as useful nutrient in water management (Cakmak 2005) Thereby this nutrient seems to be crucial for crop production in Romania even taking into account that almost 50 of land area is covered by soil naturally rich in minerals containing K In spite of low N consumption but unbalanced nutrient management there is still a space for an extra N loss for both key crops ie wheat and maize (see Fig 7) Therefore it could be concluded that any yield increase depends on both significant N rate rise and simultaneous change of fertilizer formulations The operational N-P-K fertilizers ratios suggested for Romania are as follows 1033017 in favorable and 10404 in unfavorable years The second scenario should aim at increasing plant survival under drought conditions
6 Thoughts and prospects
The new era of agriculture development in the Central Europe revealed how actual
agriculture outcomes in this region depend on three key factors presented in descending
order i) weather conditions during the growth season ii) inherent soil fertility iii) nitrogen
fertilizer consumption At present the first factor is decisive for crop production High year-
to-year yield variability reflects the imbalanced use of soil and external resources such as
fertilizers Therefore maximum attainable yields ie limited by water supply for example
for wheat are not attainable in all countries of the region In Germany also part of the
Central European region actual yields are above the ldquowater limitedrdquo level (Rabbinge amp
Diepen 2000 Supit et al 2010)
Inherent differences in the nature of soil quality between the CE countries as a background
of nutrient management are strictly related to the soil origin (Plant et al 2005) Except for
Poland all other countries are relatively rich in soils originated from loams (Cambisols) and
loess (Chernozems) These soils exhibit a high inherent potential for supplying K and other
cations such as calcium and magnesium (Nikolova 1998)
However at present nutritional requirements of high yielding crops most of the CE countries are almost entirely oriented on the third yield forming factor ie nitrogen
wwwintechopencom
Constraints and Solutions to Maintain Soil Productivity A Case Study from Central Europe
179
fertilizer use It has been well recognized that a balanced supply of external sources of slowly mobile elements such as phosphorus and potassium is broadly expected (Atkinson et al 2005 Struik amp Bonciarelli 1997) Consequently the average actual and attainable yields of main crops in CE countries are much more related to the soil-adjusted potential than to amounts of currently applied fertilizers As a result CE countries show at present much greater differences in agricultural production than at the end of the 80s
The observed unfavorable patterns of N fertilizer long-term consumption creates problems not only for agriculture production but are also potentially dangerous for the environment as a potential source of reactive nitrogen (Roberts 2006) There are three main questions to be urgently answered by specialists in all countries of the CE region i) do farmers really recognize an increasing yield gap ii) what is the reason for farmers and their advisory services to tolerate low efficiency of nitrogen iii) do farmers and advisory services recognize environmental aspects of the increasing amount of residual nitrogen In order to get answers to these questions one has to be familiar with factors contributing to the improvement in N fertilizer use efficiency
1 Farm management of N in terms of i) N rate quantification ii) time of N fertilizers application and iii) method of N fertilizers application
2 Management of nutrients responsible for the efficiency of N uptake and it in-plant transformation
3 Management of production factors other than N
The first problem is not only of technical nature because it affects in-season nitrogen use
efficiency and in turn actual yieldsrsquo variability However CE countries representing the
restoration type of yield development but at the same time unbalanced pattern of
consumed fertilizers do not indicate needs for increasing actually applied N rates This
strategy is to some extent the core of yield improvement in countries presenting stagnated
type of fertilizersrsquo management provided that any increase in N use will be compensated by
adequate amounts of applied phosphorus and potassium
It could finally be concluded that the realization of both goals of agricultural production in
the CE countries ie i) long-term yield stabilization and even its increase and ii) unit
productivity of the applied fertilizer N increase in turn decreasing amounts of the residual
N requires in the coming future changes in the structure of fertilizersrsquo consumption
keeping in the Unbalanced group of countries the same level of applied fertilizers The
problem of nutrients supply to a growing plant does not however refer only to the balanced
amounts of the applied fertilizers but also to the crop accessibility to soil natural nutrient
pools This problem is inherently related to conditions of root system growth in the soil
body There are a lot of factors limiting roots accessibility to water and nutrients even in
soils of high natural fertility which have been forgotten in the last 50 years but the most
important is soil acidy and related toxicity of aluminum (Atkinson et al 2005 Diatta et al
2010 Marschner 1991 Struik and Bonciarelli 1997) The key strategic target for farmers is to
increase soil volume directly occupied by plant roots in order to improve their access to
unavailable pools of nutrients Three main areas of soil productivity improvement via
increasing crop plants accessibility to nutrients in the subsoil at least may be considered i)
regulation of soil reaction ii) increase of organic matter content iii) removing of any kind of
hardpans It seems highly probable that in the case of Poland all three groups of measures
wwwintechopencom
Soil Fertility Improvement and Integrated Nutrient Management ndash A Global Perspective
180
are important In other countries of the CE soil acidity should be considered as an
agronomical problem for farmers conducting production on Luvisols
7 References
Atkinson A Black K amp Dawson L (2005) Prospects advantages and limitations of future crop production systems dependent upon the management processes Annals of Applied Biology Vol 146 pp 203-215 ISSN 1744-7348
Batjes H (2002) Carbon and nitrogen stocks in the soils of Central and Eastern Europe Soil Use Management Vol 18 pp 324-329 ISSN 1475-2743
Cakmak I (2005) The role of potassium in alleviating detrimental effects of abiotic stresses in plants Journal of Plant Nutrition Soil Science Vol 168 pp 521-530 ISSN 1436-8730
Catt J (2001) The agricultural importance of loess Earth-Science Reviews Vol 54 pp 213-229 ISSN 0012-8252
Cochrane N (2004) EU Enlargement Implications for US_EU agricultural relations US-EU Food and Agriculture ComaprisonWRS-04-04 78-86 Available online at
httpwwwersusdagovpublicationsWRS0404WRS0404pdf (Access 20110524)
Csatho P Sisak I amp Radimszky L (2007) Agriculture as a source of phosphorus causing eutrophication in Central and Eastern Europe Soil Use management Vol 23 (suppl 1) pp 36-56 ISSN 1475-2743
Csatho P amp Radimszky L (2009) Two Worlds within EU27 Sharp Contrasts in Organic and Mineral Nitrogen-Phosphorus Use Nitrogen-Phosphorus Balances and Soil Phosphorus Status Widening and Deepening Gap between Western and Central Europe Communications in Soil Science and Plant Analysis Vol 40 pp 999-1019 ISSN 0010-3624
Diatta J Bocianowski J amp Skubiszewska A (2010) Sulphate-based aluminum phytotoxicity mitigation under strong soil acidification Fresenius Environmental Bulletin Vol 19 No 12b pp 3185-3192 ISSN 1018-4619
Dibb D (2000) The mysteries (myths) of nutrient use efficiency Better Crops Vol 84 No 3 pp 3ndash5 ISSN 0006-0089
Dobermann A amp Cassman K (2002) Plant nutrient management for enhanced productivity in intensive grain production systems of the United States and Asia Plant and Soil Vol 247 pp 153-175 ISSN 1573-5036
Evans L amp Fisher R (1999) Yield potential its definition measurement and significance Crop Science Vol 39 pp 1544-1551 ISSN 1896-0782
Falloon P amp Betts R (2010) Climate impacts on European agriculture and water management in the context of adaptation and mitigation ndash the importance of integrated approach Science of Total Environment Vol 408 pp 5667-5687 ISSN 0048-9697
FAOSTAT Available online at httpfaostatfaoorgdefaultaspx (Access 20110524) Fixen P (2004) Phases in narrowing the yield gap Better Crops Vol 88 No 4 p 3 ISSN
0006-0089 Fronzek S amp Carter T (2007) Assessing uncertainties in climate change impacts on
resource potential for Europe based on projections from RCMs and GCMs Climate Change Vol 81 pp 357-371 ISSN 1758-6798
wwwintechopencom
Constraints and Solutions to Maintain Soil Productivity A Case Study from Central Europe
181
Grzebisz W amp Fotyma M (2007) Recommendations and use of potassium fertilizers in Central-Eastern Europe (CEE) In Proceedings International Fertiliser Society No 621 York UK pp 24 ISBN 978-0-85310-258-8
Grzebisz W Diatta J amp Haerdter R (2010) Fertilizer consumption patterns in Central European countries ndash effect on actual yield development trends in 1986-2005 years - a comparative study of the Czech Republic and Poland Journal of Central European Agriculture Vol 11 No 1 pp 73-82 ISSN 1332-9049
IFADATA Statistics online (2011) wwwfertilizerorgifastatisticsifadata datalineasp (Access 20110524)
Jongman R Bunce R amp Metzger R (2006) Objectives and applications of a statistical environmental stratification of Europe Landscape Ecology 21 409-419 ISSN 1572-9761
Karlen D Ditzler C amp Andrews S (2003) Soil quality why and how Geoderma Vol 114 pp 145-156 ISSN 0016-7061
Kelch D amp Osborne S (2001) Crop production capacity in EuropePrime Economic Research ServiceUSDA Agricultural outlookMarch 2001 19-23 ISSN 0099-1066
Marschner H (1991) Mechanisms of adaptation of plants to acid soils Plant and Soil 134 1-20 ISSN 1573-5036
Neumann K Verburg P amp Stehfest E (2010) The yield gap of global production a spatial analysis Agricultural Systems Vol 103 pp 316-326 ISSN 0308-521X
Nikolova M (1998) The soil potassium resources and the efficiency of potassium fertilizers in Bulgaria Nikola Poushkarow Inst of Soil Science and Agroecology Sofia Bulgaria IPI Country Report 12 39 pp
Olesen J amp Bindi M (2002) Consequences of climate change for European agricultural productivity land use and policy European Journal of Agronomy Vol 16 pp 239-262 ISSN 1161-0301
Olesen J Trnka M amp Kersebaum K (2011) Impacts and adaptation of European crop production systems to climate change European Journal of Agronomy Vol 34 pp 96-112 ISSN 1161-0301
Plant J Whittaker A amp Demitriades B (2005) The geological and tectonic framework of Europe Geochemical Atlas of Europe Part 1 Background Information Methodology Ed Salminen R Maps GTK FOREGS 20 pp ISBN 951-690-956-6
Rabbinge R (1993) The ecological background of food production In Crop protection and sustainable agriculture Wiley Chichester (Ciba Foundation Symposium 177 2-29 ISBN 10 0471939447
Rabbinge R amp Diepen C (2000) Changes in agriculture and land use in Europe European Journal of Agronomy Vol 13 pp 85-100 ISSN 1161-0301
Reilly J Fuglie K (1998) Future yield growth in field crops what evidence exists Soil amp Tillage Research Vol 47 pp 275-290 ISSN 0168-1987
Roberts T (2006) Improving Nutrient Use Efficiency Proceedings of the IFA Agriculture Conference Optimizing Resource Use Efficiency for Sustainable Intensification of Agriculture 27 february-2 March 2006 Kunming China pp 8
Rosegrant M Paisner M amp Meijer S (2001) Global Food Projections to 2020 Emerging trends and alternative futures IFPRI pp 206 ISBN 0-89629-640-7
wwwintechopencom
Soil Fertility Improvement and Integrated Nutrient Management ndash A Global Perspective
182
Sinclair T Purcell L amp Sneller C (2004) Crop transformation and the challenge to increase yield potential Trends in Plant Science Vol 9 No 2 pp 70-75 ISSN 136085
Struik P amp Bonciarelli F (1997) Resource use at the cropping system level European Journal of Agronomy Vol 7 pp 133-143 ISSN 1161-0301
Supit I van Diepen C amp de Wit A (2010) Recent changes in the climatic yield potential of various crops in Europe Agricultural Systems Vol 103 pp 683-694 ISSN 0308-521X
wwwintechopencom
Soil Fertility Improvement and Integrated Nutrient Management - AGlobal PerspectiveEdited by Dr Joann Whalen
ISBN 978-953-307-945-5Hard cover 306 pagesPublisher InTechPublished online 24 February 2012Published in print edition February 2012
InTech EuropeUniversity Campus STeP Ri Slavka Krautzeka 83A 51000 Rijeka Croatia Phone +385 (51) 770 447 Fax +385 (51) 686 166wwwintechopencom
InTech ChinaUnit 405 Office Block Hotel Equatorial Shanghai No65 Yan An Road (West) Shanghai 200040 China
Phone +86-21-62489820 Fax +86-21-62489821
Soil Fertility Improvement and Integrated Nutrient Management A Global Perspective presents 15 invitedchapters written by leading soil fertility experts The book is organized around three themes The first theme isSoil Mapping and Soil Fertility Testing describing spatial heterogeneity in soil nutrients within natural andmanaged ecosystems as well as up-to-date soil testing methods and information on how soil fertility indicatorsrespond to agricultural practices The second theme Organic and Inorganic Amendments for Soil FertilityImprovement describes fertilizing materials that provide important amounts of essential nutrients forplantsThe third theme Integrated Nutrient Management Planning Case Studies From Central Europe SouthAmerica and Africa highlights the principles of integrated nutrient management Additionally it gives casestudies explaining how this approach has been implemented successfully across large geographic regionsand at local scales to improve the productivity of staple crops and forages
How to referenceIn order to correctly reference this scholarly work feel free to copy and paste the following
Witold Grzebisz and Jean Diatta (2012) Constraints and Solutions to Maintain Soil Productivity A Case Studyfrom Central Europe Soil Fertility Improvement and Integrated Nutrient Management - A Global PerspectiveDr Joann Whalen (Ed) ISBN 978-953-307-945-5 InTech Available fromhttpwwwintechopencombookssoil-fertility-improvement-and-integrated-nutrient-management-a-global-perspectiveconstraints-and-solutions-to-maintain-soil-productivity-a-case-study-from-central-europe
copy 2012 The Author(s) Licensee IntechOpen This is an open access articledistributed under the terms of the Creative Commons Attribution 30License which permits unrestricted use distribution and reproduction inany medium provided the original work is properly cited
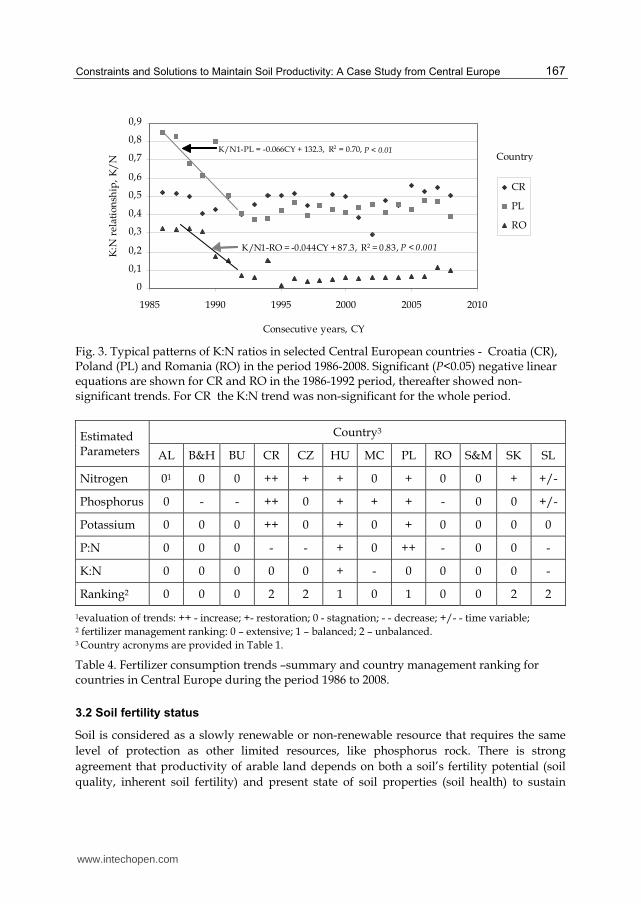
Constraints and Solutions to Maintain Soil Productivity A Case Study from Central Europe
167
0
01
02
03
04
05
06
07
08
09
1985 1990 1995 2000 2005 2010
Consecutive years CY
KN
rel
atio
nsh
ip
K
N
CR
PL
RO
Country KN1-PL = -0066CY + 1323 R2 = 070 P lt 001
KN1-RO = -0044CY + 873 R2 = 083 P lt 0001
Fig 3 Typical patterns of KN ratios in selected Central European countries - Croatia (CR) Poland (PL) and Romania (RO) in the period 1986-2008 Significant (Plt005) negative linear equations are shown for CR and RO in the 1986-1992 period thereafter showed non-significant trends For CR the KN trend was non-significant for the whole period
Estimated Parameters
Country3
AL BampH BU CR CZ HU MC PL RO SampM SK SL
Nitrogen 01 0 0 ++ + + 0 + 0 0 + +-
Phosphorus 0 - - ++ 0 + + + - 0 0 +-
Potassium 0 0 0 ++ 0 + 0 + 0 0 0 0
PN 0 0 0 - - + 0 ++ - 0 0 -
KN 0 0 0 0 0 + - 0 0 0 0 -
Ranking2 0 0 0 2 2 1 0 1 0 0 2 2
1evaluation of trends ++ - increase +- restoration 0 - stagnation - - decrease +- - time variable 2 fertilizer management ranking 0 ndash extensive 1 ndash balanced 2 ndash unbalanced 3 Country acronyms are provided in Table 1
Table 4 Fertilizer consumption trends ndashsummary and country management ranking for countries in Central Europe during the period 1986 to 2008
32 Soil fertility status
Soil is considered as a slowly renewable or non-renewable resource that requires the same
level of protection as other limited resources like phosphorus rock There is strong
agreement that productivity of arable land depends on both a soilrsquos fertility potential (soil
quality inherent soil fertility) and present state of soil properties (soil health) to sustain
wwwintechopencom
Soil Fertility Improvement and Integrated Nutrient Management ndash A Global Perspective
168
primary production and other ecological functions The minimum data set to describe
current fertility status of arable land ie soil health should contain indicators reflecting
both past and actual organic matter content soil pH and management of nutrient soil
resources (Atkinson et al 2005 Karlen et al 2003)
Total organic carbon (TOC) stock in the topsoil (00-03 m) or its content () in arable soils is
a good descriptor of short-term trends in soil organic matter (SOM) management However
the organic carbon stock measured to a depth of 1 m in the soil profile can be considered as
an indicator of soil fertility potential The actual content of TOC in an averaged arable soil
unit was calculated by weighted mean content of organic carbon for main soil types (Batjes
2002) and its percentage share in the soil cover for each CE country (see Table 1) Analysis of
this data showed that TOC in the average topsoil unit of CE countries is insufficient ranging
from ca 60 (Poland) to 80 (Hungary) t TOC ha-1 ie about 14 to 18 TOC Differences
between CE countries can be evaluated by TOC stock in the soil profile to a depth of 1 m
Based on this criterion countries can be classified into three groups
a low ( le 120 t TOC ha-1) Croatia Poland b medium (121-160 t TOC ha-1 ) Albania Bulgaria Czech Republic Macedonia
Romania Serbia amp Montenegro Slovakia Slovenia c high (gt 161 t TOC ha-1) Hungary
Phosphorus and Potassium are key nutrients for achieving high productivity of arable soils
Available resources of both nutrients are the most important indicators of soil health ie its
current productivity The country status of current soil nutrient management was evaluated
by means of soil fertility index (SFI) expressed as the sum of the percentage share of arable
land characterised by the very high high and half of medium rating of available P or K
(Grzebisz amp Fotyma 2007) It has been assumed that SFI for P and K exceeding 70 of
arable land share is a prerequisite for high yield of any crop In the 1980s this target was
achieved in many countries of the region like Czechoslovakia Hungary and some countries
of the former Yugoslavia (Serbia amp Montenegro Slovenia) (Fig 4) In these countries the
rates of applied fertilizers were far in excess of crop removal capacity Poland in spite of
currently high K consumption differs from other CE countries The sufficiency level for P
and K of 70 was never reached due to much lower inherent soil potential for nutrient
supply At the beginning of 2000 significant changes of P and K fertility were recorded The
increase of the P sufficiency level was recorded only in Slovenia and Poland In Slovenia the
reason was high consumption of P fertilizers at the beginning of the 21st century In Poland
the increase is related to sufficiently well balanced use of N and P fertilizers and slightly
lower yields than in the 80s In all other CE countries the percentage of P-fertile soils
generally decreased nevertheless the rate of the decrease differed across the region A
slight decrease occurred in Czech and Slovak Republics as well as in Hungary The greatest
drop was recorded in Bulgaria followed by Serbia and Montenegro The potassium SFI
presents much more alarming trend As reported by Grzebisz amp Fotyma (2007) for countries
of the Northern Agricultural Zone (Czech Hungary Poland Slovakia) the K sufficiency
level decreased below the target value within two decades Based on K fertilizersrsquo
consumption trends it can be assumed that the same trend occurs also in the Southern
Zone
wwwintechopencom
Constraints and Solutions to Maintain Soil Productivity A Case Study from Central Europe
169
0
10
20
30
40
50
60
70
80
90
100
AL BU CZ H PL RO SE SK SL
Countries
P s
oil
fert
ility
in
de
x
A
L
1980s
2000s
Sufficiency level
Fig 4 Phosphorus soil fertility indices (expressed as the percentage of arable land AL) for selected CE countries during the period 1986 - 2008 (based on Csatho et al 2007) The sufficiency level was assumed to be 70 as described by Grzebisz amp Fotyma (2007) Country acronyms are given in Table 1
4 Soil productivity assessment
41 Long-term trends in crop yields
All CE countries grow the same crops and cereal species predominate The area sown with cereals occupies 64 of arable land in Croatia 52 - in the Czech Republic 68 - in Poland and 59 ndash in Romania In the Czech Republic cerealsrsquo production is dominated by wheat and barley but in Poland by wheat and rye In Romania and Croatia maize is the key grain crop Sugar beets due to EU regulation in the last 10 years are of minor importance but this crop is a good indicator of soil quality Therefore it has been assumed that these crops would reflect fairly well changes in current soil fertility status as a consequence of applied nutrient management strategies This assumption is well documented by observed variability of yields of wheat maize and sugar beets in selected countries of CE (Table 5) The highest variability was found for Romania and the lowest for Poland Romania is a country with an extensive pattern of fertilizersrsquo management typical in the Southern Agricultural Zone of Europe Poland belongs to countries of the Northern Zone but presents a balanced patterns of fertilizersrsquo management (Poland Hungary) Other selected countries are members of the Unbalanced fertilizing group of CE countries
The long-term yield trend can be used as an indicator of key crops sensitivity to past and current fertilizersrsquo management As in the case of fertilizersrsquo consumption trends three consecutive phases of yield development over the period 1986-2008 may be distinguished
1 Actual-Standard (AS) 2 Recession (RC) 3 Restoration (RS) or Stagnation (SG)
The observed trends of harvested yields were most pronounced for wheat other cereals and for seed crops like oil-seed rape (Grzebisz et al 2010) In the first phase of the study taking
wwwintechopencom
Soil Fertility Improvement and Integrated Nutrient Management ndash A Global Perspective
170
place at the end of the 80s yields of wheat reached on average the highest recorded levels Therefore this particular period is considered as a standard level (AS) for evaluating subsequent phases (Fig 5) The highest yield decline ie the recession phase (RC) in response to the collapse in fertilizer consumption took place in the Northern Zone but
Crops Croatia Czech Republic Poland Romania
x plusmn SD5 CV6 x plusmn SD CV x plusmn SD CV x plusmn SD CV
Wheat 40plusmn052
39plusmn033
44plusmn094
125
86
216
48plusmn05
51plusmn04
52plusmn06
102
78
113
36plusmn03
37plusmn02
39plusmn04
90
56
100
27plusmn06
31plusmn04
29plusmn08
212
141
265
Maize 49plusmn10
40plusmn09
55plusmn13
205
217
229
58plusmn13
51plusmn05
69plusmn05
214
93
76
52plusmn08
49plusmn02
56plusmn08
143
41
157
31plusmn08
29plusmn05
34plusmn11
244
180
315
Sugar
beet
404plusmn77
398plusmn49
487plusmn52
192
123
108
424plusmn76
345plusmn15
531plusmn49
180
42
49
381plusmn55
346plusmn19
451plusmn39
145
56
88
228plusmn51
213plusmn29
304plusmn33
222
136
108
1FAOSTAT available online 2011-05-24 21986-2008 31986-1990 42004-2008 5standard deviation 6coefficient of variation
Table 5 Statistical overview of key cropsrsquo yields (t ha-1) in selected Central European
countries during the period 1986-2008 in comparison to the AS phase and the 2004-2008
periods
0
1
2
3
4
5
6
7
1985 1990 1995 2000 2005 2010
Consecutive years CY
Gra
in y
ield
(Y
) t
ha-1
CZ
RO
Country
AS RC RE or ST
Y-CZ = 0056CY + 1089 R2 = 028 P lt 005
TYG
TYG
Legend level of harvested yield AS Actual-Standard RC Recession RE Restoration ST Stagnation
Dashed line refers to AS level of yield ie an average yield harvested in the period 1986-1990 TYG
Temporary Yield Gap
Fig 5 Long-term trends of wheat production in the Czech Republic (CZ) and Romania (RO)
during the period 1986-2008 Significant (Plt005) positive linear trend is shown for the
Czech Republic whereas non-significant for Romania in the period 1992-2008
wwwintechopencom
Constraints and Solutions to Maintain Soil Productivity A Case Study from Central Europe
171
lasted for only two or three years In other countries mainly representing the Southern Zone it was also fast or showed sustained depression The third phase of yield development was manifested in two distinct trends The first ldquorestorationrdquo trend has shown a positive yield gain since yield recession It was revealed in the Northern Zone countries and also for Croatia and Slovenia The second trend has not shown any significant change in yield since the recession resulting in yield stagnation The most interesting attribute of this trend is its high year-to-year variability The difference between the actually harvested and the AS yield has been termed as the temporary yield gap (TYG) (Fig 5) The time required to recover to the AS level was long but country specific In the Northern Zone it lasted for ca 10-12 years exceeding the AS level in 2004 or 2005 In most other countries representing the Southern Zone it has not been reached up to 2008 For maize and sugar beets the recession was also observed In the recovery period maize yields were generally positive but the rate of the yield increase was much higher in the Balanced and Unbalanced groups than in the Extensive group Sugar beets yield increase was very high at the beginning of the 90s exceeding the level reported in the 80s The main reason was a reduction in area sown with sugar beets which forced farmers to cultivate this crop on more fertile soils
42 The concept of partial factor fertilizer nitrogen productivity (PFPN)
This part of the study relies on two main conceptual pillars The first one assumes that each hectare of arable soil regardless of the current crop is supplied with the same amount of nutrients including nitrogen The second assumption takes into account the fact that the unit productivity of in-season applied fertilizer N known as PFPN is a reliable scientific tool to make simple but quick discrimination of factors limiting attainable crop yield (Dobermann amp Casman 2002) Therefore the PFPN index was used to evaluate some but selected CE countries that represent the three patterns of current fertilizer management (Table 4) Croatia and the Czech Republic have been selected as examples for the Unbalanced group whereas Poland is the Balanced group and Romania represents the Extensive group of fertilizersrsquo use
The PFPN index was obtained by dividing the actual yield of a respective crop harvested within a given year by the annual amount of N fertilizers consumed by the country assuming it was applied at an equal rate for all currently cultivated crops Operationally the PFPN index consists of two components
a yield of crop (Y) expressed in kg or t ha-1 b nitrogen fertilizer rate (FN) expressed as kg N ha-1
PFPN = YFN
Based on the long-term trends of PFPN indices for each of the key crops two different types of PFPN indices can be distinguished
1 The real partial factor productivity of applied N ndash (rPFPN) it reflects actual yields as limited by both water and N availability
2 The maximal partial factor productivity of applied N (mPFPN) it was calculated as the 4th quartile of rPFPN indices it refers to yields obtained under ample water supply
To make a reliable estimate of the yield gap for some crops cultivated in the CE the corrected partial factor productivity of applied N (cPFPN) instead of mPFPN has been applied
wwwintechopencom
Soil Fertility Improvement and Integrated Nutrient Management ndash A Global Perspective
172
Operationally it has been calculated as the average of the 4th quartile but excluding extremely elevated rPFPN values which emerged in most of investigated countries at the beginning of the 90s Indices of N productivity (PFPN rPFPN and cPFPN) were then used to calculate the yield gap
The calculated rPFPN indices showed as expected high year-to-year variability for all tested crops (Table 6) They were crop and country specific when averaged over the 1986-2008 period
a wheat CR lt CZ = PL lt RO b maize CR lt CZ lt PL lt RO c sugar beets CR = CZ lt PL lt RO
These ranges are not in line with long-term average yields of all crops which followed generally the order CZ gt CR gt PL gt RO
Maximum productivity of tested crops as evaluated for the 4th quartile of rPFPN indices was
much higher rising on average by 43 However the increase was country specific and
represents 63 for Croatia 28 for the Czech Republic 30 for Poland and 48 for
Romania The concept of mPFPN assumes an increase of rPFPN indices pursuant to higher
efficiency of applied fertilizer nitrogen due to ample water supply Its reliability has been
corroborated by low coefficients of variation implicitly indicating the potential productivity
of applied fertilizer nitrogen on the background of soil quality The sequences of countries
for each crop are as follows
a wheat CZ = PL lt CR lt RO b maize CR = CZ lt PL lt RO c sugar beets CZ lt PL lt CR lt RO
As presented in Table 6 coefficients of variations of cPFPN indices were significantly lower in comparison to mPFPN stressing on the reliability of the conducted analysis
Relationships between sets of developed rPFPN and applied fertilizer nitrogen rates can also be a useful tool for making long-term assessment of nitrogen efficiency This relationship fits the best the power function
rPFPN = 9112N-067 for R2 = 077 and n = 92
where N ndash annual rate of fertilizer nitrogen consumption kg N ha-1
Analysis of the general curve shape reveals decreasing yield per unit of N fertilizer applied with highest values of rPFPN It has been observed that irrespective of the applied N rate long-term productivity of fertilizer nitrogen increased in the order Romania lt Poland lt Croatia lt the Czech Republic However the obtained high rPFPN values are as a rule related to lower yields of harvested crops This pattern of crop response refers mostly to Bulgaria Romania and former Yugoslavia countries excluding Croatia and Slovenia As pointed out by Fixen (2004) the target of efficient N fertilizer management based on high fertilizer N use efficiency is counter-productive In this N supply system plants are forced to take up an appreciable amount of N from its soil resources which decreases their rate of growth in critical stages of yield performance Therefore ldquothe elevatedrdquo level of the PFPN could be used as an attribute of the extensive type of agriculture production
wwwintechopencom
Constraints and Solutions to Maintain Soil Productivity A Case Study from Central Europe
173
PFPN
index
Croatia Czech Republic Poland Romania
x plusmn SD1 CV2 x plusmn SD CV x plusmn SD CV x plusmn SD CV
Wheat kg yield kg N-1
rPFPN 48plusmn24 498 54plusmn13 235 54plusmn15 275 81plusmn33 405
mPFPN 80plusmn23 288 70plusmn11 160 72plusmn15 212 121plusmn14 119
cPFPN 63plusmn11 174 62plusmn4 59 62plusmn2 30 112plusmn8 69
Maize kg yield kg N-1
rPFPN 56plusmn26 464 66plusmn18 281 78plusmn21 263 95plusmn45 478
mPFPN 89plusmn29 288 89plusmn7 76 103plusmn11 102 149plusmn20 135
cPFPN 69plusmn10 151 89plusmn7 76 96plusmn2 24 137plusmn9 66
Sugar beets kg yield kg N-1
rPFPN 471plusmn224 477 478plusmn120 250 566plusmn136 240 695plusmn266 383
mPFPN 766plusmn218 285 588plusmn49 825 728plusmn67 93 977plusmn122 125
cPFPN 613plusmn86 141 588plusmn49 825 675plusmn35 52 905plusmn36 40
1standard deviation 2coefficient of variation
Table 6 Partial factor fertilizer N productivity statistics for key crops in selected Central European countries with unbalanced (Croatia Czech Republic) balanced (Poland) and extensive (Romania) fertilizersrsquo management during the period 1986-2008
43 Yield gap (YG) and its attributes
Actual yields of crops harvested by farmers in all areas of the world are much lower than
the yield potential of currently cultivated varieties under defined soil and climatic
conditions This ldquovirtualrdquo un-harvested portion of yield is generally termed the yield gap
(YG) (Evans amp Fisher 1999 Dobermann amp Cassman 2002) However the CE countries
experience another phenomenon known as the temporary yield gap (TYG) (Grzebisz et al
2010) The main reason of its emergence is the collapse in fertilizer use leading to elevation
of the rPFPN index Dibb (2000) relates extremely high N efficiency to low yield and this
trend was fully corroborated by the crop yield data from countries with extensive fertilizer
management Nevertheless the countries of the Northern Agricultural Zone (Czech
Republic Hungary Poland Slovakia) in spite of drastic decrease of consumed fertilizers in
the early 90s were characterized by high yields of wheat and other cereal crops (FAOSTAT
2011 Grzebisz et al 2010) The observed rPFPN indices extremely elevated at the beginning
of the 90s were a result of the residual effect of applied fertilizer N This phenomenon could
be manifested only under growth conditions created by ample water and sufficiently high
supply of immobile nutrients such as P and K in turn balancing N use by currently growing
crops
In the first step of yield gap calculation the cPFPN index was applied to assess the maximal
attainable yield (YAM) The yield gap was then calculated as a difference between really
harvestable yield (YA) and YAM
wwwintechopencom
Soil Fertility Improvement and Integrated Nutrient Management ndash A Global Perspective
174
YAM = cPFPN middot DN
YG = YA ndash YAM
where
DN is the rate of annually applied fertilizer N (kg N ha-1) YA is the actual yield in t ha-1 for a
given year and YAM is the maximal attainable yield (t ha-1)
The observed similarities of the general yield gap pattern over time for key crops allow to
distinguish three consecutive phases of its development in the period 1986-2008 (Fig 6)
1 First ndash primary deep yield gap to the left of the transition point (TP) 2 Second ndash point of extra yield gain TP 3 Third- secondary yield gap to the right of the TP alternatively yield gap stagnation as
indicated by the lack of significant (P lt 005) linear trend response
-7
-6
-5
-4
-3
-2
-1
0
1
2
1985 1990 1995 2000 2005 2010
Consecutive years CY
Yie
ld g
ap
(Y
G)
t h
a-1
CZ
RO
TP
YGd-CZ = 079CY - 1573 R2 = 070 P lt 001
YGd-RO = 068CY - 1354 R2 = 072 P lt 0001
YGr-CZ = -012CY + 2354 R2 = 046 P lt 0001
Country
Legend TP - Transition Point YGd - yield gap decline YGr - yield gap restoration
Fig 6 Evolution of the yield gap in wheat in the Czech Republic (CZ) and Romania (RO) during the period 1986 -2008 Significant (Plt005) positive linear equations are shown for the Czech Republic in the period 1986-92 and for Romania in the period 1986-1995 thereafter showed a negative linear relationship for the Czech Republic and non-significant trend for Romania
Wheat is the best example of the yield gap course in the CE countries stressing on the
difference in fertilizer management The main dissimilarities among countries do not refer
to the first phase The YG was deep in spite of relatively high yield indicating thus a low
capacity of contemporary cultivated varieties to achieve further gains in yield Much more
important were YG length and number of years to reach the TP The time to reach the TP
was shorter (6(7) years) in countries such as the Czech and Slovak Republics Hungary and
Poland and also in Croatia and Slovenia corresponding to rapid rebuilding of fertilizer
wwwintechopencom
Constraints and Solutions to Maintain Soil Productivity A Case Study from Central Europe
175
markets in these countries In countries with extensive fertilizersrsquo management the length of
the first phase extended up to mid-90s
The YG evaluation shows that the current nutrient management in CE countries can
overcome this phenomenon especially in the case of wheat and maize A TYG can be most
easily negated in countries belonging to Unbalanced or Balanced nutrient management
groups such as the Czech and Slovak Republics Hungary and Poland and also Croatia and
Slovenia In countries with extensive fertilizersrsquo management the TYG has not been
overcome and enters the third phase of yield development stagnation due to low use of
fertilizers in turn resulting in the very low and unstable level of annually harvested yields
44 Yield prognosis ndash The unassimilated nitrogen concept
The medium or long-term food and environmental policy strategies for any country or
particular region are supported by yield prognosis considered as an operational tool
However the ex-ante prognosis depends on the reliability of the data used Two approaches
both relying on the unit productivity of fertilizer nitrogen (PFPN) have been considered The
first assumes extrapolation of real and improved yields based on the linear model (Reilly amp
Fuglie 1998) The second one is based on long term trends of the YG but transformed into
unit of temporarily lost fertilizer nitrogen termed for the purposes of this study as
unassimilated nitrogen This approach as related to nitrogen management has been used to
make a prognosis of yields of key crops in the CE countries
Operationally the concept presented in this chapter assumes that the total amount of
applied fertilizer nitrogen (FN) is simply divided into three main pools i) assimilated
(FaN) ndash nitrogen taken up by meanwhile grown crop ii) unassimilated nitrogen (FuaN) ndash
temporary out of use by plants andor iii) lost from the field (FLN) The quantitative
assessment of the FuaN pool relies on the defined YG procedure individually related to
each investigated crop
FN = FaN + F uaN + FLN
FuaN = YGcPFPN
where
FuaN ndash unassimilated nitrogen kg N ha-1 YG - yield gap cPFPN ndash the corrected partial factor productivity of applied N kg yield kg N-1
In the first step of yield prognosis the Unassimilated Nitrogen Indices (IuaN) should be computed Therefore the original set of YG data for each of the studied crops was transformed into a quantitative amount of nitrogen lost temporarily from the system marked as minus (-IuaN) In the second step of the analysis both sets of actual (YA) and maximum attainable yields (YM) of each crop were regressed against corresponding set of
uaN indices The obtained regression models clearly show that actual yields over the period of 20 years did not respond significantly to the IuaN as reported in Fig 7 for wheat in Romania The positive and simultaneously significant trends were however achieved when the maximum attainable yield (YM) instead of the actual yield (YA) was introduced into the regression model It can be therefore hypothesized that any virtual loss of nitrogen
wwwintechopencom
Soil Fertility Improvement and Integrated Nutrient Management ndash A Global Perspective
176
ie the negative uaN indices reflect the potential status for a yield increase and vice versa Unfortunately the positive indices of the uaN simply describe a state of N soil mining which in turn causes direct yield decline This is consistent with the opinion of Dibb (2000) and typical for many parts of the world including most CE countries
YM = -0114uaN + 2703 R2 = 093 P lt 0001
0
1
2
3
4
5
6
7
8
9
10
-60 -50 -40 -30 -20 -10 0 10
Gra
in y
ield
(Y
) t
ha-1
YA
YM
Yield
type
Unassimilated nitrogen (uaN) kg N ha-1
Fig 7 Yield prognosis of winter wheat based on residual nitrogen - a case of Romania (RO) Significant (Plt005) linear equation represents the trend for the attainable yields in the 1986-2008 period Legend YA ndash actual yield YM ndash maximum yield
Reliable yield prognosis can be performed assuming a certain level of expected yield or by focusing any improvement of production technology on higher N use efficiency The first approach can be best presented for wheat The maximum attainable yield for this crop in Poland and the Czech Republic is fixed at the level of 65 t ha-1 but for Romania at 45 t ha-1 (Rabbinge amp van Diepen 2000) The amount of uaN required to be incorporated into grain yield was calculated by the models and amounted to 48 27 and 33 kg ha-1 respectively It is equal to 58 27 and 100 of annual N rate applied in these countries and does not seem a realistic approach The same rules refer to other key crops in the study Therefore the second concept relying on the ability of currently cultivated crops to fix an extra amount of
uaN seems to be a more realistic approach for making any reliable yield prognosis (Table 7) This assumption is highly promising especially for countries presenting an extensive type of agriculture production for example Romania The expected wheat increase in response to the use of extra 20 kg N ha-1 is possible considering the water limited yield fixed at 45 t ha-1 The prognosis for the Czech Republic is still below the water limited yield being at 65 t ha-1 In Poland the calculated yields are at the same level as Romania but soils are less suitable for wheat production Therefore any grain yield increase seems to be a great challenge for farmers in all countries of the CE In the light of yields prognosis for sugar beets the fixed level of uaN at 20 kg N ha-1 is generally too low The level of 60 t ha-1 of beets seems to be the most reliable short-term target Thereby the amount of uaN successfully managed should be established at the level of 30 kg ha-1
wwwintechopencom
Constraints and Solutions to Maintain Soil Productivity A Case Study from Central Europe
177
CropCountry Linear regression model Yield at 20 kg uaN t ha-1
Wheat
Croatia YM = -0064 uaN + 3989 for R2 = 096 527
Czech Rep YM = -0063 uaN + 4777 for R2 = 088 604
Poland YM = -0060 uaN + 3623 for R2 = 092 482
Romania YM = -0114 uaN + 2703 for R2 = 093 498
Maize
Croatia YM = -0069 uaN + 4852 for R2 = 086 623
Czech Rep YM = -0064 uaN + 6470 for R2 = 069 776
Poland YM = -0085 uaN + 5431 for R2 = 083 713
Romania YM = -0121 uaN + 3348 for R2 = 094 578
Sugar beets
Croatia YM = -0605 uaN + 40677 for R2 = 089 5278
Czech Rep YM = -0458 uaN + 45872 for R2 = 076 5503
Poland YM = -0609 uaN + 39801 for R2 = 081 5198
Romania YM = -0822 uaN + 24046 for R2 = 093 4049
Table 7 Yield prognosis based on the unassimilated quantity of nitrogen (uaN)
5 Soil productivity improvements The concept of NPK fertilizers balance
The simple comparison of CE countries with respect to nutrient management clearly shows
that annual inputs of nitrogen are too high with respect to phosphorus and potassium
Therefore the main reasons of general yield stagnation in most of the CE countries are long-
term negative balances of P and K caused by low input of both mineral and organic
fertilizers As a consequence of soil P and K long-term mining the percentage share of soils
rich in both nutrients declined in the last two decades below the sufficiency level which was
achieved in many countries in 80s (Csatho at al 2007 Grzebisz amp Fotyma 2007)
It has been clearly stressed that in the transition phase of yield development the PFPN indices
reached the highest values resulting in yield gain This phenomenon emerged in years 1990
1991 for Poland and Hungary and in 1991 1992 for the Czech and Slovak Republics In all
these years the supply of P and K fertilizers was low In the Czech Republic ratios between
amounts of applied N-P-K fertilizers expressed as NP2O5K2O was 1025025 on average
This structure in spite of decreased fertilizersrsquo consumption allowed farmers to achieve the
same yields of all crops as in the period 1986-1990 The present structure of nutrient use is as
1015015 for the Czech Republic and 10404 for Poland These disparate nutrient ratios
stress the importance of NPK balance for high crop production The proposed NPK ratio
for the Czech Republic based on the cPFPN index can be established at the level of
1025025 in good years ie under ample water supply or 1025050 in unfavorable years ie
under expected water stress Hence keeping the current level of fertilizers consumption on
arable land ca 130 kg ha-1 one can predict the right amount of nutrients to apply In Poland
the total amount of currently consumed fertilizers is almost the same as in the Czech
wwwintechopencom
Soil Fertility Improvement and Integrated Nutrient Management ndash A Global Perspective
178
Republic Unfortunately soils in Poland are much poorer in potassium and also in
phosphorus being therefore highly sensitive to external supply of nutrients This
conclusion is corroborated by positive trends of yields in response to P and K fertilizers
application as found for all crops since 1991 onwards Consequently under favorable
weather conditions or on soils naturally rich in potassium the suggested formulation of N-
P-K fertilizers is as follows 1033066 but in years with high probability of drought or on
areas sensitive to drought a slightly different formulation is recommended namely
100510
It is not easy to formulate any efficient fertilizing strategy for Romania Since mid- 90s maize and wheat have shown yield stagnation at a very low level The main factors responsible for this situation are i) low N fertilization rates ii) imbalanced use of P and K fertilizers Therefore yields of these two crops are in fact dependent only on the seasonal weather course fluctuating for ca 100 on a yearly scale basis The main reason is unbalanced consumption of basic fertilizers which leads to permanent soil mining especially potassium The NP2O5K2O relationships averaged for the period 2004-2008 as 1027009 is not sufficient to get any yield increase or even its stabilization Potassium accumulates in plant tissues in much higher amounts and is considered as useful nutrient in water management (Cakmak 2005) Thereby this nutrient seems to be crucial for crop production in Romania even taking into account that almost 50 of land area is covered by soil naturally rich in minerals containing K In spite of low N consumption but unbalanced nutrient management there is still a space for an extra N loss for both key crops ie wheat and maize (see Fig 7) Therefore it could be concluded that any yield increase depends on both significant N rate rise and simultaneous change of fertilizer formulations The operational N-P-K fertilizers ratios suggested for Romania are as follows 1033017 in favorable and 10404 in unfavorable years The second scenario should aim at increasing plant survival under drought conditions
6 Thoughts and prospects
The new era of agriculture development in the Central Europe revealed how actual
agriculture outcomes in this region depend on three key factors presented in descending
order i) weather conditions during the growth season ii) inherent soil fertility iii) nitrogen
fertilizer consumption At present the first factor is decisive for crop production High year-
to-year yield variability reflects the imbalanced use of soil and external resources such as
fertilizers Therefore maximum attainable yields ie limited by water supply for example
for wheat are not attainable in all countries of the region In Germany also part of the
Central European region actual yields are above the ldquowater limitedrdquo level (Rabbinge amp
Diepen 2000 Supit et al 2010)
Inherent differences in the nature of soil quality between the CE countries as a background
of nutrient management are strictly related to the soil origin (Plant et al 2005) Except for
Poland all other countries are relatively rich in soils originated from loams (Cambisols) and
loess (Chernozems) These soils exhibit a high inherent potential for supplying K and other
cations such as calcium and magnesium (Nikolova 1998)
However at present nutritional requirements of high yielding crops most of the CE countries are almost entirely oriented on the third yield forming factor ie nitrogen
wwwintechopencom
Constraints and Solutions to Maintain Soil Productivity A Case Study from Central Europe
179
fertilizer use It has been well recognized that a balanced supply of external sources of slowly mobile elements such as phosphorus and potassium is broadly expected (Atkinson et al 2005 Struik amp Bonciarelli 1997) Consequently the average actual and attainable yields of main crops in CE countries are much more related to the soil-adjusted potential than to amounts of currently applied fertilizers As a result CE countries show at present much greater differences in agricultural production than at the end of the 80s
The observed unfavorable patterns of N fertilizer long-term consumption creates problems not only for agriculture production but are also potentially dangerous for the environment as a potential source of reactive nitrogen (Roberts 2006) There are three main questions to be urgently answered by specialists in all countries of the CE region i) do farmers really recognize an increasing yield gap ii) what is the reason for farmers and their advisory services to tolerate low efficiency of nitrogen iii) do farmers and advisory services recognize environmental aspects of the increasing amount of residual nitrogen In order to get answers to these questions one has to be familiar with factors contributing to the improvement in N fertilizer use efficiency
1 Farm management of N in terms of i) N rate quantification ii) time of N fertilizers application and iii) method of N fertilizers application
2 Management of nutrients responsible for the efficiency of N uptake and it in-plant transformation
3 Management of production factors other than N
The first problem is not only of technical nature because it affects in-season nitrogen use
efficiency and in turn actual yieldsrsquo variability However CE countries representing the
restoration type of yield development but at the same time unbalanced pattern of
consumed fertilizers do not indicate needs for increasing actually applied N rates This
strategy is to some extent the core of yield improvement in countries presenting stagnated
type of fertilizersrsquo management provided that any increase in N use will be compensated by
adequate amounts of applied phosphorus and potassium
It could finally be concluded that the realization of both goals of agricultural production in
the CE countries ie i) long-term yield stabilization and even its increase and ii) unit
productivity of the applied fertilizer N increase in turn decreasing amounts of the residual
N requires in the coming future changes in the structure of fertilizersrsquo consumption
keeping in the Unbalanced group of countries the same level of applied fertilizers The
problem of nutrients supply to a growing plant does not however refer only to the balanced
amounts of the applied fertilizers but also to the crop accessibility to soil natural nutrient
pools This problem is inherently related to conditions of root system growth in the soil
body There are a lot of factors limiting roots accessibility to water and nutrients even in
soils of high natural fertility which have been forgotten in the last 50 years but the most
important is soil acidy and related toxicity of aluminum (Atkinson et al 2005 Diatta et al
2010 Marschner 1991 Struik and Bonciarelli 1997) The key strategic target for farmers is to
increase soil volume directly occupied by plant roots in order to improve their access to
unavailable pools of nutrients Three main areas of soil productivity improvement via
increasing crop plants accessibility to nutrients in the subsoil at least may be considered i)
regulation of soil reaction ii) increase of organic matter content iii) removing of any kind of
hardpans It seems highly probable that in the case of Poland all three groups of measures
wwwintechopencom
Soil Fertility Improvement and Integrated Nutrient Management ndash A Global Perspective
180
are important In other countries of the CE soil acidity should be considered as an
agronomical problem for farmers conducting production on Luvisols
7 References
Atkinson A Black K amp Dawson L (2005) Prospects advantages and limitations of future crop production systems dependent upon the management processes Annals of Applied Biology Vol 146 pp 203-215 ISSN 1744-7348
Batjes H (2002) Carbon and nitrogen stocks in the soils of Central and Eastern Europe Soil Use Management Vol 18 pp 324-329 ISSN 1475-2743
Cakmak I (2005) The role of potassium in alleviating detrimental effects of abiotic stresses in plants Journal of Plant Nutrition Soil Science Vol 168 pp 521-530 ISSN 1436-8730
Catt J (2001) The agricultural importance of loess Earth-Science Reviews Vol 54 pp 213-229 ISSN 0012-8252
Cochrane N (2004) EU Enlargement Implications for US_EU agricultural relations US-EU Food and Agriculture ComaprisonWRS-04-04 78-86 Available online at
httpwwwersusdagovpublicationsWRS0404WRS0404pdf (Access 20110524)
Csatho P Sisak I amp Radimszky L (2007) Agriculture as a source of phosphorus causing eutrophication in Central and Eastern Europe Soil Use management Vol 23 (suppl 1) pp 36-56 ISSN 1475-2743
Csatho P amp Radimszky L (2009) Two Worlds within EU27 Sharp Contrasts in Organic and Mineral Nitrogen-Phosphorus Use Nitrogen-Phosphorus Balances and Soil Phosphorus Status Widening and Deepening Gap between Western and Central Europe Communications in Soil Science and Plant Analysis Vol 40 pp 999-1019 ISSN 0010-3624
Diatta J Bocianowski J amp Skubiszewska A (2010) Sulphate-based aluminum phytotoxicity mitigation under strong soil acidification Fresenius Environmental Bulletin Vol 19 No 12b pp 3185-3192 ISSN 1018-4619
Dibb D (2000) The mysteries (myths) of nutrient use efficiency Better Crops Vol 84 No 3 pp 3ndash5 ISSN 0006-0089
Dobermann A amp Cassman K (2002) Plant nutrient management for enhanced productivity in intensive grain production systems of the United States and Asia Plant and Soil Vol 247 pp 153-175 ISSN 1573-5036
Evans L amp Fisher R (1999) Yield potential its definition measurement and significance Crop Science Vol 39 pp 1544-1551 ISSN 1896-0782
Falloon P amp Betts R (2010) Climate impacts on European agriculture and water management in the context of adaptation and mitigation ndash the importance of integrated approach Science of Total Environment Vol 408 pp 5667-5687 ISSN 0048-9697
FAOSTAT Available online at httpfaostatfaoorgdefaultaspx (Access 20110524) Fixen P (2004) Phases in narrowing the yield gap Better Crops Vol 88 No 4 p 3 ISSN
0006-0089 Fronzek S amp Carter T (2007) Assessing uncertainties in climate change impacts on
resource potential for Europe based on projections from RCMs and GCMs Climate Change Vol 81 pp 357-371 ISSN 1758-6798
wwwintechopencom
Constraints and Solutions to Maintain Soil Productivity A Case Study from Central Europe
181
Grzebisz W amp Fotyma M (2007) Recommendations and use of potassium fertilizers in Central-Eastern Europe (CEE) In Proceedings International Fertiliser Society No 621 York UK pp 24 ISBN 978-0-85310-258-8
Grzebisz W Diatta J amp Haerdter R (2010) Fertilizer consumption patterns in Central European countries ndash effect on actual yield development trends in 1986-2005 years - a comparative study of the Czech Republic and Poland Journal of Central European Agriculture Vol 11 No 1 pp 73-82 ISSN 1332-9049
IFADATA Statistics online (2011) wwwfertilizerorgifastatisticsifadata datalineasp (Access 20110524)
Jongman R Bunce R amp Metzger R (2006) Objectives and applications of a statistical environmental stratification of Europe Landscape Ecology 21 409-419 ISSN 1572-9761
Karlen D Ditzler C amp Andrews S (2003) Soil quality why and how Geoderma Vol 114 pp 145-156 ISSN 0016-7061
Kelch D amp Osborne S (2001) Crop production capacity in EuropePrime Economic Research ServiceUSDA Agricultural outlookMarch 2001 19-23 ISSN 0099-1066
Marschner H (1991) Mechanisms of adaptation of plants to acid soils Plant and Soil 134 1-20 ISSN 1573-5036
Neumann K Verburg P amp Stehfest E (2010) The yield gap of global production a spatial analysis Agricultural Systems Vol 103 pp 316-326 ISSN 0308-521X
Nikolova M (1998) The soil potassium resources and the efficiency of potassium fertilizers in Bulgaria Nikola Poushkarow Inst of Soil Science and Agroecology Sofia Bulgaria IPI Country Report 12 39 pp
Olesen J amp Bindi M (2002) Consequences of climate change for European agricultural productivity land use and policy European Journal of Agronomy Vol 16 pp 239-262 ISSN 1161-0301
Olesen J Trnka M amp Kersebaum K (2011) Impacts and adaptation of European crop production systems to climate change European Journal of Agronomy Vol 34 pp 96-112 ISSN 1161-0301
Plant J Whittaker A amp Demitriades B (2005) The geological and tectonic framework of Europe Geochemical Atlas of Europe Part 1 Background Information Methodology Ed Salminen R Maps GTK FOREGS 20 pp ISBN 951-690-956-6
Rabbinge R (1993) The ecological background of food production In Crop protection and sustainable agriculture Wiley Chichester (Ciba Foundation Symposium 177 2-29 ISBN 10 0471939447
Rabbinge R amp Diepen C (2000) Changes in agriculture and land use in Europe European Journal of Agronomy Vol 13 pp 85-100 ISSN 1161-0301
Reilly J Fuglie K (1998) Future yield growth in field crops what evidence exists Soil amp Tillage Research Vol 47 pp 275-290 ISSN 0168-1987
Roberts T (2006) Improving Nutrient Use Efficiency Proceedings of the IFA Agriculture Conference Optimizing Resource Use Efficiency for Sustainable Intensification of Agriculture 27 february-2 March 2006 Kunming China pp 8
Rosegrant M Paisner M amp Meijer S (2001) Global Food Projections to 2020 Emerging trends and alternative futures IFPRI pp 206 ISBN 0-89629-640-7
wwwintechopencom
Soil Fertility Improvement and Integrated Nutrient Management ndash A Global Perspective
182
Sinclair T Purcell L amp Sneller C (2004) Crop transformation and the challenge to increase yield potential Trends in Plant Science Vol 9 No 2 pp 70-75 ISSN 136085
Struik P amp Bonciarelli F (1997) Resource use at the cropping system level European Journal of Agronomy Vol 7 pp 133-143 ISSN 1161-0301
Supit I van Diepen C amp de Wit A (2010) Recent changes in the climatic yield potential of various crops in Europe Agricultural Systems Vol 103 pp 683-694 ISSN 0308-521X
wwwintechopencom
Soil Fertility Improvement and Integrated Nutrient Management - AGlobal PerspectiveEdited by Dr Joann Whalen
ISBN 978-953-307-945-5Hard cover 306 pagesPublisher InTechPublished online 24 February 2012Published in print edition February 2012
InTech EuropeUniversity Campus STeP Ri Slavka Krautzeka 83A 51000 Rijeka Croatia Phone +385 (51) 770 447 Fax +385 (51) 686 166wwwintechopencom
InTech ChinaUnit 405 Office Block Hotel Equatorial Shanghai No65 Yan An Road (West) Shanghai 200040 China
Phone +86-21-62489820 Fax +86-21-62489821
Soil Fertility Improvement and Integrated Nutrient Management A Global Perspective presents 15 invitedchapters written by leading soil fertility experts The book is organized around three themes The first theme isSoil Mapping and Soil Fertility Testing describing spatial heterogeneity in soil nutrients within natural andmanaged ecosystems as well as up-to-date soil testing methods and information on how soil fertility indicatorsrespond to agricultural practices The second theme Organic and Inorganic Amendments for Soil FertilityImprovement describes fertilizing materials that provide important amounts of essential nutrients forplantsThe third theme Integrated Nutrient Management Planning Case Studies From Central Europe SouthAmerica and Africa highlights the principles of integrated nutrient management Additionally it gives casestudies explaining how this approach has been implemented successfully across large geographic regionsand at local scales to improve the productivity of staple crops and forages
How to referenceIn order to correctly reference this scholarly work feel free to copy and paste the following
Witold Grzebisz and Jean Diatta (2012) Constraints and Solutions to Maintain Soil Productivity A Case Studyfrom Central Europe Soil Fertility Improvement and Integrated Nutrient Management - A Global PerspectiveDr Joann Whalen (Ed) ISBN 978-953-307-945-5 InTech Available fromhttpwwwintechopencombookssoil-fertility-improvement-and-integrated-nutrient-management-a-global-perspectiveconstraints-and-solutions-to-maintain-soil-productivity-a-case-study-from-central-europe
copy 2012 The Author(s) Licensee IntechOpen This is an open access articledistributed under the terms of the Creative Commons Attribution 30License which permits unrestricted use distribution and reproduction inany medium provided the original work is properly cited
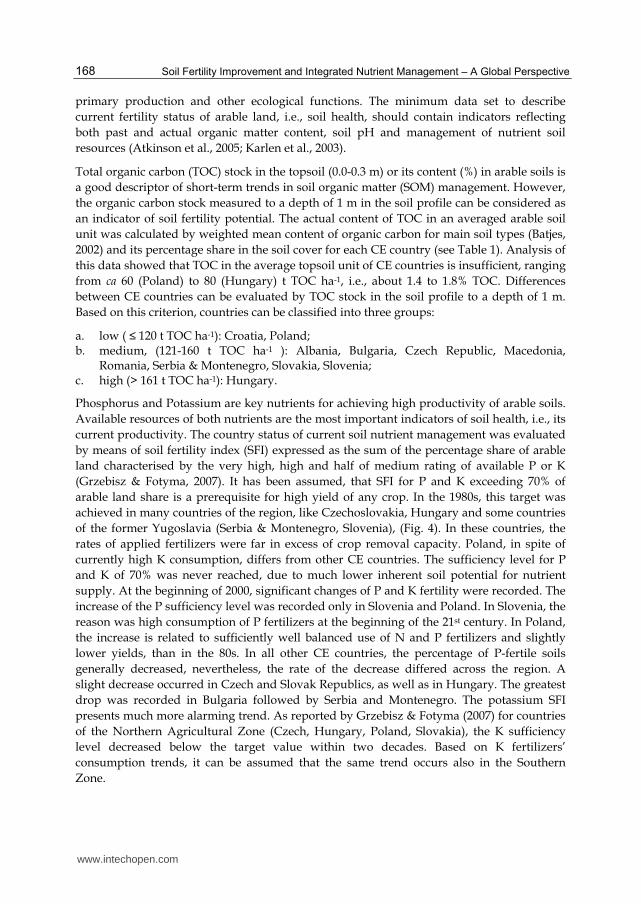
Soil Fertility Improvement and Integrated Nutrient Management ndash A Global Perspective
168
primary production and other ecological functions The minimum data set to describe
current fertility status of arable land ie soil health should contain indicators reflecting
both past and actual organic matter content soil pH and management of nutrient soil
resources (Atkinson et al 2005 Karlen et al 2003)
Total organic carbon (TOC) stock in the topsoil (00-03 m) or its content () in arable soils is
a good descriptor of short-term trends in soil organic matter (SOM) management However
the organic carbon stock measured to a depth of 1 m in the soil profile can be considered as
an indicator of soil fertility potential The actual content of TOC in an averaged arable soil
unit was calculated by weighted mean content of organic carbon for main soil types (Batjes
2002) and its percentage share in the soil cover for each CE country (see Table 1) Analysis of
this data showed that TOC in the average topsoil unit of CE countries is insufficient ranging
from ca 60 (Poland) to 80 (Hungary) t TOC ha-1 ie about 14 to 18 TOC Differences
between CE countries can be evaluated by TOC stock in the soil profile to a depth of 1 m
Based on this criterion countries can be classified into three groups
a low ( le 120 t TOC ha-1) Croatia Poland b medium (121-160 t TOC ha-1 ) Albania Bulgaria Czech Republic Macedonia
Romania Serbia amp Montenegro Slovakia Slovenia c high (gt 161 t TOC ha-1) Hungary
Phosphorus and Potassium are key nutrients for achieving high productivity of arable soils
Available resources of both nutrients are the most important indicators of soil health ie its
current productivity The country status of current soil nutrient management was evaluated
by means of soil fertility index (SFI) expressed as the sum of the percentage share of arable
land characterised by the very high high and half of medium rating of available P or K
(Grzebisz amp Fotyma 2007) It has been assumed that SFI for P and K exceeding 70 of
arable land share is a prerequisite for high yield of any crop In the 1980s this target was
achieved in many countries of the region like Czechoslovakia Hungary and some countries
of the former Yugoslavia (Serbia amp Montenegro Slovenia) (Fig 4) In these countries the
rates of applied fertilizers were far in excess of crop removal capacity Poland in spite of
currently high K consumption differs from other CE countries The sufficiency level for P
and K of 70 was never reached due to much lower inherent soil potential for nutrient
supply At the beginning of 2000 significant changes of P and K fertility were recorded The
increase of the P sufficiency level was recorded only in Slovenia and Poland In Slovenia the
reason was high consumption of P fertilizers at the beginning of the 21st century In Poland
the increase is related to sufficiently well balanced use of N and P fertilizers and slightly
lower yields than in the 80s In all other CE countries the percentage of P-fertile soils
generally decreased nevertheless the rate of the decrease differed across the region A
slight decrease occurred in Czech and Slovak Republics as well as in Hungary The greatest
drop was recorded in Bulgaria followed by Serbia and Montenegro The potassium SFI
presents much more alarming trend As reported by Grzebisz amp Fotyma (2007) for countries
of the Northern Agricultural Zone (Czech Hungary Poland Slovakia) the K sufficiency
level decreased below the target value within two decades Based on K fertilizersrsquo
consumption trends it can be assumed that the same trend occurs also in the Southern
Zone
wwwintechopencom
Constraints and Solutions to Maintain Soil Productivity A Case Study from Central Europe
169
0
10
20
30
40
50
60
70
80
90
100
AL BU CZ H PL RO SE SK SL
Countries
P s
oil
fert
ility
in
de
x
A
L
1980s
2000s
Sufficiency level
Fig 4 Phosphorus soil fertility indices (expressed as the percentage of arable land AL) for selected CE countries during the period 1986 - 2008 (based on Csatho et al 2007) The sufficiency level was assumed to be 70 as described by Grzebisz amp Fotyma (2007) Country acronyms are given in Table 1
4 Soil productivity assessment
41 Long-term trends in crop yields
All CE countries grow the same crops and cereal species predominate The area sown with cereals occupies 64 of arable land in Croatia 52 - in the Czech Republic 68 - in Poland and 59 ndash in Romania In the Czech Republic cerealsrsquo production is dominated by wheat and barley but in Poland by wheat and rye In Romania and Croatia maize is the key grain crop Sugar beets due to EU regulation in the last 10 years are of minor importance but this crop is a good indicator of soil quality Therefore it has been assumed that these crops would reflect fairly well changes in current soil fertility status as a consequence of applied nutrient management strategies This assumption is well documented by observed variability of yields of wheat maize and sugar beets in selected countries of CE (Table 5) The highest variability was found for Romania and the lowest for Poland Romania is a country with an extensive pattern of fertilizersrsquo management typical in the Southern Agricultural Zone of Europe Poland belongs to countries of the Northern Zone but presents a balanced patterns of fertilizersrsquo management (Poland Hungary) Other selected countries are members of the Unbalanced fertilizing group of CE countries
The long-term yield trend can be used as an indicator of key crops sensitivity to past and current fertilizersrsquo management As in the case of fertilizersrsquo consumption trends three consecutive phases of yield development over the period 1986-2008 may be distinguished
1 Actual-Standard (AS) 2 Recession (RC) 3 Restoration (RS) or Stagnation (SG)
The observed trends of harvested yields were most pronounced for wheat other cereals and for seed crops like oil-seed rape (Grzebisz et al 2010) In the first phase of the study taking
wwwintechopencom
Soil Fertility Improvement and Integrated Nutrient Management ndash A Global Perspective
170
place at the end of the 80s yields of wheat reached on average the highest recorded levels Therefore this particular period is considered as a standard level (AS) for evaluating subsequent phases (Fig 5) The highest yield decline ie the recession phase (RC) in response to the collapse in fertilizer consumption took place in the Northern Zone but
Crops Croatia Czech Republic Poland Romania
x plusmn SD5 CV6 x plusmn SD CV x plusmn SD CV x plusmn SD CV
Wheat 40plusmn052
39plusmn033
44plusmn094
125
86
216
48plusmn05
51plusmn04
52plusmn06
102
78
113
36plusmn03
37plusmn02
39plusmn04
90
56
100
27plusmn06
31plusmn04
29plusmn08
212
141
265
Maize 49plusmn10
40plusmn09
55plusmn13
205
217
229
58plusmn13
51plusmn05
69plusmn05
214
93
76
52plusmn08
49plusmn02
56plusmn08
143
41
157
31plusmn08
29plusmn05
34plusmn11
244
180
315
Sugar
beet
404plusmn77
398plusmn49
487plusmn52
192
123
108
424plusmn76
345plusmn15
531plusmn49
180
42
49
381plusmn55
346plusmn19
451plusmn39
145
56
88
228plusmn51
213plusmn29
304plusmn33
222
136
108
1FAOSTAT available online 2011-05-24 21986-2008 31986-1990 42004-2008 5standard deviation 6coefficient of variation
Table 5 Statistical overview of key cropsrsquo yields (t ha-1) in selected Central European
countries during the period 1986-2008 in comparison to the AS phase and the 2004-2008
periods
0
1
2
3
4
5
6
7
1985 1990 1995 2000 2005 2010
Consecutive years CY
Gra
in y
ield
(Y
) t
ha-1
CZ
RO
Country
AS RC RE or ST
Y-CZ = 0056CY + 1089 R2 = 028 P lt 005
TYG
TYG
Legend level of harvested yield AS Actual-Standard RC Recession RE Restoration ST Stagnation
Dashed line refers to AS level of yield ie an average yield harvested in the period 1986-1990 TYG
Temporary Yield Gap
Fig 5 Long-term trends of wheat production in the Czech Republic (CZ) and Romania (RO)
during the period 1986-2008 Significant (Plt005) positive linear trend is shown for the
Czech Republic whereas non-significant for Romania in the period 1992-2008
wwwintechopencom
Constraints and Solutions to Maintain Soil Productivity A Case Study from Central Europe
171
lasted for only two or three years In other countries mainly representing the Southern Zone it was also fast or showed sustained depression The third phase of yield development was manifested in two distinct trends The first ldquorestorationrdquo trend has shown a positive yield gain since yield recession It was revealed in the Northern Zone countries and also for Croatia and Slovenia The second trend has not shown any significant change in yield since the recession resulting in yield stagnation The most interesting attribute of this trend is its high year-to-year variability The difference between the actually harvested and the AS yield has been termed as the temporary yield gap (TYG) (Fig 5) The time required to recover to the AS level was long but country specific In the Northern Zone it lasted for ca 10-12 years exceeding the AS level in 2004 or 2005 In most other countries representing the Southern Zone it has not been reached up to 2008 For maize and sugar beets the recession was also observed In the recovery period maize yields were generally positive but the rate of the yield increase was much higher in the Balanced and Unbalanced groups than in the Extensive group Sugar beets yield increase was very high at the beginning of the 90s exceeding the level reported in the 80s The main reason was a reduction in area sown with sugar beets which forced farmers to cultivate this crop on more fertile soils
42 The concept of partial factor fertilizer nitrogen productivity (PFPN)
This part of the study relies on two main conceptual pillars The first one assumes that each hectare of arable soil regardless of the current crop is supplied with the same amount of nutrients including nitrogen The second assumption takes into account the fact that the unit productivity of in-season applied fertilizer N known as PFPN is a reliable scientific tool to make simple but quick discrimination of factors limiting attainable crop yield (Dobermann amp Casman 2002) Therefore the PFPN index was used to evaluate some but selected CE countries that represent the three patterns of current fertilizer management (Table 4) Croatia and the Czech Republic have been selected as examples for the Unbalanced group whereas Poland is the Balanced group and Romania represents the Extensive group of fertilizersrsquo use
The PFPN index was obtained by dividing the actual yield of a respective crop harvested within a given year by the annual amount of N fertilizers consumed by the country assuming it was applied at an equal rate for all currently cultivated crops Operationally the PFPN index consists of two components
a yield of crop (Y) expressed in kg or t ha-1 b nitrogen fertilizer rate (FN) expressed as kg N ha-1
PFPN = YFN
Based on the long-term trends of PFPN indices for each of the key crops two different types of PFPN indices can be distinguished
1 The real partial factor productivity of applied N ndash (rPFPN) it reflects actual yields as limited by both water and N availability
2 The maximal partial factor productivity of applied N (mPFPN) it was calculated as the 4th quartile of rPFPN indices it refers to yields obtained under ample water supply
To make a reliable estimate of the yield gap for some crops cultivated in the CE the corrected partial factor productivity of applied N (cPFPN) instead of mPFPN has been applied
wwwintechopencom
Soil Fertility Improvement and Integrated Nutrient Management ndash A Global Perspective
172
Operationally it has been calculated as the average of the 4th quartile but excluding extremely elevated rPFPN values which emerged in most of investigated countries at the beginning of the 90s Indices of N productivity (PFPN rPFPN and cPFPN) were then used to calculate the yield gap
The calculated rPFPN indices showed as expected high year-to-year variability for all tested crops (Table 6) They were crop and country specific when averaged over the 1986-2008 period
a wheat CR lt CZ = PL lt RO b maize CR lt CZ lt PL lt RO c sugar beets CR = CZ lt PL lt RO
These ranges are not in line with long-term average yields of all crops which followed generally the order CZ gt CR gt PL gt RO
Maximum productivity of tested crops as evaluated for the 4th quartile of rPFPN indices was
much higher rising on average by 43 However the increase was country specific and
represents 63 for Croatia 28 for the Czech Republic 30 for Poland and 48 for
Romania The concept of mPFPN assumes an increase of rPFPN indices pursuant to higher
efficiency of applied fertilizer nitrogen due to ample water supply Its reliability has been
corroborated by low coefficients of variation implicitly indicating the potential productivity
of applied fertilizer nitrogen on the background of soil quality The sequences of countries
for each crop are as follows
a wheat CZ = PL lt CR lt RO b maize CR = CZ lt PL lt RO c sugar beets CZ lt PL lt CR lt RO
As presented in Table 6 coefficients of variations of cPFPN indices were significantly lower in comparison to mPFPN stressing on the reliability of the conducted analysis
Relationships between sets of developed rPFPN and applied fertilizer nitrogen rates can also be a useful tool for making long-term assessment of nitrogen efficiency This relationship fits the best the power function
rPFPN = 9112N-067 for R2 = 077 and n = 92
where N ndash annual rate of fertilizer nitrogen consumption kg N ha-1
Analysis of the general curve shape reveals decreasing yield per unit of N fertilizer applied with highest values of rPFPN It has been observed that irrespective of the applied N rate long-term productivity of fertilizer nitrogen increased in the order Romania lt Poland lt Croatia lt the Czech Republic However the obtained high rPFPN values are as a rule related to lower yields of harvested crops This pattern of crop response refers mostly to Bulgaria Romania and former Yugoslavia countries excluding Croatia and Slovenia As pointed out by Fixen (2004) the target of efficient N fertilizer management based on high fertilizer N use efficiency is counter-productive In this N supply system plants are forced to take up an appreciable amount of N from its soil resources which decreases their rate of growth in critical stages of yield performance Therefore ldquothe elevatedrdquo level of the PFPN could be used as an attribute of the extensive type of agriculture production
wwwintechopencom
Constraints and Solutions to Maintain Soil Productivity A Case Study from Central Europe
173
PFPN
index
Croatia Czech Republic Poland Romania
x plusmn SD1 CV2 x plusmn SD CV x plusmn SD CV x plusmn SD CV
Wheat kg yield kg N-1
rPFPN 48plusmn24 498 54plusmn13 235 54plusmn15 275 81plusmn33 405
mPFPN 80plusmn23 288 70plusmn11 160 72plusmn15 212 121plusmn14 119
cPFPN 63plusmn11 174 62plusmn4 59 62plusmn2 30 112plusmn8 69
Maize kg yield kg N-1
rPFPN 56plusmn26 464 66plusmn18 281 78plusmn21 263 95plusmn45 478
mPFPN 89plusmn29 288 89plusmn7 76 103plusmn11 102 149plusmn20 135
cPFPN 69plusmn10 151 89plusmn7 76 96plusmn2 24 137plusmn9 66
Sugar beets kg yield kg N-1
rPFPN 471plusmn224 477 478plusmn120 250 566plusmn136 240 695plusmn266 383
mPFPN 766plusmn218 285 588plusmn49 825 728plusmn67 93 977plusmn122 125
cPFPN 613plusmn86 141 588plusmn49 825 675plusmn35 52 905plusmn36 40
1standard deviation 2coefficient of variation
Table 6 Partial factor fertilizer N productivity statistics for key crops in selected Central European countries with unbalanced (Croatia Czech Republic) balanced (Poland) and extensive (Romania) fertilizersrsquo management during the period 1986-2008
43 Yield gap (YG) and its attributes
Actual yields of crops harvested by farmers in all areas of the world are much lower than
the yield potential of currently cultivated varieties under defined soil and climatic
conditions This ldquovirtualrdquo un-harvested portion of yield is generally termed the yield gap
(YG) (Evans amp Fisher 1999 Dobermann amp Cassman 2002) However the CE countries
experience another phenomenon known as the temporary yield gap (TYG) (Grzebisz et al
2010) The main reason of its emergence is the collapse in fertilizer use leading to elevation
of the rPFPN index Dibb (2000) relates extremely high N efficiency to low yield and this
trend was fully corroborated by the crop yield data from countries with extensive fertilizer
management Nevertheless the countries of the Northern Agricultural Zone (Czech
Republic Hungary Poland Slovakia) in spite of drastic decrease of consumed fertilizers in
the early 90s were characterized by high yields of wheat and other cereal crops (FAOSTAT
2011 Grzebisz et al 2010) The observed rPFPN indices extremely elevated at the beginning
of the 90s were a result of the residual effect of applied fertilizer N This phenomenon could
be manifested only under growth conditions created by ample water and sufficiently high
supply of immobile nutrients such as P and K in turn balancing N use by currently growing
crops
In the first step of yield gap calculation the cPFPN index was applied to assess the maximal
attainable yield (YAM) The yield gap was then calculated as a difference between really
harvestable yield (YA) and YAM
wwwintechopencom
Soil Fertility Improvement and Integrated Nutrient Management ndash A Global Perspective
174
YAM = cPFPN middot DN
YG = YA ndash YAM
where
DN is the rate of annually applied fertilizer N (kg N ha-1) YA is the actual yield in t ha-1 for a
given year and YAM is the maximal attainable yield (t ha-1)
The observed similarities of the general yield gap pattern over time for key crops allow to
distinguish three consecutive phases of its development in the period 1986-2008 (Fig 6)
1 First ndash primary deep yield gap to the left of the transition point (TP) 2 Second ndash point of extra yield gain TP 3 Third- secondary yield gap to the right of the TP alternatively yield gap stagnation as
indicated by the lack of significant (P lt 005) linear trend response
-7
-6
-5
-4
-3
-2
-1
0
1
2
1985 1990 1995 2000 2005 2010
Consecutive years CY
Yie
ld g
ap
(Y
G)
t h
a-1
CZ
RO
TP
YGd-CZ = 079CY - 1573 R2 = 070 P lt 001
YGd-RO = 068CY - 1354 R2 = 072 P lt 0001
YGr-CZ = -012CY + 2354 R2 = 046 P lt 0001
Country
Legend TP - Transition Point YGd - yield gap decline YGr - yield gap restoration
Fig 6 Evolution of the yield gap in wheat in the Czech Republic (CZ) and Romania (RO) during the period 1986 -2008 Significant (Plt005) positive linear equations are shown for the Czech Republic in the period 1986-92 and for Romania in the period 1986-1995 thereafter showed a negative linear relationship for the Czech Republic and non-significant trend for Romania
Wheat is the best example of the yield gap course in the CE countries stressing on the
difference in fertilizer management The main dissimilarities among countries do not refer
to the first phase The YG was deep in spite of relatively high yield indicating thus a low
capacity of contemporary cultivated varieties to achieve further gains in yield Much more
important were YG length and number of years to reach the TP The time to reach the TP
was shorter (6(7) years) in countries such as the Czech and Slovak Republics Hungary and
Poland and also in Croatia and Slovenia corresponding to rapid rebuilding of fertilizer
wwwintechopencom
Constraints and Solutions to Maintain Soil Productivity A Case Study from Central Europe
175
markets in these countries In countries with extensive fertilizersrsquo management the length of
the first phase extended up to mid-90s
The YG evaluation shows that the current nutrient management in CE countries can
overcome this phenomenon especially in the case of wheat and maize A TYG can be most
easily negated in countries belonging to Unbalanced or Balanced nutrient management
groups such as the Czech and Slovak Republics Hungary and Poland and also Croatia and
Slovenia In countries with extensive fertilizersrsquo management the TYG has not been
overcome and enters the third phase of yield development stagnation due to low use of
fertilizers in turn resulting in the very low and unstable level of annually harvested yields
44 Yield prognosis ndash The unassimilated nitrogen concept
The medium or long-term food and environmental policy strategies for any country or
particular region are supported by yield prognosis considered as an operational tool
However the ex-ante prognosis depends on the reliability of the data used Two approaches
both relying on the unit productivity of fertilizer nitrogen (PFPN) have been considered The
first assumes extrapolation of real and improved yields based on the linear model (Reilly amp
Fuglie 1998) The second one is based on long term trends of the YG but transformed into
unit of temporarily lost fertilizer nitrogen termed for the purposes of this study as
unassimilated nitrogen This approach as related to nitrogen management has been used to
make a prognosis of yields of key crops in the CE countries
Operationally the concept presented in this chapter assumes that the total amount of
applied fertilizer nitrogen (FN) is simply divided into three main pools i) assimilated
(FaN) ndash nitrogen taken up by meanwhile grown crop ii) unassimilated nitrogen (FuaN) ndash
temporary out of use by plants andor iii) lost from the field (FLN) The quantitative
assessment of the FuaN pool relies on the defined YG procedure individually related to
each investigated crop
FN = FaN + F uaN + FLN
FuaN = YGcPFPN
where
FuaN ndash unassimilated nitrogen kg N ha-1 YG - yield gap cPFPN ndash the corrected partial factor productivity of applied N kg yield kg N-1
In the first step of yield prognosis the Unassimilated Nitrogen Indices (IuaN) should be computed Therefore the original set of YG data for each of the studied crops was transformed into a quantitative amount of nitrogen lost temporarily from the system marked as minus (-IuaN) In the second step of the analysis both sets of actual (YA) and maximum attainable yields (YM) of each crop were regressed against corresponding set of
uaN indices The obtained regression models clearly show that actual yields over the period of 20 years did not respond significantly to the IuaN as reported in Fig 7 for wheat in Romania The positive and simultaneously significant trends were however achieved when the maximum attainable yield (YM) instead of the actual yield (YA) was introduced into the regression model It can be therefore hypothesized that any virtual loss of nitrogen
wwwintechopencom
Soil Fertility Improvement and Integrated Nutrient Management ndash A Global Perspective
176
ie the negative uaN indices reflect the potential status for a yield increase and vice versa Unfortunately the positive indices of the uaN simply describe a state of N soil mining which in turn causes direct yield decline This is consistent with the opinion of Dibb (2000) and typical for many parts of the world including most CE countries
YM = -0114uaN + 2703 R2 = 093 P lt 0001
0
1
2
3
4
5
6
7
8
9
10
-60 -50 -40 -30 -20 -10 0 10
Gra
in y
ield
(Y
) t
ha-1
YA
YM
Yield
type
Unassimilated nitrogen (uaN) kg N ha-1
Fig 7 Yield prognosis of winter wheat based on residual nitrogen - a case of Romania (RO) Significant (Plt005) linear equation represents the trend for the attainable yields in the 1986-2008 period Legend YA ndash actual yield YM ndash maximum yield
Reliable yield prognosis can be performed assuming a certain level of expected yield or by focusing any improvement of production technology on higher N use efficiency The first approach can be best presented for wheat The maximum attainable yield for this crop in Poland and the Czech Republic is fixed at the level of 65 t ha-1 but for Romania at 45 t ha-1 (Rabbinge amp van Diepen 2000) The amount of uaN required to be incorporated into grain yield was calculated by the models and amounted to 48 27 and 33 kg ha-1 respectively It is equal to 58 27 and 100 of annual N rate applied in these countries and does not seem a realistic approach The same rules refer to other key crops in the study Therefore the second concept relying on the ability of currently cultivated crops to fix an extra amount of
uaN seems to be a more realistic approach for making any reliable yield prognosis (Table 7) This assumption is highly promising especially for countries presenting an extensive type of agriculture production for example Romania The expected wheat increase in response to the use of extra 20 kg N ha-1 is possible considering the water limited yield fixed at 45 t ha-1 The prognosis for the Czech Republic is still below the water limited yield being at 65 t ha-1 In Poland the calculated yields are at the same level as Romania but soils are less suitable for wheat production Therefore any grain yield increase seems to be a great challenge for farmers in all countries of the CE In the light of yields prognosis for sugar beets the fixed level of uaN at 20 kg N ha-1 is generally too low The level of 60 t ha-1 of beets seems to be the most reliable short-term target Thereby the amount of uaN successfully managed should be established at the level of 30 kg ha-1
wwwintechopencom
Constraints and Solutions to Maintain Soil Productivity A Case Study from Central Europe
177
CropCountry Linear regression model Yield at 20 kg uaN t ha-1
Wheat
Croatia YM = -0064 uaN + 3989 for R2 = 096 527
Czech Rep YM = -0063 uaN + 4777 for R2 = 088 604
Poland YM = -0060 uaN + 3623 for R2 = 092 482
Romania YM = -0114 uaN + 2703 for R2 = 093 498
Maize
Croatia YM = -0069 uaN + 4852 for R2 = 086 623
Czech Rep YM = -0064 uaN + 6470 for R2 = 069 776
Poland YM = -0085 uaN + 5431 for R2 = 083 713
Romania YM = -0121 uaN + 3348 for R2 = 094 578
Sugar beets
Croatia YM = -0605 uaN + 40677 for R2 = 089 5278
Czech Rep YM = -0458 uaN + 45872 for R2 = 076 5503
Poland YM = -0609 uaN + 39801 for R2 = 081 5198
Romania YM = -0822 uaN + 24046 for R2 = 093 4049
Table 7 Yield prognosis based on the unassimilated quantity of nitrogen (uaN)
5 Soil productivity improvements The concept of NPK fertilizers balance
The simple comparison of CE countries with respect to nutrient management clearly shows
that annual inputs of nitrogen are too high with respect to phosphorus and potassium
Therefore the main reasons of general yield stagnation in most of the CE countries are long-
term negative balances of P and K caused by low input of both mineral and organic
fertilizers As a consequence of soil P and K long-term mining the percentage share of soils
rich in both nutrients declined in the last two decades below the sufficiency level which was
achieved in many countries in 80s (Csatho at al 2007 Grzebisz amp Fotyma 2007)
It has been clearly stressed that in the transition phase of yield development the PFPN indices
reached the highest values resulting in yield gain This phenomenon emerged in years 1990
1991 for Poland and Hungary and in 1991 1992 for the Czech and Slovak Republics In all
these years the supply of P and K fertilizers was low In the Czech Republic ratios between
amounts of applied N-P-K fertilizers expressed as NP2O5K2O was 1025025 on average
This structure in spite of decreased fertilizersrsquo consumption allowed farmers to achieve the
same yields of all crops as in the period 1986-1990 The present structure of nutrient use is as
1015015 for the Czech Republic and 10404 for Poland These disparate nutrient ratios
stress the importance of NPK balance for high crop production The proposed NPK ratio
for the Czech Republic based on the cPFPN index can be established at the level of
1025025 in good years ie under ample water supply or 1025050 in unfavorable years ie
under expected water stress Hence keeping the current level of fertilizers consumption on
arable land ca 130 kg ha-1 one can predict the right amount of nutrients to apply In Poland
the total amount of currently consumed fertilizers is almost the same as in the Czech
wwwintechopencom
Soil Fertility Improvement and Integrated Nutrient Management ndash A Global Perspective
178
Republic Unfortunately soils in Poland are much poorer in potassium and also in
phosphorus being therefore highly sensitive to external supply of nutrients This
conclusion is corroborated by positive trends of yields in response to P and K fertilizers
application as found for all crops since 1991 onwards Consequently under favorable
weather conditions or on soils naturally rich in potassium the suggested formulation of N-
P-K fertilizers is as follows 1033066 but in years with high probability of drought or on
areas sensitive to drought a slightly different formulation is recommended namely
100510
It is not easy to formulate any efficient fertilizing strategy for Romania Since mid- 90s maize and wheat have shown yield stagnation at a very low level The main factors responsible for this situation are i) low N fertilization rates ii) imbalanced use of P and K fertilizers Therefore yields of these two crops are in fact dependent only on the seasonal weather course fluctuating for ca 100 on a yearly scale basis The main reason is unbalanced consumption of basic fertilizers which leads to permanent soil mining especially potassium The NP2O5K2O relationships averaged for the period 2004-2008 as 1027009 is not sufficient to get any yield increase or even its stabilization Potassium accumulates in plant tissues in much higher amounts and is considered as useful nutrient in water management (Cakmak 2005) Thereby this nutrient seems to be crucial for crop production in Romania even taking into account that almost 50 of land area is covered by soil naturally rich in minerals containing K In spite of low N consumption but unbalanced nutrient management there is still a space for an extra N loss for both key crops ie wheat and maize (see Fig 7) Therefore it could be concluded that any yield increase depends on both significant N rate rise and simultaneous change of fertilizer formulations The operational N-P-K fertilizers ratios suggested for Romania are as follows 1033017 in favorable and 10404 in unfavorable years The second scenario should aim at increasing plant survival under drought conditions
6 Thoughts and prospects
The new era of agriculture development in the Central Europe revealed how actual
agriculture outcomes in this region depend on three key factors presented in descending
order i) weather conditions during the growth season ii) inherent soil fertility iii) nitrogen
fertilizer consumption At present the first factor is decisive for crop production High year-
to-year yield variability reflects the imbalanced use of soil and external resources such as
fertilizers Therefore maximum attainable yields ie limited by water supply for example
for wheat are not attainable in all countries of the region In Germany also part of the
Central European region actual yields are above the ldquowater limitedrdquo level (Rabbinge amp
Diepen 2000 Supit et al 2010)
Inherent differences in the nature of soil quality between the CE countries as a background
of nutrient management are strictly related to the soil origin (Plant et al 2005) Except for
Poland all other countries are relatively rich in soils originated from loams (Cambisols) and
loess (Chernozems) These soils exhibit a high inherent potential for supplying K and other
cations such as calcium and magnesium (Nikolova 1998)
However at present nutritional requirements of high yielding crops most of the CE countries are almost entirely oriented on the third yield forming factor ie nitrogen
wwwintechopencom
Constraints and Solutions to Maintain Soil Productivity A Case Study from Central Europe
179
fertilizer use It has been well recognized that a balanced supply of external sources of slowly mobile elements such as phosphorus and potassium is broadly expected (Atkinson et al 2005 Struik amp Bonciarelli 1997) Consequently the average actual and attainable yields of main crops in CE countries are much more related to the soil-adjusted potential than to amounts of currently applied fertilizers As a result CE countries show at present much greater differences in agricultural production than at the end of the 80s
The observed unfavorable patterns of N fertilizer long-term consumption creates problems not only for agriculture production but are also potentially dangerous for the environment as a potential source of reactive nitrogen (Roberts 2006) There are three main questions to be urgently answered by specialists in all countries of the CE region i) do farmers really recognize an increasing yield gap ii) what is the reason for farmers and their advisory services to tolerate low efficiency of nitrogen iii) do farmers and advisory services recognize environmental aspects of the increasing amount of residual nitrogen In order to get answers to these questions one has to be familiar with factors contributing to the improvement in N fertilizer use efficiency
1 Farm management of N in terms of i) N rate quantification ii) time of N fertilizers application and iii) method of N fertilizers application
2 Management of nutrients responsible for the efficiency of N uptake and it in-plant transformation
3 Management of production factors other than N
The first problem is not only of technical nature because it affects in-season nitrogen use
efficiency and in turn actual yieldsrsquo variability However CE countries representing the
restoration type of yield development but at the same time unbalanced pattern of
consumed fertilizers do not indicate needs for increasing actually applied N rates This
strategy is to some extent the core of yield improvement in countries presenting stagnated
type of fertilizersrsquo management provided that any increase in N use will be compensated by
adequate amounts of applied phosphorus and potassium
It could finally be concluded that the realization of both goals of agricultural production in
the CE countries ie i) long-term yield stabilization and even its increase and ii) unit
productivity of the applied fertilizer N increase in turn decreasing amounts of the residual
N requires in the coming future changes in the structure of fertilizersrsquo consumption
keeping in the Unbalanced group of countries the same level of applied fertilizers The
problem of nutrients supply to a growing plant does not however refer only to the balanced
amounts of the applied fertilizers but also to the crop accessibility to soil natural nutrient
pools This problem is inherently related to conditions of root system growth in the soil
body There are a lot of factors limiting roots accessibility to water and nutrients even in
soils of high natural fertility which have been forgotten in the last 50 years but the most
important is soil acidy and related toxicity of aluminum (Atkinson et al 2005 Diatta et al
2010 Marschner 1991 Struik and Bonciarelli 1997) The key strategic target for farmers is to
increase soil volume directly occupied by plant roots in order to improve their access to
unavailable pools of nutrients Three main areas of soil productivity improvement via
increasing crop plants accessibility to nutrients in the subsoil at least may be considered i)
regulation of soil reaction ii) increase of organic matter content iii) removing of any kind of
hardpans It seems highly probable that in the case of Poland all three groups of measures
wwwintechopencom
Soil Fertility Improvement and Integrated Nutrient Management ndash A Global Perspective
180
are important In other countries of the CE soil acidity should be considered as an
agronomical problem for farmers conducting production on Luvisols
7 References
Atkinson A Black K amp Dawson L (2005) Prospects advantages and limitations of future crop production systems dependent upon the management processes Annals of Applied Biology Vol 146 pp 203-215 ISSN 1744-7348
Batjes H (2002) Carbon and nitrogen stocks in the soils of Central and Eastern Europe Soil Use Management Vol 18 pp 324-329 ISSN 1475-2743
Cakmak I (2005) The role of potassium in alleviating detrimental effects of abiotic stresses in plants Journal of Plant Nutrition Soil Science Vol 168 pp 521-530 ISSN 1436-8730
Catt J (2001) The agricultural importance of loess Earth-Science Reviews Vol 54 pp 213-229 ISSN 0012-8252
Cochrane N (2004) EU Enlargement Implications for US_EU agricultural relations US-EU Food and Agriculture ComaprisonWRS-04-04 78-86 Available online at
httpwwwersusdagovpublicationsWRS0404WRS0404pdf (Access 20110524)
Csatho P Sisak I amp Radimszky L (2007) Agriculture as a source of phosphorus causing eutrophication in Central and Eastern Europe Soil Use management Vol 23 (suppl 1) pp 36-56 ISSN 1475-2743
Csatho P amp Radimszky L (2009) Two Worlds within EU27 Sharp Contrasts in Organic and Mineral Nitrogen-Phosphorus Use Nitrogen-Phosphorus Balances and Soil Phosphorus Status Widening and Deepening Gap between Western and Central Europe Communications in Soil Science and Plant Analysis Vol 40 pp 999-1019 ISSN 0010-3624
Diatta J Bocianowski J amp Skubiszewska A (2010) Sulphate-based aluminum phytotoxicity mitigation under strong soil acidification Fresenius Environmental Bulletin Vol 19 No 12b pp 3185-3192 ISSN 1018-4619
Dibb D (2000) The mysteries (myths) of nutrient use efficiency Better Crops Vol 84 No 3 pp 3ndash5 ISSN 0006-0089
Dobermann A amp Cassman K (2002) Plant nutrient management for enhanced productivity in intensive grain production systems of the United States and Asia Plant and Soil Vol 247 pp 153-175 ISSN 1573-5036
Evans L amp Fisher R (1999) Yield potential its definition measurement and significance Crop Science Vol 39 pp 1544-1551 ISSN 1896-0782
Falloon P amp Betts R (2010) Climate impacts on European agriculture and water management in the context of adaptation and mitigation ndash the importance of integrated approach Science of Total Environment Vol 408 pp 5667-5687 ISSN 0048-9697
FAOSTAT Available online at httpfaostatfaoorgdefaultaspx (Access 20110524) Fixen P (2004) Phases in narrowing the yield gap Better Crops Vol 88 No 4 p 3 ISSN
0006-0089 Fronzek S amp Carter T (2007) Assessing uncertainties in climate change impacts on
resource potential for Europe based on projections from RCMs and GCMs Climate Change Vol 81 pp 357-371 ISSN 1758-6798
wwwintechopencom
Constraints and Solutions to Maintain Soil Productivity A Case Study from Central Europe
181
Grzebisz W amp Fotyma M (2007) Recommendations and use of potassium fertilizers in Central-Eastern Europe (CEE) In Proceedings International Fertiliser Society No 621 York UK pp 24 ISBN 978-0-85310-258-8
Grzebisz W Diatta J amp Haerdter R (2010) Fertilizer consumption patterns in Central European countries ndash effect on actual yield development trends in 1986-2005 years - a comparative study of the Czech Republic and Poland Journal of Central European Agriculture Vol 11 No 1 pp 73-82 ISSN 1332-9049
IFADATA Statistics online (2011) wwwfertilizerorgifastatisticsifadata datalineasp (Access 20110524)
Jongman R Bunce R amp Metzger R (2006) Objectives and applications of a statistical environmental stratification of Europe Landscape Ecology 21 409-419 ISSN 1572-9761
Karlen D Ditzler C amp Andrews S (2003) Soil quality why and how Geoderma Vol 114 pp 145-156 ISSN 0016-7061
Kelch D amp Osborne S (2001) Crop production capacity in EuropePrime Economic Research ServiceUSDA Agricultural outlookMarch 2001 19-23 ISSN 0099-1066
Marschner H (1991) Mechanisms of adaptation of plants to acid soils Plant and Soil 134 1-20 ISSN 1573-5036
Neumann K Verburg P amp Stehfest E (2010) The yield gap of global production a spatial analysis Agricultural Systems Vol 103 pp 316-326 ISSN 0308-521X
Nikolova M (1998) The soil potassium resources and the efficiency of potassium fertilizers in Bulgaria Nikola Poushkarow Inst of Soil Science and Agroecology Sofia Bulgaria IPI Country Report 12 39 pp
Olesen J amp Bindi M (2002) Consequences of climate change for European agricultural productivity land use and policy European Journal of Agronomy Vol 16 pp 239-262 ISSN 1161-0301
Olesen J Trnka M amp Kersebaum K (2011) Impacts and adaptation of European crop production systems to climate change European Journal of Agronomy Vol 34 pp 96-112 ISSN 1161-0301
Plant J Whittaker A amp Demitriades B (2005) The geological and tectonic framework of Europe Geochemical Atlas of Europe Part 1 Background Information Methodology Ed Salminen R Maps GTK FOREGS 20 pp ISBN 951-690-956-6
Rabbinge R (1993) The ecological background of food production In Crop protection and sustainable agriculture Wiley Chichester (Ciba Foundation Symposium 177 2-29 ISBN 10 0471939447
Rabbinge R amp Diepen C (2000) Changes in agriculture and land use in Europe European Journal of Agronomy Vol 13 pp 85-100 ISSN 1161-0301
Reilly J Fuglie K (1998) Future yield growth in field crops what evidence exists Soil amp Tillage Research Vol 47 pp 275-290 ISSN 0168-1987
Roberts T (2006) Improving Nutrient Use Efficiency Proceedings of the IFA Agriculture Conference Optimizing Resource Use Efficiency for Sustainable Intensification of Agriculture 27 february-2 March 2006 Kunming China pp 8
Rosegrant M Paisner M amp Meijer S (2001) Global Food Projections to 2020 Emerging trends and alternative futures IFPRI pp 206 ISBN 0-89629-640-7
wwwintechopencom
Soil Fertility Improvement and Integrated Nutrient Management ndash A Global Perspective
182
Sinclair T Purcell L amp Sneller C (2004) Crop transformation and the challenge to increase yield potential Trends in Plant Science Vol 9 No 2 pp 70-75 ISSN 136085
Struik P amp Bonciarelli F (1997) Resource use at the cropping system level European Journal of Agronomy Vol 7 pp 133-143 ISSN 1161-0301
Supit I van Diepen C amp de Wit A (2010) Recent changes in the climatic yield potential of various crops in Europe Agricultural Systems Vol 103 pp 683-694 ISSN 0308-521X
wwwintechopencom
Soil Fertility Improvement and Integrated Nutrient Management - AGlobal PerspectiveEdited by Dr Joann Whalen
ISBN 978-953-307-945-5Hard cover 306 pagesPublisher InTechPublished online 24 February 2012Published in print edition February 2012
InTech EuropeUniversity Campus STeP Ri Slavka Krautzeka 83A 51000 Rijeka Croatia Phone +385 (51) 770 447 Fax +385 (51) 686 166wwwintechopencom
InTech ChinaUnit 405 Office Block Hotel Equatorial Shanghai No65 Yan An Road (West) Shanghai 200040 China
Phone +86-21-62489820 Fax +86-21-62489821
Soil Fertility Improvement and Integrated Nutrient Management A Global Perspective presents 15 invitedchapters written by leading soil fertility experts The book is organized around three themes The first theme isSoil Mapping and Soil Fertility Testing describing spatial heterogeneity in soil nutrients within natural andmanaged ecosystems as well as up-to-date soil testing methods and information on how soil fertility indicatorsrespond to agricultural practices The second theme Organic and Inorganic Amendments for Soil FertilityImprovement describes fertilizing materials that provide important amounts of essential nutrients forplantsThe third theme Integrated Nutrient Management Planning Case Studies From Central Europe SouthAmerica and Africa highlights the principles of integrated nutrient management Additionally it gives casestudies explaining how this approach has been implemented successfully across large geographic regionsand at local scales to improve the productivity of staple crops and forages
How to referenceIn order to correctly reference this scholarly work feel free to copy and paste the following
Witold Grzebisz and Jean Diatta (2012) Constraints and Solutions to Maintain Soil Productivity A Case Studyfrom Central Europe Soil Fertility Improvement and Integrated Nutrient Management - A Global PerspectiveDr Joann Whalen (Ed) ISBN 978-953-307-945-5 InTech Available fromhttpwwwintechopencombookssoil-fertility-improvement-and-integrated-nutrient-management-a-global-perspectiveconstraints-and-solutions-to-maintain-soil-productivity-a-case-study-from-central-europe
copy 2012 The Author(s) Licensee IntechOpen This is an open access articledistributed under the terms of the Creative Commons Attribution 30License which permits unrestricted use distribution and reproduction inany medium provided the original work is properly cited

Constraints and Solutions to Maintain Soil Productivity A Case Study from Central Europe
169
0
10
20
30
40
50
60
70
80
90
100
AL BU CZ H PL RO SE SK SL
Countries
P s
oil
fert
ility
in
de
x
A
L
1980s
2000s
Sufficiency level
Fig 4 Phosphorus soil fertility indices (expressed as the percentage of arable land AL) for selected CE countries during the period 1986 - 2008 (based on Csatho et al 2007) The sufficiency level was assumed to be 70 as described by Grzebisz amp Fotyma (2007) Country acronyms are given in Table 1
4 Soil productivity assessment
41 Long-term trends in crop yields
All CE countries grow the same crops and cereal species predominate The area sown with cereals occupies 64 of arable land in Croatia 52 - in the Czech Republic 68 - in Poland and 59 ndash in Romania In the Czech Republic cerealsrsquo production is dominated by wheat and barley but in Poland by wheat and rye In Romania and Croatia maize is the key grain crop Sugar beets due to EU regulation in the last 10 years are of minor importance but this crop is a good indicator of soil quality Therefore it has been assumed that these crops would reflect fairly well changes in current soil fertility status as a consequence of applied nutrient management strategies This assumption is well documented by observed variability of yields of wheat maize and sugar beets in selected countries of CE (Table 5) The highest variability was found for Romania and the lowest for Poland Romania is a country with an extensive pattern of fertilizersrsquo management typical in the Southern Agricultural Zone of Europe Poland belongs to countries of the Northern Zone but presents a balanced patterns of fertilizersrsquo management (Poland Hungary) Other selected countries are members of the Unbalanced fertilizing group of CE countries
The long-term yield trend can be used as an indicator of key crops sensitivity to past and current fertilizersrsquo management As in the case of fertilizersrsquo consumption trends three consecutive phases of yield development over the period 1986-2008 may be distinguished
1 Actual-Standard (AS) 2 Recession (RC) 3 Restoration (RS) or Stagnation (SG)
The observed trends of harvested yields were most pronounced for wheat other cereals and for seed crops like oil-seed rape (Grzebisz et al 2010) In the first phase of the study taking
wwwintechopencom
Soil Fertility Improvement and Integrated Nutrient Management ndash A Global Perspective
170
place at the end of the 80s yields of wheat reached on average the highest recorded levels Therefore this particular period is considered as a standard level (AS) for evaluating subsequent phases (Fig 5) The highest yield decline ie the recession phase (RC) in response to the collapse in fertilizer consumption took place in the Northern Zone but
Crops Croatia Czech Republic Poland Romania
x plusmn SD5 CV6 x plusmn SD CV x plusmn SD CV x plusmn SD CV
Wheat 40plusmn052
39plusmn033
44plusmn094
125
86
216
48plusmn05
51plusmn04
52plusmn06
102
78
113
36plusmn03
37plusmn02
39plusmn04
90
56
100
27plusmn06
31plusmn04
29plusmn08
212
141
265
Maize 49plusmn10
40plusmn09
55plusmn13
205
217
229
58plusmn13
51plusmn05
69plusmn05
214
93
76
52plusmn08
49plusmn02
56plusmn08
143
41
157
31plusmn08
29plusmn05
34plusmn11
244
180
315
Sugar
beet
404plusmn77
398plusmn49
487plusmn52
192
123
108
424plusmn76
345plusmn15
531plusmn49
180
42
49
381plusmn55
346plusmn19
451plusmn39
145
56
88
228plusmn51
213plusmn29
304plusmn33
222
136
108
1FAOSTAT available online 2011-05-24 21986-2008 31986-1990 42004-2008 5standard deviation 6coefficient of variation
Table 5 Statistical overview of key cropsrsquo yields (t ha-1) in selected Central European
countries during the period 1986-2008 in comparison to the AS phase and the 2004-2008
periods
0
1
2
3
4
5
6
7
1985 1990 1995 2000 2005 2010
Consecutive years CY
Gra
in y
ield
(Y
) t
ha-1
CZ
RO
Country
AS RC RE or ST
Y-CZ = 0056CY + 1089 R2 = 028 P lt 005
TYG
TYG
Legend level of harvested yield AS Actual-Standard RC Recession RE Restoration ST Stagnation
Dashed line refers to AS level of yield ie an average yield harvested in the period 1986-1990 TYG
Temporary Yield Gap
Fig 5 Long-term trends of wheat production in the Czech Republic (CZ) and Romania (RO)
during the period 1986-2008 Significant (Plt005) positive linear trend is shown for the
Czech Republic whereas non-significant for Romania in the period 1992-2008
wwwintechopencom
Constraints and Solutions to Maintain Soil Productivity A Case Study from Central Europe
171
lasted for only two or three years In other countries mainly representing the Southern Zone it was also fast or showed sustained depression The third phase of yield development was manifested in two distinct trends The first ldquorestorationrdquo trend has shown a positive yield gain since yield recession It was revealed in the Northern Zone countries and also for Croatia and Slovenia The second trend has not shown any significant change in yield since the recession resulting in yield stagnation The most interesting attribute of this trend is its high year-to-year variability The difference between the actually harvested and the AS yield has been termed as the temporary yield gap (TYG) (Fig 5) The time required to recover to the AS level was long but country specific In the Northern Zone it lasted for ca 10-12 years exceeding the AS level in 2004 or 2005 In most other countries representing the Southern Zone it has not been reached up to 2008 For maize and sugar beets the recession was also observed In the recovery period maize yields were generally positive but the rate of the yield increase was much higher in the Balanced and Unbalanced groups than in the Extensive group Sugar beets yield increase was very high at the beginning of the 90s exceeding the level reported in the 80s The main reason was a reduction in area sown with sugar beets which forced farmers to cultivate this crop on more fertile soils
42 The concept of partial factor fertilizer nitrogen productivity (PFPN)
This part of the study relies on two main conceptual pillars The first one assumes that each hectare of arable soil regardless of the current crop is supplied with the same amount of nutrients including nitrogen The second assumption takes into account the fact that the unit productivity of in-season applied fertilizer N known as PFPN is a reliable scientific tool to make simple but quick discrimination of factors limiting attainable crop yield (Dobermann amp Casman 2002) Therefore the PFPN index was used to evaluate some but selected CE countries that represent the three patterns of current fertilizer management (Table 4) Croatia and the Czech Republic have been selected as examples for the Unbalanced group whereas Poland is the Balanced group and Romania represents the Extensive group of fertilizersrsquo use
The PFPN index was obtained by dividing the actual yield of a respective crop harvested within a given year by the annual amount of N fertilizers consumed by the country assuming it was applied at an equal rate for all currently cultivated crops Operationally the PFPN index consists of two components
a yield of crop (Y) expressed in kg or t ha-1 b nitrogen fertilizer rate (FN) expressed as kg N ha-1
PFPN = YFN
Based on the long-term trends of PFPN indices for each of the key crops two different types of PFPN indices can be distinguished
1 The real partial factor productivity of applied N ndash (rPFPN) it reflects actual yields as limited by both water and N availability
2 The maximal partial factor productivity of applied N (mPFPN) it was calculated as the 4th quartile of rPFPN indices it refers to yields obtained under ample water supply
To make a reliable estimate of the yield gap for some crops cultivated in the CE the corrected partial factor productivity of applied N (cPFPN) instead of mPFPN has been applied
wwwintechopencom
Soil Fertility Improvement and Integrated Nutrient Management ndash A Global Perspective
172
Operationally it has been calculated as the average of the 4th quartile but excluding extremely elevated rPFPN values which emerged in most of investigated countries at the beginning of the 90s Indices of N productivity (PFPN rPFPN and cPFPN) were then used to calculate the yield gap
The calculated rPFPN indices showed as expected high year-to-year variability for all tested crops (Table 6) They were crop and country specific when averaged over the 1986-2008 period
a wheat CR lt CZ = PL lt RO b maize CR lt CZ lt PL lt RO c sugar beets CR = CZ lt PL lt RO
These ranges are not in line with long-term average yields of all crops which followed generally the order CZ gt CR gt PL gt RO
Maximum productivity of tested crops as evaluated for the 4th quartile of rPFPN indices was
much higher rising on average by 43 However the increase was country specific and
represents 63 for Croatia 28 for the Czech Republic 30 for Poland and 48 for
Romania The concept of mPFPN assumes an increase of rPFPN indices pursuant to higher
efficiency of applied fertilizer nitrogen due to ample water supply Its reliability has been
corroborated by low coefficients of variation implicitly indicating the potential productivity
of applied fertilizer nitrogen on the background of soil quality The sequences of countries
for each crop are as follows
a wheat CZ = PL lt CR lt RO b maize CR = CZ lt PL lt RO c sugar beets CZ lt PL lt CR lt RO
As presented in Table 6 coefficients of variations of cPFPN indices were significantly lower in comparison to mPFPN stressing on the reliability of the conducted analysis
Relationships between sets of developed rPFPN and applied fertilizer nitrogen rates can also be a useful tool for making long-term assessment of nitrogen efficiency This relationship fits the best the power function
rPFPN = 9112N-067 for R2 = 077 and n = 92
where N ndash annual rate of fertilizer nitrogen consumption kg N ha-1
Analysis of the general curve shape reveals decreasing yield per unit of N fertilizer applied with highest values of rPFPN It has been observed that irrespective of the applied N rate long-term productivity of fertilizer nitrogen increased in the order Romania lt Poland lt Croatia lt the Czech Republic However the obtained high rPFPN values are as a rule related to lower yields of harvested crops This pattern of crop response refers mostly to Bulgaria Romania and former Yugoslavia countries excluding Croatia and Slovenia As pointed out by Fixen (2004) the target of efficient N fertilizer management based on high fertilizer N use efficiency is counter-productive In this N supply system plants are forced to take up an appreciable amount of N from its soil resources which decreases their rate of growth in critical stages of yield performance Therefore ldquothe elevatedrdquo level of the PFPN could be used as an attribute of the extensive type of agriculture production
wwwintechopencom
Constraints and Solutions to Maintain Soil Productivity A Case Study from Central Europe
173
PFPN
index
Croatia Czech Republic Poland Romania
x plusmn SD1 CV2 x plusmn SD CV x plusmn SD CV x plusmn SD CV
Wheat kg yield kg N-1
rPFPN 48plusmn24 498 54plusmn13 235 54plusmn15 275 81plusmn33 405
mPFPN 80plusmn23 288 70plusmn11 160 72plusmn15 212 121plusmn14 119
cPFPN 63plusmn11 174 62plusmn4 59 62plusmn2 30 112plusmn8 69
Maize kg yield kg N-1
rPFPN 56plusmn26 464 66plusmn18 281 78plusmn21 263 95plusmn45 478
mPFPN 89plusmn29 288 89plusmn7 76 103plusmn11 102 149plusmn20 135
cPFPN 69plusmn10 151 89plusmn7 76 96plusmn2 24 137plusmn9 66
Sugar beets kg yield kg N-1
rPFPN 471plusmn224 477 478plusmn120 250 566plusmn136 240 695plusmn266 383
mPFPN 766plusmn218 285 588plusmn49 825 728plusmn67 93 977plusmn122 125
cPFPN 613plusmn86 141 588plusmn49 825 675plusmn35 52 905plusmn36 40
1standard deviation 2coefficient of variation
Table 6 Partial factor fertilizer N productivity statistics for key crops in selected Central European countries with unbalanced (Croatia Czech Republic) balanced (Poland) and extensive (Romania) fertilizersrsquo management during the period 1986-2008
43 Yield gap (YG) and its attributes
Actual yields of crops harvested by farmers in all areas of the world are much lower than
the yield potential of currently cultivated varieties under defined soil and climatic
conditions This ldquovirtualrdquo un-harvested portion of yield is generally termed the yield gap
(YG) (Evans amp Fisher 1999 Dobermann amp Cassman 2002) However the CE countries
experience another phenomenon known as the temporary yield gap (TYG) (Grzebisz et al
2010) The main reason of its emergence is the collapse in fertilizer use leading to elevation
of the rPFPN index Dibb (2000) relates extremely high N efficiency to low yield and this
trend was fully corroborated by the crop yield data from countries with extensive fertilizer
management Nevertheless the countries of the Northern Agricultural Zone (Czech
Republic Hungary Poland Slovakia) in spite of drastic decrease of consumed fertilizers in
the early 90s were characterized by high yields of wheat and other cereal crops (FAOSTAT
2011 Grzebisz et al 2010) The observed rPFPN indices extremely elevated at the beginning
of the 90s were a result of the residual effect of applied fertilizer N This phenomenon could
be manifested only under growth conditions created by ample water and sufficiently high
supply of immobile nutrients such as P and K in turn balancing N use by currently growing
crops
In the first step of yield gap calculation the cPFPN index was applied to assess the maximal
attainable yield (YAM) The yield gap was then calculated as a difference between really
harvestable yield (YA) and YAM
wwwintechopencom
Soil Fertility Improvement and Integrated Nutrient Management ndash A Global Perspective
174
YAM = cPFPN middot DN
YG = YA ndash YAM
where
DN is the rate of annually applied fertilizer N (kg N ha-1) YA is the actual yield in t ha-1 for a
given year and YAM is the maximal attainable yield (t ha-1)
The observed similarities of the general yield gap pattern over time for key crops allow to
distinguish three consecutive phases of its development in the period 1986-2008 (Fig 6)
1 First ndash primary deep yield gap to the left of the transition point (TP) 2 Second ndash point of extra yield gain TP 3 Third- secondary yield gap to the right of the TP alternatively yield gap stagnation as
indicated by the lack of significant (P lt 005) linear trend response
-7
-6
-5
-4
-3
-2
-1
0
1
2
1985 1990 1995 2000 2005 2010
Consecutive years CY
Yie
ld g
ap
(Y
G)
t h
a-1
CZ
RO
TP
YGd-CZ = 079CY - 1573 R2 = 070 P lt 001
YGd-RO = 068CY - 1354 R2 = 072 P lt 0001
YGr-CZ = -012CY + 2354 R2 = 046 P lt 0001
Country
Legend TP - Transition Point YGd - yield gap decline YGr - yield gap restoration
Fig 6 Evolution of the yield gap in wheat in the Czech Republic (CZ) and Romania (RO) during the period 1986 -2008 Significant (Plt005) positive linear equations are shown for the Czech Republic in the period 1986-92 and for Romania in the period 1986-1995 thereafter showed a negative linear relationship for the Czech Republic and non-significant trend for Romania
Wheat is the best example of the yield gap course in the CE countries stressing on the
difference in fertilizer management The main dissimilarities among countries do not refer
to the first phase The YG was deep in spite of relatively high yield indicating thus a low
capacity of contemporary cultivated varieties to achieve further gains in yield Much more
important were YG length and number of years to reach the TP The time to reach the TP
was shorter (6(7) years) in countries such as the Czech and Slovak Republics Hungary and
Poland and also in Croatia and Slovenia corresponding to rapid rebuilding of fertilizer
wwwintechopencom
Constraints and Solutions to Maintain Soil Productivity A Case Study from Central Europe
175
markets in these countries In countries with extensive fertilizersrsquo management the length of
the first phase extended up to mid-90s
The YG evaluation shows that the current nutrient management in CE countries can
overcome this phenomenon especially in the case of wheat and maize A TYG can be most
easily negated in countries belonging to Unbalanced or Balanced nutrient management
groups such as the Czech and Slovak Republics Hungary and Poland and also Croatia and
Slovenia In countries with extensive fertilizersrsquo management the TYG has not been
overcome and enters the third phase of yield development stagnation due to low use of
fertilizers in turn resulting in the very low and unstable level of annually harvested yields
44 Yield prognosis ndash The unassimilated nitrogen concept
The medium or long-term food and environmental policy strategies for any country or
particular region are supported by yield prognosis considered as an operational tool
However the ex-ante prognosis depends on the reliability of the data used Two approaches
both relying on the unit productivity of fertilizer nitrogen (PFPN) have been considered The
first assumes extrapolation of real and improved yields based on the linear model (Reilly amp
Fuglie 1998) The second one is based on long term trends of the YG but transformed into
unit of temporarily lost fertilizer nitrogen termed for the purposes of this study as
unassimilated nitrogen This approach as related to nitrogen management has been used to
make a prognosis of yields of key crops in the CE countries
Operationally the concept presented in this chapter assumes that the total amount of
applied fertilizer nitrogen (FN) is simply divided into three main pools i) assimilated
(FaN) ndash nitrogen taken up by meanwhile grown crop ii) unassimilated nitrogen (FuaN) ndash
temporary out of use by plants andor iii) lost from the field (FLN) The quantitative
assessment of the FuaN pool relies on the defined YG procedure individually related to
each investigated crop
FN = FaN + F uaN + FLN
FuaN = YGcPFPN
where
FuaN ndash unassimilated nitrogen kg N ha-1 YG - yield gap cPFPN ndash the corrected partial factor productivity of applied N kg yield kg N-1
In the first step of yield prognosis the Unassimilated Nitrogen Indices (IuaN) should be computed Therefore the original set of YG data for each of the studied crops was transformed into a quantitative amount of nitrogen lost temporarily from the system marked as minus (-IuaN) In the second step of the analysis both sets of actual (YA) and maximum attainable yields (YM) of each crop were regressed against corresponding set of
uaN indices The obtained regression models clearly show that actual yields over the period of 20 years did not respond significantly to the IuaN as reported in Fig 7 for wheat in Romania The positive and simultaneously significant trends were however achieved when the maximum attainable yield (YM) instead of the actual yield (YA) was introduced into the regression model It can be therefore hypothesized that any virtual loss of nitrogen
wwwintechopencom
Soil Fertility Improvement and Integrated Nutrient Management ndash A Global Perspective
176
ie the negative uaN indices reflect the potential status for a yield increase and vice versa Unfortunately the positive indices of the uaN simply describe a state of N soil mining which in turn causes direct yield decline This is consistent with the opinion of Dibb (2000) and typical for many parts of the world including most CE countries
YM = -0114uaN + 2703 R2 = 093 P lt 0001
0
1
2
3
4
5
6
7
8
9
10
-60 -50 -40 -30 -20 -10 0 10
Gra
in y
ield
(Y
) t
ha-1
YA
YM
Yield
type
Unassimilated nitrogen (uaN) kg N ha-1
Fig 7 Yield prognosis of winter wheat based on residual nitrogen - a case of Romania (RO) Significant (Plt005) linear equation represents the trend for the attainable yields in the 1986-2008 period Legend YA ndash actual yield YM ndash maximum yield
Reliable yield prognosis can be performed assuming a certain level of expected yield or by focusing any improvement of production technology on higher N use efficiency The first approach can be best presented for wheat The maximum attainable yield for this crop in Poland and the Czech Republic is fixed at the level of 65 t ha-1 but for Romania at 45 t ha-1 (Rabbinge amp van Diepen 2000) The amount of uaN required to be incorporated into grain yield was calculated by the models and amounted to 48 27 and 33 kg ha-1 respectively It is equal to 58 27 and 100 of annual N rate applied in these countries and does not seem a realistic approach The same rules refer to other key crops in the study Therefore the second concept relying on the ability of currently cultivated crops to fix an extra amount of
uaN seems to be a more realistic approach for making any reliable yield prognosis (Table 7) This assumption is highly promising especially for countries presenting an extensive type of agriculture production for example Romania The expected wheat increase in response to the use of extra 20 kg N ha-1 is possible considering the water limited yield fixed at 45 t ha-1 The prognosis for the Czech Republic is still below the water limited yield being at 65 t ha-1 In Poland the calculated yields are at the same level as Romania but soils are less suitable for wheat production Therefore any grain yield increase seems to be a great challenge for farmers in all countries of the CE In the light of yields prognosis for sugar beets the fixed level of uaN at 20 kg N ha-1 is generally too low The level of 60 t ha-1 of beets seems to be the most reliable short-term target Thereby the amount of uaN successfully managed should be established at the level of 30 kg ha-1
wwwintechopencom
Constraints and Solutions to Maintain Soil Productivity A Case Study from Central Europe
177
CropCountry Linear regression model Yield at 20 kg uaN t ha-1
Wheat
Croatia YM = -0064 uaN + 3989 for R2 = 096 527
Czech Rep YM = -0063 uaN + 4777 for R2 = 088 604
Poland YM = -0060 uaN + 3623 for R2 = 092 482
Romania YM = -0114 uaN + 2703 for R2 = 093 498
Maize
Croatia YM = -0069 uaN + 4852 for R2 = 086 623
Czech Rep YM = -0064 uaN + 6470 for R2 = 069 776
Poland YM = -0085 uaN + 5431 for R2 = 083 713
Romania YM = -0121 uaN + 3348 for R2 = 094 578
Sugar beets
Croatia YM = -0605 uaN + 40677 for R2 = 089 5278
Czech Rep YM = -0458 uaN + 45872 for R2 = 076 5503
Poland YM = -0609 uaN + 39801 for R2 = 081 5198
Romania YM = -0822 uaN + 24046 for R2 = 093 4049
Table 7 Yield prognosis based on the unassimilated quantity of nitrogen (uaN)
5 Soil productivity improvements The concept of NPK fertilizers balance
The simple comparison of CE countries with respect to nutrient management clearly shows
that annual inputs of nitrogen are too high with respect to phosphorus and potassium
Therefore the main reasons of general yield stagnation in most of the CE countries are long-
term negative balances of P and K caused by low input of both mineral and organic
fertilizers As a consequence of soil P and K long-term mining the percentage share of soils
rich in both nutrients declined in the last two decades below the sufficiency level which was
achieved in many countries in 80s (Csatho at al 2007 Grzebisz amp Fotyma 2007)
It has been clearly stressed that in the transition phase of yield development the PFPN indices
reached the highest values resulting in yield gain This phenomenon emerged in years 1990
1991 for Poland and Hungary and in 1991 1992 for the Czech and Slovak Republics In all
these years the supply of P and K fertilizers was low In the Czech Republic ratios between
amounts of applied N-P-K fertilizers expressed as NP2O5K2O was 1025025 on average
This structure in spite of decreased fertilizersrsquo consumption allowed farmers to achieve the
same yields of all crops as in the period 1986-1990 The present structure of nutrient use is as
1015015 for the Czech Republic and 10404 for Poland These disparate nutrient ratios
stress the importance of NPK balance for high crop production The proposed NPK ratio
for the Czech Republic based on the cPFPN index can be established at the level of
1025025 in good years ie under ample water supply or 1025050 in unfavorable years ie
under expected water stress Hence keeping the current level of fertilizers consumption on
arable land ca 130 kg ha-1 one can predict the right amount of nutrients to apply In Poland
the total amount of currently consumed fertilizers is almost the same as in the Czech
wwwintechopencom
Soil Fertility Improvement and Integrated Nutrient Management ndash A Global Perspective
178
Republic Unfortunately soils in Poland are much poorer in potassium and also in
phosphorus being therefore highly sensitive to external supply of nutrients This
conclusion is corroborated by positive trends of yields in response to P and K fertilizers
application as found for all crops since 1991 onwards Consequently under favorable
weather conditions or on soils naturally rich in potassium the suggested formulation of N-
P-K fertilizers is as follows 1033066 but in years with high probability of drought or on
areas sensitive to drought a slightly different formulation is recommended namely
100510
It is not easy to formulate any efficient fertilizing strategy for Romania Since mid- 90s maize and wheat have shown yield stagnation at a very low level The main factors responsible for this situation are i) low N fertilization rates ii) imbalanced use of P and K fertilizers Therefore yields of these two crops are in fact dependent only on the seasonal weather course fluctuating for ca 100 on a yearly scale basis The main reason is unbalanced consumption of basic fertilizers which leads to permanent soil mining especially potassium The NP2O5K2O relationships averaged for the period 2004-2008 as 1027009 is not sufficient to get any yield increase or even its stabilization Potassium accumulates in plant tissues in much higher amounts and is considered as useful nutrient in water management (Cakmak 2005) Thereby this nutrient seems to be crucial for crop production in Romania even taking into account that almost 50 of land area is covered by soil naturally rich in minerals containing K In spite of low N consumption but unbalanced nutrient management there is still a space for an extra N loss for both key crops ie wheat and maize (see Fig 7) Therefore it could be concluded that any yield increase depends on both significant N rate rise and simultaneous change of fertilizer formulations The operational N-P-K fertilizers ratios suggested for Romania are as follows 1033017 in favorable and 10404 in unfavorable years The second scenario should aim at increasing plant survival under drought conditions
6 Thoughts and prospects
The new era of agriculture development in the Central Europe revealed how actual
agriculture outcomes in this region depend on three key factors presented in descending
order i) weather conditions during the growth season ii) inherent soil fertility iii) nitrogen
fertilizer consumption At present the first factor is decisive for crop production High year-
to-year yield variability reflects the imbalanced use of soil and external resources such as
fertilizers Therefore maximum attainable yields ie limited by water supply for example
for wheat are not attainable in all countries of the region In Germany also part of the
Central European region actual yields are above the ldquowater limitedrdquo level (Rabbinge amp
Diepen 2000 Supit et al 2010)
Inherent differences in the nature of soil quality between the CE countries as a background
of nutrient management are strictly related to the soil origin (Plant et al 2005) Except for
Poland all other countries are relatively rich in soils originated from loams (Cambisols) and
loess (Chernozems) These soils exhibit a high inherent potential for supplying K and other
cations such as calcium and magnesium (Nikolova 1998)
However at present nutritional requirements of high yielding crops most of the CE countries are almost entirely oriented on the third yield forming factor ie nitrogen
wwwintechopencom
Constraints and Solutions to Maintain Soil Productivity A Case Study from Central Europe
179
fertilizer use It has been well recognized that a balanced supply of external sources of slowly mobile elements such as phosphorus and potassium is broadly expected (Atkinson et al 2005 Struik amp Bonciarelli 1997) Consequently the average actual and attainable yields of main crops in CE countries are much more related to the soil-adjusted potential than to amounts of currently applied fertilizers As a result CE countries show at present much greater differences in agricultural production than at the end of the 80s
The observed unfavorable patterns of N fertilizer long-term consumption creates problems not only for agriculture production but are also potentially dangerous for the environment as a potential source of reactive nitrogen (Roberts 2006) There are three main questions to be urgently answered by specialists in all countries of the CE region i) do farmers really recognize an increasing yield gap ii) what is the reason for farmers and their advisory services to tolerate low efficiency of nitrogen iii) do farmers and advisory services recognize environmental aspects of the increasing amount of residual nitrogen In order to get answers to these questions one has to be familiar with factors contributing to the improvement in N fertilizer use efficiency
1 Farm management of N in terms of i) N rate quantification ii) time of N fertilizers application and iii) method of N fertilizers application
2 Management of nutrients responsible for the efficiency of N uptake and it in-plant transformation
3 Management of production factors other than N
The first problem is not only of technical nature because it affects in-season nitrogen use
efficiency and in turn actual yieldsrsquo variability However CE countries representing the
restoration type of yield development but at the same time unbalanced pattern of
consumed fertilizers do not indicate needs for increasing actually applied N rates This
strategy is to some extent the core of yield improvement in countries presenting stagnated
type of fertilizersrsquo management provided that any increase in N use will be compensated by
adequate amounts of applied phosphorus and potassium
It could finally be concluded that the realization of both goals of agricultural production in
the CE countries ie i) long-term yield stabilization and even its increase and ii) unit
productivity of the applied fertilizer N increase in turn decreasing amounts of the residual
N requires in the coming future changes in the structure of fertilizersrsquo consumption
keeping in the Unbalanced group of countries the same level of applied fertilizers The
problem of nutrients supply to a growing plant does not however refer only to the balanced
amounts of the applied fertilizers but also to the crop accessibility to soil natural nutrient
pools This problem is inherently related to conditions of root system growth in the soil
body There are a lot of factors limiting roots accessibility to water and nutrients even in
soils of high natural fertility which have been forgotten in the last 50 years but the most
important is soil acidy and related toxicity of aluminum (Atkinson et al 2005 Diatta et al
2010 Marschner 1991 Struik and Bonciarelli 1997) The key strategic target for farmers is to
increase soil volume directly occupied by plant roots in order to improve their access to
unavailable pools of nutrients Three main areas of soil productivity improvement via
increasing crop plants accessibility to nutrients in the subsoil at least may be considered i)
regulation of soil reaction ii) increase of organic matter content iii) removing of any kind of
hardpans It seems highly probable that in the case of Poland all three groups of measures
wwwintechopencom
Soil Fertility Improvement and Integrated Nutrient Management ndash A Global Perspective
180
are important In other countries of the CE soil acidity should be considered as an
agronomical problem for farmers conducting production on Luvisols
7 References
Atkinson A Black K amp Dawson L (2005) Prospects advantages and limitations of future crop production systems dependent upon the management processes Annals of Applied Biology Vol 146 pp 203-215 ISSN 1744-7348
Batjes H (2002) Carbon and nitrogen stocks in the soils of Central and Eastern Europe Soil Use Management Vol 18 pp 324-329 ISSN 1475-2743
Cakmak I (2005) The role of potassium in alleviating detrimental effects of abiotic stresses in plants Journal of Plant Nutrition Soil Science Vol 168 pp 521-530 ISSN 1436-8730
Catt J (2001) The agricultural importance of loess Earth-Science Reviews Vol 54 pp 213-229 ISSN 0012-8252
Cochrane N (2004) EU Enlargement Implications for US_EU agricultural relations US-EU Food and Agriculture ComaprisonWRS-04-04 78-86 Available online at
httpwwwersusdagovpublicationsWRS0404WRS0404pdf (Access 20110524)
Csatho P Sisak I amp Radimszky L (2007) Agriculture as a source of phosphorus causing eutrophication in Central and Eastern Europe Soil Use management Vol 23 (suppl 1) pp 36-56 ISSN 1475-2743
Csatho P amp Radimszky L (2009) Two Worlds within EU27 Sharp Contrasts in Organic and Mineral Nitrogen-Phosphorus Use Nitrogen-Phosphorus Balances and Soil Phosphorus Status Widening and Deepening Gap between Western and Central Europe Communications in Soil Science and Plant Analysis Vol 40 pp 999-1019 ISSN 0010-3624
Diatta J Bocianowski J amp Skubiszewska A (2010) Sulphate-based aluminum phytotoxicity mitigation under strong soil acidification Fresenius Environmental Bulletin Vol 19 No 12b pp 3185-3192 ISSN 1018-4619
Dibb D (2000) The mysteries (myths) of nutrient use efficiency Better Crops Vol 84 No 3 pp 3ndash5 ISSN 0006-0089
Dobermann A amp Cassman K (2002) Plant nutrient management for enhanced productivity in intensive grain production systems of the United States and Asia Plant and Soil Vol 247 pp 153-175 ISSN 1573-5036
Evans L amp Fisher R (1999) Yield potential its definition measurement and significance Crop Science Vol 39 pp 1544-1551 ISSN 1896-0782
Falloon P amp Betts R (2010) Climate impacts on European agriculture and water management in the context of adaptation and mitigation ndash the importance of integrated approach Science of Total Environment Vol 408 pp 5667-5687 ISSN 0048-9697
FAOSTAT Available online at httpfaostatfaoorgdefaultaspx (Access 20110524) Fixen P (2004) Phases in narrowing the yield gap Better Crops Vol 88 No 4 p 3 ISSN
0006-0089 Fronzek S amp Carter T (2007) Assessing uncertainties in climate change impacts on
resource potential for Europe based on projections from RCMs and GCMs Climate Change Vol 81 pp 357-371 ISSN 1758-6798
wwwintechopencom
Constraints and Solutions to Maintain Soil Productivity A Case Study from Central Europe
181
Grzebisz W amp Fotyma M (2007) Recommendations and use of potassium fertilizers in Central-Eastern Europe (CEE) In Proceedings International Fertiliser Society No 621 York UK pp 24 ISBN 978-0-85310-258-8
Grzebisz W Diatta J amp Haerdter R (2010) Fertilizer consumption patterns in Central European countries ndash effect on actual yield development trends in 1986-2005 years - a comparative study of the Czech Republic and Poland Journal of Central European Agriculture Vol 11 No 1 pp 73-82 ISSN 1332-9049
IFADATA Statistics online (2011) wwwfertilizerorgifastatisticsifadata datalineasp (Access 20110524)
Jongman R Bunce R amp Metzger R (2006) Objectives and applications of a statistical environmental stratification of Europe Landscape Ecology 21 409-419 ISSN 1572-9761
Karlen D Ditzler C amp Andrews S (2003) Soil quality why and how Geoderma Vol 114 pp 145-156 ISSN 0016-7061
Kelch D amp Osborne S (2001) Crop production capacity in EuropePrime Economic Research ServiceUSDA Agricultural outlookMarch 2001 19-23 ISSN 0099-1066
Marschner H (1991) Mechanisms of adaptation of plants to acid soils Plant and Soil 134 1-20 ISSN 1573-5036
Neumann K Verburg P amp Stehfest E (2010) The yield gap of global production a spatial analysis Agricultural Systems Vol 103 pp 316-326 ISSN 0308-521X
Nikolova M (1998) The soil potassium resources and the efficiency of potassium fertilizers in Bulgaria Nikola Poushkarow Inst of Soil Science and Agroecology Sofia Bulgaria IPI Country Report 12 39 pp
Olesen J amp Bindi M (2002) Consequences of climate change for European agricultural productivity land use and policy European Journal of Agronomy Vol 16 pp 239-262 ISSN 1161-0301
Olesen J Trnka M amp Kersebaum K (2011) Impacts and adaptation of European crop production systems to climate change European Journal of Agronomy Vol 34 pp 96-112 ISSN 1161-0301
Plant J Whittaker A amp Demitriades B (2005) The geological and tectonic framework of Europe Geochemical Atlas of Europe Part 1 Background Information Methodology Ed Salminen R Maps GTK FOREGS 20 pp ISBN 951-690-956-6
Rabbinge R (1993) The ecological background of food production In Crop protection and sustainable agriculture Wiley Chichester (Ciba Foundation Symposium 177 2-29 ISBN 10 0471939447
Rabbinge R amp Diepen C (2000) Changes in agriculture and land use in Europe European Journal of Agronomy Vol 13 pp 85-100 ISSN 1161-0301
Reilly J Fuglie K (1998) Future yield growth in field crops what evidence exists Soil amp Tillage Research Vol 47 pp 275-290 ISSN 0168-1987
Roberts T (2006) Improving Nutrient Use Efficiency Proceedings of the IFA Agriculture Conference Optimizing Resource Use Efficiency for Sustainable Intensification of Agriculture 27 february-2 March 2006 Kunming China pp 8
Rosegrant M Paisner M amp Meijer S (2001) Global Food Projections to 2020 Emerging trends and alternative futures IFPRI pp 206 ISBN 0-89629-640-7
wwwintechopencom
Soil Fertility Improvement and Integrated Nutrient Management ndash A Global Perspective
182
Sinclair T Purcell L amp Sneller C (2004) Crop transformation and the challenge to increase yield potential Trends in Plant Science Vol 9 No 2 pp 70-75 ISSN 136085
Struik P amp Bonciarelli F (1997) Resource use at the cropping system level European Journal of Agronomy Vol 7 pp 133-143 ISSN 1161-0301
Supit I van Diepen C amp de Wit A (2010) Recent changes in the climatic yield potential of various crops in Europe Agricultural Systems Vol 103 pp 683-694 ISSN 0308-521X
wwwintechopencom
Soil Fertility Improvement and Integrated Nutrient Management - AGlobal PerspectiveEdited by Dr Joann Whalen
ISBN 978-953-307-945-5Hard cover 306 pagesPublisher InTechPublished online 24 February 2012Published in print edition February 2012
InTech EuropeUniversity Campus STeP Ri Slavka Krautzeka 83A 51000 Rijeka Croatia Phone +385 (51) 770 447 Fax +385 (51) 686 166wwwintechopencom
InTech ChinaUnit 405 Office Block Hotel Equatorial Shanghai No65 Yan An Road (West) Shanghai 200040 China
Phone +86-21-62489820 Fax +86-21-62489821
Soil Fertility Improvement and Integrated Nutrient Management A Global Perspective presents 15 invitedchapters written by leading soil fertility experts The book is organized around three themes The first theme isSoil Mapping and Soil Fertility Testing describing spatial heterogeneity in soil nutrients within natural andmanaged ecosystems as well as up-to-date soil testing methods and information on how soil fertility indicatorsrespond to agricultural practices The second theme Organic and Inorganic Amendments for Soil FertilityImprovement describes fertilizing materials that provide important amounts of essential nutrients forplantsThe third theme Integrated Nutrient Management Planning Case Studies From Central Europe SouthAmerica and Africa highlights the principles of integrated nutrient management Additionally it gives casestudies explaining how this approach has been implemented successfully across large geographic regionsand at local scales to improve the productivity of staple crops and forages
How to referenceIn order to correctly reference this scholarly work feel free to copy and paste the following
Witold Grzebisz and Jean Diatta (2012) Constraints and Solutions to Maintain Soil Productivity A Case Studyfrom Central Europe Soil Fertility Improvement and Integrated Nutrient Management - A Global PerspectiveDr Joann Whalen (Ed) ISBN 978-953-307-945-5 InTech Available fromhttpwwwintechopencombookssoil-fertility-improvement-and-integrated-nutrient-management-a-global-perspectiveconstraints-and-solutions-to-maintain-soil-productivity-a-case-study-from-central-europe
copy 2012 The Author(s) Licensee IntechOpen This is an open access articledistributed under the terms of the Creative Commons Attribution 30License which permits unrestricted use distribution and reproduction inany medium provided the original work is properly cited
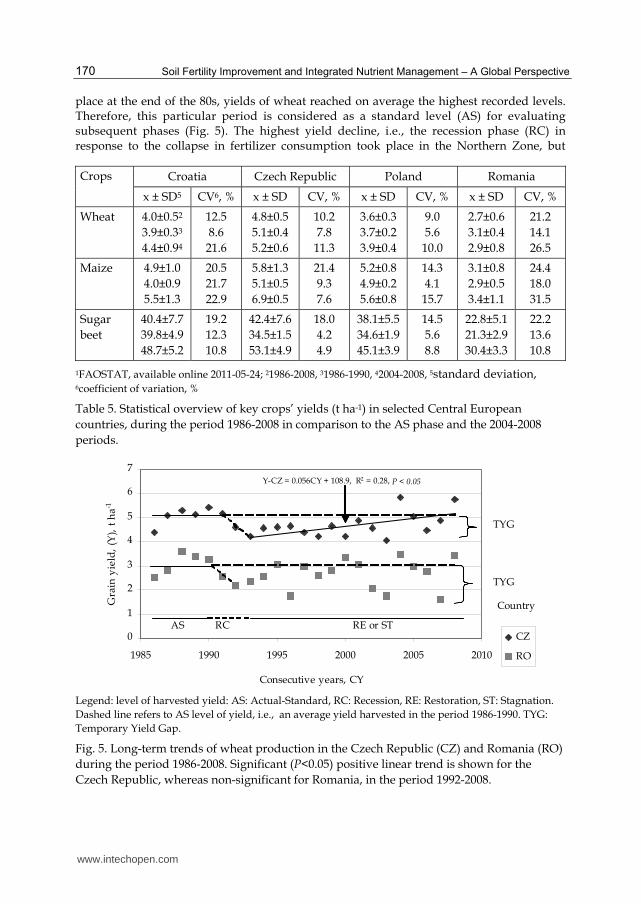
Soil Fertility Improvement and Integrated Nutrient Management ndash A Global Perspective
170
place at the end of the 80s yields of wheat reached on average the highest recorded levels Therefore this particular period is considered as a standard level (AS) for evaluating subsequent phases (Fig 5) The highest yield decline ie the recession phase (RC) in response to the collapse in fertilizer consumption took place in the Northern Zone but
Crops Croatia Czech Republic Poland Romania
x plusmn SD5 CV6 x plusmn SD CV x plusmn SD CV x plusmn SD CV
Wheat 40plusmn052
39plusmn033
44plusmn094
125
86
216
48plusmn05
51plusmn04
52plusmn06
102
78
113
36plusmn03
37plusmn02
39plusmn04
90
56
100
27plusmn06
31plusmn04
29plusmn08
212
141
265
Maize 49plusmn10
40plusmn09
55plusmn13
205
217
229
58plusmn13
51plusmn05
69plusmn05
214
93
76
52plusmn08
49plusmn02
56plusmn08
143
41
157
31plusmn08
29plusmn05
34plusmn11
244
180
315
Sugar
beet
404plusmn77
398plusmn49
487plusmn52
192
123
108
424plusmn76
345plusmn15
531plusmn49
180
42
49
381plusmn55
346plusmn19
451plusmn39
145
56
88
228plusmn51
213plusmn29
304plusmn33
222
136
108
1FAOSTAT available online 2011-05-24 21986-2008 31986-1990 42004-2008 5standard deviation 6coefficient of variation
Table 5 Statistical overview of key cropsrsquo yields (t ha-1) in selected Central European
countries during the period 1986-2008 in comparison to the AS phase and the 2004-2008
periods
0
1
2
3
4
5
6
7
1985 1990 1995 2000 2005 2010
Consecutive years CY
Gra
in y
ield
(Y
) t
ha-1
CZ
RO
Country
AS RC RE or ST
Y-CZ = 0056CY + 1089 R2 = 028 P lt 005
TYG
TYG
Legend level of harvested yield AS Actual-Standard RC Recession RE Restoration ST Stagnation
Dashed line refers to AS level of yield ie an average yield harvested in the period 1986-1990 TYG
Temporary Yield Gap
Fig 5 Long-term trends of wheat production in the Czech Republic (CZ) and Romania (RO)
during the period 1986-2008 Significant (Plt005) positive linear trend is shown for the
Czech Republic whereas non-significant for Romania in the period 1992-2008
wwwintechopencom
Constraints and Solutions to Maintain Soil Productivity A Case Study from Central Europe
171
lasted for only two or three years In other countries mainly representing the Southern Zone it was also fast or showed sustained depression The third phase of yield development was manifested in two distinct trends The first ldquorestorationrdquo trend has shown a positive yield gain since yield recession It was revealed in the Northern Zone countries and also for Croatia and Slovenia The second trend has not shown any significant change in yield since the recession resulting in yield stagnation The most interesting attribute of this trend is its high year-to-year variability The difference between the actually harvested and the AS yield has been termed as the temporary yield gap (TYG) (Fig 5) The time required to recover to the AS level was long but country specific In the Northern Zone it lasted for ca 10-12 years exceeding the AS level in 2004 or 2005 In most other countries representing the Southern Zone it has not been reached up to 2008 For maize and sugar beets the recession was also observed In the recovery period maize yields were generally positive but the rate of the yield increase was much higher in the Balanced and Unbalanced groups than in the Extensive group Sugar beets yield increase was very high at the beginning of the 90s exceeding the level reported in the 80s The main reason was a reduction in area sown with sugar beets which forced farmers to cultivate this crop on more fertile soils
42 The concept of partial factor fertilizer nitrogen productivity (PFPN)
This part of the study relies on two main conceptual pillars The first one assumes that each hectare of arable soil regardless of the current crop is supplied with the same amount of nutrients including nitrogen The second assumption takes into account the fact that the unit productivity of in-season applied fertilizer N known as PFPN is a reliable scientific tool to make simple but quick discrimination of factors limiting attainable crop yield (Dobermann amp Casman 2002) Therefore the PFPN index was used to evaluate some but selected CE countries that represent the three patterns of current fertilizer management (Table 4) Croatia and the Czech Republic have been selected as examples for the Unbalanced group whereas Poland is the Balanced group and Romania represents the Extensive group of fertilizersrsquo use
The PFPN index was obtained by dividing the actual yield of a respective crop harvested within a given year by the annual amount of N fertilizers consumed by the country assuming it was applied at an equal rate for all currently cultivated crops Operationally the PFPN index consists of two components
a yield of crop (Y) expressed in kg or t ha-1 b nitrogen fertilizer rate (FN) expressed as kg N ha-1
PFPN = YFN
Based on the long-term trends of PFPN indices for each of the key crops two different types of PFPN indices can be distinguished
1 The real partial factor productivity of applied N ndash (rPFPN) it reflects actual yields as limited by both water and N availability
2 The maximal partial factor productivity of applied N (mPFPN) it was calculated as the 4th quartile of rPFPN indices it refers to yields obtained under ample water supply
To make a reliable estimate of the yield gap for some crops cultivated in the CE the corrected partial factor productivity of applied N (cPFPN) instead of mPFPN has been applied
wwwintechopencom
Soil Fertility Improvement and Integrated Nutrient Management ndash A Global Perspective
172
Operationally it has been calculated as the average of the 4th quartile but excluding extremely elevated rPFPN values which emerged in most of investigated countries at the beginning of the 90s Indices of N productivity (PFPN rPFPN and cPFPN) were then used to calculate the yield gap
The calculated rPFPN indices showed as expected high year-to-year variability for all tested crops (Table 6) They were crop and country specific when averaged over the 1986-2008 period
a wheat CR lt CZ = PL lt RO b maize CR lt CZ lt PL lt RO c sugar beets CR = CZ lt PL lt RO
These ranges are not in line with long-term average yields of all crops which followed generally the order CZ gt CR gt PL gt RO
Maximum productivity of tested crops as evaluated for the 4th quartile of rPFPN indices was
much higher rising on average by 43 However the increase was country specific and
represents 63 for Croatia 28 for the Czech Republic 30 for Poland and 48 for
Romania The concept of mPFPN assumes an increase of rPFPN indices pursuant to higher
efficiency of applied fertilizer nitrogen due to ample water supply Its reliability has been
corroborated by low coefficients of variation implicitly indicating the potential productivity
of applied fertilizer nitrogen on the background of soil quality The sequences of countries
for each crop are as follows
a wheat CZ = PL lt CR lt RO b maize CR = CZ lt PL lt RO c sugar beets CZ lt PL lt CR lt RO
As presented in Table 6 coefficients of variations of cPFPN indices were significantly lower in comparison to mPFPN stressing on the reliability of the conducted analysis
Relationships between sets of developed rPFPN and applied fertilizer nitrogen rates can also be a useful tool for making long-term assessment of nitrogen efficiency This relationship fits the best the power function
rPFPN = 9112N-067 for R2 = 077 and n = 92
where N ndash annual rate of fertilizer nitrogen consumption kg N ha-1
Analysis of the general curve shape reveals decreasing yield per unit of N fertilizer applied with highest values of rPFPN It has been observed that irrespective of the applied N rate long-term productivity of fertilizer nitrogen increased in the order Romania lt Poland lt Croatia lt the Czech Republic However the obtained high rPFPN values are as a rule related to lower yields of harvested crops This pattern of crop response refers mostly to Bulgaria Romania and former Yugoslavia countries excluding Croatia and Slovenia As pointed out by Fixen (2004) the target of efficient N fertilizer management based on high fertilizer N use efficiency is counter-productive In this N supply system plants are forced to take up an appreciable amount of N from its soil resources which decreases their rate of growth in critical stages of yield performance Therefore ldquothe elevatedrdquo level of the PFPN could be used as an attribute of the extensive type of agriculture production
wwwintechopencom
Constraints and Solutions to Maintain Soil Productivity A Case Study from Central Europe
173
PFPN
index
Croatia Czech Republic Poland Romania
x plusmn SD1 CV2 x plusmn SD CV x plusmn SD CV x plusmn SD CV
Wheat kg yield kg N-1
rPFPN 48plusmn24 498 54plusmn13 235 54plusmn15 275 81plusmn33 405
mPFPN 80plusmn23 288 70plusmn11 160 72plusmn15 212 121plusmn14 119
cPFPN 63plusmn11 174 62plusmn4 59 62plusmn2 30 112plusmn8 69
Maize kg yield kg N-1
rPFPN 56plusmn26 464 66plusmn18 281 78plusmn21 263 95plusmn45 478
mPFPN 89plusmn29 288 89plusmn7 76 103plusmn11 102 149plusmn20 135
cPFPN 69plusmn10 151 89plusmn7 76 96plusmn2 24 137plusmn9 66
Sugar beets kg yield kg N-1
rPFPN 471plusmn224 477 478plusmn120 250 566plusmn136 240 695plusmn266 383
mPFPN 766plusmn218 285 588plusmn49 825 728plusmn67 93 977plusmn122 125
cPFPN 613plusmn86 141 588plusmn49 825 675plusmn35 52 905plusmn36 40
1standard deviation 2coefficient of variation
Table 6 Partial factor fertilizer N productivity statistics for key crops in selected Central European countries with unbalanced (Croatia Czech Republic) balanced (Poland) and extensive (Romania) fertilizersrsquo management during the period 1986-2008
43 Yield gap (YG) and its attributes
Actual yields of crops harvested by farmers in all areas of the world are much lower than
the yield potential of currently cultivated varieties under defined soil and climatic
conditions This ldquovirtualrdquo un-harvested portion of yield is generally termed the yield gap
(YG) (Evans amp Fisher 1999 Dobermann amp Cassman 2002) However the CE countries
experience another phenomenon known as the temporary yield gap (TYG) (Grzebisz et al
2010) The main reason of its emergence is the collapse in fertilizer use leading to elevation
of the rPFPN index Dibb (2000) relates extremely high N efficiency to low yield and this
trend was fully corroborated by the crop yield data from countries with extensive fertilizer
management Nevertheless the countries of the Northern Agricultural Zone (Czech
Republic Hungary Poland Slovakia) in spite of drastic decrease of consumed fertilizers in
the early 90s were characterized by high yields of wheat and other cereal crops (FAOSTAT
2011 Grzebisz et al 2010) The observed rPFPN indices extremely elevated at the beginning
of the 90s were a result of the residual effect of applied fertilizer N This phenomenon could
be manifested only under growth conditions created by ample water and sufficiently high
supply of immobile nutrients such as P and K in turn balancing N use by currently growing
crops
In the first step of yield gap calculation the cPFPN index was applied to assess the maximal
attainable yield (YAM) The yield gap was then calculated as a difference between really
harvestable yield (YA) and YAM
wwwintechopencom
Soil Fertility Improvement and Integrated Nutrient Management ndash A Global Perspective
174
YAM = cPFPN middot DN
YG = YA ndash YAM
where
DN is the rate of annually applied fertilizer N (kg N ha-1) YA is the actual yield in t ha-1 for a
given year and YAM is the maximal attainable yield (t ha-1)
The observed similarities of the general yield gap pattern over time for key crops allow to
distinguish three consecutive phases of its development in the period 1986-2008 (Fig 6)
1 First ndash primary deep yield gap to the left of the transition point (TP) 2 Second ndash point of extra yield gain TP 3 Third- secondary yield gap to the right of the TP alternatively yield gap stagnation as
indicated by the lack of significant (P lt 005) linear trend response
-7
-6
-5
-4
-3
-2
-1
0
1
2
1985 1990 1995 2000 2005 2010
Consecutive years CY
Yie
ld g
ap
(Y
G)
t h
a-1
CZ
RO
TP
YGd-CZ = 079CY - 1573 R2 = 070 P lt 001
YGd-RO = 068CY - 1354 R2 = 072 P lt 0001
YGr-CZ = -012CY + 2354 R2 = 046 P lt 0001
Country
Legend TP - Transition Point YGd - yield gap decline YGr - yield gap restoration
Fig 6 Evolution of the yield gap in wheat in the Czech Republic (CZ) and Romania (RO) during the period 1986 -2008 Significant (Plt005) positive linear equations are shown for the Czech Republic in the period 1986-92 and for Romania in the period 1986-1995 thereafter showed a negative linear relationship for the Czech Republic and non-significant trend for Romania
Wheat is the best example of the yield gap course in the CE countries stressing on the
difference in fertilizer management The main dissimilarities among countries do not refer
to the first phase The YG was deep in spite of relatively high yield indicating thus a low
capacity of contemporary cultivated varieties to achieve further gains in yield Much more
important were YG length and number of years to reach the TP The time to reach the TP
was shorter (6(7) years) in countries such as the Czech and Slovak Republics Hungary and
Poland and also in Croatia and Slovenia corresponding to rapid rebuilding of fertilizer
wwwintechopencom
Constraints and Solutions to Maintain Soil Productivity A Case Study from Central Europe
175
markets in these countries In countries with extensive fertilizersrsquo management the length of
the first phase extended up to mid-90s
The YG evaluation shows that the current nutrient management in CE countries can
overcome this phenomenon especially in the case of wheat and maize A TYG can be most
easily negated in countries belonging to Unbalanced or Balanced nutrient management
groups such as the Czech and Slovak Republics Hungary and Poland and also Croatia and
Slovenia In countries with extensive fertilizersrsquo management the TYG has not been
overcome and enters the third phase of yield development stagnation due to low use of
fertilizers in turn resulting in the very low and unstable level of annually harvested yields
44 Yield prognosis ndash The unassimilated nitrogen concept
The medium or long-term food and environmental policy strategies for any country or
particular region are supported by yield prognosis considered as an operational tool
However the ex-ante prognosis depends on the reliability of the data used Two approaches
both relying on the unit productivity of fertilizer nitrogen (PFPN) have been considered The
first assumes extrapolation of real and improved yields based on the linear model (Reilly amp
Fuglie 1998) The second one is based on long term trends of the YG but transformed into
unit of temporarily lost fertilizer nitrogen termed for the purposes of this study as
unassimilated nitrogen This approach as related to nitrogen management has been used to
make a prognosis of yields of key crops in the CE countries
Operationally the concept presented in this chapter assumes that the total amount of
applied fertilizer nitrogen (FN) is simply divided into three main pools i) assimilated
(FaN) ndash nitrogen taken up by meanwhile grown crop ii) unassimilated nitrogen (FuaN) ndash
temporary out of use by plants andor iii) lost from the field (FLN) The quantitative
assessment of the FuaN pool relies on the defined YG procedure individually related to
each investigated crop
FN = FaN + F uaN + FLN
FuaN = YGcPFPN
where
FuaN ndash unassimilated nitrogen kg N ha-1 YG - yield gap cPFPN ndash the corrected partial factor productivity of applied N kg yield kg N-1
In the first step of yield prognosis the Unassimilated Nitrogen Indices (IuaN) should be computed Therefore the original set of YG data for each of the studied crops was transformed into a quantitative amount of nitrogen lost temporarily from the system marked as minus (-IuaN) In the second step of the analysis both sets of actual (YA) and maximum attainable yields (YM) of each crop were regressed against corresponding set of
uaN indices The obtained regression models clearly show that actual yields over the period of 20 years did not respond significantly to the IuaN as reported in Fig 7 for wheat in Romania The positive and simultaneously significant trends were however achieved when the maximum attainable yield (YM) instead of the actual yield (YA) was introduced into the regression model It can be therefore hypothesized that any virtual loss of nitrogen
wwwintechopencom
Soil Fertility Improvement and Integrated Nutrient Management ndash A Global Perspective
176
ie the negative uaN indices reflect the potential status for a yield increase and vice versa Unfortunately the positive indices of the uaN simply describe a state of N soil mining which in turn causes direct yield decline This is consistent with the opinion of Dibb (2000) and typical for many parts of the world including most CE countries
YM = -0114uaN + 2703 R2 = 093 P lt 0001
0
1
2
3
4
5
6
7
8
9
10
-60 -50 -40 -30 -20 -10 0 10
Gra
in y
ield
(Y
) t
ha-1
YA
YM
Yield
type
Unassimilated nitrogen (uaN) kg N ha-1
Fig 7 Yield prognosis of winter wheat based on residual nitrogen - a case of Romania (RO) Significant (Plt005) linear equation represents the trend for the attainable yields in the 1986-2008 period Legend YA ndash actual yield YM ndash maximum yield
Reliable yield prognosis can be performed assuming a certain level of expected yield or by focusing any improvement of production technology on higher N use efficiency The first approach can be best presented for wheat The maximum attainable yield for this crop in Poland and the Czech Republic is fixed at the level of 65 t ha-1 but for Romania at 45 t ha-1 (Rabbinge amp van Diepen 2000) The amount of uaN required to be incorporated into grain yield was calculated by the models and amounted to 48 27 and 33 kg ha-1 respectively It is equal to 58 27 and 100 of annual N rate applied in these countries and does not seem a realistic approach The same rules refer to other key crops in the study Therefore the second concept relying on the ability of currently cultivated crops to fix an extra amount of
uaN seems to be a more realistic approach for making any reliable yield prognosis (Table 7) This assumption is highly promising especially for countries presenting an extensive type of agriculture production for example Romania The expected wheat increase in response to the use of extra 20 kg N ha-1 is possible considering the water limited yield fixed at 45 t ha-1 The prognosis for the Czech Republic is still below the water limited yield being at 65 t ha-1 In Poland the calculated yields are at the same level as Romania but soils are less suitable for wheat production Therefore any grain yield increase seems to be a great challenge for farmers in all countries of the CE In the light of yields prognosis for sugar beets the fixed level of uaN at 20 kg N ha-1 is generally too low The level of 60 t ha-1 of beets seems to be the most reliable short-term target Thereby the amount of uaN successfully managed should be established at the level of 30 kg ha-1
wwwintechopencom
Constraints and Solutions to Maintain Soil Productivity A Case Study from Central Europe
177
CropCountry Linear regression model Yield at 20 kg uaN t ha-1
Wheat
Croatia YM = -0064 uaN + 3989 for R2 = 096 527
Czech Rep YM = -0063 uaN + 4777 for R2 = 088 604
Poland YM = -0060 uaN + 3623 for R2 = 092 482
Romania YM = -0114 uaN + 2703 for R2 = 093 498
Maize
Croatia YM = -0069 uaN + 4852 for R2 = 086 623
Czech Rep YM = -0064 uaN + 6470 for R2 = 069 776
Poland YM = -0085 uaN + 5431 for R2 = 083 713
Romania YM = -0121 uaN + 3348 for R2 = 094 578
Sugar beets
Croatia YM = -0605 uaN + 40677 for R2 = 089 5278
Czech Rep YM = -0458 uaN + 45872 for R2 = 076 5503
Poland YM = -0609 uaN + 39801 for R2 = 081 5198
Romania YM = -0822 uaN + 24046 for R2 = 093 4049
Table 7 Yield prognosis based on the unassimilated quantity of nitrogen (uaN)
5 Soil productivity improvements The concept of NPK fertilizers balance
The simple comparison of CE countries with respect to nutrient management clearly shows
that annual inputs of nitrogen are too high with respect to phosphorus and potassium
Therefore the main reasons of general yield stagnation in most of the CE countries are long-
term negative balances of P and K caused by low input of both mineral and organic
fertilizers As a consequence of soil P and K long-term mining the percentage share of soils
rich in both nutrients declined in the last two decades below the sufficiency level which was
achieved in many countries in 80s (Csatho at al 2007 Grzebisz amp Fotyma 2007)
It has been clearly stressed that in the transition phase of yield development the PFPN indices
reached the highest values resulting in yield gain This phenomenon emerged in years 1990
1991 for Poland and Hungary and in 1991 1992 for the Czech and Slovak Republics In all
these years the supply of P and K fertilizers was low In the Czech Republic ratios between
amounts of applied N-P-K fertilizers expressed as NP2O5K2O was 1025025 on average
This structure in spite of decreased fertilizersrsquo consumption allowed farmers to achieve the
same yields of all crops as in the period 1986-1990 The present structure of nutrient use is as
1015015 for the Czech Republic and 10404 for Poland These disparate nutrient ratios
stress the importance of NPK balance for high crop production The proposed NPK ratio
for the Czech Republic based on the cPFPN index can be established at the level of
1025025 in good years ie under ample water supply or 1025050 in unfavorable years ie
under expected water stress Hence keeping the current level of fertilizers consumption on
arable land ca 130 kg ha-1 one can predict the right amount of nutrients to apply In Poland
the total amount of currently consumed fertilizers is almost the same as in the Czech
wwwintechopencom
Soil Fertility Improvement and Integrated Nutrient Management ndash A Global Perspective
178
Republic Unfortunately soils in Poland are much poorer in potassium and also in
phosphorus being therefore highly sensitive to external supply of nutrients This
conclusion is corroborated by positive trends of yields in response to P and K fertilizers
application as found for all crops since 1991 onwards Consequently under favorable
weather conditions or on soils naturally rich in potassium the suggested formulation of N-
P-K fertilizers is as follows 1033066 but in years with high probability of drought or on
areas sensitive to drought a slightly different formulation is recommended namely
100510
It is not easy to formulate any efficient fertilizing strategy for Romania Since mid- 90s maize and wheat have shown yield stagnation at a very low level The main factors responsible for this situation are i) low N fertilization rates ii) imbalanced use of P and K fertilizers Therefore yields of these two crops are in fact dependent only on the seasonal weather course fluctuating for ca 100 on a yearly scale basis The main reason is unbalanced consumption of basic fertilizers which leads to permanent soil mining especially potassium The NP2O5K2O relationships averaged for the period 2004-2008 as 1027009 is not sufficient to get any yield increase or even its stabilization Potassium accumulates in plant tissues in much higher amounts and is considered as useful nutrient in water management (Cakmak 2005) Thereby this nutrient seems to be crucial for crop production in Romania even taking into account that almost 50 of land area is covered by soil naturally rich in minerals containing K In spite of low N consumption but unbalanced nutrient management there is still a space for an extra N loss for both key crops ie wheat and maize (see Fig 7) Therefore it could be concluded that any yield increase depends on both significant N rate rise and simultaneous change of fertilizer formulations The operational N-P-K fertilizers ratios suggested for Romania are as follows 1033017 in favorable and 10404 in unfavorable years The second scenario should aim at increasing plant survival under drought conditions
6 Thoughts and prospects
The new era of agriculture development in the Central Europe revealed how actual
agriculture outcomes in this region depend on three key factors presented in descending
order i) weather conditions during the growth season ii) inherent soil fertility iii) nitrogen
fertilizer consumption At present the first factor is decisive for crop production High year-
to-year yield variability reflects the imbalanced use of soil and external resources such as
fertilizers Therefore maximum attainable yields ie limited by water supply for example
for wheat are not attainable in all countries of the region In Germany also part of the
Central European region actual yields are above the ldquowater limitedrdquo level (Rabbinge amp
Diepen 2000 Supit et al 2010)
Inherent differences in the nature of soil quality between the CE countries as a background
of nutrient management are strictly related to the soil origin (Plant et al 2005) Except for
Poland all other countries are relatively rich in soils originated from loams (Cambisols) and
loess (Chernozems) These soils exhibit a high inherent potential for supplying K and other
cations such as calcium and magnesium (Nikolova 1998)
However at present nutritional requirements of high yielding crops most of the CE countries are almost entirely oriented on the third yield forming factor ie nitrogen
wwwintechopencom
Constraints and Solutions to Maintain Soil Productivity A Case Study from Central Europe
179
fertilizer use It has been well recognized that a balanced supply of external sources of slowly mobile elements such as phosphorus and potassium is broadly expected (Atkinson et al 2005 Struik amp Bonciarelli 1997) Consequently the average actual and attainable yields of main crops in CE countries are much more related to the soil-adjusted potential than to amounts of currently applied fertilizers As a result CE countries show at present much greater differences in agricultural production than at the end of the 80s
The observed unfavorable patterns of N fertilizer long-term consumption creates problems not only for agriculture production but are also potentially dangerous for the environment as a potential source of reactive nitrogen (Roberts 2006) There are three main questions to be urgently answered by specialists in all countries of the CE region i) do farmers really recognize an increasing yield gap ii) what is the reason for farmers and their advisory services to tolerate low efficiency of nitrogen iii) do farmers and advisory services recognize environmental aspects of the increasing amount of residual nitrogen In order to get answers to these questions one has to be familiar with factors contributing to the improvement in N fertilizer use efficiency
1 Farm management of N in terms of i) N rate quantification ii) time of N fertilizers application and iii) method of N fertilizers application
2 Management of nutrients responsible for the efficiency of N uptake and it in-plant transformation
3 Management of production factors other than N
The first problem is not only of technical nature because it affects in-season nitrogen use
efficiency and in turn actual yieldsrsquo variability However CE countries representing the
restoration type of yield development but at the same time unbalanced pattern of
consumed fertilizers do not indicate needs for increasing actually applied N rates This
strategy is to some extent the core of yield improvement in countries presenting stagnated
type of fertilizersrsquo management provided that any increase in N use will be compensated by
adequate amounts of applied phosphorus and potassium
It could finally be concluded that the realization of both goals of agricultural production in
the CE countries ie i) long-term yield stabilization and even its increase and ii) unit
productivity of the applied fertilizer N increase in turn decreasing amounts of the residual
N requires in the coming future changes in the structure of fertilizersrsquo consumption
keeping in the Unbalanced group of countries the same level of applied fertilizers The
problem of nutrients supply to a growing plant does not however refer only to the balanced
amounts of the applied fertilizers but also to the crop accessibility to soil natural nutrient
pools This problem is inherently related to conditions of root system growth in the soil
body There are a lot of factors limiting roots accessibility to water and nutrients even in
soils of high natural fertility which have been forgotten in the last 50 years but the most
important is soil acidy and related toxicity of aluminum (Atkinson et al 2005 Diatta et al
2010 Marschner 1991 Struik and Bonciarelli 1997) The key strategic target for farmers is to
increase soil volume directly occupied by plant roots in order to improve their access to
unavailable pools of nutrients Three main areas of soil productivity improvement via
increasing crop plants accessibility to nutrients in the subsoil at least may be considered i)
regulation of soil reaction ii) increase of organic matter content iii) removing of any kind of
hardpans It seems highly probable that in the case of Poland all three groups of measures
wwwintechopencom
Soil Fertility Improvement and Integrated Nutrient Management ndash A Global Perspective
180
are important In other countries of the CE soil acidity should be considered as an
agronomical problem for farmers conducting production on Luvisols
7 References
Atkinson A Black K amp Dawson L (2005) Prospects advantages and limitations of future crop production systems dependent upon the management processes Annals of Applied Biology Vol 146 pp 203-215 ISSN 1744-7348
Batjes H (2002) Carbon and nitrogen stocks in the soils of Central and Eastern Europe Soil Use Management Vol 18 pp 324-329 ISSN 1475-2743
Cakmak I (2005) The role of potassium in alleviating detrimental effects of abiotic stresses in plants Journal of Plant Nutrition Soil Science Vol 168 pp 521-530 ISSN 1436-8730
Catt J (2001) The agricultural importance of loess Earth-Science Reviews Vol 54 pp 213-229 ISSN 0012-8252
Cochrane N (2004) EU Enlargement Implications for US_EU agricultural relations US-EU Food and Agriculture ComaprisonWRS-04-04 78-86 Available online at
httpwwwersusdagovpublicationsWRS0404WRS0404pdf (Access 20110524)
Csatho P Sisak I amp Radimszky L (2007) Agriculture as a source of phosphorus causing eutrophication in Central and Eastern Europe Soil Use management Vol 23 (suppl 1) pp 36-56 ISSN 1475-2743
Csatho P amp Radimszky L (2009) Two Worlds within EU27 Sharp Contrasts in Organic and Mineral Nitrogen-Phosphorus Use Nitrogen-Phosphorus Balances and Soil Phosphorus Status Widening and Deepening Gap between Western and Central Europe Communications in Soil Science and Plant Analysis Vol 40 pp 999-1019 ISSN 0010-3624
Diatta J Bocianowski J amp Skubiszewska A (2010) Sulphate-based aluminum phytotoxicity mitigation under strong soil acidification Fresenius Environmental Bulletin Vol 19 No 12b pp 3185-3192 ISSN 1018-4619
Dibb D (2000) The mysteries (myths) of nutrient use efficiency Better Crops Vol 84 No 3 pp 3ndash5 ISSN 0006-0089
Dobermann A amp Cassman K (2002) Plant nutrient management for enhanced productivity in intensive grain production systems of the United States and Asia Plant and Soil Vol 247 pp 153-175 ISSN 1573-5036
Evans L amp Fisher R (1999) Yield potential its definition measurement and significance Crop Science Vol 39 pp 1544-1551 ISSN 1896-0782
Falloon P amp Betts R (2010) Climate impacts on European agriculture and water management in the context of adaptation and mitigation ndash the importance of integrated approach Science of Total Environment Vol 408 pp 5667-5687 ISSN 0048-9697
FAOSTAT Available online at httpfaostatfaoorgdefaultaspx (Access 20110524) Fixen P (2004) Phases in narrowing the yield gap Better Crops Vol 88 No 4 p 3 ISSN
0006-0089 Fronzek S amp Carter T (2007) Assessing uncertainties in climate change impacts on
resource potential for Europe based on projections from RCMs and GCMs Climate Change Vol 81 pp 357-371 ISSN 1758-6798
wwwintechopencom
Constraints and Solutions to Maintain Soil Productivity A Case Study from Central Europe
181
Grzebisz W amp Fotyma M (2007) Recommendations and use of potassium fertilizers in Central-Eastern Europe (CEE) In Proceedings International Fertiliser Society No 621 York UK pp 24 ISBN 978-0-85310-258-8
Grzebisz W Diatta J amp Haerdter R (2010) Fertilizer consumption patterns in Central European countries ndash effect on actual yield development trends in 1986-2005 years - a comparative study of the Czech Republic and Poland Journal of Central European Agriculture Vol 11 No 1 pp 73-82 ISSN 1332-9049
IFADATA Statistics online (2011) wwwfertilizerorgifastatisticsifadata datalineasp (Access 20110524)
Jongman R Bunce R amp Metzger R (2006) Objectives and applications of a statistical environmental stratification of Europe Landscape Ecology 21 409-419 ISSN 1572-9761
Karlen D Ditzler C amp Andrews S (2003) Soil quality why and how Geoderma Vol 114 pp 145-156 ISSN 0016-7061
Kelch D amp Osborne S (2001) Crop production capacity in EuropePrime Economic Research ServiceUSDA Agricultural outlookMarch 2001 19-23 ISSN 0099-1066
Marschner H (1991) Mechanisms of adaptation of plants to acid soils Plant and Soil 134 1-20 ISSN 1573-5036
Neumann K Verburg P amp Stehfest E (2010) The yield gap of global production a spatial analysis Agricultural Systems Vol 103 pp 316-326 ISSN 0308-521X
Nikolova M (1998) The soil potassium resources and the efficiency of potassium fertilizers in Bulgaria Nikola Poushkarow Inst of Soil Science and Agroecology Sofia Bulgaria IPI Country Report 12 39 pp
Olesen J amp Bindi M (2002) Consequences of climate change for European agricultural productivity land use and policy European Journal of Agronomy Vol 16 pp 239-262 ISSN 1161-0301
Olesen J Trnka M amp Kersebaum K (2011) Impacts and adaptation of European crop production systems to climate change European Journal of Agronomy Vol 34 pp 96-112 ISSN 1161-0301
Plant J Whittaker A amp Demitriades B (2005) The geological and tectonic framework of Europe Geochemical Atlas of Europe Part 1 Background Information Methodology Ed Salminen R Maps GTK FOREGS 20 pp ISBN 951-690-956-6
Rabbinge R (1993) The ecological background of food production In Crop protection and sustainable agriculture Wiley Chichester (Ciba Foundation Symposium 177 2-29 ISBN 10 0471939447
Rabbinge R amp Diepen C (2000) Changes in agriculture and land use in Europe European Journal of Agronomy Vol 13 pp 85-100 ISSN 1161-0301
Reilly J Fuglie K (1998) Future yield growth in field crops what evidence exists Soil amp Tillage Research Vol 47 pp 275-290 ISSN 0168-1987
Roberts T (2006) Improving Nutrient Use Efficiency Proceedings of the IFA Agriculture Conference Optimizing Resource Use Efficiency for Sustainable Intensification of Agriculture 27 february-2 March 2006 Kunming China pp 8
Rosegrant M Paisner M amp Meijer S (2001) Global Food Projections to 2020 Emerging trends and alternative futures IFPRI pp 206 ISBN 0-89629-640-7
wwwintechopencom
Soil Fertility Improvement and Integrated Nutrient Management ndash A Global Perspective
182
Sinclair T Purcell L amp Sneller C (2004) Crop transformation and the challenge to increase yield potential Trends in Plant Science Vol 9 No 2 pp 70-75 ISSN 136085
Struik P amp Bonciarelli F (1997) Resource use at the cropping system level European Journal of Agronomy Vol 7 pp 133-143 ISSN 1161-0301
Supit I van Diepen C amp de Wit A (2010) Recent changes in the climatic yield potential of various crops in Europe Agricultural Systems Vol 103 pp 683-694 ISSN 0308-521X
wwwintechopencom
Soil Fertility Improvement and Integrated Nutrient Management - AGlobal PerspectiveEdited by Dr Joann Whalen
ISBN 978-953-307-945-5Hard cover 306 pagesPublisher InTechPublished online 24 February 2012Published in print edition February 2012
InTech EuropeUniversity Campus STeP Ri Slavka Krautzeka 83A 51000 Rijeka Croatia Phone +385 (51) 770 447 Fax +385 (51) 686 166wwwintechopencom
InTech ChinaUnit 405 Office Block Hotel Equatorial Shanghai No65 Yan An Road (West) Shanghai 200040 China
Phone +86-21-62489820 Fax +86-21-62489821
Soil Fertility Improvement and Integrated Nutrient Management A Global Perspective presents 15 invitedchapters written by leading soil fertility experts The book is organized around three themes The first theme isSoil Mapping and Soil Fertility Testing describing spatial heterogeneity in soil nutrients within natural andmanaged ecosystems as well as up-to-date soil testing methods and information on how soil fertility indicatorsrespond to agricultural practices The second theme Organic and Inorganic Amendments for Soil FertilityImprovement describes fertilizing materials that provide important amounts of essential nutrients forplantsThe third theme Integrated Nutrient Management Planning Case Studies From Central Europe SouthAmerica and Africa highlights the principles of integrated nutrient management Additionally it gives casestudies explaining how this approach has been implemented successfully across large geographic regionsand at local scales to improve the productivity of staple crops and forages
How to referenceIn order to correctly reference this scholarly work feel free to copy and paste the following
Witold Grzebisz and Jean Diatta (2012) Constraints and Solutions to Maintain Soil Productivity A Case Studyfrom Central Europe Soil Fertility Improvement and Integrated Nutrient Management - A Global PerspectiveDr Joann Whalen (Ed) ISBN 978-953-307-945-5 InTech Available fromhttpwwwintechopencombookssoil-fertility-improvement-and-integrated-nutrient-management-a-global-perspectiveconstraints-and-solutions-to-maintain-soil-productivity-a-case-study-from-central-europe
copy 2012 The Author(s) Licensee IntechOpen This is an open access articledistributed under the terms of the Creative Commons Attribution 30License which permits unrestricted use distribution and reproduction inany medium provided the original work is properly cited
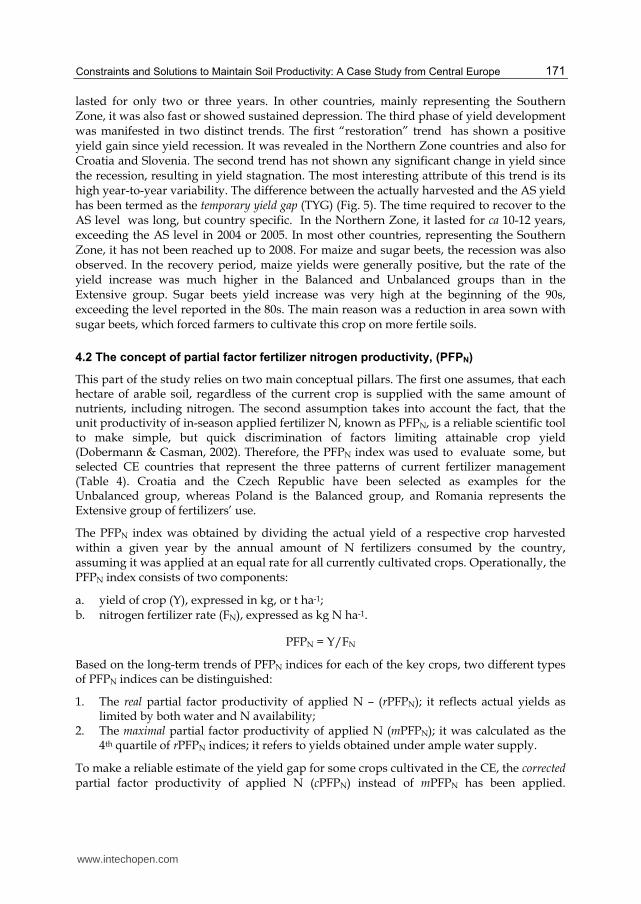
Constraints and Solutions to Maintain Soil Productivity A Case Study from Central Europe
171
lasted for only two or three years In other countries mainly representing the Southern Zone it was also fast or showed sustained depression The third phase of yield development was manifested in two distinct trends The first ldquorestorationrdquo trend has shown a positive yield gain since yield recession It was revealed in the Northern Zone countries and also for Croatia and Slovenia The second trend has not shown any significant change in yield since the recession resulting in yield stagnation The most interesting attribute of this trend is its high year-to-year variability The difference between the actually harvested and the AS yield has been termed as the temporary yield gap (TYG) (Fig 5) The time required to recover to the AS level was long but country specific In the Northern Zone it lasted for ca 10-12 years exceeding the AS level in 2004 or 2005 In most other countries representing the Southern Zone it has not been reached up to 2008 For maize and sugar beets the recession was also observed In the recovery period maize yields were generally positive but the rate of the yield increase was much higher in the Balanced and Unbalanced groups than in the Extensive group Sugar beets yield increase was very high at the beginning of the 90s exceeding the level reported in the 80s The main reason was a reduction in area sown with sugar beets which forced farmers to cultivate this crop on more fertile soils
42 The concept of partial factor fertilizer nitrogen productivity (PFPN)
This part of the study relies on two main conceptual pillars The first one assumes that each hectare of arable soil regardless of the current crop is supplied with the same amount of nutrients including nitrogen The second assumption takes into account the fact that the unit productivity of in-season applied fertilizer N known as PFPN is a reliable scientific tool to make simple but quick discrimination of factors limiting attainable crop yield (Dobermann amp Casman 2002) Therefore the PFPN index was used to evaluate some but selected CE countries that represent the three patterns of current fertilizer management (Table 4) Croatia and the Czech Republic have been selected as examples for the Unbalanced group whereas Poland is the Balanced group and Romania represents the Extensive group of fertilizersrsquo use
The PFPN index was obtained by dividing the actual yield of a respective crop harvested within a given year by the annual amount of N fertilizers consumed by the country assuming it was applied at an equal rate for all currently cultivated crops Operationally the PFPN index consists of two components
a yield of crop (Y) expressed in kg or t ha-1 b nitrogen fertilizer rate (FN) expressed as kg N ha-1
PFPN = YFN
Based on the long-term trends of PFPN indices for each of the key crops two different types of PFPN indices can be distinguished
1 The real partial factor productivity of applied N ndash (rPFPN) it reflects actual yields as limited by both water and N availability
2 The maximal partial factor productivity of applied N (mPFPN) it was calculated as the 4th quartile of rPFPN indices it refers to yields obtained under ample water supply
To make a reliable estimate of the yield gap for some crops cultivated in the CE the corrected partial factor productivity of applied N (cPFPN) instead of mPFPN has been applied
wwwintechopencom
Soil Fertility Improvement and Integrated Nutrient Management ndash A Global Perspective
172
Operationally it has been calculated as the average of the 4th quartile but excluding extremely elevated rPFPN values which emerged in most of investigated countries at the beginning of the 90s Indices of N productivity (PFPN rPFPN and cPFPN) were then used to calculate the yield gap
The calculated rPFPN indices showed as expected high year-to-year variability for all tested crops (Table 6) They were crop and country specific when averaged over the 1986-2008 period
a wheat CR lt CZ = PL lt RO b maize CR lt CZ lt PL lt RO c sugar beets CR = CZ lt PL lt RO
These ranges are not in line with long-term average yields of all crops which followed generally the order CZ gt CR gt PL gt RO
Maximum productivity of tested crops as evaluated for the 4th quartile of rPFPN indices was
much higher rising on average by 43 However the increase was country specific and
represents 63 for Croatia 28 for the Czech Republic 30 for Poland and 48 for
Romania The concept of mPFPN assumes an increase of rPFPN indices pursuant to higher
efficiency of applied fertilizer nitrogen due to ample water supply Its reliability has been
corroborated by low coefficients of variation implicitly indicating the potential productivity
of applied fertilizer nitrogen on the background of soil quality The sequences of countries
for each crop are as follows
a wheat CZ = PL lt CR lt RO b maize CR = CZ lt PL lt RO c sugar beets CZ lt PL lt CR lt RO
As presented in Table 6 coefficients of variations of cPFPN indices were significantly lower in comparison to mPFPN stressing on the reliability of the conducted analysis
Relationships between sets of developed rPFPN and applied fertilizer nitrogen rates can also be a useful tool for making long-term assessment of nitrogen efficiency This relationship fits the best the power function
rPFPN = 9112N-067 for R2 = 077 and n = 92
where N ndash annual rate of fertilizer nitrogen consumption kg N ha-1
Analysis of the general curve shape reveals decreasing yield per unit of N fertilizer applied with highest values of rPFPN It has been observed that irrespective of the applied N rate long-term productivity of fertilizer nitrogen increased in the order Romania lt Poland lt Croatia lt the Czech Republic However the obtained high rPFPN values are as a rule related to lower yields of harvested crops This pattern of crop response refers mostly to Bulgaria Romania and former Yugoslavia countries excluding Croatia and Slovenia As pointed out by Fixen (2004) the target of efficient N fertilizer management based on high fertilizer N use efficiency is counter-productive In this N supply system plants are forced to take up an appreciable amount of N from its soil resources which decreases their rate of growth in critical stages of yield performance Therefore ldquothe elevatedrdquo level of the PFPN could be used as an attribute of the extensive type of agriculture production
wwwintechopencom
Constraints and Solutions to Maintain Soil Productivity A Case Study from Central Europe
173
PFPN
index
Croatia Czech Republic Poland Romania
x plusmn SD1 CV2 x plusmn SD CV x plusmn SD CV x plusmn SD CV
Wheat kg yield kg N-1
rPFPN 48plusmn24 498 54plusmn13 235 54plusmn15 275 81plusmn33 405
mPFPN 80plusmn23 288 70plusmn11 160 72plusmn15 212 121plusmn14 119
cPFPN 63plusmn11 174 62plusmn4 59 62plusmn2 30 112plusmn8 69
Maize kg yield kg N-1
rPFPN 56plusmn26 464 66plusmn18 281 78plusmn21 263 95plusmn45 478
mPFPN 89plusmn29 288 89plusmn7 76 103plusmn11 102 149plusmn20 135
cPFPN 69plusmn10 151 89plusmn7 76 96plusmn2 24 137plusmn9 66
Sugar beets kg yield kg N-1
rPFPN 471plusmn224 477 478plusmn120 250 566plusmn136 240 695plusmn266 383
mPFPN 766plusmn218 285 588plusmn49 825 728plusmn67 93 977plusmn122 125
cPFPN 613plusmn86 141 588plusmn49 825 675plusmn35 52 905plusmn36 40
1standard deviation 2coefficient of variation
Table 6 Partial factor fertilizer N productivity statistics for key crops in selected Central European countries with unbalanced (Croatia Czech Republic) balanced (Poland) and extensive (Romania) fertilizersrsquo management during the period 1986-2008
43 Yield gap (YG) and its attributes
Actual yields of crops harvested by farmers in all areas of the world are much lower than
the yield potential of currently cultivated varieties under defined soil and climatic
conditions This ldquovirtualrdquo un-harvested portion of yield is generally termed the yield gap
(YG) (Evans amp Fisher 1999 Dobermann amp Cassman 2002) However the CE countries
experience another phenomenon known as the temporary yield gap (TYG) (Grzebisz et al
2010) The main reason of its emergence is the collapse in fertilizer use leading to elevation
of the rPFPN index Dibb (2000) relates extremely high N efficiency to low yield and this
trend was fully corroborated by the crop yield data from countries with extensive fertilizer
management Nevertheless the countries of the Northern Agricultural Zone (Czech
Republic Hungary Poland Slovakia) in spite of drastic decrease of consumed fertilizers in
the early 90s were characterized by high yields of wheat and other cereal crops (FAOSTAT
2011 Grzebisz et al 2010) The observed rPFPN indices extremely elevated at the beginning
of the 90s were a result of the residual effect of applied fertilizer N This phenomenon could
be manifested only under growth conditions created by ample water and sufficiently high
supply of immobile nutrients such as P and K in turn balancing N use by currently growing
crops
In the first step of yield gap calculation the cPFPN index was applied to assess the maximal
attainable yield (YAM) The yield gap was then calculated as a difference between really
harvestable yield (YA) and YAM
wwwintechopencom
Soil Fertility Improvement and Integrated Nutrient Management ndash A Global Perspective
174
YAM = cPFPN middot DN
YG = YA ndash YAM
where
DN is the rate of annually applied fertilizer N (kg N ha-1) YA is the actual yield in t ha-1 for a
given year and YAM is the maximal attainable yield (t ha-1)
The observed similarities of the general yield gap pattern over time for key crops allow to
distinguish three consecutive phases of its development in the period 1986-2008 (Fig 6)
1 First ndash primary deep yield gap to the left of the transition point (TP) 2 Second ndash point of extra yield gain TP 3 Third- secondary yield gap to the right of the TP alternatively yield gap stagnation as
indicated by the lack of significant (P lt 005) linear trend response
-7
-6
-5
-4
-3
-2
-1
0
1
2
1985 1990 1995 2000 2005 2010
Consecutive years CY
Yie
ld g
ap
(Y
G)
t h
a-1
CZ
RO
TP
YGd-CZ = 079CY - 1573 R2 = 070 P lt 001
YGd-RO = 068CY - 1354 R2 = 072 P lt 0001
YGr-CZ = -012CY + 2354 R2 = 046 P lt 0001
Country
Legend TP - Transition Point YGd - yield gap decline YGr - yield gap restoration
Fig 6 Evolution of the yield gap in wheat in the Czech Republic (CZ) and Romania (RO) during the period 1986 -2008 Significant (Plt005) positive linear equations are shown for the Czech Republic in the period 1986-92 and for Romania in the period 1986-1995 thereafter showed a negative linear relationship for the Czech Republic and non-significant trend for Romania
Wheat is the best example of the yield gap course in the CE countries stressing on the
difference in fertilizer management The main dissimilarities among countries do not refer
to the first phase The YG was deep in spite of relatively high yield indicating thus a low
capacity of contemporary cultivated varieties to achieve further gains in yield Much more
important were YG length and number of years to reach the TP The time to reach the TP
was shorter (6(7) years) in countries such as the Czech and Slovak Republics Hungary and
Poland and also in Croatia and Slovenia corresponding to rapid rebuilding of fertilizer
wwwintechopencom
Constraints and Solutions to Maintain Soil Productivity A Case Study from Central Europe
175
markets in these countries In countries with extensive fertilizersrsquo management the length of
the first phase extended up to mid-90s
The YG evaluation shows that the current nutrient management in CE countries can
overcome this phenomenon especially in the case of wheat and maize A TYG can be most
easily negated in countries belonging to Unbalanced or Balanced nutrient management
groups such as the Czech and Slovak Republics Hungary and Poland and also Croatia and
Slovenia In countries with extensive fertilizersrsquo management the TYG has not been
overcome and enters the third phase of yield development stagnation due to low use of
fertilizers in turn resulting in the very low and unstable level of annually harvested yields
44 Yield prognosis ndash The unassimilated nitrogen concept
The medium or long-term food and environmental policy strategies for any country or
particular region are supported by yield prognosis considered as an operational tool
However the ex-ante prognosis depends on the reliability of the data used Two approaches
both relying on the unit productivity of fertilizer nitrogen (PFPN) have been considered The
first assumes extrapolation of real and improved yields based on the linear model (Reilly amp
Fuglie 1998) The second one is based on long term trends of the YG but transformed into
unit of temporarily lost fertilizer nitrogen termed for the purposes of this study as
unassimilated nitrogen This approach as related to nitrogen management has been used to
make a prognosis of yields of key crops in the CE countries
Operationally the concept presented in this chapter assumes that the total amount of
applied fertilizer nitrogen (FN) is simply divided into three main pools i) assimilated
(FaN) ndash nitrogen taken up by meanwhile grown crop ii) unassimilated nitrogen (FuaN) ndash
temporary out of use by plants andor iii) lost from the field (FLN) The quantitative
assessment of the FuaN pool relies on the defined YG procedure individually related to
each investigated crop
FN = FaN + F uaN + FLN
FuaN = YGcPFPN
where
FuaN ndash unassimilated nitrogen kg N ha-1 YG - yield gap cPFPN ndash the corrected partial factor productivity of applied N kg yield kg N-1
In the first step of yield prognosis the Unassimilated Nitrogen Indices (IuaN) should be computed Therefore the original set of YG data for each of the studied crops was transformed into a quantitative amount of nitrogen lost temporarily from the system marked as minus (-IuaN) In the second step of the analysis both sets of actual (YA) and maximum attainable yields (YM) of each crop were regressed against corresponding set of
uaN indices The obtained regression models clearly show that actual yields over the period of 20 years did not respond significantly to the IuaN as reported in Fig 7 for wheat in Romania The positive and simultaneously significant trends were however achieved when the maximum attainable yield (YM) instead of the actual yield (YA) was introduced into the regression model It can be therefore hypothesized that any virtual loss of nitrogen
wwwintechopencom
Soil Fertility Improvement and Integrated Nutrient Management ndash A Global Perspective
176
ie the negative uaN indices reflect the potential status for a yield increase and vice versa Unfortunately the positive indices of the uaN simply describe a state of N soil mining which in turn causes direct yield decline This is consistent with the opinion of Dibb (2000) and typical for many parts of the world including most CE countries
YM = -0114uaN + 2703 R2 = 093 P lt 0001
0
1
2
3
4
5
6
7
8
9
10
-60 -50 -40 -30 -20 -10 0 10
Gra
in y
ield
(Y
) t
ha-1
YA
YM
Yield
type
Unassimilated nitrogen (uaN) kg N ha-1
Fig 7 Yield prognosis of winter wheat based on residual nitrogen - a case of Romania (RO) Significant (Plt005) linear equation represents the trend for the attainable yields in the 1986-2008 period Legend YA ndash actual yield YM ndash maximum yield
Reliable yield prognosis can be performed assuming a certain level of expected yield or by focusing any improvement of production technology on higher N use efficiency The first approach can be best presented for wheat The maximum attainable yield for this crop in Poland and the Czech Republic is fixed at the level of 65 t ha-1 but for Romania at 45 t ha-1 (Rabbinge amp van Diepen 2000) The amount of uaN required to be incorporated into grain yield was calculated by the models and amounted to 48 27 and 33 kg ha-1 respectively It is equal to 58 27 and 100 of annual N rate applied in these countries and does not seem a realistic approach The same rules refer to other key crops in the study Therefore the second concept relying on the ability of currently cultivated crops to fix an extra amount of
uaN seems to be a more realistic approach for making any reliable yield prognosis (Table 7) This assumption is highly promising especially for countries presenting an extensive type of agriculture production for example Romania The expected wheat increase in response to the use of extra 20 kg N ha-1 is possible considering the water limited yield fixed at 45 t ha-1 The prognosis for the Czech Republic is still below the water limited yield being at 65 t ha-1 In Poland the calculated yields are at the same level as Romania but soils are less suitable for wheat production Therefore any grain yield increase seems to be a great challenge for farmers in all countries of the CE In the light of yields prognosis for sugar beets the fixed level of uaN at 20 kg N ha-1 is generally too low The level of 60 t ha-1 of beets seems to be the most reliable short-term target Thereby the amount of uaN successfully managed should be established at the level of 30 kg ha-1
wwwintechopencom
Constraints and Solutions to Maintain Soil Productivity A Case Study from Central Europe
177
CropCountry Linear regression model Yield at 20 kg uaN t ha-1
Wheat
Croatia YM = -0064 uaN + 3989 for R2 = 096 527
Czech Rep YM = -0063 uaN + 4777 for R2 = 088 604
Poland YM = -0060 uaN + 3623 for R2 = 092 482
Romania YM = -0114 uaN + 2703 for R2 = 093 498
Maize
Croatia YM = -0069 uaN + 4852 for R2 = 086 623
Czech Rep YM = -0064 uaN + 6470 for R2 = 069 776
Poland YM = -0085 uaN + 5431 for R2 = 083 713
Romania YM = -0121 uaN + 3348 for R2 = 094 578
Sugar beets
Croatia YM = -0605 uaN + 40677 for R2 = 089 5278
Czech Rep YM = -0458 uaN + 45872 for R2 = 076 5503
Poland YM = -0609 uaN + 39801 for R2 = 081 5198
Romania YM = -0822 uaN + 24046 for R2 = 093 4049
Table 7 Yield prognosis based on the unassimilated quantity of nitrogen (uaN)
5 Soil productivity improvements The concept of NPK fertilizers balance
The simple comparison of CE countries with respect to nutrient management clearly shows
that annual inputs of nitrogen are too high with respect to phosphorus and potassium
Therefore the main reasons of general yield stagnation in most of the CE countries are long-
term negative balances of P and K caused by low input of both mineral and organic
fertilizers As a consequence of soil P and K long-term mining the percentage share of soils
rich in both nutrients declined in the last two decades below the sufficiency level which was
achieved in many countries in 80s (Csatho at al 2007 Grzebisz amp Fotyma 2007)
It has been clearly stressed that in the transition phase of yield development the PFPN indices
reached the highest values resulting in yield gain This phenomenon emerged in years 1990
1991 for Poland and Hungary and in 1991 1992 for the Czech and Slovak Republics In all
these years the supply of P and K fertilizers was low In the Czech Republic ratios between
amounts of applied N-P-K fertilizers expressed as NP2O5K2O was 1025025 on average
This structure in spite of decreased fertilizersrsquo consumption allowed farmers to achieve the
same yields of all crops as in the period 1986-1990 The present structure of nutrient use is as
1015015 for the Czech Republic and 10404 for Poland These disparate nutrient ratios
stress the importance of NPK balance for high crop production The proposed NPK ratio
for the Czech Republic based on the cPFPN index can be established at the level of
1025025 in good years ie under ample water supply or 1025050 in unfavorable years ie
under expected water stress Hence keeping the current level of fertilizers consumption on
arable land ca 130 kg ha-1 one can predict the right amount of nutrients to apply In Poland
the total amount of currently consumed fertilizers is almost the same as in the Czech
wwwintechopencom
Soil Fertility Improvement and Integrated Nutrient Management ndash A Global Perspective
178
Republic Unfortunately soils in Poland are much poorer in potassium and also in
phosphorus being therefore highly sensitive to external supply of nutrients This
conclusion is corroborated by positive trends of yields in response to P and K fertilizers
application as found for all crops since 1991 onwards Consequently under favorable
weather conditions or on soils naturally rich in potassium the suggested formulation of N-
P-K fertilizers is as follows 1033066 but in years with high probability of drought or on
areas sensitive to drought a slightly different formulation is recommended namely
100510
It is not easy to formulate any efficient fertilizing strategy for Romania Since mid- 90s maize and wheat have shown yield stagnation at a very low level The main factors responsible for this situation are i) low N fertilization rates ii) imbalanced use of P and K fertilizers Therefore yields of these two crops are in fact dependent only on the seasonal weather course fluctuating for ca 100 on a yearly scale basis The main reason is unbalanced consumption of basic fertilizers which leads to permanent soil mining especially potassium The NP2O5K2O relationships averaged for the period 2004-2008 as 1027009 is not sufficient to get any yield increase or even its stabilization Potassium accumulates in plant tissues in much higher amounts and is considered as useful nutrient in water management (Cakmak 2005) Thereby this nutrient seems to be crucial for crop production in Romania even taking into account that almost 50 of land area is covered by soil naturally rich in minerals containing K In spite of low N consumption but unbalanced nutrient management there is still a space for an extra N loss for both key crops ie wheat and maize (see Fig 7) Therefore it could be concluded that any yield increase depends on both significant N rate rise and simultaneous change of fertilizer formulations The operational N-P-K fertilizers ratios suggested for Romania are as follows 1033017 in favorable and 10404 in unfavorable years The second scenario should aim at increasing plant survival under drought conditions
6 Thoughts and prospects
The new era of agriculture development in the Central Europe revealed how actual
agriculture outcomes in this region depend on three key factors presented in descending
order i) weather conditions during the growth season ii) inherent soil fertility iii) nitrogen
fertilizer consumption At present the first factor is decisive for crop production High year-
to-year yield variability reflects the imbalanced use of soil and external resources such as
fertilizers Therefore maximum attainable yields ie limited by water supply for example
for wheat are not attainable in all countries of the region In Germany also part of the
Central European region actual yields are above the ldquowater limitedrdquo level (Rabbinge amp
Diepen 2000 Supit et al 2010)
Inherent differences in the nature of soil quality between the CE countries as a background
of nutrient management are strictly related to the soil origin (Plant et al 2005) Except for
Poland all other countries are relatively rich in soils originated from loams (Cambisols) and
loess (Chernozems) These soils exhibit a high inherent potential for supplying K and other
cations such as calcium and magnesium (Nikolova 1998)
However at present nutritional requirements of high yielding crops most of the CE countries are almost entirely oriented on the third yield forming factor ie nitrogen
wwwintechopencom
Constraints and Solutions to Maintain Soil Productivity A Case Study from Central Europe
179
fertilizer use It has been well recognized that a balanced supply of external sources of slowly mobile elements such as phosphorus and potassium is broadly expected (Atkinson et al 2005 Struik amp Bonciarelli 1997) Consequently the average actual and attainable yields of main crops in CE countries are much more related to the soil-adjusted potential than to amounts of currently applied fertilizers As a result CE countries show at present much greater differences in agricultural production than at the end of the 80s
The observed unfavorable patterns of N fertilizer long-term consumption creates problems not only for agriculture production but are also potentially dangerous for the environment as a potential source of reactive nitrogen (Roberts 2006) There are three main questions to be urgently answered by specialists in all countries of the CE region i) do farmers really recognize an increasing yield gap ii) what is the reason for farmers and their advisory services to tolerate low efficiency of nitrogen iii) do farmers and advisory services recognize environmental aspects of the increasing amount of residual nitrogen In order to get answers to these questions one has to be familiar with factors contributing to the improvement in N fertilizer use efficiency
1 Farm management of N in terms of i) N rate quantification ii) time of N fertilizers application and iii) method of N fertilizers application
2 Management of nutrients responsible for the efficiency of N uptake and it in-plant transformation
3 Management of production factors other than N
The first problem is not only of technical nature because it affects in-season nitrogen use
efficiency and in turn actual yieldsrsquo variability However CE countries representing the
restoration type of yield development but at the same time unbalanced pattern of
consumed fertilizers do not indicate needs for increasing actually applied N rates This
strategy is to some extent the core of yield improvement in countries presenting stagnated
type of fertilizersrsquo management provided that any increase in N use will be compensated by
adequate amounts of applied phosphorus and potassium
It could finally be concluded that the realization of both goals of agricultural production in
the CE countries ie i) long-term yield stabilization and even its increase and ii) unit
productivity of the applied fertilizer N increase in turn decreasing amounts of the residual
N requires in the coming future changes in the structure of fertilizersrsquo consumption
keeping in the Unbalanced group of countries the same level of applied fertilizers The
problem of nutrients supply to a growing plant does not however refer only to the balanced
amounts of the applied fertilizers but also to the crop accessibility to soil natural nutrient
pools This problem is inherently related to conditions of root system growth in the soil
body There are a lot of factors limiting roots accessibility to water and nutrients even in
soils of high natural fertility which have been forgotten in the last 50 years but the most
important is soil acidy and related toxicity of aluminum (Atkinson et al 2005 Diatta et al
2010 Marschner 1991 Struik and Bonciarelli 1997) The key strategic target for farmers is to
increase soil volume directly occupied by plant roots in order to improve their access to
unavailable pools of nutrients Three main areas of soil productivity improvement via
increasing crop plants accessibility to nutrients in the subsoil at least may be considered i)
regulation of soil reaction ii) increase of organic matter content iii) removing of any kind of
hardpans It seems highly probable that in the case of Poland all three groups of measures
wwwintechopencom
Soil Fertility Improvement and Integrated Nutrient Management ndash A Global Perspective
180
are important In other countries of the CE soil acidity should be considered as an
agronomical problem for farmers conducting production on Luvisols
7 References
Atkinson A Black K amp Dawson L (2005) Prospects advantages and limitations of future crop production systems dependent upon the management processes Annals of Applied Biology Vol 146 pp 203-215 ISSN 1744-7348
Batjes H (2002) Carbon and nitrogen stocks in the soils of Central and Eastern Europe Soil Use Management Vol 18 pp 324-329 ISSN 1475-2743
Cakmak I (2005) The role of potassium in alleviating detrimental effects of abiotic stresses in plants Journal of Plant Nutrition Soil Science Vol 168 pp 521-530 ISSN 1436-8730
Catt J (2001) The agricultural importance of loess Earth-Science Reviews Vol 54 pp 213-229 ISSN 0012-8252
Cochrane N (2004) EU Enlargement Implications for US_EU agricultural relations US-EU Food and Agriculture ComaprisonWRS-04-04 78-86 Available online at
httpwwwersusdagovpublicationsWRS0404WRS0404pdf (Access 20110524)
Csatho P Sisak I amp Radimszky L (2007) Agriculture as a source of phosphorus causing eutrophication in Central and Eastern Europe Soil Use management Vol 23 (suppl 1) pp 36-56 ISSN 1475-2743
Csatho P amp Radimszky L (2009) Two Worlds within EU27 Sharp Contrasts in Organic and Mineral Nitrogen-Phosphorus Use Nitrogen-Phosphorus Balances and Soil Phosphorus Status Widening and Deepening Gap between Western and Central Europe Communications in Soil Science and Plant Analysis Vol 40 pp 999-1019 ISSN 0010-3624
Diatta J Bocianowski J amp Skubiszewska A (2010) Sulphate-based aluminum phytotoxicity mitigation under strong soil acidification Fresenius Environmental Bulletin Vol 19 No 12b pp 3185-3192 ISSN 1018-4619
Dibb D (2000) The mysteries (myths) of nutrient use efficiency Better Crops Vol 84 No 3 pp 3ndash5 ISSN 0006-0089
Dobermann A amp Cassman K (2002) Plant nutrient management for enhanced productivity in intensive grain production systems of the United States and Asia Plant and Soil Vol 247 pp 153-175 ISSN 1573-5036
Evans L amp Fisher R (1999) Yield potential its definition measurement and significance Crop Science Vol 39 pp 1544-1551 ISSN 1896-0782
Falloon P amp Betts R (2010) Climate impacts on European agriculture and water management in the context of adaptation and mitigation ndash the importance of integrated approach Science of Total Environment Vol 408 pp 5667-5687 ISSN 0048-9697
FAOSTAT Available online at httpfaostatfaoorgdefaultaspx (Access 20110524) Fixen P (2004) Phases in narrowing the yield gap Better Crops Vol 88 No 4 p 3 ISSN
0006-0089 Fronzek S amp Carter T (2007) Assessing uncertainties in climate change impacts on
resource potential for Europe based on projections from RCMs and GCMs Climate Change Vol 81 pp 357-371 ISSN 1758-6798
wwwintechopencom
Constraints and Solutions to Maintain Soil Productivity A Case Study from Central Europe
181
Grzebisz W amp Fotyma M (2007) Recommendations and use of potassium fertilizers in Central-Eastern Europe (CEE) In Proceedings International Fertiliser Society No 621 York UK pp 24 ISBN 978-0-85310-258-8
Grzebisz W Diatta J amp Haerdter R (2010) Fertilizer consumption patterns in Central European countries ndash effect on actual yield development trends in 1986-2005 years - a comparative study of the Czech Republic and Poland Journal of Central European Agriculture Vol 11 No 1 pp 73-82 ISSN 1332-9049
IFADATA Statistics online (2011) wwwfertilizerorgifastatisticsifadata datalineasp (Access 20110524)
Jongman R Bunce R amp Metzger R (2006) Objectives and applications of a statistical environmental stratification of Europe Landscape Ecology 21 409-419 ISSN 1572-9761
Karlen D Ditzler C amp Andrews S (2003) Soil quality why and how Geoderma Vol 114 pp 145-156 ISSN 0016-7061
Kelch D amp Osborne S (2001) Crop production capacity in EuropePrime Economic Research ServiceUSDA Agricultural outlookMarch 2001 19-23 ISSN 0099-1066
Marschner H (1991) Mechanisms of adaptation of plants to acid soils Plant and Soil 134 1-20 ISSN 1573-5036
Neumann K Verburg P amp Stehfest E (2010) The yield gap of global production a spatial analysis Agricultural Systems Vol 103 pp 316-326 ISSN 0308-521X
Nikolova M (1998) The soil potassium resources and the efficiency of potassium fertilizers in Bulgaria Nikola Poushkarow Inst of Soil Science and Agroecology Sofia Bulgaria IPI Country Report 12 39 pp
Olesen J amp Bindi M (2002) Consequences of climate change for European agricultural productivity land use and policy European Journal of Agronomy Vol 16 pp 239-262 ISSN 1161-0301
Olesen J Trnka M amp Kersebaum K (2011) Impacts and adaptation of European crop production systems to climate change European Journal of Agronomy Vol 34 pp 96-112 ISSN 1161-0301
Plant J Whittaker A amp Demitriades B (2005) The geological and tectonic framework of Europe Geochemical Atlas of Europe Part 1 Background Information Methodology Ed Salminen R Maps GTK FOREGS 20 pp ISBN 951-690-956-6
Rabbinge R (1993) The ecological background of food production In Crop protection and sustainable agriculture Wiley Chichester (Ciba Foundation Symposium 177 2-29 ISBN 10 0471939447
Rabbinge R amp Diepen C (2000) Changes in agriculture and land use in Europe European Journal of Agronomy Vol 13 pp 85-100 ISSN 1161-0301
Reilly J Fuglie K (1998) Future yield growth in field crops what evidence exists Soil amp Tillage Research Vol 47 pp 275-290 ISSN 0168-1987
Roberts T (2006) Improving Nutrient Use Efficiency Proceedings of the IFA Agriculture Conference Optimizing Resource Use Efficiency for Sustainable Intensification of Agriculture 27 february-2 March 2006 Kunming China pp 8
Rosegrant M Paisner M amp Meijer S (2001) Global Food Projections to 2020 Emerging trends and alternative futures IFPRI pp 206 ISBN 0-89629-640-7
wwwintechopencom
Soil Fertility Improvement and Integrated Nutrient Management ndash A Global Perspective
182
Sinclair T Purcell L amp Sneller C (2004) Crop transformation and the challenge to increase yield potential Trends in Plant Science Vol 9 No 2 pp 70-75 ISSN 136085
Struik P amp Bonciarelli F (1997) Resource use at the cropping system level European Journal of Agronomy Vol 7 pp 133-143 ISSN 1161-0301
Supit I van Diepen C amp de Wit A (2010) Recent changes in the climatic yield potential of various crops in Europe Agricultural Systems Vol 103 pp 683-694 ISSN 0308-521X
wwwintechopencom
Soil Fertility Improvement and Integrated Nutrient Management - AGlobal PerspectiveEdited by Dr Joann Whalen
ISBN 978-953-307-945-5Hard cover 306 pagesPublisher InTechPublished online 24 February 2012Published in print edition February 2012
InTech EuropeUniversity Campus STeP Ri Slavka Krautzeka 83A 51000 Rijeka Croatia Phone +385 (51) 770 447 Fax +385 (51) 686 166wwwintechopencom
InTech ChinaUnit 405 Office Block Hotel Equatorial Shanghai No65 Yan An Road (West) Shanghai 200040 China
Phone +86-21-62489820 Fax +86-21-62489821
Soil Fertility Improvement and Integrated Nutrient Management A Global Perspective presents 15 invitedchapters written by leading soil fertility experts The book is organized around three themes The first theme isSoil Mapping and Soil Fertility Testing describing spatial heterogeneity in soil nutrients within natural andmanaged ecosystems as well as up-to-date soil testing methods and information on how soil fertility indicatorsrespond to agricultural practices The second theme Organic and Inorganic Amendments for Soil FertilityImprovement describes fertilizing materials that provide important amounts of essential nutrients forplantsThe third theme Integrated Nutrient Management Planning Case Studies From Central Europe SouthAmerica and Africa highlights the principles of integrated nutrient management Additionally it gives casestudies explaining how this approach has been implemented successfully across large geographic regionsand at local scales to improve the productivity of staple crops and forages
How to referenceIn order to correctly reference this scholarly work feel free to copy and paste the following
Witold Grzebisz and Jean Diatta (2012) Constraints and Solutions to Maintain Soil Productivity A Case Studyfrom Central Europe Soil Fertility Improvement and Integrated Nutrient Management - A Global PerspectiveDr Joann Whalen (Ed) ISBN 978-953-307-945-5 InTech Available fromhttpwwwintechopencombookssoil-fertility-improvement-and-integrated-nutrient-management-a-global-perspectiveconstraints-and-solutions-to-maintain-soil-productivity-a-case-study-from-central-europe
copy 2012 The Author(s) Licensee IntechOpen This is an open access articledistributed under the terms of the Creative Commons Attribution 30License which permits unrestricted use distribution and reproduction inany medium provided the original work is properly cited
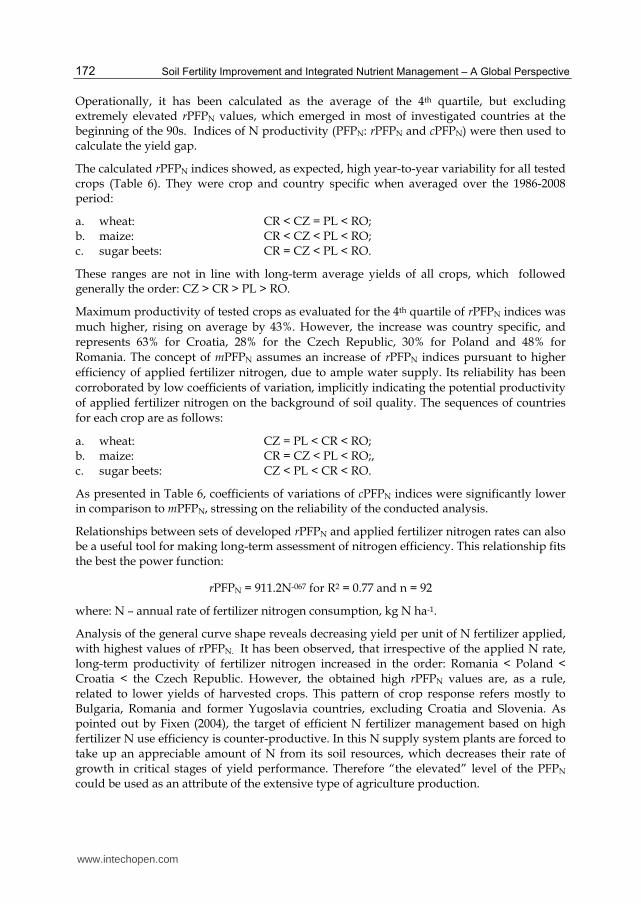
Soil Fertility Improvement and Integrated Nutrient Management ndash A Global Perspective
172
Operationally it has been calculated as the average of the 4th quartile but excluding extremely elevated rPFPN values which emerged in most of investigated countries at the beginning of the 90s Indices of N productivity (PFPN rPFPN and cPFPN) were then used to calculate the yield gap
The calculated rPFPN indices showed as expected high year-to-year variability for all tested crops (Table 6) They were crop and country specific when averaged over the 1986-2008 period
a wheat CR lt CZ = PL lt RO b maize CR lt CZ lt PL lt RO c sugar beets CR = CZ lt PL lt RO
These ranges are not in line with long-term average yields of all crops which followed generally the order CZ gt CR gt PL gt RO
Maximum productivity of tested crops as evaluated for the 4th quartile of rPFPN indices was
much higher rising on average by 43 However the increase was country specific and
represents 63 for Croatia 28 for the Czech Republic 30 for Poland and 48 for
Romania The concept of mPFPN assumes an increase of rPFPN indices pursuant to higher
efficiency of applied fertilizer nitrogen due to ample water supply Its reliability has been
corroborated by low coefficients of variation implicitly indicating the potential productivity
of applied fertilizer nitrogen on the background of soil quality The sequences of countries
for each crop are as follows
a wheat CZ = PL lt CR lt RO b maize CR = CZ lt PL lt RO c sugar beets CZ lt PL lt CR lt RO
As presented in Table 6 coefficients of variations of cPFPN indices were significantly lower in comparison to mPFPN stressing on the reliability of the conducted analysis
Relationships between sets of developed rPFPN and applied fertilizer nitrogen rates can also be a useful tool for making long-term assessment of nitrogen efficiency This relationship fits the best the power function
rPFPN = 9112N-067 for R2 = 077 and n = 92
where N ndash annual rate of fertilizer nitrogen consumption kg N ha-1
Analysis of the general curve shape reveals decreasing yield per unit of N fertilizer applied with highest values of rPFPN It has been observed that irrespective of the applied N rate long-term productivity of fertilizer nitrogen increased in the order Romania lt Poland lt Croatia lt the Czech Republic However the obtained high rPFPN values are as a rule related to lower yields of harvested crops This pattern of crop response refers mostly to Bulgaria Romania and former Yugoslavia countries excluding Croatia and Slovenia As pointed out by Fixen (2004) the target of efficient N fertilizer management based on high fertilizer N use efficiency is counter-productive In this N supply system plants are forced to take up an appreciable amount of N from its soil resources which decreases their rate of growth in critical stages of yield performance Therefore ldquothe elevatedrdquo level of the PFPN could be used as an attribute of the extensive type of agriculture production
wwwintechopencom
Constraints and Solutions to Maintain Soil Productivity A Case Study from Central Europe
173
PFPN
index
Croatia Czech Republic Poland Romania
x plusmn SD1 CV2 x plusmn SD CV x plusmn SD CV x plusmn SD CV
Wheat kg yield kg N-1
rPFPN 48plusmn24 498 54plusmn13 235 54plusmn15 275 81plusmn33 405
mPFPN 80plusmn23 288 70plusmn11 160 72plusmn15 212 121plusmn14 119
cPFPN 63plusmn11 174 62plusmn4 59 62plusmn2 30 112plusmn8 69
Maize kg yield kg N-1
rPFPN 56plusmn26 464 66plusmn18 281 78plusmn21 263 95plusmn45 478
mPFPN 89plusmn29 288 89plusmn7 76 103plusmn11 102 149plusmn20 135
cPFPN 69plusmn10 151 89plusmn7 76 96plusmn2 24 137plusmn9 66
Sugar beets kg yield kg N-1
rPFPN 471plusmn224 477 478plusmn120 250 566plusmn136 240 695plusmn266 383
mPFPN 766plusmn218 285 588plusmn49 825 728plusmn67 93 977plusmn122 125
cPFPN 613plusmn86 141 588plusmn49 825 675plusmn35 52 905plusmn36 40
1standard deviation 2coefficient of variation
Table 6 Partial factor fertilizer N productivity statistics for key crops in selected Central European countries with unbalanced (Croatia Czech Republic) balanced (Poland) and extensive (Romania) fertilizersrsquo management during the period 1986-2008
43 Yield gap (YG) and its attributes
Actual yields of crops harvested by farmers in all areas of the world are much lower than
the yield potential of currently cultivated varieties under defined soil and climatic
conditions This ldquovirtualrdquo un-harvested portion of yield is generally termed the yield gap
(YG) (Evans amp Fisher 1999 Dobermann amp Cassman 2002) However the CE countries
experience another phenomenon known as the temporary yield gap (TYG) (Grzebisz et al
2010) The main reason of its emergence is the collapse in fertilizer use leading to elevation
of the rPFPN index Dibb (2000) relates extremely high N efficiency to low yield and this
trend was fully corroborated by the crop yield data from countries with extensive fertilizer
management Nevertheless the countries of the Northern Agricultural Zone (Czech
Republic Hungary Poland Slovakia) in spite of drastic decrease of consumed fertilizers in
the early 90s were characterized by high yields of wheat and other cereal crops (FAOSTAT
2011 Grzebisz et al 2010) The observed rPFPN indices extremely elevated at the beginning
of the 90s were a result of the residual effect of applied fertilizer N This phenomenon could
be manifested only under growth conditions created by ample water and sufficiently high
supply of immobile nutrients such as P and K in turn balancing N use by currently growing
crops
In the first step of yield gap calculation the cPFPN index was applied to assess the maximal
attainable yield (YAM) The yield gap was then calculated as a difference between really
harvestable yield (YA) and YAM
wwwintechopencom
Soil Fertility Improvement and Integrated Nutrient Management ndash A Global Perspective
174
YAM = cPFPN middot DN
YG = YA ndash YAM
where
DN is the rate of annually applied fertilizer N (kg N ha-1) YA is the actual yield in t ha-1 for a
given year and YAM is the maximal attainable yield (t ha-1)
The observed similarities of the general yield gap pattern over time for key crops allow to
distinguish three consecutive phases of its development in the period 1986-2008 (Fig 6)
1 First ndash primary deep yield gap to the left of the transition point (TP) 2 Second ndash point of extra yield gain TP 3 Third- secondary yield gap to the right of the TP alternatively yield gap stagnation as
indicated by the lack of significant (P lt 005) linear trend response
-7
-6
-5
-4
-3
-2
-1
0
1
2
1985 1990 1995 2000 2005 2010
Consecutive years CY
Yie
ld g
ap
(Y
G)
t h
a-1
CZ
RO
TP
YGd-CZ = 079CY - 1573 R2 = 070 P lt 001
YGd-RO = 068CY - 1354 R2 = 072 P lt 0001
YGr-CZ = -012CY + 2354 R2 = 046 P lt 0001
Country
Legend TP - Transition Point YGd - yield gap decline YGr - yield gap restoration
Fig 6 Evolution of the yield gap in wheat in the Czech Republic (CZ) and Romania (RO) during the period 1986 -2008 Significant (Plt005) positive linear equations are shown for the Czech Republic in the period 1986-92 and for Romania in the period 1986-1995 thereafter showed a negative linear relationship for the Czech Republic and non-significant trend for Romania
Wheat is the best example of the yield gap course in the CE countries stressing on the
difference in fertilizer management The main dissimilarities among countries do not refer
to the first phase The YG was deep in spite of relatively high yield indicating thus a low
capacity of contemporary cultivated varieties to achieve further gains in yield Much more
important were YG length and number of years to reach the TP The time to reach the TP
was shorter (6(7) years) in countries such as the Czech and Slovak Republics Hungary and
Poland and also in Croatia and Slovenia corresponding to rapid rebuilding of fertilizer
wwwintechopencom
Constraints and Solutions to Maintain Soil Productivity A Case Study from Central Europe
175
markets in these countries In countries with extensive fertilizersrsquo management the length of
the first phase extended up to mid-90s
The YG evaluation shows that the current nutrient management in CE countries can
overcome this phenomenon especially in the case of wheat and maize A TYG can be most
easily negated in countries belonging to Unbalanced or Balanced nutrient management
groups such as the Czech and Slovak Republics Hungary and Poland and also Croatia and
Slovenia In countries with extensive fertilizersrsquo management the TYG has not been
overcome and enters the third phase of yield development stagnation due to low use of
fertilizers in turn resulting in the very low and unstable level of annually harvested yields
44 Yield prognosis ndash The unassimilated nitrogen concept
The medium or long-term food and environmental policy strategies for any country or
particular region are supported by yield prognosis considered as an operational tool
However the ex-ante prognosis depends on the reliability of the data used Two approaches
both relying on the unit productivity of fertilizer nitrogen (PFPN) have been considered The
first assumes extrapolation of real and improved yields based on the linear model (Reilly amp
Fuglie 1998) The second one is based on long term trends of the YG but transformed into
unit of temporarily lost fertilizer nitrogen termed for the purposes of this study as
unassimilated nitrogen This approach as related to nitrogen management has been used to
make a prognosis of yields of key crops in the CE countries
Operationally the concept presented in this chapter assumes that the total amount of
applied fertilizer nitrogen (FN) is simply divided into three main pools i) assimilated
(FaN) ndash nitrogen taken up by meanwhile grown crop ii) unassimilated nitrogen (FuaN) ndash
temporary out of use by plants andor iii) lost from the field (FLN) The quantitative
assessment of the FuaN pool relies on the defined YG procedure individually related to
each investigated crop
FN = FaN + F uaN + FLN
FuaN = YGcPFPN
where
FuaN ndash unassimilated nitrogen kg N ha-1 YG - yield gap cPFPN ndash the corrected partial factor productivity of applied N kg yield kg N-1
In the first step of yield prognosis the Unassimilated Nitrogen Indices (IuaN) should be computed Therefore the original set of YG data for each of the studied crops was transformed into a quantitative amount of nitrogen lost temporarily from the system marked as minus (-IuaN) In the second step of the analysis both sets of actual (YA) and maximum attainable yields (YM) of each crop were regressed against corresponding set of
uaN indices The obtained regression models clearly show that actual yields over the period of 20 years did not respond significantly to the IuaN as reported in Fig 7 for wheat in Romania The positive and simultaneously significant trends were however achieved when the maximum attainable yield (YM) instead of the actual yield (YA) was introduced into the regression model It can be therefore hypothesized that any virtual loss of nitrogen
wwwintechopencom
Soil Fertility Improvement and Integrated Nutrient Management ndash A Global Perspective
176
ie the negative uaN indices reflect the potential status for a yield increase and vice versa Unfortunately the positive indices of the uaN simply describe a state of N soil mining which in turn causes direct yield decline This is consistent with the opinion of Dibb (2000) and typical for many parts of the world including most CE countries
YM = -0114uaN + 2703 R2 = 093 P lt 0001
0
1
2
3
4
5
6
7
8
9
10
-60 -50 -40 -30 -20 -10 0 10
Gra
in y
ield
(Y
) t
ha-1
YA
YM
Yield
type
Unassimilated nitrogen (uaN) kg N ha-1
Fig 7 Yield prognosis of winter wheat based on residual nitrogen - a case of Romania (RO) Significant (Plt005) linear equation represents the trend for the attainable yields in the 1986-2008 period Legend YA ndash actual yield YM ndash maximum yield
Reliable yield prognosis can be performed assuming a certain level of expected yield or by focusing any improvement of production technology on higher N use efficiency The first approach can be best presented for wheat The maximum attainable yield for this crop in Poland and the Czech Republic is fixed at the level of 65 t ha-1 but for Romania at 45 t ha-1 (Rabbinge amp van Diepen 2000) The amount of uaN required to be incorporated into grain yield was calculated by the models and amounted to 48 27 and 33 kg ha-1 respectively It is equal to 58 27 and 100 of annual N rate applied in these countries and does not seem a realistic approach The same rules refer to other key crops in the study Therefore the second concept relying on the ability of currently cultivated crops to fix an extra amount of
uaN seems to be a more realistic approach for making any reliable yield prognosis (Table 7) This assumption is highly promising especially for countries presenting an extensive type of agriculture production for example Romania The expected wheat increase in response to the use of extra 20 kg N ha-1 is possible considering the water limited yield fixed at 45 t ha-1 The prognosis for the Czech Republic is still below the water limited yield being at 65 t ha-1 In Poland the calculated yields are at the same level as Romania but soils are less suitable for wheat production Therefore any grain yield increase seems to be a great challenge for farmers in all countries of the CE In the light of yields prognosis for sugar beets the fixed level of uaN at 20 kg N ha-1 is generally too low The level of 60 t ha-1 of beets seems to be the most reliable short-term target Thereby the amount of uaN successfully managed should be established at the level of 30 kg ha-1
wwwintechopencom
Constraints and Solutions to Maintain Soil Productivity A Case Study from Central Europe
177
CropCountry Linear regression model Yield at 20 kg uaN t ha-1
Wheat
Croatia YM = -0064 uaN + 3989 for R2 = 096 527
Czech Rep YM = -0063 uaN + 4777 for R2 = 088 604
Poland YM = -0060 uaN + 3623 for R2 = 092 482
Romania YM = -0114 uaN + 2703 for R2 = 093 498
Maize
Croatia YM = -0069 uaN + 4852 for R2 = 086 623
Czech Rep YM = -0064 uaN + 6470 for R2 = 069 776
Poland YM = -0085 uaN + 5431 for R2 = 083 713
Romania YM = -0121 uaN + 3348 for R2 = 094 578
Sugar beets
Croatia YM = -0605 uaN + 40677 for R2 = 089 5278
Czech Rep YM = -0458 uaN + 45872 for R2 = 076 5503
Poland YM = -0609 uaN + 39801 for R2 = 081 5198
Romania YM = -0822 uaN + 24046 for R2 = 093 4049
Table 7 Yield prognosis based on the unassimilated quantity of nitrogen (uaN)
5 Soil productivity improvements The concept of NPK fertilizers balance
The simple comparison of CE countries with respect to nutrient management clearly shows
that annual inputs of nitrogen are too high with respect to phosphorus and potassium
Therefore the main reasons of general yield stagnation in most of the CE countries are long-
term negative balances of P and K caused by low input of both mineral and organic
fertilizers As a consequence of soil P and K long-term mining the percentage share of soils
rich in both nutrients declined in the last two decades below the sufficiency level which was
achieved in many countries in 80s (Csatho at al 2007 Grzebisz amp Fotyma 2007)
It has been clearly stressed that in the transition phase of yield development the PFPN indices
reached the highest values resulting in yield gain This phenomenon emerged in years 1990
1991 for Poland and Hungary and in 1991 1992 for the Czech and Slovak Republics In all
these years the supply of P and K fertilizers was low In the Czech Republic ratios between
amounts of applied N-P-K fertilizers expressed as NP2O5K2O was 1025025 on average
This structure in spite of decreased fertilizersrsquo consumption allowed farmers to achieve the
same yields of all crops as in the period 1986-1990 The present structure of nutrient use is as
1015015 for the Czech Republic and 10404 for Poland These disparate nutrient ratios
stress the importance of NPK balance for high crop production The proposed NPK ratio
for the Czech Republic based on the cPFPN index can be established at the level of
1025025 in good years ie under ample water supply or 1025050 in unfavorable years ie
under expected water stress Hence keeping the current level of fertilizers consumption on
arable land ca 130 kg ha-1 one can predict the right amount of nutrients to apply In Poland
the total amount of currently consumed fertilizers is almost the same as in the Czech
wwwintechopencom
Soil Fertility Improvement and Integrated Nutrient Management ndash A Global Perspective
178
Republic Unfortunately soils in Poland are much poorer in potassium and also in
phosphorus being therefore highly sensitive to external supply of nutrients This
conclusion is corroborated by positive trends of yields in response to P and K fertilizers
application as found for all crops since 1991 onwards Consequently under favorable
weather conditions or on soils naturally rich in potassium the suggested formulation of N-
P-K fertilizers is as follows 1033066 but in years with high probability of drought or on
areas sensitive to drought a slightly different formulation is recommended namely
100510
It is not easy to formulate any efficient fertilizing strategy for Romania Since mid- 90s maize and wheat have shown yield stagnation at a very low level The main factors responsible for this situation are i) low N fertilization rates ii) imbalanced use of P and K fertilizers Therefore yields of these two crops are in fact dependent only on the seasonal weather course fluctuating for ca 100 on a yearly scale basis The main reason is unbalanced consumption of basic fertilizers which leads to permanent soil mining especially potassium The NP2O5K2O relationships averaged for the period 2004-2008 as 1027009 is not sufficient to get any yield increase or even its stabilization Potassium accumulates in plant tissues in much higher amounts and is considered as useful nutrient in water management (Cakmak 2005) Thereby this nutrient seems to be crucial for crop production in Romania even taking into account that almost 50 of land area is covered by soil naturally rich in minerals containing K In spite of low N consumption but unbalanced nutrient management there is still a space for an extra N loss for both key crops ie wheat and maize (see Fig 7) Therefore it could be concluded that any yield increase depends on both significant N rate rise and simultaneous change of fertilizer formulations The operational N-P-K fertilizers ratios suggested for Romania are as follows 1033017 in favorable and 10404 in unfavorable years The second scenario should aim at increasing plant survival under drought conditions
6 Thoughts and prospects
The new era of agriculture development in the Central Europe revealed how actual
agriculture outcomes in this region depend on three key factors presented in descending
order i) weather conditions during the growth season ii) inherent soil fertility iii) nitrogen
fertilizer consumption At present the first factor is decisive for crop production High year-
to-year yield variability reflects the imbalanced use of soil and external resources such as
fertilizers Therefore maximum attainable yields ie limited by water supply for example
for wheat are not attainable in all countries of the region In Germany also part of the
Central European region actual yields are above the ldquowater limitedrdquo level (Rabbinge amp
Diepen 2000 Supit et al 2010)
Inherent differences in the nature of soil quality between the CE countries as a background
of nutrient management are strictly related to the soil origin (Plant et al 2005) Except for
Poland all other countries are relatively rich in soils originated from loams (Cambisols) and
loess (Chernozems) These soils exhibit a high inherent potential for supplying K and other
cations such as calcium and magnesium (Nikolova 1998)
However at present nutritional requirements of high yielding crops most of the CE countries are almost entirely oriented on the third yield forming factor ie nitrogen
wwwintechopencom
Constraints and Solutions to Maintain Soil Productivity A Case Study from Central Europe
179
fertilizer use It has been well recognized that a balanced supply of external sources of slowly mobile elements such as phosphorus and potassium is broadly expected (Atkinson et al 2005 Struik amp Bonciarelli 1997) Consequently the average actual and attainable yields of main crops in CE countries are much more related to the soil-adjusted potential than to amounts of currently applied fertilizers As a result CE countries show at present much greater differences in agricultural production than at the end of the 80s
The observed unfavorable patterns of N fertilizer long-term consumption creates problems not only for agriculture production but are also potentially dangerous for the environment as a potential source of reactive nitrogen (Roberts 2006) There are three main questions to be urgently answered by specialists in all countries of the CE region i) do farmers really recognize an increasing yield gap ii) what is the reason for farmers and their advisory services to tolerate low efficiency of nitrogen iii) do farmers and advisory services recognize environmental aspects of the increasing amount of residual nitrogen In order to get answers to these questions one has to be familiar with factors contributing to the improvement in N fertilizer use efficiency
1 Farm management of N in terms of i) N rate quantification ii) time of N fertilizers application and iii) method of N fertilizers application
2 Management of nutrients responsible for the efficiency of N uptake and it in-plant transformation
3 Management of production factors other than N
The first problem is not only of technical nature because it affects in-season nitrogen use
efficiency and in turn actual yieldsrsquo variability However CE countries representing the
restoration type of yield development but at the same time unbalanced pattern of
consumed fertilizers do not indicate needs for increasing actually applied N rates This
strategy is to some extent the core of yield improvement in countries presenting stagnated
type of fertilizersrsquo management provided that any increase in N use will be compensated by
adequate amounts of applied phosphorus and potassium
It could finally be concluded that the realization of both goals of agricultural production in
the CE countries ie i) long-term yield stabilization and even its increase and ii) unit
productivity of the applied fertilizer N increase in turn decreasing amounts of the residual
N requires in the coming future changes in the structure of fertilizersrsquo consumption
keeping in the Unbalanced group of countries the same level of applied fertilizers The
problem of nutrients supply to a growing plant does not however refer only to the balanced
amounts of the applied fertilizers but also to the crop accessibility to soil natural nutrient
pools This problem is inherently related to conditions of root system growth in the soil
body There are a lot of factors limiting roots accessibility to water and nutrients even in
soils of high natural fertility which have been forgotten in the last 50 years but the most
important is soil acidy and related toxicity of aluminum (Atkinson et al 2005 Diatta et al
2010 Marschner 1991 Struik and Bonciarelli 1997) The key strategic target for farmers is to
increase soil volume directly occupied by plant roots in order to improve their access to
unavailable pools of nutrients Three main areas of soil productivity improvement via
increasing crop plants accessibility to nutrients in the subsoil at least may be considered i)
regulation of soil reaction ii) increase of organic matter content iii) removing of any kind of
hardpans It seems highly probable that in the case of Poland all three groups of measures
wwwintechopencom
Soil Fertility Improvement and Integrated Nutrient Management ndash A Global Perspective
180
are important In other countries of the CE soil acidity should be considered as an
agronomical problem for farmers conducting production on Luvisols
7 References
Atkinson A Black K amp Dawson L (2005) Prospects advantages and limitations of future crop production systems dependent upon the management processes Annals of Applied Biology Vol 146 pp 203-215 ISSN 1744-7348
Batjes H (2002) Carbon and nitrogen stocks in the soils of Central and Eastern Europe Soil Use Management Vol 18 pp 324-329 ISSN 1475-2743
Cakmak I (2005) The role of potassium in alleviating detrimental effects of abiotic stresses in plants Journal of Plant Nutrition Soil Science Vol 168 pp 521-530 ISSN 1436-8730
Catt J (2001) The agricultural importance of loess Earth-Science Reviews Vol 54 pp 213-229 ISSN 0012-8252
Cochrane N (2004) EU Enlargement Implications for US_EU agricultural relations US-EU Food and Agriculture ComaprisonWRS-04-04 78-86 Available online at
httpwwwersusdagovpublicationsWRS0404WRS0404pdf (Access 20110524)
Csatho P Sisak I amp Radimszky L (2007) Agriculture as a source of phosphorus causing eutrophication in Central and Eastern Europe Soil Use management Vol 23 (suppl 1) pp 36-56 ISSN 1475-2743
Csatho P amp Radimszky L (2009) Two Worlds within EU27 Sharp Contrasts in Organic and Mineral Nitrogen-Phosphorus Use Nitrogen-Phosphorus Balances and Soil Phosphorus Status Widening and Deepening Gap between Western and Central Europe Communications in Soil Science and Plant Analysis Vol 40 pp 999-1019 ISSN 0010-3624
Diatta J Bocianowski J amp Skubiszewska A (2010) Sulphate-based aluminum phytotoxicity mitigation under strong soil acidification Fresenius Environmental Bulletin Vol 19 No 12b pp 3185-3192 ISSN 1018-4619
Dibb D (2000) The mysteries (myths) of nutrient use efficiency Better Crops Vol 84 No 3 pp 3ndash5 ISSN 0006-0089
Dobermann A amp Cassman K (2002) Plant nutrient management for enhanced productivity in intensive grain production systems of the United States and Asia Plant and Soil Vol 247 pp 153-175 ISSN 1573-5036
Evans L amp Fisher R (1999) Yield potential its definition measurement and significance Crop Science Vol 39 pp 1544-1551 ISSN 1896-0782
Falloon P amp Betts R (2010) Climate impacts on European agriculture and water management in the context of adaptation and mitigation ndash the importance of integrated approach Science of Total Environment Vol 408 pp 5667-5687 ISSN 0048-9697
FAOSTAT Available online at httpfaostatfaoorgdefaultaspx (Access 20110524) Fixen P (2004) Phases in narrowing the yield gap Better Crops Vol 88 No 4 p 3 ISSN
0006-0089 Fronzek S amp Carter T (2007) Assessing uncertainties in climate change impacts on
resource potential for Europe based on projections from RCMs and GCMs Climate Change Vol 81 pp 357-371 ISSN 1758-6798
wwwintechopencom
Constraints and Solutions to Maintain Soil Productivity A Case Study from Central Europe
181
Grzebisz W amp Fotyma M (2007) Recommendations and use of potassium fertilizers in Central-Eastern Europe (CEE) In Proceedings International Fertiliser Society No 621 York UK pp 24 ISBN 978-0-85310-258-8
Grzebisz W Diatta J amp Haerdter R (2010) Fertilizer consumption patterns in Central European countries ndash effect on actual yield development trends in 1986-2005 years - a comparative study of the Czech Republic and Poland Journal of Central European Agriculture Vol 11 No 1 pp 73-82 ISSN 1332-9049
IFADATA Statistics online (2011) wwwfertilizerorgifastatisticsifadata datalineasp (Access 20110524)
Jongman R Bunce R amp Metzger R (2006) Objectives and applications of a statistical environmental stratification of Europe Landscape Ecology 21 409-419 ISSN 1572-9761
Karlen D Ditzler C amp Andrews S (2003) Soil quality why and how Geoderma Vol 114 pp 145-156 ISSN 0016-7061
Kelch D amp Osborne S (2001) Crop production capacity in EuropePrime Economic Research ServiceUSDA Agricultural outlookMarch 2001 19-23 ISSN 0099-1066
Marschner H (1991) Mechanisms of adaptation of plants to acid soils Plant and Soil 134 1-20 ISSN 1573-5036
Neumann K Verburg P amp Stehfest E (2010) The yield gap of global production a spatial analysis Agricultural Systems Vol 103 pp 316-326 ISSN 0308-521X
Nikolova M (1998) The soil potassium resources and the efficiency of potassium fertilizers in Bulgaria Nikola Poushkarow Inst of Soil Science and Agroecology Sofia Bulgaria IPI Country Report 12 39 pp
Olesen J amp Bindi M (2002) Consequences of climate change for European agricultural productivity land use and policy European Journal of Agronomy Vol 16 pp 239-262 ISSN 1161-0301
Olesen J Trnka M amp Kersebaum K (2011) Impacts and adaptation of European crop production systems to climate change European Journal of Agronomy Vol 34 pp 96-112 ISSN 1161-0301
Plant J Whittaker A amp Demitriades B (2005) The geological and tectonic framework of Europe Geochemical Atlas of Europe Part 1 Background Information Methodology Ed Salminen R Maps GTK FOREGS 20 pp ISBN 951-690-956-6
Rabbinge R (1993) The ecological background of food production In Crop protection and sustainable agriculture Wiley Chichester (Ciba Foundation Symposium 177 2-29 ISBN 10 0471939447
Rabbinge R amp Diepen C (2000) Changes in agriculture and land use in Europe European Journal of Agronomy Vol 13 pp 85-100 ISSN 1161-0301
Reilly J Fuglie K (1998) Future yield growth in field crops what evidence exists Soil amp Tillage Research Vol 47 pp 275-290 ISSN 0168-1987
Roberts T (2006) Improving Nutrient Use Efficiency Proceedings of the IFA Agriculture Conference Optimizing Resource Use Efficiency for Sustainable Intensification of Agriculture 27 february-2 March 2006 Kunming China pp 8
Rosegrant M Paisner M amp Meijer S (2001) Global Food Projections to 2020 Emerging trends and alternative futures IFPRI pp 206 ISBN 0-89629-640-7
wwwintechopencom
Soil Fertility Improvement and Integrated Nutrient Management ndash A Global Perspective
182
Sinclair T Purcell L amp Sneller C (2004) Crop transformation and the challenge to increase yield potential Trends in Plant Science Vol 9 No 2 pp 70-75 ISSN 136085
Struik P amp Bonciarelli F (1997) Resource use at the cropping system level European Journal of Agronomy Vol 7 pp 133-143 ISSN 1161-0301
Supit I van Diepen C amp de Wit A (2010) Recent changes in the climatic yield potential of various crops in Europe Agricultural Systems Vol 103 pp 683-694 ISSN 0308-521X
wwwintechopencom
Soil Fertility Improvement and Integrated Nutrient Management - AGlobal PerspectiveEdited by Dr Joann Whalen
ISBN 978-953-307-945-5Hard cover 306 pagesPublisher InTechPublished online 24 February 2012Published in print edition February 2012
InTech EuropeUniversity Campus STeP Ri Slavka Krautzeka 83A 51000 Rijeka Croatia Phone +385 (51) 770 447 Fax +385 (51) 686 166wwwintechopencom
InTech ChinaUnit 405 Office Block Hotel Equatorial Shanghai No65 Yan An Road (West) Shanghai 200040 China
Phone +86-21-62489820 Fax +86-21-62489821
Soil Fertility Improvement and Integrated Nutrient Management A Global Perspective presents 15 invitedchapters written by leading soil fertility experts The book is organized around three themes The first theme isSoil Mapping and Soil Fertility Testing describing spatial heterogeneity in soil nutrients within natural andmanaged ecosystems as well as up-to-date soil testing methods and information on how soil fertility indicatorsrespond to agricultural practices The second theme Organic and Inorganic Amendments for Soil FertilityImprovement describes fertilizing materials that provide important amounts of essential nutrients forplantsThe third theme Integrated Nutrient Management Planning Case Studies From Central Europe SouthAmerica and Africa highlights the principles of integrated nutrient management Additionally it gives casestudies explaining how this approach has been implemented successfully across large geographic regionsand at local scales to improve the productivity of staple crops and forages
How to referenceIn order to correctly reference this scholarly work feel free to copy and paste the following
Witold Grzebisz and Jean Diatta (2012) Constraints and Solutions to Maintain Soil Productivity A Case Studyfrom Central Europe Soil Fertility Improvement and Integrated Nutrient Management - A Global PerspectiveDr Joann Whalen (Ed) ISBN 978-953-307-945-5 InTech Available fromhttpwwwintechopencombookssoil-fertility-improvement-and-integrated-nutrient-management-a-global-perspectiveconstraints-and-solutions-to-maintain-soil-productivity-a-case-study-from-central-europe
copy 2012 The Author(s) Licensee IntechOpen This is an open access articledistributed under the terms of the Creative Commons Attribution 30License which permits unrestricted use distribution and reproduction inany medium provided the original work is properly cited
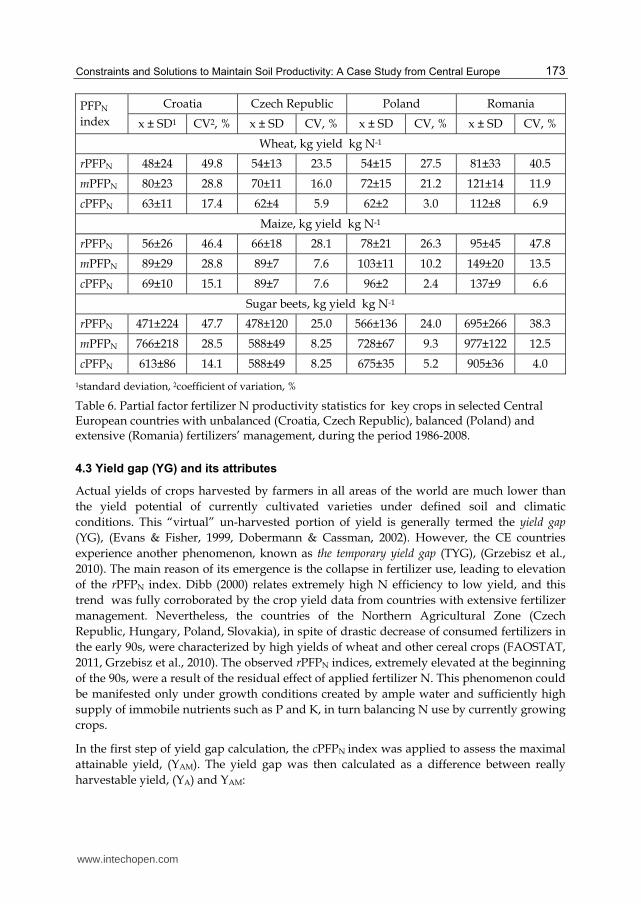
Constraints and Solutions to Maintain Soil Productivity A Case Study from Central Europe
173
PFPN
index
Croatia Czech Republic Poland Romania
x plusmn SD1 CV2 x plusmn SD CV x plusmn SD CV x plusmn SD CV
Wheat kg yield kg N-1
rPFPN 48plusmn24 498 54plusmn13 235 54plusmn15 275 81plusmn33 405
mPFPN 80plusmn23 288 70plusmn11 160 72plusmn15 212 121plusmn14 119
cPFPN 63plusmn11 174 62plusmn4 59 62plusmn2 30 112plusmn8 69
Maize kg yield kg N-1
rPFPN 56plusmn26 464 66plusmn18 281 78plusmn21 263 95plusmn45 478
mPFPN 89plusmn29 288 89plusmn7 76 103plusmn11 102 149plusmn20 135
cPFPN 69plusmn10 151 89plusmn7 76 96plusmn2 24 137plusmn9 66
Sugar beets kg yield kg N-1
rPFPN 471plusmn224 477 478plusmn120 250 566plusmn136 240 695plusmn266 383
mPFPN 766plusmn218 285 588plusmn49 825 728plusmn67 93 977plusmn122 125
cPFPN 613plusmn86 141 588plusmn49 825 675plusmn35 52 905plusmn36 40
1standard deviation 2coefficient of variation
Table 6 Partial factor fertilizer N productivity statistics for key crops in selected Central European countries with unbalanced (Croatia Czech Republic) balanced (Poland) and extensive (Romania) fertilizersrsquo management during the period 1986-2008
43 Yield gap (YG) and its attributes
Actual yields of crops harvested by farmers in all areas of the world are much lower than
the yield potential of currently cultivated varieties under defined soil and climatic
conditions This ldquovirtualrdquo un-harvested portion of yield is generally termed the yield gap
(YG) (Evans amp Fisher 1999 Dobermann amp Cassman 2002) However the CE countries
experience another phenomenon known as the temporary yield gap (TYG) (Grzebisz et al
2010) The main reason of its emergence is the collapse in fertilizer use leading to elevation
of the rPFPN index Dibb (2000) relates extremely high N efficiency to low yield and this
trend was fully corroborated by the crop yield data from countries with extensive fertilizer
management Nevertheless the countries of the Northern Agricultural Zone (Czech
Republic Hungary Poland Slovakia) in spite of drastic decrease of consumed fertilizers in
the early 90s were characterized by high yields of wheat and other cereal crops (FAOSTAT
2011 Grzebisz et al 2010) The observed rPFPN indices extremely elevated at the beginning
of the 90s were a result of the residual effect of applied fertilizer N This phenomenon could
be manifested only under growth conditions created by ample water and sufficiently high
supply of immobile nutrients such as P and K in turn balancing N use by currently growing
crops
In the first step of yield gap calculation the cPFPN index was applied to assess the maximal
attainable yield (YAM) The yield gap was then calculated as a difference between really
harvestable yield (YA) and YAM
wwwintechopencom
Soil Fertility Improvement and Integrated Nutrient Management ndash A Global Perspective
174
YAM = cPFPN middot DN
YG = YA ndash YAM
where
DN is the rate of annually applied fertilizer N (kg N ha-1) YA is the actual yield in t ha-1 for a
given year and YAM is the maximal attainable yield (t ha-1)
The observed similarities of the general yield gap pattern over time for key crops allow to
distinguish three consecutive phases of its development in the period 1986-2008 (Fig 6)
1 First ndash primary deep yield gap to the left of the transition point (TP) 2 Second ndash point of extra yield gain TP 3 Third- secondary yield gap to the right of the TP alternatively yield gap stagnation as
indicated by the lack of significant (P lt 005) linear trend response
-7
-6
-5
-4
-3
-2
-1
0
1
2
1985 1990 1995 2000 2005 2010
Consecutive years CY
Yie
ld g
ap
(Y
G)
t h
a-1
CZ
RO
TP
YGd-CZ = 079CY - 1573 R2 = 070 P lt 001
YGd-RO = 068CY - 1354 R2 = 072 P lt 0001
YGr-CZ = -012CY + 2354 R2 = 046 P lt 0001
Country
Legend TP - Transition Point YGd - yield gap decline YGr - yield gap restoration
Fig 6 Evolution of the yield gap in wheat in the Czech Republic (CZ) and Romania (RO) during the period 1986 -2008 Significant (Plt005) positive linear equations are shown for the Czech Republic in the period 1986-92 and for Romania in the period 1986-1995 thereafter showed a negative linear relationship for the Czech Republic and non-significant trend for Romania
Wheat is the best example of the yield gap course in the CE countries stressing on the
difference in fertilizer management The main dissimilarities among countries do not refer
to the first phase The YG was deep in spite of relatively high yield indicating thus a low
capacity of contemporary cultivated varieties to achieve further gains in yield Much more
important were YG length and number of years to reach the TP The time to reach the TP
was shorter (6(7) years) in countries such as the Czech and Slovak Republics Hungary and
Poland and also in Croatia and Slovenia corresponding to rapid rebuilding of fertilizer
wwwintechopencom
Constraints and Solutions to Maintain Soil Productivity A Case Study from Central Europe
175
markets in these countries In countries with extensive fertilizersrsquo management the length of
the first phase extended up to mid-90s
The YG evaluation shows that the current nutrient management in CE countries can
overcome this phenomenon especially in the case of wheat and maize A TYG can be most
easily negated in countries belonging to Unbalanced or Balanced nutrient management
groups such as the Czech and Slovak Republics Hungary and Poland and also Croatia and
Slovenia In countries with extensive fertilizersrsquo management the TYG has not been
overcome and enters the third phase of yield development stagnation due to low use of
fertilizers in turn resulting in the very low and unstable level of annually harvested yields
44 Yield prognosis ndash The unassimilated nitrogen concept
The medium or long-term food and environmental policy strategies for any country or
particular region are supported by yield prognosis considered as an operational tool
However the ex-ante prognosis depends on the reliability of the data used Two approaches
both relying on the unit productivity of fertilizer nitrogen (PFPN) have been considered The
first assumes extrapolation of real and improved yields based on the linear model (Reilly amp
Fuglie 1998) The second one is based on long term trends of the YG but transformed into
unit of temporarily lost fertilizer nitrogen termed for the purposes of this study as
unassimilated nitrogen This approach as related to nitrogen management has been used to
make a prognosis of yields of key crops in the CE countries
Operationally the concept presented in this chapter assumes that the total amount of
applied fertilizer nitrogen (FN) is simply divided into three main pools i) assimilated
(FaN) ndash nitrogen taken up by meanwhile grown crop ii) unassimilated nitrogen (FuaN) ndash
temporary out of use by plants andor iii) lost from the field (FLN) The quantitative
assessment of the FuaN pool relies on the defined YG procedure individually related to
each investigated crop
FN = FaN + F uaN + FLN
FuaN = YGcPFPN
where
FuaN ndash unassimilated nitrogen kg N ha-1 YG - yield gap cPFPN ndash the corrected partial factor productivity of applied N kg yield kg N-1
In the first step of yield prognosis the Unassimilated Nitrogen Indices (IuaN) should be computed Therefore the original set of YG data for each of the studied crops was transformed into a quantitative amount of nitrogen lost temporarily from the system marked as minus (-IuaN) In the second step of the analysis both sets of actual (YA) and maximum attainable yields (YM) of each crop were regressed against corresponding set of
uaN indices The obtained regression models clearly show that actual yields over the period of 20 years did not respond significantly to the IuaN as reported in Fig 7 for wheat in Romania The positive and simultaneously significant trends were however achieved when the maximum attainable yield (YM) instead of the actual yield (YA) was introduced into the regression model It can be therefore hypothesized that any virtual loss of nitrogen
wwwintechopencom
Soil Fertility Improvement and Integrated Nutrient Management ndash A Global Perspective
176
ie the negative uaN indices reflect the potential status for a yield increase and vice versa Unfortunately the positive indices of the uaN simply describe a state of N soil mining which in turn causes direct yield decline This is consistent with the opinion of Dibb (2000) and typical for many parts of the world including most CE countries
YM = -0114uaN + 2703 R2 = 093 P lt 0001
0
1
2
3
4
5
6
7
8
9
10
-60 -50 -40 -30 -20 -10 0 10
Gra
in y
ield
(Y
) t
ha-1
YA
YM
Yield
type
Unassimilated nitrogen (uaN) kg N ha-1
Fig 7 Yield prognosis of winter wheat based on residual nitrogen - a case of Romania (RO) Significant (Plt005) linear equation represents the trend for the attainable yields in the 1986-2008 period Legend YA ndash actual yield YM ndash maximum yield
Reliable yield prognosis can be performed assuming a certain level of expected yield or by focusing any improvement of production technology on higher N use efficiency The first approach can be best presented for wheat The maximum attainable yield for this crop in Poland and the Czech Republic is fixed at the level of 65 t ha-1 but for Romania at 45 t ha-1 (Rabbinge amp van Diepen 2000) The amount of uaN required to be incorporated into grain yield was calculated by the models and amounted to 48 27 and 33 kg ha-1 respectively It is equal to 58 27 and 100 of annual N rate applied in these countries and does not seem a realistic approach The same rules refer to other key crops in the study Therefore the second concept relying on the ability of currently cultivated crops to fix an extra amount of
uaN seems to be a more realistic approach for making any reliable yield prognosis (Table 7) This assumption is highly promising especially for countries presenting an extensive type of agriculture production for example Romania The expected wheat increase in response to the use of extra 20 kg N ha-1 is possible considering the water limited yield fixed at 45 t ha-1 The prognosis for the Czech Republic is still below the water limited yield being at 65 t ha-1 In Poland the calculated yields are at the same level as Romania but soils are less suitable for wheat production Therefore any grain yield increase seems to be a great challenge for farmers in all countries of the CE In the light of yields prognosis for sugar beets the fixed level of uaN at 20 kg N ha-1 is generally too low The level of 60 t ha-1 of beets seems to be the most reliable short-term target Thereby the amount of uaN successfully managed should be established at the level of 30 kg ha-1
wwwintechopencom
Constraints and Solutions to Maintain Soil Productivity A Case Study from Central Europe
177
CropCountry Linear regression model Yield at 20 kg uaN t ha-1
Wheat
Croatia YM = -0064 uaN + 3989 for R2 = 096 527
Czech Rep YM = -0063 uaN + 4777 for R2 = 088 604
Poland YM = -0060 uaN + 3623 for R2 = 092 482
Romania YM = -0114 uaN + 2703 for R2 = 093 498
Maize
Croatia YM = -0069 uaN + 4852 for R2 = 086 623
Czech Rep YM = -0064 uaN + 6470 for R2 = 069 776
Poland YM = -0085 uaN + 5431 for R2 = 083 713
Romania YM = -0121 uaN + 3348 for R2 = 094 578
Sugar beets
Croatia YM = -0605 uaN + 40677 for R2 = 089 5278
Czech Rep YM = -0458 uaN + 45872 for R2 = 076 5503
Poland YM = -0609 uaN + 39801 for R2 = 081 5198
Romania YM = -0822 uaN + 24046 for R2 = 093 4049
Table 7 Yield prognosis based on the unassimilated quantity of nitrogen (uaN)
5 Soil productivity improvements The concept of NPK fertilizers balance
The simple comparison of CE countries with respect to nutrient management clearly shows
that annual inputs of nitrogen are too high with respect to phosphorus and potassium
Therefore the main reasons of general yield stagnation in most of the CE countries are long-
term negative balances of P and K caused by low input of both mineral and organic
fertilizers As a consequence of soil P and K long-term mining the percentage share of soils
rich in both nutrients declined in the last two decades below the sufficiency level which was
achieved in many countries in 80s (Csatho at al 2007 Grzebisz amp Fotyma 2007)
It has been clearly stressed that in the transition phase of yield development the PFPN indices
reached the highest values resulting in yield gain This phenomenon emerged in years 1990
1991 for Poland and Hungary and in 1991 1992 for the Czech and Slovak Republics In all
these years the supply of P and K fertilizers was low In the Czech Republic ratios between
amounts of applied N-P-K fertilizers expressed as NP2O5K2O was 1025025 on average
This structure in spite of decreased fertilizersrsquo consumption allowed farmers to achieve the
same yields of all crops as in the period 1986-1990 The present structure of nutrient use is as
1015015 for the Czech Republic and 10404 for Poland These disparate nutrient ratios
stress the importance of NPK balance for high crop production The proposed NPK ratio
for the Czech Republic based on the cPFPN index can be established at the level of
1025025 in good years ie under ample water supply or 1025050 in unfavorable years ie
under expected water stress Hence keeping the current level of fertilizers consumption on
arable land ca 130 kg ha-1 one can predict the right amount of nutrients to apply In Poland
the total amount of currently consumed fertilizers is almost the same as in the Czech
wwwintechopencom
Soil Fertility Improvement and Integrated Nutrient Management ndash A Global Perspective
178
Republic Unfortunately soils in Poland are much poorer in potassium and also in
phosphorus being therefore highly sensitive to external supply of nutrients This
conclusion is corroborated by positive trends of yields in response to P and K fertilizers
application as found for all crops since 1991 onwards Consequently under favorable
weather conditions or on soils naturally rich in potassium the suggested formulation of N-
P-K fertilizers is as follows 1033066 but in years with high probability of drought or on
areas sensitive to drought a slightly different formulation is recommended namely
100510
It is not easy to formulate any efficient fertilizing strategy for Romania Since mid- 90s maize and wheat have shown yield stagnation at a very low level The main factors responsible for this situation are i) low N fertilization rates ii) imbalanced use of P and K fertilizers Therefore yields of these two crops are in fact dependent only on the seasonal weather course fluctuating for ca 100 on a yearly scale basis The main reason is unbalanced consumption of basic fertilizers which leads to permanent soil mining especially potassium The NP2O5K2O relationships averaged for the period 2004-2008 as 1027009 is not sufficient to get any yield increase or even its stabilization Potassium accumulates in plant tissues in much higher amounts and is considered as useful nutrient in water management (Cakmak 2005) Thereby this nutrient seems to be crucial for crop production in Romania even taking into account that almost 50 of land area is covered by soil naturally rich in minerals containing K In spite of low N consumption but unbalanced nutrient management there is still a space for an extra N loss for both key crops ie wheat and maize (see Fig 7) Therefore it could be concluded that any yield increase depends on both significant N rate rise and simultaneous change of fertilizer formulations The operational N-P-K fertilizers ratios suggested for Romania are as follows 1033017 in favorable and 10404 in unfavorable years The second scenario should aim at increasing plant survival under drought conditions
6 Thoughts and prospects
The new era of agriculture development in the Central Europe revealed how actual
agriculture outcomes in this region depend on three key factors presented in descending
order i) weather conditions during the growth season ii) inherent soil fertility iii) nitrogen
fertilizer consumption At present the first factor is decisive for crop production High year-
to-year yield variability reflects the imbalanced use of soil and external resources such as
fertilizers Therefore maximum attainable yields ie limited by water supply for example
for wheat are not attainable in all countries of the region In Germany also part of the
Central European region actual yields are above the ldquowater limitedrdquo level (Rabbinge amp
Diepen 2000 Supit et al 2010)
Inherent differences in the nature of soil quality between the CE countries as a background
of nutrient management are strictly related to the soil origin (Plant et al 2005) Except for
Poland all other countries are relatively rich in soils originated from loams (Cambisols) and
loess (Chernozems) These soils exhibit a high inherent potential for supplying K and other
cations such as calcium and magnesium (Nikolova 1998)
However at present nutritional requirements of high yielding crops most of the CE countries are almost entirely oriented on the third yield forming factor ie nitrogen
wwwintechopencom
Constraints and Solutions to Maintain Soil Productivity A Case Study from Central Europe
179
fertilizer use It has been well recognized that a balanced supply of external sources of slowly mobile elements such as phosphorus and potassium is broadly expected (Atkinson et al 2005 Struik amp Bonciarelli 1997) Consequently the average actual and attainable yields of main crops in CE countries are much more related to the soil-adjusted potential than to amounts of currently applied fertilizers As a result CE countries show at present much greater differences in agricultural production than at the end of the 80s
The observed unfavorable patterns of N fertilizer long-term consumption creates problems not only for agriculture production but are also potentially dangerous for the environment as a potential source of reactive nitrogen (Roberts 2006) There are three main questions to be urgently answered by specialists in all countries of the CE region i) do farmers really recognize an increasing yield gap ii) what is the reason for farmers and their advisory services to tolerate low efficiency of nitrogen iii) do farmers and advisory services recognize environmental aspects of the increasing amount of residual nitrogen In order to get answers to these questions one has to be familiar with factors contributing to the improvement in N fertilizer use efficiency
1 Farm management of N in terms of i) N rate quantification ii) time of N fertilizers application and iii) method of N fertilizers application
2 Management of nutrients responsible for the efficiency of N uptake and it in-plant transformation
3 Management of production factors other than N
The first problem is not only of technical nature because it affects in-season nitrogen use
efficiency and in turn actual yieldsrsquo variability However CE countries representing the
restoration type of yield development but at the same time unbalanced pattern of
consumed fertilizers do not indicate needs for increasing actually applied N rates This
strategy is to some extent the core of yield improvement in countries presenting stagnated
type of fertilizersrsquo management provided that any increase in N use will be compensated by
adequate amounts of applied phosphorus and potassium
It could finally be concluded that the realization of both goals of agricultural production in
the CE countries ie i) long-term yield stabilization and even its increase and ii) unit
productivity of the applied fertilizer N increase in turn decreasing amounts of the residual
N requires in the coming future changes in the structure of fertilizersrsquo consumption
keeping in the Unbalanced group of countries the same level of applied fertilizers The
problem of nutrients supply to a growing plant does not however refer only to the balanced
amounts of the applied fertilizers but also to the crop accessibility to soil natural nutrient
pools This problem is inherently related to conditions of root system growth in the soil
body There are a lot of factors limiting roots accessibility to water and nutrients even in
soils of high natural fertility which have been forgotten in the last 50 years but the most
important is soil acidy and related toxicity of aluminum (Atkinson et al 2005 Diatta et al
2010 Marschner 1991 Struik and Bonciarelli 1997) The key strategic target for farmers is to
increase soil volume directly occupied by plant roots in order to improve their access to
unavailable pools of nutrients Three main areas of soil productivity improvement via
increasing crop plants accessibility to nutrients in the subsoil at least may be considered i)
regulation of soil reaction ii) increase of organic matter content iii) removing of any kind of
hardpans It seems highly probable that in the case of Poland all three groups of measures
wwwintechopencom
Soil Fertility Improvement and Integrated Nutrient Management ndash A Global Perspective
180
are important In other countries of the CE soil acidity should be considered as an
agronomical problem for farmers conducting production on Luvisols
7 References
Atkinson A Black K amp Dawson L (2005) Prospects advantages and limitations of future crop production systems dependent upon the management processes Annals of Applied Biology Vol 146 pp 203-215 ISSN 1744-7348
Batjes H (2002) Carbon and nitrogen stocks in the soils of Central and Eastern Europe Soil Use Management Vol 18 pp 324-329 ISSN 1475-2743
Cakmak I (2005) The role of potassium in alleviating detrimental effects of abiotic stresses in plants Journal of Plant Nutrition Soil Science Vol 168 pp 521-530 ISSN 1436-8730
Catt J (2001) The agricultural importance of loess Earth-Science Reviews Vol 54 pp 213-229 ISSN 0012-8252
Cochrane N (2004) EU Enlargement Implications for US_EU agricultural relations US-EU Food and Agriculture ComaprisonWRS-04-04 78-86 Available online at
httpwwwersusdagovpublicationsWRS0404WRS0404pdf (Access 20110524)
Csatho P Sisak I amp Radimszky L (2007) Agriculture as a source of phosphorus causing eutrophication in Central and Eastern Europe Soil Use management Vol 23 (suppl 1) pp 36-56 ISSN 1475-2743
Csatho P amp Radimszky L (2009) Two Worlds within EU27 Sharp Contrasts in Organic and Mineral Nitrogen-Phosphorus Use Nitrogen-Phosphorus Balances and Soil Phosphorus Status Widening and Deepening Gap between Western and Central Europe Communications in Soil Science and Plant Analysis Vol 40 pp 999-1019 ISSN 0010-3624
Diatta J Bocianowski J amp Skubiszewska A (2010) Sulphate-based aluminum phytotoxicity mitigation under strong soil acidification Fresenius Environmental Bulletin Vol 19 No 12b pp 3185-3192 ISSN 1018-4619
Dibb D (2000) The mysteries (myths) of nutrient use efficiency Better Crops Vol 84 No 3 pp 3ndash5 ISSN 0006-0089
Dobermann A amp Cassman K (2002) Plant nutrient management for enhanced productivity in intensive grain production systems of the United States and Asia Plant and Soil Vol 247 pp 153-175 ISSN 1573-5036
Evans L amp Fisher R (1999) Yield potential its definition measurement and significance Crop Science Vol 39 pp 1544-1551 ISSN 1896-0782
Falloon P amp Betts R (2010) Climate impacts on European agriculture and water management in the context of adaptation and mitigation ndash the importance of integrated approach Science of Total Environment Vol 408 pp 5667-5687 ISSN 0048-9697
FAOSTAT Available online at httpfaostatfaoorgdefaultaspx (Access 20110524) Fixen P (2004) Phases in narrowing the yield gap Better Crops Vol 88 No 4 p 3 ISSN
0006-0089 Fronzek S amp Carter T (2007) Assessing uncertainties in climate change impacts on
resource potential for Europe based on projections from RCMs and GCMs Climate Change Vol 81 pp 357-371 ISSN 1758-6798
wwwintechopencom
Constraints and Solutions to Maintain Soil Productivity A Case Study from Central Europe
181
Grzebisz W amp Fotyma M (2007) Recommendations and use of potassium fertilizers in Central-Eastern Europe (CEE) In Proceedings International Fertiliser Society No 621 York UK pp 24 ISBN 978-0-85310-258-8
Grzebisz W Diatta J amp Haerdter R (2010) Fertilizer consumption patterns in Central European countries ndash effect on actual yield development trends in 1986-2005 years - a comparative study of the Czech Republic and Poland Journal of Central European Agriculture Vol 11 No 1 pp 73-82 ISSN 1332-9049
IFADATA Statistics online (2011) wwwfertilizerorgifastatisticsifadata datalineasp (Access 20110524)
Jongman R Bunce R amp Metzger R (2006) Objectives and applications of a statistical environmental stratification of Europe Landscape Ecology 21 409-419 ISSN 1572-9761
Karlen D Ditzler C amp Andrews S (2003) Soil quality why and how Geoderma Vol 114 pp 145-156 ISSN 0016-7061
Kelch D amp Osborne S (2001) Crop production capacity in EuropePrime Economic Research ServiceUSDA Agricultural outlookMarch 2001 19-23 ISSN 0099-1066
Marschner H (1991) Mechanisms of adaptation of plants to acid soils Plant and Soil 134 1-20 ISSN 1573-5036
Neumann K Verburg P amp Stehfest E (2010) The yield gap of global production a spatial analysis Agricultural Systems Vol 103 pp 316-326 ISSN 0308-521X
Nikolova M (1998) The soil potassium resources and the efficiency of potassium fertilizers in Bulgaria Nikola Poushkarow Inst of Soil Science and Agroecology Sofia Bulgaria IPI Country Report 12 39 pp
Olesen J amp Bindi M (2002) Consequences of climate change for European agricultural productivity land use and policy European Journal of Agronomy Vol 16 pp 239-262 ISSN 1161-0301
Olesen J Trnka M amp Kersebaum K (2011) Impacts and adaptation of European crop production systems to climate change European Journal of Agronomy Vol 34 pp 96-112 ISSN 1161-0301
Plant J Whittaker A amp Demitriades B (2005) The geological and tectonic framework of Europe Geochemical Atlas of Europe Part 1 Background Information Methodology Ed Salminen R Maps GTK FOREGS 20 pp ISBN 951-690-956-6
Rabbinge R (1993) The ecological background of food production In Crop protection and sustainable agriculture Wiley Chichester (Ciba Foundation Symposium 177 2-29 ISBN 10 0471939447
Rabbinge R amp Diepen C (2000) Changes in agriculture and land use in Europe European Journal of Agronomy Vol 13 pp 85-100 ISSN 1161-0301
Reilly J Fuglie K (1998) Future yield growth in field crops what evidence exists Soil amp Tillage Research Vol 47 pp 275-290 ISSN 0168-1987
Roberts T (2006) Improving Nutrient Use Efficiency Proceedings of the IFA Agriculture Conference Optimizing Resource Use Efficiency for Sustainable Intensification of Agriculture 27 february-2 March 2006 Kunming China pp 8
Rosegrant M Paisner M amp Meijer S (2001) Global Food Projections to 2020 Emerging trends and alternative futures IFPRI pp 206 ISBN 0-89629-640-7
wwwintechopencom
Soil Fertility Improvement and Integrated Nutrient Management ndash A Global Perspective
182
Sinclair T Purcell L amp Sneller C (2004) Crop transformation and the challenge to increase yield potential Trends in Plant Science Vol 9 No 2 pp 70-75 ISSN 136085
Struik P amp Bonciarelli F (1997) Resource use at the cropping system level European Journal of Agronomy Vol 7 pp 133-143 ISSN 1161-0301
Supit I van Diepen C amp de Wit A (2010) Recent changes in the climatic yield potential of various crops in Europe Agricultural Systems Vol 103 pp 683-694 ISSN 0308-521X
wwwintechopencom
Soil Fertility Improvement and Integrated Nutrient Management - AGlobal PerspectiveEdited by Dr Joann Whalen
ISBN 978-953-307-945-5Hard cover 306 pagesPublisher InTechPublished online 24 February 2012Published in print edition February 2012
InTech EuropeUniversity Campus STeP Ri Slavka Krautzeka 83A 51000 Rijeka Croatia Phone +385 (51) 770 447 Fax +385 (51) 686 166wwwintechopencom
InTech ChinaUnit 405 Office Block Hotel Equatorial Shanghai No65 Yan An Road (West) Shanghai 200040 China
Phone +86-21-62489820 Fax +86-21-62489821
Soil Fertility Improvement and Integrated Nutrient Management A Global Perspective presents 15 invitedchapters written by leading soil fertility experts The book is organized around three themes The first theme isSoil Mapping and Soil Fertility Testing describing spatial heterogeneity in soil nutrients within natural andmanaged ecosystems as well as up-to-date soil testing methods and information on how soil fertility indicatorsrespond to agricultural practices The second theme Organic and Inorganic Amendments for Soil FertilityImprovement describes fertilizing materials that provide important amounts of essential nutrients forplantsThe third theme Integrated Nutrient Management Planning Case Studies From Central Europe SouthAmerica and Africa highlights the principles of integrated nutrient management Additionally it gives casestudies explaining how this approach has been implemented successfully across large geographic regionsand at local scales to improve the productivity of staple crops and forages
How to referenceIn order to correctly reference this scholarly work feel free to copy and paste the following
Witold Grzebisz and Jean Diatta (2012) Constraints and Solutions to Maintain Soil Productivity A Case Studyfrom Central Europe Soil Fertility Improvement and Integrated Nutrient Management - A Global PerspectiveDr Joann Whalen (Ed) ISBN 978-953-307-945-5 InTech Available fromhttpwwwintechopencombookssoil-fertility-improvement-and-integrated-nutrient-management-a-global-perspectiveconstraints-and-solutions-to-maintain-soil-productivity-a-case-study-from-central-europe
copy 2012 The Author(s) Licensee IntechOpen This is an open access articledistributed under the terms of the Creative Commons Attribution 30License which permits unrestricted use distribution and reproduction inany medium provided the original work is properly cited

Soil Fertility Improvement and Integrated Nutrient Management ndash A Global Perspective
174
YAM = cPFPN middot DN
YG = YA ndash YAM
where
DN is the rate of annually applied fertilizer N (kg N ha-1) YA is the actual yield in t ha-1 for a
given year and YAM is the maximal attainable yield (t ha-1)
The observed similarities of the general yield gap pattern over time for key crops allow to
distinguish three consecutive phases of its development in the period 1986-2008 (Fig 6)
1 First ndash primary deep yield gap to the left of the transition point (TP) 2 Second ndash point of extra yield gain TP 3 Third- secondary yield gap to the right of the TP alternatively yield gap stagnation as
indicated by the lack of significant (P lt 005) linear trend response
-7
-6
-5
-4
-3
-2
-1
0
1
2
1985 1990 1995 2000 2005 2010
Consecutive years CY
Yie
ld g
ap
(Y
G)
t h
a-1
CZ
RO
TP
YGd-CZ = 079CY - 1573 R2 = 070 P lt 001
YGd-RO = 068CY - 1354 R2 = 072 P lt 0001
YGr-CZ = -012CY + 2354 R2 = 046 P lt 0001
Country
Legend TP - Transition Point YGd - yield gap decline YGr - yield gap restoration
Fig 6 Evolution of the yield gap in wheat in the Czech Republic (CZ) and Romania (RO) during the period 1986 -2008 Significant (Plt005) positive linear equations are shown for the Czech Republic in the period 1986-92 and for Romania in the period 1986-1995 thereafter showed a negative linear relationship for the Czech Republic and non-significant trend for Romania
Wheat is the best example of the yield gap course in the CE countries stressing on the
difference in fertilizer management The main dissimilarities among countries do not refer
to the first phase The YG was deep in spite of relatively high yield indicating thus a low
capacity of contemporary cultivated varieties to achieve further gains in yield Much more
important were YG length and number of years to reach the TP The time to reach the TP
was shorter (6(7) years) in countries such as the Czech and Slovak Republics Hungary and
Poland and also in Croatia and Slovenia corresponding to rapid rebuilding of fertilizer
wwwintechopencom
Constraints and Solutions to Maintain Soil Productivity A Case Study from Central Europe
175
markets in these countries In countries with extensive fertilizersrsquo management the length of
the first phase extended up to mid-90s
The YG evaluation shows that the current nutrient management in CE countries can
overcome this phenomenon especially in the case of wheat and maize A TYG can be most
easily negated in countries belonging to Unbalanced or Balanced nutrient management
groups such as the Czech and Slovak Republics Hungary and Poland and also Croatia and
Slovenia In countries with extensive fertilizersrsquo management the TYG has not been
overcome and enters the third phase of yield development stagnation due to low use of
fertilizers in turn resulting in the very low and unstable level of annually harvested yields
44 Yield prognosis ndash The unassimilated nitrogen concept
The medium or long-term food and environmental policy strategies for any country or
particular region are supported by yield prognosis considered as an operational tool
However the ex-ante prognosis depends on the reliability of the data used Two approaches
both relying on the unit productivity of fertilizer nitrogen (PFPN) have been considered The
first assumes extrapolation of real and improved yields based on the linear model (Reilly amp
Fuglie 1998) The second one is based on long term trends of the YG but transformed into
unit of temporarily lost fertilizer nitrogen termed for the purposes of this study as
unassimilated nitrogen This approach as related to nitrogen management has been used to
make a prognosis of yields of key crops in the CE countries
Operationally the concept presented in this chapter assumes that the total amount of
applied fertilizer nitrogen (FN) is simply divided into three main pools i) assimilated
(FaN) ndash nitrogen taken up by meanwhile grown crop ii) unassimilated nitrogen (FuaN) ndash
temporary out of use by plants andor iii) lost from the field (FLN) The quantitative
assessment of the FuaN pool relies on the defined YG procedure individually related to
each investigated crop
FN = FaN + F uaN + FLN
FuaN = YGcPFPN
where
FuaN ndash unassimilated nitrogen kg N ha-1 YG - yield gap cPFPN ndash the corrected partial factor productivity of applied N kg yield kg N-1
In the first step of yield prognosis the Unassimilated Nitrogen Indices (IuaN) should be computed Therefore the original set of YG data for each of the studied crops was transformed into a quantitative amount of nitrogen lost temporarily from the system marked as minus (-IuaN) In the second step of the analysis both sets of actual (YA) and maximum attainable yields (YM) of each crop were regressed against corresponding set of
uaN indices The obtained regression models clearly show that actual yields over the period of 20 years did not respond significantly to the IuaN as reported in Fig 7 for wheat in Romania The positive and simultaneously significant trends were however achieved when the maximum attainable yield (YM) instead of the actual yield (YA) was introduced into the regression model It can be therefore hypothesized that any virtual loss of nitrogen
wwwintechopencom
Soil Fertility Improvement and Integrated Nutrient Management ndash A Global Perspective
176
ie the negative uaN indices reflect the potential status for a yield increase and vice versa Unfortunately the positive indices of the uaN simply describe a state of N soil mining which in turn causes direct yield decline This is consistent with the opinion of Dibb (2000) and typical for many parts of the world including most CE countries
YM = -0114uaN + 2703 R2 = 093 P lt 0001
0
1
2
3
4
5
6
7
8
9
10
-60 -50 -40 -30 -20 -10 0 10
Gra
in y
ield
(Y
) t
ha-1
YA
YM
Yield
type
Unassimilated nitrogen (uaN) kg N ha-1
Fig 7 Yield prognosis of winter wheat based on residual nitrogen - a case of Romania (RO) Significant (Plt005) linear equation represents the trend for the attainable yields in the 1986-2008 period Legend YA ndash actual yield YM ndash maximum yield
Reliable yield prognosis can be performed assuming a certain level of expected yield or by focusing any improvement of production technology on higher N use efficiency The first approach can be best presented for wheat The maximum attainable yield for this crop in Poland and the Czech Republic is fixed at the level of 65 t ha-1 but for Romania at 45 t ha-1 (Rabbinge amp van Diepen 2000) The amount of uaN required to be incorporated into grain yield was calculated by the models and amounted to 48 27 and 33 kg ha-1 respectively It is equal to 58 27 and 100 of annual N rate applied in these countries and does not seem a realistic approach The same rules refer to other key crops in the study Therefore the second concept relying on the ability of currently cultivated crops to fix an extra amount of
uaN seems to be a more realistic approach for making any reliable yield prognosis (Table 7) This assumption is highly promising especially for countries presenting an extensive type of agriculture production for example Romania The expected wheat increase in response to the use of extra 20 kg N ha-1 is possible considering the water limited yield fixed at 45 t ha-1 The prognosis for the Czech Republic is still below the water limited yield being at 65 t ha-1 In Poland the calculated yields are at the same level as Romania but soils are less suitable for wheat production Therefore any grain yield increase seems to be a great challenge for farmers in all countries of the CE In the light of yields prognosis for sugar beets the fixed level of uaN at 20 kg N ha-1 is generally too low The level of 60 t ha-1 of beets seems to be the most reliable short-term target Thereby the amount of uaN successfully managed should be established at the level of 30 kg ha-1
wwwintechopencom
Constraints and Solutions to Maintain Soil Productivity A Case Study from Central Europe
177
CropCountry Linear regression model Yield at 20 kg uaN t ha-1
Wheat
Croatia YM = -0064 uaN + 3989 for R2 = 096 527
Czech Rep YM = -0063 uaN + 4777 for R2 = 088 604
Poland YM = -0060 uaN + 3623 for R2 = 092 482
Romania YM = -0114 uaN + 2703 for R2 = 093 498
Maize
Croatia YM = -0069 uaN + 4852 for R2 = 086 623
Czech Rep YM = -0064 uaN + 6470 for R2 = 069 776
Poland YM = -0085 uaN + 5431 for R2 = 083 713
Romania YM = -0121 uaN + 3348 for R2 = 094 578
Sugar beets
Croatia YM = -0605 uaN + 40677 for R2 = 089 5278
Czech Rep YM = -0458 uaN + 45872 for R2 = 076 5503
Poland YM = -0609 uaN + 39801 for R2 = 081 5198
Romania YM = -0822 uaN + 24046 for R2 = 093 4049
Table 7 Yield prognosis based on the unassimilated quantity of nitrogen (uaN)
5 Soil productivity improvements The concept of NPK fertilizers balance
The simple comparison of CE countries with respect to nutrient management clearly shows
that annual inputs of nitrogen are too high with respect to phosphorus and potassium
Therefore the main reasons of general yield stagnation in most of the CE countries are long-
term negative balances of P and K caused by low input of both mineral and organic
fertilizers As a consequence of soil P and K long-term mining the percentage share of soils
rich in both nutrients declined in the last two decades below the sufficiency level which was
achieved in many countries in 80s (Csatho at al 2007 Grzebisz amp Fotyma 2007)
It has been clearly stressed that in the transition phase of yield development the PFPN indices
reached the highest values resulting in yield gain This phenomenon emerged in years 1990
1991 for Poland and Hungary and in 1991 1992 for the Czech and Slovak Republics In all
these years the supply of P and K fertilizers was low In the Czech Republic ratios between
amounts of applied N-P-K fertilizers expressed as NP2O5K2O was 1025025 on average
This structure in spite of decreased fertilizersrsquo consumption allowed farmers to achieve the
same yields of all crops as in the period 1986-1990 The present structure of nutrient use is as
1015015 for the Czech Republic and 10404 for Poland These disparate nutrient ratios
stress the importance of NPK balance for high crop production The proposed NPK ratio
for the Czech Republic based on the cPFPN index can be established at the level of
1025025 in good years ie under ample water supply or 1025050 in unfavorable years ie
under expected water stress Hence keeping the current level of fertilizers consumption on
arable land ca 130 kg ha-1 one can predict the right amount of nutrients to apply In Poland
the total amount of currently consumed fertilizers is almost the same as in the Czech
wwwintechopencom
Soil Fertility Improvement and Integrated Nutrient Management ndash A Global Perspective
178
Republic Unfortunately soils in Poland are much poorer in potassium and also in
phosphorus being therefore highly sensitive to external supply of nutrients This
conclusion is corroborated by positive trends of yields in response to P and K fertilizers
application as found for all crops since 1991 onwards Consequently under favorable
weather conditions or on soils naturally rich in potassium the suggested formulation of N-
P-K fertilizers is as follows 1033066 but in years with high probability of drought or on
areas sensitive to drought a slightly different formulation is recommended namely
100510
It is not easy to formulate any efficient fertilizing strategy for Romania Since mid- 90s maize and wheat have shown yield stagnation at a very low level The main factors responsible for this situation are i) low N fertilization rates ii) imbalanced use of P and K fertilizers Therefore yields of these two crops are in fact dependent only on the seasonal weather course fluctuating for ca 100 on a yearly scale basis The main reason is unbalanced consumption of basic fertilizers which leads to permanent soil mining especially potassium The NP2O5K2O relationships averaged for the period 2004-2008 as 1027009 is not sufficient to get any yield increase or even its stabilization Potassium accumulates in plant tissues in much higher amounts and is considered as useful nutrient in water management (Cakmak 2005) Thereby this nutrient seems to be crucial for crop production in Romania even taking into account that almost 50 of land area is covered by soil naturally rich in minerals containing K In spite of low N consumption but unbalanced nutrient management there is still a space for an extra N loss for both key crops ie wheat and maize (see Fig 7) Therefore it could be concluded that any yield increase depends on both significant N rate rise and simultaneous change of fertilizer formulations The operational N-P-K fertilizers ratios suggested for Romania are as follows 1033017 in favorable and 10404 in unfavorable years The second scenario should aim at increasing plant survival under drought conditions
6 Thoughts and prospects
The new era of agriculture development in the Central Europe revealed how actual
agriculture outcomes in this region depend on three key factors presented in descending
order i) weather conditions during the growth season ii) inherent soil fertility iii) nitrogen
fertilizer consumption At present the first factor is decisive for crop production High year-
to-year yield variability reflects the imbalanced use of soil and external resources such as
fertilizers Therefore maximum attainable yields ie limited by water supply for example
for wheat are not attainable in all countries of the region In Germany also part of the
Central European region actual yields are above the ldquowater limitedrdquo level (Rabbinge amp
Diepen 2000 Supit et al 2010)
Inherent differences in the nature of soil quality between the CE countries as a background
of nutrient management are strictly related to the soil origin (Plant et al 2005) Except for
Poland all other countries are relatively rich in soils originated from loams (Cambisols) and
loess (Chernozems) These soils exhibit a high inherent potential for supplying K and other
cations such as calcium and magnesium (Nikolova 1998)
However at present nutritional requirements of high yielding crops most of the CE countries are almost entirely oriented on the third yield forming factor ie nitrogen
wwwintechopencom
Constraints and Solutions to Maintain Soil Productivity A Case Study from Central Europe
179
fertilizer use It has been well recognized that a balanced supply of external sources of slowly mobile elements such as phosphorus and potassium is broadly expected (Atkinson et al 2005 Struik amp Bonciarelli 1997) Consequently the average actual and attainable yields of main crops in CE countries are much more related to the soil-adjusted potential than to amounts of currently applied fertilizers As a result CE countries show at present much greater differences in agricultural production than at the end of the 80s
The observed unfavorable patterns of N fertilizer long-term consumption creates problems not only for agriculture production but are also potentially dangerous for the environment as a potential source of reactive nitrogen (Roberts 2006) There are three main questions to be urgently answered by specialists in all countries of the CE region i) do farmers really recognize an increasing yield gap ii) what is the reason for farmers and their advisory services to tolerate low efficiency of nitrogen iii) do farmers and advisory services recognize environmental aspects of the increasing amount of residual nitrogen In order to get answers to these questions one has to be familiar with factors contributing to the improvement in N fertilizer use efficiency
1 Farm management of N in terms of i) N rate quantification ii) time of N fertilizers application and iii) method of N fertilizers application
2 Management of nutrients responsible for the efficiency of N uptake and it in-plant transformation
3 Management of production factors other than N
The first problem is not only of technical nature because it affects in-season nitrogen use
efficiency and in turn actual yieldsrsquo variability However CE countries representing the
restoration type of yield development but at the same time unbalanced pattern of
consumed fertilizers do not indicate needs for increasing actually applied N rates This
strategy is to some extent the core of yield improvement in countries presenting stagnated
type of fertilizersrsquo management provided that any increase in N use will be compensated by
adequate amounts of applied phosphorus and potassium
It could finally be concluded that the realization of both goals of agricultural production in
the CE countries ie i) long-term yield stabilization and even its increase and ii) unit
productivity of the applied fertilizer N increase in turn decreasing amounts of the residual
N requires in the coming future changes in the structure of fertilizersrsquo consumption
keeping in the Unbalanced group of countries the same level of applied fertilizers The
problem of nutrients supply to a growing plant does not however refer only to the balanced
amounts of the applied fertilizers but also to the crop accessibility to soil natural nutrient
pools This problem is inherently related to conditions of root system growth in the soil
body There are a lot of factors limiting roots accessibility to water and nutrients even in
soils of high natural fertility which have been forgotten in the last 50 years but the most
important is soil acidy and related toxicity of aluminum (Atkinson et al 2005 Diatta et al
2010 Marschner 1991 Struik and Bonciarelli 1997) The key strategic target for farmers is to
increase soil volume directly occupied by plant roots in order to improve their access to
unavailable pools of nutrients Three main areas of soil productivity improvement via
increasing crop plants accessibility to nutrients in the subsoil at least may be considered i)
regulation of soil reaction ii) increase of organic matter content iii) removing of any kind of
hardpans It seems highly probable that in the case of Poland all three groups of measures
wwwintechopencom
Soil Fertility Improvement and Integrated Nutrient Management ndash A Global Perspective
180
are important In other countries of the CE soil acidity should be considered as an
agronomical problem for farmers conducting production on Luvisols
7 References
Atkinson A Black K amp Dawson L (2005) Prospects advantages and limitations of future crop production systems dependent upon the management processes Annals of Applied Biology Vol 146 pp 203-215 ISSN 1744-7348
Batjes H (2002) Carbon and nitrogen stocks in the soils of Central and Eastern Europe Soil Use Management Vol 18 pp 324-329 ISSN 1475-2743
Cakmak I (2005) The role of potassium in alleviating detrimental effects of abiotic stresses in plants Journal of Plant Nutrition Soil Science Vol 168 pp 521-530 ISSN 1436-8730
Catt J (2001) The agricultural importance of loess Earth-Science Reviews Vol 54 pp 213-229 ISSN 0012-8252
Cochrane N (2004) EU Enlargement Implications for US_EU agricultural relations US-EU Food and Agriculture ComaprisonWRS-04-04 78-86 Available online at
httpwwwersusdagovpublicationsWRS0404WRS0404pdf (Access 20110524)
Csatho P Sisak I amp Radimszky L (2007) Agriculture as a source of phosphorus causing eutrophication in Central and Eastern Europe Soil Use management Vol 23 (suppl 1) pp 36-56 ISSN 1475-2743
Csatho P amp Radimszky L (2009) Two Worlds within EU27 Sharp Contrasts in Organic and Mineral Nitrogen-Phosphorus Use Nitrogen-Phosphorus Balances and Soil Phosphorus Status Widening and Deepening Gap between Western and Central Europe Communications in Soil Science and Plant Analysis Vol 40 pp 999-1019 ISSN 0010-3624
Diatta J Bocianowski J amp Skubiszewska A (2010) Sulphate-based aluminum phytotoxicity mitigation under strong soil acidification Fresenius Environmental Bulletin Vol 19 No 12b pp 3185-3192 ISSN 1018-4619
Dibb D (2000) The mysteries (myths) of nutrient use efficiency Better Crops Vol 84 No 3 pp 3ndash5 ISSN 0006-0089
Dobermann A amp Cassman K (2002) Plant nutrient management for enhanced productivity in intensive grain production systems of the United States and Asia Plant and Soil Vol 247 pp 153-175 ISSN 1573-5036
Evans L amp Fisher R (1999) Yield potential its definition measurement and significance Crop Science Vol 39 pp 1544-1551 ISSN 1896-0782
Falloon P amp Betts R (2010) Climate impacts on European agriculture and water management in the context of adaptation and mitigation ndash the importance of integrated approach Science of Total Environment Vol 408 pp 5667-5687 ISSN 0048-9697
FAOSTAT Available online at httpfaostatfaoorgdefaultaspx (Access 20110524) Fixen P (2004) Phases in narrowing the yield gap Better Crops Vol 88 No 4 p 3 ISSN
0006-0089 Fronzek S amp Carter T (2007) Assessing uncertainties in climate change impacts on
resource potential for Europe based on projections from RCMs and GCMs Climate Change Vol 81 pp 357-371 ISSN 1758-6798
wwwintechopencom
Constraints and Solutions to Maintain Soil Productivity A Case Study from Central Europe
181
Grzebisz W amp Fotyma M (2007) Recommendations and use of potassium fertilizers in Central-Eastern Europe (CEE) In Proceedings International Fertiliser Society No 621 York UK pp 24 ISBN 978-0-85310-258-8
Grzebisz W Diatta J amp Haerdter R (2010) Fertilizer consumption patterns in Central European countries ndash effect on actual yield development trends in 1986-2005 years - a comparative study of the Czech Republic and Poland Journal of Central European Agriculture Vol 11 No 1 pp 73-82 ISSN 1332-9049
IFADATA Statistics online (2011) wwwfertilizerorgifastatisticsifadata datalineasp (Access 20110524)
Jongman R Bunce R amp Metzger R (2006) Objectives and applications of a statistical environmental stratification of Europe Landscape Ecology 21 409-419 ISSN 1572-9761
Karlen D Ditzler C amp Andrews S (2003) Soil quality why and how Geoderma Vol 114 pp 145-156 ISSN 0016-7061
Kelch D amp Osborne S (2001) Crop production capacity in EuropePrime Economic Research ServiceUSDA Agricultural outlookMarch 2001 19-23 ISSN 0099-1066
Marschner H (1991) Mechanisms of adaptation of plants to acid soils Plant and Soil 134 1-20 ISSN 1573-5036
Neumann K Verburg P amp Stehfest E (2010) The yield gap of global production a spatial analysis Agricultural Systems Vol 103 pp 316-326 ISSN 0308-521X
Nikolova M (1998) The soil potassium resources and the efficiency of potassium fertilizers in Bulgaria Nikola Poushkarow Inst of Soil Science and Agroecology Sofia Bulgaria IPI Country Report 12 39 pp
Olesen J amp Bindi M (2002) Consequences of climate change for European agricultural productivity land use and policy European Journal of Agronomy Vol 16 pp 239-262 ISSN 1161-0301
Olesen J Trnka M amp Kersebaum K (2011) Impacts and adaptation of European crop production systems to climate change European Journal of Agronomy Vol 34 pp 96-112 ISSN 1161-0301
Plant J Whittaker A amp Demitriades B (2005) The geological and tectonic framework of Europe Geochemical Atlas of Europe Part 1 Background Information Methodology Ed Salminen R Maps GTK FOREGS 20 pp ISBN 951-690-956-6
Rabbinge R (1993) The ecological background of food production In Crop protection and sustainable agriculture Wiley Chichester (Ciba Foundation Symposium 177 2-29 ISBN 10 0471939447
Rabbinge R amp Diepen C (2000) Changes in agriculture and land use in Europe European Journal of Agronomy Vol 13 pp 85-100 ISSN 1161-0301
Reilly J Fuglie K (1998) Future yield growth in field crops what evidence exists Soil amp Tillage Research Vol 47 pp 275-290 ISSN 0168-1987
Roberts T (2006) Improving Nutrient Use Efficiency Proceedings of the IFA Agriculture Conference Optimizing Resource Use Efficiency for Sustainable Intensification of Agriculture 27 february-2 March 2006 Kunming China pp 8
Rosegrant M Paisner M amp Meijer S (2001) Global Food Projections to 2020 Emerging trends and alternative futures IFPRI pp 206 ISBN 0-89629-640-7
wwwintechopencom
Soil Fertility Improvement and Integrated Nutrient Management ndash A Global Perspective
182
Sinclair T Purcell L amp Sneller C (2004) Crop transformation and the challenge to increase yield potential Trends in Plant Science Vol 9 No 2 pp 70-75 ISSN 136085
Struik P amp Bonciarelli F (1997) Resource use at the cropping system level European Journal of Agronomy Vol 7 pp 133-143 ISSN 1161-0301
Supit I van Diepen C amp de Wit A (2010) Recent changes in the climatic yield potential of various crops in Europe Agricultural Systems Vol 103 pp 683-694 ISSN 0308-521X
wwwintechopencom
Soil Fertility Improvement and Integrated Nutrient Management - AGlobal PerspectiveEdited by Dr Joann Whalen
ISBN 978-953-307-945-5Hard cover 306 pagesPublisher InTechPublished online 24 February 2012Published in print edition February 2012
InTech EuropeUniversity Campus STeP Ri Slavka Krautzeka 83A 51000 Rijeka Croatia Phone +385 (51) 770 447 Fax +385 (51) 686 166wwwintechopencom
InTech ChinaUnit 405 Office Block Hotel Equatorial Shanghai No65 Yan An Road (West) Shanghai 200040 China
Phone +86-21-62489820 Fax +86-21-62489821
Soil Fertility Improvement and Integrated Nutrient Management A Global Perspective presents 15 invitedchapters written by leading soil fertility experts The book is organized around three themes The first theme isSoil Mapping and Soil Fertility Testing describing spatial heterogeneity in soil nutrients within natural andmanaged ecosystems as well as up-to-date soil testing methods and information on how soil fertility indicatorsrespond to agricultural practices The second theme Organic and Inorganic Amendments for Soil FertilityImprovement describes fertilizing materials that provide important amounts of essential nutrients forplantsThe third theme Integrated Nutrient Management Planning Case Studies From Central Europe SouthAmerica and Africa highlights the principles of integrated nutrient management Additionally it gives casestudies explaining how this approach has been implemented successfully across large geographic regionsand at local scales to improve the productivity of staple crops and forages
How to referenceIn order to correctly reference this scholarly work feel free to copy and paste the following
Witold Grzebisz and Jean Diatta (2012) Constraints and Solutions to Maintain Soil Productivity A Case Studyfrom Central Europe Soil Fertility Improvement and Integrated Nutrient Management - A Global PerspectiveDr Joann Whalen (Ed) ISBN 978-953-307-945-5 InTech Available fromhttpwwwintechopencombookssoil-fertility-improvement-and-integrated-nutrient-management-a-global-perspectiveconstraints-and-solutions-to-maintain-soil-productivity-a-case-study-from-central-europe
copy 2012 The Author(s) Licensee IntechOpen This is an open access articledistributed under the terms of the Creative Commons Attribution 30License which permits unrestricted use distribution and reproduction inany medium provided the original work is properly cited
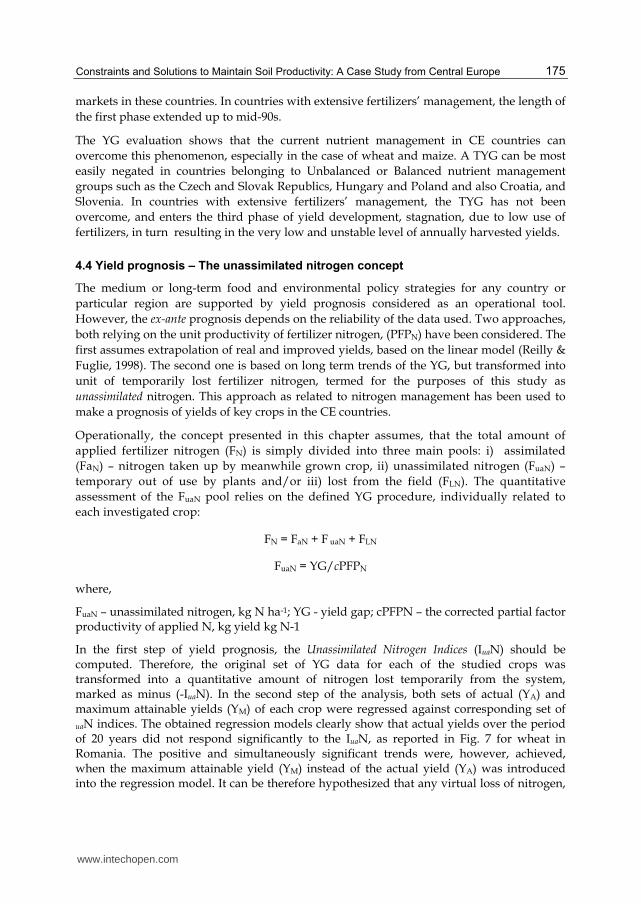
Constraints and Solutions to Maintain Soil Productivity A Case Study from Central Europe
175
markets in these countries In countries with extensive fertilizersrsquo management the length of
the first phase extended up to mid-90s
The YG evaluation shows that the current nutrient management in CE countries can
overcome this phenomenon especially in the case of wheat and maize A TYG can be most
easily negated in countries belonging to Unbalanced or Balanced nutrient management
groups such as the Czech and Slovak Republics Hungary and Poland and also Croatia and
Slovenia In countries with extensive fertilizersrsquo management the TYG has not been
overcome and enters the third phase of yield development stagnation due to low use of
fertilizers in turn resulting in the very low and unstable level of annually harvested yields
44 Yield prognosis ndash The unassimilated nitrogen concept
The medium or long-term food and environmental policy strategies for any country or
particular region are supported by yield prognosis considered as an operational tool
However the ex-ante prognosis depends on the reliability of the data used Two approaches
both relying on the unit productivity of fertilizer nitrogen (PFPN) have been considered The
first assumes extrapolation of real and improved yields based on the linear model (Reilly amp
Fuglie 1998) The second one is based on long term trends of the YG but transformed into
unit of temporarily lost fertilizer nitrogen termed for the purposes of this study as
unassimilated nitrogen This approach as related to nitrogen management has been used to
make a prognosis of yields of key crops in the CE countries
Operationally the concept presented in this chapter assumes that the total amount of
applied fertilizer nitrogen (FN) is simply divided into three main pools i) assimilated
(FaN) ndash nitrogen taken up by meanwhile grown crop ii) unassimilated nitrogen (FuaN) ndash
temporary out of use by plants andor iii) lost from the field (FLN) The quantitative
assessment of the FuaN pool relies on the defined YG procedure individually related to
each investigated crop
FN = FaN + F uaN + FLN
FuaN = YGcPFPN
where
FuaN ndash unassimilated nitrogen kg N ha-1 YG - yield gap cPFPN ndash the corrected partial factor productivity of applied N kg yield kg N-1
In the first step of yield prognosis the Unassimilated Nitrogen Indices (IuaN) should be computed Therefore the original set of YG data for each of the studied crops was transformed into a quantitative amount of nitrogen lost temporarily from the system marked as minus (-IuaN) In the second step of the analysis both sets of actual (YA) and maximum attainable yields (YM) of each crop were regressed against corresponding set of
uaN indices The obtained regression models clearly show that actual yields over the period of 20 years did not respond significantly to the IuaN as reported in Fig 7 for wheat in Romania The positive and simultaneously significant trends were however achieved when the maximum attainable yield (YM) instead of the actual yield (YA) was introduced into the regression model It can be therefore hypothesized that any virtual loss of nitrogen
wwwintechopencom
Soil Fertility Improvement and Integrated Nutrient Management ndash A Global Perspective
176
ie the negative uaN indices reflect the potential status for a yield increase and vice versa Unfortunately the positive indices of the uaN simply describe a state of N soil mining which in turn causes direct yield decline This is consistent with the opinion of Dibb (2000) and typical for many parts of the world including most CE countries
YM = -0114uaN + 2703 R2 = 093 P lt 0001
0
1
2
3
4
5
6
7
8
9
10
-60 -50 -40 -30 -20 -10 0 10
Gra
in y
ield
(Y
) t
ha-1
YA
YM
Yield
type
Unassimilated nitrogen (uaN) kg N ha-1
Fig 7 Yield prognosis of winter wheat based on residual nitrogen - a case of Romania (RO) Significant (Plt005) linear equation represents the trend for the attainable yields in the 1986-2008 period Legend YA ndash actual yield YM ndash maximum yield
Reliable yield prognosis can be performed assuming a certain level of expected yield or by focusing any improvement of production technology on higher N use efficiency The first approach can be best presented for wheat The maximum attainable yield for this crop in Poland and the Czech Republic is fixed at the level of 65 t ha-1 but for Romania at 45 t ha-1 (Rabbinge amp van Diepen 2000) The amount of uaN required to be incorporated into grain yield was calculated by the models and amounted to 48 27 and 33 kg ha-1 respectively It is equal to 58 27 and 100 of annual N rate applied in these countries and does not seem a realistic approach The same rules refer to other key crops in the study Therefore the second concept relying on the ability of currently cultivated crops to fix an extra amount of
uaN seems to be a more realistic approach for making any reliable yield prognosis (Table 7) This assumption is highly promising especially for countries presenting an extensive type of agriculture production for example Romania The expected wheat increase in response to the use of extra 20 kg N ha-1 is possible considering the water limited yield fixed at 45 t ha-1 The prognosis for the Czech Republic is still below the water limited yield being at 65 t ha-1 In Poland the calculated yields are at the same level as Romania but soils are less suitable for wheat production Therefore any grain yield increase seems to be a great challenge for farmers in all countries of the CE In the light of yields prognosis for sugar beets the fixed level of uaN at 20 kg N ha-1 is generally too low The level of 60 t ha-1 of beets seems to be the most reliable short-term target Thereby the amount of uaN successfully managed should be established at the level of 30 kg ha-1
wwwintechopencom
Constraints and Solutions to Maintain Soil Productivity A Case Study from Central Europe
177
CropCountry Linear regression model Yield at 20 kg uaN t ha-1
Wheat
Croatia YM = -0064 uaN + 3989 for R2 = 096 527
Czech Rep YM = -0063 uaN + 4777 for R2 = 088 604
Poland YM = -0060 uaN + 3623 for R2 = 092 482
Romania YM = -0114 uaN + 2703 for R2 = 093 498
Maize
Croatia YM = -0069 uaN + 4852 for R2 = 086 623
Czech Rep YM = -0064 uaN + 6470 for R2 = 069 776
Poland YM = -0085 uaN + 5431 for R2 = 083 713
Romania YM = -0121 uaN + 3348 for R2 = 094 578
Sugar beets
Croatia YM = -0605 uaN + 40677 for R2 = 089 5278
Czech Rep YM = -0458 uaN + 45872 for R2 = 076 5503
Poland YM = -0609 uaN + 39801 for R2 = 081 5198
Romania YM = -0822 uaN + 24046 for R2 = 093 4049
Table 7 Yield prognosis based on the unassimilated quantity of nitrogen (uaN)
5 Soil productivity improvements The concept of NPK fertilizers balance
The simple comparison of CE countries with respect to nutrient management clearly shows
that annual inputs of nitrogen are too high with respect to phosphorus and potassium
Therefore the main reasons of general yield stagnation in most of the CE countries are long-
term negative balances of P and K caused by low input of both mineral and organic
fertilizers As a consequence of soil P and K long-term mining the percentage share of soils
rich in both nutrients declined in the last two decades below the sufficiency level which was
achieved in many countries in 80s (Csatho at al 2007 Grzebisz amp Fotyma 2007)
It has been clearly stressed that in the transition phase of yield development the PFPN indices
reached the highest values resulting in yield gain This phenomenon emerged in years 1990
1991 for Poland and Hungary and in 1991 1992 for the Czech and Slovak Republics In all
these years the supply of P and K fertilizers was low In the Czech Republic ratios between
amounts of applied N-P-K fertilizers expressed as NP2O5K2O was 1025025 on average
This structure in spite of decreased fertilizersrsquo consumption allowed farmers to achieve the
same yields of all crops as in the period 1986-1990 The present structure of nutrient use is as
1015015 for the Czech Republic and 10404 for Poland These disparate nutrient ratios
stress the importance of NPK balance for high crop production The proposed NPK ratio
for the Czech Republic based on the cPFPN index can be established at the level of
1025025 in good years ie under ample water supply or 1025050 in unfavorable years ie
under expected water stress Hence keeping the current level of fertilizers consumption on
arable land ca 130 kg ha-1 one can predict the right amount of nutrients to apply In Poland
the total amount of currently consumed fertilizers is almost the same as in the Czech
wwwintechopencom
Soil Fertility Improvement and Integrated Nutrient Management ndash A Global Perspective
178
Republic Unfortunately soils in Poland are much poorer in potassium and also in
phosphorus being therefore highly sensitive to external supply of nutrients This
conclusion is corroborated by positive trends of yields in response to P and K fertilizers
application as found for all crops since 1991 onwards Consequently under favorable
weather conditions or on soils naturally rich in potassium the suggested formulation of N-
P-K fertilizers is as follows 1033066 but in years with high probability of drought or on
areas sensitive to drought a slightly different formulation is recommended namely
100510
It is not easy to formulate any efficient fertilizing strategy for Romania Since mid- 90s maize and wheat have shown yield stagnation at a very low level The main factors responsible for this situation are i) low N fertilization rates ii) imbalanced use of P and K fertilizers Therefore yields of these two crops are in fact dependent only on the seasonal weather course fluctuating for ca 100 on a yearly scale basis The main reason is unbalanced consumption of basic fertilizers which leads to permanent soil mining especially potassium The NP2O5K2O relationships averaged for the period 2004-2008 as 1027009 is not sufficient to get any yield increase or even its stabilization Potassium accumulates in plant tissues in much higher amounts and is considered as useful nutrient in water management (Cakmak 2005) Thereby this nutrient seems to be crucial for crop production in Romania even taking into account that almost 50 of land area is covered by soil naturally rich in minerals containing K In spite of low N consumption but unbalanced nutrient management there is still a space for an extra N loss for both key crops ie wheat and maize (see Fig 7) Therefore it could be concluded that any yield increase depends on both significant N rate rise and simultaneous change of fertilizer formulations The operational N-P-K fertilizers ratios suggested for Romania are as follows 1033017 in favorable and 10404 in unfavorable years The second scenario should aim at increasing plant survival under drought conditions
6 Thoughts and prospects
The new era of agriculture development in the Central Europe revealed how actual
agriculture outcomes in this region depend on three key factors presented in descending
order i) weather conditions during the growth season ii) inherent soil fertility iii) nitrogen
fertilizer consumption At present the first factor is decisive for crop production High year-
to-year yield variability reflects the imbalanced use of soil and external resources such as
fertilizers Therefore maximum attainable yields ie limited by water supply for example
for wheat are not attainable in all countries of the region In Germany also part of the
Central European region actual yields are above the ldquowater limitedrdquo level (Rabbinge amp
Diepen 2000 Supit et al 2010)
Inherent differences in the nature of soil quality between the CE countries as a background
of nutrient management are strictly related to the soil origin (Plant et al 2005) Except for
Poland all other countries are relatively rich in soils originated from loams (Cambisols) and
loess (Chernozems) These soils exhibit a high inherent potential for supplying K and other
cations such as calcium and magnesium (Nikolova 1998)
However at present nutritional requirements of high yielding crops most of the CE countries are almost entirely oriented on the third yield forming factor ie nitrogen
wwwintechopencom
Constraints and Solutions to Maintain Soil Productivity A Case Study from Central Europe
179
fertilizer use It has been well recognized that a balanced supply of external sources of slowly mobile elements such as phosphorus and potassium is broadly expected (Atkinson et al 2005 Struik amp Bonciarelli 1997) Consequently the average actual and attainable yields of main crops in CE countries are much more related to the soil-adjusted potential than to amounts of currently applied fertilizers As a result CE countries show at present much greater differences in agricultural production than at the end of the 80s
The observed unfavorable patterns of N fertilizer long-term consumption creates problems not only for agriculture production but are also potentially dangerous for the environment as a potential source of reactive nitrogen (Roberts 2006) There are three main questions to be urgently answered by specialists in all countries of the CE region i) do farmers really recognize an increasing yield gap ii) what is the reason for farmers and their advisory services to tolerate low efficiency of nitrogen iii) do farmers and advisory services recognize environmental aspects of the increasing amount of residual nitrogen In order to get answers to these questions one has to be familiar with factors contributing to the improvement in N fertilizer use efficiency
1 Farm management of N in terms of i) N rate quantification ii) time of N fertilizers application and iii) method of N fertilizers application
2 Management of nutrients responsible for the efficiency of N uptake and it in-plant transformation
3 Management of production factors other than N
The first problem is not only of technical nature because it affects in-season nitrogen use
efficiency and in turn actual yieldsrsquo variability However CE countries representing the
restoration type of yield development but at the same time unbalanced pattern of
consumed fertilizers do not indicate needs for increasing actually applied N rates This
strategy is to some extent the core of yield improvement in countries presenting stagnated
type of fertilizersrsquo management provided that any increase in N use will be compensated by
adequate amounts of applied phosphorus and potassium
It could finally be concluded that the realization of both goals of agricultural production in
the CE countries ie i) long-term yield stabilization and even its increase and ii) unit
productivity of the applied fertilizer N increase in turn decreasing amounts of the residual
N requires in the coming future changes in the structure of fertilizersrsquo consumption
keeping in the Unbalanced group of countries the same level of applied fertilizers The
problem of nutrients supply to a growing plant does not however refer only to the balanced
amounts of the applied fertilizers but also to the crop accessibility to soil natural nutrient
pools This problem is inherently related to conditions of root system growth in the soil
body There are a lot of factors limiting roots accessibility to water and nutrients even in
soils of high natural fertility which have been forgotten in the last 50 years but the most
important is soil acidy and related toxicity of aluminum (Atkinson et al 2005 Diatta et al
2010 Marschner 1991 Struik and Bonciarelli 1997) The key strategic target for farmers is to
increase soil volume directly occupied by plant roots in order to improve their access to
unavailable pools of nutrients Three main areas of soil productivity improvement via
increasing crop plants accessibility to nutrients in the subsoil at least may be considered i)
regulation of soil reaction ii) increase of organic matter content iii) removing of any kind of
hardpans It seems highly probable that in the case of Poland all three groups of measures
wwwintechopencom
Soil Fertility Improvement and Integrated Nutrient Management ndash A Global Perspective
180
are important In other countries of the CE soil acidity should be considered as an
agronomical problem for farmers conducting production on Luvisols
7 References
Atkinson A Black K amp Dawson L (2005) Prospects advantages and limitations of future crop production systems dependent upon the management processes Annals of Applied Biology Vol 146 pp 203-215 ISSN 1744-7348
Batjes H (2002) Carbon and nitrogen stocks in the soils of Central and Eastern Europe Soil Use Management Vol 18 pp 324-329 ISSN 1475-2743
Cakmak I (2005) The role of potassium in alleviating detrimental effects of abiotic stresses in plants Journal of Plant Nutrition Soil Science Vol 168 pp 521-530 ISSN 1436-8730
Catt J (2001) The agricultural importance of loess Earth-Science Reviews Vol 54 pp 213-229 ISSN 0012-8252
Cochrane N (2004) EU Enlargement Implications for US_EU agricultural relations US-EU Food and Agriculture ComaprisonWRS-04-04 78-86 Available online at
httpwwwersusdagovpublicationsWRS0404WRS0404pdf (Access 20110524)
Csatho P Sisak I amp Radimszky L (2007) Agriculture as a source of phosphorus causing eutrophication in Central and Eastern Europe Soil Use management Vol 23 (suppl 1) pp 36-56 ISSN 1475-2743
Csatho P amp Radimszky L (2009) Two Worlds within EU27 Sharp Contrasts in Organic and Mineral Nitrogen-Phosphorus Use Nitrogen-Phosphorus Balances and Soil Phosphorus Status Widening and Deepening Gap between Western and Central Europe Communications in Soil Science and Plant Analysis Vol 40 pp 999-1019 ISSN 0010-3624
Diatta J Bocianowski J amp Skubiszewska A (2010) Sulphate-based aluminum phytotoxicity mitigation under strong soil acidification Fresenius Environmental Bulletin Vol 19 No 12b pp 3185-3192 ISSN 1018-4619
Dibb D (2000) The mysteries (myths) of nutrient use efficiency Better Crops Vol 84 No 3 pp 3ndash5 ISSN 0006-0089
Dobermann A amp Cassman K (2002) Plant nutrient management for enhanced productivity in intensive grain production systems of the United States and Asia Plant and Soil Vol 247 pp 153-175 ISSN 1573-5036
Evans L amp Fisher R (1999) Yield potential its definition measurement and significance Crop Science Vol 39 pp 1544-1551 ISSN 1896-0782
Falloon P amp Betts R (2010) Climate impacts on European agriculture and water management in the context of adaptation and mitigation ndash the importance of integrated approach Science of Total Environment Vol 408 pp 5667-5687 ISSN 0048-9697
FAOSTAT Available online at httpfaostatfaoorgdefaultaspx (Access 20110524) Fixen P (2004) Phases in narrowing the yield gap Better Crops Vol 88 No 4 p 3 ISSN
0006-0089 Fronzek S amp Carter T (2007) Assessing uncertainties in climate change impacts on
resource potential for Europe based on projections from RCMs and GCMs Climate Change Vol 81 pp 357-371 ISSN 1758-6798
wwwintechopencom
Constraints and Solutions to Maintain Soil Productivity A Case Study from Central Europe
181
Grzebisz W amp Fotyma M (2007) Recommendations and use of potassium fertilizers in Central-Eastern Europe (CEE) In Proceedings International Fertiliser Society No 621 York UK pp 24 ISBN 978-0-85310-258-8
Grzebisz W Diatta J amp Haerdter R (2010) Fertilizer consumption patterns in Central European countries ndash effect on actual yield development trends in 1986-2005 years - a comparative study of the Czech Republic and Poland Journal of Central European Agriculture Vol 11 No 1 pp 73-82 ISSN 1332-9049
IFADATA Statistics online (2011) wwwfertilizerorgifastatisticsifadata datalineasp (Access 20110524)
Jongman R Bunce R amp Metzger R (2006) Objectives and applications of a statistical environmental stratification of Europe Landscape Ecology 21 409-419 ISSN 1572-9761
Karlen D Ditzler C amp Andrews S (2003) Soil quality why and how Geoderma Vol 114 pp 145-156 ISSN 0016-7061
Kelch D amp Osborne S (2001) Crop production capacity in EuropePrime Economic Research ServiceUSDA Agricultural outlookMarch 2001 19-23 ISSN 0099-1066
Marschner H (1991) Mechanisms of adaptation of plants to acid soils Plant and Soil 134 1-20 ISSN 1573-5036
Neumann K Verburg P amp Stehfest E (2010) The yield gap of global production a spatial analysis Agricultural Systems Vol 103 pp 316-326 ISSN 0308-521X
Nikolova M (1998) The soil potassium resources and the efficiency of potassium fertilizers in Bulgaria Nikola Poushkarow Inst of Soil Science and Agroecology Sofia Bulgaria IPI Country Report 12 39 pp
Olesen J amp Bindi M (2002) Consequences of climate change for European agricultural productivity land use and policy European Journal of Agronomy Vol 16 pp 239-262 ISSN 1161-0301
Olesen J Trnka M amp Kersebaum K (2011) Impacts and adaptation of European crop production systems to climate change European Journal of Agronomy Vol 34 pp 96-112 ISSN 1161-0301
Plant J Whittaker A amp Demitriades B (2005) The geological and tectonic framework of Europe Geochemical Atlas of Europe Part 1 Background Information Methodology Ed Salminen R Maps GTK FOREGS 20 pp ISBN 951-690-956-6
Rabbinge R (1993) The ecological background of food production In Crop protection and sustainable agriculture Wiley Chichester (Ciba Foundation Symposium 177 2-29 ISBN 10 0471939447
Rabbinge R amp Diepen C (2000) Changes in agriculture and land use in Europe European Journal of Agronomy Vol 13 pp 85-100 ISSN 1161-0301
Reilly J Fuglie K (1998) Future yield growth in field crops what evidence exists Soil amp Tillage Research Vol 47 pp 275-290 ISSN 0168-1987
Roberts T (2006) Improving Nutrient Use Efficiency Proceedings of the IFA Agriculture Conference Optimizing Resource Use Efficiency for Sustainable Intensification of Agriculture 27 february-2 March 2006 Kunming China pp 8
Rosegrant M Paisner M amp Meijer S (2001) Global Food Projections to 2020 Emerging trends and alternative futures IFPRI pp 206 ISBN 0-89629-640-7
wwwintechopencom
Soil Fertility Improvement and Integrated Nutrient Management ndash A Global Perspective
182
Sinclair T Purcell L amp Sneller C (2004) Crop transformation and the challenge to increase yield potential Trends in Plant Science Vol 9 No 2 pp 70-75 ISSN 136085
Struik P amp Bonciarelli F (1997) Resource use at the cropping system level European Journal of Agronomy Vol 7 pp 133-143 ISSN 1161-0301
Supit I van Diepen C amp de Wit A (2010) Recent changes in the climatic yield potential of various crops in Europe Agricultural Systems Vol 103 pp 683-694 ISSN 0308-521X
wwwintechopencom
Soil Fertility Improvement and Integrated Nutrient Management - AGlobal PerspectiveEdited by Dr Joann Whalen
ISBN 978-953-307-945-5Hard cover 306 pagesPublisher InTechPublished online 24 February 2012Published in print edition February 2012
InTech EuropeUniversity Campus STeP Ri Slavka Krautzeka 83A 51000 Rijeka Croatia Phone +385 (51) 770 447 Fax +385 (51) 686 166wwwintechopencom
InTech ChinaUnit 405 Office Block Hotel Equatorial Shanghai No65 Yan An Road (West) Shanghai 200040 China
Phone +86-21-62489820 Fax +86-21-62489821
Soil Fertility Improvement and Integrated Nutrient Management A Global Perspective presents 15 invitedchapters written by leading soil fertility experts The book is organized around three themes The first theme isSoil Mapping and Soil Fertility Testing describing spatial heterogeneity in soil nutrients within natural andmanaged ecosystems as well as up-to-date soil testing methods and information on how soil fertility indicatorsrespond to agricultural practices The second theme Organic and Inorganic Amendments for Soil FertilityImprovement describes fertilizing materials that provide important amounts of essential nutrients forplantsThe third theme Integrated Nutrient Management Planning Case Studies From Central Europe SouthAmerica and Africa highlights the principles of integrated nutrient management Additionally it gives casestudies explaining how this approach has been implemented successfully across large geographic regionsand at local scales to improve the productivity of staple crops and forages
How to referenceIn order to correctly reference this scholarly work feel free to copy and paste the following
Witold Grzebisz and Jean Diatta (2012) Constraints and Solutions to Maintain Soil Productivity A Case Studyfrom Central Europe Soil Fertility Improvement and Integrated Nutrient Management - A Global PerspectiveDr Joann Whalen (Ed) ISBN 978-953-307-945-5 InTech Available fromhttpwwwintechopencombookssoil-fertility-improvement-and-integrated-nutrient-management-a-global-perspectiveconstraints-and-solutions-to-maintain-soil-productivity-a-case-study-from-central-europe
copy 2012 The Author(s) Licensee IntechOpen This is an open access articledistributed under the terms of the Creative Commons Attribution 30License which permits unrestricted use distribution and reproduction inany medium provided the original work is properly cited
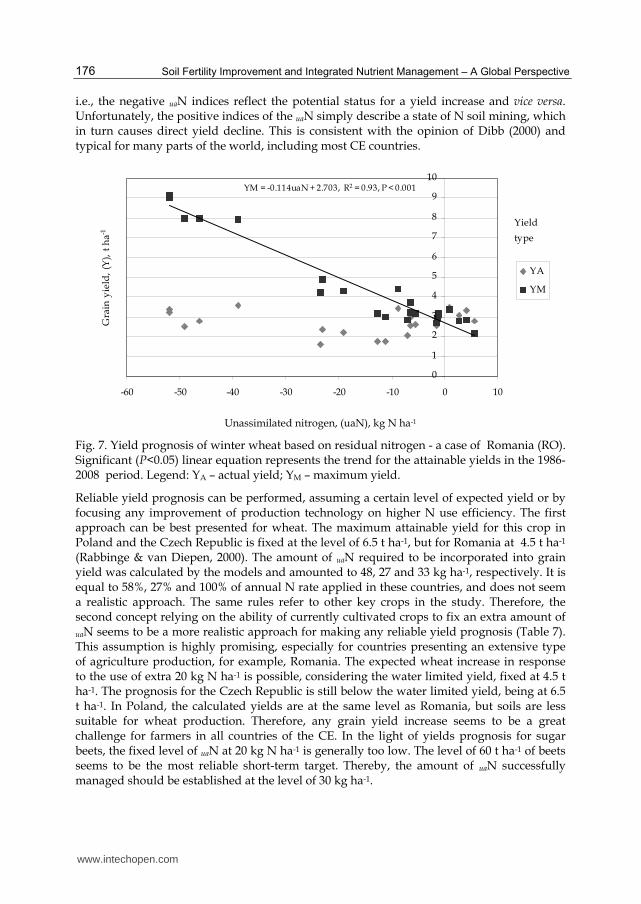
Soil Fertility Improvement and Integrated Nutrient Management ndash A Global Perspective
176
ie the negative uaN indices reflect the potential status for a yield increase and vice versa Unfortunately the positive indices of the uaN simply describe a state of N soil mining which in turn causes direct yield decline This is consistent with the opinion of Dibb (2000) and typical for many parts of the world including most CE countries
YM = -0114uaN + 2703 R2 = 093 P lt 0001
0
1
2
3
4
5
6
7
8
9
10
-60 -50 -40 -30 -20 -10 0 10
Gra
in y
ield
(Y
) t
ha-1
YA
YM
Yield
type
Unassimilated nitrogen (uaN) kg N ha-1
Fig 7 Yield prognosis of winter wheat based on residual nitrogen - a case of Romania (RO) Significant (Plt005) linear equation represents the trend for the attainable yields in the 1986-2008 period Legend YA ndash actual yield YM ndash maximum yield
Reliable yield prognosis can be performed assuming a certain level of expected yield or by focusing any improvement of production technology on higher N use efficiency The first approach can be best presented for wheat The maximum attainable yield for this crop in Poland and the Czech Republic is fixed at the level of 65 t ha-1 but for Romania at 45 t ha-1 (Rabbinge amp van Diepen 2000) The amount of uaN required to be incorporated into grain yield was calculated by the models and amounted to 48 27 and 33 kg ha-1 respectively It is equal to 58 27 and 100 of annual N rate applied in these countries and does not seem a realistic approach The same rules refer to other key crops in the study Therefore the second concept relying on the ability of currently cultivated crops to fix an extra amount of
uaN seems to be a more realistic approach for making any reliable yield prognosis (Table 7) This assumption is highly promising especially for countries presenting an extensive type of agriculture production for example Romania The expected wheat increase in response to the use of extra 20 kg N ha-1 is possible considering the water limited yield fixed at 45 t ha-1 The prognosis for the Czech Republic is still below the water limited yield being at 65 t ha-1 In Poland the calculated yields are at the same level as Romania but soils are less suitable for wheat production Therefore any grain yield increase seems to be a great challenge for farmers in all countries of the CE In the light of yields prognosis for sugar beets the fixed level of uaN at 20 kg N ha-1 is generally too low The level of 60 t ha-1 of beets seems to be the most reliable short-term target Thereby the amount of uaN successfully managed should be established at the level of 30 kg ha-1
wwwintechopencom
Constraints and Solutions to Maintain Soil Productivity A Case Study from Central Europe
177
CropCountry Linear regression model Yield at 20 kg uaN t ha-1
Wheat
Croatia YM = -0064 uaN + 3989 for R2 = 096 527
Czech Rep YM = -0063 uaN + 4777 for R2 = 088 604
Poland YM = -0060 uaN + 3623 for R2 = 092 482
Romania YM = -0114 uaN + 2703 for R2 = 093 498
Maize
Croatia YM = -0069 uaN + 4852 for R2 = 086 623
Czech Rep YM = -0064 uaN + 6470 for R2 = 069 776
Poland YM = -0085 uaN + 5431 for R2 = 083 713
Romania YM = -0121 uaN + 3348 for R2 = 094 578
Sugar beets
Croatia YM = -0605 uaN + 40677 for R2 = 089 5278
Czech Rep YM = -0458 uaN + 45872 for R2 = 076 5503
Poland YM = -0609 uaN + 39801 for R2 = 081 5198
Romania YM = -0822 uaN + 24046 for R2 = 093 4049
Table 7 Yield prognosis based on the unassimilated quantity of nitrogen (uaN)
5 Soil productivity improvements The concept of NPK fertilizers balance
The simple comparison of CE countries with respect to nutrient management clearly shows
that annual inputs of nitrogen are too high with respect to phosphorus and potassium
Therefore the main reasons of general yield stagnation in most of the CE countries are long-
term negative balances of P and K caused by low input of both mineral and organic
fertilizers As a consequence of soil P and K long-term mining the percentage share of soils
rich in both nutrients declined in the last two decades below the sufficiency level which was
achieved in many countries in 80s (Csatho at al 2007 Grzebisz amp Fotyma 2007)
It has been clearly stressed that in the transition phase of yield development the PFPN indices
reached the highest values resulting in yield gain This phenomenon emerged in years 1990
1991 for Poland and Hungary and in 1991 1992 for the Czech and Slovak Republics In all
these years the supply of P and K fertilizers was low In the Czech Republic ratios between
amounts of applied N-P-K fertilizers expressed as NP2O5K2O was 1025025 on average
This structure in spite of decreased fertilizersrsquo consumption allowed farmers to achieve the
same yields of all crops as in the period 1986-1990 The present structure of nutrient use is as
1015015 for the Czech Republic and 10404 for Poland These disparate nutrient ratios
stress the importance of NPK balance for high crop production The proposed NPK ratio
for the Czech Republic based on the cPFPN index can be established at the level of
1025025 in good years ie under ample water supply or 1025050 in unfavorable years ie
under expected water stress Hence keeping the current level of fertilizers consumption on
arable land ca 130 kg ha-1 one can predict the right amount of nutrients to apply In Poland
the total amount of currently consumed fertilizers is almost the same as in the Czech
wwwintechopencom
Soil Fertility Improvement and Integrated Nutrient Management ndash A Global Perspective
178
Republic Unfortunately soils in Poland are much poorer in potassium and also in
phosphorus being therefore highly sensitive to external supply of nutrients This
conclusion is corroborated by positive trends of yields in response to P and K fertilizers
application as found for all crops since 1991 onwards Consequently under favorable
weather conditions or on soils naturally rich in potassium the suggested formulation of N-
P-K fertilizers is as follows 1033066 but in years with high probability of drought or on
areas sensitive to drought a slightly different formulation is recommended namely
100510
It is not easy to formulate any efficient fertilizing strategy for Romania Since mid- 90s maize and wheat have shown yield stagnation at a very low level The main factors responsible for this situation are i) low N fertilization rates ii) imbalanced use of P and K fertilizers Therefore yields of these two crops are in fact dependent only on the seasonal weather course fluctuating for ca 100 on a yearly scale basis The main reason is unbalanced consumption of basic fertilizers which leads to permanent soil mining especially potassium The NP2O5K2O relationships averaged for the period 2004-2008 as 1027009 is not sufficient to get any yield increase or even its stabilization Potassium accumulates in plant tissues in much higher amounts and is considered as useful nutrient in water management (Cakmak 2005) Thereby this nutrient seems to be crucial for crop production in Romania even taking into account that almost 50 of land area is covered by soil naturally rich in minerals containing K In spite of low N consumption but unbalanced nutrient management there is still a space for an extra N loss for both key crops ie wheat and maize (see Fig 7) Therefore it could be concluded that any yield increase depends on both significant N rate rise and simultaneous change of fertilizer formulations The operational N-P-K fertilizers ratios suggested for Romania are as follows 1033017 in favorable and 10404 in unfavorable years The second scenario should aim at increasing plant survival under drought conditions
6 Thoughts and prospects
The new era of agriculture development in the Central Europe revealed how actual
agriculture outcomes in this region depend on three key factors presented in descending
order i) weather conditions during the growth season ii) inherent soil fertility iii) nitrogen
fertilizer consumption At present the first factor is decisive for crop production High year-
to-year yield variability reflects the imbalanced use of soil and external resources such as
fertilizers Therefore maximum attainable yields ie limited by water supply for example
for wheat are not attainable in all countries of the region In Germany also part of the
Central European region actual yields are above the ldquowater limitedrdquo level (Rabbinge amp
Diepen 2000 Supit et al 2010)
Inherent differences in the nature of soil quality between the CE countries as a background
of nutrient management are strictly related to the soil origin (Plant et al 2005) Except for
Poland all other countries are relatively rich in soils originated from loams (Cambisols) and
loess (Chernozems) These soils exhibit a high inherent potential for supplying K and other
cations such as calcium and magnesium (Nikolova 1998)
However at present nutritional requirements of high yielding crops most of the CE countries are almost entirely oriented on the third yield forming factor ie nitrogen
wwwintechopencom
Constraints and Solutions to Maintain Soil Productivity A Case Study from Central Europe
179
fertilizer use It has been well recognized that a balanced supply of external sources of slowly mobile elements such as phosphorus and potassium is broadly expected (Atkinson et al 2005 Struik amp Bonciarelli 1997) Consequently the average actual and attainable yields of main crops in CE countries are much more related to the soil-adjusted potential than to amounts of currently applied fertilizers As a result CE countries show at present much greater differences in agricultural production than at the end of the 80s
The observed unfavorable patterns of N fertilizer long-term consumption creates problems not only for agriculture production but are also potentially dangerous for the environment as a potential source of reactive nitrogen (Roberts 2006) There are three main questions to be urgently answered by specialists in all countries of the CE region i) do farmers really recognize an increasing yield gap ii) what is the reason for farmers and their advisory services to tolerate low efficiency of nitrogen iii) do farmers and advisory services recognize environmental aspects of the increasing amount of residual nitrogen In order to get answers to these questions one has to be familiar with factors contributing to the improvement in N fertilizer use efficiency
1 Farm management of N in terms of i) N rate quantification ii) time of N fertilizers application and iii) method of N fertilizers application
2 Management of nutrients responsible for the efficiency of N uptake and it in-plant transformation
3 Management of production factors other than N
The first problem is not only of technical nature because it affects in-season nitrogen use
efficiency and in turn actual yieldsrsquo variability However CE countries representing the
restoration type of yield development but at the same time unbalanced pattern of
consumed fertilizers do not indicate needs for increasing actually applied N rates This
strategy is to some extent the core of yield improvement in countries presenting stagnated
type of fertilizersrsquo management provided that any increase in N use will be compensated by
adequate amounts of applied phosphorus and potassium
It could finally be concluded that the realization of both goals of agricultural production in
the CE countries ie i) long-term yield stabilization and even its increase and ii) unit
productivity of the applied fertilizer N increase in turn decreasing amounts of the residual
N requires in the coming future changes in the structure of fertilizersrsquo consumption
keeping in the Unbalanced group of countries the same level of applied fertilizers The
problem of nutrients supply to a growing plant does not however refer only to the balanced
amounts of the applied fertilizers but also to the crop accessibility to soil natural nutrient
pools This problem is inherently related to conditions of root system growth in the soil
body There are a lot of factors limiting roots accessibility to water and nutrients even in
soils of high natural fertility which have been forgotten in the last 50 years but the most
important is soil acidy and related toxicity of aluminum (Atkinson et al 2005 Diatta et al
2010 Marschner 1991 Struik and Bonciarelli 1997) The key strategic target for farmers is to
increase soil volume directly occupied by plant roots in order to improve their access to
unavailable pools of nutrients Three main areas of soil productivity improvement via
increasing crop plants accessibility to nutrients in the subsoil at least may be considered i)
regulation of soil reaction ii) increase of organic matter content iii) removing of any kind of
hardpans It seems highly probable that in the case of Poland all three groups of measures
wwwintechopencom
Soil Fertility Improvement and Integrated Nutrient Management ndash A Global Perspective
180
are important In other countries of the CE soil acidity should be considered as an
agronomical problem for farmers conducting production on Luvisols
7 References
Atkinson A Black K amp Dawson L (2005) Prospects advantages and limitations of future crop production systems dependent upon the management processes Annals of Applied Biology Vol 146 pp 203-215 ISSN 1744-7348
Batjes H (2002) Carbon and nitrogen stocks in the soils of Central and Eastern Europe Soil Use Management Vol 18 pp 324-329 ISSN 1475-2743
Cakmak I (2005) The role of potassium in alleviating detrimental effects of abiotic stresses in plants Journal of Plant Nutrition Soil Science Vol 168 pp 521-530 ISSN 1436-8730
Catt J (2001) The agricultural importance of loess Earth-Science Reviews Vol 54 pp 213-229 ISSN 0012-8252
Cochrane N (2004) EU Enlargement Implications for US_EU agricultural relations US-EU Food and Agriculture ComaprisonWRS-04-04 78-86 Available online at
httpwwwersusdagovpublicationsWRS0404WRS0404pdf (Access 20110524)
Csatho P Sisak I amp Radimszky L (2007) Agriculture as a source of phosphorus causing eutrophication in Central and Eastern Europe Soil Use management Vol 23 (suppl 1) pp 36-56 ISSN 1475-2743
Csatho P amp Radimszky L (2009) Two Worlds within EU27 Sharp Contrasts in Organic and Mineral Nitrogen-Phosphorus Use Nitrogen-Phosphorus Balances and Soil Phosphorus Status Widening and Deepening Gap between Western and Central Europe Communications in Soil Science and Plant Analysis Vol 40 pp 999-1019 ISSN 0010-3624
Diatta J Bocianowski J amp Skubiszewska A (2010) Sulphate-based aluminum phytotoxicity mitigation under strong soil acidification Fresenius Environmental Bulletin Vol 19 No 12b pp 3185-3192 ISSN 1018-4619
Dibb D (2000) The mysteries (myths) of nutrient use efficiency Better Crops Vol 84 No 3 pp 3ndash5 ISSN 0006-0089
Dobermann A amp Cassman K (2002) Plant nutrient management for enhanced productivity in intensive grain production systems of the United States and Asia Plant and Soil Vol 247 pp 153-175 ISSN 1573-5036
Evans L amp Fisher R (1999) Yield potential its definition measurement and significance Crop Science Vol 39 pp 1544-1551 ISSN 1896-0782
Falloon P amp Betts R (2010) Climate impacts on European agriculture and water management in the context of adaptation and mitigation ndash the importance of integrated approach Science of Total Environment Vol 408 pp 5667-5687 ISSN 0048-9697
FAOSTAT Available online at httpfaostatfaoorgdefaultaspx (Access 20110524) Fixen P (2004) Phases in narrowing the yield gap Better Crops Vol 88 No 4 p 3 ISSN
0006-0089 Fronzek S amp Carter T (2007) Assessing uncertainties in climate change impacts on
resource potential for Europe based on projections from RCMs and GCMs Climate Change Vol 81 pp 357-371 ISSN 1758-6798
wwwintechopencom
Constraints and Solutions to Maintain Soil Productivity A Case Study from Central Europe
181
Grzebisz W amp Fotyma M (2007) Recommendations and use of potassium fertilizers in Central-Eastern Europe (CEE) In Proceedings International Fertiliser Society No 621 York UK pp 24 ISBN 978-0-85310-258-8
Grzebisz W Diatta J amp Haerdter R (2010) Fertilizer consumption patterns in Central European countries ndash effect on actual yield development trends in 1986-2005 years - a comparative study of the Czech Republic and Poland Journal of Central European Agriculture Vol 11 No 1 pp 73-82 ISSN 1332-9049
IFADATA Statistics online (2011) wwwfertilizerorgifastatisticsifadata datalineasp (Access 20110524)
Jongman R Bunce R amp Metzger R (2006) Objectives and applications of a statistical environmental stratification of Europe Landscape Ecology 21 409-419 ISSN 1572-9761
Karlen D Ditzler C amp Andrews S (2003) Soil quality why and how Geoderma Vol 114 pp 145-156 ISSN 0016-7061
Kelch D amp Osborne S (2001) Crop production capacity in EuropePrime Economic Research ServiceUSDA Agricultural outlookMarch 2001 19-23 ISSN 0099-1066
Marschner H (1991) Mechanisms of adaptation of plants to acid soils Plant and Soil 134 1-20 ISSN 1573-5036
Neumann K Verburg P amp Stehfest E (2010) The yield gap of global production a spatial analysis Agricultural Systems Vol 103 pp 316-326 ISSN 0308-521X
Nikolova M (1998) The soil potassium resources and the efficiency of potassium fertilizers in Bulgaria Nikola Poushkarow Inst of Soil Science and Agroecology Sofia Bulgaria IPI Country Report 12 39 pp
Olesen J amp Bindi M (2002) Consequences of climate change for European agricultural productivity land use and policy European Journal of Agronomy Vol 16 pp 239-262 ISSN 1161-0301
Olesen J Trnka M amp Kersebaum K (2011) Impacts and adaptation of European crop production systems to climate change European Journal of Agronomy Vol 34 pp 96-112 ISSN 1161-0301
Plant J Whittaker A amp Demitriades B (2005) The geological and tectonic framework of Europe Geochemical Atlas of Europe Part 1 Background Information Methodology Ed Salminen R Maps GTK FOREGS 20 pp ISBN 951-690-956-6
Rabbinge R (1993) The ecological background of food production In Crop protection and sustainable agriculture Wiley Chichester (Ciba Foundation Symposium 177 2-29 ISBN 10 0471939447
Rabbinge R amp Diepen C (2000) Changes in agriculture and land use in Europe European Journal of Agronomy Vol 13 pp 85-100 ISSN 1161-0301
Reilly J Fuglie K (1998) Future yield growth in field crops what evidence exists Soil amp Tillage Research Vol 47 pp 275-290 ISSN 0168-1987
Roberts T (2006) Improving Nutrient Use Efficiency Proceedings of the IFA Agriculture Conference Optimizing Resource Use Efficiency for Sustainable Intensification of Agriculture 27 february-2 March 2006 Kunming China pp 8
Rosegrant M Paisner M amp Meijer S (2001) Global Food Projections to 2020 Emerging trends and alternative futures IFPRI pp 206 ISBN 0-89629-640-7
wwwintechopencom
Soil Fertility Improvement and Integrated Nutrient Management ndash A Global Perspective
182
Sinclair T Purcell L amp Sneller C (2004) Crop transformation and the challenge to increase yield potential Trends in Plant Science Vol 9 No 2 pp 70-75 ISSN 136085
Struik P amp Bonciarelli F (1997) Resource use at the cropping system level European Journal of Agronomy Vol 7 pp 133-143 ISSN 1161-0301
Supit I van Diepen C amp de Wit A (2010) Recent changes in the climatic yield potential of various crops in Europe Agricultural Systems Vol 103 pp 683-694 ISSN 0308-521X
wwwintechopencom
Soil Fertility Improvement and Integrated Nutrient Management - AGlobal PerspectiveEdited by Dr Joann Whalen
ISBN 978-953-307-945-5Hard cover 306 pagesPublisher InTechPublished online 24 February 2012Published in print edition February 2012
InTech EuropeUniversity Campus STeP Ri Slavka Krautzeka 83A 51000 Rijeka Croatia Phone +385 (51) 770 447 Fax +385 (51) 686 166wwwintechopencom
InTech ChinaUnit 405 Office Block Hotel Equatorial Shanghai No65 Yan An Road (West) Shanghai 200040 China
Phone +86-21-62489820 Fax +86-21-62489821
Soil Fertility Improvement and Integrated Nutrient Management A Global Perspective presents 15 invitedchapters written by leading soil fertility experts The book is organized around three themes The first theme isSoil Mapping and Soil Fertility Testing describing spatial heterogeneity in soil nutrients within natural andmanaged ecosystems as well as up-to-date soil testing methods and information on how soil fertility indicatorsrespond to agricultural practices The second theme Organic and Inorganic Amendments for Soil FertilityImprovement describes fertilizing materials that provide important amounts of essential nutrients forplantsThe third theme Integrated Nutrient Management Planning Case Studies From Central Europe SouthAmerica and Africa highlights the principles of integrated nutrient management Additionally it gives casestudies explaining how this approach has been implemented successfully across large geographic regionsand at local scales to improve the productivity of staple crops and forages
How to referenceIn order to correctly reference this scholarly work feel free to copy and paste the following
Witold Grzebisz and Jean Diatta (2012) Constraints and Solutions to Maintain Soil Productivity A Case Studyfrom Central Europe Soil Fertility Improvement and Integrated Nutrient Management - A Global PerspectiveDr Joann Whalen (Ed) ISBN 978-953-307-945-5 InTech Available fromhttpwwwintechopencombookssoil-fertility-improvement-and-integrated-nutrient-management-a-global-perspectiveconstraints-and-solutions-to-maintain-soil-productivity-a-case-study-from-central-europe
copy 2012 The Author(s) Licensee IntechOpen This is an open access articledistributed under the terms of the Creative Commons Attribution 30License which permits unrestricted use distribution and reproduction inany medium provided the original work is properly cited
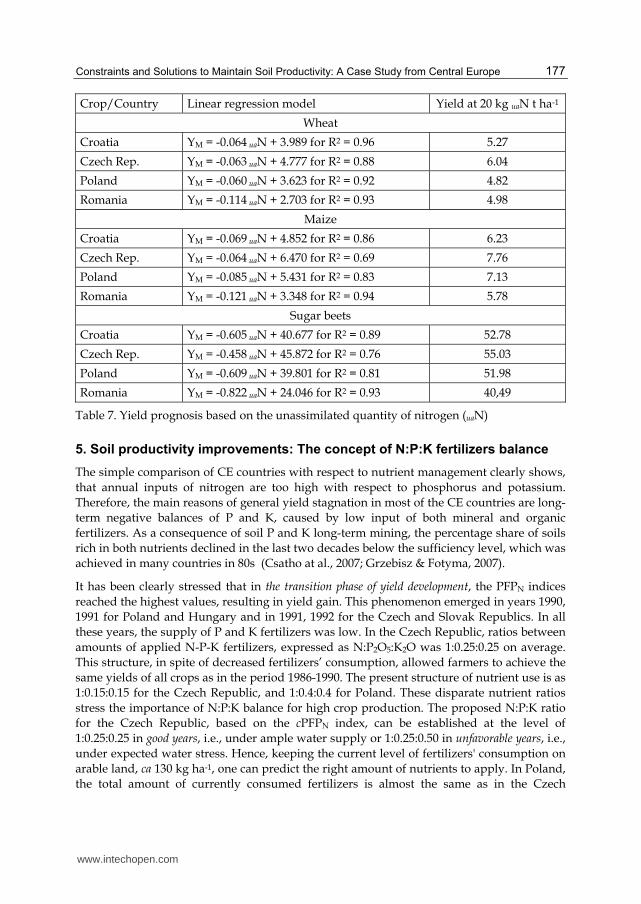
Constraints and Solutions to Maintain Soil Productivity A Case Study from Central Europe
177
CropCountry Linear regression model Yield at 20 kg uaN t ha-1
Wheat
Croatia YM = -0064 uaN + 3989 for R2 = 096 527
Czech Rep YM = -0063 uaN + 4777 for R2 = 088 604
Poland YM = -0060 uaN + 3623 for R2 = 092 482
Romania YM = -0114 uaN + 2703 for R2 = 093 498
Maize
Croatia YM = -0069 uaN + 4852 for R2 = 086 623
Czech Rep YM = -0064 uaN + 6470 for R2 = 069 776
Poland YM = -0085 uaN + 5431 for R2 = 083 713
Romania YM = -0121 uaN + 3348 for R2 = 094 578
Sugar beets
Croatia YM = -0605 uaN + 40677 for R2 = 089 5278
Czech Rep YM = -0458 uaN + 45872 for R2 = 076 5503
Poland YM = -0609 uaN + 39801 for R2 = 081 5198
Romania YM = -0822 uaN + 24046 for R2 = 093 4049
Table 7 Yield prognosis based on the unassimilated quantity of nitrogen (uaN)
5 Soil productivity improvements The concept of NPK fertilizers balance
The simple comparison of CE countries with respect to nutrient management clearly shows
that annual inputs of nitrogen are too high with respect to phosphorus and potassium
Therefore the main reasons of general yield stagnation in most of the CE countries are long-
term negative balances of P and K caused by low input of both mineral and organic
fertilizers As a consequence of soil P and K long-term mining the percentage share of soils
rich in both nutrients declined in the last two decades below the sufficiency level which was
achieved in many countries in 80s (Csatho at al 2007 Grzebisz amp Fotyma 2007)
It has been clearly stressed that in the transition phase of yield development the PFPN indices
reached the highest values resulting in yield gain This phenomenon emerged in years 1990
1991 for Poland and Hungary and in 1991 1992 for the Czech and Slovak Republics In all
these years the supply of P and K fertilizers was low In the Czech Republic ratios between
amounts of applied N-P-K fertilizers expressed as NP2O5K2O was 1025025 on average
This structure in spite of decreased fertilizersrsquo consumption allowed farmers to achieve the
same yields of all crops as in the period 1986-1990 The present structure of nutrient use is as
1015015 for the Czech Republic and 10404 for Poland These disparate nutrient ratios
stress the importance of NPK balance for high crop production The proposed NPK ratio
for the Czech Republic based on the cPFPN index can be established at the level of
1025025 in good years ie under ample water supply or 1025050 in unfavorable years ie
under expected water stress Hence keeping the current level of fertilizers consumption on
arable land ca 130 kg ha-1 one can predict the right amount of nutrients to apply In Poland
the total amount of currently consumed fertilizers is almost the same as in the Czech
wwwintechopencom
Soil Fertility Improvement and Integrated Nutrient Management ndash A Global Perspective
178
Republic Unfortunately soils in Poland are much poorer in potassium and also in
phosphorus being therefore highly sensitive to external supply of nutrients This
conclusion is corroborated by positive trends of yields in response to P and K fertilizers
application as found for all crops since 1991 onwards Consequently under favorable
weather conditions or on soils naturally rich in potassium the suggested formulation of N-
P-K fertilizers is as follows 1033066 but in years with high probability of drought or on
areas sensitive to drought a slightly different formulation is recommended namely
100510
It is not easy to formulate any efficient fertilizing strategy for Romania Since mid- 90s maize and wheat have shown yield stagnation at a very low level The main factors responsible for this situation are i) low N fertilization rates ii) imbalanced use of P and K fertilizers Therefore yields of these two crops are in fact dependent only on the seasonal weather course fluctuating for ca 100 on a yearly scale basis The main reason is unbalanced consumption of basic fertilizers which leads to permanent soil mining especially potassium The NP2O5K2O relationships averaged for the period 2004-2008 as 1027009 is not sufficient to get any yield increase or even its stabilization Potassium accumulates in plant tissues in much higher amounts and is considered as useful nutrient in water management (Cakmak 2005) Thereby this nutrient seems to be crucial for crop production in Romania even taking into account that almost 50 of land area is covered by soil naturally rich in minerals containing K In spite of low N consumption but unbalanced nutrient management there is still a space for an extra N loss for both key crops ie wheat and maize (see Fig 7) Therefore it could be concluded that any yield increase depends on both significant N rate rise and simultaneous change of fertilizer formulations The operational N-P-K fertilizers ratios suggested for Romania are as follows 1033017 in favorable and 10404 in unfavorable years The second scenario should aim at increasing plant survival under drought conditions
6 Thoughts and prospects
The new era of agriculture development in the Central Europe revealed how actual
agriculture outcomes in this region depend on three key factors presented in descending
order i) weather conditions during the growth season ii) inherent soil fertility iii) nitrogen
fertilizer consumption At present the first factor is decisive for crop production High year-
to-year yield variability reflects the imbalanced use of soil and external resources such as
fertilizers Therefore maximum attainable yields ie limited by water supply for example
for wheat are not attainable in all countries of the region In Germany also part of the
Central European region actual yields are above the ldquowater limitedrdquo level (Rabbinge amp
Diepen 2000 Supit et al 2010)
Inherent differences in the nature of soil quality between the CE countries as a background
of nutrient management are strictly related to the soil origin (Plant et al 2005) Except for
Poland all other countries are relatively rich in soils originated from loams (Cambisols) and
loess (Chernozems) These soils exhibit a high inherent potential for supplying K and other
cations such as calcium and magnesium (Nikolova 1998)
However at present nutritional requirements of high yielding crops most of the CE countries are almost entirely oriented on the third yield forming factor ie nitrogen
wwwintechopencom
Constraints and Solutions to Maintain Soil Productivity A Case Study from Central Europe
179
fertilizer use It has been well recognized that a balanced supply of external sources of slowly mobile elements such as phosphorus and potassium is broadly expected (Atkinson et al 2005 Struik amp Bonciarelli 1997) Consequently the average actual and attainable yields of main crops in CE countries are much more related to the soil-adjusted potential than to amounts of currently applied fertilizers As a result CE countries show at present much greater differences in agricultural production than at the end of the 80s
The observed unfavorable patterns of N fertilizer long-term consumption creates problems not only for agriculture production but are also potentially dangerous for the environment as a potential source of reactive nitrogen (Roberts 2006) There are three main questions to be urgently answered by specialists in all countries of the CE region i) do farmers really recognize an increasing yield gap ii) what is the reason for farmers and their advisory services to tolerate low efficiency of nitrogen iii) do farmers and advisory services recognize environmental aspects of the increasing amount of residual nitrogen In order to get answers to these questions one has to be familiar with factors contributing to the improvement in N fertilizer use efficiency
1 Farm management of N in terms of i) N rate quantification ii) time of N fertilizers application and iii) method of N fertilizers application
2 Management of nutrients responsible for the efficiency of N uptake and it in-plant transformation
3 Management of production factors other than N
The first problem is not only of technical nature because it affects in-season nitrogen use
efficiency and in turn actual yieldsrsquo variability However CE countries representing the
restoration type of yield development but at the same time unbalanced pattern of
consumed fertilizers do not indicate needs for increasing actually applied N rates This
strategy is to some extent the core of yield improvement in countries presenting stagnated
type of fertilizersrsquo management provided that any increase in N use will be compensated by
adequate amounts of applied phosphorus and potassium
It could finally be concluded that the realization of both goals of agricultural production in
the CE countries ie i) long-term yield stabilization and even its increase and ii) unit
productivity of the applied fertilizer N increase in turn decreasing amounts of the residual
N requires in the coming future changes in the structure of fertilizersrsquo consumption
keeping in the Unbalanced group of countries the same level of applied fertilizers The
problem of nutrients supply to a growing plant does not however refer only to the balanced
amounts of the applied fertilizers but also to the crop accessibility to soil natural nutrient
pools This problem is inherently related to conditions of root system growth in the soil
body There are a lot of factors limiting roots accessibility to water and nutrients even in
soils of high natural fertility which have been forgotten in the last 50 years but the most
important is soil acidy and related toxicity of aluminum (Atkinson et al 2005 Diatta et al
2010 Marschner 1991 Struik and Bonciarelli 1997) The key strategic target for farmers is to
increase soil volume directly occupied by plant roots in order to improve their access to
unavailable pools of nutrients Three main areas of soil productivity improvement via
increasing crop plants accessibility to nutrients in the subsoil at least may be considered i)
regulation of soil reaction ii) increase of organic matter content iii) removing of any kind of
hardpans It seems highly probable that in the case of Poland all three groups of measures
wwwintechopencom
Soil Fertility Improvement and Integrated Nutrient Management ndash A Global Perspective
180
are important In other countries of the CE soil acidity should be considered as an
agronomical problem for farmers conducting production on Luvisols
7 References
Atkinson A Black K amp Dawson L (2005) Prospects advantages and limitations of future crop production systems dependent upon the management processes Annals of Applied Biology Vol 146 pp 203-215 ISSN 1744-7348
Batjes H (2002) Carbon and nitrogen stocks in the soils of Central and Eastern Europe Soil Use Management Vol 18 pp 324-329 ISSN 1475-2743
Cakmak I (2005) The role of potassium in alleviating detrimental effects of abiotic stresses in plants Journal of Plant Nutrition Soil Science Vol 168 pp 521-530 ISSN 1436-8730
Catt J (2001) The agricultural importance of loess Earth-Science Reviews Vol 54 pp 213-229 ISSN 0012-8252
Cochrane N (2004) EU Enlargement Implications for US_EU agricultural relations US-EU Food and Agriculture ComaprisonWRS-04-04 78-86 Available online at
httpwwwersusdagovpublicationsWRS0404WRS0404pdf (Access 20110524)
Csatho P Sisak I amp Radimszky L (2007) Agriculture as a source of phosphorus causing eutrophication in Central and Eastern Europe Soil Use management Vol 23 (suppl 1) pp 36-56 ISSN 1475-2743
Csatho P amp Radimszky L (2009) Two Worlds within EU27 Sharp Contrasts in Organic and Mineral Nitrogen-Phosphorus Use Nitrogen-Phosphorus Balances and Soil Phosphorus Status Widening and Deepening Gap between Western and Central Europe Communications in Soil Science and Plant Analysis Vol 40 pp 999-1019 ISSN 0010-3624
Diatta J Bocianowski J amp Skubiszewska A (2010) Sulphate-based aluminum phytotoxicity mitigation under strong soil acidification Fresenius Environmental Bulletin Vol 19 No 12b pp 3185-3192 ISSN 1018-4619
Dibb D (2000) The mysteries (myths) of nutrient use efficiency Better Crops Vol 84 No 3 pp 3ndash5 ISSN 0006-0089
Dobermann A amp Cassman K (2002) Plant nutrient management for enhanced productivity in intensive grain production systems of the United States and Asia Plant and Soil Vol 247 pp 153-175 ISSN 1573-5036
Evans L amp Fisher R (1999) Yield potential its definition measurement and significance Crop Science Vol 39 pp 1544-1551 ISSN 1896-0782
Falloon P amp Betts R (2010) Climate impacts on European agriculture and water management in the context of adaptation and mitigation ndash the importance of integrated approach Science of Total Environment Vol 408 pp 5667-5687 ISSN 0048-9697
FAOSTAT Available online at httpfaostatfaoorgdefaultaspx (Access 20110524) Fixen P (2004) Phases in narrowing the yield gap Better Crops Vol 88 No 4 p 3 ISSN
0006-0089 Fronzek S amp Carter T (2007) Assessing uncertainties in climate change impacts on
resource potential for Europe based on projections from RCMs and GCMs Climate Change Vol 81 pp 357-371 ISSN 1758-6798
wwwintechopencom
Constraints and Solutions to Maintain Soil Productivity A Case Study from Central Europe
181
Grzebisz W amp Fotyma M (2007) Recommendations and use of potassium fertilizers in Central-Eastern Europe (CEE) In Proceedings International Fertiliser Society No 621 York UK pp 24 ISBN 978-0-85310-258-8
Grzebisz W Diatta J amp Haerdter R (2010) Fertilizer consumption patterns in Central European countries ndash effect on actual yield development trends in 1986-2005 years - a comparative study of the Czech Republic and Poland Journal of Central European Agriculture Vol 11 No 1 pp 73-82 ISSN 1332-9049
IFADATA Statistics online (2011) wwwfertilizerorgifastatisticsifadata datalineasp (Access 20110524)
Jongman R Bunce R amp Metzger R (2006) Objectives and applications of a statistical environmental stratification of Europe Landscape Ecology 21 409-419 ISSN 1572-9761
Karlen D Ditzler C amp Andrews S (2003) Soil quality why and how Geoderma Vol 114 pp 145-156 ISSN 0016-7061
Kelch D amp Osborne S (2001) Crop production capacity in EuropePrime Economic Research ServiceUSDA Agricultural outlookMarch 2001 19-23 ISSN 0099-1066
Marschner H (1991) Mechanisms of adaptation of plants to acid soils Plant and Soil 134 1-20 ISSN 1573-5036
Neumann K Verburg P amp Stehfest E (2010) The yield gap of global production a spatial analysis Agricultural Systems Vol 103 pp 316-326 ISSN 0308-521X
Nikolova M (1998) The soil potassium resources and the efficiency of potassium fertilizers in Bulgaria Nikola Poushkarow Inst of Soil Science and Agroecology Sofia Bulgaria IPI Country Report 12 39 pp
Olesen J amp Bindi M (2002) Consequences of climate change for European agricultural productivity land use and policy European Journal of Agronomy Vol 16 pp 239-262 ISSN 1161-0301
Olesen J Trnka M amp Kersebaum K (2011) Impacts and adaptation of European crop production systems to climate change European Journal of Agronomy Vol 34 pp 96-112 ISSN 1161-0301
Plant J Whittaker A amp Demitriades B (2005) The geological and tectonic framework of Europe Geochemical Atlas of Europe Part 1 Background Information Methodology Ed Salminen R Maps GTK FOREGS 20 pp ISBN 951-690-956-6
Rabbinge R (1993) The ecological background of food production In Crop protection and sustainable agriculture Wiley Chichester (Ciba Foundation Symposium 177 2-29 ISBN 10 0471939447
Rabbinge R amp Diepen C (2000) Changes in agriculture and land use in Europe European Journal of Agronomy Vol 13 pp 85-100 ISSN 1161-0301
Reilly J Fuglie K (1998) Future yield growth in field crops what evidence exists Soil amp Tillage Research Vol 47 pp 275-290 ISSN 0168-1987
Roberts T (2006) Improving Nutrient Use Efficiency Proceedings of the IFA Agriculture Conference Optimizing Resource Use Efficiency for Sustainable Intensification of Agriculture 27 february-2 March 2006 Kunming China pp 8
Rosegrant M Paisner M amp Meijer S (2001) Global Food Projections to 2020 Emerging trends and alternative futures IFPRI pp 206 ISBN 0-89629-640-7
wwwintechopencom
Soil Fertility Improvement and Integrated Nutrient Management ndash A Global Perspective
182
Sinclair T Purcell L amp Sneller C (2004) Crop transformation and the challenge to increase yield potential Trends in Plant Science Vol 9 No 2 pp 70-75 ISSN 136085
Struik P amp Bonciarelli F (1997) Resource use at the cropping system level European Journal of Agronomy Vol 7 pp 133-143 ISSN 1161-0301
Supit I van Diepen C amp de Wit A (2010) Recent changes in the climatic yield potential of various crops in Europe Agricultural Systems Vol 103 pp 683-694 ISSN 0308-521X
wwwintechopencom
Soil Fertility Improvement and Integrated Nutrient Management - AGlobal PerspectiveEdited by Dr Joann Whalen
ISBN 978-953-307-945-5Hard cover 306 pagesPublisher InTechPublished online 24 February 2012Published in print edition February 2012
InTech EuropeUniversity Campus STeP Ri Slavka Krautzeka 83A 51000 Rijeka Croatia Phone +385 (51) 770 447 Fax +385 (51) 686 166wwwintechopencom
InTech ChinaUnit 405 Office Block Hotel Equatorial Shanghai No65 Yan An Road (West) Shanghai 200040 China
Phone +86-21-62489820 Fax +86-21-62489821
Soil Fertility Improvement and Integrated Nutrient Management A Global Perspective presents 15 invitedchapters written by leading soil fertility experts The book is organized around three themes The first theme isSoil Mapping and Soil Fertility Testing describing spatial heterogeneity in soil nutrients within natural andmanaged ecosystems as well as up-to-date soil testing methods and information on how soil fertility indicatorsrespond to agricultural practices The second theme Organic and Inorganic Amendments for Soil FertilityImprovement describes fertilizing materials that provide important amounts of essential nutrients forplantsThe third theme Integrated Nutrient Management Planning Case Studies From Central Europe SouthAmerica and Africa highlights the principles of integrated nutrient management Additionally it gives casestudies explaining how this approach has been implemented successfully across large geographic regionsand at local scales to improve the productivity of staple crops and forages
How to referenceIn order to correctly reference this scholarly work feel free to copy and paste the following
Witold Grzebisz and Jean Diatta (2012) Constraints and Solutions to Maintain Soil Productivity A Case Studyfrom Central Europe Soil Fertility Improvement and Integrated Nutrient Management - A Global PerspectiveDr Joann Whalen (Ed) ISBN 978-953-307-945-5 InTech Available fromhttpwwwintechopencombookssoil-fertility-improvement-and-integrated-nutrient-management-a-global-perspectiveconstraints-and-solutions-to-maintain-soil-productivity-a-case-study-from-central-europe
copy 2012 The Author(s) Licensee IntechOpen This is an open access articledistributed under the terms of the Creative Commons Attribution 30License which permits unrestricted use distribution and reproduction inany medium provided the original work is properly cited

Soil Fertility Improvement and Integrated Nutrient Management ndash A Global Perspective
178
Republic Unfortunately soils in Poland are much poorer in potassium and also in
phosphorus being therefore highly sensitive to external supply of nutrients This
conclusion is corroborated by positive trends of yields in response to P and K fertilizers
application as found for all crops since 1991 onwards Consequently under favorable
weather conditions or on soils naturally rich in potassium the suggested formulation of N-
P-K fertilizers is as follows 1033066 but in years with high probability of drought or on
areas sensitive to drought a slightly different formulation is recommended namely
100510
It is not easy to formulate any efficient fertilizing strategy for Romania Since mid- 90s maize and wheat have shown yield stagnation at a very low level The main factors responsible for this situation are i) low N fertilization rates ii) imbalanced use of P and K fertilizers Therefore yields of these two crops are in fact dependent only on the seasonal weather course fluctuating for ca 100 on a yearly scale basis The main reason is unbalanced consumption of basic fertilizers which leads to permanent soil mining especially potassium The NP2O5K2O relationships averaged for the period 2004-2008 as 1027009 is not sufficient to get any yield increase or even its stabilization Potassium accumulates in plant tissues in much higher amounts and is considered as useful nutrient in water management (Cakmak 2005) Thereby this nutrient seems to be crucial for crop production in Romania even taking into account that almost 50 of land area is covered by soil naturally rich in minerals containing K In spite of low N consumption but unbalanced nutrient management there is still a space for an extra N loss for both key crops ie wheat and maize (see Fig 7) Therefore it could be concluded that any yield increase depends on both significant N rate rise and simultaneous change of fertilizer formulations The operational N-P-K fertilizers ratios suggested for Romania are as follows 1033017 in favorable and 10404 in unfavorable years The second scenario should aim at increasing plant survival under drought conditions
6 Thoughts and prospects
The new era of agriculture development in the Central Europe revealed how actual
agriculture outcomes in this region depend on three key factors presented in descending
order i) weather conditions during the growth season ii) inherent soil fertility iii) nitrogen
fertilizer consumption At present the first factor is decisive for crop production High year-
to-year yield variability reflects the imbalanced use of soil and external resources such as
fertilizers Therefore maximum attainable yields ie limited by water supply for example
for wheat are not attainable in all countries of the region In Germany also part of the
Central European region actual yields are above the ldquowater limitedrdquo level (Rabbinge amp
Diepen 2000 Supit et al 2010)
Inherent differences in the nature of soil quality between the CE countries as a background
of nutrient management are strictly related to the soil origin (Plant et al 2005) Except for
Poland all other countries are relatively rich in soils originated from loams (Cambisols) and
loess (Chernozems) These soils exhibit a high inherent potential for supplying K and other
cations such as calcium and magnesium (Nikolova 1998)
However at present nutritional requirements of high yielding crops most of the CE countries are almost entirely oriented on the third yield forming factor ie nitrogen
wwwintechopencom
Constraints and Solutions to Maintain Soil Productivity A Case Study from Central Europe
179
fertilizer use It has been well recognized that a balanced supply of external sources of slowly mobile elements such as phosphorus and potassium is broadly expected (Atkinson et al 2005 Struik amp Bonciarelli 1997) Consequently the average actual and attainable yields of main crops in CE countries are much more related to the soil-adjusted potential than to amounts of currently applied fertilizers As a result CE countries show at present much greater differences in agricultural production than at the end of the 80s
The observed unfavorable patterns of N fertilizer long-term consumption creates problems not only for agriculture production but are also potentially dangerous for the environment as a potential source of reactive nitrogen (Roberts 2006) There are three main questions to be urgently answered by specialists in all countries of the CE region i) do farmers really recognize an increasing yield gap ii) what is the reason for farmers and their advisory services to tolerate low efficiency of nitrogen iii) do farmers and advisory services recognize environmental aspects of the increasing amount of residual nitrogen In order to get answers to these questions one has to be familiar with factors contributing to the improvement in N fertilizer use efficiency
1 Farm management of N in terms of i) N rate quantification ii) time of N fertilizers application and iii) method of N fertilizers application
2 Management of nutrients responsible for the efficiency of N uptake and it in-plant transformation
3 Management of production factors other than N
The first problem is not only of technical nature because it affects in-season nitrogen use
efficiency and in turn actual yieldsrsquo variability However CE countries representing the
restoration type of yield development but at the same time unbalanced pattern of
consumed fertilizers do not indicate needs for increasing actually applied N rates This
strategy is to some extent the core of yield improvement in countries presenting stagnated
type of fertilizersrsquo management provided that any increase in N use will be compensated by
adequate amounts of applied phosphorus and potassium
It could finally be concluded that the realization of both goals of agricultural production in
the CE countries ie i) long-term yield stabilization and even its increase and ii) unit
productivity of the applied fertilizer N increase in turn decreasing amounts of the residual
N requires in the coming future changes in the structure of fertilizersrsquo consumption
keeping in the Unbalanced group of countries the same level of applied fertilizers The
problem of nutrients supply to a growing plant does not however refer only to the balanced
amounts of the applied fertilizers but also to the crop accessibility to soil natural nutrient
pools This problem is inherently related to conditions of root system growth in the soil
body There are a lot of factors limiting roots accessibility to water and nutrients even in
soils of high natural fertility which have been forgotten in the last 50 years but the most
important is soil acidy and related toxicity of aluminum (Atkinson et al 2005 Diatta et al
2010 Marschner 1991 Struik and Bonciarelli 1997) The key strategic target for farmers is to
increase soil volume directly occupied by plant roots in order to improve their access to
unavailable pools of nutrients Three main areas of soil productivity improvement via
increasing crop plants accessibility to nutrients in the subsoil at least may be considered i)
regulation of soil reaction ii) increase of organic matter content iii) removing of any kind of
hardpans It seems highly probable that in the case of Poland all three groups of measures
wwwintechopencom
Soil Fertility Improvement and Integrated Nutrient Management ndash A Global Perspective
180
are important In other countries of the CE soil acidity should be considered as an
agronomical problem for farmers conducting production on Luvisols
7 References
Atkinson A Black K amp Dawson L (2005) Prospects advantages and limitations of future crop production systems dependent upon the management processes Annals of Applied Biology Vol 146 pp 203-215 ISSN 1744-7348
Batjes H (2002) Carbon and nitrogen stocks in the soils of Central and Eastern Europe Soil Use Management Vol 18 pp 324-329 ISSN 1475-2743
Cakmak I (2005) The role of potassium in alleviating detrimental effects of abiotic stresses in plants Journal of Plant Nutrition Soil Science Vol 168 pp 521-530 ISSN 1436-8730
Catt J (2001) The agricultural importance of loess Earth-Science Reviews Vol 54 pp 213-229 ISSN 0012-8252
Cochrane N (2004) EU Enlargement Implications for US_EU agricultural relations US-EU Food and Agriculture ComaprisonWRS-04-04 78-86 Available online at
httpwwwersusdagovpublicationsWRS0404WRS0404pdf (Access 20110524)
Csatho P Sisak I amp Radimszky L (2007) Agriculture as a source of phosphorus causing eutrophication in Central and Eastern Europe Soil Use management Vol 23 (suppl 1) pp 36-56 ISSN 1475-2743
Csatho P amp Radimszky L (2009) Two Worlds within EU27 Sharp Contrasts in Organic and Mineral Nitrogen-Phosphorus Use Nitrogen-Phosphorus Balances and Soil Phosphorus Status Widening and Deepening Gap between Western and Central Europe Communications in Soil Science and Plant Analysis Vol 40 pp 999-1019 ISSN 0010-3624
Diatta J Bocianowski J amp Skubiszewska A (2010) Sulphate-based aluminum phytotoxicity mitigation under strong soil acidification Fresenius Environmental Bulletin Vol 19 No 12b pp 3185-3192 ISSN 1018-4619
Dibb D (2000) The mysteries (myths) of nutrient use efficiency Better Crops Vol 84 No 3 pp 3ndash5 ISSN 0006-0089
Dobermann A amp Cassman K (2002) Plant nutrient management for enhanced productivity in intensive grain production systems of the United States and Asia Plant and Soil Vol 247 pp 153-175 ISSN 1573-5036
Evans L amp Fisher R (1999) Yield potential its definition measurement and significance Crop Science Vol 39 pp 1544-1551 ISSN 1896-0782
Falloon P amp Betts R (2010) Climate impacts on European agriculture and water management in the context of adaptation and mitigation ndash the importance of integrated approach Science of Total Environment Vol 408 pp 5667-5687 ISSN 0048-9697
FAOSTAT Available online at httpfaostatfaoorgdefaultaspx (Access 20110524) Fixen P (2004) Phases in narrowing the yield gap Better Crops Vol 88 No 4 p 3 ISSN
0006-0089 Fronzek S amp Carter T (2007) Assessing uncertainties in climate change impacts on
resource potential for Europe based on projections from RCMs and GCMs Climate Change Vol 81 pp 357-371 ISSN 1758-6798
wwwintechopencom
Constraints and Solutions to Maintain Soil Productivity A Case Study from Central Europe
181
Grzebisz W amp Fotyma M (2007) Recommendations and use of potassium fertilizers in Central-Eastern Europe (CEE) In Proceedings International Fertiliser Society No 621 York UK pp 24 ISBN 978-0-85310-258-8
Grzebisz W Diatta J amp Haerdter R (2010) Fertilizer consumption patterns in Central European countries ndash effect on actual yield development trends in 1986-2005 years - a comparative study of the Czech Republic and Poland Journal of Central European Agriculture Vol 11 No 1 pp 73-82 ISSN 1332-9049
IFADATA Statistics online (2011) wwwfertilizerorgifastatisticsifadata datalineasp (Access 20110524)
Jongman R Bunce R amp Metzger R (2006) Objectives and applications of a statistical environmental stratification of Europe Landscape Ecology 21 409-419 ISSN 1572-9761
Karlen D Ditzler C amp Andrews S (2003) Soil quality why and how Geoderma Vol 114 pp 145-156 ISSN 0016-7061
Kelch D amp Osborne S (2001) Crop production capacity in EuropePrime Economic Research ServiceUSDA Agricultural outlookMarch 2001 19-23 ISSN 0099-1066
Marschner H (1991) Mechanisms of adaptation of plants to acid soils Plant and Soil 134 1-20 ISSN 1573-5036
Neumann K Verburg P amp Stehfest E (2010) The yield gap of global production a spatial analysis Agricultural Systems Vol 103 pp 316-326 ISSN 0308-521X
Nikolova M (1998) The soil potassium resources and the efficiency of potassium fertilizers in Bulgaria Nikola Poushkarow Inst of Soil Science and Agroecology Sofia Bulgaria IPI Country Report 12 39 pp
Olesen J amp Bindi M (2002) Consequences of climate change for European agricultural productivity land use and policy European Journal of Agronomy Vol 16 pp 239-262 ISSN 1161-0301
Olesen J Trnka M amp Kersebaum K (2011) Impacts and adaptation of European crop production systems to climate change European Journal of Agronomy Vol 34 pp 96-112 ISSN 1161-0301
Plant J Whittaker A amp Demitriades B (2005) The geological and tectonic framework of Europe Geochemical Atlas of Europe Part 1 Background Information Methodology Ed Salminen R Maps GTK FOREGS 20 pp ISBN 951-690-956-6
Rabbinge R (1993) The ecological background of food production In Crop protection and sustainable agriculture Wiley Chichester (Ciba Foundation Symposium 177 2-29 ISBN 10 0471939447
Rabbinge R amp Diepen C (2000) Changes in agriculture and land use in Europe European Journal of Agronomy Vol 13 pp 85-100 ISSN 1161-0301
Reilly J Fuglie K (1998) Future yield growth in field crops what evidence exists Soil amp Tillage Research Vol 47 pp 275-290 ISSN 0168-1987
Roberts T (2006) Improving Nutrient Use Efficiency Proceedings of the IFA Agriculture Conference Optimizing Resource Use Efficiency for Sustainable Intensification of Agriculture 27 february-2 March 2006 Kunming China pp 8
Rosegrant M Paisner M amp Meijer S (2001) Global Food Projections to 2020 Emerging trends and alternative futures IFPRI pp 206 ISBN 0-89629-640-7
wwwintechopencom
Soil Fertility Improvement and Integrated Nutrient Management ndash A Global Perspective
182
Sinclair T Purcell L amp Sneller C (2004) Crop transformation and the challenge to increase yield potential Trends in Plant Science Vol 9 No 2 pp 70-75 ISSN 136085
Struik P amp Bonciarelli F (1997) Resource use at the cropping system level European Journal of Agronomy Vol 7 pp 133-143 ISSN 1161-0301
Supit I van Diepen C amp de Wit A (2010) Recent changes in the climatic yield potential of various crops in Europe Agricultural Systems Vol 103 pp 683-694 ISSN 0308-521X
wwwintechopencom
Soil Fertility Improvement and Integrated Nutrient Management - AGlobal PerspectiveEdited by Dr Joann Whalen
ISBN 978-953-307-945-5Hard cover 306 pagesPublisher InTechPublished online 24 February 2012Published in print edition February 2012
InTech EuropeUniversity Campus STeP Ri Slavka Krautzeka 83A 51000 Rijeka Croatia Phone +385 (51) 770 447 Fax +385 (51) 686 166wwwintechopencom
InTech ChinaUnit 405 Office Block Hotel Equatorial Shanghai No65 Yan An Road (West) Shanghai 200040 China
Phone +86-21-62489820 Fax +86-21-62489821
Soil Fertility Improvement and Integrated Nutrient Management A Global Perspective presents 15 invitedchapters written by leading soil fertility experts The book is organized around three themes The first theme isSoil Mapping and Soil Fertility Testing describing spatial heterogeneity in soil nutrients within natural andmanaged ecosystems as well as up-to-date soil testing methods and information on how soil fertility indicatorsrespond to agricultural practices The second theme Organic and Inorganic Amendments for Soil FertilityImprovement describes fertilizing materials that provide important amounts of essential nutrients forplantsThe third theme Integrated Nutrient Management Planning Case Studies From Central Europe SouthAmerica and Africa highlights the principles of integrated nutrient management Additionally it gives casestudies explaining how this approach has been implemented successfully across large geographic regionsand at local scales to improve the productivity of staple crops and forages
How to referenceIn order to correctly reference this scholarly work feel free to copy and paste the following
Witold Grzebisz and Jean Diatta (2012) Constraints and Solutions to Maintain Soil Productivity A Case Studyfrom Central Europe Soil Fertility Improvement and Integrated Nutrient Management - A Global PerspectiveDr Joann Whalen (Ed) ISBN 978-953-307-945-5 InTech Available fromhttpwwwintechopencombookssoil-fertility-improvement-and-integrated-nutrient-management-a-global-perspectiveconstraints-and-solutions-to-maintain-soil-productivity-a-case-study-from-central-europe
copy 2012 The Author(s) Licensee IntechOpen This is an open access articledistributed under the terms of the Creative Commons Attribution 30License which permits unrestricted use distribution and reproduction inany medium provided the original work is properly cited
Constraints and Solutions to Maintain Soil Productivity A Case Study from Central Europe
179
fertilizer use It has been well recognized that a balanced supply of external sources of slowly mobile elements such as phosphorus and potassium is broadly expected (Atkinson et al 2005 Struik amp Bonciarelli 1997) Consequently the average actual and attainable yields of main crops in CE countries are much more related to the soil-adjusted potential than to amounts of currently applied fertilizers As a result CE countries show at present much greater differences in agricultural production than at the end of the 80s
The observed unfavorable patterns of N fertilizer long-term consumption creates problems not only for agriculture production but are also potentially dangerous for the environment as a potential source of reactive nitrogen (Roberts 2006) There are three main questions to be urgently answered by specialists in all countries of the CE region i) do farmers really recognize an increasing yield gap ii) what is the reason for farmers and their advisory services to tolerate low efficiency of nitrogen iii) do farmers and advisory services recognize environmental aspects of the increasing amount of residual nitrogen In order to get answers to these questions one has to be familiar with factors contributing to the improvement in N fertilizer use efficiency
1 Farm management of N in terms of i) N rate quantification ii) time of N fertilizers application and iii) method of N fertilizers application
2 Management of nutrients responsible for the efficiency of N uptake and it in-plant transformation
3 Management of production factors other than N
The first problem is not only of technical nature because it affects in-season nitrogen use
efficiency and in turn actual yieldsrsquo variability However CE countries representing the
restoration type of yield development but at the same time unbalanced pattern of
consumed fertilizers do not indicate needs for increasing actually applied N rates This
strategy is to some extent the core of yield improvement in countries presenting stagnated
type of fertilizersrsquo management provided that any increase in N use will be compensated by
adequate amounts of applied phosphorus and potassium
It could finally be concluded that the realization of both goals of agricultural production in
the CE countries ie i) long-term yield stabilization and even its increase and ii) unit
productivity of the applied fertilizer N increase in turn decreasing amounts of the residual
N requires in the coming future changes in the structure of fertilizersrsquo consumption
keeping in the Unbalanced group of countries the same level of applied fertilizers The
problem of nutrients supply to a growing plant does not however refer only to the balanced
amounts of the applied fertilizers but also to the crop accessibility to soil natural nutrient
pools This problem is inherently related to conditions of root system growth in the soil
body There are a lot of factors limiting roots accessibility to water and nutrients even in
soils of high natural fertility which have been forgotten in the last 50 years but the most
important is soil acidy and related toxicity of aluminum (Atkinson et al 2005 Diatta et al
2010 Marschner 1991 Struik and Bonciarelli 1997) The key strategic target for farmers is to
increase soil volume directly occupied by plant roots in order to improve their access to
unavailable pools of nutrients Three main areas of soil productivity improvement via
increasing crop plants accessibility to nutrients in the subsoil at least may be considered i)
regulation of soil reaction ii) increase of organic matter content iii) removing of any kind of
hardpans It seems highly probable that in the case of Poland all three groups of measures
wwwintechopencom
Soil Fertility Improvement and Integrated Nutrient Management ndash A Global Perspective
180
are important In other countries of the CE soil acidity should be considered as an
agronomical problem for farmers conducting production on Luvisols
7 References
Atkinson A Black K amp Dawson L (2005) Prospects advantages and limitations of future crop production systems dependent upon the management processes Annals of Applied Biology Vol 146 pp 203-215 ISSN 1744-7348
Batjes H (2002) Carbon and nitrogen stocks in the soils of Central and Eastern Europe Soil Use Management Vol 18 pp 324-329 ISSN 1475-2743
Cakmak I (2005) The role of potassium in alleviating detrimental effects of abiotic stresses in plants Journal of Plant Nutrition Soil Science Vol 168 pp 521-530 ISSN 1436-8730
Catt J (2001) The agricultural importance of loess Earth-Science Reviews Vol 54 pp 213-229 ISSN 0012-8252
Cochrane N (2004) EU Enlargement Implications for US_EU agricultural relations US-EU Food and Agriculture ComaprisonWRS-04-04 78-86 Available online at
httpwwwersusdagovpublicationsWRS0404WRS0404pdf (Access 20110524)
Csatho P Sisak I amp Radimszky L (2007) Agriculture as a source of phosphorus causing eutrophication in Central and Eastern Europe Soil Use management Vol 23 (suppl 1) pp 36-56 ISSN 1475-2743
Csatho P amp Radimszky L (2009) Two Worlds within EU27 Sharp Contrasts in Organic and Mineral Nitrogen-Phosphorus Use Nitrogen-Phosphorus Balances and Soil Phosphorus Status Widening and Deepening Gap between Western and Central Europe Communications in Soil Science and Plant Analysis Vol 40 pp 999-1019 ISSN 0010-3624
Diatta J Bocianowski J amp Skubiszewska A (2010) Sulphate-based aluminum phytotoxicity mitigation under strong soil acidification Fresenius Environmental Bulletin Vol 19 No 12b pp 3185-3192 ISSN 1018-4619
Dibb D (2000) The mysteries (myths) of nutrient use efficiency Better Crops Vol 84 No 3 pp 3ndash5 ISSN 0006-0089
Dobermann A amp Cassman K (2002) Plant nutrient management for enhanced productivity in intensive grain production systems of the United States and Asia Plant and Soil Vol 247 pp 153-175 ISSN 1573-5036
Evans L amp Fisher R (1999) Yield potential its definition measurement and significance Crop Science Vol 39 pp 1544-1551 ISSN 1896-0782
Falloon P amp Betts R (2010) Climate impacts on European agriculture and water management in the context of adaptation and mitigation ndash the importance of integrated approach Science of Total Environment Vol 408 pp 5667-5687 ISSN 0048-9697
FAOSTAT Available online at httpfaostatfaoorgdefaultaspx (Access 20110524) Fixen P (2004) Phases in narrowing the yield gap Better Crops Vol 88 No 4 p 3 ISSN
0006-0089 Fronzek S amp Carter T (2007) Assessing uncertainties in climate change impacts on
resource potential for Europe based on projections from RCMs and GCMs Climate Change Vol 81 pp 357-371 ISSN 1758-6798
wwwintechopencom
Constraints and Solutions to Maintain Soil Productivity A Case Study from Central Europe
181
Grzebisz W amp Fotyma M (2007) Recommendations and use of potassium fertilizers in Central-Eastern Europe (CEE) In Proceedings International Fertiliser Society No 621 York UK pp 24 ISBN 978-0-85310-258-8
Grzebisz W Diatta J amp Haerdter R (2010) Fertilizer consumption patterns in Central European countries ndash effect on actual yield development trends in 1986-2005 years - a comparative study of the Czech Republic and Poland Journal of Central European Agriculture Vol 11 No 1 pp 73-82 ISSN 1332-9049
IFADATA Statistics online (2011) wwwfertilizerorgifastatisticsifadata datalineasp (Access 20110524)
Jongman R Bunce R amp Metzger R (2006) Objectives and applications of a statistical environmental stratification of Europe Landscape Ecology 21 409-419 ISSN 1572-9761
Karlen D Ditzler C amp Andrews S (2003) Soil quality why and how Geoderma Vol 114 pp 145-156 ISSN 0016-7061
Kelch D amp Osborne S (2001) Crop production capacity in EuropePrime Economic Research ServiceUSDA Agricultural outlookMarch 2001 19-23 ISSN 0099-1066
Marschner H (1991) Mechanisms of adaptation of plants to acid soils Plant and Soil 134 1-20 ISSN 1573-5036
Neumann K Verburg P amp Stehfest E (2010) The yield gap of global production a spatial analysis Agricultural Systems Vol 103 pp 316-326 ISSN 0308-521X
Nikolova M (1998) The soil potassium resources and the efficiency of potassium fertilizers in Bulgaria Nikola Poushkarow Inst of Soil Science and Agroecology Sofia Bulgaria IPI Country Report 12 39 pp
Olesen J amp Bindi M (2002) Consequences of climate change for European agricultural productivity land use and policy European Journal of Agronomy Vol 16 pp 239-262 ISSN 1161-0301
Olesen J Trnka M amp Kersebaum K (2011) Impacts and adaptation of European crop production systems to climate change European Journal of Agronomy Vol 34 pp 96-112 ISSN 1161-0301
Plant J Whittaker A amp Demitriades B (2005) The geological and tectonic framework of Europe Geochemical Atlas of Europe Part 1 Background Information Methodology Ed Salminen R Maps GTK FOREGS 20 pp ISBN 951-690-956-6
Rabbinge R (1993) The ecological background of food production In Crop protection and sustainable agriculture Wiley Chichester (Ciba Foundation Symposium 177 2-29 ISBN 10 0471939447
Rabbinge R amp Diepen C (2000) Changes in agriculture and land use in Europe European Journal of Agronomy Vol 13 pp 85-100 ISSN 1161-0301
Reilly J Fuglie K (1998) Future yield growth in field crops what evidence exists Soil amp Tillage Research Vol 47 pp 275-290 ISSN 0168-1987
Roberts T (2006) Improving Nutrient Use Efficiency Proceedings of the IFA Agriculture Conference Optimizing Resource Use Efficiency for Sustainable Intensification of Agriculture 27 february-2 March 2006 Kunming China pp 8
Rosegrant M Paisner M amp Meijer S (2001) Global Food Projections to 2020 Emerging trends and alternative futures IFPRI pp 206 ISBN 0-89629-640-7
wwwintechopencom
Soil Fertility Improvement and Integrated Nutrient Management ndash A Global Perspective
182
Sinclair T Purcell L amp Sneller C (2004) Crop transformation and the challenge to increase yield potential Trends in Plant Science Vol 9 No 2 pp 70-75 ISSN 136085
Struik P amp Bonciarelli F (1997) Resource use at the cropping system level European Journal of Agronomy Vol 7 pp 133-143 ISSN 1161-0301
Supit I van Diepen C amp de Wit A (2010) Recent changes in the climatic yield potential of various crops in Europe Agricultural Systems Vol 103 pp 683-694 ISSN 0308-521X
wwwintechopencom
Soil Fertility Improvement and Integrated Nutrient Management - AGlobal PerspectiveEdited by Dr Joann Whalen
ISBN 978-953-307-945-5Hard cover 306 pagesPublisher InTechPublished online 24 February 2012Published in print edition February 2012
InTech EuropeUniversity Campus STeP Ri Slavka Krautzeka 83A 51000 Rijeka Croatia Phone +385 (51) 770 447 Fax +385 (51) 686 166wwwintechopencom
InTech ChinaUnit 405 Office Block Hotel Equatorial Shanghai No65 Yan An Road (West) Shanghai 200040 China
Phone +86-21-62489820 Fax +86-21-62489821
Soil Fertility Improvement and Integrated Nutrient Management A Global Perspective presents 15 invitedchapters written by leading soil fertility experts The book is organized around three themes The first theme isSoil Mapping and Soil Fertility Testing describing spatial heterogeneity in soil nutrients within natural andmanaged ecosystems as well as up-to-date soil testing methods and information on how soil fertility indicatorsrespond to agricultural practices The second theme Organic and Inorganic Amendments for Soil FertilityImprovement describes fertilizing materials that provide important amounts of essential nutrients forplantsThe third theme Integrated Nutrient Management Planning Case Studies From Central Europe SouthAmerica and Africa highlights the principles of integrated nutrient management Additionally it gives casestudies explaining how this approach has been implemented successfully across large geographic regionsand at local scales to improve the productivity of staple crops and forages
How to referenceIn order to correctly reference this scholarly work feel free to copy and paste the following
Witold Grzebisz and Jean Diatta (2012) Constraints and Solutions to Maintain Soil Productivity A Case Studyfrom Central Europe Soil Fertility Improvement and Integrated Nutrient Management - A Global PerspectiveDr Joann Whalen (Ed) ISBN 978-953-307-945-5 InTech Available fromhttpwwwintechopencombookssoil-fertility-improvement-and-integrated-nutrient-management-a-global-perspectiveconstraints-and-solutions-to-maintain-soil-productivity-a-case-study-from-central-europe
copy 2012 The Author(s) Licensee IntechOpen This is an open access articledistributed under the terms of the Creative Commons Attribution 30License which permits unrestricted use distribution and reproduction inany medium provided the original work is properly cited
Soil Fertility Improvement and Integrated Nutrient Management ndash A Global Perspective
180
are important In other countries of the CE soil acidity should be considered as an
agronomical problem for farmers conducting production on Luvisols
7 References
Atkinson A Black K amp Dawson L (2005) Prospects advantages and limitations of future crop production systems dependent upon the management processes Annals of Applied Biology Vol 146 pp 203-215 ISSN 1744-7348
Batjes H (2002) Carbon and nitrogen stocks in the soils of Central and Eastern Europe Soil Use Management Vol 18 pp 324-329 ISSN 1475-2743
Cakmak I (2005) The role of potassium in alleviating detrimental effects of abiotic stresses in plants Journal of Plant Nutrition Soil Science Vol 168 pp 521-530 ISSN 1436-8730
Catt J (2001) The agricultural importance of loess Earth-Science Reviews Vol 54 pp 213-229 ISSN 0012-8252
Cochrane N (2004) EU Enlargement Implications for US_EU agricultural relations US-EU Food and Agriculture ComaprisonWRS-04-04 78-86 Available online at
httpwwwersusdagovpublicationsWRS0404WRS0404pdf (Access 20110524)
Csatho P Sisak I amp Radimszky L (2007) Agriculture as a source of phosphorus causing eutrophication in Central and Eastern Europe Soil Use management Vol 23 (suppl 1) pp 36-56 ISSN 1475-2743
Csatho P amp Radimszky L (2009) Two Worlds within EU27 Sharp Contrasts in Organic and Mineral Nitrogen-Phosphorus Use Nitrogen-Phosphorus Balances and Soil Phosphorus Status Widening and Deepening Gap between Western and Central Europe Communications in Soil Science and Plant Analysis Vol 40 pp 999-1019 ISSN 0010-3624
Diatta J Bocianowski J amp Skubiszewska A (2010) Sulphate-based aluminum phytotoxicity mitigation under strong soil acidification Fresenius Environmental Bulletin Vol 19 No 12b pp 3185-3192 ISSN 1018-4619
Dibb D (2000) The mysteries (myths) of nutrient use efficiency Better Crops Vol 84 No 3 pp 3ndash5 ISSN 0006-0089
Dobermann A amp Cassman K (2002) Plant nutrient management for enhanced productivity in intensive grain production systems of the United States and Asia Plant and Soil Vol 247 pp 153-175 ISSN 1573-5036
Evans L amp Fisher R (1999) Yield potential its definition measurement and significance Crop Science Vol 39 pp 1544-1551 ISSN 1896-0782
Falloon P amp Betts R (2010) Climate impacts on European agriculture and water management in the context of adaptation and mitigation ndash the importance of integrated approach Science of Total Environment Vol 408 pp 5667-5687 ISSN 0048-9697
FAOSTAT Available online at httpfaostatfaoorgdefaultaspx (Access 20110524) Fixen P (2004) Phases in narrowing the yield gap Better Crops Vol 88 No 4 p 3 ISSN
0006-0089 Fronzek S amp Carter T (2007) Assessing uncertainties in climate change impacts on
resource potential for Europe based on projections from RCMs and GCMs Climate Change Vol 81 pp 357-371 ISSN 1758-6798
wwwintechopencom
Constraints and Solutions to Maintain Soil Productivity A Case Study from Central Europe
181
Grzebisz W amp Fotyma M (2007) Recommendations and use of potassium fertilizers in Central-Eastern Europe (CEE) In Proceedings International Fertiliser Society No 621 York UK pp 24 ISBN 978-0-85310-258-8
Grzebisz W Diatta J amp Haerdter R (2010) Fertilizer consumption patterns in Central European countries ndash effect on actual yield development trends in 1986-2005 years - a comparative study of the Czech Republic and Poland Journal of Central European Agriculture Vol 11 No 1 pp 73-82 ISSN 1332-9049
IFADATA Statistics online (2011) wwwfertilizerorgifastatisticsifadata datalineasp (Access 20110524)
Jongman R Bunce R amp Metzger R (2006) Objectives and applications of a statistical environmental stratification of Europe Landscape Ecology 21 409-419 ISSN 1572-9761
Karlen D Ditzler C amp Andrews S (2003) Soil quality why and how Geoderma Vol 114 pp 145-156 ISSN 0016-7061
Kelch D amp Osborne S (2001) Crop production capacity in EuropePrime Economic Research ServiceUSDA Agricultural outlookMarch 2001 19-23 ISSN 0099-1066
Marschner H (1991) Mechanisms of adaptation of plants to acid soils Plant and Soil 134 1-20 ISSN 1573-5036
Neumann K Verburg P amp Stehfest E (2010) The yield gap of global production a spatial analysis Agricultural Systems Vol 103 pp 316-326 ISSN 0308-521X
Nikolova M (1998) The soil potassium resources and the efficiency of potassium fertilizers in Bulgaria Nikola Poushkarow Inst of Soil Science and Agroecology Sofia Bulgaria IPI Country Report 12 39 pp
Olesen J amp Bindi M (2002) Consequences of climate change for European agricultural productivity land use and policy European Journal of Agronomy Vol 16 pp 239-262 ISSN 1161-0301
Olesen J Trnka M amp Kersebaum K (2011) Impacts and adaptation of European crop production systems to climate change European Journal of Agronomy Vol 34 pp 96-112 ISSN 1161-0301
Plant J Whittaker A amp Demitriades B (2005) The geological and tectonic framework of Europe Geochemical Atlas of Europe Part 1 Background Information Methodology Ed Salminen R Maps GTK FOREGS 20 pp ISBN 951-690-956-6
Rabbinge R (1993) The ecological background of food production In Crop protection and sustainable agriculture Wiley Chichester (Ciba Foundation Symposium 177 2-29 ISBN 10 0471939447
Rabbinge R amp Diepen C (2000) Changes in agriculture and land use in Europe European Journal of Agronomy Vol 13 pp 85-100 ISSN 1161-0301
Reilly J Fuglie K (1998) Future yield growth in field crops what evidence exists Soil amp Tillage Research Vol 47 pp 275-290 ISSN 0168-1987
Roberts T (2006) Improving Nutrient Use Efficiency Proceedings of the IFA Agriculture Conference Optimizing Resource Use Efficiency for Sustainable Intensification of Agriculture 27 february-2 March 2006 Kunming China pp 8
Rosegrant M Paisner M amp Meijer S (2001) Global Food Projections to 2020 Emerging trends and alternative futures IFPRI pp 206 ISBN 0-89629-640-7
wwwintechopencom
Soil Fertility Improvement and Integrated Nutrient Management ndash A Global Perspective
182
Sinclair T Purcell L amp Sneller C (2004) Crop transformation and the challenge to increase yield potential Trends in Plant Science Vol 9 No 2 pp 70-75 ISSN 136085
Struik P amp Bonciarelli F (1997) Resource use at the cropping system level European Journal of Agronomy Vol 7 pp 133-143 ISSN 1161-0301
Supit I van Diepen C amp de Wit A (2010) Recent changes in the climatic yield potential of various crops in Europe Agricultural Systems Vol 103 pp 683-694 ISSN 0308-521X
wwwintechopencom
Soil Fertility Improvement and Integrated Nutrient Management - AGlobal PerspectiveEdited by Dr Joann Whalen
ISBN 978-953-307-945-5Hard cover 306 pagesPublisher InTechPublished online 24 February 2012Published in print edition February 2012
InTech EuropeUniversity Campus STeP Ri Slavka Krautzeka 83A 51000 Rijeka Croatia Phone +385 (51) 770 447 Fax +385 (51) 686 166wwwintechopencom
InTech ChinaUnit 405 Office Block Hotel Equatorial Shanghai No65 Yan An Road (West) Shanghai 200040 China
Phone +86-21-62489820 Fax +86-21-62489821
Soil Fertility Improvement and Integrated Nutrient Management A Global Perspective presents 15 invitedchapters written by leading soil fertility experts The book is organized around three themes The first theme isSoil Mapping and Soil Fertility Testing describing spatial heterogeneity in soil nutrients within natural andmanaged ecosystems as well as up-to-date soil testing methods and information on how soil fertility indicatorsrespond to agricultural practices The second theme Organic and Inorganic Amendments for Soil FertilityImprovement describes fertilizing materials that provide important amounts of essential nutrients forplantsThe third theme Integrated Nutrient Management Planning Case Studies From Central Europe SouthAmerica and Africa highlights the principles of integrated nutrient management Additionally it gives casestudies explaining how this approach has been implemented successfully across large geographic regionsand at local scales to improve the productivity of staple crops and forages
How to referenceIn order to correctly reference this scholarly work feel free to copy and paste the following
Witold Grzebisz and Jean Diatta (2012) Constraints and Solutions to Maintain Soil Productivity A Case Studyfrom Central Europe Soil Fertility Improvement and Integrated Nutrient Management - A Global PerspectiveDr Joann Whalen (Ed) ISBN 978-953-307-945-5 InTech Available fromhttpwwwintechopencombookssoil-fertility-improvement-and-integrated-nutrient-management-a-global-perspectiveconstraints-and-solutions-to-maintain-soil-productivity-a-case-study-from-central-europe
copy 2012 The Author(s) Licensee IntechOpen This is an open access articledistributed under the terms of the Creative Commons Attribution 30License which permits unrestricted use distribution and reproduction inany medium provided the original work is properly cited

copy 2012 The Author(s) Licensee IntechOpen This is an open access articledistributed under the terms of the Creative Commons Attribution 30License which permits unrestricted use distribution and reproduction inany medium provided the original work is properly cited