constraining the galaxy mass content in the core of a383...
TRANSCRIPT
MNRAS 447, 1224–1241 (2015) doi:10.1093/mnras/stu2534
Constraining the galaxy mass content in the core of A383 using velocitydispersion measurements for individual cluster members
A. Monna,1,2‹ S. Seitz,1,2 A. Zitrin,3† M. J. Geller,4 C. Grillo,5 A. Mercurio,6
N. Greisel,1,2 A. Halkola,7 S. H. Suyu,8 M. Postman,9 P. Rosati,10 I. Balestra,2,11
A. Biviano,11 D. Coe,9 D. G. Fabricant,4 H. S. Hwang12 and A. Koekemoer9
1University Observatory Munich, Scheinerstrasse 1, D-81679 Munich, Germany2Max Planck Institute for Extraterrestrial Physics, Giessenbachstrasse, D-85748 Garching, Germany3Cahill Center for Astronomy and Astrophysics, California Institute of Technology, MS 249-17, Pasadena, CA 91125, USA4Harvad–Smithsonian Astrophysical Observatory, 60 Garden St, Cambridge, MA 02138, USA5Dark Cosmology Centre, Niels Bohr Institute, University of Copenhagen, Juliane Maries Vej 30, DK-2100 Copenhagen, Denmark6INAF/Osservatorio Astronomico di Capodimonte, Via Moiariello 16, I-80131 Napoli, Italy7Institute of Medical Engineering, University of Lubeck, Ratzeburger Allee 160, D-23562 Lubeck, Germany8Institute of Astronomy and Astrophysics, Academia Sinica, PO Box 23-141, Taipei 10617, Taiwan9Space Telescope Science Institute, 3700 San Martin Drive, Baltimore, MD 21208, USA10Dipartimento di Fisica e Scienze della Terra, Univ. degli Studi di Ferrara, via Saragat 1, I-44122 Ferrara, Italy11INAF-Osservatorio Astronomico di Trieste, via G.B. Tiepolo 11, I-34143 Trieste, Italy12Korea Institute for Advanced Study, 85 Hoegiro, Dongdaemun-gu, Seoul 130-722, Republic of Korea
Accepted 2014 November 28. Received 2014 November 27; in original form 2014 October 29
ABSTRACTWe use velocity dispersion measurements of 21 individual cluster members in the core ofAbell 383, obtained with Multiple Mirror Telescope Hectospec, to separate the galaxy and thesmooth dark halo (DH) lensing contributions. While lensing usually constrains the overall,projected mass density, the innovative use of velocity dispersion measurements as a proxy formasses of individual cluster members breaks inherent degeneracies and allows us to (a) refinethe constraints on single galaxy masses and on the galaxy mass-to-light scaling relation and,as a result, (b) refine the constraints on the DM-only map, a high-end goal of lens modelling.The knowledge of cluster member velocity dispersions improves the fit by 17 per cent interms of the image reproduction χ2, or 20 per cent in terms of the rms. The constraints onthe mass parameters improve by ∼10 per cent for the DH, while for the galaxy component,they are refined correspondingly by ∼50 per cent, including the galaxy halo truncation radius.For an L∗ galaxy with M∗
B = −20.96, for example, we obtain best-fitting truncation radiusr∗
tr = 20.5+9.6−6.7 kpc and velocity dispersion σ ∗ = 324 ± 17 km s−1. Moreover, by performing
the surface brightness reconstruction of the southern giant arc, we improve the constraintson rtr of two nearby cluster members, which have measured velocity dispersions, by morethan ∼30 per cent. We estimate the stripped mass for these two galaxies, getting results thatare consistent with numerical simulations. In the future, we plan to apply this analysis to othergalaxy clusters for which velocity dispersions of member galaxies are available.
Key words: gravitational lensing: strong – galaxies: clusters: general – galaxies: clusters: in-dividual: A383 – galaxies: haloes – dark matter.
1 IN T RO D U C T I O N
Gravitational lensing and its modelling represent reliable and impor-tant tools to map the mass distribution of structures in the Universe,from galaxies through galaxy groups and clusters, up to the large-
�E-mail: [email protected]†Hubble Fellow.
scale structure (e.g. Schneider 2003; Bartelmann 2010; Kneib &Natarajan 2011). One of the main motivations of using lensing isits ability to map the total projected mass density of the lens andthus shed light on the distribution and properties of the otherwiseinvisible dark matter (DM).
Modelling of gravitational lensing is usually performed in twoways. The first, often dubbed ‘non-parametric’, elegantly makes noprior assumptions on the underlying mass distribution, but due to thetypical low number of constraints usually yields a low-resolution
C© 2014 The AuthorsPublished by Oxford University Press on behalf of the Royal Astronomical Society
at California Institute of T
echnology on April 9, 2015
http://mnras.oxfordjournals.org/
Dow
nloaded from
Constraining the galaxy mass content in A383 1225
result that lacks predictive power (see, Abdelsalam, Saha &Williams 1998; Diego et al. 2005; Coe et al. 2008). Alternatively,‘parametric’ mass models exploit prior knowledge or assumptionsregarding the general form of the underlying mass distribution. Themass parameters are obtained by producing many mass models, eachwith a different set of parameter values, and looking for the solu-tion which best reproduces the observations. Despite their modeldependence, these methods allow for a very high spatial resolution,and typically exhibit high predictive power to reproduce additionalconstraints such as multiple images not used as inputs (see e.g. Julloet al. 2007; Zitrin et al. 2009; Grillo et al. 2014; Monna et al. 2014).In the case of galaxy clusters acting as lenses, the cluster DM compo-nent usually follows descriptions obtained from numerical simula-tions, such as an elliptical (Navarro, Frenk & White 1997, hereafterNFW) halo or alike. The galaxy mass component of the cluster isgiven by the combination of all the cluster member masses whichare typically modelled as power-law profiles, isothermal spheres ortheir variants (e.g. see Natarajan & Kneib 1997; Kneib & Natara-jan 2011). The combination of the baryonic and DM componentsyields the total projected surface mass density, which is the quan-tity probed in the lensing analysis. In that respect, it is difficultto properly separate the baryonic and DM galaxy components, aslensing probes only their joint contribution and degeneracies existbetween the different parameters which could explain the same setof constraints. To infer the masses of the galaxies directly from thelight, typically, luminosity–velocity dispersion–mass scaling rela-tions are used. Physical properties of elliptical galaxies are globallywell described by power-law relations which relate them to theirobserved luminosity, both for galaxies in field and in clusters. TheFundamental Plane (see Djorgovski & Davis 1987; Dressler et al.1987; Faber et al. 1987; Bender, Burstein & Faber 1992) gives therelation between effective radius re, central velocity dispersion σ 0
and mean surface brightness Ie within re of elliptical galaxies. Thecentral velocity dispersion σ 0 is related to the galaxy luminosityLe through the Faber–Jackson relation (Le ∝ σα
0 ; Faber & Jackson1976). However, it has been shown that bright galaxies, like thebrightest cluster galaxies (BCGs), can deviate substantially fromthe scaling relation (see von der Linden et al. 2007; Postman et al.2012b; Kormendy & Bender 2013).
In Eichner et al. (2013), we investigated the halo properties ofthe cluster members of MACS1206.2-0847 through strong lensinganalysis. We broke the degeneracy between the halo velocity disper-sion σ and size rtr, improving the constraints on the σ–rtr relationthrough the surface brightness reconstruction of the giant arc in thecore of the cluster. However, the large scatter in the FundamentalPlane (or, Faber–Jackson relation) inherently introduces modellingbiases in lensing analyses which inevitably assume an analytic scal-ing relation for the M–L–σ planes. Direct velocity dispersion mea-surements of galaxies (typically, elliptical cluster members) allowa direct estimate of their enclosed mass, through the virial theoremthat reduces to ρ(r) = σ 2
2πGrfor an isothermal sphere, for example.
These mass estimates can be used individually for each lens galaxyinstead of applying an idealized analytic scaling relation. This willespecially be significant for bright and massive cluster galaxies gov-erning the lens, i.e. galaxies within, or close to, the critical curves,as these affect the lensing properties the most. For that reason, wehave embarked on an innovative project using Hectospec on theMultiple Mirror Telescope (MMT) to measure the velocity disper-sion of individual cluster members in various cluster lenses. Weaim to obtain an independent measure of the mass of each relevantcluster galaxy, so that internal degeneracies can be broken and theconstraints on the DM-only component improved. We present here
the first case-study we perform using these velocity dispersion data,analysing the strong-lensing features in the galaxy cluster Abell383 (hereafter A383) at zcl = 0.189, while examining the extent ofimprovement obtained by using these additional mass proxies.
The mass distribution of A383 has been previously traced throughgravitational lensing analyses (see Smith et al. 2001, 2005; Sandet al. 2004), also combined with dynamical analyses (see Sand et al.2008). Newman et al. (2011) combined strong and weak lensinganalyses with galaxy kinematics and X-ray data to trace the massdistribution of the cluster out to 1.5 Mpc. They disentangled thebaryonic and DM components in the inner region of the cluster,finding a shallow slope β for the density profile ρ ∝ r−β of the DMon small scales. Geller et al. (2014) presented a detailed dynamicalanalysis of A383 using 2360 new redshift measurements of galax-ies in the region around the cluster. They traced the cluster massdistribution up to about 7 Mpc from the cluster centre, obtainingresults that are in good agreement with mass profiles derived fromweak lensing analyses, in particular at radial distances larger thanR200. Zitrin et al. (2011) performed a detailed strong lensing recon-struction of the cluster using the well-known giant arcs and severalnewly identified lensed systems using the deep 16-band HubbleSpace Telescope (HST) photometric data set from the CLASH sur-vey (Postman et al. 2012a). They used nine lensed systems witha total of 27 multiple images to measure in detail the total massdistribution and profile in the cluster core.
In this work, we perform an accurate strong lensing analysis ofA383 using velocity dispersion measurements for several clustermembers as additional constraints. We investigate the impact ofsuch information on the accuracy of the lensing reconstruction, onthe constraints for the individual galaxy masses and on the globalσ–L relation. In addition, we perform the surface brightness recon-struction of the southern tangential giant arc lensed between severalcluster members to set stronger constraints on the mass profiles ofthese individual galaxies and directly measure their size.
The paper is organized as follows. In Section 2, we describe thephotometric and spectroscopic data set. In Section 3, we presentthe photometric catalogues and the cluster member selection. InSection 4, we describe the strong lensing analysis, the mass com-ponents included in the mass model and the lensed systems used asconstraints. In Section 5, we present the results of the strong lensinganalyses performed using as constraints the observed positions oflensed images. In Section 6, we perform the surface brightness re-construction of the southern giant arc to refine the constraints on themass profile of cluster members close to the arc. Summary and con-clusions are given in Section 7. Throughout the paper, we assume acosmological model with Hubble constant H0 = 70 km s−1 Mpc−1
and density parameters �m = 0.3 and � = 0.7. Magnitudes aregiven in the AB system.
2 PH OTO M E T R I C A N D S P E C T RO S C O P I CDATA SET
As part of the CLASH survey, A383 was observed (between2010 November and 2011 March) in 16 filters covering theUV, optical and NIR range with the HST Advanced Cam-era for Surveys (ACS) and the HST Wide Field Camera 3(WFC3) with its ultraviolet and visible light (UVIS) and in-frared (IR) channels. The photometric data set1 is composedof HST mosaic drizzled 65 mas pixel−1 images generated with
1 available at http://archive.stsci.edu/prepds/clash/.
MNRAS 447, 1224–1241 (2015)
at California Institute of T
echnology on April 9, 2015
http://mnras.oxfordjournals.org/
Dow
nloaded from
1226 A. Monna et al.
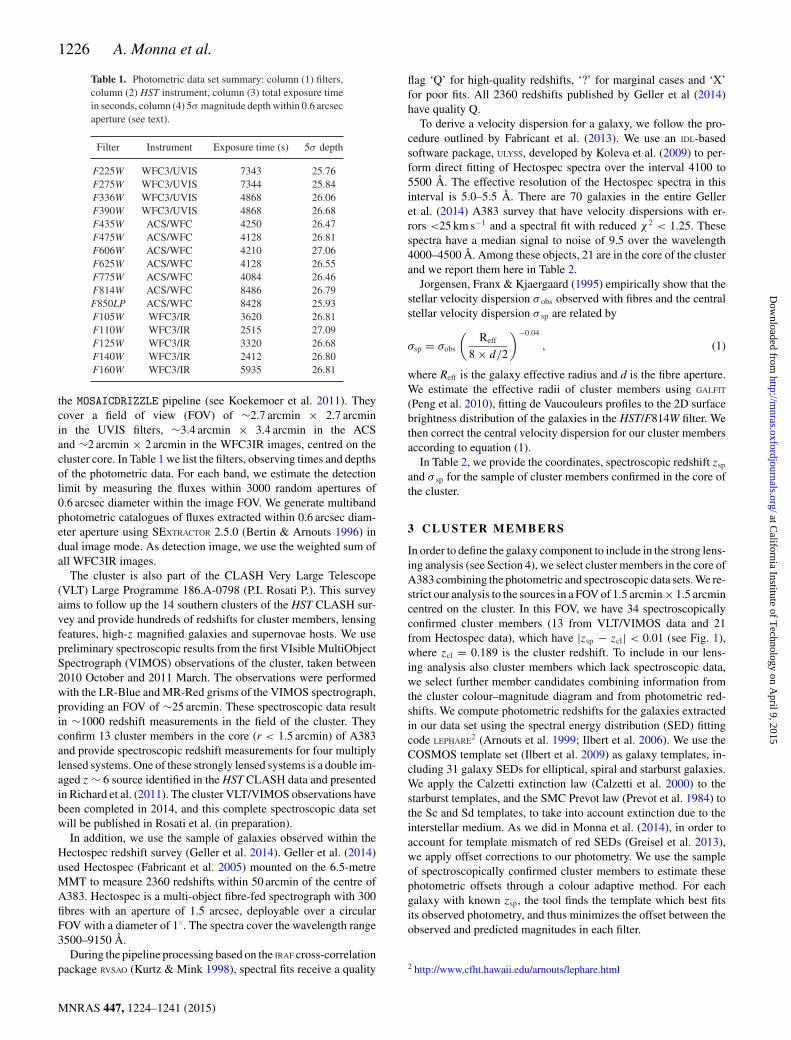
Table 1. Photometric data set summary: column (1) filters,column (2) HST instrument, column (3) total exposure timein seconds, column (4) 5σ magnitude depth within 0.6 arcsecaperture (see text).
Filter Instrument Exposure time (s) 5σ depth
F225W WFC3/UVIS 7343 25.76F275W WFC3/UVIS 7344 25.84F336W WFC3/UVIS 4868 26.06F390W WFC3/UVIS 4868 26.68F435W ACS/WFC 4250 26.47F475W ACS/WFC 4128 26.81F606W ACS/WFC 4210 27.06F625W ACS/WFC 4128 26.55F775W ACS/WFC 4084 26.46F814W ACS/WFC 8486 26.79F850LP ACS/WFC 8428 25.93F105W WFC3/IR 3620 26.81F110W WFC3/IR 2515 27.09F125W WFC3/IR 3320 26.68F140W WFC3/IR 2412 26.80F160W WFC3/IR 5935 26.81
the MOSAICDRIZZLE pipeline (see Koekemoer et al. 2011). Theycover a field of view (FOV) of ∼2.7 arcmin × 2.7 arcminin the UVIS filters, ∼3.4 arcmin × 3.4 arcmin in the ACSand ∼2 arcmin × 2 arcmin in the WFC3IR images, centred on thecluster core. In Table 1 we list the filters, observing times and depthsof the photometric data. For each band, we estimate the detectionlimit by measuring the fluxes within 3000 random apertures of0.6 arcsec diameter within the image FOV. We generate multibandphotometric catalogues of fluxes extracted within 0.6 arcsec diam-eter aperture using SEXTRACTOR 2.5.0 (Bertin & Arnouts 1996) indual image mode. As detection image, we use the weighted sum ofall WFC3IR images.
The cluster is also part of the CLASH Very Large Telescope(VLT) Large Programme 186.A-0798 (P.I. Rosati P.). This surveyaims to follow up the 14 southern clusters of the HST CLASH sur-vey and provide hundreds of redshifts for cluster members, lensingfeatures, high-z magnified galaxies and supernovae hosts. We usepreliminary spectroscopic results from the first VIsible MultiObjectSpectrograph (VIMOS) observations of the cluster, taken between2010 October and 2011 March. The observations were performedwith the LR-Blue and MR-Red grisms of the VIMOS spectrograph,providing an FOV of ∼25 arcmin. These spectroscopic data resultin ∼1000 redshift measurements in the field of the cluster. Theyconfirm 13 cluster members in the core (r < 1.5 arcmin) of A383and provide spectroscopic redshift measurements for four multiplylensed systems. One of these strongly lensed systems is a double im-aged z ∼ 6 source identified in the HST CLASH data and presentedin Richard et al. (2011). The cluster VLT/VIMOS observations havebeen completed in 2014, and this complete spectroscopic data setwill be published in Rosati et al. (in preparation).
In addition, we use the sample of galaxies observed within theHectospec redshift survey (Geller et al. 2014). Geller et al. (2014)used Hectospec (Fabricant et al. 2005) mounted on the 6.5-metreMMT to measure 2360 redshifts within 50 arcmin of the centre ofA383. Hectospec is a multi-object fibre-fed spectrograph with 300fibres with an aperture of 1.5 arcsec, deployable over a circularFOV with a diameter of 1◦. The spectra cover the wavelength range3500–9150 Å.
During the pipeline processing based on the IRAF cross-correlationpackage RVSAO (Kurtz & Mink 1998), spectral fits receive a quality
flag ‘Q’ for high-quality redshifts, ‘?’ for marginal cases and ‘X’for poor fits. All 2360 redshifts published by Geller et al (2014)have quality Q.
To derive a velocity dispersion for a galaxy, we follow the pro-cedure outlined by Fabricant et al. (2013). We use an IDL-basedsoftware package, ULYSS, developed by Koleva et al. (2009) to per-form direct fitting of Hectospec spectra over the interval 4100 to5500 Å. The effective resolution of the Hectospec spectra in thisinterval is 5.0–5.5 Å. There are 70 galaxies in the entire Gelleret al. (2014) A383 survey that have velocity dispersions with er-rors <25 km s−1 and a spectral fit with reduced χ2 < 1.25. Thesespectra have a median signal to noise of 9.5 over the wavelength4000–4500 Å. Among these objects, 21 are in the core of the clusterand we report them here in Table 2.
Jorgensen, Franx & Kjaergaard (1995) empirically show that thestellar velocity dispersion σ obs observed with fibres and the centralstellar velocity dispersion σ sp are related by
σsp = σobs
(Reff
8 × d/2
)−0.04
, (1)
where Reff is the galaxy effective radius and d is the fibre aperture.We estimate the effective radii of cluster members using GALFIT
(Peng et al. 2010), fitting de Vaucouleurs profiles to the 2D surfacebrightness distribution of the galaxies in the HST/F814W filter. Wethen correct the central velocity dispersion for our cluster membersaccording to equation (1).
In Table 2, we provide the coordinates, spectroscopic redshift zsp
and σ sp for the sample of cluster members confirmed in the core ofthe cluster.
3 C LUSTER MEMBERS
In order to define the galaxy component to include in the strong lens-ing analysis (see Section 4), we select cluster members in the core ofA383 combining the photometric and spectroscopic data sets. We re-strict our analysis to the sources in a FOV of 1.5 arcmin × 1.5 arcmincentred on the cluster. In this FOV, we have 34 spectroscopicallyconfirmed cluster members (13 from VLT/VIMOS data and 21from Hectospec data), which have |zsp − zcl| < 0.01 (see Fig. 1),where zcl = 0.189 is the cluster redshift. To include in our lens-ing analysis also cluster members which lack spectroscopic data,we select further member candidates combining information fromthe cluster colour–magnitude diagram and from photometric red-shifts. We compute photometric redshifts for the galaxies extractedin our data set using the spectral energy distribution (SED) fittingcode LEPHARE2 (Arnouts et al. 1999; Ilbert et al. 2006). We use theCOSMOS template set (Ilbert et al. 2009) as galaxy templates, in-cluding 31 galaxy SEDs for elliptical, spiral and starburst galaxies.We apply the Calzetti extinction law (Calzetti et al. 2000) to thestarburst templates, and the SMC Prevot law (Prevot et al. 1984) tothe Sc and Sd templates, to take into account extinction due to theinterstellar medium. As we did in Monna et al. (2014), in order toaccount for template mismatch of red SEDs (Greisel et al. 2013),we apply offset corrections to our photometry. We use the sampleof spectroscopically confirmed cluster members to estimate thesephotometric offsets through a colour adaptive method. For eachgalaxy with known zsp, the tool finds the template which best fitsits observed photometry, and thus minimizes the offset between theobserved and predicted magnitudes in each filter.
2 http://www.cfht.hawaii.edu/arnouts/lephare.html
MNRAS 447, 1224–1241 (2015)
at California Institute of T
echnology on April 9, 2015
http://mnras.oxfordjournals.org/
Dow
nloaded from

Constraining the galaxy mass content in A383 1227
Table 2. List of cluster members with measured spectroscopic redshift from theHectospec and VIMOS/VLT surveys. Col. 1 ID; Col. 2–3 RA and Dec; Col. 4spectroscopic redshift; Col. 5 measured velocity dispersion corrected accordingto equation (1); Col. 6 Effective radius.
ID α δ zsp σ sp (km s−1) Reff(kpc)
GR 02:48:03.6 −03:31:15.7 0.194a 233.1 ± 12.2 5.03 ± 0.03BCG 02:48:03.4 −03:31:45.0 0.189a 377.8 ± 15.1 10.45 ± 0.15G1 02:48:02.4 −03:32:01.9 0.191a 254.9 ± 12.8 3.35 ± 0.02G2 02:48:03.4 −03:32:09.3 0.195a 201.8 ± 15.4 1.59 ± 0.0215 02:48:03.0 −03:30:18.2 0.188a 141.9 ± 16.0 2.11 ± 0.0216 02:48:03.0 −03:30:20.8 0.195a 273.4 ± 13.5 2.35 ± 0.01146 02:48:00.5 −03:31:21.6 0.191a 121.5 ± 34.5 1.25 ± 0.01223 02:48:02.1 −03:30:43.9 0.194a 194.8 ± 11.1 3.67 ± 0.02410 02:48:03.7 −03:31:02.0 0.182a 159.6 ± 24.8 1.73 ± 0.01658 02:48:08.5 −03:31:28.9 0.195a 207.7 ± 13.4 2.49 ± 0.01683 02:48:00.3 −03:31:29.2 0.179a 164.3 ± 33.1 0.62 ± 0.01711 02:48:05.9 −03:31:31.9 0.186a 159.4 ± 13.7 1.78 ± 0.01770 02:48:03.7 −03:31:35.0 0.190a 172.1 ± 18.3 1.16 ± 0.02773 02:48:02.8 −03:31:47.1 0.186a 212.0 ± 12.3 3.16 ± 0.03816 02:48:08.3 −03:31:39.2 0.191a 192.8 ± 16.2 4.21 ± 0.05906 02:48:03.7 −03:31:58.4 0.190a 240.4 ± 20.5 1.74 ± 0.02975 02:48:01.0 −03:31:54.7 0.192a 75.0 ± 35.4 0.97 ± 0.01
1034 02:48:07.1 −03:31:46.9 0.184a 81.0 ± 48.1 2.22 ± 0.011069 02:48:04.5 −03:32:06.5 0.196a 244.6 ± 16.0 3.25 ± 0.011214 02:48:05.4 −03:32:18.4 0.185a 212.0 ± 21.8 2.0 ± 0.011479 02:48:04.9 −03:32:36.7 0.183a 108.5 ± 20.3 1.03 ± 0.01208 02:48:02.6 −03:30:37.7 0.184b – –233 02:48:03.7 −03:30:43.2 0.186b – –367 02:48:06.8 −03:30:55.3 0.197b – –496 02:48:05.1 −03:31:10.1 0.191b – –601 02:48:04.5 −03:31:19.6 0.193b – –742 02:48:02.8 −03:31:32.8 0.188b – –792 02:48:04.6 −03:31:34.5 0.184b – –901 02:48:01.9 −03:31:45.8 0.203b – –
1274 02:48:01.1 −03:32:23.3 0.197b – –1342 02:48:00.6 −03:32:26.8 0.188b – –1362 02:48:05.5 −03:32:30.4 0.192b – –1551 02:48:05.3 −03:32:44.0 0.188b – –1670 02:48:05.9 −03:32:53.0 0.191b – –
Notes. a From the Hectospec Survey.b From the VIMOS CLASH–VLT Survey.
The photometric redshift and spectroscopic measurements forthe relatively bright spectroscopically confirmed cluster memberspresent small scatter: all of them fall within |zsp − zph| < 0.02.However, we use a larger interval of |zph − zcl| < 0.03 to select can-didate cluster members photometrically, since faint galaxies havelarger photometric redshift errors in general. In addition, we requirecandidate cluster members to be brighter than 25 mag in the F625Wfilter (F625Wauto < 25) and to lie around the red sequence in thecolour–magnitude diagram (having F435W − F625W ∈ [1.3, 2.3],see Figs 2 and 3).
Our final cluster member sample in the core of the cluster contains92 galaxies, 34 spectroscopically confirmed and 58 photometriccandidates.
4 STRONG LENSING RECIPE
We perform the strong lensing analysis of A383 using the stronglensing parametric mass modelling software GLEE (Suyu & Halkola2010; Suyu et al. 2012). As constraints, we use the positions andredshifts (when known) of the multiple images. These directly mea-sure the differences of lensing deflection angles at the position
of multiple images. In addition, we also reconstruct the surfacebrightness distributions of giant arcs, which contain information onhigher order derivatives of the deflection angle. We adopt analyticmass models to describe the mass profiles of the cluster dark halo(DH) and the galaxy mass components. The best-fitting model isfound through a simulated annealing minimization in the imageplane. The most probable parameters and uncertainties for the clus-ter mass model are then obtained from a Monte Carlo Markov Chain(MCMC) sampling.
4.1 Mass components and scaling relations
We describe the smooth DH mass component of the cluster witha pseudo-isothermal elliptical mass distribution (PIEMD) profile(Kassiola & Kovner 1993). Its projected surface density is
�(R) = σ 2
2G
(1√
r2c + R2
), (2)
where σ is the velocity dispersion of the DH and rc is its coreradius. R is the 2D radius, given by R2 = x2/(1 + e)2 + y2/(1 −e)2 for an elliptical profile with ellipticity e. Strong lensing allows
MNRAS 447, 1224–1241 (2015)
at California Institute of T
echnology on April 9, 2015
http://mnras.oxfordjournals.org/
Dow
nloaded from

1228 A. Monna et al.
Figure 1. 1.5 arcmin × 1.5 arcmin HST colour composite image of A383 core: Blue = F435W+F475W; Green = F606W+F625W+F775W+F814W+F850LP;Red = F105W+F110W+F140W+F160W. Blue circles label the spectroscopically confirmed cluster members in the FOV shown, while red circles label thegalaxies with measured velocity dispersion. We label with ‘GR’ the galaxy used as reference for the luminosity scaling relations, and with ‘G1’ and ‘G2’ thetwo galaxies we are modelling individually (see Section 6). The nine multiply lensed systems used in the strong lensing analysis (see Section 4) are labelledas in Zitrin et al. (2011).
us to robustly constrain the Einstein radius of a lens. This is theradius of the Einstein ring formed by a point source lensed by aspherical halo, when source and lens are aligned with the observer.For a singular isothermal sphere, the Einstein radius θE and velocitydispersion of the halo are related by
θE = 4π(σ
c
)2 Dds
Ds= E
Dds
Ds, (3)
where θE and E are in arcseconds, c is the speed of light, Ds is thedistance of the lensed source and Dds is the distance between the lensand the source. E is the Einstein parameter, which corresponds tothe Einstein radius for Dds/Ds = 1. For elliptical mass distributionwith core radius, lensing measures the Einstein parameter E, whichcorresponds to the Einstein radius when the ellipticity and coreradius go to zero (e, rc → 0). In the following analysis, we use theEinstein parameter E to describe the mass amplitude of the lenshalo.
The total mass associated with each cluster member is modelledwith a dual pseudo-isothermal elliptical profile (dPIE; Elıasdottiret al. 2007). This model has a core radius rc and a truncation radiusrtr, which marks the region where the density slope changes fromρ ∝ r−2 to ρ ∝ r−4.
The projected surface mass density is
�(R) = σ 2
2GR
r2tr(
r2tr − r2
c
)⎛⎝ 1√
1 + r2c
R2
− 1√1 + r2
trR2
⎞⎠ , (4)
where R2 = x2/(1 + e)2 + y2/(1 − e)2, as for the PIEMD massprofile. The total mass is given by
Mtot = πσ 2
G
r2tr
rtr + rc, (5)
which, for rc → 0, reduces to
Mtot = πσ 2rtr
G. (6)
MNRAS 447, 1224–1241 (2015)
at California Institute of T
echnology on April 9, 2015
http://mnras.oxfordjournals.org/
Dow
nloaded from

Constraining the galaxy mass content in A383 1229
Figure 2. Redshift distribution of the final cluster member sample, in-cluding photometric candidates (green histogram) and spectroscopicallyconfirmed members (red histogram).
Figure 3. Colour–magnitude diagram for the sources extracted in the coreof A383. We plot the colour from aperture magnitudes in the filters F435Wand F625W versus the SEXTRACTOR mag auto in the F625W filter. Bluecircles are all the sources extracted in the cluster core; in red we plot thespectroscopically confirmed cluster members and in green the photometriccluster member candidates with zph ∈ [0.16, 0.22].
For vanishing core radius, rtr corresponds to the radius containinghalf of the total mass of the galaxy (see appendix A3 in Elıasdottiret al. 2007). We adopt vanishing core radii for the galaxies (unlessstated otherwise), so that we have only two free parameters associ-ated with each galaxy, i.e. σ and rtr. However, we selected 92 clustermembers in the cluster core and this would yield ∼200 free parame-ters for the galaxy mass component. To reduce this large number offree parameters, we adopt luminosity scaling relations to relate thevelocity dispersion and truncation radius of the cluster members toa fiducial reference galaxy, as in Halkola, Seitz & Pannella (2007)and Eichner et al. (2013). In other words, we only optimize σ andrtr for a reference galaxy and then scale all the other galaxies’ σ andrtr through luminosity scaling relations (i.e. the Faber–Jackson andFundamental Plane for σ and rtr, respectively).
Given the Faber–Jackson relation, the central velocity dispersionof early-type galaxies is proportional to a power law of the lumi-nosity. Thus, for the cluster member we adopt
σ = σGR
(L
LGR
)δ
, (7)
where the amplitude σ GR is the velocity dispersion of a referencegalaxy halo with luminosity LGR.
Following Hoekstra et al. (2003), Halkola, Seitz & Pannella(2006), Halkola et al. (2007) and Limousin et al. (2007), we assumethat the truncation radius of galaxy haloes scales with luminosityas
rtr = rtr,GR
(L
LGR
)α
= rtr,GR
(σ
σGR
) αδ
, (8)
where rtr, GR is the truncation radius for a galaxy with luminosityLGR. Given equations (7) and (8), once we fix the exponent δ andα, the free parameters, used to tune the galaxy mass contributionto the total cluster mass, are reduced to the velocity dispersion σ GR
and truncation radius rtr, GR of the reference galaxy.The total mass-to-light ratio for a galaxy scales as
Mtot
L∝ Lε ∝ σ
εδ (9)
and it is constant for ε = 0. Combining equations (6), (7) and (8),the total mass scales as
Mtot ∝ σ 2rtr ∝ σ 2+ αδ . (10)
Therefore, from equations (9) and (10), we obtain the followingrelation for the exponents
α = ε − 2δ + 1, (11)
which means that if we have knowledge of two of them, we canderive the third one. In the following, we will go through someconsiderations which will help us to fix the value of these exponents.
For elliptical galaxies in clusters, the exponent δ has measure-ments between 0.25 and 0.3, depending on the filter in which thephotometry is extracted (see Ziegler & Bender 1997; Fritz, Bohm& Ziegler 2009; Focardi & Malavasi 2012; Kormendy & Bender2013). Measurements from strong and weak lensing analyses yieldδ = 0.3 (see Rusin et al. 2003; Brimioulle et al. 2013).
Concerning the truncation radius of galaxies in clusters, theoret-ical studies predict that in dense environment it scales linearly withthe galaxies velocity dispersion (see Merritt 1983) and, given equa-tion (6), this yields Mtot ∝ σ 3. However, from equation (9), the totalgalaxy mass can be written as Mtot ∝ σ
ε+1δ , and thus we conclude
that ε = 3δ − 1.In summary, we expect δ to be within [0.25, 0.3], which implies
ε to be within [−0.3, 0.2]. The lower limit ε = −0.3 is the case inwhich the galaxy haloes’ mass has a value as expected for completedstripping process (e.g. see Merritt 1983). On the contrary, ε = 0.2 isthe case in which the galaxies have suffered no stripping at all andfulfill the scaling relations in fields (e.g. see Brimioulle et al. 2013).
A383 is a relaxed galaxy cluster, thus we expect the galaxy halostripping process to be completed in the core. However, to takeinto account still ongoing halo stripping, as we did in Eichner et al.(2013) we fix the exponents of the mass-to-light luminosity relationsto be ε = 0. This value is in between the ones expected for not yetstarted, and already completed halo stripping.
Using the sample of confirmed cluster members with measuredvelocity dispersions, we directly measured the exponent δ of theFaber–Jackson relation in the F814W band. We get δ ∼ 0.296, thusin the lensing analysis we use δ = 0.3.
Finally, referring to the general relation between the exponents ofthe scaling relations given in equation (11), we obtain that α = 0.4.
Once we fix the exponents of the luminosity scaling relations,the only parameters we need to determine to define the galaxy masscomponent are the amplitudes of the scaling relations, σ GR and
MNRAS 447, 1224–1241 (2015)
at California Institute of T
echnology on April 9, 2015
http://mnras.oxfordjournals.org/
Dow
nloaded from
1230 A. Monna et al.
rtr, GR. We use as reference galaxy (GR) the third brightest galaxyof the cluster (RA J2000=02:48:03.63, DEC J2000=−03:31:15.7),which has F814W iso = 17.74 ± 0.01, zsp = 0.194 and a measuredvelocity dispersion σ GR = 233 ± 12 km s−1.
Bright galaxies, as the cluster BCGs, can show a large scatterand likely also a systematic deviation from the scaling relations ofcluster luminous red galaxies (see Postman et al. 2012b; Kormendy& Bender 2013). Thus, we model the BCG independently to betteraccount for its contribution to the total mass profile. Moreover,we independently optimize two further cluster members close tothe lensed systems 3 to 4 (see Section 6). These galaxies havemeasured σ sp, which, combined with the strong lensing constraintsfrom their nearby arcs, allow us to directly measure their halo sizes.We call these two galaxies G1 and G2 (see Fig. 1). Their redshiftsand measured velocity dispersions are zG1 = 0.191, zG2 = 0.195and σ G1 = 255 ± 13 km s−1, σ G2 = 202 ± 15 km s−1, respectively(see Table 2).
To scale σ and rtr of the cluster members according to equations(7) and (8), we use the observed isophotal fluxes in the F814Wfilter. Moreover, assuming that the luminosity of the galaxies tracestheir DM haloes, we fix the ellipticity and orientation of each haloesto the respective values associated with the galaxy light profile, asextracted with SEXTRACTOR in the F814W band.
In addition, we also allow for an external shear component to takeinto account the large-scale environment contribution to the lensingpotential.
4.2 Multiple images
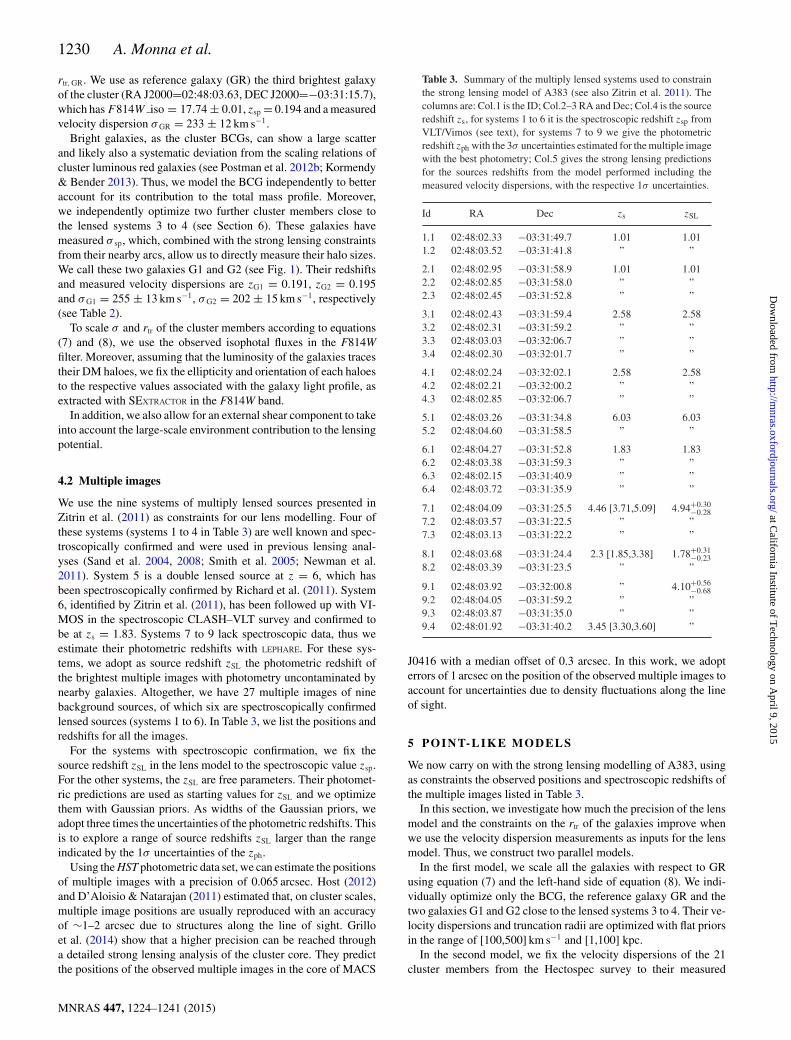
We use the nine systems of multiply lensed sources presented inZitrin et al. (2011) as constraints for our lens modelling. Four ofthese systems (systems 1 to 4 in Table 3) are well known and spec-troscopically confirmed and were used in previous lensing anal-yses (Sand et al. 2004, 2008; Smith et al. 2005; Newman et al.2011). System 5 is a double lensed source at z = 6, which hasbeen spectroscopically confirmed by Richard et al. (2011). System6, identified by Zitrin et al. (2011), has been followed up with VI-MOS in the spectroscopic CLASH–VLT survey and confirmed tobe at zs = 1.83. Systems 7 to 9 lack spectroscopic data, thus weestimate their photometric redshifts with LEPHARE. For these sys-tems, we adopt as source redshift zSL the photometric redshift ofthe brightest multiple images with photometry uncontaminated bynearby galaxies. Altogether, we have 27 multiple images of ninebackground sources, of which six are spectroscopically confirmedlensed sources (systems 1 to 6). In Table 3, we list the positions andredshifts for all the images.
For the systems with spectroscopic confirmation, we fix thesource redshift zSL in the lens model to the spectroscopic value zsp.For the other systems, the zSL are free parameters. Their photomet-ric predictions are used as starting values for zSL and we optimizethem with Gaussian priors. As widths of the Gaussian priors, weadopt three times the uncertainties of the photometric redshifts. Thisis to explore a range of source redshifts zSL larger than the rangeindicated by the 1σ uncertainties of the zph.
Using the HST photometric data set, we can estimate the positionsof multiple images with a precision of 0.065 arcsec. Host (2012)and D’Aloisio & Natarajan (2011) estimated that, on cluster scales,multiple image positions are usually reproduced with an accuracyof ∼1–2 arcsec due to structures along the line of sight. Grilloet al. (2014) show that a higher precision can be reached througha detailed strong lensing analysis of the cluster core. They predictthe positions of the observed multiple images in the core of MACS
Table 3. Summary of the multiply lensed systems used to constrainthe strong lensing model of A383 (see also Zitrin et al. 2011). Thecolumns are: Col.1 is the ID; Col.2–3 RA and Dec; Col.4 is the sourceredshift zs, for systems 1 to 6 it is the spectroscopic redshift zsp fromVLT/Vimos (see text), for systems 7 to 9 we give the photometricredshift zph with the 3σ uncertainties estimated for the multiple imagewith the best photometry; Col.5 gives the strong lensing predictionsfor the sources redshifts from the model performed including themeasured velocity dispersions, with the respective 1σ uncertainties.
Id RA Dec zs zSL
1.1 02:48:02.33 −03:31:49.7 1.01 1.011.2 02:48:03.52 −03:31:41.8 ” ”
2.1 02:48:02.95 −03:31:58.9 1.01 1.012.2 02:48:02.85 −03:31:58.0 ” ”2.3 02:48:02.45 −03:31:52.8 ” ”
3.1 02:48:02.43 −03:31:59.4 2.58 2.583.2 02:48:02.31 −03:31:59.2 ” ”3.3 02:48:03.03 −03:32:06.7 ” ”3.4 02:48:02.30 −03:32:01.7 ” ”
4.1 02:48:02.24 −03:32:02.1 2.58 2.584.2 02:48:02.21 −03:32:00.2 ” ”4.3 02:48:02.85 −03:32:06.7 ” ”
5.1 02:48:03.26 −03:31:34.8 6.03 6.035.2 02:48:04.60 −03:31:58.5 ” ”
6.1 02:48:04.27 −03:31:52.8 1.83 1.836.2 02:48:03.38 −03:31:59.3 ” ”6.3 02:48:02.15 −03:31:40.9 ” ”6.4 02:48:03.72 −03:31:35.9 ” ”
7.1 02:48:04.09 −03:31:25.5 4.46 [3.71,5.09] 4.94+0.30−0.28
7.2 02:48:03.57 −03:31:22.5 ” ”7.3 02:48:03.13 −03:31:22.2 ” ”
8.1 02:48:03.68 −03:31:24.4 2.3 [1.85,3.38] 1.78+0.31−0.23
8.2 02:48:03.39 −03:31:23.5 ” ”
9.1 02:48:03.92 −03:32:00.8 ” 4.10+0.56−0.68
9.2 02:48:04.05 −03:31:59.2 ” ”9.3 02:48:03.87 −03:31:35.0 ” ”9.4 02:48:01.92 −03:31:40.2 3.45 [3.30,3.60] ”
J0416 with a median offset of 0.3 arcsec. In this work, we adopterrors of 1 arcsec on the position of the observed multiple images toaccount for uncertainties due to density fluctuations along the lineof sight.
5 PO I N T- L I K E M O D E L S
We now carry on with the strong lensing modelling of A383, usingas constraints the observed positions and spectroscopic redshifts ofthe multiple images listed in Table 3.
In this section, we investigate how much the precision of the lensmodel and the constraints on the rtr of the galaxies improve whenwe use the velocity dispersion measurements as inputs for the lensmodel. Thus, we construct two parallel models.
In the first model, we scale all the galaxies with respect to GRusing equation (7) and the left-hand side of equation (8). We indi-vidually optimize only the BCG, the reference galaxy GR and thetwo galaxies G1 and G2 close to the lensed systems 3 to 4. Their ve-locity dispersions and truncation radii are optimized with flat priorsin the range of [100,500] km s−1 and [1,100] kpc.
In the second model, we fix the velocity dispersions of the 21cluster members from the Hectospec survey to their measured
MNRAS 447, 1224–1241 (2015)
at California Institute of T
echnology on April 9, 2015
http://mnras.oxfordjournals.org/
Dow
nloaded from

Constraining the galaxy mass content in A383 1231
values. Their truncation radii are then given by the left-hand sideof equation (8). All the other cluster members are still scaled withrespect to GR according to equations (7) and (8). In the lens mod-elling, we allow for some freedom for the velocity dispersions of theBCG, GR, G1 and G2, which we optimize around their σ sp usingGaussian priors with width equal to their spectroscopic uncertain-ties. Also in this case, the truncation radii of these four galaxies areoptimized with a flat prior within [1,100]kpc.
We will refer to these two models as ‘point-like models withand without velocity dispersions’ (hereafter ‘w/σ ’ and ‘wo/σ ’,respectively). With ‘point-like’, we indicate that multiple imageconstraints are used as points, without accounting, at this stage, forsurface brightness constraints.
In both cases, we optimize all the DH parameters using flat priors:the DH centre is optimized within 3 arcsec from the BCG position,ellipticity within [0,1], the position angle (PA) is free to vary within180◦ and the core radius within [0,60] kpc. The Einstein parameter E is optimized within [4.5, 65] arcsec, which correspond to thevelocity dispersion range [400,1500] km s−1 for a singular isother-mal sphere. For each galaxy, we fix its position, ellipticity ε andposition angle PA to the value measured from the photometry in theACS/F814W filter. Only for the BCG, we optimize the values of ε
and PA measured in the ACS/F814W filter with a Gaussian priorwith width of 0.25 and 10◦, respectively. The two models have 18free parameters associated with the mass components. In Table 4,we list the results on the galaxy and DH parameters for both mod-els and in the appendix (Figs A1, A2) we provide the plots of theMCMC sampling.
Here, we summarize the main results.The final best model wo/σ reproduces the positions of the
observed multiple images to an accuracy of 0.5 arcsec, withχ2 = 0.6 in the image plane. The cluster DH has a core radiusof ∼37.5+5.6
−7.7 kpc and Einstein parameter E = 13.3+2.6−2.2 arcsec,
which corresponds to the fiducial Einstein radius θE = 11.6+2.3−1.9 arc-
sec for a source at zs = 2.58. It gives a central velocity disper-sion of σ = 680+67
−57 km s−1 for a singular isothermal sphere. TheBCG has a velocity dispersion of σBCG = 395+39
−44 km s−1 and trun-cation radius of rtr = 53.1+15.6
−25.0 kpc. The predicted velocity disper-sion and radii for GR, G1 and G2 are σGR = 214+40
−32 km s−1, σG1 =253 ± 23 km s−1, σG2 = 194+54
−45 km s−1 and rtr,GR = 23.1+29.4−12.8 kpc,
rtr, G1 = 47.8 ± 20.9 kpc, rtr,G2 = 32.2+31.5−23.4 kpc. The total mass
of the cluster within the Einstein radius θE = 11.6+2.3−1.9 arcsec is
Mtot = 9.72 ± 0.23 × 10¹² M.Including the measured velocity dispersions in the strong lens-
ing analysis leads to a final best model with χ2 = 0.5 in the im-age plane, which reproduces the multiple images positions with amean accuracy of 0.4 arcsec. The smooth DH has core radius of39.5+5.3
−5.7 kpc, and θE=11.1+2.1−1.6 arcsec for a source at zs = 2.58,
from which we get σ = 667+62−47 km s−1 for a singular isothermal
sphere. The measured velocity dispersions of GR, BCG, G1 and G2are optimized within their uncertainties. The final values for theseparameters are σGR = 238 ± 15 km s−1, σBCG = 379 ± 21 km s−1,σG1 = 252 ± 14 km s−1 and σG2 = 201 ± 20 km s−1. The predictedradii for GR, BCG, G1 and G2 are rtr,GR = 13.2+6.2
−4.3 kpc, rtr,BCG =58.4+24.9
−33.2 kpc, rtr,G1 = 73.1+38.7−35.5 kpc, rtr,G2 = 53.2+49.2
−36.3 kpc. Thetotal mass of the cluster is Mtot = 9.70 ± 0.22 × 10¹² Mwithin the Einstein radius θE=11.1+2.1
−1.6 arcsec for a source atzs = 2.58.
The results for the two point-like models are globally in agree-ment within their 1σ errors.
In Fig. 4, we show the critical lines for a source at z = 2.58for both the models overplotted on the colour composite image
Table 4. Most probable mass profiles param-eters with the respective 1σ uncertainties forthe smooth DH, the BCG, GR, G1 and G2 fromstrong lensing models of A383. In column (1),we give the results for the model without mea-sured velocity dispersions and in column (2)for the model with velocity dispersions.
Param ‘wo/σ ’ ‘w/σ ’
External shear
γ 0.07 ± 0.03 0.04 ± 0.02
θ (◦) 51+17−11 37+17
−26
Dark halo
δx (arcsec) 0.7 ± 0.5 1.0 ± 0.4
δy (arcsec) 1.0 ± 0.8 2.4+0.4−0.6
PA (◦) 88+10−14 111 ± 20
b/a 0.8 ± 0.1 0.90 ± 0.06
θE (arcsec) 11.6+2.3−1.9 11.1+2.1
−1.6
rc (kpc) 37.5+5.6−7.7 39.5+5.3
−5.7
BCG
PA (◦) 94◦ ± 23◦ 98◦ ± 9◦
b/a 0.61+0.18−0.15 0.60+0.17
−0.13
σ (km s−1) 395+39−44 379 ± 21
rtr (kpc) 53.1+15.6−25.0 58.4+24.9
−33.2
GR
σ (km s−1) 214+40−32 238 ± 15
rtr (kpc) 23.1+29.4−12.8 13.2+6.2
−4.3
G1
σ (km s−1) 253 ± 23 252 ± 14
rtr (kpc) 47.8 ± 20.9 73.1+38.7−35.5
G2
σ (km s−1) 194+54−45 201 ± 20
rtr (kpc) 32.2+31.5−23.4 53.2+49.2
−36.3
of the cluster core. The global models are in agreement; however,using the spectroscopically measured velocity dispersions of clus-ter members locally affects the mass distribution reconstruction. InFig. 5, we plot the measured velocity dispersions σ sp versus thepredicted ones from SL for the model ‘wo/σ ’, and in the lowerpanel their ratio. They are in overall agreement within the 1σ un-certainties. Only few galaxies present a larger deviation from themeasured velocity dispersions, but they are anyhow consistent atthe 2σ level. These are faint galaxies (F814W auto mag > 18.6)which have spectroscopic velocity dispersion with uncertainties of�30 per cent. The velocity dispersions predicted from SL for thefour galaxies optimized individually are in good agreement withthe measured values, in particular for G1 and G2, which are wellconstrained through the lensed systems 3 to 4. The velocity disper-sion predicted for the reference galaxy, σSL,GR = 214+40
−32 km s−1, isslightly lower than the measured σ sp, GR = 233 ± 12 km s−1, butstill consistent within the 1σ errors.
From the comparison of the two point-like models, we find thatlensing predictions for galaxies velocity dispersions are overall ingood agreement with spectroscopic measurements. We reached sim-ilar results in Eichner et al. (2013), where the velocity dispersionspredicted from strong lensing for cluster members in the core ofMACS1206 were in great agreement with the σ estimated from the
MNRAS 447, 1224–1241 (2015)
at California Institute of T
echnology on April 9, 2015
http://mnras.oxfordjournals.org/
Dow
nloaded from

1232 A. Monna et al.
Figure 4. HST colour composite image of A383 core with the critical lines overplotted (in blue) for the SL models. Left-hand panel shows the model ‘wo/σ ’,and the right-hand panel is the model including the measured velocity dispersions. The critical lines are for a source at zs = 2.58, which is the spectroscopicredshift of systems 3 to 4.
Figure 5. Upper panel: velocity dispersions σ SL predicted from the SLanalysis versus measured velocity dispersions σ sp for the 21 cluster membersfrom the Hectospec survey. Lower panel: ratio of σ SL and σ sp. The σ SL arepredicted using the scaling luminosity relation, except for the four galaxiesindividually optimized, GR, BCG, G1 and G2. The values predicted inthe model ‘wo/σ ’ are globally in agreement with the measured σ sp atthe 1σ level, except at low velocity dispersions where they are slightlyoverestimated by a factor of ∼1.5. We label in red the data for the galaxiesindividually optimized: these show an excellent agreement between the σ SL
and the measured σ sp.
Figure 6. Probability contours of the GR velocity dispersions versus thetruncation radius from the MCMC sampling for the model ‘wo/σ ’ (in blue)and ‘w/σ ’ (in red). The knowledge of the galaxies velocity dispersions im-proves the constraint on the global scaling relation, tightening the constraintson the galaxy truncation radii by ∼50 per cent.
Faber–Jackson relation. In Fig. 6, we plot the probability contoursfrom the MCMC sampling for the truncation radius and velocitydispersion of the GR. The results from the model ‘wo/σ ’ showa clear degeneracy between these two parameters (see also equa-tion 6), which is broken only in the analysis ‘w/σ ’. The inclusionof velocity dispersion measurements allows us to improve the con-straints on the galaxy sizes by ∼50 per cent reaching uncertainties
MNRAS 447, 1224–1241 (2015)
at California Institute of T
echnology on April 9, 2015
http://mnras.oxfordjournals.org/
Dow
nloaded from
Constraining the galaxy mass content in A383 1233
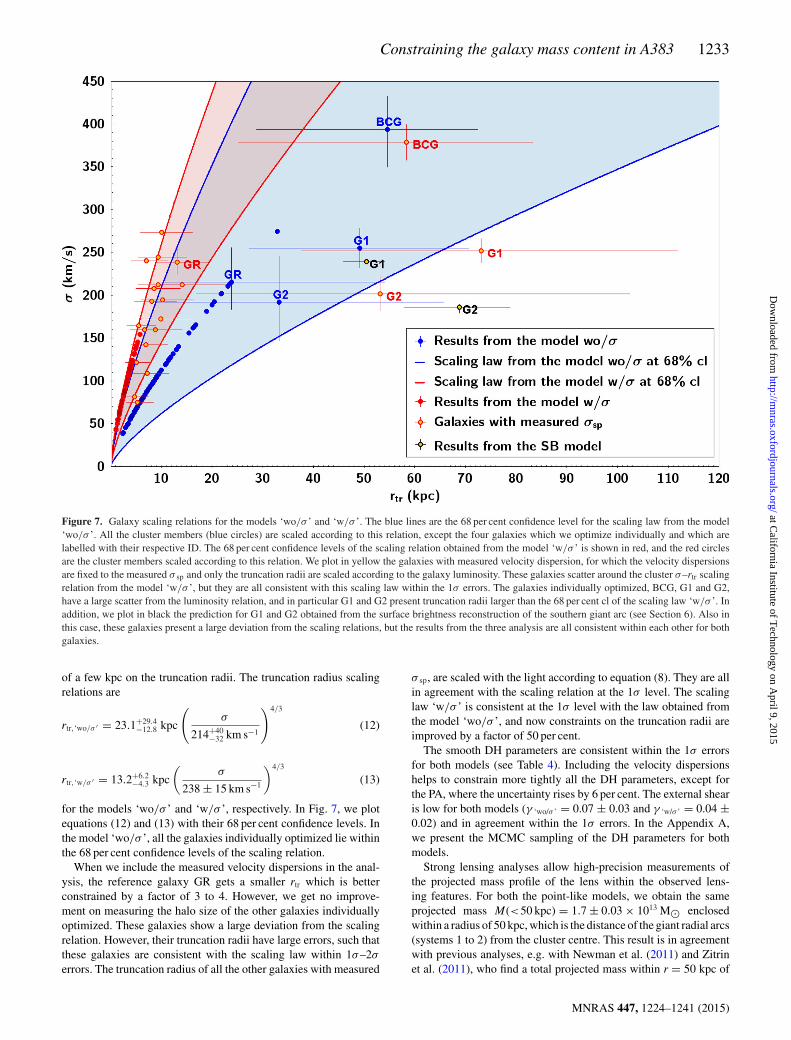
Figure 7. Galaxy scaling relations for the models ‘wo/σ ’ and ‘w/σ ’. The blue lines are the 68 per cent confidence level for the scaling law from the model‘wo/σ ’. All the cluster members (blue circles) are scaled according to this relation, except the four galaxies which we optimize individually and which arelabelled with their respective ID. The 68 per cent confidence levels of the scaling relation obtained from the model ‘w/σ ’ is shown in red, and the red circlesare the cluster members scaled according to this relation. We plot in yellow the galaxies with measured velocity dispersion, for which the velocity dispersionsare fixed to the measured σ sp and only the truncation radii are scaled according to the galaxy luminosity. These galaxies scatter around the cluster σ–rtr scalingrelation from the model ‘w/σ ’, but they are all consistent with this scaling law within the 1σ errors. The galaxies individually optimized, BCG, G1 and G2,have a large scatter from the luminosity relation, and in particular G1 and G2 present truncation radii larger than the 68 per cent cl of the scaling law ‘w/σ ’. Inaddition, we plot in black the prediction for G1 and G2 obtained from the surface brightness reconstruction of the southern giant arc (see Section 6). Also inthis case, these galaxies present a large deviation from the scaling relations, but the results from the three analysis are all consistent within each other for bothgalaxies.
of a few kpc on the truncation radii. The truncation radius scalingrelations are
rtr,‘wo/σ ′ = 23.1+29.4−12.8 kpc
(σ
214+40−32 km s−1
)4/3
(12)
rtr,‘w/σ ′ = 13.2+6.2−4.3 kpc
(σ
238 ± 15 km s−1
)4/3
(13)
for the models ‘wo/σ ’ and ‘w/σ ’, respectively. In Fig. 7, we plotequations (12) and (13) with their 68 per cent confidence levels. Inthe model ‘wo/σ ’, all the galaxies individually optimized lie withinthe 68 per cent confidence levels of the scaling relation.
When we include the measured velocity dispersions in the anal-ysis, the reference galaxy GR gets a smaller rtr which is betterconstrained by a factor of 3 to 4. However, we get no improve-ment on measuring the halo size of the other galaxies individuallyoptimized. These galaxies show a large deviation from the scalingrelation. However, their truncation radii have large errors, such thatthese galaxies are consistent with the scaling law within 1σ–2σ
errors. The truncation radius of all the other galaxies with measured
σ sp, are scaled with the light according to equation (8). They are allin agreement with the scaling relation at the 1σ level. The scalinglaw ‘w/σ ’ is consistent at the 1σ level with the law obtained fromthe model ‘wo/σ ’, and now constraints on the truncation radii areimproved by a factor of 50 per cent.
The smooth DH parameters are consistent within the 1σ errorsfor both models (see Table 4). Including the velocity dispersionshelps to constrain more tightly all the DH parameters, except forthe PA, where the uncertainty rises by 6 per cent. The external shearis low for both models (γ ‘wo/σ ’ = 0.07 ± 0.03 and γ ‘w/σ ’ = 0.04 ±0.02) and in agreement within the 1σ errors. In the Appendix A,we present the MCMC sampling of the DH parameters for bothmodels.
Strong lensing analyses allow high-precision measurements ofthe projected mass profile of the lens within the observed lens-ing features. For both the point-like models, we obtain the sameprojected mass M(<50 kpc) = 1.7 ± 0.03 × 10¹³ M enclosedwithin a radius of 50 kpc, which is the distance of the giant radial arcs(systems 1 to 2) from the cluster centre. This result is in agreementwith previous analyses, e.g. with Newman et al. (2011) and Zitrinet al. (2011), who find a total projected mass within r = 50 kpc of
MNRAS 447, 1224–1241 (2015)
at California Institute of T
echnology on April 9, 2015
http://mnras.oxfordjournals.org/
Dow
nloaded from
1234 A. Monna et al.
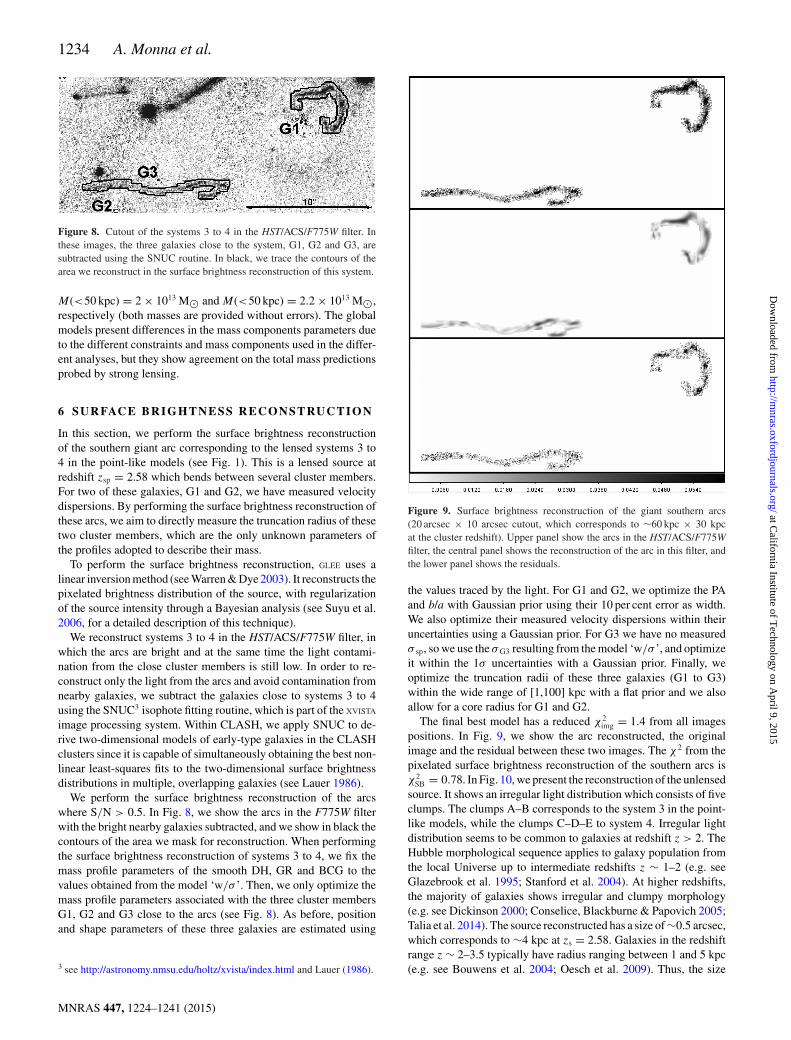
Figure 8. Cutout of the systems 3 to 4 in the HST/ACS/F775W filter. Inthese images, the three galaxies close to the system, G1, G2 and G3, aresubtracted using the SNUC routine. In black, we trace the contours of thearea we reconstruct in the surface brightness reconstruction of this system.
M(<50 kpc) = 2 × 10¹³ M and M(<50 kpc) = 2.2 × 10¹³ M,respectively (both masses are provided without errors). The globalmodels present differences in the mass components parameters dueto the different constraints and mass components used in the differ-ent analyses, but they show agreement on the total mass predictionsprobed by strong lensing.
6 SU R FAC E B R I G H T N E S S R E C O N S T RU C T I O N
In this section, we perform the surface brightness reconstructionof the southern giant arc corresponding to the lensed systems 3 to4 in the point-like models (see Fig. 1). This is a lensed source atredshift zsp = 2.58 which bends between several cluster members.For two of these galaxies, G1 and G2, we have measured velocitydispersions. By performing the surface brightness reconstruction ofthese arcs, we aim to directly measure the truncation radius of thesetwo cluster members, which are the only unknown parameters ofthe profiles adopted to describe their mass.
To perform the surface brightness reconstruction, GLEE uses alinear inversion method (see Warren & Dye 2003). It reconstructs thepixelated brightness distribution of the source, with regularizationof the source intensity through a Bayesian analysis (see Suyu et al.2006, for a detailed description of this technique).
We reconstruct systems 3 to 4 in the HST/ACS/F775W filter, inwhich the arcs are bright and at the same time the light contami-nation from the close cluster members is still low. In order to re-construct only the light from the arcs and avoid contamination fromnearby galaxies, we subtract the galaxies close to systems 3 to 4using the SNUC3 isophote fitting routine, which is part of the XVISTA
image processing system. Within CLASH, we apply SNUC to de-rive two-dimensional models of early-type galaxies in the CLASHclusters since it is capable of simultaneously obtaining the best non-linear least-squares fits to the two-dimensional surface brightnessdistributions in multiple, overlapping galaxies (see Lauer 1986).
We perform the surface brightness reconstruction of the arcswhere S/N > 0.5. In Fig. 8, we show the arcs in the F775W filterwith the bright nearby galaxies subtracted, and we show in black thecontours of the area we mask for reconstruction. When performingthe surface brightness reconstruction of systems 3 to 4, we fix themass profile parameters of the smooth DH, GR and BCG to thevalues obtained from the model ‘w/σ ’. Then, we only optimize themass profile parameters associated with the three cluster membersG1, G2 and G3 close to the arcs (see Fig. 8). As before, positionand shape parameters of these three galaxies are estimated using
3 see http://astronomy.nmsu.edu/holtz/xvista/index.html and Lauer (1986).
Figure 9. Surface brightness reconstruction of the giant southern arcs(20 arcsec × 10 arcsec cutout, which corresponds to ∼60 kpc × 30 kpcat the cluster redshift). Upper panel show the arcs in the HST/ACS/F775Wfilter, the central panel shows the reconstruction of the arc in this filter, andthe lower panel shows the residuals.
the values traced by the light. For G1 and G2, we optimize the PAand b/a with Gaussian prior using their 10 per cent error as width.We also optimize their measured velocity dispersions within theiruncertainties using a Gaussian prior. For G3 we have no measuredσ sp, so we use the σ G3 resulting from the model ‘w/σ ’, and optimizeit within the 1σ uncertainties with a Gaussian prior. Finally, weoptimize the truncation radii of these three galaxies (G1 to G3)within the wide range of [1,100] kpc with a flat prior and we alsoallow for a core radius for G1 and G2.
The final best model has a reduced χ2img = 1.4 from all images
positions. In Fig. 9, we show the arc reconstructed, the originalimage and the residual between these two images. The χ2 from thepixelated surface brightness reconstruction of the southern arcs isχ2
SB = 0.78. In Fig. 10, we present the reconstruction of the unlensedsource. It shows an irregular light distribution which consists of fiveclumps. The clumps A–B corresponds to the system 3 in the point-like models, while the clumps C–D–E to system 4. Irregular lightdistribution seems to be common to galaxies at redshift z > 2. TheHubble morphological sequence applies to galaxy population fromthe local Universe up to intermediate redshifts z ∼ 1–2 (e.g. seeGlazebrook et al. 1995; Stanford et al. 2004). At higher redshifts,the majority of galaxies shows irregular and clumpy morphology(e.g. see Dickinson 2000; Conselice, Blackburne & Papovich 2005;Talia et al. 2014). The source reconstructed has a size of ∼0.5 arcsec,which corresponds to ∼4 kpc at zs = 2.58. Galaxies in the redshiftrange z ∼ 2–3.5 typically have radius ranging between 1 and 5 kpc(e.g. see Bouwens et al. 2004; Oesch et al. 2009). Thus, the size
MNRAS 447, 1224–1241 (2015)
at California Institute of T
echnology on April 9, 2015
http://mnras.oxfordjournals.org/
Dow
nloaded from

Constraining the galaxy mass content in A383 1235
Figure 10. Source reconstruction of the southern arc (1.3 arcsec × 1.0 arc-sec cutout, which corresponds to ∼10 kpc × 8 kpc at the redshift of thesource). The grey lines are the caustics. The reconstructed source is com-posed of five clumps (red dashed contours). The clumps A–B correspondsto the system 3 in the point-like models, while C–D–E are the light recon-struction of system 4.
Table 5. Most probable parameters with the respective 1σ
errors for the dPIE mass distribution of the cluster membersclose to the reconstructed giant arcs. The total mass is esti-mated according to equation (6).
Galaxy ‘wo/σ ’ ‘w/σ ’ Ext model
G1b/a 0.8 0.8 0.82 ± 0.01
PA 151 151 150.7 ± 0.6
σ (km s−1) 253 ± 23 252 ± 14 239 ± 2
rcore (kpc) 0. 0. 1.3 ± 0.1
rtr (kpc) 47.8 ± 20.9 56.8+24.8−25.6 50.5+3.6
−4.6
M (1012 M) 2.2 ± 1.4 2.6+1.4−1.5 2.1 ± 0.2
G2
b/a 0.58 0.58 0.57 ± 0.01
PA 63 63 63 ± 1
σ (km s−1) 194+54−45 201 ± 20 186+4
−7
rcore (kpc) 0. 0. 0.3+0.3−0.2
rtr (kpc) 32.2+31.5−23.4 53.2+49.2
−36.3 68.8+10.0−10.9
Mtot (1012 M) 0.9+1.3−1.1 1.6+1.8
−1.4 1.7 ± 1.3
G3
b/a 0.93 0.93 0.57 ± 0.01PA 65 65 65
σ (km s−1) 109+20−16 120 ± 7 128 ± 2
rcore (kpc) 0. 0. 0.rtr (kpc) 9.6+12.2
−5.3 4.1+2.5−1.7 2.9 ± 0.4
Mtot (1012 M) 0.08+0.14−0.07 0.04+0.02
−0.03 0.04 ± 0.01
of the source we reconstruct at zs = 2.58 is consistent with valueexpected for galaxies at high redshift.
In Table 5, we list the most probable mass parameters and theirrespective 1σ uncertainties for G1, G2 and G3. Here, we focuson the parameters for G1 and G2, to compare them with results fromthe point-like models. The ellipticity and PA are stable relative tothe values extracted from the light profiles for both galaxies. G1 getsa velocity dispersion of σ = 239 ± 2 km s−1, which is consistentwith previous results within the 1σ uncertainties. The core radius
is 1.3 ± 0.1 kpc and the truncation radius is 50.5+3.6−4.6 kpc. For
G2, we get σ = 186+4−7 km s−1, rc = 0.3+0.3
−0.2 kpc (consistent withzero) and rtr = 68.8+10.0
−10.9 kpc. In Fig. 7, we plot the results forG1 and G2 to compare them with the prediction from the scalingrelations obtained from the point-like modelling. In the previousmodels, these two galaxies get truncation radii which are severaltimes larger than the predictions from the respective luminosityscaling laws in equations (12) and (13). The surface brightnessreconstruction of the southern arcs leads to similar results. Both thegalaxies have truncation radius larger than the respective predictionsfrom the global scaling law. However, comparing the rtr predictionof these two galaxies from the three analyses performed in thiswork, they are all consistent with each others within the 1σ errors.In Appendix A, we plot the MCMC sampling of the DH parametersfor both G1 and G2. The total masses associated with the twogalaxies (see equation 5) are MG1 = 2.1 ± 0.2 × 10¹² M andMG2 = 1.7 ± 1.3 × 10¹² M, which are consistent with the massestimations from the point-like models. See Table 5 for a summaryof the mass profile parameters.
To infer the amount of stripped DM for galaxies in cluster cores,we can estimate the total mass that G1 and G2 would have if theywere in underdense environments, and compare them to their totalmass estimated with lensing in the cluster core. Brimioulle et al.(2013) estimated the rtr–σ scaling law for early-type field galax-ies, getting rtr,field = 245+64
−52 h−1100 kpc for a reference galaxy with
σ = 144 km s−1, assuming that rtr ∝ σ 2 in fields. Using this re-lation and equation (5), we can derive the mass that G1 and G2would have in the field. Assuming that the velocity dispersion ofthe halo does not change when a galaxy infalls in cluster and dur-ing the stripping process, we get that MG1
tot,SL/MG1tot,fields = 0.07 and
MG2tot,SL/MG2
tot,fields = 0.17, which imply that 93 and 83 per cent of themass has been stripped, respectively, for G1 and G2. This resultsis in agreement with numerical simulations of tidal stripping pro-cesses (see Warnick, Knebe & Power 2008; Limousin et al. 2009)which estimate that ∼90 per cent of the mass is lost for galaxies incluster cores.
7 D I S C U S S I O N A N D C O N C L U S I O N S
In this paper, we measured the mass distribution in the core ofA383 using point-like lensing constraints and by reconstructing thesurface brightness distribution of giant arcs. For the first time, weinclude in the lensing analyses the measurements of velocity disper-sions for 21 cluster members. These allow us to refine individuallythe constraints on the galaxy mass component and on the smoothDH mass profile.
In Section 5, we constructed two parallel models, one in whichwe include the measured σ sp and the other in which do not use suchinformation. We find that the σ SL values are globally in agreementwith the measured values at the 1σ level (see Fig. 5). Only fewgalaxies have σ SL slightly different from the measured velocity dis-persions, which are faint galaxies with large errors on the measuredvelocity dispersions. However, they agree at the 2σ level with thespectroscopic measurements.
In particular, when we optimize the mass profiles of cluster mem-bers individually, taking advantage of stronger constraints fromlensing, the σ SL predictions are in great agreement with the σ sp
measurements.The galaxy chosen as reference for the luminosity scaling rela-
tions has measured velocity dispersion. Thus, once we fix the expo-nents of the scaling relations (equations 7 and 8), the only parameter
MNRAS 447, 1224–1241 (2015)
at California Institute of T
echnology on April 9, 2015
http://mnras.oxfordjournals.org/
Dow
nloaded from

1236 A. Monna et al.
Figure 11. Galaxy scaling relations resulting from our and previous lensing analyses. The red lines are the 68 per cent confidence levels of the scaling relationsobtained in this work from the model ‘wo/σ ’ (red dashed lines) and ‘w/σ ’ (red lines). We also plot the measurements of the DH sizes of G1 and G2 resultingfrom the surface brightness reconstruction of the southern giant arcs. In yellow and cyan, we plot the 68 per cent confidence levels of the scaling relationsderived in Eichner et al. (2013) and Halkola et al. (2007), respectively. Natarajan et al. (2002) and Limousin et al. (2007) derive the halo sizes of galaxies inthe core of several clusters, using, respectively, strong and weak lensing analyses. Their results are plotted as green (Natarajan et al. 2002) and blue circles(Limousin et al. 2007). The uncertainties on the measurements of Limousin et al. (2007) are 1σ , 2σ and 3σ errors, depending on the cluster (see Limousinet al. 2007, for details). In addition, we plot individual measurements of galaxy haloes in a group, from Suyu & Halkola (2010, plotted in cyan), and in clusters,from Richard et al. (2010, in magenta) and Donnarumma et al. (2011, in black). The measurements from Donnarumma et al. (2011) are the parameters for thesix galaxies individually optimized in the core of A611, corresponding to the ‘case 6’ presented in their paper. Our scaling relation from the modelling ‘wo/σ ’is in agreement with all the previous measurements, except for two clusters from Natarajan et al. (2002), while the tighter relation resulting from our model‘w/σ ’ is consistent with the results from Limousin et al. (2007), Suyu & Halkola (2010) and part of results from Natarajan et al. (2002). See text for moredetails.
we need to constrain to estimate the global scaling laws is the trunca-tion radius rtr, GR. The results of the point-like models show that theknowledge of the cluster members velocity dispersions allows us toimprove the constraints on the rtr, GR and on the scaling relation by50 per cent. Faber et al. (2007) investigated the luminosity functionfor red and blue galaxies in several redshift bins up to z ∼ 1. For thered galaxy sample with redshift 0.2 � z < 0.4, a typical L∗ galaxyhas M∗
B = −20.95+0.16−0.17 in AB system. According to our final scaling
relation ‘w/σ ’ (equation 13), such a typical L∗ red galaxy at z ∼ 0.2has a truncation radius of r∗
tr = 20.5+9.6−6.7 kpc, velocity dispersion of
σ ∗ = 324 ± 17 km s−1 and total mass M∗tot = 1.57+0.75
−0.54 × 10¹² M.Natarajan et al. (2009), combining strong and weak lensing anal-
yses, investigated the DH of galaxies in the core of CL 0024+16 atz = 0.39 for early- and late-type galaxies as a function of their dis-tance from the cluster centre. They found that the DH mass of a fidu-cial L∗ early-type galaxy increases with the distance from the clustercentre, from M∗ = 6.3+2.7
−2.0 × 10¹¹ M in the core (r < 0.6 Mpc) toM∗ = 3.7+1.4
−1.1 × 10¹² M in the outskirts. This is consistent withour results for a L∗ galaxy in the core of A383 at the 2σ level.
Limousin et al. (2009), using N-boby hydrodynamical simula-tions, probed the tidal stripping of galaxy DH in clusters in theredshift range zcl = [0, 0.7]. They used the half-mass radii r1/2 ofgalaxies to quantify the extent of their DH, which correspond to ourrtr for dPIE profile with vanishing core radius. They found that ther1/2 and the total DH mass of the galaxies decrease moving from
the outskirts to the core of the clusters, showing that galaxies inthe core experience stronger stripping than the ones in the outer re-gions. In particular, galaxies in the core (r < 0.6 Mpc) are expectedto have r1/2 < 20 kpc. In this work, we analysed the halo proper-ties of galaxies in the core of A383, with projected radial distanceR < 1.5 arcmin = 0.3 Mpc. Our results from the model ‘w/σ ’ arein great agreement with the predictions of Limousin et al. (2009),confirming that the sample of cluster members we investigated inthe core of A383 experienced strong tidal stripping.
In Fig. 11, we compare our results for the scaling law betweenthe truncation radius and velocity dispersion with results from pre-vious analyses. In Eichner et al. (2013), we measured the galaxies’scaling relation in the cluster MACS1206 at z = 0.439 perform-ing an analysis similar to the one presented here for A383, butwithout the knowledge of cluster members’ velocity dispersions.For MACS1206, we obtained rtr = 35 ± 8 kpc(σ/186 km s−1)4/3,which is consistent with the result for A383 from the point-likemodel ‘wo/σ ’, but it is not in agreement at the 1σ level with thetighter scaling relation we get from the model “w/σ”. This is alsothe case when we compare our results with the ones presented inHalkola et al. (2007), where strong lensing is used to derive thesize of galaxy haloes in the core of Abell 1689. They tested theassumption of two different exponents for the rtr–σ relation, usingα/δ = 1, 2 (see equation 8). The reference truncation radii result-ing from their two models are consistent and they conclude that
MNRAS 447, 1224–1241 (2015)
at California Institute of T
echnology on April 9, 2015
http://mnras.oxfordjournals.org/
Dow
nloaded from

Constraining the galaxy mass content in A383 1237
galaxies in the core of the cluster are strongly truncated. For sim-plicity in Fig. 11, we plot only their results for α/δ = 1, which iscloser to the exponent assumed in our analyses. The scaling relationsfrom Eichner et al. (2013) and Halkola et al. (2007) deviate fromour relations. This can be a result of the different clusters analysed.Another reason could be that, by scaling all the cluster members(including the brighter ones) with the same law, the resulting sizesare overestimated. Bright cluster members, which have been centralgalaxies before accretion to the cluster, have not yet been stronglystripped as fainter galaxies which have been satellites for a longtime. Indeed, one expects that the dispersion of halo mass is largerfor bright galaxies than for fainter ones, depending on whether theyhave been a satellite or central galaxy at accretion of the cluster. Inour analysis, several brighter central galaxies (GR, BCG, G1, G2)are individually optimized, and the scaling laws mainly applies togalaxies which have been satellites for a long time.
Suyu & Halkola (2010) derived the size for a satellite halo ina galaxy group at z = 0.35, which has a projected distance fromthe centre of galaxy group of R ∼ 26 kpc. The truncation radii andvelocity dispersion estimated for this satellite are rtr = 6.0+2.9
−2.0 kpcfor σsat = 127+22
−12 km s−1, respectively. This is in good agreementwith predictions from our scaling law ‘w/σ ’ at low velocity disper-sions, and support that our scaling law is representative for satellitegalaxies.
Natarajan, Kneib & Smail (2002), combining strong and weaklensing analyses, investigated properties of galaxies in six massiveclusters spanning the redshift range z = 0.17–0.58, using archivalHST data. They found that galaxies are tidally truncated in clusters,and in particular their results for three clusters of the sample (A2390,AC114, CL0054-27) are in good agreement with our results fromthe modelling ‘w/σ ’.
Limousin et al. (2007) used weak lensing to measure the sizeof galaxies in five clusters at z ∼ 0.2, including A383, covering awide FOV with R < 2 Mpc. Globally, they find that galaxies withvelocity dispersion within [150, 250] km s−1 have truncation radiilower than 50 kpc, with mean value of 13 kpc, which is consistentwith predictions from our scaling laws. In particular for A383, theypredicted rtr = 13+37
−12 kpc for a galaxy with σ = 175+66−143 km s−1 (in
agreement with our results).Finally, Richard et al. (2010) and Donnarumma et al. (2011) mea-
sured the halo size of individual galaxies in the core of Abell 370(z = 0.375) and Abell 611 (z = 0.288), respectively, taking advan-tage of direct strong lensing constraints on the galaxies. Their analy-ses predict larger truncation radii for these galaxies when comparedto our ‘w/σ ’ scaling law, but they are consistent with our resultsfrom the model ‘wo/σ ’ at the 1σ level (see Fig. 11).
The estimates from these previous works are still degeneratewith the velocity dispersions they used. Here in this work, for thefirst time we broke this degeneracy using measurements of clustermembers velocity dispersions.
To improve the constraints on the halo size of individual galaxiesin the core of the cluster, we performed the surface brightnessreconstruction of the southern giant arcs. This allowed us to measurethe rtr of two close cluster members, G1 and G2, for which we havemeasured velocity dispersions. With this analysis, we improve theconstraints by more than 30 per cent on the halo size of these twogalaxies. The results are also plotted in Fig. 11, which shows thatthese two galaxies deviate from the global scaling law derived forthe cluster. This could mean that G1 and G2 have been centralgalaxies before accretion to the cluster and suffered less strippingthan fainter galaxies which have been satellites. However, usingequation (6) we estimated the total mass associated with the DH for
G1 and G2 and compared these values with the mass they wouldhave without suffering any stripping for the interaction with thecluster DH and the other galaxies. It results that 93 and 83 per centof the mass has been stripped, respectively, for G1 and G2, inagreement with results from numerical simulations which predictthat galaxies in cluster cores lose 90 per cent of their mass due totidal stripping.
In this paper, we have shown that the degeneracy in the analyticscaling relation, adopted for cluster members in lens modelling,can be broken using measured velocity dispersions of individualcluster galaxies. The knowledge of cluster members σ sp yields toimprovements both on the fit and on the constraints on the massshape and composition. We found that galaxies in cluster coresare strongly truncated, which is overall in agreement with previousmeasurements and also with prediction from numerical simulations.High-resolution photometric and spectroscopic data, combined withgalaxy kinematics, allow us to constrain to a higher level the galaxyscaling law in core of clusters, and also to individually identify clus-ter members which deviate from the global scaling law measuredfor the cluster, as G1 and G2.
This was a first case study on a well-studied lensing cluster, A383.In the near future, we plan to apply this new technique to a largersample of clusters, and explore further the treasury of using clustermembers measured velocity dispersions in lensing analysis.
AC K N OW L E D G E M E N T S
This work is supported by the Transregional Collaborative ResearchCentre TRR 33 – The Dark Universe and the DFG cluster of ex-cellence ‘Origin and Structure of the Universe. The CLASH Multi-Cycle Treasury Program (GO-12065) is based on observations madewith the NASA/ESA Hubble Space Telescope. The Space TelescopeScience Institute is operated by the Association of Universities forResearch in Astronomy, Inc. under NASA contract NAS 5-26555.The Dark Cosmology Centre is funded by the DNRF. Support forAZ is provided by NASA through Hubble Fellowship grant #HST-HF-51334.01-A awarded by STScI. The Smithsonian Institutionsupports the research of DGF, MJG, and HSH. We thank DanielGruen for his contribution to the improvement of the text.
R E F E R E N C E S
Abdelsalam H. M., Saha P., Williams L. L. R., 1998, MNRAS, 294, 734Arnouts S., Cristiani S., Moscardini L., Matarrese S., Lucchin F., Fontana
A., Giallongo E., 1999, MNRAS, 310, 540Bartelmann M., 2010, Class. Quantum Gravity, 27, 233001Bender R., Burstein D., Faber S. M., 1992, ApJ, 399, 462Bertin E., Arnouts S., 1996, A&AS, 117, 393Bouwens R. J., Illingworth G. D., Blakeslee J. P., Broadhurst T. J., Franx
M., 2004, ApJ, 611, L1Brimioulle F., Seitz S., Lerchster M., Bender R., Snigula J., 2013, MNRAS,
432, 1046Calzetti D., Armus L., Bohlin R. C., Kinney A. L., Koornneef J., Storchi-
Bergmann T., 2000, ApJ, 533, 682Coe D., Fuselier E., Benıtez N., Broadhurst T., Frye B., Ford H., 2008, ApJ,
681, 814Conselice C. J., Blackburne J. A., Papovich C., 2005, ApJ, 620, 564D’Aloisio A., Natarajan P., 2011, MNRAS, 411, 1628Dickinson M., 2000, Phil. Trans. R. Soc. A, 358, 2001Diego J. M., Protopapas P., Sandvik H. B., Tegmark M., 2005, MNRAS,
360, 477Djorgovski S., Davis M., 1987, ApJ, 313, 59Donnarumma A. et al., 2011, A&A, 528, A73
MNRAS 447, 1224–1241 (2015)
at California Institute of T
echnology on April 9, 2015
http://mnras.oxfordjournals.org/
Dow
nloaded from
1238 A. Monna et al.
Dressler A., Lynden-Bell D., Burstein D., Davies R. L., Faber S. M., Ter-levich R., Wegner G., 1987, ApJ, 313, 42
Eichner T. et al., 2013, ApJ, 774, 124Elıasdottir A. et al., 2007, preprint (arXiv:0710.5636)Faber S. M., Dressler A., Davies R. L., Burstein D., Lynden-Bell D., 1987,
in Faber S. M., ed., Nearly Normal Galaxies. From the Planck Time tothe Present. Springer-Verlag, Berlin, p. 175
Faber S. M., Jackson R. E., 1976, ApJ, 204, 668Faber S. M. et al., 2007, ApJ, 665, 265Fabricant D. et al., 2005, PASP, 117, 1411Fabricant D., Chilingarian I., Hwang H. S., Kurtz M. J., Geller M. J.,
Del’Antonio I. P., Rines K. J., 2013, PASP, 125, 1362Focardi P., Malavasi N., 2012, ApJ, 756, 117Fritz A., Bohm A., Ziegler B. L., 2009, MNRAS, 393, 1467Geller M. J., Hwang H. S., Diaferio A., Kurtz M. J., Coe D., Rines K. J.,
2014, ApJ, 783, 52Glazebrook K., Ellis R., Santiago B., Griffiths R., 1995, MNRAS, 275, L19Greisel N., Seitz S., Drory N., Bender R., Saglia R. P., Snigula J., 2013,
ApJ, 768, 117Grillo C. et al., 2014, preprint (arXiv:1407.7866)Halkola A., Seitz S., Pannella M., 2006, MNRAS, 372, 1425Halkola A., Seitz S., Pannella M., 2007, ApJ, 656, 739Hoekstra H., Franx M., Kuijken K., Carlberg R. G., Yee H. K. C., 2003,
MNRAS, 340, 609Host O., 2012, MNRAS, 420, L18Ilbert O. et al., 2006, A&A, 457, 841Ilbert O. et al., 2009, ApJ, 690, 1236Jorgensen I., Franx M., Kjaergaard P., 1995, MNRAS, 276, 1341Jullo E., Kneib J.-P., Limousin M., Elıasdottir A., Marshall P. J., Verdugo
T., 2007, New J. Phys., 9, 447Kassiola A., Kovner I., 1993, in Surdej J., Fraipont-Caro D., Gosset E., Refs-
dal S., Remy M., eds, Proc. Liege International Astrophysical Colloquia,Vol. 31, Gravitational Lenses in the Universe. Institut d’Astrophysique,Universite de Liege, Liege, p. 571
Kneib J.-P., Natarajan P., 2011, A&AR, 19, 47Koekemoer A. M. et al., 2011, ApJS, 197, 36Koleva M., Prugniel P., Bouchard A., Wu Y., 2009, A&A, 501, 1269Kormendy J., Bender R., 2013, ApJ, 769, L5Kurtz M. J., Mink D. J., 1998, PASP, 110, 934Lauer T. R., 1986, ApJ, 311, 34Limousin M., Kneib J. P., Bardeau S., Natarajan P., Czoske O., Smail I.,
Ebeling H., Smith G. P., 2007, A&A, 461, 881Limousin M., Sommer-Larsen J., Natarajan P., Milvang-Jensen B., 2009,
ApJ, 696, 1771Merritt D., 1983, ApJ, 264, 24Monna A. et al., 2014, MNRAS, 438, 1417Natarajan P., Kneib J.-P., 1997, MNRAS, 287, 833Natarajan P., Kneib J.-P., Smail I., 2002, ApJ, 580, L11Natarajan P., Kneib J.-P., Smail I., Treu T., Ellis R., Moran S., Limousin M.,
Czoske O., 2009, ApJ, 693, 970Navarro J., Frenk C., White S., 1997, ApJ, 490, 439 (NFW)Newman A. B., Treu T., Ellis R. S., Sand D. J., 2011, ApJ, 728, L39Oesch P. A. et al., 2009, ApJ, 690, 1350Peng C. Y., Ho L. C., Impey C. D., Rix H.-W., 2010, AJ, 139, 2097Postman M. et al., 2012a, ApJS, 199, 25
Postman M. et al., 2012b, ApJ, 756, 159Prevot M. L., Lequeux J., Prevot L., Maurice E., Rocca-Volmerange B.,
1984, A&A, 132, 389Richard J., Kneib J.-P., Limousin M., Edge A., Jullo E., 2010, MNRAS,
402, L44Richard J., Kneib J.-P., Ebeling H., Stark D. P., Egami E., Fiedler A. K.,
2011, MNRAS, 414, L31Rusin D. et al., 2003, ApJ, 587, 143Sand D. J., Treu T., Smith G. P., Ellis R. S., 2004, ApJ, 604, 88Sand D. J., Treu T., Ellis R. S., Smith G. P., Kneib J.-P., 2008, ApJ, 674, 711Schneider P., 2003, preprint (arXiv:astro-ph/0306465)Smith G. P., Kneib J.-P., Ebeling H., Czoske O., Smail I., 2001, ApJ, 552,
493Smith G. P., Kneib J.-P., Smail I., Mazzotta P., Ebeling H., Czoske O., 2005,
MNRAS, 359, 417Stanford S. A., Dickinson M., Postman M., Ferguson H. C., Lucas R. A.,
Conselice C. J., Budavari T., Somerville R., 2004, AJ, 127, 131Suyu S. H., Halkola A., 2010, A&A, 524, A94Suyu S. H., Marshall P. J., Hobson M. P., Blandford R. D., 2006, MNRAS,
371, 983Suyu S. H. et al., 2012, ApJ, 750, 10Talia M., Cimatti A., Mignoli M., Pozzetti L., Renzini A., Kurk J., Halliday
C., 2014, A&A, 562, A113von der Linden A., Best P. N., Kauffmann G., White S. D. M., 2007,
MNRAS, 379, 867Warnick K., Knebe A., Power C., 2008, MNRAS, 385, 1859Warren S. J., Dye S., 2003, ApJ, 590, 673Ziegler B. L., Bender R., 1997, MNRAS, 291, 527Zitrin A. et al., 2009, MNRAS, 396, 1985Zitrin A. et al., 2011, ApJ, 742, 117
A P P E N D I X A : M C M C SA M P L I N G O F T H EP O I N T-L I K E M O D E L S
We show here the MCMC sampling of the parameters describingthe cluster DH and the physical parameters for the galaxies thatwe optimized individually through our analyses. The grey-scalescorrespond to 68.3 per cent (black), 95.5 per cent (dark grey) and99.7 per cent (light grey). In Fig. A1, we show the MCMC samplingof the parameters of the smooth DH mass profile of the cluster, bothfor the point-like model ‘wo/σ ’ (upper panel) and ‘w/σ ’. In Fig. A2,we show the sampling of the mass parameters for the four galaxiesindividually optimized in the point-like models. The upper panelshows the results for the model ‘wo/σ ’ and the lower one the resultsfor the model ‘w/σ ’. The galaxies truncation radii present largeerrors in the model ‘wo/σ ’, and including the measured velocitydispersions of the 21 cluster members allows us to improve theconstraints on the halo size of the reference galaxy by 50 per cent.Performing the surface brightness reconstruction of the southernarcs improves the constraints also on the individual galaxies G1 andG2 close to the arcs, as can be seen from the MCMC sampling ofthis model presented in Fig. A3.
MNRAS 447, 1224–1241 (2015)
at California Institute of T
echnology on April 9, 2015
http://mnras.oxfordjournals.org/
Dow
nloaded from

Constraining the galaxy mass content in A383 1239
Figure A1. MCMC sampling of the DH parameters for the models ‘wo/σ ’ (upper panel) and ‘w/σ ’ (lower panel). The angles paγ and paDH are given inradians, xDH and yDH in arcseconds with respect to the BCG position, rcore and E are in arcseconds as well.
MNRAS 447, 1224–1241 (2015)
at California Institute of T
echnology on April 9, 2015
http://mnras.oxfordjournals.org/
Dow
nloaded from

1240 A. Monna et al.
Figure A2. MCMC parameters for GR, BCG, G1 and G2 from the model without (upper panel) and with sigma (lower panel). The truncation radii and E
are in arcseconds as in the previous plot.
MNRAS 447, 1224–1241 (2015)
at California Institute of T
echnology on April 9, 2015
http://mnras.oxfordjournals.org/
Dow
nloaded from
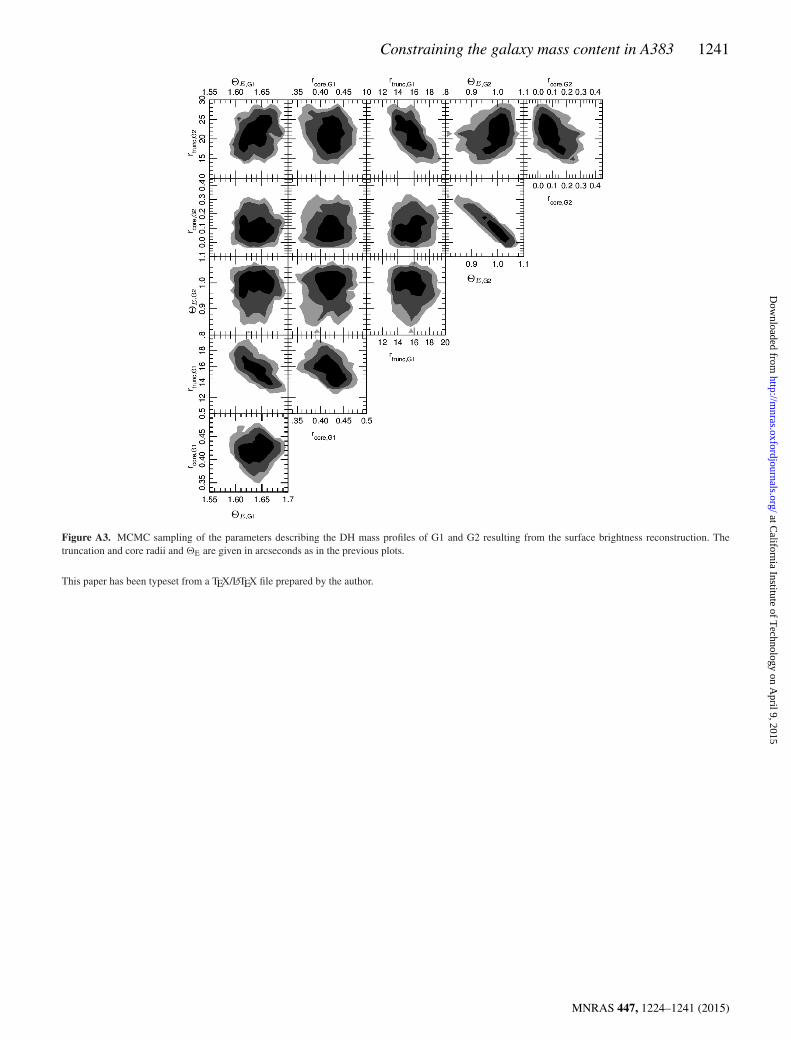
Constraining the galaxy mass content in A383 1241
Figure A3. MCMC sampling of the parameters describing the DH mass profiles of G1 and G2 resulting from the surface brightness reconstruction. Thetruncation and core radii and E are given in arcseconds as in the previous plots.
This paper has been typeset from a TEX/LATEX file prepared by the author.
MNRAS 447, 1224–1241 (2015)
at California Institute of T
echnology on April 9, 2015
http://mnras.oxfordjournals.org/
Dow
nloaded from