constitutive modeling of frozen soils
TRANSCRIPT

Constitutive modeling of frozen soilsPoreLab Kick-off Meeting
Gustav Grimstad and Seyed Ali Ghoreishian Amiri
Department of Civil and Transport Engineering, NTNU
6th to 8th of Sept. 2017

Overview
• Background
• Main features in the behavior of frozen soils
• Elasto-plastic model
• Elasto-viscoplastic model
• Results
2

Background
• Challenges in the arctic
– Coastal erosion
– Settlements
– Thawing permafrost
• Challenges in the
subpolar and
temperate zones
– Seasonal frost
3

Background (cont.)
• Artificial ground freezing
4

Frozen soil testing at NTNU
• New 20MPa triaxial cell (GDS)• -30°C to + 65°C• Up to 250 kN of axial load• Accurate high pressure volume controllers• Local displacement transducers
5

Example
• Heat storage and (over)extraction
6

The physical system of 1D ground freezing
Freezing region
Unfrozen soilSoil grains, water
Water migration
Frozen soilSoil grains, water, ice
Phase change
Heave
Thermal flux
7

Modelling of frozen soils
• Total stress models
– Pure mechanical
– Parameters given for one temperature -> change in temp. ->
change in parameters
• Effective stress models
– For THM modelling
– Ice as fluid or solid?
8

Saturated frozen soils
sw + si = 1
9

Poor ice soils:
→ Binding effects on grains
→ Ice cementation
Ice rich soils:
→ Decreases grains contact
An increase in ice content
results in an increase in
strength
An increase in ice content
results in a decrease in
strength
Schematic of ice increasing in an ice rich soil body
(Li et al. 2002)
Effect of total moisture on strength of frozen soil
(adopted from Baker 1979)
Ice content
10

Decreasing temperature results in:
→ An increase in elastic modulus
→ An increase in strength
In other word: Change of behavior from plastic type to a brittle type
Stress-strain curves at different temperatures
(Xu 2014)
Temperature
11

Relation between strength and confining pressure (Chamberlin et al. 1972)
Low pressure: (Region I)→ Confining pressure makes the solid phase (soil and ice) more compact→ Strength increases with confining pressure
High pressure: (Region 2)→ Ice in the sample begins to be crushed→ Pressure melting occurs→ Strength decreases with confining pressure
Higher pressure: (Region 3)→ Ice content tends to zero→ Strength increases with confining pressure
Confining pressure
12

Increasing strain rate results in:
→ An increase in strength
→ More brittle behavior
Stress-strain curves at different strain rates (Arenson et al. 2004)
Strain rate
13

Clausius-Clapeyron Equation:
Suction (Temperature)f
Freezing Characteristic Function:
Ice content (Suction)f
Studying the effect of suction could be sufficient for
capturing the effects of ice content and temperature
Cryogenic suction
14

Curvature-induced pre-melting mechanism
Result of surface tension
Acts very similar to capillary suction
Bonding the grains together
Interfacial pre-melting mechanism
Result of disjoining pressure
Acts as a repelling force between ice and grains
Tends to widen the gap by sucking in more water
Combination of these mechanisms
controls the behavior against ice
content and temperature variations.
Pre-melting Dynamic (Weelaufer and Worster 2006)
15

Frozen soil could be explained by
The behavior will be explained in two stress-state variables framework:
Solid phase (consists of
soil particles and ice)
Water phase
*
w ws p σ σ I
0
lncry w i i
TS p p l
T
Solid phase
stress:
Cryogenic
suction:
Elastoplatic Model
16
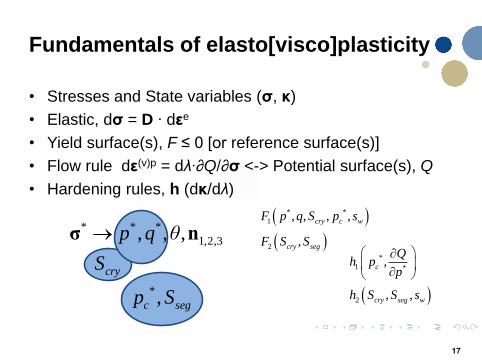
Fundamentals of elasto[visco]plasticity
• Stresses and State variables (σ, κ)
• Elastic, dσ = D ∙ dεe
• Yield surface(s), F ≤ 0 [or reference surface(s)]
• Flow rule dε(v)p = dλ∙∂Q/∂σ <-> Potential surface(s), Q
• Hardening rules, h (dκ/dλ)
* * *
1,2,3, , ,p q θσ n
cryS
* *
1
2
, , , ,
,
cry c w
cry seg
F p q S p s
F S S
*,c segp S
*
1 *
2
,
, ,
c
cry seg w
Qh p
p
h S S s
17

*p
cS Yield surface for ice segregation
Due to ice cohesion
*p
*q
Yield surfaces in Scry – p* space Yield surface in p* - q space
*p
*q
cS
Complete yield surfaces:
Elastoplastic model (cont.)
18

(cont.)
• By freezing, the material goes from a porous
material to a non-porous material
• Yield and plastic potential should be
saturation dependent
2
** * *
1
m
t t w y t
qF p k S p k S s p k S
M
2 2* **
12
y t
w
p k S qQ s p
M
19

p
q
Reference Surface
Dynamic Surface
*
*
Over-stress method
Elasto-viscoplastic model
Dynamic SurfaceReference Surface
Current Suction
S p*
20

Model Results
21

Model Results: Triaxial tests under
different temperatures
Confining pressure: 1 MPa
Strain rate: Constant
22

Model Results: Compression tests at
different strain rates
Confining pressure: 1 MPa
Temperature: -3 C
23

Temperature = -5 °C Temperature = -15 ° C
Model Results: Creep tests at different
temperatures and stress level
24

Boundary Value Problems
25

BWPs
Artificial ground freezing, temperature distribution10 days 180 days
Artificial ground freezing, surface heave30 days 210 days
Manuel Aukenthaler, TUD and PLAXIS
26

BWP – Caen experiment
Hooman Rostami, NTNU
27

BWP – Caen experiment – cont.
28

Loading steps during 8 years of simulations
Loading Step (Years)
Load (MPa)
0-3 0.09
3-4 0.19
4-8 0.29
Ground surface Temperature variation
EVP- Plate loading experiment subjected to seasonal temperature variation (Zhang et al., 2014)
29

Gro
un
d t
em
pe
ratu
re (
oC
)
-15
+15
Cont.
30