constellation energy 2007 third quarter form 10-q
TRANSCRIPT

UNITED STATESSECURITIES AND EXCHANGE COMMISSION
Washington, D.C. 20549
FORM 10-Q
QUARTERLY REPORT PURSUANT TO SECTION 13 OR 15(d) OFTHE SECURITIES EXCHANGE ACT OF 1934
For The Quarterly Period Ended September 30, 2007
Commission IRS EmployerFile Number Exact name of registrant as specified in its charter Identification No.
1-12869 CONSTELLATION ENERGY GROUP, INC. 52-1964611
1-1910 BALTIMORE GAS AND ELECTRIC COMPANY 52-0280210
MARYLAND
(State of Incorporation of both registrants)
750 E. PRATT STREET, BALTIMORE, MARYLAND 21202
(Address of principal executive offices) (Zip Code)
410-783-2800
(Registrants’ telephone number, including area code)
NOT APPLICABLE
(Former name, former address and former fiscal year, if changed since last report)
Indicate by check mark whether the registrants (1) have filed all reports required to be filed by Section 13 or 15(d) of theSecurities Exchange Act of 1934 during the preceding 12 months, and (2) have been subject to such filing requirements for thepast 90 days. Yes � No �
Indicate by check mark whether Constellation Energy Group, Inc. is a large accelerated filer, an accelerated filer, or anon-accelerated filer. See definition of ‘‘accelerated filer’’ and ‘‘large accelerated filer’’ in Rule 12b-2 of the Exchange Act.(Check one):
Large accelerated filer � Accelerated filer � Non-accelerated filer �
Indicate by check mark whether Baltimore Gas and Electric Company is a large accelerated filer, an accelerated filer, or anon-accelerated filer. See definition of ‘‘accelerated filer’’ and ‘‘large accelerated filer’’ in Rule 12b-2 of the Exchange Act.(Check one):
Large accelerated filer � Accelerated filer � Non-accelerated filer �
Indicate by check mark whether Constellation Energy Group, Inc. is a shell company (as defined in Rule 12b-2 of theExchange Act) Yes � No �
Indicate by check mark whether Baltimore Gas and Electric Company is a shell company (as defined in Rule 12b-2 of theExchange Act) Yes � No �
Common Stock, without par value 180,653,530 shares outstanding ofConstellation Energy Group, Inc. on October 31, 2007.
Baltimore Gas and Electric Company meets the conditions set forth in General Instruction H(1)(a) and (b) of Form 10-Q andis therefore filing this form in the reduced disclosure format.

TABLE OF CONTENTS
Page
Part I—Financial Information
Item 1—Financial Statements
Constellation Energy Group, Inc. and Subsidiaries
Consolidated Statements of Income . . . . . . . . . . . . . . . . . . . . . . . . . . . . . . . . . . . . . . . . . . . . . . . . . . . . . . . . 3
Consolidated Statements of Comprehensive Income . . . . . . . . . . . . . . . . . . . . . . . . . . . . . . . . . . . . . . . . . . . 3
Consolidated Balance Sheets . . . . . . . . . . . . . . . . . . . . . . . . . . . . . . . . . . . . . . . . . . . . . . . . . . . . . . . . . . . . . . . 4
Consolidated Statements of Cash Flows . . . . . . . . . . . . . . . . . . . . . . . . . . . . . . . . . . . . . . . . . . . . . . . . . . . . . 6
Baltimore Gas and Electric Company and Subsidiaries
Consolidated Statements of Income . . . . . . . . . . . . . . . . . . . . . . . . . . . . . . . . . . . . . . . . . . . . . . . . . . . . . . . . 7
Consolidated Balance Sheets . . . . . . . . . . . . . . . . . . . . . . . . . . . . . . . . . . . . . . . . . . . . . . . . . . . . . . . . . . . . . . . 8
Consolidated Statements of Cash Flows . . . . . . . . . . . . . . . . . . . . . . . . . . . . . . . . . . . . . . . . . . . . . . . . . . . . . 10
Notes to Consolidated Financial Statements . . . . . . . . . . . . . . . . . . . . . . . . . . . . . . . . . . . . . . . . . . . . . . . . . . 11
Item 2—Management’s Discussion and Analysis of Financial Condition and Results of Operations
Introduction and Overview . . . . . . . . . . . . . . . . . . . . . . . . . . . . . . . . . . . . . . . . . . . . . . . . . . . . . . . . . . . . . . . 26
Business Environment . . . . . . . . . . . . . . . . . . . . . . . . . . . . . . . . . . . . . . . . . . . . . . . . . . . . . . . . . . . . . . . . . . . . 26
Critical Accounting Policies . . . . . . . . . . . . . . . . . . . . . . . . . . . . . . . . . . . . . . . . . . . . . . . . . . . . . . . . . . . . . . . 28
Events of 2007 . . . . . . . . . . . . . . . . . . . . . . . . . . . . . . . . . . . . . . . . . . . . . . . . . . . . . . . . . . . . . . . . . . . . . . . . . . 28
Results of Operations . . . . . . . . . . . . . . . . . . . . . . . . . . . . . . . . . . . . . . . . . . . . . . . . . . . . . . . . . . . . . . . . . . . . 30
Financial Condition . . . . . . . . . . . . . . . . . . . . . . . . . . . . . . . . . . . . . . . . . . . . . . . . . . . . . . . . . . . . . . . . . . . . . . 48
Capital Resources . . . . . . . . . . . . . . . . . . . . . . . . . . . . . . . . . . . . . . . . . . . . . . . . . . . . . . . . . . . . . . . . . . . . . . . . 50
Item 3—Quantitative and Qualitative Disclosures About Market Risk . . . . . . . . . . . . . . . . . . . . . . . . . . . . . . . . . . . . . . 55
Item 4—Controls and Procedures . . . . . . . . . . . . . . . . . . . . . . . . . . . . . . . . . . . . . . . . . . . . . . . . . . . . . . . . . . . . . . . . . . . . . 55
Part II—Other Information
Item 1—Legal Proceedings . . . . . . . . . . . . . . . . . . . . . . . . . . . . . . . . . . . . . . . . . . . . . . . . . . . . . . . . . . . . . . . . . . . . . . . . . . . 56
Item 1A—Risk Factors . . . . . . . . . . . . . . . . . . . . . . . . . . . . . . . . . . . . . . . . . . . . . . . . . . . . . . . . . . . . . . . . . . . . . . . . . . . . . . 56
Item 2—Unregistered Sales of Equity Securities and Use of Proceeds . . . . . . . . . . . . . . . . . . . . . . . . . . . . . . . . . . . . . . . 56
Item 5—Other Information . . . . . . . . . . . . . . . . . . . . . . . . . . . . . . . . . . . . . . . . . . . . . . . . . . . . . . . . . . . . . . . . . . . . . . . . . . 57
Item 6—Exhibits . . . . . . . . . . . . . . . . . . . . . . . . . . . . . . . . . . . . . . . . . . . . . . . . . . . . . . . . . . . . . . . . . . . . . . . . . . . . . . . . . . . 58
Signature . . . . . . . . . . . . . . . . . . . . . . . . . . . . . . . . . . . . . . . . . . . . . . . . . . . . . . . . . . . . . . . . . . . . . . . . . . . . . . . . . . . . . . . . . . 59
2

PART 1—FINANCIAL INFORMATIONItem 1—Financial Statements
CONSOLIDATED STATEMENTS OF INCOME (UNAUDITED)
Conste l lat ion Energy Group, Inc . and Subsid iar ies
Three Months Ended Nine Months EndedSeptember 30, September 30,
2007 2006 2007 2006(In millions, except per share amounts)
RevenuesNonregulated revenues $ 4,965.4 $ 4,631.8 $13,332.1 $12,307.0Regulated electric revenues 778.2 649.9 1,837.3 1,652.6Regulated gas revenues 112.8 111.7 674.4 671.8
Total revenues 5,856.4 5,393.4 15,843.8 14,631.4Expenses
Fuel and purchased energy expenses 4,549.7 4,096.2 12,451.6 11,415.5Operating expenses 653.6 514.2 1,802.7 1,597.6Impairment losses and other costs — — 20.2 —Workforce reduction costs — 21.7 2.3 23.9Merger-related costs — 3.4 — 12.4Depreciation, depletion, and amortization 138.3 136.4 413.5 399.9Accretion of asset retirement obligations 16.0 17.0 51.9 50.2Taxes other than income taxes 73.7 73.6 219.7 218.7
Total expenses 5,431.3 4,862.5 14,961.9 13,718.2
Income from Operations 425.1 530.9 881.9 913.2Gains on Sale of CEP LLC Equity 39.2 — 52.1 —Other Income, primarily interest income 29.1 9.5 116.7 38.6Fixed Charges
Interest expense 80.3 83.1 231.7 239.3Interest capitalized and allowance for borrowed funds used during construction (5.2) (3.5) (13.6) (10.0)BGE preference stock dividends 3.3 3.3 9.9 9.9
Total fixed charges 78.4 82.9 228.0 239.2
Income from Continuing Operations Before Income Taxes 415.0 457.5 822.7 712.6Income Tax Expense 164.3 151.2 258.4 230.6
Income from Continuing Operations 250.7 306.3 564.3 482.0Income (loss) from discontinued operations, net of income taxes of $0.7, $10.1, $1.5 and $27.8,
respectively 0.7 18.1 (0.9) 49.5
Net Income $ 251.4 $ 324.4 $ 563.4 $ 531.5
Earnings Applicable to Common Stock $ 251.4 $ 324.4 $ 563.4 $ 531.5
Average Shares of Common Stock Outstanding—Basic 180.5 179.7 180.5 179.1Average Shares of Common Stock Outstanding—Diluted 182.8 181.6 182.8 180.9Earnings Per Common Share from Continuing Operations—Basic $ 1.39 $ 1.70 $ 3.13 $ 2.69
Income (loss) from discontinued operations — 0.11 (0.01) 0.28
Earnings Per Common Share—Basic $ 1.39 $ 1.81 $ 3.12 $ 2.97
Earnings Per Common Share from Continuing Operations—Diluted $ 1.37 $ 1.69 $ 3.09 $ 2.66Income (loss) from discontinued operations 0.01 0.10 (0.01) 0.28
Earnings Per Common Share—Diluted $ 1.38 $ 1.79 $ 3.08 $ 2.94
Dividends Declared Per Common Share $ 0.435 $ 0.3775 $ 1.305 $ 1.1325
CONSOLIDATED STATEMENTS OF COMPREHENSIVE INCOME (UNAUDITED)
Conste l lat ion Energy Group, Inc . and Subsid iar ies
Three Months Ended Nine Months EndedSeptember 30, September 30,
2007 2006 2007 2006
(In millions)Net Income $ 251.4 $ 324.4 $ 563.4 $ 531.5
Other comprehensive income (loss) (OCI)Hedging instruments:
Reclassification of net loss on hedging instruments from OCI to net income, net of taxes 275.1 193.0 833.4 407.1Net unrealized loss on hedging instruments, net of taxes (360.0) (369.7) (498.4) (1,418.7)
Available-for-sale securities:Reclassification of net gain on sales of securities from OCI to net income, net of taxes (0.5) — (3.3) (0.3)Net unrealized (loss) gain on securities, net of taxes (13.0) 16.7 0.7 20.0
Defined benefit obligations:Amortization of net actuarial loss, prior service cost, and transition obligation included in net
periodic benefit cost, net of taxes 5.8 — 18.3 —Net unrealized gain (loss) on foreign currency, net of taxes 3.3 (0.3) 6.4 0.8
Comprehensive Income (Loss) $ 162.1 $ 164.1 $ 920.5 $ (459.6)
See Notes to Consolidated Financial Statements.Certain prior-period amounts have been reclassified to conform with the current period’s presentation.
3
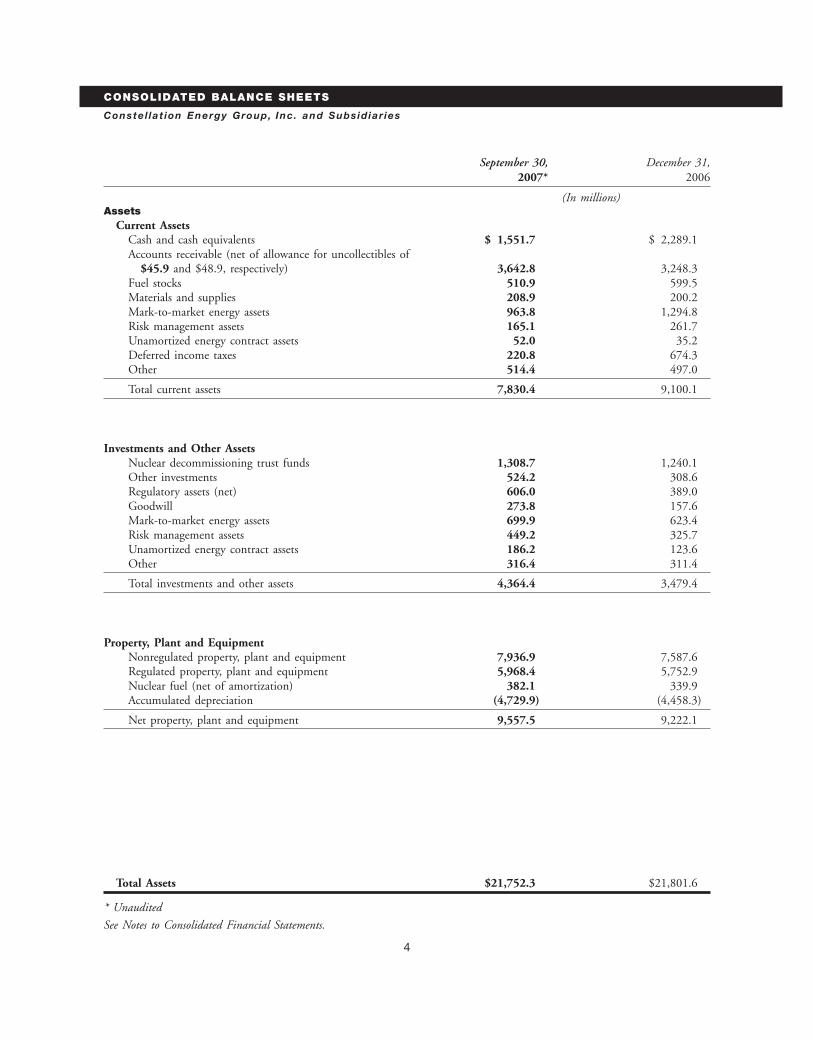
CONSOLIDATED BALANCE SHEETS
Conste l lat ion Energy Group, Inc . and Subsid iar ies
September 30, December 31,2007* 2006
(In millions)Assets
Current AssetsCash and cash equivalents $ 1,551.7 $ 2,289.1Accounts receivable (net of allowance for uncollectibles of
$45.9 and $48.9, respectively) 3,642.8 3,248.3Fuel stocks 510.9 599.5Materials and supplies 208.9 200.2Mark-to-market energy assets 963.8 1,294.8Risk management assets 165.1 261.7Unamortized energy contract assets 52.0 35.2Deferred income taxes 220.8 674.3Other 514.4 497.0
Total current assets 7,830.4 9,100.1
Investments and Other AssetsNuclear decommissioning trust funds 1,308.7 1,240.1Other investments 524.2 308.6Regulatory assets (net) 606.0 389.0Goodwill 273.8 157.6Mark-to-market energy assets 699.9 623.4Risk management assets 449.2 325.7Unamortized energy contract assets 186.2 123.6Other 316.4 311.4
Total investments and other assets 4,364.4 3,479.4
Property, Plant and EquipmentNonregulated property, plant and equipment 7,936.9 7,587.6Regulated property, plant and equipment 5,968.4 5,752.9Nuclear fuel (net of amortization) 382.1 339.9Accumulated depreciation (4,729.9) (4,458.3)
Net property, plant and equipment 9,557.5 9,222.1
Total Assets $21,752.3 $21,801.6
* Unaudited
See Notes to Consolidated Financial Statements.
4
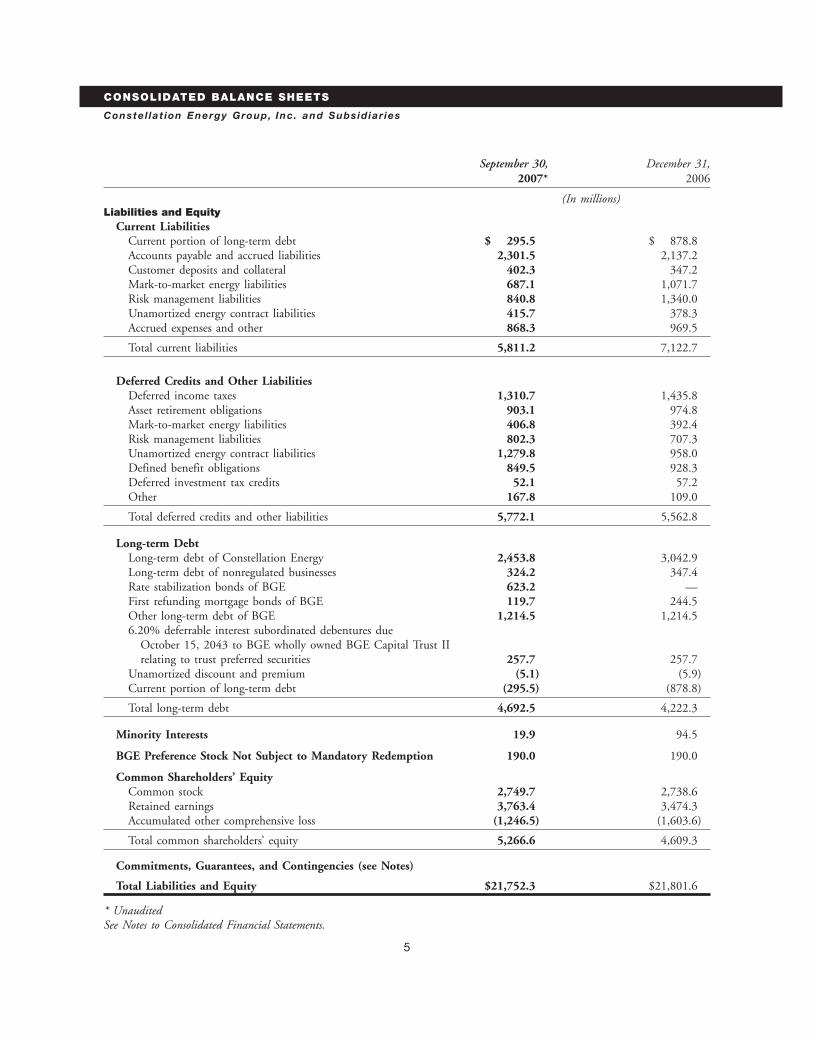
CONSOLIDATED BALANCE SHEETS
Conste l lat ion Energy Group, Inc . and Subsid iar ies
September 30, December 31,2007* 2006
(In millions)Liabilities and Equity
Current LiabilitiesCurrent portion of long-term debt $ 295.5 $ 878.8Accounts payable and accrued liabilities 2,301.5 2,137.2Customer deposits and collateral 402.3 347.2Mark-to-market energy liabilities 687.1 1,071.7Risk management liabilities 840.8 1,340.0Unamortized energy contract liabilities 415.7 378.3Accrued expenses and other 868.3 969.5
Total current liabilities 5,811.2 7,122.7
Deferred Credits and Other LiabilitiesDeferred income taxes 1,310.7 1,435.8Asset retirement obligations 903.1 974.8Mark-to-market energy liabilities 406.8 392.4Risk management liabilities 802.3 707.3Unamortized energy contract liabilities 1,279.8 958.0Defined benefit obligations 849.5 928.3Deferred investment tax credits 52.1 57.2Other 167.8 109.0
Total deferred credits and other liabilities 5,772.1 5,562.8
Long-term DebtLong-term debt of Constellation Energy 2,453.8 3,042.9Long-term debt of nonregulated businesses 324.2 347.4Rate stabilization bonds of BGE 623.2 —First refunding mortgage bonds of BGE 119.7 244.5Other long-term debt of BGE 1,214.5 1,214.56.20% deferrable interest subordinated debentures due
October 15, 2043 to BGE wholly owned BGE Capital Trust IIrelating to trust preferred securities 257.7 257.7
Unamortized discount and premium (5.1) (5.9)Current portion of long-term debt (295.5) (878.8)
Total long-term debt 4,692.5 4,222.3
Minority Interests 19.9 94.5
BGE Preference Stock Not Subject to Mandatory Redemption 190.0 190.0
Common Shareholders’ EquityCommon stock 2,749.7 2,738.6Retained earnings 3,763.4 3,474.3Accumulated other comprehensive loss (1,246.5) (1,603.6)
Total common shareholders’ equity 5,266.6 4,609.3
Commitments, Guarantees, and Contingencies (see Notes)
Total Liabilities and Equity $21,752.3 $21,801.6
* UnauditedSee Notes to Consolidated Financial Statements.
5

CONSOLIDATED STATEMENTS OF CASH FLOWS (UNAUDITED)
Conste l lat ion Energy Group, Inc . and Subsid iar ies
Nine Months Ended September 30, 2007 2006
(In millions)Cash Flows From Operating Activities
Net income $ 563.4 $ 531.5Adjustments to reconcile to net cash provided by operating activities
Gain on sales of discontinued operations — (0.9)Depreciation, depletion, and amortization 309.7 419.5Accretion of asset retirement obligations 51.9 50.2Deferred income taxes 118.7 73.8Investment tax credit adjustments (5.0) (5.2)Deferred fuel costs (248.7) (164.7)Defined benefit obligation expense 105.7 111.4Defined benefit obligation payments (153.7) (78.3)Workforce reduction costs 2.3 23.9Impairment losses and other costs 20.2 —Gains on sale of CEP LLC equity (52.1) —Equity in earnings of affiliates less than dividends received 36.6 12.9Proceeds from derivative power sales contracts classified as financing
activities under SFAS No. 149 15.1 (38.9)Changes in
Accounts receivable (142.1) (367.7)Mark-to-market energy assets and liabilities (55.7) (241.5)Risk management assets and liabilities (23.2) (3.1)Materials, supplies, and fuel stocks 10.9 (267.9)Other current assets 19.9 53.9Accounts payable and accrued liabilities 100.4 30.9Other current liabilities (52.2) 32.9Other (5.4) (9.6)
Net cash provided by operating activities 616.7 163.1
Cash Flows From Investing ActivitiesInvestments in property, plant and equipment (920.3) (668.0)Acquisitions, net of cash acquired (344.1) (133.5)Investments in nuclear decommissioning trust fund securities (514.6) (348.4)Proceeds from nuclear decommissioning trust fund securities 505.8 339.6Sales of investments and other assets 5.6 43.5Contract and portfolio acquisitions (474.2) (2.3)Issuances of loans receivable (19.0) (65.4)Other (65.4) 33.8
Net cash used in investing activities (1,826.2) (800.7)
Cash Flows From Financing ActivitiesNet issuance of short-term borrowings — 184.3Proceeds from issuance of
Common stock 47.7 56.2Long-term debt 647.2 122.0
Repayment of long-term debt (740.2) (285.8)Common stock dividends paid (226.8) (195.7)Reacquisition of common stock (114.4) —Proceeds from contract and portfolio acquisitions 847.8 221.3Proceeds from derivative power sales contracts classified as financing activities
under SFAS No. 149 (15.1) 38.9Other 25.9 4.1
Net cash provided by financing activities 472.1 145.3
Net Decrease in Cash and Cash Equivalents (737.4) (492.3)Cash and Cash Equivalents at Beginning of Period 2,289.1 813.0
Cash and Cash Equivalents at End of Period $ 1,551.7 $ 320.7
See Notes to Consolidated Financial Statements.Certain prior-period amounts have been reclassified to conform with the current period’s presentation.
6

CONSOLIDATED STATEMENTS OF INCOME (UNAUDITED)
Balt imore Gas and Electr ic Company and Subsid iar ies
Three Months Ended Nine Months EndedSeptember 30, September 30,
2007 2006 2007 2006
(In millions)Revenues
Electric revenues $778.2 $649.9 $1,837.3 $1,652.6Gas revenues 118.7 114.6 688.8 678.4
Total revenues 896.9 764.5 2,526.1 2,331.0Expenses
Operating expensesElectricity purchased for resale 522.6 391.1 1,117.7 933.8Gas purchased for resale 70.6 66.4 457.6 448.6Operations and maintenance 134.8 123.9 389.2 364.2Merger-related costs — 0.8 — 3.3
Depreciation and amortization 58.4 57.2 175.8 172.1Taxes other than income taxes 44.0 42.1 132.8 126.4
Total expenses 830.4 681.5 2,273.1 2,048.4
Income from Operations 66.5 83.0 253.0 282.6Other Income 9.2 3.9 19.2 4.9Fixed Charges
Interest expense 35.3 24.8 92.4 73.3Allowance for borrowed funds used during construction (0.7) (0.5) (1.8) (1.4)
Total fixed charges 34.6 24.3 90.6 71.9
Income Before Income Taxes 41.1 62.6 181.6 215.6Income Taxes 13.4 23.7 67.7 83.3
Net Income 27.7 38.9 113.9 132.3Preference Stock Dividends 3.3 3.3 9.9 9.9
Earnings Applicable to Common Stock $ 24.4 $ 35.6 $ 104.0 $ 122.4
See Notes to Consolidated Financial Statements.
7

CONSOLIDATED BALANCE SHEETS
Balt imore Gas and Electr ic Company and Subsid iar ies
September 30, December 31,2007* 2006
(In millions)Assets
Current AssetsCash and cash equivalents $ 18.4 $ 10.9Accounts receivable (net of allowance for uncollectibles of
$16.7 and $15.5, respectively) 328.2 190.3Accounts receivable, unbilled 142.2 154.4Investment in cash pool, affiliated company 261.8 60.6Accounts receivable, affiliated companies 3.2 2.5Fuel stocks 113.6 110.9Materials and supplies 44.0 40.2Prepaid taxes other than income taxes 31.5 48.0Regulatory assets, net 65.6 62.5Other 22.6 35.2
Total current assets 1,031.1 715.5
Investments and Other AssetsRegulatory assets (net) 606.0 389.0Receivable, affiliated company 157.6 150.5Other 149.0 127.5
Total investments and other assets 912.6 667.0
Utility PlantPlant in service
Electric 4,183.8 4,060.2Gas 1,173.9 1,148.3Common 465.2 444.6
Total plant in service 5,822.9 5,653.1Accumulated depreciation (2,069.9) (1,994.7)
Net plant in service 3,753.0 3,658.4Construction work in progress 143.1 97.1Plant held for future use 2.4 2.7
Net utility plant 3,898.5 3,758.2
Total Assets $ 5,842.2 $ 5,140.7
* Unaudited
See Notes to Consolidated Financial Statements.Certain prior-period amounts have been reclassified to conform with the current period’s presentation.
8

CONSOLIDATED BALANCE SHEETS
Balt imore Gas and Electr ic Company and Subsid iar ies
September 30, December 31,2007 * 2006
(In millions)Liabilities and Equity
Current LiabilitiesCurrent portion of long-term debt $ 284.5 $ 258.3Accounts payable and accrued liabilities 138.1 187.3Accounts payable and accrued liabilities, affiliated companies 223.9 163.4Customer deposits 70.9 71.4Deferred income taxes 39.7 47.4Accrued expenses and other 165.3 98.3
Total current liabilities 922.4 826.1
Deferred Credits and Other LiabilitiesDeferred income taxes 772.8 697.7Payable, affiliated company 251.0 250.7Deferred investment tax credits 12.3 13.5Other 21.9 14.0
Total deferred credits and other liabilities 1,058.0 975.9
Long-term DebtRate stabilization bonds 623.2 —First refunding mortgage bonds 119.7 244.5Other long-term debt 1,214.5 1,214.56.20% deferrable interest subordinated debentures due
October 15, 2043 to wholly owned BGE Capital Trust IIrelating to trust preferred securities 257.7 257.7
Long-term debt of nonregulated businesses 25.0 25.0Unamortized discount and premium (2.7) (2.9)Current portion of long-term debt (284.5) (258.3)
Total long-term debt 1,952.9 1,480.5
Minority Interest 16.7 16.7
Preference Stock Not Subject to Mandatory Redemption 190.0 190.0
Common Shareholder’s EquityCommon stock 912.2 912.2Retained earnings 789.3 738.6Accumulated other comprehensive income 0.7 0.7
Total common shareholder’s equity 1,702.2 1,651.5
Commitments, Guarantees, and Contingencies (see Notes)
Total Liabilities and Equity $5,842.2 $5,140.7
* Unaudited
See Notes to Consolidated Financial Statements.Certain prior-period amounts have been reclassified to conform with the current period’s presentation.
9

CONSOLIDATED STATEMENTS OF CASH FLOWS (UNAUDITED)
Balt imore Gas and Electr ic Company and Subsid iar ies
Nine Months Ended September 30, 2007 2006
(In millions)Cash Flows From Operating Activities
Net income $ 113.9 $ 132.3Adjustments to reconcile to net cash provided by operating activities
Depreciation and amortization 185.3 182.5Deferred income taxes 85.5 59.0Investment tax credit adjustments (1.2) (1.2)Deferred fuel costs (248.7) (164.7)Defined benefit plan expenses 31.7 33.4Merger-related costs — 3.3Allowance for equity funds used during construction (3.4) (2.6)Changes in
Accounts receivable (125.7) 169.8Accounts receivable, affiliated companies (0.7) (29.1)Materials, supplies, and fuel stocks (6.5) (14.4)Other current assets 47.0 (11.7)Accounts payable and accrued liabilities (49.2) (8.3)Accounts payable and accrued liabilities, affiliated companies 7.5 (18.7)Other current liabilities 31.3 (3.7)Long-term receivables and payables, affiliated companies (38.5) (38.3)Other (22.4) (12.0)
Net cash provided by operating activities 5.9 275.6
Cash Flows From Investing ActivitiesUtility construction expenditures (excluding equity portion of allowance for
funds used during construction) (264.6) (225.2)Change in cash pool at parent (201.2) 144.1Other (21.1) 10.3
Net cash used in investing activities (486.9) (70.8)
Cash Flows From Financing ActivitiesProceeds from issuance of long-term debt 623.2 —Repayment of long-term debt (124.8) (135.3)Preference stock dividends paid (9.9) (9.9)Distribution to parent — (59.8)
Net cash provided by (used in) financing activities 488.5 (205.0)
Net Increase (Decrease) in Cash and Cash Equivalents 7.5 (0.2)Cash and Cash Equivalents at Beginning of Period 10.9 15.1
Cash and Cash Equivalents at End of Period $ 18.4 $ 14.9
See Notes to Consolidated Financial Statements.Certain prior-period amounts have been reclassified to conform with the current period’s presentation.
10

NOTES TO CONSOLIDATED FINANCIAL STATEMENTS
Various factors can have a significant impact on our results The following is summary information available as offor interim periods. This means that the results for this September 30, 2007 about the VIEs in which we have aquarter are not necessarily indicative of future quarters or significant interest, but are not the primary beneficiary:full year results given the seasonality of our business.
PowerOur interim financial statements on the previous pages
Contract Allreflect all adjustments that management believes are
Monetization Othernecessary for the fair statement of the results of operations
VIEs VIEs Totalfor the interim periods presented. These adjustments are of
(In millions)a normal recurring nature.Total assets $739.6 $399.1 $1,138.7Total liabilities 586.2 199.4 785.6Basis of PresentationOur ownershipThis Quarterly Report on Form 10-Q is a combined report
interest — 53.4 53.4of Constellation Energy Group, Inc. (Constellation Energy)Other ownershipand Baltimore Gas and Electric Company (BGE).
interests 153.4 146.3 299.7References in this report to ‘‘we’’ and ‘‘our’’ are toOur maximumConstellation Energy and its subsidiaries, collectively.
exposure to loss 59.5 165.6 225.1References in this report to the ‘‘regulated business(es)’’ areto BGE. The maximum exposure to loss represents the loss that
we would incur in the unlikely event that our interests inVariable Interest Entities all of these entities were to become worthless and we wereWe have a significant interest in the following variable required to fund the full amount of all guaranteesinterest entities (VIE) for which we are not the primary associated with these entities. Our maximum exposure tobeneficiary: loss as of September 30, 2007 consists of the following:
♦ outstanding receivables, loans and letters of creditNature of Date oftotaling $159.4 million,VIE Involvement Involvement
♦ the carrying amount of our investment totalingPower projects Equity investment Prior to 2003 $53.0 million, and
and guarantees ♦ debt and performance guarantees totaling$12.7 million.Power contract Power sale March 2005
We assess the risk of a loss equal to our maximummonetization agreements,exposure to be remote.entities loans, and
guaranteesRSB BondCo LLC
Oil and gas fields Equity investment May 2006 In 2007, BGE formed RSB BondCo LLC (BondCo), aspecial purpose bankruptcy-remote limited liabilityRetail power supply Power sale Septembercompany. In June 2007, BondCo purchased rateagreement 2006stabilization property from BGE, including the right to
We discuss the nature of our involvement with the assess, collect, and receive non-bypassable rate stabilizationpower contract monetization VIEs in detail in Note 4 to charges payable by all residential electric customers of BGE.our 2006 Annual Report on Form 10-K. These charges are being assessed in order to recover
previously incurred power purchase costs that BGE deferredpursuant to Senate Bill 1. We discuss Senate Bill 1 in moredetail in our 2006 Annual Report on Form 10-K.
BGE has determined that BondCo is a variable interestentity for which it is also the primary beneficiary. As aresult, BGE consolidated BondCo. We discuss theconsolidation method of accounting in more detail inNote 1 of our 2006 Annual Report on Form 10-K and theissuance of rate stabilization bonds by BondCo on page 17of Notes to Consolidated Financial Statements.
11

Discontinued Operations (In millions)In the fourth quarter of 2006, we completed the sale of six Initial severance liability balance1 $ 2.6natural gas-fired plants, including the High Desert facility, Amounts recorded as pension andwhich was classified as discontinued operations. We postretirement liabilities (1.5)recognized an after-tax loss of $1.6 million as a component
Net cash severance liability 1.1of ‘‘Income (loss) from discontinued operations’’ in the first Cash severance payments —quarter of 2007 due to post-closing working capital Other —adjustments. We discuss the details of the sale in Note 2 of
Severance liability balance at September 30,our 2006 Annual Report on Form 10-K. In the third2007 $ 1.1
quarter of 2007, we recognized an after-tax gain of1 Includes $0.3 million to be reimbursed from co-owner.$0.7 million relating to income tax adjustments arising
from the sale of the High Desert facility and the June 2004Earnings Per Sharesale of a geothermal generating facility in Hawaii that wasBasic earnings per common share (EPS) is computed byalso previously classified as discontinued operations.dividing earnings applicable to common stock by theweighted-average number of common shares outstanding forImpairment Losses and Other Coststhe period. Diluted EPS reflects the potential dilution ofIn October 2006, in connection with the termination ofcommon stock equivalent shares that could occur ifthe merger agreement with FPL Group, Inc., we acquiredsecurities or other contracts to issue common stock werecertain rights relating to a wind development project inexercised or converted into common stock.Western Maryland. In the second quarter of 2007, we
Our dilutive common stock equivalent shares consistelected not to make the additional investment that wasof stock options and other stock-based compensationrequired at that time to retain our rights in the project;awards. The following table presents stock options that weretherefore, we recorded a charge of $20.2 million pre-tax tonot dilutive and were excluded from the computation ofwrite-off our investment in these development rights.diluted EPS in each period, as well as the dilutive commonstock equivalent shares:Workforce Reduction Costs
We incurred costs related to workforce reduction efforts Quarter Ended Nine Months EndedSeptember 30, September 30,initiated in 2006. We discuss these costs in more detail in2007 2006 2007 2006
Note 2 of our 2006 Annual Report on Form 10-K.(In millions)
The following table summarizes the status of the 2006Non-dilutive stock
involuntary severance liability for Nine Mile Point and options — 2.0 — 2.0Calvert Cliffs at September 30, 2007: Dilutive common stock
equivalent shares 2.3 1.9 2.3 1.8(In millions)
Initial severance liability balance $ 19.6Accretion of Asset Retirement ObligationsAmounts recorded as pension andWe discuss our asset retirement obligations in more detailpostretirement liabilities (7.3)in Note 1 of our 2006 Annual Report on Form 10-K. TheNet cash severance liability 12.3change in our ‘‘Asset retirement obligations’’ liability duringCash severance payments (10.3)2007 was as follows:Other —
Severance liability balance at September 30, (In millions)2007 $ 2.0 Liability at January 1, 2007 $ 974.8
Accretion expense 51.9In June 2007, we approved an additional restructuring Liabilities incurred 3.4
Liabilities settled (0.3)of the workforce at our Nine Mile Point nuclear facility.Revisions to expected future cash flows (123.8)The following table summarizes the status of thisOther (2.9)involuntary severance liability for Nine Mile Point at
September 30, 2007: Liability at September 30, 2007 $ 903.1
12
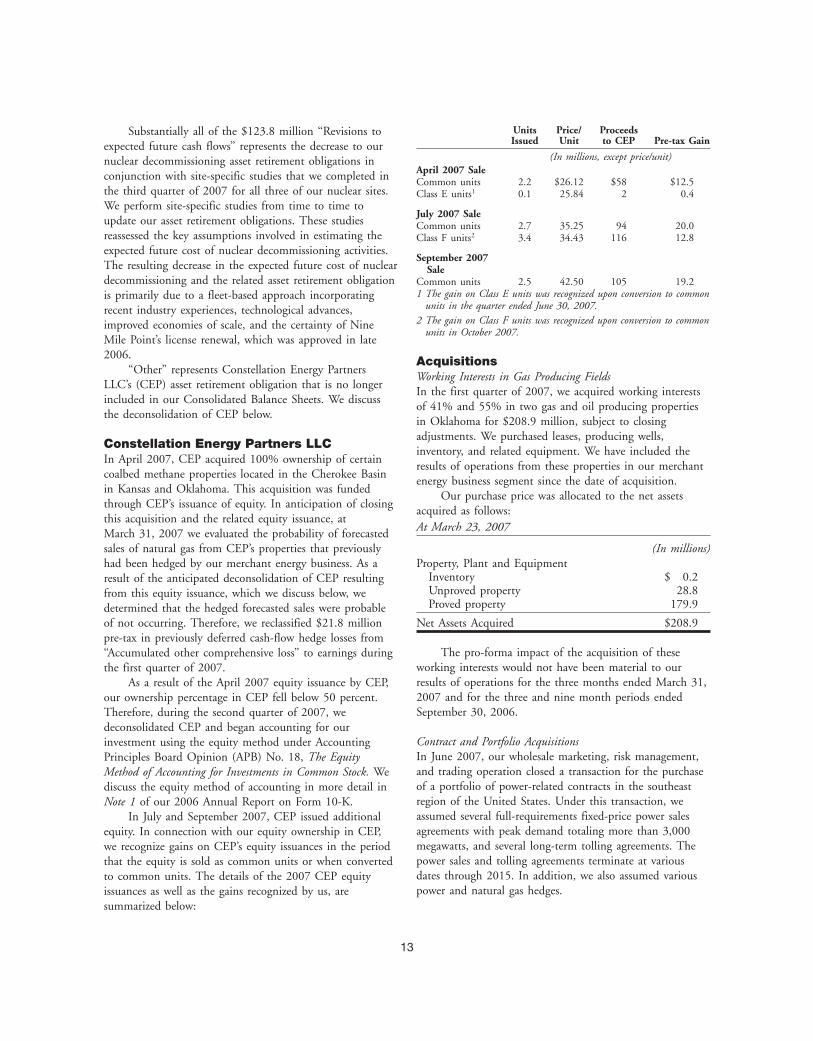
Units Price/ ProceedsSubstantially all of the $123.8 million ‘‘Revisions toIssued Unit to CEP Pre-tax Gainexpected future cash flows’’ represents the decrease to our
(In millions, except price/unit)nuclear decommissioning asset retirement obligations inApril 2007 Saleconjunction with site-specific studies that we completed in Common units 2.2 $26.12 $58 $12.5
the third quarter of 2007 for all three of our nuclear sites. Class E units1 0.1 25.84 2 0.4We perform site-specific studies from time to time to
July 2007 Saleupdate our asset retirement obligations. These studies Common units 2.7 35.25 94 20.0reassessed the key assumptions involved in estimating the Class F units2 3.4 34.43 116 12.8expected future cost of nuclear decommissioning activities.
September 2007The resulting decrease in the expected future cost of nuclear Saledecommissioning and the related asset retirement obligation Common units 2.5 42.50 105 19.2
1 The gain on Class E units was recognized upon conversion to commonis primarily due to a fleet-based approach incorporatingunits in the quarter ended June 30, 2007.recent industry experiences, technological advances,
2 The gain on Class F units was recognized upon conversion to commonimproved economies of scale, and the certainty of Nineunits in October 2007.
Mile Point’s license renewal, which was approved in late2006. Acquisitions
‘‘Other’’ represents Constellation Energy PartnersWorking Interests in Gas Producing Fields
LLC’s (CEP) asset retirement obligation that is no longerIn the first quarter of 2007, we acquired working interests
included in our Consolidated Balance Sheets. We discussof 41% and 55% in two gas and oil producing properties
the deconsolidation of CEP below.in Oklahoma for $208.9 million, subject to closingadjustments. We purchased leases, producing wells,
Constellation Energy Partners LLCinventory, and related equipment. We have included the
In April 2007, CEP acquired 100% ownership of certainresults of operations from these properties in our merchant
coalbed methane properties located in the Cherokee Basinenergy business segment since the date of acquisition.
in Kansas and Oklahoma. This acquisition was fundedOur purchase price was allocated to the net assets
through CEP’s issuance of equity. In anticipation of closingacquired as follows:
this acquisition and the related equity issuance, atAt March 23, 2007March 31, 2007 we evaluated the probability of forecasted
sales of natural gas from CEP’s properties that previously (In millions)had been hedged by our merchant energy business. As a Property, Plant and Equipment
Inventory $ 0.2result of the anticipated deconsolidation of CEP resultingUnproved property 28.8from this equity issuance, which we discuss below, weProved property 179.9determined that the hedged forecasted sales were probable
of not occurring. Therefore, we reclassified $21.8 million Net Assets Acquired $208.9pre-tax in previously deferred cash-flow hedge losses from
The pro-forma impact of the acquisition of these‘‘Accumulated other comprehensive loss’’ to earnings duringworking interests would not have been material to ourthe first quarter of 2007.results of operations for the three months ended March 31,As a result of the April 2007 equity issuance by CEP,2007 and for the three and nine month periods endedour ownership percentage in CEP fell below 50 percent.September 30, 2006.Therefore, during the second quarter of 2007, we
deconsolidated CEP and began accounting for ourContract and Portfolio Acquisitionsinvestment using the equity method under AccountingIn June 2007, our wholesale marketing, risk management,Principles Board Opinion (APB) No. 18, The Equityand trading operation closed a transaction for the purchaseMethod of Accounting for Investments in Common Stock. Weof a portfolio of power-related contracts in the southeastdiscuss the equity method of accounting in more detail inregion of the United States. Under this transaction, weNote 1 of our 2006 Annual Report on Form 10-K.assumed several full-requirements fixed-price power salesIn July and September 2007, CEP issued additionalagreements with peak demand totaling more than 3,000equity. In connection with our equity ownership in CEP,megawatts, and several long-term tolling agreements. Thewe recognize gains on CEP’s equity issuances in the periodpower sales and tolling agreements terminate at variousthat the equity is sold as common units or when converteddates through 2015. In addition, we also assumed variousto common units. The details of the 2007 CEP equitypower and natural gas hedges.issuances as well as the gains recognized by us, are
summarized below:
13

The market price was different than the contract prices We acquired 100% ownership for $100.8 million,at closing. As a result, each contract was evaluated to which was paid in cash at closing. As part of the purchase,determine whether the fair value of the contract price was we acquired $7.3 million in cash.above- or below-market at the time of closing. We recorded The total consideration for accounting purposes,the fair value of each contract as an asset if the fair value consisting of cash and other noncash consideration,was above-market (in-the-money) and as a liability if the including the fair value of certain preexisting contracts withcontract was below-market (out-of-the-money). CEI, was equal to $145.2 million and was allocated to the
The table below summarizes the transaction and the net assets acquired as follows:net cash received at closing:
At July 1, 2007(In millions)
(In millions)Contracts out-of-the-money at closing $ 820.8Cash $ 7.3Contracts in-the-money at closing (474.2)Other Current Assets 84.9
Net cash received at closing $ 346.6Total Current Assets 92.2Goodwill(1) 115.9We recorded this transaction in our financialNet Property, Plant and Equipment 0.5statements as follows:Other Assets 6.7
Balance Sheet Cash FlowsTotal Assets Acquired 215.3
Acquisition of out- Unamortized energy FinancingCurrent Liabilities (66.5)of-the-money contract liabilities cashDeferred Credits and Other Liabilities (3.6)contracts and risk inflow
management Total Liabilities (70.1)liabilities
Net Assets Acquired $145.2Acquisition of in- Unamortized energy Investing
1 Deductible for tax purposes.the-money contract assets, cashcontracts mark-to-market outflow
Our purchase price allocation is based on preliminaryenergy assets, riskestimates, and the purchase price is subject to adjustments,managementboth of which could impact our purchase price allocation.assets, and
accounts The pro-forma impact of the CEI acquisition wouldreceivable not have been material to our results of operations for the
We recorded the cash received at the acquisition of three and six months ended June 30, 2007 and for thecontracts that are out-of-the-money at closing as a financing three and nine months ended September 30, 2006.cash inflow because it does not represent a cash inflow fromcurrent period operating activities. For those acquired Shipping Joint Venturecontracts that are derivatives, we record the ongoing cash In December 2006, we formed a shipping joint venture inflows related to the contract with the counterparties as which we have a 50% ownership interest. The joint venturefinancing cash flows in accordance with SFAS No. 149, will own and operate six freight ships. In the third quarterAmendment of Statement 133 on Derivative Instruments and of 2007, we made cash contributions of approximatelyHedging Activities. We record all other ongoing cash flows $44 million to the joint venture. We expect our total cashfrom the sale or purchase of power under contracts assumed contribution will be approximately $60 million in 2007.in this transaction as operating cash flows. The joint venture is accounted for using the equity method
of accounting under APB No. 18. We discuss the equityCornerstone Energy method of accounting in more detail in Note 1 of our 2006On July 1, 2007, we acquired Cornerstone Energy, Inc Annual Report on Form 10-K.(CEI). We include CEI, part of our retail competitivesupply operation, in our merchant energy business and haveincluded its results of operations in our consolidatedfinancial statements since the date of acquisition. CEIprovides natural gas supply and related services tocommercial, industrial and institutional customers across thecentral United States. CEI is expected to add approximately100 billion cubic feet of natural gas to our annual volumesserved.
14

Electricite de France Joint Venture Information by Operating SegmentOur reportable operating segments are—Merchant Energy,In August 2007, we formed a joint venture, UniStarRegulated Electric, and Regulated Gas:Nuclear Energy, LLC (UniStar) with an affiliate of
♦ Our merchant energy business is nonregulated andElectricite de France, SA (EDF). We have a 50% ownershipincludes:interest in this joint venture to develop, own, and operate
— full requirements load-serving sales of energynew nuclear projects in the United States and Canada. Thisand capacity to utilities, cooperatives, andjoint venture will be accounted for using the equity methodcommercial, industrial, and governmental
of accounting under APB No. 18. The agreement withcustomers,
EDF includes a phased-in investment of $625 million by — structured transactions and risk managementEDF in UniStar. Initially, EDF invested $350 million in services for various customers (includingUniStar during the quarter ended September 30, 2007, and hedging of output from generating facilitieswe contributed the new nuclear line of businesses we have and fuel costs),developed over the past two years, which included assets — deployment of risk capital through portfoliowith a book value of $47 million and the right to develop management and trading activities,
— gas retail energy products and services topossible new nuclear projects at our existing nuclear plantcommercial, industrial, and governmentallocations. Upon reaching certain licensing milestones, EDFcustomers,will contribute up to an additional $275 million in UniStar.
— fossil, nuclear, and interests in hydroelectricIn connection with this joint venture, we entered intogenerating facilities and qualifying facilities,an investor agreement with EDF under which EDF mayfuel processing facilities, and power projectspurchase in the open market up to a total of 9.9% of ourin the United States,outstanding common stock during the next five years, with
— upstream (exploration and production) anda limit of 5% ownership during the first twelve months of downstream (transportation and storage)the agreement. EDF has agreed to vote any shares of our natural gas operations,common stock owned by it in the manner recommended — coal sourcing and logistics services for theby our board of directors and not to take any actions that variable or fixed supply needs of globalseek control of Constellation Energy during the next five customers, andyears. — generation operations and maintenance and
new nuclear development, includingconsulting services.Common Share Repurchase Program
♦ Our regulated electric business purchases, transmits,In October 2007, our board of directors approved adistributes, and sells electricity in Centralcommon share repurchase program for up to $1 billion ofMaryland.our outstanding common shares. Subsequent to this ♦ Our regulated gas business purchases, transports,approval, on October 31, 2007, we entered into anand sells natural gas in Central Maryland.
accelerated share repurchase agreement with a financial Our remaining nonregulated businesses:institution, and, on November 2, 2007, we purchased ♦ design, construct, and operate heating, cooling, and2,023,527 of outstanding shares of our common stock, cogeneration facilities for commercial, industrial,which represents the minimum number of shares deliverable and municipal customers throughout Northunder the agreement, for a total of $250 million. The America, and$250 million payment was funded from available cash on ♦ provide home improvements, service electric andhand. The final price of the shares repurchased will be gas appliances, service heating, air conditioning,
plumbing, electrical, and indoor air quality systems,determined based on a discount to the volume-weightedand provide natural gas marketing to residentialaverage trading price of our common stock during a periodcustomers in Central Maryland.of up to three months. Depending on the final price of the
In addition, we own several investments that we dorepurchased shares, the financial institution may delivernot consider to be core operations. These include financialadditional shares to us at the completion of the transaction.investments and real estate projects.The shares repurchased in November 2007 will be
Our Merchant Energy, Regulated Electric, andaccounted for as a reduction to common shareholders’Regulated Gas reportable segments are strategic businesses
equity at cost in the fourth quarter of 2007. The remainder based principally upon regulations, products, and servicesof the program is expected to be executed over the next that require different technology and marketing strategies.24 months in a manner that preserves flexibility to pursue We evaluate the performance of these segments based onadditional strategic investment opportunities. net income. We account for intersegment revenues using
market prices. A summary of information by operatingsegment is shown on the next page.
15

Reportable Segments
Merchant Regulated Regulated OtherEnergy Electric Gas Nonregulated
Business Business Business Businesses Eliminations Consolidated
(In millions)For the three months ended September 30,2007Unaffiliated revenues $ 4,910.4 $ 778.2 $112.8 $ 55.0 $ — $ 5,856.4Intersegment revenues 365.5 — 5.9 — (371.4) —
Total revenues 5,275.9 778.2 118.7 55.0 (371.4) 5,856.4Income from discontinued operations 0.7 — — — — 0.7Net income (loss) 227.2 34.3 (9.8) (0.3) — 251.4
2006Unaffiliated revenues $ 4,586.3 $ 649.9 $111.7 $ 45.5 $ — $ 5,393.4Intersegment revenues 422.4 — 2.9 — (425.3) —
Total revenues 5,008.7 649.9 114.6 45.5 (425.3) 5,393.4Income from discontinued operations 18.1 — — — — 18.1Net income (loss) 284.8 42.8 (7.3) 4.1 — 324.4
For the nine months ended September 30,2007Unaffiliated revenues $13,157.6 $1,837.3 $674.4 $174.5 $ — $15,843.8Intersegment revenues 956.1 — 14.4 — (970.5) —
Total revenues 14,113.7 1,837.3 688.8 174.5 (970.5) 15,843.8Loss from discontinued operations (0.9) — — — — (0.9)Net income 449.4 85.9 18.2 9.9 — 563.4
2006Unaffiliated revenues $ 12,137.8 $ 1,652.6 $671.8 $169.2 $ — $ 14,631.4Intersegment revenues 862.1 — 6.6 0.1 (868.8) —
Total revenues 12,999.9 1,652.6 678.4 169.3 (868.8) 14,631.4Income from discontinued operations 48.6 — — 0.9 — 49.5Net income 400.1 96.3 26.3 8.8 — 531.5
Certain prior period amounts have been reclassified to conform with the current period’s presentation. Revenues for the ninemonths ended September 30, 2007 reflect the reclassification of $111.7 million relating to the six months ended June 30, 2007 toconform with the current period presentation. Prior year reclassifications relate to operations that have been classified asdiscontinued operations.
16

Our non-qualified pension plans and ourPension and Postretirement Benefitspostretirement benefit programs are not funded; however,We show the components of net periodic pension benefitwe have trust assets securing certain executive pensioncost in the following table:benefits. We estimate that we will incur approximatelyQuarter Ended Nine Months Ended
September 30, September 30, $5 million in pension benefit payments for our2007 2006 2007 2006 non-qualified pension plans and approximately $29 million
(In millions) for retiree health and life insurance benefit payments duringComponents of net 2007. We contributed $125.0 million to our qualified
periodic pension pension plans in March 2007.benefit cost
Service cost $ 13.3 $ 11.9 $ 38.0 $ 36.5Interest cost 25.6 22.0 72.9 66.5 Financing ActivitiesExpected return on In July 2007, we entered into a new five-year credit facility
plan assets (27.8) (23.6) (79.1) (72.1) totaling $3.85 billion. This new facility amended andRecognized netrestated three facilities totaling $3.35 billion—a $1.5 billionactuarial loss 8.7 9.2 25.1 28.0
Amortization of prior facility that would have expired in March 2010, aservice cost 1.4 1.4 4.0 4.2 $1.1 billion facility that would have expired in
Amount capitalized as November 2010, and a $750 million facility that wouldconstruction cost (2.9) (3.1) (8.8) (9.8)have expired in November 2010. In connection with
Net periodic pension entering into the new five-year credit facility, we terminatedbenefit cost1 $ 18.3 $ 17.8 $ 52.1 $ 53.3a $1.0 billion facility that would have expired in
1 The amounts shown above do not reflect a settlement charge of October 2007. As of November 1, 2007, we had$7.6 million recorded in the third quarter of 2006 related to one of our committed bank lines of credit under facilities totalingqualified pension plans. BGE’s portion of our net periodic pension
$4.05 billion for short-term financial needs. These facilitiesbenefit cost, net of amounts capitalized, was $5.8 million for thequarter ended September 30, 2007 and $6.2 million for the quarter can issue letters of credit up to approximately $4.05 billion.ended September 30, 2006. BGE’s portion of our net periodic pension Letters of credit issued under all of our facilities totaledbenefit cost, net of amounts capitalized, was $16.1 million for the nine $1.9 billion at September 30, 2007.months ended September 30, 2007 and $18.6 million for the nine
In June 2007, BondCo, a subsidiary of BGE, issuedmonths ended September 30, 2006.an aggregate principal amount of $623.2 million of rate
We show the components of net periodic stabilization bonds to recover deferred power purchase costs.postretirement benefit cost in the following table: We discuss BondCo in more detail on page 11. Below are
the details of the rate stabilization bonds:Quarter Ended Nine Months EndedSeptember 30, September 30,
Interest Scheduled2007 2006 2007 2006Principal Rate Maturity Date(In millions)
Components of net $284.0 5.47% October 2012periodic 220.0 5.72 April 2016postretirement 119.2 5.82 April 2017benefit cost
The bonds are secured primarily by a usage-based,Service cost $ 1.6 $ 1.9 $ 5.1 $ 6.1Interest cost 5.7 6.0 19.0 18.8 non-bypassable charge payable by all of BGE’s residentialAmortization of electric customers over the next ten years. The charges will
transition obligation 0.4 0.6 1.6 1.7be adjusted semi-annually to ensure that the aggregateRecognized netcharges collected are sufficient to pay principal and interestactuarial loss 1.0 1.6 3.2 5.2
Amortization of prior on the bonds as well as certain on-going costs ofservice cost (0.8) (0.9) (2.7) (2.8) administering and servicing the bonds. BondCo cannot use
Amount capitalized asthe charges collected to satisfy any other obligations.construction cost (1.7) (2.0) (6.0) (6.3)BondCo’s assets are not assets of any affiliate and are not
Net periodicavailable to pay creditors of any affiliate of BondCo. IfpostretirementBondCo is unable to make principal and interest paymentsbenefit cost1 $ 6.2 $ 7.2 $ 20.2 $ 22.7on the bonds, neither Constellation Energy nor BGE are
1 BGE’s portion of our net periodic postretirement benefit cost, net ofrequired to make the payments on behalf of BondCo.amounts capitalized, was $3.7 million for the quarter ended
In connection with the equity issuance by CEP inSeptember 30, 2007 and $4.2 million for the quarter endedSeptember 30, 2006. BGE’s portion of our net periodic postretirement April 2007, which is discussed on page 13, webenefit costs, net of amounts capitalized, was $11.9 million for the nine deconsolidated CEP and began accounting for ourmonths ended September 30, 2007 and $12.9 million for the nine
investment using the equity method of accounting undermonths ended September 30, 2006.APB No. 18. As a result, the $32.0 million of borrowings
17

outstanding under the CEP credit facility at the time of We discuss the adoption of the Financial Accountingdeconsolidation are no longer included in our Consolidated Standards Board’s (FASB) Interpretation No. (FIN) 48,Balance Sheets. Accounting for Uncertainty in Income Taxes, on page 24.
Under our shareholder investment plans we issued$47.7 million of common stock during the nine months Taxes Other Than Income Taxesended September 30, 2007. In addition, during the first BGE collects from certain customers franchise and othernine months of 2007, we purchased $114.4 million of our taxes that are levied by state or local governments on thecommon stock in the open market. These common shares sale or distribution of gas and electricity. Some of theseare held by us in order to satisfy employee stock-based taxes are imposed on the customer and others are imposedcompensation obligations. on BGE. The taxes imposed on the customer are accounted
for on a net basis, which means we do not recognizeIncome Taxes revenue and an offsetting tax expense for the taxes collectedTotal income taxes are different from the amount that from customers. The taxes imposed on BGE are accountedwould be computed by applying the statutory Federal for on a gross basis, which means we recognize revenue forincome tax rate of 35% to book income before income the taxes collected from customers. Accordingly, the taxestaxes as follows: accounted for on a gross basis are recorded as revenues in
the accompanying Consolidated Statements of Income forQuarter Ended Nine Months EndedSeptember 30, September 30, BGE as follows:
2007 2006 2007 2006Quarter Ended Nine Months Ended(In millions) September 30, September 30,
Income before income 2007 2006 2007 2006taxes (excluding
(In millions)BGE preferencestock dividends) $418.3 $460.8 $832.6 $722.5 Taxes other than income
Statutory federal taxes included inincome tax rate 35% 35% 35% 35% revenues—BGE $19.4 $18.5 $57.9 $55.7
Income taxescomputed atstatutory federal Commitments, Guarantees, andrate 146.4 161.4 291.4 252.9 Contingencies
(Decreases) increasesWe have made substantial commitments in connection within income taxes due
to: our merchant energy, regulated electric and gas, and otherSynthetic fuel tax nonregulated businesses. These commitments relate to:
credits flowed ♦ purchase of electric generating capacity and energy,through toincome (37.1) (15.2) (119.7) (87.4) ♦ procurement and delivery of fuels,
Synthetic fuel tax ♦ the capacity and transmission and transportationcredit phase-out 20.1 6.4 44.0 48.0
rights for the physical delivery of energy to meetPhase-out true upfrom prior our obligations to our customers, andperiods 20.5 (19.0) 12.6 (15.3) ♦ long-term service agreements, capital for
State income taxes,construction programs, and other.net of federal tax
Our merchant energy business enters into variousbenefit 19.0 18.7 36.6 32.3Other (4.6) (1.1) (6.5) 0.1 long-term contracts for the procurement and delivery of
Total income taxes $164.3 $151.2 $258.4 $230.6 fuels to supply our generating plant requirements. In mostcases, our contracts contain provisions for price escalations,Effective tax rate 39.3% 32.8% 31.0% 31.9%minimum purchase levels, and other financial
Certain prior year amounts have been reclassified to conform with thecommitments. These contracts expire in various yearscurrent year’s presentation. The reclassifications relate to operations thatbetween 2007 and 2020. In addition, our merchant energyhave been classified as discontinued operations.business enters into long-term contracts for the capacitySynthetic fuel tax credits recognized throughand transmission rights for the delivery of energy to meetSeptember 30, 2007 are net of our expectation of a 54%our physical obligations to our customers. These contractsphase-out in 2007 based on forward market prices andexpire in various years between 2007 and 2019.volatilities at September 30, 2007. Based on forward market
Our merchant energy business also has committed toprices and volatilities as of October 26, 2007, we currentlylong-term service agreements and other purchaseestimate a 69% tax credit phase-out in 2007. The expectedcommitments for our plants.amount of synthetic fuel tax credits phased-out may change
materially from period to period as a result of continuedchanges in oil prices.
18

Our regulated electric business enters into various At September 30, 2007, Constellation Energy had along-term contracts for the procurement of electricity. total of $13,932.0 million in guarantees outstanding relatedThese contracts expire between 2007 and 2009. Our to loans, credit facilities, and contractual performance ofregulated gas business has gas transportation and storage certain of its subsidiaries as described below.contracts that expire between 2007 and 2028. As discussed ♦ Constellation Energy guaranteed $12,737.3 millionin Note 1 of our 2006 Annual Report on Form 10-K, the on behalf of our subsidiaries for competitive supplycosts under these contracts are fully recoverable by our activities. These guarantees are put into place inregulated businesses. order to allow our subsidiaries the flexibility needed
Our other nonregulated businesses have committed to to conduct business with counterparties withoutgas purchases, as well as to contribute additional capital for having to post other forms of collateral. While theconstruction programs and joint ventures in which they face amount of these guarantees ishave an interest. $12,737.3 million, our calculated fair value of
We have also committed to long-term service obligations for commercial transactions covered byagreements and other obligations related to our information these guarantees was $3,133.1 million attechnology systems. September 30, 2007. The $3,133.1 million
At September 30, 2007, the total amount of represents the total amount Constellation Energycommitments was $7,574.0 million. These commitments could be required to fund based on market pricesare primarily related to our merchant energy business. as of September 30, 2007, if the subsidiaries do
not honor contractual commitments covered byLong-Term Power Sales Contracts these guarantees. For those guarantees related toWe enter into long-term power sales contracts in our mark-to-market energy or risk managementconnection with our load-serving activities. We also enter liabilities, the fair value of the obligation isinto long-term power sales contracts associated with certain recorded in our Consolidated Balance Sheets.of our power plants. Our load-serving power sales contracts ♦ Constellation Energy guaranteed $786.1 millionextend for terms through 2019 and provide for the sale of primarily on behalf of our nuclear generatingenergy to electricity distribution utilities and certain retail facilities for nuclear insurance and credit support tocustomers. Our power sales contracts associated with power ensure these plants have funds to meet expensesplants we own extend for terms into 2014 and provide for and obligations to safely operate and maintain thethe sale of all or a portion of the actual output of certain plants.of our power plants. All long-term contracts were executed ♦ BGE guaranteed the Trust Preferred Securities ofat pricing that approximated market rates, including profit $250.0 million of BGE Trust II.margin, at the time of execution. ♦ BGE guaranteed two-thirds of certain debt of Safe
Harbor Water Power Corporation, anGuarantees unconsolidated investment. At September 30, 2007,Our guarantees do not represent incremental Constellation Safe Harbor Water Power Corporation hadEnergy obligations; rather they primarily represent parental outstanding debt of $20.0 million. The maximumguarantees of subsidiary obligations. The following table amount of BGE’s guarantee is $13.3 million.summarizes the maximum exposure based on the stated ♦ Constellation Energy guaranteed $95.1 million onlimit of our outstanding guarantees: behalf of our other nonregulated businesses
primarily for loans and performance bonds ofAt September 30, 2007 Stated Limitwhich $25.0 million was recorded in our
(In millions) Consolidated Balance Sheets at September 30,Competitive supply guarantees $12,737.3 2007.Nuclear guarantees 786.1 ♦ Our other nonregulated business guaranteedBGE guarantees 263.3
$11.0 million primarily for performance bonds.Other non-regulated guarantees 106.1 ♦ Our merchant energy business guaranteedPower project guarantees 39.2$39.2 million for loans and other performance
Total guarantees $13,932.0 guarantees related to certain power projects inwhich we have an investment.
We believe it is unlikely that we would be required toperform or incur any losses associated with guarantees ofour subsidiaries’ obligations.
19

Contingencies closer to completion. However, those costs could have aRevenue Sufficiency Guarantee Costs material effect on our financial results.During 2006, the Federal Energy Regulatory Commission(FERC) issued orders finding that the Midwest Spring GardensIndependent System Operator (MISO) violated its tariff by In December 1996, BGE signed a consent order with theincorrectly allocating revenue sufficiency guarantee (RSG) Maryland Department of the Environment that requires itcharges among market participants. As a result of FERC to implement remedial action plans for contamination atorders, MISO proposed a revised methodology for the and around the Spring Gardens site, located in Baltimore,allocation of RSG charges in its December 2006 Maryland. The Spring Gardens site was once used tocompliance filing with the FERC with a proposed effective manufacture gas from coal and oil. Based on remedialdate of April 1, 2007. action plans and cost modeling performed in late 2006,
In March 2007, FERC rejected the RSG allocation BGE estimates its probable clean-up costs will totalmethodology proposed by MISO in its December 2006 $43 million. BGE has recorded these costs as a liability incompliance filing and ordered MISO to reallocate RSG its Consolidated Balance Sheets and has deferred thesecosts based on its existing tariff back to the date of FERC’s costs, net of accumulated amortization and amounts itoriginal order (April 2006). Based on this FERC order, we recovered from insurance companies, as a regulatory asset.recorded an immaterial liability in our Consolidated Based on the results of studies at this site, it is reasonablyBalance Sheets based on our estimate of the amount of possible that additional costs could exceed the amount BGEre-allocated RSGs we believe is probable. Our liability is has recognized by approximately $3 million. Throughsubject to change based upon MISO’s calculation of the September 30, 2007, BGE has spent approximatelyactual RSG adjustment. In addition, the order may be $40 million for remediation at this site.appealed, and we cannot predict the ultimate timing or BGE also has investigated other small sites where gasoutcome of any appeal. was manufactured in the past. We do not expect the
clean-up costs of the remaining smaller sites to have aEnvironmental Matters material effect on our financial results.Solid and Hazardous WasteThe Environmental Protection Agency (EPA) and several Air Qualitystate agencies have notified us that we are considered a In late July 2005, we received two Notices of Violationpotentially responsible party with respect to the clean-up of (NOVs) from the Placer County Air Pollution Controlcertain environmentally contaminated sites. We cannot District, Placer County California (District) alleging thatestimate the final clean-up costs for all of these sites, but the Rio Bravo Rocklin facility located in Lincoln, Californiathe current estimated costs for, and current status of, each had violated certain District air emission regulations. Wesite is described in more detail below. have a combined 50% ownership interest in the partnership
which owns the Rio Bravo Rocklin facility. The NOVs68th Street Dump allege a total of 38 violations between January 2003 andIn 1999, the EPA proposed to add the 68th Street Dump March 2005 of either the facility’s air permit or federal,in Baltimore, Maryland to the Superfund National Priorities state, and county air emission standards related to nitrogenList, which is its list of sites targeted for clean-up and oxide, carbon monoxide, and particulate emissions, as wellenforcement, and sent a general notice letter to BGE and as violations of certain monitoring and reporting19 other parties identifying them as potentially liable parties requirements during that time period. The maximum civilat the site. In March 2004, we and other potentially penalties for the alleged violations range from $10,000 toresponsible parties formed the 68th Street Coalition and $40,000 per violation. Management of the Rio Bravoentered into consent order negotiations with the EPA to Rocklin facility is currently discussing the allegations in theinvestigate clean-up options for the site under the NOVs with District representatives. It is not possible toSuperfund Alternative Sites Program. In May 2006, a determine the actual liability, if any, of the partnership thatsettlement among the EPA and 19 of the potentially owns the Rio Bravo Rocklin facility.responsible parties, including BGE, with respect to In May 2007, a subsidiary of Constellation Energyinvestigation of the site became effective. The settlement entered into a consent decree with the Marylandrequires the potentially responsible parties, over the course Department of the Environment to resolve allegedof several years, to identify contamination at the site and violations of air quality opacity standards at three fossil fuelrecommend clean-up options. BGE is fully indemnified by plants in Maryland. The consent decree requires thea wholly-owned subsidiary of Constellation Energy for costs subsidiary to pay a $100,000 penalty, provide $100,000 torelated to this settlement, as well as any clean-up costs. The a supplemental environmental project, and installclean-up costs will not be known until the investigation is technology to control emissions from those plants.
20

Water Quality address several energy issues in the state, including dismissalIn October 2007, a subsidiary of Constellation Energy of all claims against wholesale suppliers by the Attorneyentered into a consent decree with the Maryland General, both in the state of Illinois and before the FERC.Department of the Environment relating to groundwater This legislation has been signed into law by the Governorcontamination at a third party facility that was licensed to of Illinois, and the Attorney General’s claims have beenaccept fly ash, a byproduct generated by our coal-fired dismissed.plants. The consent decree requires the payment of a In addition, two class action complaints have been$1.0 million penalty, remediation of groundwater filed in Illinois state court against these wholesale supplierscontamination resulting from the ash placement operations alleging that they engaged in deceptive practices, includingat the site, replacement of drinking water supplies in the colluding in setting prices and actual price fixing. Thevicinity of the site, and monitoring of groundwater complaints seek unspecified damages in an amount to beconditions. We recorded a liability in our Consolidated proven at trial. These complaints subsequently were movedBalance Sheets of approximately $4 million, which includes to federal court.the $1 million penalty and our estimate of probable costs We believe we have meritorious defenses to theseto remediate contamination, replace drinking water supplies, claims challenging the Illinois auction and our conduct inand monitor groundwater conditions. We estimate that it is the auction and intend to defend against them vigorously.reasonably possible that we could incur additional costs of However, we cannot predict the timing, or outcome, ofup to approximately $10 million more than the liability these proceedings, or their possible effect on our financialthat we accrued. results.
Litigation MercuryIn the normal course of business, we are involved in various Since September 2002, BGE, Constellation Energy, andlegal proceedings. We discuss the significant matters below. several other defendants have been involved in numerous
actions filed in the Circuit Court for Baltimore City,City of Tacoma v. AEP, et al.,—The City of Tacoma, onMaryland alleging mercury poisoning from several sources,June 7, 2004, in the U.S. District Court, Western Districtincluding coal plants formerly owned by BGE. The plantsof Washington, filed a complaint against over 60are now owned by a subsidiary of Constellation Energy. Incompanies, including Constellation Energy Commoditiesaddition to BGE and Constellation Energy, approximatelyGroup, Inc. (CCG). The complaint alleges that the11 other defendants, consisting of pharmaceuticaldefendants engaged in manipulation of electricity marketscompanies, manufacturers of vaccines, and manufacturers ofresulting in prices for power in the western power marketsThimerosal have been sued. Approximately 70 cases,that were substantially above what market prices wouldinvolving claims related to approximately 132 children, havehave been in the absence of the alleged unlawful contracts,been filed to date, with each claimant seeking $20 millioncombinations and conspiracy in violation of Section 1 ofin compensatory damages, plus punitive damages, from us.the Sherman Act. The complaint further alleges that the
In rulings applicable to all but three of the cases,total amount of damages is unknown, but is estimated toinvolving claims related to approximately 47 children, theexceed $175 million. On February 11, 2005, the CourtCircuit Court for Baltimore City dismissed all claimsgranted the defendants’ motion to dismiss the action basedagainst BGE and Constellation Energy. Plaintiffs mayon the Court’s lack of jurisdiction over the claims inattempt to pursue appeals of the rulings in favor of BGEquestion. The plaintiff appealed the dismissal of the actionand Constellation Energy once the cases are finallyto the Ninth Circuit Court of Appeals, but subsequentlyconcluded as to all defendants. We believe that we haveagreed to a dismissal with prejudice, which the Ninthmeritorious defenses and intend to defend the remainingCircuit Court ordered on March 20, 2007.actions vigorously. However, we cannot predict the timing,or outcome, of these cases, or their possible effect on our,Challenges to the Illinois Auctionor BGE’s, financial results.In March 2007, the Illinois Attorney General filed a
complaint at FERC against the wholesale suppliers,Asbestosincluding our wholesale marketing, risk management andSince 1993, BGE and certain Constellation Energytrading operation, that were successful bidders in the recentsubsidiaries have been involved in several actions concerningIllinois auction. The complaint alleged that the ratesasbestos. The actions are based upon the theory ofresulting from the auction were not ‘‘just and reasonable’’‘‘premises liability,’’ alleging that BGE and Constellationand requested that FERC commence a proceeding toEnergy knew of and exposed individuals to an asbestosdetermine if the rates were just and reasonable and tohazard. BGE and Constellation Energy, and numerous otherinvestigate evidence of price manipulation. In July 2007,parties are defendants in these cases.the Illinois legislature approved comprehensive legislation to
21

Approximately 535 individuals who were never ♦ fixing the price for a portion of anticipated energyemployees of BGE or Constellation Energy have pending purchases to supply our load-serving customers,claims each seeking several million dollars in compensatory andand punitive damages. Cross-claims and third-party claims ♦ fixing the price for a portion of anticipated sales ofbrought by other defendants may also be filed against BGE natural gas to customers.and Constellation Energy in these actions. To date, most The portion of forecasted transactions hedged mayasbestos claims against us have been dismissed or resolved vary based upon management’s assessment of market,without any payment and a small minority have been weather, operational, and other factors.resolved for amounts that were not material to our financial Our merchant energy business designated certain fixed-results. The remaining claims are currently pending in state price forward contracts as cash-flow hedges of forecastedcourts in Maryland and Pennsylvania. sales of energy and forecasted purchases of fuel and energy
BGE and Constellation Energy do not know the for the years 2007 through 2016 under Statement ofspecific facts necessary to estimate their potential liability Financial Accounting Standard (SFAS) No. 133, Accountingfor these claims. The specific facts we do not know include: for Derivative Instruments and Hedging Activities, as
♦ the identity of the facilities at which the plaintiffs amended. Our merchant energy business had net unrealizedallegedly worked as contractors, pre-tax losses on these cash-flow hedges recorded in
♦ the names of the plaintiffs’ employers, ‘‘Accumulated other comprehensive loss’’ of♦ the dates on which and the places where the $1,685.3 million at September 30, 2007 and
exposure allegedly occurred, and $2,227.1 million at December 31, 2006.♦ the facts and circumstances relating to the alleged We expect to reclassify $1,019.8 million of net pre-tax
exposure. losses on cash-flow hedges from ‘‘Accumulated otherUntil the relevant facts are determined, we are unable comprehensive loss’’ into earnings during the next twelve
to estimate what our, or BGE’s, liability might be. months based on market prices at September 30, 2007.Although insurance and hold harmless agreements from However, the actual amount reclassified into earnings couldcontractors who employed the plaintiffs may cover a vary from the amounts recorded at September 30, 2007,portion of any awards in the actions, the potential effect on due to future changes in market prices. Additionally, forour, or BGE’s, financial results could be material. cash-flow hedges settled by physical delivery of the
underlying commodity, ‘‘Reclassification of net losses onInsurance hedging instruments from OCI to net income’’ representsWe discuss our nuclear and non-nuclear insurance programs the fair value of those derivatives, which is realized throughin Note 12 of our 2006 Annual Report on Form 10-K.
gross settlement at the contract price.During the nine months ended September 30, 2007,
SFAS No. 133 Hedging Activitieswe de-designated contracts previously designated as
We are exposed to market risk, including changes incash-flow hedges for which the forecasted transactions
interest rates and the impact of market fluctuations in theoriginally hedged are probable of not occurring and as a
price and transportation costs of electricity, natural gas, andresult we recognized a pre-tax loss of $21.6 million. Weother commodities. We discuss our market risk in morediscuss the transaction that accounts for substantially all ofdetail in our 2006 Annual Report on Form 10-K.this amount in more detail in the Constellation EnergyPartners LLC section on page 13.Commodity Prices
During the nine months ended September 30, 2006,Our merchant energy business uses a variety of derivativewe de-designated contracts previously designated asand non-derivative instruments to manage the commoditycash-flow hedges and as a result we recognized a pre-tax lossprice risk of our competitive supply activities and ourof $10.5 million.electric generation facilities, including power sales, fuel and
Our merchant energy business also enters into naturalenergy purchases, gas purchased for resale, emission credits,gas storage contracts under which the gas in storageweather risk, freight, and the market risk of outages. Inqualifies for fair value hedge accounting treatment underorder to manage these risks, we may enter into fixed-priceSFAS No. 133.derivative or non-derivative contracts to hedge the
We record changes in fair value of hedges related tovariability in future cash flows from forecasted sales ofour retail competitive supply operations as a component ofenergy and purchases of fuel and energy. The objectives for‘‘Fuel and purchased energy expenses’’ in our Consolidatedentering into such hedges include:Statements of Income. We record changes in fair value of♦ fixing the price for a portion of anticipated futurehedges related to our wholesale competitive supplyelectricity sales at a level that provides an acceptableoperations as a component of ‘‘Nonregulated revenues’’ inreturn on our electric generation operations,our Consolidated Statements of Income.♦ fixing the price of a portion of anticipated fuel
purchases for the operation of our power plants,
22

We recorded in earnings the following pre-tax gains twelve months. We had no hedge ineffectiveness on these(losses) related to hedge ineffectiveness: swaps.
In order to optimize the mix of fixed and floating-rateQuarter Ended Nine Months EndedSeptember 30, September 30, debt, we entered into interest rate swaps qualifying as fair2007 2006 2007 2006 value hedges relating to $450.0 million of our fixed-rate
(In millions) debt maturing in 2012 and 2015, and converted thisCash-flow hedges $32.5 $(1.9) $ 2.2 $ 3.7 notional amount of debt to floating-rate. The fair value ofFair value hedges (1.6) 6.3 (0.5) 7.9
these hedges was an unrealized gain of $3.8 million atTotal $30.9 $ 4.4 $ 1.7 $11.6 September 30, 2007 and was recorded as an increase in our
‘‘Risk management assets’’ and an increase in ourThe ineffectiveness amounts in the table above exclude‘‘Long-term debt.’’ The fair value of these hedges was an$9.1 million of pre-tax gains and $7.3 million of pre-taxunrealized loss of $7.1 million at December 31, 2006 andlosses that we recognized as a result of market price changeswas recorded as an increase in our ‘‘Risk managementfor the quarter and nine months ended September 30,liabilities’’ and a decrease in our ‘‘Long-term debt.’’ We had2007, respectively. These amounts represent the change inno hedge ineffectiveness on these interest rate swaps.fair value of derivatives that did not qualify for cash-flow
hedge accounting due to reduced price correlation betweenAccounting Standards Issuedthe hedge and the risk being hedged, but remain designatedSFAS No. 159as hedges prospectively. Corresponding amounts for theIn February 2007, the FASB issued SFAS No. 159, Theprior year were immaterial.Fair Value Option for Financial Assets and FinancialLiabilities—including an amendment of FASB StatementInterest RatesNo. 115. SFAS No. 159 provides the option to report atWe use interest rate swaps to manage our interest ratefair value certain financial instruments that are notexposures associated with new debt issuances, to managecurrently required or permitted to be measured at fair value.our exposure to fluctuations in interest rates on variable rateThis option would be applied on an instrument bydebt, and to optimize the mix of fixed and floating-rateinstrument basis. If elected, unrealized gains and losses ondebt. The swaps used to manage our exposure prior to thethe affected financial instruments would be recognized inissuance of new debt are designated as cash-flow hedgesearnings at each subsequent reporting date. SFAS No. 159under SFAS No. 133, with the effective portion of gainsis effective beginning January 1, 2008. We are currentlyand losses, net of associated deferred income tax effects,assessing the provisions of SFAS No. 159; however, whilerecorded in ‘‘Accumulated other comprehensive loss’’ inthe application of the fair value accounting would beanticipation of planned financing transactions. We reclassifyoptional, the impact of fair value accounting, if elected,gains and losses on the hedges from ‘‘Accumulated othercould be material to our, or BGE’s, financial results.comprehensive loss’’ into ‘‘Interest expense’’ in our
Consolidated Statements of Income during the periods inFSP FIN 39-1which the interest payments being hedged occur.In April 2007, the FASB issued Staff Position (FSP) FINThe swaps used to optimize the mix of fixed and39-1, Amendment of FASB Interpretation No. 39. FSP FINfloating-rate debt are designated as fair value hedges under39-1 permits an entity to report all derivatives recorded atSFAS No. 133. We record any gains or losses on swaps thatfair value with any associated fair value cash collateral,qualify for fair value hedge accounting treatment, as well aswhich are with the same counterparty under a masterchanges in the fair value of the debt being hedged, innetting arrangement, together in the balance sheet. Our‘‘Interest expense,’’ and we record any changes in fair valuewholesale competitive supply operation reports derivativeof the swaps and the debt in ‘‘Risk management assets andamounts under master netting arrangements net inliabilities’’ and ‘‘Long-term debt’’ in our Consolidatedaccordance with FIN 39, Offsetting of Amounts Related toBalance Sheets. In addition, we record the differenceCertain Contracts; however, we report fair value cashbetween interest on hedged fixed-rate debt and floating-ratecollateral separately from our derivative amounts. Under theswaps in ‘‘Interest expense’’ in the periods that the swapsprovisions of this FSP, we must either report all derivativessettle.recorded at fair value net with the associated fair value cash‘‘Accumulated other comprehensive loss’’ includes netcollateral or report all derivative amounts gross. The effectsunrealized pre-tax gains on interest rate cash-flow hedgesof FSP FIN 39-1 must be applied by adjusting all financialterminated upon debt issuance totaling $11.9 million atstatements presented beginning January 1, 2008. We areSeptember 30, 2007 and $12.5 million at December 31,currently evaluating the impact of this FSP; however, this2006. We expect to reclassify $0.1 million of pre-tax netFSP could have a material impact on our balance sheetlosses on these cash-flow hedges from ‘‘Accumulated otherpresentation.comprehensive loss’’ into ‘‘Interest expense’’ during the next
23

The following table summarizes our total unrecognizedAccounting Standards AdoptedFIN 48 tax benefits at January 1, 2007:In July 2006, the FASB issued FIN 48. FIN 48 provides
At January 1, 2007guidance for the recognition and measurement of an entity’s
(In millions)uncertain tax positions. These are defined as positions takenTotal liabilities reflected in our balance sheet forin a previously filed tax return or positions expected to be
unrecognized tax benefits of $56.7 milliontaken in future tax returns and which result in, amongless $12.1 million of interest and penalties $ 44.6other things, a permanent reduction of income taxes
Other unrecognized tax benefits not reflected inpayable, a deferral of income taxes otherwise currently our balance sheet 59.4payable to future years, or a change in the expected ability
Total unrecognized tax benefits $104.0to realize deferred tax assets. Under FIN 48, we arerequired to recognize the financial statement effects of tax
During the nine months ended September 30, 2007,positions if they meet a ‘‘more-likely-than-not’’ threshold. Intotal unrecognized tax benefits increased approximatelyevaluating items relative to this threshold, we must assess$20 million primarily due to increases in temporarywhether each tax position will be sustained based solely ondifferences related to deductions for repairs. There was noits technical merits assuming examination by a taxingsignificant net change in tax expense as a result of theseauthority.differences. The increases reflect tax positions expected toFor those uncertain tax positions that we havebe taken in current year tax returns that are consistent withrecognized in our financial statements, we establishsimilar tax positions taken in prior years.liabilities to reflect the portion of those positions we cannot
If the total amount of unrecognized tax benefits ofconclude are ‘‘more likely than not’’ to be realized upon$124.0 million as of September 30, 2007 were ultimatelyultimate settlement. These are referred to as liabilities forrealized, our income tax expense would decrease byunrecognized tax benefits under FIN 48. We recognizeapproximately $76.0 million. The $124.0 million includesinterest and penalties related to unrecognized tax benefits inthe $48.3 million of disallowed refund claims discussed‘‘Income tax expense’’ in our Consolidated Statements ofabove.Income.
We file income tax returns in the United States andThe adoption of FIN 48 on January 1, 2007, resultedforeign jurisdictions. With few exceptions, we are no longerin our recording a $7.3 million incremental liability forsubject to U.S. federal, state and local, or non-U.S. incomeunrecognized tax benefits and a corresponding reduction intax examinations by tax authorities for years before 2002.‘‘Retained earnings’’ in our Consolidated Balance Sheets as aThe IRS commenced an examination of our U.S. incomecumulative effect of change in accounting principle. Wetax returns for 2002, 2003, and 2004 in the third quarteralso reclassified $49.4 million from existing tax liabilitiesof 2005. We anticipate that these examinations will be(primarily deferred income taxes) to the new FIN 48completed by the end of 2007.liability for unrecognized tax benefits. Our resulting total
Recently, the IRS has proposed certain adjustments to$56.7 million FIN 48 liability for unrecognized tax benefitsour 2002-2004 deductions for repairs and casualty losses.included $12.1 million of accrued interest and penalties.We do not anticipate the adjustments, if any, would resultAdditionally, FIN 48 requires disclosure of totalin a material impact on our financial results. However, weunrecognized tax benefits, regardless of whether or not theseanticipate that it is reasonably possible that we will make anamounts are reflected in our balance sheet. We haveadditional payment in the range of $20 to $25 million by$59.4 million of unrecognized tax benefits related toJune 30, 2008, which will reduce our liabilities foroutstanding federal and state refund claims for which nounrecognized tax benefits.tax benefit was previously provided in our financial
The adoption of FIN 48 did not have a materialstatements because the claims do not meet theimpact on BGE’s financial results.‘‘more-likely-than-not’’ threshold. Included in this amount
is $48.3 million of refund claims that have been disallowedby the applicable tax authorities for which we assess theprobability of tax benefit recognition to be remote.
24

Balance SheetRelated Party Transactions—BGEBGE participates in a cash pool under a Master DemandIncome StatementNote agreement with Constellation Energy. Under thisBGE is obligated to provide market-based standard offerarrangement, participating subsidiaries may invest in orservice to all of its electric customers for varying periods.borrow from the pool at market interest rates. ConstellationBidding to supply BGE’s market-based standard offerEnergy administers the pool and invests excess cash inservice to electric customers will occur from time to timeshort-term investments or issues commercial paper tothrough a competitive bidding process approved by themanage consolidated cash requirements. Under thisMaryland PSC.arrangement, BGE had invested $261.8 million atOur wholesale marketing, risk management, andSeptember 30, 2007 and $60.6 million at December 31,trading operation supplied a substantial portion of BGE’s2006.market-based standard offer service obligation to residential
BGE’s Consolidated Balance Sheets includeelectric customers through May 31, 2007, and will supply aintercompany amounts related to corporate functionsportion of BGE’s market-based standard offer serviceperformed at the Constellation Energy holding company,obligations for electric customers from June 1, 2007BGE’s purchases to meet its standard offer servicethrough May 31, 2009.obligation, BGE’s charges to Constellation Energy and itsThe cost of BGE’s purchased energy fromnonregulated affiliates for certain services it provides them,nonregulated subsidiaries of Constellation Energy to meetand the participation of BGE’s employees in theits standard offer service obligation was as follows:Constellation Energy defined benefit plans.Quarter Ended Nine Months Ended
September 30, September 30, We believe our allocation methods are reasonable and2007 2006 2007 2006 approximate the costs that would be charged to unaffiliated
(In millions) entities.Purchased energy $355.1 $412.5 $912.1 $820.8
In addition, Constellation Energy charges BGE for thecosts of certain corporate functions. Certain costs aredirectly assigned to BGE. We allocate other corporatefunction costs based on a total percentage of expected useby BGE. We believe this method of allocation is reasonableand approximates the cost BGE would have incurred as anunaffiliated entity.
The following table presents the costs ConstellationEnergy charged to BGE in each period.
Quarter Ended Nine Months EndedSeptember 30, September 30,2007 2006 2007 2006
(In millions)Charges to BGE $41.8 $37.5 $111.6 $99.2
25

Item 2. Management’s Discussion
Management’s Discussion and Analysis of Financial Condition andResults of Operations
We have organized our discussion and analysis asIntroduction and Overviewfollows:Constellation Energy Group, Inc. (Constellation Energy) is
♦ We describe changes to our business environmentan energy company that conducts its business throughduring the year.various subsidiaries including a merchant energy business
♦ We discuss our critical accounting policies. Theseand Baltimore Gas and Electric Company (BGE). Weare the accounting policies that are most importantdescribe our operating segments in the Notes to Consolidatedto the portrayal of our financial condition andFinancial Statements on page 15.results of operations and require management’sThis Quarterly Report on Form 10-Q is a combinedmost difficult, subjective, or complex judgment.report of Constellation Energy and BGE. References in this
♦ We highlight significant events that occurred inreport to ‘‘we’’ and ‘‘our’’ are to Constellation Energy and2007 that are important to understanding ourits subsidiaries, collectively. References in this report to theresults of operations and financial condition.‘‘regulated business(es)’’ are to BGE. We discuss our
♦ We then review our results of operations beginningbusiness in more detail in Item 1—Business section of ourwith an overview of our total company results,2006 Annual Report on Form 10-K and we discuss thefollowed by a more detailed review of those resultsrisks affecting our business in Item 1A. Risk Factors sectionby operating segment.on page 56.
♦ We review our financial condition, addressing ourOur 2006 Annual Report on Form 10-K includes asources and uses of cash, capital resources,detailed discussion of various items impacting our business,commitments, and liquidity.our results of operations, and our financial condition. These
♦ We conclude with a discussion of our exposure toinclude:various market risks.♦ Introduction and Overview section which provides a
description of our business segments,♦ Strategy section, Business Environment♦ Business Environment section, including how With the evolving regulatory environment surrounding
regulation, weather, and other factors affect our customer choice, increasing competition, and the growth ofbusiness, and our merchant energy business, various factors affect our
♦ Critical Accounting Policies section. financial results. We discuss these various factors in theIn this discussion and analysis, we explain the general Forward Looking Statements section on page 57 and in Item
financial condition and the results of operations for 1A. Risk Factors section on page 56. We discuss our marketConstellation Energy and BGE including: risks in the Market Risk section beginning on page 52.
♦ factors which affect our businesses, In this section, we discuss in more detail events which♦ our earnings and costs in the periods presented, have impacted our business during 2007.♦ changes in earnings and costs between periods,♦ sources of earnings, Regulation by the Maryland PSC♦ impact of these factors on our overall financial In April 2007, Senate Bill 400 was enacted, which makes
condition, certain modifications to Senate Bill 1, which was enacted in♦ expected future expenditures for capital projects, June 2006. We discuss Senate Bill 1 in more detail in Item
and 1. Business—Electric Regulatory Matters and Competition♦ expected sources of cash for further capital section of our 2006 Annual Report on Form 10-K.
expenditures. Pursuant to Senate Bill 400, the Maryland Public ServiceAs you read this discussion and analysis, refer to our Commission (Maryland PSC) has retained a consultant and
Consolidated Statements of Income on page 3, which initiated several studies, including studies relating topresent the results of our operations for the quarters and stranded costs, the costs and benefits of various options fornine months ended September 30, 2007 and 2006. We regulation, and the structure of the electric industry inanalyze and explain the differences between periods in the Maryland. The Maryland PSC is required to submit anspecific line items of the Consolidated Statements of interim report by December 1, 2007 and a final report byIncome. December 1, 2008. We cannot at this time predict the
outcome of these studies or their actual effect on our, orBGE’s, financial results, but it could be material.
26

As required by Senate Bill 1, in May 2007, the Global Climate ChangeMaryland PSC approved a plan allowing residential electric In April 2007, the U.S. Supreme Court ruled that the EPAcustomers the option to defer the transition to market rates has authority to regulate carbon dioxide (CO2) emissionsfrom June 1, 2007 to January 1, 2008. Customers from automobiles. Although the decision did not addressparticipating in the plan will repay the deferred charges CO2 emissions from stationary sources such as powerbeginning April 1, 2008 through December 31, 2009 generation facilities, federal legislation or regulationwithout interest. Only 4 percent of BGE’s residential addressing CO2 emissions from other sources may now beelectric customers opted into the deferral plan, while the more likely. We cannot predict the nature or timing of anyremaining 96 percent moved to full market rates effective CO2 legislation or regulation, but any compliance costs weJune 1, 2007. The total amount deferred under this plan is incur could have a material impact on our financial results.expected to be approximately $6 million. Also in April 2007, Maryland became a full
The Maryland PSC has made various inquiries relating participant in the Northeast Regional Greenhouse Gasto the relationship between Constellation Energy and BGE Initiative (RGGI). In October 2007, the Marylandand the impact of that relationship on the rates paid by Department of the Environment proposed auctioning 90%BGE residential electric customers. Hearings may also be of CO2 allowances associated with Maryland’s power plants,conducted. We cannot at this time predict the outcome of which include plants owned by us, under RGGI. If thisthese inquiries or any hearings that may be held or how proposal is enacted, we could incur material costs tosuch outcome may affect our, or BGE’s, financial results, purchase CO2 allowances necessary to offset emissions frombut it could be material. our plants. We discuss RGGI in more detail in Item 1—
Business section of our 2006 Annual Report on Form 10-K.Environmental MattersAir Quality Water QualityNational Ambient Air Quality Standards (NAAQS) Water Intake RegulationsIn June 2007, the United States Court of Appeals for the In response to a ruling by the United States Court ofDistrict of Columbia Circuit denied a petition by the Appeals for the Second Circuit that the EPA’s water intakeEnvironmental Protection Agency (EPA) to rehear a Court regulations did not properly implement the Clean Waterdecision finding that the EPA must impose fees on Act requirements in a number of areas, the EPA suspendedemissions sources that failed to achieve applicable ozone the second phase of the regulations for existing facilitiesstandards retroactive to November 2005. In pending further rulemaking, and directed permittingSeptember 2007, a number of parties petitioned the U.S. authorities to use their best professional judgment toSupreme Court to hear an appeal. At this time, we cannot establish controls for cooling water intake structures thatpredict whether the Court will grant the petition. In reflect the best technology available for minimizing adverseaddition, the exact method of computing these fees has not environmental impact. We continue to evaluate ourbeen established and will depend in part on state compliance options in light of the court decision and theimplementation regulations that have not been finalized. EPA’s order. Until we determine our most viable option, weConsequently, we are unable to estimate the ultimate cannot estimate our compliance costs. However, those costsfinancial impact of the fees in light of the uncertainty could be material.surrounding the methodology that will be used incalculating the fees. However, any fees that are ultimately Hazardous and Solid Wasteassessed could have a material impact on our financial The Maryland Department of the Environment intends toresults. issue regulations by the end of 2007 governing ash
management in Maryland. Depending on the scope of anyNew Source Review final regulations, our compliance costs could be material.In April 2007, the U.S. Supreme Court issued a decisionregarding the standard to be used to measure emissionswhen the EPA’s new source review requirements aretriggered but did not address when those requirements aretriggered. We do not believe the Court’s decision will havea material impact on our financial results.
27
Capital Expenditures In view of the significant number of assumptionsAs discussed in our 2006 Annual Report on Form 10-K, underlying the decommissioning cost estimate and the longwe expect to incur additional environmental capital time horizons involved, our estimate of the future cost ofexpenditures to comply with air quality laws and decommissioning is likely to continue to change over time.regulations. Based on updated information from vendors, For perspective, a 10% increase or decrease in our estimatewe expect our estimated environmental capital requirements of the future cost of nuclear decommissioning wouldto be approximately $170 million in 2007, $540 million in produce an approximately $80 million change to our asset2008, $360 million in 2009 and $40 million from retirement obligation and an approximately $10 million2010-2011. change in our total annual amortization and accretion
Our estimates may change further as we implement expenses.our compliance plan. As discussed in our 2006 AnnualReport on Form 10-K, our estimates of capital expenditures Accounting Standards Issued and Adoptedcontinue to be subject to significant uncertainties. We discuss recently issued and adopted accounting
standards in the Accounting Standards Issued and AccountingCritical Accounting Policies Standards Adopted sections of the Notes to ConsolidatedWe discuss our critical accounting policies in detail in our Financial Statements beginning on page 23.2006 Annual Report on Form 10-K. Our criticalaccounting policies relate to derivative accounting, Events of 2007
Common Share Repurchase Programevaluation of assets for impairment and other thanIn October 2007, our board of directors approved atemporary decline in value, and asset retirement obligations.common share repurchase program for up to $1 billion ofFrom time to time, we perform studies to update ourour outstanding common stock. We discuss this commonnuclear decommissioning asset retirement obligations.share repurchase program in more detail in the Notes toDuring the third quarter of 2007, we completed siteConsolidated Financial Statements on page 15.specific studies for all three of our nuclear sites in which we
updated our estimate of the future cost of decommissioningConstellation Energy Partners LLCour nuclear power plants. Based on the results of theseWe discuss the issuances of Constellation Energy Partnersstudies, we recognized an approximately $124 millionLLC equity and their impact on our financial results inreduction in our asset retirement obligation. We discuss themore detail in the Notes to Consolidated Financial Statementsreduction in our asset retirement obligation in the Notes toon page 13.Consolidated Financial Statements beginning on page 12.
There are numerous key assumptions involved inAcquisitionsestimating the future cost of nuclear decommissioning,Working Interests in Gas Producing Fieldswhich, in turn, are used to develop the related assetIn March 2007, we acquired working interests in gas andretirement obligation. The following are some of the moreoil producing fields. We discuss this acquisition in moresignificant assumptions that were addressed in our 2007detail in the Notes to Consolidated Financial Statements onstudies:page 13.♦ decommissioning methods and technologies,
♦ the timing of key activities and acceptance of spentContract and Portfolio Acquisitionsfuel by the Department of Energy,In June 2007, our wholesale marketing, risk management,♦ cost-escalation assumptions for labor, materials andand trading operation acquired a portfolio of energyequipment, waste disposal, energy, transportation,contracts in the southeast region of the United States. Weand general inflation, anddiscuss this in more detail in the Notes to Consolidated♦ federal and state regulatory requirements.Financial Statements beginning on page 13.
Cornerstone EnergyIn July 2007, we acquired Cornerstone Energy, Inc. Wediscuss this acquisition in more detail in the Notes toConsolidated Financial Statements on page 14.
28

Shipping Joint Venture Synthetic Fuel Tax CreditsIn the third quarter of 2007, we made cash contributions As discussed in our 2006 Annual Report on Form 10-K,totaling $44 million to a shipping joint venture in which the Internal Revenue Code provides for a phase-out ofwe have a 50% ownership interest. We discuss this joint synthetic fuel tax credits if average annual wellhead oilventure in more detail in the Notes to Consolidated Financial prices increase above certain levels. For 2007, we estimateStatements on page 14. the tax credit reduction would begin if the reference price
exceeds approximately $56 per barrel and would be fullyRate Stabilization Bonds phased out if the reference price exceeds approximately $70In 2007, BGE formed a special purpose bankruptcy-remote per barrel.limited liability company to purchase rate stabilization Based on forward market prices and volatilities andproperty from BGE and to issue rate stabilization bonds. current production levels as of September 30, 2007, weWe discuss this entity and the related financing in more estimate a 54% tax credit phase-out in 2007. We discussdetail in the Notes to Consolidated Financial Statements on the impact of synthetic fuel tax credits on our total incomepages 11 and 17. tax expense and effective tax rate in the Notes to
Consolidated Financial Statements on page 18.Electricite de France Joint Venture Based on forward market prices and volatilities andIn August 2007, we formed a joint venture, UniStar current production levels as of October 26, 2007, weNuclear Energy, LLC, with an affiliate of Electricite de currently estimate a 69% tax credit phase-out in 2007.France. We discuss this joint venture in more detail in the However, the ultimate amount of tax credits phased-out forNotes to Consolidated Financial Statements on page 15. 2007, if any, is subject to change based on the actual
reference price and production levels for the entire year.
29

Results of Operations for the Quarter and Nine Months Ended September 30,2007 Compared with the Same Periods of 2006
In this section, we discuss our earnings and the factors ♦ We had lower earnings from discontinuedaffecting them. We begin with a general overview, then operations of $17.4 million after-tax.separately discuss earnings for our operating segments. We ♦ We had lower earnings of $17.3 million after-tax atdiscuss changes in other income, fixed charges, and income our retail competitive supply operation due totaxes, as necessary, in the aggregate for all segments in the lower gross margin and higher operating expenses.Consolidated Nonoperating Income and Expenses section We discuss our retail gross margin in more detail inbeginning on page 46. the Competitive Supply section beginning on
page 34.♦ We had lower earnings of $11.0 million after-tax atOverview
our regulated businesses primarily due to higherResultsoperations and maintenance expenses and credits toQuarter Ended Nine Months Endedresidential customers required by Maryland’s SenateSeptember 30, September 30,
2007 2006 2007 2006 Bill 1.(In millions, after-tax) ♦ We had lower earnings of approximately
Merchant energy $226.5 $266.7 $450.3 $351.5 $10 million after-tax at our wholesale competitiveRegulated electric 34.3 42.8 85.9 96.3 supply operations mostly due to higher operatingRegulated gas (9.8) (7.3) 18.2 26.3
expenses and the absence of earnings from our gasOther nonregulated (0.3) 4.1 9.9 7.9plants that were sold in December 2006, partiallyIncome from Continuingoffset by higher gross margin. We discuss ourOperations 250.7 306.3 564.3 482.0
Income (loss) from mark-to-market and wholesale accrual results indiscontinued operations 0.7 18.1 (0.9) 49.5 more detail in the Competitive Supply section
Net Income $251.4 $324.4 $563.4 $531.5 beginning on page 35.These decreases were partially offset by the following:Other Items Included in Operations
Non-qualifying hedges $ 1.9 $ 35.9 $ (6.0) $ 26.2 ♦ We had higher earnings of approximatelyImpairment losses and $24 million after-tax due to gains on the sales of
other costs — — (12.2) — equity by Constellation Energy Partners (CEP). WeWorkforce reduction costs — (13.1) (1.5) (14.4)discuss these sales in more detail in the Notes toMerger-related costs — (2.5) — (10.0)Consolidated Financial Statements on page 13.Total Other Items $ 1.9 $ 20.3 $ (19.7) $ 1.8
♦ We had higher earnings of approximatelyCertain prior-period amounts have been reclassified to conform with the $15 million after-tax from an increase in othercurrent period’s presentation.
income mostly due to interest income resultingfrom a higher cash balance primarily from proceedsQuarter Ended September 30, 2007from the sale of gas-fired plants in December 2006,Our total net income for the quarter ended September 30,and lower fixed charges due to the repayment of2007 decreased $73.0 million, or $0.41 per share,$600 million of long-term debt in April 2007.compared to the same period of 2006 mostly because of the
♦ We had higher earnings of $13.1 million after-taxfollowing:related to a lower level of workforce reduction♦ We had lower earnings of $35.7 million after-taxcosts.from our facilities that produce synthetic fuel
primarily due to a higher level of expectedNine Months Ended September 30, 2007phase-out in tax credits. We discuss the impact ofOur total net income for the nine months endedsynthetic fuel tax credits from these facilities inSeptember 30, 2007 increased $31.9 million, or $0.14 permore detail in the Notes to Consolidated Financialshare, compared to the same period of 2006 mostly becauseStatements on page 18.of the following:♦ We had lower earnings of approximately ♦ We had higher earnings of approximately$19 million after-tax at our merchant energy
$108 million after-tax at our merchant energybusiness due to lower gross margin from thebusiness due to higher gross margin from theMid-Atlantic Region. We discuss this decrease inMid-Atlantic Region. We discuss this increase ingross margin in more detail in the Mid-Atlanticgross margin in more detail in the Mid-AtlanticRegion section on page 34.Region section on page 34.
30

♦ We had higher earnings of approximately Merchant Energy Business$54 million after-tax from an increase in other Backgroundincome mostly due to interest income resulting Our merchant energy business is a competitive provider offrom a higher cash balance primarily from proceeds energy solutions for various customers. We discuss thefrom the sale of gas-fired plants in December 2006, impact of deregulation on our merchant energy business inand lower fixed charges due to the repayment of Item 1. Business—Competition section of our 2006 Annual$600 million of long-term debt in April 2007. Report on Form 10-K.
♦ We had higher earnings of approximately Our merchant energy business focuses on delivery of$31 million after-tax due to gains on the sales of physical, customer-oriented products to producers andequity by CEP. We discuss these sales in more consumers, manages the risk and optimizes the value of ourdetail in the Notes to Consolidated Financial owned generation assets, and uses our portfolioStatements on page 13. management and trading capabilities both to manage risk
♦ We had higher earnings of $12.9 million after-tax and to deploy risk capital to generate additional returns. Werelated to lower workforce reduction costs. continue to identify and pursue opportunities which can
♦ We had higher earnings of $10.0 million after-tax generate additional returns through portfolio managementdue to the absence of merger-related costs and trading activities within our business. Theseassociated with our cancelled merger with FPL opportunities have increased due to the significant growthGroup. in scale of our competitive supply operations.
These increases were partially offset by the following: We record merchant energy revenues and expenses in♦ We had lower earnings from discontinued our financial results in different periods depending upon
operations of $50.4 million after-tax. which portion of our business they affect. We discuss our♦ We had lower earnings of approximately revenue recognition policies in the Critical Accounting
$51 million after-tax at our wholesale competitive Policies section and Note 1 of our 2006 Annual Report onsupply operations mostly due to higher operating Form 10-K. We summarize our revenue and expenseexpenses and slightly lower gross margin, including recognition policies as follows:the absence of gross margin from our gas plants ♦ We record revenues as they are earned and fuel andthat were sold in December 2006. We discuss our purchased energy costs as they are incurred formark-to-market and wholesale accrual results in contracts and activities subject to accrualmore detail in the Competitive Supply section accounting, including certain load-serving activities.beginning on page 35. ♦ Prior to the settlement of the forecasted transaction
♦ We had lower earnings of $19.9 million after-tax at being hedged, we record changes in the fair valueour retail competitive supply operation due of contracts designated as cash-flow hedges in otherprimarily to higher operations expenses, partially comprehensive income to the extent that theoffset by higher gross margin. We discuss our retail hedges are effective. We record the effective portiongross margin in more detail in the Competitive of the changes in fair value of hedges in earnings inSupply section beginning on page 34. the period the settlement of the hedged transaction
♦ We had higher costs of approximately $20 million occurs. We record the ineffective portion of theafter-tax at our generating facilities mostly due to changes in fair value of hedges, if any, in earningshigher expenses at our fossil plants. in the period in which the change occurs.
♦ We had lower earnings of $18.5 million after-tax at ♦ We record changes in the fair value of contractsour regulated businesses primarily due to higher that are subject to mark-to-market accounting inoperations and maintenance expenses. revenues or fuel and purchased energy expenses in
♦ We had lower earnings due to a $12.2 million the period in which the change occurs.after-tax charge related to a cancelled wind Mark-to-market accounting requires us to makedevelopment project. We discuss this charge in estimates and assumptions using judgment in determiningmore detail in the Notes to Consolidated Financial the fair value of certain contracts and in recording revenuesStatements on page 12. from those contracts. We discuss the effects of
In the following sections, we discuss our net income mark-to-market accounting on our results in theby business segment in greater detail. Competitive Supply—Mark-to-Market section beginning on
page 36.
31

Our wholesale marketing, risk management, and Revenues and Fuel and Purchased Energy ExpensesOur merchant energy business manages the revenues wetrading operation actively transacts in energy and energy-realize from the sale of energy to our customers and ourrelated commodities in order to manage our portfolio ofcosts of procuring fuel and energy. As previously discussed,energy purchases and sales to customers through structuredour merchant energy business uses either accrual ortransactions. As part of these activities, we trade energy andmark-to-market accounting to record our revenues andenergy-related commodities and deploy risk capital in theexpenses. Mark-to-market results reflect the net impact ofmanagement of our portfolio in order to earn additionalamounts recorded in either revenues or fuel and purchasedreturns. These activities are managed through daily value atenergy expenses to recognize changes in fair value ofrisk and stop loss limits and liquidity guidelines, and mayderivative contracts subject to mark-to-market accountinghave a material impact on our financial results. We discussduring the reporting period.
the impact of our trading activities and value at risk in The difference between revenues and fuel andmore detail in the Competitive Supply—Mark-to-Market purchased energy expenses, including all direct expenses, issection beginning on page 36 and the Market Risk section the gross margin of our merchant energy business, and thisbeginning on page 52. measure is a useful tool for assessing the profitability of our
merchant energy business. Accordingly, we believe it isResults appropriate to discuss the operating results of our merchant
Quarter Ended Nine Months Ended energy business by analyzing the changes in gross marginSeptember 30, September 30,between periods. In managing our portfolio, we may2007 2006 2007 2006terminate, restructure, or acquire contracts. Such
(In millions)transactions are within the normal course of managing ourRevenues $ 5,275.9 $ 5,008.7 $ 14,113.7 $ 12,999.9portfolio and may materially impact the timing of ourFuel and purchased
energy expenses (4,319.2) (4,055.7) (11,808.0) (10.862.4) recognition of revenues, fuel and purchased energyOperating expenses (486.1) (367.3) (1,338.0) (1,146.3) expenses, and cash flows.Impairment losses and
We analyze our merchant energy gross margin in theother costs — — (20.2) —Workforce reduction following categories because of the risk profile of each
costs — (21.7) (2.3) (23.9) category, differences in the revenue sources, and the natureMerger-related costs — (2.5) — (8.8)of fuel and purchased energy expenses. With the exceptionDepreciation,
depletion, and of a portion of our competitive supply activities that we areamortization (66.9) (68.6) (197.7) (199.3) required to account for using the mark-to-market methodAccretion of asset
of accounting, all of these activities are accounted for on anretirementobligations (16.0) (17.0) (51.9) (50.2) accrual basis.
Taxes other than ♦ Mid-Atlantic Region—our fossil, nuclear, andincome taxes (29.1) (31.3) (85.0) (90.9)
hydroelectric generating facilities and load-servingIncome from activities in the PJM region. This also includesOperations $ 358.6 $ 444.6 $ 610.6 $ 618.1
active portfolio management of the generatingIncome from assets and other physical and financial contractualContinuing
arrangements, as well as other PJM competitiveOperations (after-tax) $ 226.5 $ 266.7 $ 450.3 $ 351.5 supply activities.Income from ♦ Plants with Power Purchase Agreements—our Ninediscontinued
Mile Point and Ginna nuclear generating facilities.operations (after-tax) 0.7 18.1 (0.9) 48.6 ♦ Wholesale Competitive Supply—our marketing,
Net Income $ 227.2 $ 284.8 $ 449.4 $ 400.1 risk management, and trading operation thatprovides energy products and services (includingOther Items Included in Operations (after-tax)
Non-qualifying portfolio management and trading activities)hedges $ 1.9 $ 35.9 $ (6.0) $ 26.2 primarily to distribution utilities, power generators,Impairment losses
and other wholesale customers. We also provideand other costs — — (12.2) —Workforce global energy, logistics, and upstream and
reduction costs — (13.1) (1.5) (14.4) downstream natural gas services.Merger-related costs — (1.8) — (7.0) ♦ Retail Competitive Supply—our operation thatTotal Other Items $ 1.9 $ 21.0 $ (19.7) $ 4.8 provides electric and gas energy products andCertain prior-period amounts have been reclassified to conform with the services to commercial, industrial, andcurrent period’s presentation. Above amounts include intercompany
governmental customers.transactions eliminated in our Consolidated Financial Statements. The♦ Other—our investments in qualifying facilities andInformation by Operating Segment section within the Notes to
Consolidated Financial Statements on page 16 provides a reconciliation domestic power projects and our generationof operating results by segment to our Consolidated Financial Statements. operations and maintenance services.
32

We provide a summary of our revenues, fuel and purchased energy expenses, and gross margin as follows:
Quarter Ended September 30, Nine Months Ended September 30,2007 2006 2007 2006
(Dollar amounts in millions)Revenues:
Mid-Atlantic Region $ 1,364.6 $ 1,002.2 $ 2,596.8 $ 2,119.2Plants with Power Purchase
Agreements 204.1 214.7 517.6 518.0Competitive Supply
Retail 2,291.0 2,094.8 6,671.2 5,964.9Wholesale 1,387.2 1,668.9 4,274.6 4,339.3
Other 29.0 28.1 53.5 58.5
Total $ 5,275.9 $ 5,008.7 $ 14,113.7 $ 12,999.9
Fuel and purchased energy expenses:Mid-Atlantic Region $ (998.9) $ (605.3) $ (1,669.7) $ (1,370.3)Plants with Power Purchase
Agreements (20.8) (16.5) (58.4) (51.3)Competitive Supply
Retail (2,172.1) (1,964.9) (6,360.9) (5,667.6)Wholesale (1,127.4) (1,469.0) (3,719.0) (3,773.2)
Other — — — —
Total $(4,319.2) $(4,055.7) $(11,808.0) $(10,862.4)
% of % of % of % ofTotal Total Total Total
Gross Margin:Mid-Atlantic Region $ 365.7 38% $ 396.9 41% $ 927.1 40% $ 748.9 35%Plants with Power Purchase
Agreements 183.3 19 198.2 21 459.2 20 466.7 22Competitive Supply
Retail 118.9 12 129.9 14 310.3 13 297.3 14Wholesale 259.8 28 199.9 21 555.6 25 566.1 26
Other 29.0 3 28.1 3 53.5 2 58.5 3
Total $ 956.7 100% $ 953.0 100% $ 2,305.7 100% $ 2,137.5 100%
Certain prior-period amounts have been reclassified to conform with the current period’s presentation. Revenues for the ninemonths ended September 30, 2007 reflect the reclassification of $111.7 million relating to the six months ended June 30, 2007 toconform with the current period presentation. Prior year reclassifications relate to operations that have been classified asdiscontinued operations.
Merchant energy gross margin for the quarter and nine ♦ Additionally, we were required to discontinue themonths ended September 30, 2007 includes the effects of application of hedge accounting treatment formarket price changes on derivatives designated as cash-flow certain derivatives due to insufficient priceand fair value hedges. These market price changes had two correlation between the hedge and the risk beingprimary impacts on the quarter and nine months ended hedged. As a result, the full change in the fair valueSeptember 30, 2007: of these derivatives has been recorded in earnings.
♦ We experienced a significant increase in the level ofineffectiveness associated with derivatives thatqualified for hedge accounting treatment.
33

The merchant energy gross margin impact for the The $178.2 million increase in gross margin duringquarter and nine months ended September 30, 2007 from the nine months ended September 30, 2007 compared tothe effect of market price changes on derivatives designated the same period of 2006 is primarily due to approximatelyas cash-flow and fair value hedges is summarized as follows: $244 million in higher margins on new and existing
contracts. The increase in gross margin was partially offsetQuarter Ended Nine Months EndedSeptember 30, September 30, by the following:
2007 2007 ♦ the unfavorable impact of approximately(in millions) $25 million related to losses recognized on
Ineffectiveness on cash-flow hedges due to ineffectiveness and certainderivatives that qualified cash-flow hedges that did not qualify for hedgefor hedge accounting accounting during the quarter, andtreatment $ 30.9 $ 1.7 ♦ absence of competitive transition charge (CTC)
Effect of reduced price revenue of $41.0 million, which ended June 30,correlation on derivatives 2006.that did not qualify forhedge accounting
Plants with Power Purchase AgreementstreatmentQuarter Ended Nine Months EndedDerivatives that remainSeptember 30, September 30,
designated as hedges 2007 2006 2007 2006prospectively 9.1 (7.3)
(In millions)Derivatives not eligibleRevenues $204.1 $214.7 $517.6 $518.0
for designation as Fuel and purchasedhedges prospectively (14.1) (51.1) energy expenses (20.8) (16.5) (58.4) (51.3)
Total $ 25.9 $(56.7) Gross margin $183.3 $198.2 $459.2 $466.7
We discuss below the impact of these items on the Gross margin from our Plants with Power Purchaseapplicable categories of merchant energy gross margin for Agreements was $14.9 million lower primarily due to lowerthe quarter and nine months ended September 30, 2007 prices for the output from our facilities, partially offset bycompared to the same periods of 2006. We discuss our higher output from our Ginna nuclear facility for thehedging activities in more detail in the Notes to Consolidated quarter ended September 30, 2007. Gross margin from ourFinancials beginning on page 22. Plants with Power Purchase Agreements was $7.5 million
lower primarily due to higher nuclear fuel amortizationMid-Atlantic Region expense and lower prices for the output from our facilities,
Quarter Ended Nine Months Ended partially offset by higher output from our Ginna nuclearSeptember 30, September 30, facility for the nine months ended September 30, 2007.2007 2006 2007 2006
During the fourth quarter of 2006, we completed a(In millions) planned outage at Ginna, which included increasing the
Revenues $1,364.6 $1,002.2 $ 2,596.8 $ 2,119.2plant capacity from 498 megawatts to the current 581Fuel and purchasedmegawatts.energy expenses (998.9) (605.3) (1,669.7) (1,370.3)
Gross margin $ 365.7 $ 396.9 $ 927.1 $ 748.9Competitive SupplyRetailThe decrease in gross margin of $31.2 million during the
Quarter Ended Nine Months Endedquarter ended September 30, 2007 compared to the sameSeptember 30, September 30,period of 2006 is primarily due to approximately 2007 2006 2007 2006
$50 million related to lower volumes served, partially offset(In millions)by $19 million related to the favorable impact of gains on
Accrual revenues $ 2,288.1 $ 2,083.3 $ 6,688.3 $ 5,943.2certain cash-flow hedges. The favorable impact of gains Fuel and purchasedrecognized on cash-flow hedges is due to ineffectiveness and energy expenses (2,172.1) (1,981.3) (6,360.9) (5,664.8)certain cash-flow hedges that did not qualify for hedge Retail accrual activities 116.0 102.0 327.4 278.4accounting during the quarter ended September 30, 2007 Mark-to-market
activities 2.9 27.9 (17.1) 18.9compared to the same period of 2006.Gross margin $ 118.9 $ 129.9 $ 310.3 $ 297.3
34
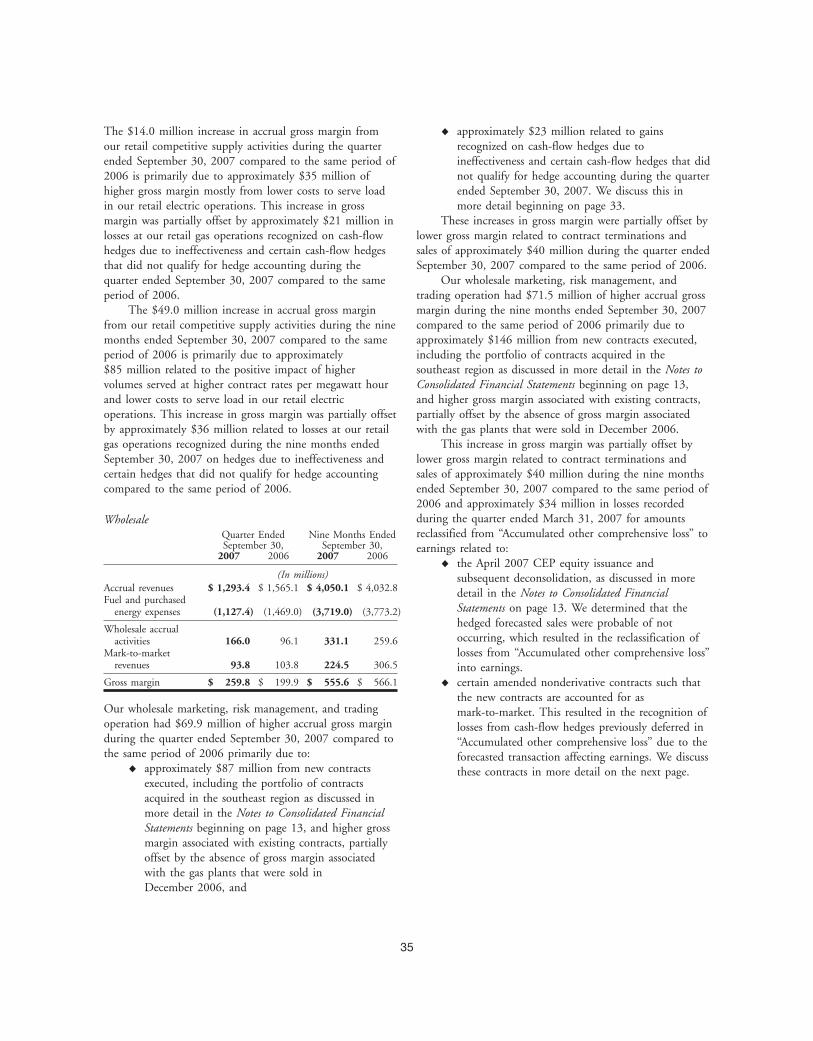
The $14.0 million increase in accrual gross margin from ♦ approximately $23 million related to gainsour retail competitive supply activities during the quarter recognized on cash-flow hedges due toended September 30, 2007 compared to the same period of ineffectiveness and certain cash-flow hedges that did2006 is primarily due to approximately $35 million of not qualify for hedge accounting during the quarterhigher gross margin mostly from lower costs to serve load ended September 30, 2007. We discuss this inin our retail electric operations. This increase in gross more detail beginning on page 33.margin was partially offset by approximately $21 million in These increases in gross margin were partially offset bylosses at our retail gas operations recognized on cash-flow lower gross margin related to contract terminations andhedges due to ineffectiveness and certain cash-flow hedges sales of approximately $40 million during the quarter endedthat did not qualify for hedge accounting during the September 30, 2007 compared to the same period of 2006.quarter ended September 30, 2007 compared to the same Our wholesale marketing, risk management, andperiod of 2006. trading operation had $71.5 million of higher accrual gross
The $49.0 million increase in accrual gross margin margin during the nine months ended September 30, 2007from our retail competitive supply activities during the nine compared to the same period of 2006 primarily due tomonths ended September 30, 2007 compared to the same approximately $146 million from new contracts executed,period of 2006 is primarily due to approximately including the portfolio of contracts acquired in the$85 million related to the positive impact of higher southeast region as discussed in more detail in the Notes tovolumes served at higher contract rates per megawatt hour Consolidated Financial Statements beginning on page 13,and lower costs to serve load in our retail electric and higher gross margin associated with existing contracts,operations. This increase in gross margin was partially offset partially offset by the absence of gross margin associatedby approximately $36 million related to losses at our retail with the gas plants that were sold in December 2006.gas operations recognized during the nine months ended This increase in gross margin was partially offset bySeptember 30, 2007 on hedges due to ineffectiveness and lower gross margin related to contract terminations andcertain hedges that did not qualify for hedge accounting sales of approximately $40 million during the nine monthscompared to the same period of 2006. ended September 30, 2007 compared to the same period of
2006 and approximately $34 million in losses recordedduring the quarter ended March 31, 2007 for amountsWholesalereclassified from ‘‘Accumulated other comprehensive loss’’ toQuarter Ended Nine Months Ended
September 30, September 30, earnings related to:2007 2006 2007 2006 ♦ the April 2007 CEP equity issuance and
(In millions) subsequent deconsolidation, as discussed in moreAccrual revenues $ 1,293.4 $ 1,565.1 $ 4,050.1 $ 4,032.8 detail in the Notes to Consolidated FinancialFuel and purchased
Statements on page 13. We determined that theenergy expenses (1,127.4) (1,469.0) (3,719.0) (3,773.2)hedged forecasted sales were probable of notWholesale accrualoccurring, which resulted in the reclassification ofactivities 166.0 96.1 331.1 259.6
Mark-to-market losses from ‘‘Accumulated other comprehensive loss’’revenues 93.8 103.8 224.5 306.5 into earnings.
Gross margin $ 259.8 $ 199.9 $ 555.6 $ 566.1 ♦ certain amended nonderivative contracts such thatthe new contracts are accounted for as
Our wholesale marketing, risk management, and trading mark-to-market. This resulted in the recognition ofoperation had $69.9 million of higher accrual gross margin losses from cash-flow hedges previously deferred induring the quarter ended September 30, 2007 compared to ‘‘Accumulated other comprehensive loss’’ due to thethe same period of 2006 primarily due to: forecasted transaction affecting earnings. We discuss
♦ approximately $87 million from new contracts these contracts in more detail on the next page.executed, including the portfolio of contractsacquired in the southeast region as discussed inmore detail in the Notes to Consolidated FinancialStatements beginning on page 13, and higher grossmargin associated with existing contracts, partiallyoffset by the absence of gross margin associatedwith the gas plants that were sold inDecember 2006, and
35

Mark-to-Market Origination gains arise primarily from contracts thatMark-to-market results include net gains and losses from our wholesale marketing, risk management, and tradingorigination, trading, and risk management activities for operation structures to meet the risk management needs ofwhich we use the mark-to-market method of accounting. our customers or relate to our trading activities.We discuss these activities and the mark-to-market method Transactions that result in origination gains may be uniqueof accounting in more detail in the Critical Accounting and provide the potential for individually significantPolicies section of our 2006 Annual Report on Form 10-K. revenues and gains from a single transaction.
As a result of the nature of our operations and the use Origination gains represent the initial fair valueof mark-to-market accounting for certain activities, recognized on these transactions. The recognition ofmark-to-market earnings will fluctuate. We cannot predict origination gains is dependent on sufficient observablethese fluctuations, but the impact on our earnings could be market data that validates the initial fair value of thematerial. We discuss our market risk in more detail in the contract. Liquidity and market conditions impact ourMarket Risk section beginning on page 52. The primary ability to identify sufficient, objective market-pricefactors that cause fluctuations in our mark-to-market results information to permit recognition of origination gains. As aare: result, while our strategy and competitive position provide
♦ the number, size, and profitability of new the opportunity to continue to originate such transactions,transactions, including termination or restructuring the level of origination gains we are able to recognize mayof existing contracts, vary from period to period as a result of the number, size,
♦ the number and size of our open derivative and market-price transparency of the individual transactionspositions, and executed in any period.
♦ changes in the level and volatility of forward During the first nine months of 2007, our wholesalecommodity prices and interest rates. marketing, risk management, and trading operation
Mark-to-market results were as follows: amended certain nonderivative power sales contracts suchQuarter Ended Nine Months Ended that the new contracts are derivatives subject toSeptember 30, September 30, mark-to-market accounting under Statement of Financial2007 2006 2007 2006
Accounting Standards (SFAS) No. 133, Accounting for(In millions) Derivative Instruments and Hedging Activities, as amended.
Unrealized mark-to- Simultaneous with the amending of the nonderivativemarket resultscontracts, we executed at current market prices several newOrigination gains $ 4.3 $ 3.6 $ 37.4 $ 9.6offsetting derivative power purchase contracts subject toRisk management andmark-to-market accounting. The combination of thesetrading—mark-to-
market transactions resulted in substantially all of the originationUnrealized changes in gains presented for the first nine months of 2007 in the
fair value 92.4 128.1 170.0 315.8table on the previous page, as well as mitigated our riskChanges in valuationexposure under the amended contracts.techniques — — — —
Reclassification of The origination gain from these transactions wassettled contracts to partially offset by approximately $12 million of losses inrealized (21.3) (95.4) (189.2) (324.3) our accrual portfolio due to the reclassification of losses
Total risk management related to cash-flow hedges previously established for theand trading—mark-to-
amended nonderivative contracts from ‘‘Accumulated othermarket 71.1 32.7 (19.2) (8.5)comprehensive loss’’ into earnings as discussed in our
Total unrealized mark-to-Competitive Supply-Wholesale Accrual section on the previousmarket* 75.4 36.3 18.2 1.1page. In the absence of these transactions, the originationRealized mark-to-market 21.3 95.4 189.2 324.3gain and the losses associated with cash-flow hedges wouldTotal mark-to-markethave been recognized over the remaining term of theresults $ 96.7 $131.7 $207.4 $ 325.4contracts, which extended through the first quarter of 2009.* Total unrealized mark-to-market is the sum of origination gains and
total risk management and trading—mark-to-market.
36

Risk management and trading—mark-to-market Total mark-to-market results decreased $118.0 millionrepresents both realized and unrealized gains and losses during the nine months ended September 30, 2007from changes in the value of our portfolio, including the compared to the same period of 2006 mostly because of arecognition of gains associated with decreases in the decrease in unrealized changes in fair value of approximatelyclose-out adjustment when we are able to obtain sufficient $146 million, partially offset by the $28 million increase inmarket price information. In addition, we use derivative origination gains previously discussed. The $146 millioncontracts subject to mark-to-market accounting to manage decrease in unrealized changes in fair value was a result of:our exposure to changes in market prices primarily as a ♦ a less favorable price environment resulting in lowerresult of our gas transportation and storage activities, while gains of approximately $136 million,in general the underlying physical transactions related to ♦ approximately $53 million from lowerour gas activities are accounted for on an accrual basis. We mark-to-market results related to the impact ofdiscuss the changes in mark-to-market results below. We certain economic hedges primarily related to gasshow the relationship between our mark-to-market results transportation and storage contracts, andand the change in our net mark-to-market energy asset later ♦ these decreases were partially offset by ain this section. $42.8 million favorable impact related to changes
Total mark-to-market results decreased $35.0 million in the close-out adjustment.during the quarter ended September 30, 2007 compared to The close-out adjustments are determined by thethe same period of 2006 mostly because of a decrease in change in open positions, new transactions where we didunrealized changes in fair value of approximately not have observable market price information, and existing$36 million, primarily due to approximately $56 million transactions where we have now observed sufficient marketlower mark-to-market results related to the impact of price information and/or we realized cash flows since thecertain economic hedges primarily related to gas transactions’ inception. We discuss the close-out adjustmenttransportation and storage contracts that do not qualify for in more detail in the Critical Accounting Policies section ofor are not designated as cash-flow hedges under Statement our 2006 Annual Report on Form 10-K.of Financial Accounting Standards (SFAS) No. 133,Accounting for Derivative Instruments and Hedging Activities,as amended, partially offset by higher earnings of$21.7 million for the favorable impact related to changes inthe close-out adjustment.
37

Mark-to-Market Energy Assets and Liabilities Changes in the net mark-to-market energy asset thatOur mark-to-market energy assets and liabilities are affected earnings were as follows:comprised of derivative contracts subject to ♦ Origination gains represent the initial unrealizedmark-to-market accounting and consisted of the following: fair value at the time these contracts are executed
to the extent permitted by applicable accountingSeptember 30, December 31,2007 2006 rules.
♦ Unrealized changes in fair value represent(In millions)unrealized changes in commodity prices, theCurrent Assets $ 963.8 $1,294.8
Noncurrent Assets 699.9 623.4 volatility of options on commodities, the timevalue of options, and other valuation adjustments.Total Assets 1,663.7 1,918.2
♦ Changes in valuation techniques representCurrent Liabilities 687.1 1,071.7
improvements in estimation techniques, includingNoncurrent Liabilities 406.8 392.4modeling and other statistical enhancements used
Total Liabilities 1,093.9 1,464.1 to value our portfolio to more accurately reflectNet mark-to-market the fair value of our contracts.
energy asset $ 569.8 $ 454.1 ♦ Reclassification of settled contracts to realizedrepresent the portion of previously unrealized
The following are the primary sources of the change amounts settled during the period and recorded asin the net mark-to-market energy asset during the quarter realized revenues.and nine months ended September 30, 2007: The net mark-to-market energy asset also changed
due to the following items recorded in accounts otherQuarter Ended Nine Months EndedSeptember 30, 2007 September 30, 2007 than in our Consolidated Statements of Income:
♦ Changes in value of exchange-listed futures and(in millions)Fair value beginning options are adjustments to remove unrealized
of period $532.5 $454.1 revenue from exchange-traded contracts that areChanges in fair included in risk management revenues. The fair
value recorded in value of these contracts is recorded in ‘‘Accountsearnings
receivable’’ rather than ‘‘Mark-to-market energyOrigination gains $ 4.3 $ 37.4assets’’ in our Consolidated Balance Sheets becauseUnrealized changesthese amounts are settled through our marginin fair value 92.4 170.0account with a third-party broker.Changes in
valuation ♦ Net changes in premiums on options reflects thetechniques — — accounting for premiums on options purchased as
Reclassification of an increase in the net mark-to-market energy assetsettled contracts and premiums on options sold as a decrease into realized (21.3) (189.2)
the net mark-to-market energy asset.Total changes in fair ♦ Contracts acquired represents the initial fair value
value recorded in of acquired derivative contracts recorded inearnings 75.4 18.2 ‘‘Mark-to-market energy assets and liabilities’’ in
Changes in value ofour Consolidated Balance Sheets.exchange-listed ♦ Other changes in fair value include transfersfutures andbetween mark-to-market energy assets andoptions 39.6 48.2liabilities and risk management assets andNet change in
premiums on liabilities resulting from the designation andoptions (77.2) 10.7 de-designation of cash-flow hedges.
Contracts acquired (5.1) 88.5Other changes in
fair value 4.6 (49.9)
Fair value at end ofperiod $569.8 $569.8
38

The settlement terms of the net mark-to-market energy asset and sources of fair value as of September 30, 2007 are asfollows:
Settlement Term
2007 2008 2009 2010 2011 2012 Thereafter Fair Value
(In millions)Prices provided by external sources(1) $146.3 $222.7 $ 5.2 $(24.1) $(46.0) $ (9.8) $1.5 $295.8Prices based on models 16.2 (3.1) 76.2 75.0 95.3 13.1 1.3 274.0
Total net mark-to-market energy asset $162.5 $219.6 $81.4 $ 50.9 $ 49.3 $ 3.3 $2.8 $569.8
(1) Includes contracts actively quoted and contracts valued from other external sources.
We manage our mark-to-market risk on a portfolio ♦ options for the purchase and sale of electricitybasis based upon the delivery period of our contracts and during peak hours for delivery terms throughthe individual components of the risks within each 2008, depending upon the region,contract. Accordingly, we record and manage the energy ♦ forward purchases and sales of electric capacity forpurchase and sale obligations under our contracts in delivery terms primarily through 2007, but up toseparate components based upon the commodity (e.g., 2008, depending upon the region,electricity or gas), the product (e.g., electricity for delivery ♦ forward and swap purchases and sales of naturalduring peak or off-peak hours), the delivery location (e.g., gas, coal, and oil for delivery terms primarilyby region), the risk profile (e.g., forward or option), and through 2011, andthe delivery period (e.g., by month and year). ♦ options for the purchase and sale of natural gas,
Consistent with our risk management practices, we coal, and oil for delivery terms through 2008.have presented the information in the table on the The remainder of the net mark-to-market energyprevious page based upon the ability to obtain reliable asset is valued using models. The portion of contracts forprices for components of the risks in our contracts from which such techniques are used includes standard productsexternal price sources rather than on a for which external prices are not available and customizedcontract-by-contract basis. Thus, the portion of long-term products that are valued using modeling techniques tocontracts that is valued using external price sources is determine expected future market prices, contractpresented under the caption ‘‘prices provided by external quantities, or both.sources.’’ This is consistent with how we manage our risk, Modeling techniques include estimating the presentand we believe it provides the best indication of the basis value of cash flows based upon underlying contractualfor the valuation of our portfolio. Since we manage our terms and incorporate, where appropriate, option pricingrisk on a portfolio basis rather than contract-by-contract, models and statistical and simulation procedures. Inputs toit is not practicable to determine separately the portion of the models include:long-term contracts that is included in each valuation ♦ observable market prices,category. We describe the commodities, products, and ♦ estimated market prices in the absence of quoteddelivery periods included in each valuation category in market prices,detail below. ♦ the risk-free market discount rate,
The amounts for which fair value is determined ♦ volatility factors,using prices provided by external sources represent the ♦ estimated correlation of energy commodity prices,portion of forward, swap, and option contracts for which andprice quotations are available through brokers or ♦ expected generation profiles of specific regions.over-the-counter transactions. The term for which such Additionally, we incorporate counterparty-specificprice information is available varies by commodity, region, credit quality and factors for market price and volatilityand product. The fair values included in this category are uncertainty and other risks in our valuation. The inputsthe following portions of our contracts: and factors used to determine fair value reflect
♦ forward and swap purchases and sales of electricity management’s best estimates.during peak and off-peak hours for delivery termsprimarily through 2010, but up to 2012,depending upon the region,
39

The electricity, fuel, and other contracts we hold have In 2006, the Financial Accounting Standards Boardvarying terms to maturity, ranging from contracts for issued SFAS No. 157, Fair Value Measurements, that willdelivery the next hour to contracts with terms of ten years impact our accounting for derivative instruments. Weor more. Because an active, liquid electricity futures discuss this in more detail in Note 1 of our 2006 Annualmarket comparable to that for other commodities has not Report on Form 10-K.developed, the majority of contracts used in the wholesalemarketing, risk management, and trading operation are Risk Management Assets and Liabilitiesdirect contracts between market participants and are not We record derivatives that qualify for designation asexchange-traded or financially settling contracts that can hedges under SFAS No. 133 in ‘‘Risk management assetsbe readily liquidated in their entirety through an exchange and liabilities’’ in our Consolidated Balance Sheets. Ouror other market mechanism. Consequently, we and other risk management assets and liabilities consisted of themarket participants generally realize the value of these following:contracts as cash flows become due or payable under the September 30, December 31,terms of the contracts rather than through selling or 2007 2006liquidating the contracts themselves. (In millions)
Consistent with our risk management practices, the Current Assets $ 165.1 $ 261.7amounts shown in the table on the previous page as being Noncurrent Assets 449.2 325.7valued using prices from external sources include the Total Assets 614.3 587.4portion of long-term contracts for which we can obtain
Current Liabilities 840.8 1,340.0reliable prices from external sources. The remainingNoncurrent Liabilities 802.3 707.3
portions of these long-term contracts are shown in theTotal Liabilities 1,643.1 2,047.3table as being valued using models. In order to realize the
entire value of a long-term contract in a single transaction, Net risk management liability $(1,028.8) $(1,459.9)we would need to sell or assign the entire contract. If we
The decrease in our net risk management liabilitywere to sell or assign any of our long-term contracts insince December 31, 2006 of $431.1 million was duetheir entirety, we may not realize the entire value reflectedprimarily to an approximate $264 million change in ourin the table. However, based upon the nature of thecash-flow hedge positions, which include both increases inwholesale marketing, risk management, and tradingpower prices that increased the fair value of our cash-flowoperation, we expect to realize the value of these contracts,hedge positions and settlements of cash-flow hedgesas well as any contracts we may enter into in the future toduring the nine months ended September 30, 2007, andmanage our risk, over time as the contracts and relatedapproximately $167 million of net cash-flow hedge assetshedges settle in accordance with their terms. Generally, weacquired as part of a contract and portfolio acquisition indo not expect to realize the value of these contracts andJune 2007. We discuss this contract and portfoliorelated hedges by selling or assigning the contractsacquisition in more detail in the Notes to Consolidatedthemselves in total.Financial Statements beginning on page 13.The fair values in the table represent expected future
cash flows based on the level of forward prices andOthervolatility factors as of September 30, 2007 and could
change significantly as a result of future changes in these Quarter Ended Nine Months Endedfactors. Additionally, because the depth and liquidity of September 30, September 30,
2007 2006 2007 2006the power markets varies substantially between regions and(In millions)time periods, the prices used to determine fair value could
Revenues $29.0 $28.1 $53.5 $58.5be affected significantly by the volume of transactionsexecuted.
Our merchant energy business holds up to a 50%Management uses its best estimates to determine thevoting interest in 24 operating domestic energy projectsfair value of commodity and derivative contracts it holdsthat consist of electric generation, fuel processing, or fueland sells. These estimates consider various factorshandling facilities. Of these 24 projects, 17 are ‘‘qualifyingincluding closing exchange and over-the-counter pricefacilities’’ that receive certain exemptions and pricingquotations, time value, volatility factors, and creditunder the Public Utility Regulatory Policy Act of 1978exposure. However, future market prices and actualbased on the facilities’ energy source or the use of aquantities will vary from those used in recordingcogeneration process.mark-to-market energy assets and liabilities, and it is
possible that such variations could be material.
40

We believe the current market conditions for our ♦ an increase of $32.9 million at our generatingequity-method investments that own geothermal, coal, facilities which included higher expenses ofhydroelectric, and fuel processing projects provide approximately $10 million at our fossil plants,sufficient positive cash flows to recover our investments. approximately $6 million in higher costs relatedWe continuously monitor issues that potentially could to new nuclear development, and expenses ofimpact future profitability of these investments, including approximately $4 million related to the consentenvironmental and legislative initiatives. We discuss the decree with the Maryland Department of theimpact of subsidies from the State of California in more Environment. We discuss the consent decree indetail in the Merchant Energy Business—Other section in more detail in the Notes to Consolidated Financialour 2006 Annual Report on Form 10-K. Statements on page 21.
We discuss certain risks and uncertainties in moredetail in the Forward Looking Statements section on Impairment Losses and Other Costspage 57 and in Item 1A. Risk Factors section on page 56. During the nine months ended September 30, 2007, ourHowever, should future events cause these investments to merchant energy business recorded a $20.2 million chargebecome uneconomic, our investments in these projects associated with a cancelled wind development project. Wecould become impaired under the provisions of discuss the charge in more detail in the Notes toAccounting Principles Board Opinion (APB) No. 18, The Consolidated Financial Statements on page 12.Equity Method of Accounting for Investments in CommonStock. Workforce Reduction Costs
During the nine months ended September 30, 2007, ourOperating Expenses merchant energy business recognized expenses, net ofOur merchant energy business operating expenses reimbursement from co-owners, of $2.3 million associatedincreased $118.8 million during the quarter ended with our workforce reduction efforts at our Nine MileSeptember 30, 2007 compared to the same period of Point nuclear facility. We discuss the workforce reduction2006 mostly due to the following: in more detail in the Notes to Consolidated Financial
♦ an increase at our competitive supply operation Statements on page 12.totaling $90.7 million primarily related to thecontinued growth of this operation and higher Taxes Other Than Income Taxescompensation and benefit costs, and Taxes other than income taxes decreased $5.9 million
♦ an increase of $12.1 million at our generating during the nine months ended September 30, 2007facilities reflecting higher expenses at our fossil compared to the same period of 2006 primarily due toplants, which included approximately $4 million $4.7 million lower gross receipts tax at our retailin expenses related to the consent decree with the competitive supply operation and a $3.1 million decreaseMaryland Department of the Environment, and due to the sale of our gas-fired plants. These decreases areapproximately $2 million due to the growth in partially offset by an increase of $2.7 million mostly dueour business activities related to new nuclear to growth of our upstream gas business.development. We discuss the consent decree inmore detail in the Notes to Consolidated FinancialStatements on page 21.
Our merchant energy business operating expensesincreased $191.7 million during the nine months endedSeptember 30, 2007 compared to the same period of2006 mostly due to the following:
♦ an increase at our competitive supply operationstotaling $138.2 million primarily related to thecontinued growth of this operation and highercompensation and benefit costs, and
41

Electric RevenuesRegulated Electric BusinessThe changes in electric revenues in 2007 compared toOur regulated electric business is discussed in detail in2006 were caused by:Item 1. Business—Electric Business section of our 2006
Annual Report on Form 10-K. Quarter Ended Nine Months EndedSeptember 30, September 30,2007 vs. 2006 2007 vs. 2006Results
(In millions)Quarter Ended Nine Months EndedDistribution volumes $ 5.4 $ 10.2September 30, September 30,
2007 2006 2007 2006 Standard offer service (57.4) 270.3Rate stabilization credits 169.8 (111.0)(In millions)Rate stabilization recovery 18.7 24.0Revenues $ 778.2 $ 649.9 $ 1,837.3 $1,652.6Financing credit (3.8) (4.5)Electricity purchasedSenate Bill 1 credits (10.6) (21.6)for resale expenses (522.6) (391.1) (1,117.7) (933.8)
Operations and Total change in electricmaintenance revenues from electricexpenses (96.7) (89.3) (274.9) (258.9) system sales 122.1 167.4
Merger-related costs — (0.6) — (2.3) Other 6.2 17.3Depreciation and
Total change in electricamortization (46.8) (45.6) (140.5) (137.1)revenues $128.3 $ 184.7Taxes other than
income taxes (36.1) (34.7) (105.8) (101.5)
Income from Distribution VolumesOperations $ 76.0 $ 88.6 $ 198.4 $ 219.0
Distribution volumes are the amount of electricity thatNet Income $ 34.3 $ 42.8 $ 85.9 $ 96.3 BGE delivers to customers in its service territory.
The percentage changes in our distribution volumes,Other Items Included in Operations (after-tax):by type of customer, in 2007 compared to 2006 were:Merger-related costs $ — $ (0.5) $ — $ (2.0)
Above amounts include intercompany transactions eliminated in our Quarter Ended Nine Months EndedConsolidated Financial Statements. The Information by Operating September 30, September 30,Segment section within the Notes to Consolidated Financial Statements 2007 vs. 2006 2007 vs. 2006on page 16 provides a reconciliation of operating results by segment to Residential 0.3% 5.3%our Consolidated Financial Statements. Commercial (1.5) 2.5
Industrial 2.2 (2.6)Net income from the regulated electric businessDuring the quarter ended September 30, 2007decreased $8.5 million during the quarter ended
compared to the same period of 2006, we distributedSeptember 30, 2007 compared to the same period ofessentially the same amount of electricity to residential2006, mostly due to increased operations and maintenancecustomers. We distributed less electricity to commercialexpenses of $4.5 million after-tax and decreased revenuecustomers due to milder weather and decreased usage perless electricity purchased for resale expenses ofcustomer partially offset by an increased number of$2.0 million after-tax reflecting credits to residentialcustomers. We distributed more electricity to industrialcustomers required by Maryland’s Senate Bill 1.customers primarily due to increased usage per customer.Net income from the regulated electric business
During the nine months ended September 30, 2007decreased $10.4 million during the nine months endedcompared to the same period of 2006, we distributedSeptember 30, 2007 compared to the same period ofmore electricity to residential and commercial customers2006, primarily due to increased operations anddue to increased usage per customer, colder wintermaintenance expenses of $9.8 million after-tax.weather, and an increased number of customers. Wedistributed less electricity to industrial customers primarilydue to decreased usage per customer, partially offset by anincreased number of customers.
42

Standard Offer Service Rate Stabilization Recovery
BGE provides standard offer service for customers that do Recovery of the amounts deferred under the ratenot select an alternative supplier. We discuss the provisions stabilization plan that ended on May 31, 2007 began inof Senate Bill 1 related to residential electric rates in the late June 2007.Item 1. Business—Electric Regulatory Matters andCompetition section of our 2006 Annual Report on Financing CreditsForm 10-K and recent developments related to residential Concurrent with the recovery of the deferred amountselectric rates in the Regulation by the Maryland PSC related to the rate stabilization plan, we are providingsection beginning on page 26. credits to residential customers to compensate them
Standard offer service revenues decreased during the primarily for income tax benefits associated with thequarter ended September 30, 2007 compared to the same financing of the deferred amounts with rate stabilizationperiod of 2006 due to lower standard offer service bonds. We discuss the rate stabilization bonds in morevolumes due to commercial and industrial customers detail in the Notes to Consolidated Financial Statements onswitching to alternative suppliers and a decrease in the page 17.standard offer service rates.
Standard offer service revenues increased during theSenate Bill 1 Credits
nine months ended September 30, 2007 compared to theAs a result of Senate Bill 1, beginning January 1, 2007,same period of 2006 due to higher standard offer servicewe were required to provide to residential electricvolumes and an increase in the standard offer service ratescustomers a credit equal to the amount collected from allfollowing the expiration of residential rate freeze service inBGE ratepayers for the decommissioning of our CalvertJuly 2006.Cliffs nuclear power plant and to suspend collection ofthe residential return component of the Provider of LastRate Stabilization CreditsResort (POLR) administrative charge collected through
As a result of Senate Bill 1, we were required to defer residential POLR rates through May 31, 2007. Under anfrom July 1, 2006 until May 31, 2007 a portion of the order issued by the Maryland PSC in May 2007, as offull market rate increase resulting from the expiration of June 1, 2007, we were required to reinstate collection ofthe residential rate freeze. In addition, we offered a plan the residential return component of the POLRallowing residential customers the option to defer the administration charge in POLR rates and to provide alltransition to market rates from June 1, 2007 until residential electric customers a credit for the residentialJanuary 1, 2008. Based on the number of customers return component of the administrative charge.electing to defer the transition to market rates fromJune 1, 2007 until January 1, 2008, the total amount
Electricity Purchased for Resale Expensesdeferred under this plan is expected to be approximately
Electricity purchased for resale expenses include the cost of$6 million.
electricity purchased for resale to our standard offer serviceDuring the quarter ended September 30, 2007
customers. These costs do not include the cost ofcompared to the same period of 2006, the amount of rate
electricity purchased by delivery service only customers.stabilization credits provided to residential electric
Quarter Ended Nine Months Endedcustomers substantially decreased and thereby increasedSeptember 30, September 30,
revenues due to the expiration of the rate stabilization 2007 2006 2007 2006plan which began on July 1, 2006 and ended on May 31, (In millions)2007, partially offset by additional credits given to Actual costs $508.4 $565.5 $1,379.1 $1,108.2residential electric customers in the current quarter who Deferral under rate
stabilization plans (4.5) (174.4) (285.4) (174.4)elected to defer the transition to market rates from June 1,Recovery under rate2007 until January 1, 2008.
stabilization plans 18.7 — 24.0 —During the nine months ended September 30, 2007Electricity purchased forcompared to the same period of 2006, the amount of rate
resale $522.6 $391.1 $1,117.7 $ 933.8stabilization credits provided to residential electriccustomers increased and thereby reduced revenues asrequired by Senate Bill 1.
43

Actual Costs Taxes Other Than Income TaxesTaxes other than income taxes increased $4.3 million forBGE’s actual costs for electricity purchased for resalethe nine months ended September 30, 2007 indecreased $57.1 million during the quarter endedcomparison with the same period in 2006 primarily dueSeptember 30, 2007 in comparison with the same periodto increased property taxes.in 2006 as a result of lower volumes mostly due to
commercial and industrial customers switching to alternateRegulated Gas Businesssuppliers and lower contract prices to purchase electricityOur regulated gas business is discussed in detail in Item 1.for our residential customers.Business—Gas Business section of our 2006 Annual ReportBGE’s actual costs for electricity purchased for resaleon Form 10-K.increased $270.9 million for the nine months ended
September 30, 2007 compared to the same period ofResults2006 primarily due to higher contract prices to purchase
Quarter Ended Nine Months Endedelectricity for our residential customers following theSeptember 30, September 30,
expiration of contracts that were executed in 2000 as part 2007 2006 2007 2006of the implementation of electric deregulation in (In millions)Maryland, combined with higher volumes. Gas revenues $118.7 $114.6 $ 688.8 $ 678.4
Gas purchased for resaleexpenses (70.6) (66.4) (457.6) (448.6)Deferral under Rate Stabilization Plans
Operations andWe defer the difference between our actual costs of maintenance expenses (38.1) (34.6) (114.3) (105.3)electricity purchased for resale and what we are allowed to Merger-related costs — (0.2) — (1.0)
Depreciation andbill customers under Senate Bill 1. During the quarteramortization (11.6) (11.6) (35.3) (35.0)ended September 30, 2007, we deferred $4.5 million and
Taxes other than incomeduring the nine months ended September 30, 2007, wetaxes (7.9) (7.4) (27.0) (24.9)deferred $285.4 million in electricity purchased for resale
(Loss) income fromexpenses. Since July 1, 2006, we have deferredoperations $ (9.5) $ (5.6) $ 54.6 $ 63.6$607.3 million in electricity purchased for resale expenses.
Net (Loss) Income $ (9.8) $ (7.3) $ 18.2 $ 26.3These deferred expenses, plus carrying charges, areincluded in ‘‘Regulatory Assets (net)’’ in our, and BGE’s, Other Items Included in Operations (after-tax):Consolidated Balance Sheets. Merger-related costs $ — $ (0.2) $ — $ (0.8)
Above amounts include intercompany transactions eliminated in ourRecovery under Rate Stabilization Plans Consolidated Financial Statements. The Information by Operating
Segment section within the Notes to Consolidated Financial StatementsIn late June 2007, we began recovering previously deferredon page 16 provides a reconciliation of operating results by segment toamounts from customers. We recovered $18.7 millionour Consolidated Financial Statements.during the quarter ended September 30, 2007 and
$24.0 million during the nine months ended The net loss from the regulated gas businessSeptember 30, 2007 in deferred electricity purchased for increased $2.5 million during the quarter endedresale expenses. As discussed in Available Sources of September 30, 2007 compared to the same period ofFunding section on page 50, these collections secure the 2006 mostly due to increased operations and maintenancepayment of principal and interest and other ongoing costs expenses of $2.2 million after-tax.associated with rate stabilization bonds issued by a Net income from the regulated gas business decreasedsubsidiary of BGE in June 2007. $8.1 million during the nine months ended
September 30, 2007 compared to the same period ofElectric Operations and Maintenance Expenses 2006 primarily due to increased operations andRegulated operations and maintenance expenses increased maintenance expenses of $5.5 million after-tax.$7.4 million in the quarter ended September 30, 2007and $16.0 million in the nine months endedSeptember 30, 2007 compared to the same periods in2006 mostly due to higher labor and benefit costs and theimpact of inflation on other costs.
44

Gas Revenues Revenue DecouplingThe changes in gas revenues in 2007 compared to 2006 The Maryland PSC allows us to record a monthlywere caused by: adjustment to our gas distribution revenues to eliminate
Quarter Ended Nine Months Ended the effect of abnormal weather patterns on our gasSeptember 30, September 30, distribution volumes. This means our monthly gas base2007 vs. 2006 2007 vs. 2006
rate revenues are based on weather that is considered(In millions)‘‘normal’’ for the month and, therefore, are not affected byDistribution volumes $ 0.5 $ 15.6actual weather conditions.Revenue decoupling (0.1) (16.5)
Gas cost adjustments 0.1 33.1Gas Cost AdjustmentsTotal change in gas
revenues from gas We charge our gas customers for the natural gas theysystem sales 0.5 32.2 purchase from us using gas cost adjustment clauses set by
Off-system sales 3.2 (21.3) the Maryland PSC as described in Note 1 of our 2006Other 0.4 (0.5) Annual Report on Form 10-K.Total change in gas Gas cost adjustment revenues increased $33.1 million
revenues $ 4.1 $ 10.4 during the nine months ended September 30, 2007compared to the same period of 2006 because we soldmore gas, partially offset by lower prices.Distribution Volumes
The percentage changes in our distribution volumes, by Off-System Gas Salestype of customer, in 2007 compared to 2006 were:
Off-system gas sales are low-margin direct sales of gas toQuarter Ended Nine Months Ended wholesale suppliers of natural gas. Off-system gas sales,September 30, September 30,2007 vs. 2006 2007 vs. 2006 which occur after we have satisfied our customers’
demand, are not subject to gas cost adjustments. TheResidential (2.6)% 18.7%Maryland PSC approved an arrangement for part of theCommercial 14.8 18.2margin from off-system sales to benefit customersIndustrial (7.5) (17.0)(through reduced costs) and the remainder to be retainedby BGE (which benefits shareholders). Changes inDuring the quarter ended September 30, 2007off-system sales do not significantly impact earnings.compared to the same period in 2006, we distributed less
Revenues from off-system gas sales increased duringgas to residential customers due to decreased usage perthe quarter ended September 30, 2007 compared to thecustomer, partially offset by an increased number ofsame period of 2006 because we sold more gas, partiallycustomers. We distributed more gas to commercialoffset by lower prices.customers compared to the same period of 2006 mostly
Revenues from off-system gas sales decreased duringdue to increased usage per customer and an increasedthe nine months ended September 30, 2007 compared tonumber of customers. We distributed less gas to industrialthe same period of 2006 because we sold less gas at lowercustomers mostly due to decreased usage per customer.prices.During the nine months ended September 30, 2007
compared to the same period in 2006, we distributedmore gas to residential customers due to colder weather, Gas Purchased For Resale Expensesincreased usage per customer and an increased number of Gas purchased for resale expenses include the cost of gascustomers. We distributed more gas to commercial purchased for resale to our customers and for off-systemcustomers due to an increased number of customers and sales. These costs do not include the cost of gas purchasedcolder weather, partially offset by decreased usage per by delivery service only customers.customer. We distributed less gas to industrial customers Gas costs increased $4.2 million during the quartermostly due to decreased usage per customer. and $9.0 million during the nine months ended
September 30, 2007 compared to the same periods of2006 because we purchased more gas, partially offset bylower prices.
45

Gas Operations and Maintenance Expenses Net income decreased during the quarter endedRegulated operations and maintenance expenses increased September 30, 2007 compared to the same period of$3.5 million in the quarter and $9.0 million in the nine 2006, mostly due to increased depreciation andmonths ended September 30, 2007 compared to the same amortization.periods in 2006 mostly due to increased maintenance As previously discussed in our 2006 Annual Reportrequirements, higher labor and benefit costs and the on Form 10-K, we decided to sell certain non-core assetsimpact of inflation on other costs. and accelerate the exit strategies on other assets that we
will continue to hold and own over the next several years.While our intent is to dispose of these assets, marketGas Taxes Other Than Income Taxesconditions and other events beyond our control may affectGas taxes other than income taxes increased $2.1 millionthe actual sale of these assets. In addition, a future declinein the nine month period ended September 30, 2007in the fair value of these assets could result in additionalcompared to the same period in 2006 primarily due tolosses.increased property taxes.
Consolidated Nonoperating Income andOther Nonregulated BusinessesExpensesResultsGains on Sale of CEP LLC EquityQuarter Ended Nine Months Ended
September 30, September 30, In the second and third quarters of 2007, CEP sold2007 2006 2007 2006
additional equity. As a result of these sales of equity by(In millions)
CEP, we recognized pre-tax gains totaling $39.2 millionRevenues $ 55.0 $ 45.5 $ 174.5 $ 169.3
during the quarter ended September 30, 2007 andOperating expense (41.4) (31.3) (114.5) (126.6)$52.1 million during the nine months endedMerger-related costs — (0.1) — (0.3)September 30, 2007. We discuss the additional equityDepreciation and
amortization (13.0) (10.6) (40.0) (28.5) offerings in the Notes to Consolidated Financial StatementsTaxes other than income on page 13.
taxes (0.6) (0.2) (1.9) (1.4)
Income from Operations $ — $ 3.3 $ 18.1 $ 12.5 Other IncomeOther income increased during the quarter and nine(Loss) income frommonths ended September 30, 2007 compared to the samecontinuing operationsperiods of 2006, mostly due to higher interest and(after-tax) $ (0.3) $ 4.1 $ 9.9 $ 7.9
Income from investment income due to a higher cash balance.discontinued Total other income at BGE increased during theoperations (after-tax) — — — 0.9 quarter and nine months ended September 30, 2007
compared to the same periods of 2006, primarily due toNet (Loss) Income $ (0.3) $ 4.1 $ 9.9 $ 8.8carrying charges related to rate stabilization credits. WeOther Items Included in Operations (after-tax):discuss the rate stabilization credits in more detail in theMerger-related costs $ — $ — $ — $ (0.2)Regulated Electric section on page 43.
Above amounts include intercompany transactions eliminated in ourConsolidated Financial Statements. The Information by OperatingSegment section within the Notes to Consolidated Financial Statementson page 16 provides a reconciliation of operating results by segment toour Consolidated Financial Statements.
46

Fixed Charges Income TaxesFixed charges decreased during the quarter and nine Our income taxes increased $13.1 million during themonths ended September 30, 2007 compared to the same quarter ended September 30, 2007 compared to the sameperiods of 2006, mostly due to a lower level of debt period of 2006 mostly because of a $31.3 million decreaseoutstanding. in synthetic fuel tax credits partially offset by a decrease in
Fixed charges at BGE increased during the quarter taxable income. We discuss synthetic fuel tax credits inand nine months ended September 30, 2007 compared to more detail in the Notes to Consolidated Financialthe same periods of 2006 mostly due to interest expense Statements on page 18.recognized on debt that was issued in October 2006 and Our income taxes increased $27.8 million during thethe rate stabilization bonds issued during the second nine months ended September 30, 2007 compared to thequarter of 2007. same period of 2006 mostly because of an increase in
pre-tax income. This was partially offset by an increase insynthetic fuel tax credits of $8.4 million.
Income taxes at BGE decreased during the quarterand nine months ended September 30, 2007 compared tothe same periods of 2006 primarily due to a decrease inpre-tax income.
47

Financial ConditionCash FlowsThe following table summarizes our cash flows for 2007 and 2006, excluding the impact of changes in intercompanybalances.
Consolidated2007 Segment Cash Flows Cash Flows
Nine Months Ended Nine Months EndedSeptember 30, 2007 September 30,
Merchant Regulated Other 2007 2006
(In millions)Operating Activities
Net income $ 449.4 $ 104.1 $ 9.9 $ 563.4 $ 531.5Non-cash adjustments to net income 213.5 18.2 17.0 248.7 370.6Changes in working capital (59.9) (101.0) 18.9 (142.0) (762.5)Defined benefit obligations* — — — (48.0) 33.1Other (9.6) (25.5) 29.7 (5.4) (9.6)
Net cash provided by (used in) operating activities 593.4 (4.2) 75.5 616.7 163.1
Investing ActivitiesInvestments in property, plant and equipment (612.3) (264.1) (43.9) (920.3) (668.0)Acquisitions, net of cash acquired (344.1) — — (344.1) (133.5)Contributions to nuclear decommissioning trust funds (8.8) — — (8.8) (8.8)Sales of investments and other assets 4.0 — 1.6 5.6 43.5Contract and portfolio acquisitions (474.2) — — (474.2) (2.3)Issuances of loans receivable (19.0) — — (19.0) (65.4)Other (43.0) (21.1) (1.3) (65.4) 33.8
Net cash used in investing activities (1,497.4) (285.2) (43.6) (1,826.2) (800.7)
Cash flows from operating activities less cash flows from investing activities $ (904.0) $(289.4) $ 31.9 (1,209.5) (637.6)
Financing Activities*Net (repayment) issuance of debt (93.0) 20.5Proceeds from issuance of common stock 47.7 56.2Common stock dividends paid (226.8) (195.7)Reacquisition of common stock (114.4) —Proceeds from contract and portfolio acquisitions 847.8 221.3Other 10.8 43.0
Net cash provided by financing activities 472.1 145.3
Net Decrease in Cash and Cash Equivalents $ (737.4) $(492.3)
*Items are not allocated to the business segments because they are managed for the company as a whole.Certain prior-period amounts have been reclassified to conform to the current period presentation.
Cash Flows from Operating Activities Changes in working capital had a negative impact ofCash provided by operating activities was $616.7 million $142.0 million on cash flow from operations in 2007in 2007 compared to $163.1 million in 2006. This compared to a negative impact of $762.5 million in 2006.$453.6 million increase was primarily due to favorable The net increase of $620.5 million was primarily due tochanges in working capital, offset in part by a decrease in cash changes related to our collateral positions, which isnon-cash adjustments to net income in 2007. impacted by commodity price volatility and the level of
risk management and trading activities. During the ninemonths ended September 30, 2007, we receivedapproximately $110 million in cash due to a decrease incollateral requirements, compared to the same period of2006, when we posted cash collateral of approximately$627 million.
48

Non-cash adjustments to net income decreased Contract and Portfolio Acquisitions$121.9 million in 2007 compared to 2006 primarily due During 2007 and 2006 our merchant energy businessto a change in deferred fuel costs of $84.0 million related acquired pre-existing power-related agreements, whichmostly to higher deferrals of electricity purchased for resale generated significant cash flows at the inception of theunder the BGE rate stabilization plan. We discuss the rate agreements. These agreements had contract prices thatstabilization plan in more detail in the Item 1.-Business- differed from market prices at closing, which resulted inElectric Regulatory Matters and Competition section of our cash payments from the counterparty at the acquisition of2006 Annual Report on Form 10-K. the contracts.
We received net cash of $373.6 million during thenine months ended September 30, 2007 andCash Flows from Investing Activities$219.0 million during the same period of 2006 forCash used in investing activities was $1,826.2 million invarious contract and portfolio acquisitions. We reflect the2007 compared to $800.7 million in 2006. Theunderlying contracts on a gross basis as assets or liabilities$1,025.5 million increase in cash used in 2007 comparedin our Consolidated Balance Sheets depending on whetherto 2006 was primarily due to the following:they were in-the-money or out-of-the-money at closing;♦ a $471.9 million increase in contract andtherefore, we have also reflected them on a gross basis inportfolio acquisitions that we discuss in morecash flows from investing and financing activities in ourdetail below,Consolidated Statements of Cash Flows as follows:♦ a $252.3 million increase in investments in
property, plant and equipment, which includesNine Months Ended September 30, 2007 2006spending related to environmental controls at our
(In millions)generating facilities, andFinancing activities—proceeds from♦ a $210.6 million increase in acquisitions,
contract and portfolio acquisitions $ 847.8 $ 221.3primarily related to our acquisitions of workingInvesting activities—contract and
interests in gas and oil producing properties and portfolio acquisitions (474.2) (2.3)Cornerstone Energy as discussed in more detail in
Cash flows from contract and portfoliothe Notes to Consolidated Financial Statements acquisitions $ 373.6 $ 219.0beginning on page 13.
We record the proceeds we receive to acquire energyCash Flows from Financing Activities purchase and sale agreements as a financing cash inflowCash provided by financing activities was $472.1 million because it constitutes a prepayment for a portion of thein 2007 compared to $145.3 million in 2006. The market price of energy, which we will buy or sell over theincrease of $326.8 million was primarily due to an term of the agreements and does not represent a cashincrease in gross proceeds from contract and portfolio inflow from current period operating activities. For thoseacquisitions of $626.5 million, which we discuss below. acquired contracts that are derivatives, we record theThis was partially offset by cash used for reacquisition of ongoing cash flows related to the contract with thecommon stock of $114.4 million, a net decrease in cash counterparties as financing cash flows in accordance withrelated to changes in short-term borrowings and long-term SFAS No. 149, Amendment of Statement 133 on Derivativedebt of $113.5 million, and a $31.1 million increase in Instruments and Hedging Activities. For those acquiredour dividends paid in 2007 compared to 2006. contracts that are not derivatives, we record the ongoing
In October 2007, our board of directors approved a cash flows related to the contract as operating cash flows.common share repurchase program for up to $1 billion ofour outstanding common shares. Subsequent to this Security Ratingsapproval, on October 31, 2007, we entered into an In June 2007, in connection with BondCo’s issuance ofaccelerated share repurchase agreement with a financial rate stabilization bonds, the rating agencies took theinstitution, and on November 2, 2007 we purchased following actions:2,023,527 of outstanding shares of our common stock for ♦ Standard and Poor’s Rating Group and Fitch$250 million. We discuss the share repurchase program in Ratings issued AAA ratings for the bonds, andmore detail in the Notes to Consolidated Financial ♦ Moody’s Investors Service issued an Aaa rating forStatements on page 15. the bonds.
We discuss the issuance of the rate stabilizationbonds in more detail in the section on the next page.
49
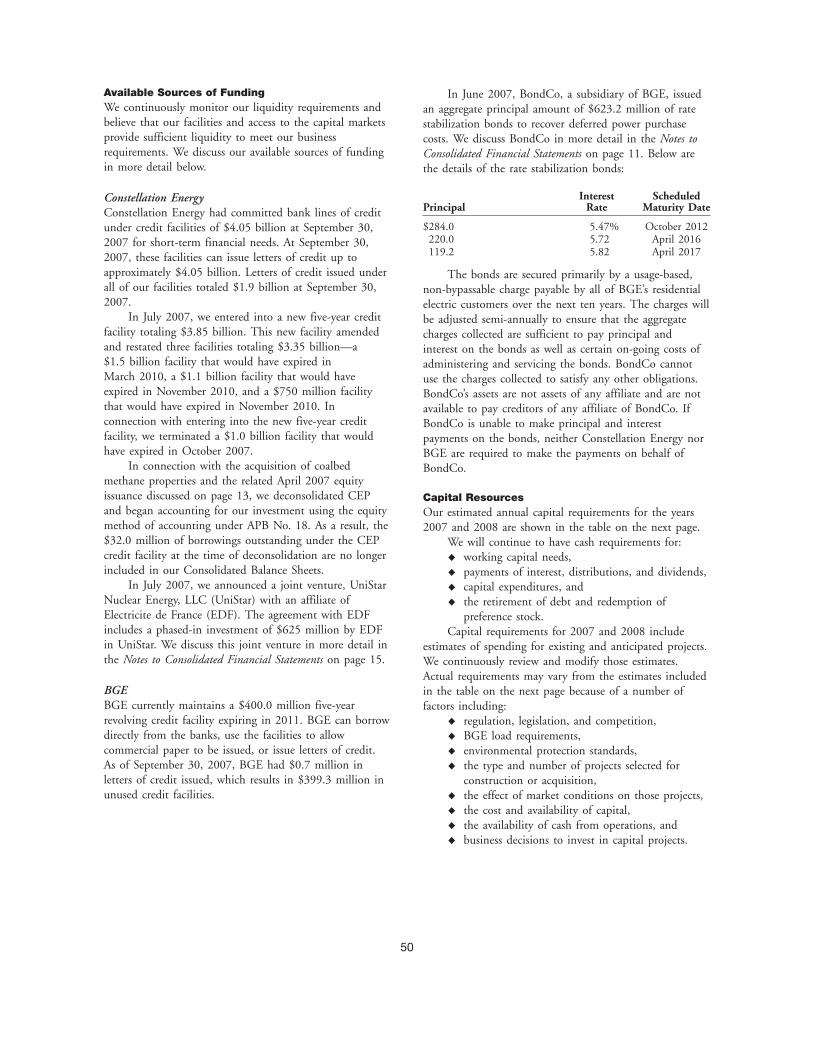
Available Sources of Funding In June 2007, BondCo, a subsidiary of BGE, issuedWe continuously monitor our liquidity requirements and an aggregate principal amount of $623.2 million of ratebelieve that our facilities and access to the capital markets stabilization bonds to recover deferred power purchaseprovide sufficient liquidity to meet our business costs. We discuss BondCo in more detail in the Notes torequirements. We discuss our available sources of funding Consolidated Financial Statements on page 11. Below arein more detail below. the details of the rate stabilization bonds:
Interest ScheduledConstellation EnergyPrincipal Rate Maturity DateConstellation Energy had committed bank lines of credit$284.0 5.47% October 2012under credit facilities of $4.05 billion at September 30,220.0 5.72 April 20162007 for short-term financial needs. At September 30,119.2 5.82 April 20172007, these facilities can issue letters of credit up to
approximately $4.05 billion. Letters of credit issued under The bonds are secured primarily by a usage-based,all of our facilities totaled $1.9 billion at September 30, non-bypassable charge payable by all of BGE’s residential2007. electric customers over the next ten years. The charges will
In July 2007, we entered into a new five-year credit be adjusted semi-annually to ensure that the aggregatefacility totaling $3.85 billion. This new facility amended charges collected are sufficient to pay principal andand restated three facilities totaling $3.35 billion—a interest on the bonds as well as certain on-going costs of$1.5 billion facility that would have expired in administering and servicing the bonds. BondCo cannotMarch 2010, a $1.1 billion facility that would have use the charges collected to satisfy any other obligations.expired in November 2010, and a $750 million facility BondCo’s assets are not assets of any affiliate and are notthat would have expired in November 2010. In available to pay creditors of any affiliate of BondCo. Ifconnection with entering into the new five-year credit BondCo is unable to make principal and interestfacility, we terminated a $1.0 billion facility that would payments on the bonds, neither Constellation Energy norhave expired in October 2007. BGE are required to make the payments on behalf of
In connection with the acquisition of coalbed BondCo.methane properties and the related April 2007 equityissuance discussed on page 13, we deconsolidated CEP Capital Resourcesand began accounting for our investment using the equity Our estimated annual capital requirements for the yearsmethod of accounting under APB No. 18. As a result, the 2007 and 2008 are shown in the table on the next page.$32.0 million of borrowings outstanding under the CEP We will continue to have cash requirements for:credit facility at the time of deconsolidation are no longer ♦ working capital needs,included in our Consolidated Balance Sheets. ♦ payments of interest, distributions, and dividends,
In July 2007, we announced a joint venture, UniStar ♦ capital expenditures, andNuclear Energy, LLC (UniStar) with an affiliate of ♦ the retirement of debt and redemption ofElectricite de France (EDF). The agreement with EDF preference stock.includes a phased-in investment of $625 million by EDF Capital requirements for 2007 and 2008 includein UniStar. We discuss this joint venture in more detail in estimates of spending for existing and anticipated projects.the Notes to Consolidated Financial Statements on page 15. We continuously review and modify those estimates.
Actual requirements may vary from the estimates includedBGE in the table on the next page because of a number ofBGE currently maintains a $400.0 million five-year factors including:revolving credit facility expiring in 2011. BGE can borrow ♦ regulation, legislation, and competition,directly from the banks, use the facilities to allow ♦ BGE load requirements,commercial paper to be issued, or issue letters of credit. ♦ environmental protection standards,As of September 30, 2007, BGE had $0.7 million in ♦ the type and number of projects selected forletters of credit issued, which results in $399.3 million in construction or acquisition,unused credit facilities. ♦ the effect of market conditions on those projects,
♦ the cost and availability of capital,♦ the availability of cash from operations, and♦ business decisions to invest in capital projects.
50

Contractual Payment Obligations andOur estimates are also subject to additional factors.Committed AmountsPlease see the Forward Looking Statements section onWe enter into various agreements that result in contractualpage 57 and Item 1A. Risk Factors section on page 56. Wepayment obligations in connection with our businessdiscuss the potential impact of environmental legislationactivities. These obligations primarily relate to ourand regulation in more detail in Business Environmentfinancing arrangements (such as long-term debt, preferencesection beginning on page 26 and Item 1. Business—stock, and operating leases), purchases of capacity andEnvironmental Matters section of our 2006 Annual Reportenergy to support the growth in our merchant energyon Form 10-K.business activities, and purchases of fuel andtransportation to satisfy the fuel requirements of ourCalendar Year Estimates 2007 2008power generating facilities.(In millions)
We detail our contractual payment obligations atNonregulated Capital Requirements:Merchant energy September 30, 2007 in the following table:
Generation plants $ 195 $ 375Nuclear fuel 150 210Environmental controls 170 540 PaymentsPortfolio acquisitions/investments 550 195 2008- 2010- There-Technology/other 190 110 2007 2009 2011 after Total
(In millions)Total merchant energy capitalContractual Paymentrequirements 1,255 1,430
ObligationsOther nonregulated capital Long-term debt:1requirements 25 10 Nonregulated
Principal $ 5.1 $ 507.8 $ 50.7 $2,214.4 $ 2,778.0Total nonregulated capital requirements 1,280 1,440 Interest 43.7 327.0 277.1 1,272.0 1,919.8
Regulated Capital Requirements: Total 48.8 834.8 327.8 3,486.4 4,697.8BGERegulated electric 370 445
Principal — 415.0 138.3 1,661.8 2,215.1Regulated gas 60 80Interest 24.3 239.1 208.8 1,480.0 1,952.2
Total regulated capital requirements 430 525 Total 24.3 654.1 347.1 3,141.8 4,167.3BGE preference stock — — — 190.0 190.0Total capital requirements $ 1,710 $1,965 Operating leases2 125.8 659.1 400.5 829.6 2,015.0Purchase obligations:3
Purchased capacityand energy4 91.8 744.3 268.6 374.0 1,478.7Capital Requirements
Fuel andMerchant Energy Business transportation 1,125.6 2,674.5 812.3 1,166.5 5,778.9Other 186.8 93.7 7.8 28.1 316.4Our merchant energy business’ capital requirements consist
Other noncurrentof its continuing requirements, including expenditures for: liabilities:Pension benefits5 2.0 74.7 134.3 65.3 276.3♦ improvements to generating plants,Postretirement and♦ nuclear fuel costs, postemployment
benefits6 8.3 90.5 108.5 305.7 513.0♦ upstream gas investments,Total contractual♦ portfolio acquisitions and other investments,
payment obligations $1,613.4 $5,825.7 $2,406.9 $9,587.4 $19,433.4♦ costs of complying with the EPA, Maryland, and1 Amounts in long-term debt reflect the original maturity date. Investors mayPennsylvania environmental regulations and
require us to repay $274.8 million early through put options andlegislation, and remarketing features. Interest on variable rate debt is included based on the
September 30, 2007 forward curve for interest rates.♦ enhancements to our information technology2 Our operating lease commitments include future payment obligations underinfrastructure. certain power purchase agreements as discussed further in Note 11 of our
2006 Annual Report on Form 10-K.3 Contracts to purchase goods or services that specify all significant terms.Regulated Electric and Gas
Amounts related to certain purchase obligations are based on futureRegulated electric and gas construction expenditures purchase expectations which may differ from actual purchases.
4 Our contractual obligations for purchased capacity and energy are shown onprimarily include new business construction needs anda gross basis for certain transactions, including both the fixed paymentimprovements to existing facilities, including projects to portions of tolling contracts and estimated variable payments underunit-contingent power purchase agreements.improve reliability and support demand response and
5 Amounts related to pension benefits reflect our current 5-year forecast ofconservation initiatives.contributions for our qualified pension plans and participant payments forour nonqualified pension plans. Refer to Note 7 of our 2006 AnnualReport on Form 10-K for more detail on our pension plans.Funding for Capital Requirements
6 Amounts related to postretirement and postemployment benefits are forWe discuss our funding for capital requirements in our unfunded plans and reflect present value amounts consistent with the2006 Annual Report on Form 10-K. determination of the related liabilities recorded in our Consolidated Balance
Sheets.
51

Liquidity Provisions The credit agreement of BGE contains a provisionIn many cases, customers of our wholesale marketing, risk requiring BGE to maintain a ratio of debt tomanagement, and trading operation rely on the capitalization equal to or less than 65%. At September 30,creditworthiness of Constellation Energy. A decline below 2007, the debt to capitalization ratio for BGE as definedinvestment grade by Constellation Energy would in these credit agreements was 45%.negatively impact the business prospects of that operation.
We regularly review our liquidity needs to ensure that Off-Balance Sheet Arrangementswe have adequate facilities available to meet collateral We discuss our off-balance sheet arrangements in ourrequirements. This includes having liquidity available to 2006 Annual Report on Form 10-K.meet margin requirements for our competitive supply At September 30, 2007, Constellation Energy had aoperations. total of $13,932.0 million in guarantees outstanding, of
We have certain agreements that contain provisions which $12,737.3 million related to our competitive supplythat would require additional collateral upon significant activities. These amounts do not represent incrementalcredit rating decreases in senior unsecured debt of consolidated Constellation Energy obligations; rather, theyConstellation Energy. Decreases in Constellation Energy’s primarily represent parental guarantees of certaincredit ratings would not trigger an early payment on any subsidiary obligations to third parties. These guaranteesof our credit facilities. are put into place in order to allow our subsidiaries the
Under counterparty contracts related to our wholesale flexibility needed to conduct business with counterpartiesmarketing, risk management, and trading operation, we without having to post other forms of collateral. Whileare obligated to post collateral if Constellation Energy’s the stated limit of these guarantees is $12,737.3 million,senior unsecured credit ratings declined below established our calculated fair value of obligations for commercialcontractual levels. Based on contractual provisions at transactions covered by these guarantees wasSeptember 30, 2007, we estimate that if Constellation $3,133.1 million at September 30, 2007. TheEnergy’s senior unsecured debt were downgraded we $3,133.1 million represents the total amount Constellationwould have the following additional collateral obligations: Energy could be required to fund based on market prices
as of September 30, 2007, if the subsidiaries do not honorLevelcontractual commitments covered by these guarantees. ForBelow
Credit Ratings Current Incremental Cumulative those guarantees related to our mark-to-market energy orDowngraded to Rating Obligations Obligations risk management liabilities, the fair value of the obligation
(In millions) is recorded in our Consolidated Balance Sheets. WeBBB/Baa2 1 $106 $106
believe it is unlikely that we would be required to performBBB-/Baa3 2 228 334or incur any losses associated with guarantees of ourBelow investment grade 3 634 968subsidiaries’ obligations.
Based on market conditions and contractual We discuss our other guarantees in the Notes toobligations at the time of a downgrade, we could be Consolidated Financial Statements on page 19.required to post collateral in an amount that could exceedthe amounts specified above, which could be material. We Market Riskdiscuss our credit ratings in the Security Ratings section of Commodity Riskour 2006 Annual Report on Form 10-K and our credit We measure the sensitivity of our wholesale marketing,facilities in the Available Sources of Funding section on risk management, and trading mark-to-market energypage 50. contracts to potential changes in market prices using value
Certain credit facilities of Constellation Energy at risk. Value at risk represents the potential pre-tax loss incontain a provision requiring Constellation Energy to the fair value of our wholesale marketing, riskmaintain a ratio of debt to capitalization equal to or less management, and trading mark-to-market energy assetsthan 65%. At September 30, 2007, the debt to and liabilities over one and ten-day holding periods. Wecapitalization ratio as defined in the credit agreements was discuss value at risk in more detail in the Market Risk45%. The failure by Constellation Energy to comply with section of our 2006 Annual Report on Form 10-K.these provisions could result in the acceleration of the The table on the next page is the value at riskmaturity of the debt outstanding under these facilities, associated with our wholesale marketing, risk management,which is primarily letters of credit issued in support of our and trading operation’s mark-to-market energy assets andcompetitive supply operations. We detail our letters of liabilities, including both trading and non-tradingcredit in the Available Sources of Funding section on activities.page 50. We discuss our mark-to-market results in more detail
in the Competitive Supply section beginning on page 34.
52

Wholesale Credit RiskQuarter EndedSeptember 30, 2007 We actively monitor the credit portfolio of our wholesale
marketing, risk management, and trading operation to(In millions)attempt to reduce the impact of counterparty default. As99% Confidence Level,
One-Day Holding Period of September 30, 2007 and December 31, 2006, theAverage $19.3 credit portfolio of our wholesale marketing, riskHigh 26.8 management, and trading operation had the following
95% Confidence Level, One-Day public credit ratings:Holding Period
Average 14.7 December 31,September 30,High 20.4 2007 2006
95% Confidence Level, Ten-DayRatingHolding Period
Investment Grade1 46% 61%Average 46.5 Non-Investment Grade 8 3High 64.6 Not Rated 46 36
1 Includes counterparties with an investment grade rating by atThe following table details our value at risk for the least one of the major credit rating agencies. If split rating exists,trading portion of our wholesale marketing, risk the lower rating is used.management, and trading mark-to-market energy assets
We utilize internal credit ratings to evaluate theand liabilities over a one-day holding period at a 99%
creditworthiness of our wholesale customers, includingconfidence level for the third quarter of 2007:
those companies that do not have public credit ratings.Quarter Ended The ‘‘Not Rated’’ category in the table above includes
September 30, 2007counterparties that do not have public credit ratings and
(In millions) include governmental entities, municipalities, cooperatives,Average $12.7 power pools, and other load-serving entities, andHigh 15.8
marketers for which we determine creditworthiness basedDue to the inherent limitations of statistical measures on internal credit ratings.
such as value at risk and the seasonality of changes in The following table provides the breakdown of themarket prices, the value at risk calculation may not reflect credit quality of our wholesale credit portfolio based onthe full extent of our commodity price risk exposure. our internal credit ratings.Additionally, actual changes in the value of options may December 31,September 30,differ from the value at risk calculated using a linear 2007 2006approximation inherent in our calculation method. As a
Investment Graderesult, actual changes in the fair value of mark-to-market Equivalent 66% 82%energy assets and liabilities could differ from the calculated Non-Investment Grade 34 18value at risk, and such changes could have a material
The credit quality of our wholesale credit portfolioimpact on our financial results.declined during the first nine months of 2007 as a resultof the downgrade of Illinois utilities resulting frompolitical and regulatory issues surrounding rate increasesand our growing exposure to international freight and coalcounterparties.
A portion of our wholesale credit risk is related totransactions that are recorded in our Consolidated BalanceSheets. These transactions primarily consist of openpositions from our wholesale marketing, risk management,and trading operation that are accounted for usingmark-to-market accounting, as well as amounts owed bywholesale counterparties for transactions that settled buthave not yet been paid. The table on the next pagehighlights the credit quality and exposures related to theseactivities at September 30, 2007:
53

Number of Net Exposure ofTotal Exposure Counterparties Greater Counterparties GreaterBefore Credit Credit Net than 10% of Net than 10% of Net
Rating Collateral Collateral Exposure Exposure Exposure
(Dollars in millions)Investment grade $1,376 $291 $1,085 — $ —Split rating 52 — 52 — —Non-investment grade 75 30 45 — —Internally rated—investment grade 315 36 279 — —Internally rated—non-investment grade 236 15 221 — —
Total $2,054 $372 $1,682 — $ —
Due to the possibility of extreme volatility in the We continue to examine plans to achieve ourprices of energy commodities and derivatives, the market strategies and to further strengthen our balance sheet andvalue of contractual positions with individual enhance our liquidity. We discuss our liquidity in thecounterparties could exceed established credit limits or Financial Condition section on page 52.collateral provided by those counterparties. If such a
Interest Rate Risk, Retail Credit Risk, Foreigncounterparty were then to fail to perform its obligationsCurrency Risk, and Equity Price Riskunder its contract (for example, fail to deliver theWe discuss our exposure to interest rate risk, retail creditelectricity our wholesale marketing, risk management, andrisk, foreign currency risk, and equity price risk in thetrading operation had contracted for), we could incur aMarket Risk section of our 2006 Annual Report onloss that could have a material impact on our financialForm 10-K.results.
Additionally, if a counterparty were to default and wewere to liquidate all contracts with that entity, our creditloss would include the loss in value of mark-to-marketcontracts, the amount owed for settled transactions, andadditional payments, if any, we would have to make tosettle unrealized losses on accrual contracts.
54

Item 3. Quantitative and Qualitative Disclosures About Market Risk
We discuss the following information related to our ♦ evaluation of commodity and credit risk in themarket risk: Market Risk section of Management’s Discussion
♦ SFAS No. 133 hedging activities in the Notes to and Analysis beginning on page 52, andConsolidated Financial Statements beginning on ♦ changes to our business environment in thepage 22, Business Environment section of Management’s
♦ activities of our wholesale marketing, risk Discussion and Analysis beginning on page 26.management, and trading operation in theMerchant Energy Business section of Management’sDiscussion and Analysis beginning on page 31,
Item 4. Controls and Procedures
A control system, no matter how well conceived and Evaluation of Disclosure Controls and Proceduresoperated, can provide only reasonable, not absolute, The principal executive officers and principal financialassurance that the objectives of the control system are met. officer of both Constellation Energy and BGE haveBecause of the inherent limitations in all control systems, evaluated the effectiveness of the disclosure controls andno evaluation of controls can provide absolute assurance procedures (as such term is defined in Rules 13a-15(e)that all control issues and instances of fraud, if any, within and 15d-15(e) under the Securities Exchange Act of 1934,Constellation Energy or BGE have been detected. These as amended (the ‘‘Exchange Act’’)) as of the end of theinherent limitations include errors by personnel in fiscal quarter covered by this quarterly report (theexecuting controls due to faulty judgment or simple ‘‘Evaluation Date’’). Based on such evaluation, suchmistakes, which could occur in situations such as when officers have concluded that, as of the Evaluation Date,personnel performing controls are new to a job function Constellation Energy’s and BGE’s disclosure controls andor when inadequate resources are applied to a process. procedures are effective.Additionally, controls can be circumvented by theindividual acts of some persons or by collusion of two or Changes in Internal Control over Financial Reportingmore people. During the quarter ended September 30, 2007, there has
The design of any system of controls also is based in been no change in either Constellation Energy’s or BGE’spart upon certain assumptions about the likelihood of internal control over financial reporting (as such term isfuture events, and there can be no absolute assurance that defined in Rules 13a-15(f ) and 15d-15(f ) under theany design will succeed in achieving its stated goals under Exchange Act) that has materially affected, or is reasonablyall potential future conditions; over time, controls may likely to materially affect, either Constellation Energy’s orbecome inadequate because of changes in conditions or BGE’s internal control over financial reporting.personnel, or the degree of compliance with the policies orprocedures may deteriorate. Because of the inherentlimitations in a cost-effective control system, misstatementsdue to error or fraud may occur and not be detected.
55

PART II. OTHER INFORMATION
Item 1. Legal ProceedingsWe discuss our Legal Proceedings in the Notes to Consolidated Financial Statements beginning on page 21.
Item 1A. Risk FactorsThe risk factors included in our 2006 Annual Report on Form 10-K have not materially changed. You should considercarefully the risks described under Item 1A. Risk Factors in our 2006 Annual Report on Form 10-K. The risks anduncertainties described in our 2006 Annual Report on Form 10-K are not the only ones that may affect us. Additional risksand uncertainties also may adversely affect our business and operations including those discussed in Item 2. Management’sDiscussion and Analysis. If any of the events described actually occur, our business and financial results could be materiallyadversely affected.
Item 2. Unregistered Sales of Equity Securities and Use of ProceedsThe following table presents shares surrendered by employees to satisfy tax withholding obligations on vested restrictedstock. There were no shares repurchased by us in the open market to satisfy employee stock option exercises and restrictedstock grants during the third quarter of 2007.
Total Numberof Shares Maximum Number
Purchased as of Shares thatPart of Publicly May Yet Be
Total Number Announced Purchased Underof Shares Average Price Plans or the Plans and
Period Purchased Paid for Shares Programs Programs
July 1 – July 31, 2007 — $ — — —August 1 – August 31, 2007 406 78.49 — —September 1 – September 30, 2007 794 89.05 — —
Total 1,200 $85.47 — —
56

Item 5. Other Information Energy) and BGE’s ability to maintain theircurrent credit ratings,Forward Looking Statements ♦ the effectiveness of Constellation Energy’s andWe make statements in this report that are consideredBGE’s risk management policies and proceduresforward looking statements within the meaning of theand the ability and willingness of ourSecurities Exchange Act of 1934. Sometimes thesecounterparties to satisfy their financial andstatements will contain words such as ‘‘believes,’’performance commitments,‘‘anticipates,’’ ‘‘expects,’’ ‘‘intends,’’ ‘‘plans,’’ and other ♦ operational factors affecting commercial operationssimilar words. We also disclose non-historical informationof our generating facilities (including nuclearthat represents management’s expectations, which are basedfacilities) and BGE’s transmission and distributionon numerous assumptions. These statements andfacilities, including catastrophic weather-relatedprojections are not guarantees of our future performancedamages, unscheduled outages or repairs,and are subject to risks, uncertainties, and other importantunanticipated changes in fuel costs or availability,factors that could cause our actual performance orunavailability of coal or gas transportation orachievements to be materially different from those weelectric transmission services, workforce issues,project. These risks, uncertainties, and factors include, butterrorism, liabilities associated with catastrophicare not limited to:events, and other events beyond our control,♦ the timing and extent of changes in commodity ♦ the actual outcome of uncertainties associatedprices and volatilities for energy and energywith assumptions and estimates using judgmentrelated products including coal, natural gas, oil,when applying critical accounting policies andelectricity, nuclear fuel, and emission allowances,preparing financial statements, including factors♦ the liquidity and competitiveness of wholesalethat are estimated in determining the fair value ofmarkets for energy commodities,energy contracts, such as the ability to obtain♦ the effect of weather and general economic andmarket prices and, in the absence of verifiablebusiness conditions on energy supply, demand,market prices, the appropriateness of models andand prices,model inputs (including, but not limited to,♦ the ability to attract and retain customers in ourestimated contractual load obligations, unitcompetitive supply activities and to adequatelyavailability, forward commodity prices, interestforecast their energy usage,rates, correlation and volatility factors),♦ the timing and extent of deregulation of, and ♦ changes in accounting principles or practices,competition in, the energy markets, and the rules ♦ losses on the sale or write down of assets due toand regulations adopted in those markets,impairment events or changes in management♦ uncertainties associated with estimating naturalintent with regard to either holding or sellinggas reserves, developing properties, and extractingcertain assets,natural gas, ♦ the ability to successfully identify and complete♦ regulatory or legislative developments that affectacquisitions and sales of businesses and assets, andderegulation, the price of energy, transmission or ♦ cost and other effects of legal and administrativedistribution rates and revenues, demand forproceedings that may not be covered by insurance,energy, or increases in costs, including costsincluding environmental liabilities.related to nuclear power plants, safety, or
Given these uncertainties, you should not placeenvironmental compliance,undue reliance on these forward looking statements. Please♦ the ability of our regulated and nonregulatedsee the other sections of this report and our other periodicbusinesses to comply with complex and/orreports filed with the Securities and Exchangechanging market rules and regulations,Commission for more information on these factors. These♦ the inability of BGE to recover all its costsforward looking statements represent our estimates andassociated with providing customers service,assumptions only as of the date of this report.♦ the conditions of the capital markets, interest
Changes may occur after that date, and neitherrates, foreign exchange rates, availability of creditConstellation Energy nor BGE assume responsibility tofacilities to support business requirements, andupdate these forward looking statements.general economic conditions, as well as
Constellation Energy Group’s (Constellation
57

Item 6. Exhibits
Exhibit No. 10(a) Letter Agreement, dated October 31, 2007, by and between Constellation EnergyGroup, Inc. and J.P. Morgan Securities Inc., as agent for JPMorgan Chase Bank,National Associates, London Branch (Designated as Exhibit 10.1 to the CurrentReport on Form 8-K dated November 1, 2007, File No. 1-12869).
Exhibit No. 12(a) Constellation Energy Group, Inc. Computation of Ratio of Earnings to Fixed Charges.Exhibit No. 12(b) Baltimore Gas and Electric Company Computation of Ratio of Earnings to Fixed
Charges and Computation of Ratio of Earnings to Combined Fixed Charges andPreferred and Preference Dividend Requirements.
Exhibit No. 31(a) Certification of Chairman of the Board, President, and Chief Executive Officer ofConstellation Energy Group, Inc. pursuant to Section 302 of the Sarbanes-Oxley Actof 2002.
Exhibit No. 31(b) Certification of Executive Vice President, Chief Financial Officer, and Chief RiskOfficer of Constellation Energy Group, Inc. pursuant to Section 302 of the Sarbanes-Oxley Act of 2002.
Exhibit No. 31(c) Certification of President and Chief Executive Officer of Baltimore Gas and ElectricCompany pursuant to Section 302 of the Sarbanes-Oxley Act of 2002.
Exhibit No. 31(d) Certification of Senior Vice President and Chief Financial Officer of Baltimore Gasand Electric Company pursuant to Section 302 of the Sarbanes-Oxley Act of 2002.
Exhibit No. 32(a) Certification of Chairman of the Board, President, and Chief Executive Officer ofConstellation Energy Group, Inc. pursuant to 18 U.S.C. Section 1350, as adoptedpursuant to Section 906 of the Sarbanes-Oxley Act of 2002.
Exhibit No. 32(b) Certification of Executive Vice President, Chief Financial Officer, and Chief RiskOfficer of Constellation Energy Group, Inc. pursuant to 18 U.S.C. Section 1350, asadopted pursuant to Section 906 of the Sarbanes-Oxley Act of 2002.
Exhibit No. 32(c) Certification of President and Chief Executive Officer of Baltimore Gas and ElectricCompany pursuant to 18 U.S.C. Section 1350, as adopted pursuant to Section 906 ofthe Sarbanes-Oxley Act of 2002.
Exhibit No. 32(d) Certification of Senior Vice President and Chief Financial Officer of Baltimore Gasand Electric Company pursuant to 18 U.S.C. Section 1350, as adopted pursuant toSection 906 of the Sarbanes-Oxley Act of 2002.
* Incorporated by reference
58

SIGNATURE
Pursuant to the requirements of the Securities Exchange Act of 1934, each registrant has duly caused this report to besigned on its behalf by the undersigned thereunto duly authorized.
CONSTELLATION ENERGY GROUP, INC.
(Registrant)
BALTIMORE GAS AND ELECTRIC COMPANY
(Registrant)
Date: November 8, 2007 /s/ JOHN R. COLLINS
John R. Collins,Executive Vice President of Constellation Energy Group,
Inc. and Senior Vice President of Baltimore Gas andElectric Company, and as Principal Financial Officer of
each Registrant
59

Exhibit 12(a)
CONSTELLATION ENERGY GROUP, INC. AND SUBSIDIARIES
COMPUTATION OF RATIO OF EARNINGS TO FIXED CHARGES
9 Months Ended 12 Months Ended
September December December December December December2007 2006 2005 2004 2003 2002
(In millions)
Income from Continuing Operations(Before Extraordinary Loss and CumulativeEffects of Changes in Accounting Principles) $ 564.3 $ 748.6 $ 535.9 $ 498.4 $ 409.4 $ 515.4
Taxes on Income, Including Tax Effect forBGE Preference Stock Dividends 252.5 343.1 155.4 110.2 213.7 292.6
Adjusted Income $ 816.8 $1,091.7 $ 691.3 $ 608.6 $ 623.1 $ 808.0
Fixed Charges:Interest and Amortization of Debt Discount
and Expense and Premium on allIndebtedness, net of amounts capitalized $ 218.4 $ 315.9 $ 297.6 $ 315.9 $ 325.6 $ 265.9
Earnings Required for BGE Preference StockDividends 15.8 21.1 21.6 21.4 21.7 21.8
Capitalized Interest and Allowance forFunds Used During Construction 13.6 13.7 9.9 9.7 11.7 42.5
Interest Factor in Rentals 3.3 4.5 6.1 4.1 3.5 2.1
Total Fixed Charges $ 251.1 $ 355.2 $ 335.2 $ 351.1 $ 362.5 $ 332.3
Amortization of Capitalized Interest $ 2.7 $ 4.3 $ 3.7 $ 2.8 $ 2.4 $ 1.3
Earnings (1) $1,057.0 $1,437.5 $1,020.3 $ 952.8 $ 976.3 $1,099.1
Ratio of Earnings to Fixed Charges 4.21 4.05 3.04 2.71 2.69 3.31
(1) Earnings are deemed to consist of income from continuing operations (before extraordinary items,cumulative effects of changes in accounting principles, and income (loss) from discontinued operations) thatincludes earnings of Constellation Energy’s consolidated subsidiaries, equity in the net income ofunconsolidated subsidiaries, income taxes (including deferred income taxes, investment tax creditadjustments, and the tax effect of BGE’s preference stock dividends), and fixed charges (including theamortization of capitalized interest but excluding the capitalization of interest).

Exhibit 12(b)
BALTIMORE GAS AND ELECTRIC COMPANY AND SUBSIDIARIES
COMPUTATION OF RATIO OF EARNINGS TO FIXED CHARGES ANDCOMPUTATION OF RATIO OF EARNINGS TO COMBINED FIXED CHARGES AND
PREFERRED AND PREFERENCE DIVIDEND REQUIREMENTS
9 Months Ended 12 Months Ended
September December December December December December2007 2006 2005 2004 2003 2002
(In Millions of Dollars)
Income from Continuing Operations(Before Extraordinary Loss) $113.9 $170.3 $189.0 $166.3 $163.2 $143.1
Taxes on Income 67.7 102.2 119.9 102.5 105.2 93.3
Adjusted Income $181.6 $272.5 $308.9 $268.8 $268.4 $236.4Fixed Charges:
Interest and Amortization of Debt Discountand Expense and Premium on allIndebtedness, net of amounts capitalized $ 92.4 $104.6 $ 95.6 $ 97.3 $112.8 $142.1
Interest Factor in Rentals 0.2 0.3 0.3 0.5 0.7 0.5
Total Fixed Charges $ 92.6 $104.9 $ 95.9 $ 97.8 $113.5 $142.6
Preferred and PreferenceDividend Requirements: (1)Preferred and Preference Dividends $ 9.9 $ 13.2 $ 13.2 $ 13.2 $ 13.2 $ 13.2Income Tax Required 5.9 8.0 8.4 8.1 8.6 8.6
Total Preferred and Preference DividendRequirements $ 15.8 $ 21.2 $ 21.6 $ 21.3 $ 21.8 $ 21.8
Total Fixed Charges and Preferred and PreferenceDividend Requirements $108.4 $126.1 $117.5 $119.1 $135.3 $164.4
Earnings (2) $274.2 $377.4 $404.8 $366.6 $381.9 $379.0
Ratio of Earnings to Fixed Charges 2.96 3.60 4.22 3.75 3.36 2.66Ratio of Earnings to Combined Fixed Charges
and Preferred and Preference DividendRequirements 2.53 2.99 3.45 3.08 2.82 2.31
(1) Preferred and preference dividend requirements consist of an amount equal to the pre-tax earnings thatwould be required to meet dividend requirements on preferred stock and preference stock.
(2) Earnings are deemed to consist of income from continuing operations (before extraordinary items) thatincludes earnings of BGE’s consolidated subsidiaries, income taxes (including deferred income taxes andinvestment tax credit adjustments), and fixed charges other than capitalized interest.

Exhibit 31(a)
CONSTELLATION ENERGY GROUP, INC.
CERTIFICATIONI, Mayo A. Shattuck III, certify that:
1. I have reviewed this report on Form 10-Q of Constellation Energy Group, Inc.;
2. Based on my knowledge, this report does not contain any untrue statement of a material fact or omit to state amaterial fact necessary to make the statements made, in light of the circumstances under which such statementswere made, not misleading with respect to the period covered by this report;
3. Based on my knowledge, the financial statements, and other financial information included in this report, fairlypresent in all material respects the financial condition, results of operations and cash flows of the registrant as of,and for, the periods presented in this report;
4. The registrant’s other certifying officer(s) and I are responsible for establishing and maintaining disclosure controlsand procedures (as defined in Exchange Act Rules 13a-15(e) and 15d-15(e)) and internal control over financialreporting (as defined in Exchange Act Rules 13a-15(f ) and 15d-15(f )) for the registrant and have:
(a) Designed such disclosure controls and procedures, or caused such disclosure controls and procedures to bedesigned under our supervision, to ensure that material information relating to the registrant, including itsconsolidated subsidiaries, is made known to us by others within those entities, particularly during the periodin which this report is being prepared;
(b) Designed such internal control over financial reporting, or caused such internal control over financialreporting to be designed under our supervision, to provide reasonable assurance regarding the reliability offinancial reporting and the preparation of financial statements for external purposes in accordance withgenerally accepted accounting principles;
(c) Evaluated the effectiveness of the registrant’s disclosure controls and procedures and presented in this reportour conclusions about the effectiveness of the disclosure controls and procedures, as of the end of the periodcovered by this report based on such evaluation; and
(d) Disclosed in this report any change in the registrant’s internal control over financial reporting that occurredduring the registrant’s most recent fiscal quarter (the registrant’s fourth quarter in the case of an annualreport) that has materially affected, or is reasonably likely to materially affect, the registrant’s internal controlover financial reporting; and
5. The registrant’s other certifying officer(s) and I have disclosed, based on our most recent evaluation of internalcontrol over financial reporting, to the registrant’s auditors and the audit committee of the registrant’s Board ofDirectors (or persons performing the equivalent functions):
(a) All significant deficiencies and material weaknesses in the design or operation of internal control overfinancial reporting which are reasonably likely to adversely affect the registrant’s ability to record, process,summarize and report financial information; and
(b) Any fraud, whether or not material, that involves management or other employees who have a significantrole in the registrant’s internal control over financial reporting.
Date: November 8, 2007
/s/ MAYO A. SHATTUCK III
Chairman of the Board, President, and Chief Executive Officer

Exhibit 31(b)
CONSTELLATION ENERGY GROUP, INC.
CERTIFICATIONI, John R. Collins, certify that:
1. I have reviewed this report on Form 10-Q of Constellation Energy Group, Inc.;
2. Based on my knowledge, this report does not contain any untrue statement of a material fact or omit to state amaterial fact necessary to make the statements made, in light of the circumstances under which such statementswere made, not misleading with respect to the period covered by this report;
3. Based on my knowledge, the financial statements, and other financial information included in this report, fairlypresent in all material respects the financial condition, results of operations and cash flows of the registrant as of,and for, the periods presented in this report;
4. The registrant’s other certifying officer(s) and I are responsible for establishing and maintaining disclosure controlsand procedures (as defined in Exchange Act Rules 13a-15(e) and 15d-15(e)) and internal control over financialreporting (as defined in Exchange Act Rules 13a-15(f ) and 15d-15(f )) for the registrant and have:
(a) Designed such disclosure controls and procedures, or caused such disclosure controls and procedures to bedesigned under our supervision, to ensure that material information relating to the registrant, including itsconsolidated subsidiaries, is made known to us by others within those entities, particularly during the periodin which this report is being prepared;
(b) Designed such internal control over financial reporting, or caused such internal control over financialreporting to be designed under our supervision, to provide reasonable assurance regarding the reliability offinancial reporting and the preparation of financial statements for external purposes in accordance withgenerally accepted accounting principles;
(c) Evaluated the effectiveness of the registrant’s disclosure controls and procedures and presented in this reportour conclusions about the effectiveness of the disclosure controls and procedures, as of the end of the periodcovered by this report based on such evaluation; and
(d) Disclosed in this report any change in the registrant’s internal control over financial reporting that occurredduring the registrant’s most recent fiscal quarter (the registrant’s fourth quarter in the case of an annualreport) that has materially affected, or is reasonably likely to materially affect, the registrant’s internal controlover financial reporting; and
5. The registrant’s other certifying officer(s) and I have disclosed, based on our most recent evaluation of internalcontrol over financial reporting, to the registrant’s auditors and the audit committee of the registrant’s Board ofDirectors (or persons performing the equivalent functions):
(a) All significant deficiencies and material weaknesses in the design or operation of internal control overfinancial reporting which are reasonably likely to adversely affect the registrant’s ability to record, process,summarize and report financial information; and
(b) Any fraud, whether or not material, that involves management or other employees who have a significantrole in the registrant’s internal control over financial reporting.
Date: November 8, 2007
/s/ JOHN R. COLLINS
Executive Vice President, Chief Financial Officer, andChief Risk Officer

Exhibit 31(c)
BALTIMORE GAS AND ELECTRIC COMPANY
CERTIFICATIONI, Kenneth W. DeFontes, Jr., certify that:
1. I have reviewed this report on Form 10-Q of Baltimore Gas and Electric Company;
2. Based on my knowledge, this report does not contain any untrue statement of a material fact or omit to state amaterial fact necessary to make the statements made, in light of the circumstances under which such statementswere made, not misleading with respect to the period covered by this report;
3. Based on my knowledge, the financial statements, and other financial information included in this report, fairlypresent in all material respects the financial condition, results of operations and cash flows of the registrant as of,and for, the periods presented in this report;
4. The registrant’s other certifying officer(s) and I are responsible for establishing and maintaining disclosure controlsand procedures (as defined in Exchange Act Rules 13a-15(e) and 15d-15(e)) for the registrant and have:
(a) Designed such disclosure controls and procedures, or caused such disclosure controls and procedures to bedesigned under our supervision, to ensure that material information relating to the registrant, including itsconsolidated subsidiaries, is made known to us by others within those entities, particularly during the periodin which this report is being prepared;
(b) Evaluated the effectiveness of the registrant’s disclosure controls and procedures and presented in this reportour conclusions about the effectiveness of the disclosure controls and procedures, as of the end of the periodcovered by this report based on such evaluation; and
(c) Disclosed in this report any change in the registrant’s internal control over financial reporting that occurredduring the registrant’s most recent fiscal quarter (the registrant’s fourth quarter in the case of an annualreport) that has materially affected, or is reasonably likely to materially affect, the registrant’s internal controlover financial reporting; and
5. The registrant’s other certifying officer(s) and I have disclosed, based on our most recent evaluation of internalcontrol over financial reporting, to the registrant’s auditors and the audit committee of the registrant’s Board ofDirectors (or persons performing the equivalent functions):
(a) All significant deficiencies and material weaknesses in the design or operation of internal control overfinancial reporting which are reasonably likely to adversely affect the registrant’s ability to record, process,summarize and report financial information; and
(b) Any fraud, whether or not material, that involves management or other employees who have a significantrole in the registrant’s internal control over financial reporting.
Date: November 8, 2007
/s/ KENNETH W. DEFONTES, JR.
President and Chief Executive Officer

Exhibit 31(d)
BALTIMORE GAS AND ELECTRIC COMPANY
CERTIFICATIONI, John R. Collins, certify that:
1. I have reviewed this report on Form 10-Q of Baltimore Gas and Electric Company;
2. Based on my knowledge, this report does not contain any untrue statement of a material fact or omit to state amaterial fact necessary to make the statements made, in light of the circumstances under which such statementswere made, not misleading with respect to the period covered by this report;
3. Based on my knowledge, the financial statements, and other financial information included in this report, fairlypresent in all material respects the financial condition, results of operations and cash flows of the registrant as of,and for, the periods presented in this report;
4. The registrant’s other certifying officer(s) and I are responsible for establishing and maintaining disclosure controlsand procedures (as defined in Exchange Act Rules 13a-15(e) and 15d-15(e)) for the registrant and have:
(a) Designed such disclosure controls and procedures, or caused such disclosure controls and procedures to bedesigned under our supervision, to ensure that material information relating to the registrant, including itsconsolidated subsidiaries, is made known to us by others within those entities, particularly during the periodin which this report is being prepared;
(b) Evaluated the effectiveness of the registrant’s disclosure controls and procedures and presented in this reportour conclusions about the effectiveness of the disclosure controls and procedures, as of the end of the periodcovered by this report based on such evaluation; and
(c) Disclosed in this report any change in the registrant’s internal control over financial reporting that occurredduring the registrant’s most recent fiscal quarter (the registrant’s fourth quarter in the case of an annualreport) that has materially affected, or is reasonably likely to materially affect, the registrant’s internal controlover financial reporting; and
5. The registrant’s other certifying officer(s) and I have disclosed, based on our most recent evaluation of internalcontrol over financial reporting, to the registrant’s auditors and the audit committee of the registrant’s Board ofDirectors (or persons performing the equivalent functions):
(a) All significant deficiencies and material weaknesses in the design or operation of internal control overfinancial reporting which are reasonably likely to adversely affect the registrant’s ability to record, process,summarize and report financial information; and
(b) Any fraud, whether or not material, that involves management or other employees who have a significantrole in the registrant’s internal control over financial reporting.
Date: November 8, 2007
/s/ JOHN R. COLLINS
Senior Vice President and Chief Financial Officer

Exhibit 32(a)
CERTIFICATION PURSUANT TO18 U.S.C. SECTION 1350
AS ADOPTED PURSUANT TOSECTION 906 OF THE SARBANES-OXLEY ACT OF 2002
I, Mayo A. Shattuck III, Chairman of the Board, President, and Chief Executive Officer of Constellation EnergyGroup, Inc., certify pursuant to 18 U.S.C. Section 1350 adopted pursuant to Section 906 of the Sarbanes-Oxley Act of2002 that to my knowledge:
(i) The accompanying Quarterly Report on Form 10-Q for the quarter ended September 30, 2007 fully complieswith the requirements of Section 13(a) or Section 15(d) of the Securities Exchange Act of 1934, as amended; and
(ii) The information contained in such report fairly presents, in all material respects, the financial condition andresults of operations of Constellation Energy Group, Inc.
/s/ MAYO A. SHATTUCK III
Mayo A. Shattuck IIIChairman of the Board, President andChief Executive Officer
Date: November 8, 2007
Exhibit 32(b)
CERTIFICATION PURSUANT TO18 U.S.C. SECTION 1350
AS ADOPTED PURSUANT TOSECTION 906 OF THE SARBANES-OXLEY ACT OF 2002
I, John R. Collins, Executive Vice President, Chief Financial Officer, and Chief Risk Officer of Constellation EnergyGroup, Inc., certify pursuant to 18 U.S.C. Section 1350 adopted pursuant to Section 906 of the Sarbanes-Oxley Act of2002 that to my knowledge:
(i) The accompanying Quarterly Report on Form 10-Q for the quarter ended September 30, 2007 fully complieswith the requirements of Section 13(a) or Section 15(d) of the Securities Exchange Act of 1934, as amended; and
(ii) The information contained in such report fairly presents, in all material respects, the financial condition andresults of operations of Constellation Energy Group, Inc.
/s/ JOHN R. COLLINS
John R. CollinsExecutive Vice President, Chief Financial Officer, andChief Risk Officer
Date: November 8, 2007

Exhibit 32(c)
CERTIFICATION PURSUANT TO18 U.S.C. SECTION 1350
AS ADOPTED PURSUANT TOSECTION 906 OF THE SARBANES-OXLEY ACT OF 2002
I, Kenneth W. DeFontes, Jr., President and Chief Executive Officer of Baltimore Gas and Electric Company, certifypursuant to 18 U.S.C. Section 1350 adopted pursuant to Section 906 of the Sarbanes-Oxley Act of 2002 that to myknowledge:
(i) The accompanying Quarterly Report on Form 10-Q for the quarter ended September 30, 2007 fully complieswith the requirements of Section 13(a) or Section 15(d) of the Securities Exchange Act of 1934, as amended; and
(ii) The information contained in such report fairly presents, in all material respects, the financial condition andresults of operations of Baltimore Gas and Electric Company.
/s/ KENNETH W. DEFONTES, JR.
Kenneth W. DeFontes, Jr.President and Chief Executive Officer
Date: November 8, 2007

Exhibit 32(d)
CERTIFICATION PURSUANT TO18 U.S.C. SECTION 1350
AS ADOPTED PURSUANT TOSECTION 906 OF THE SARBANES-OXLEY ACT OF 2002
I, John R. Collins, Senior Vice President and Chief Financial Officer of Baltimore Gas and Electric Company, certifypursuant to 18 U.S.C. Section 1350 adopted pursuant to Section 906 of the Sarbanes-Oxley Act of 2002 that to myknowledge:
(i) The accompanying Quarterly Report on Form 10-Q for the quarter ended September 30, 2007 fully complieswith the requirements of Section 13(a) or Section 15(d) of the Securities Exchange Act of 1934, as amended; and
(ii) The information contained in such report fairly presents, in all material respects, the financial condition andresults of operations of Baltimore Gas and Electric Company.
/s/ JOHN R. COLLINS
John R. CollinsSenior Vice President and Chief Financial Officer
Date: November 8, 2007